Embed Size (px)
Citation preview
1
NASA/GMAO GEOS-5 Observation Impact Monitoring
The following results are from the routine observation impact monitoring of NASA/GMAO’s GEOS-5 atmospheric data assimilation system, but focused here on the period 10 Jan-10 Mar 2012 Observation impacts are computed daily using the adjoint of the GEOS-5 atmospheric data assimilation system, including the GEOS-5 global forecast model and Gridpoint Statistical Interpolation (GSI) analysis scheme The metric is a 24h global forecast error norm - dry total energy;
• Negative (positive) values indicate that assimilation of a given set of observation has improved (degraded) the 24hr forecast in terms of this metric
http://gmao.gsfc.nasa.gov/products/forecasts/systems/fp/obs_impact/
2
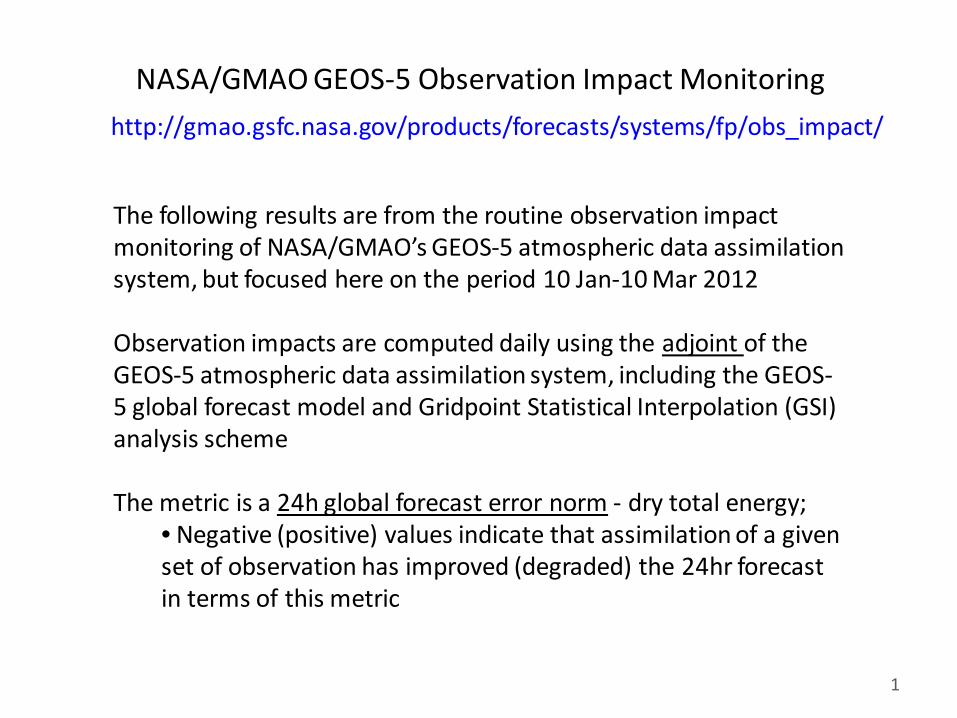
NASA/GMAO GEOS-5 24h Observation Impact Time Series 10 January – 10 March 2012 00z
N.H. Dropsonde Total Impact
N.H. Radiosonde Total Impact
• Dark greens indicate largest improvements
• Dropsondes have significant beneficial impact in several cases, but also degrade the forecast slightly in some cases
• For reference, NH radiosondes have consistently large beneficial impact, but are much more numerous
3
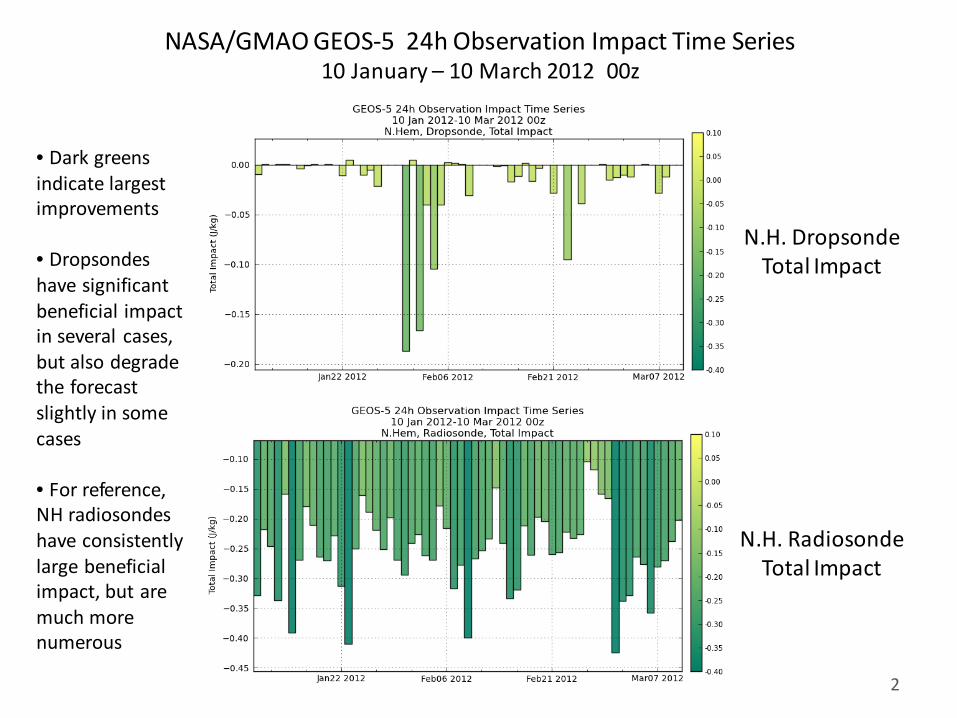
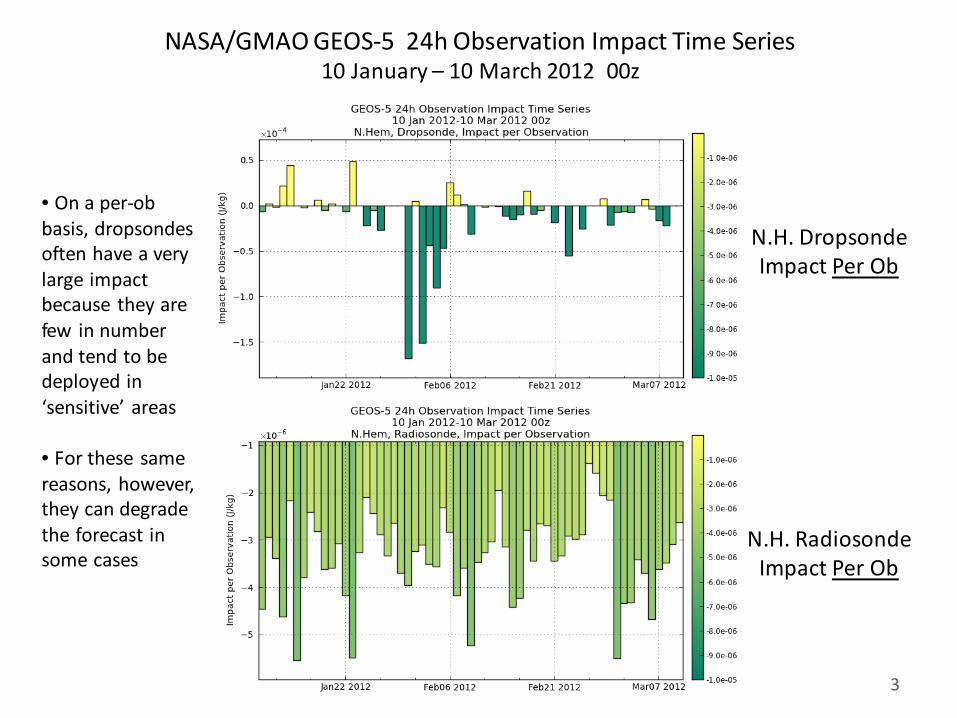
NASA/GMAO GEOS-5 24h Observation Impact Time Series 10 January – 10 March 2012 00z
N.H. Dropsonde Impact Per Ob
N.H. Radiosonde Impact Per Ob
• On a per-ob basis, dropsondes often have a very large impact because they are few in number and tend to be deployed in ‘sensitive’ areas
• For these same reasons, however, they can degrade the forecast in some cases
4
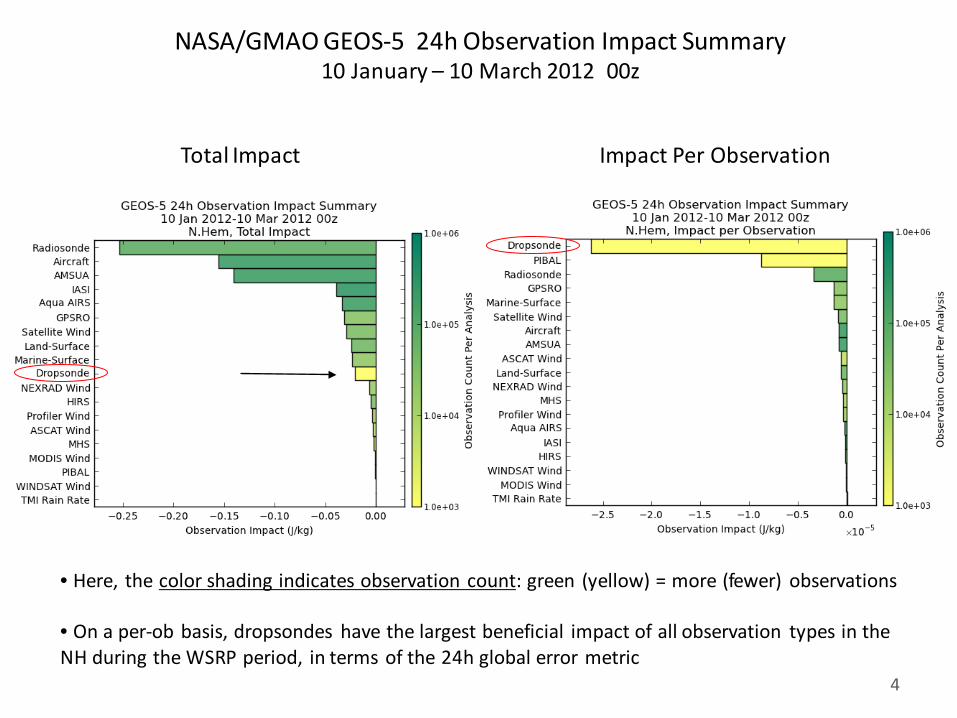
NASA/GMAO GEOS-5 24h Observation Impact Summary 10 January – 10 March 2012 00z
Total Impact Impact Per Observation
• Here, the color shading indicates observation count: green (yellow) = more (fewer) observations
• On a per-ob basis, dropsondes have the largest beneficial impact of all observation types in the NH during the WSRP period, in terms of the 24h global error metric
5
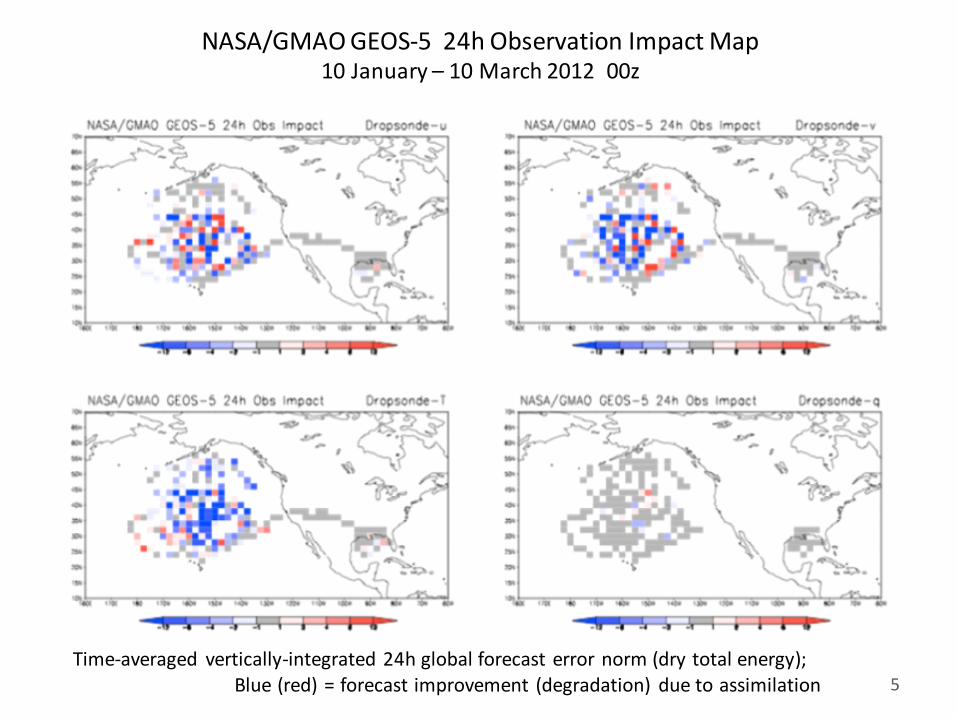
NASA/GMAO GEOS-5 24h Observation Impact Map 10 January – 10 March 2012 00z
Time-averaged vertically-integrated 24h global forecast error norm (dry total energy); Blue (red) = forecast improvement (degradation) due to assimilation
6
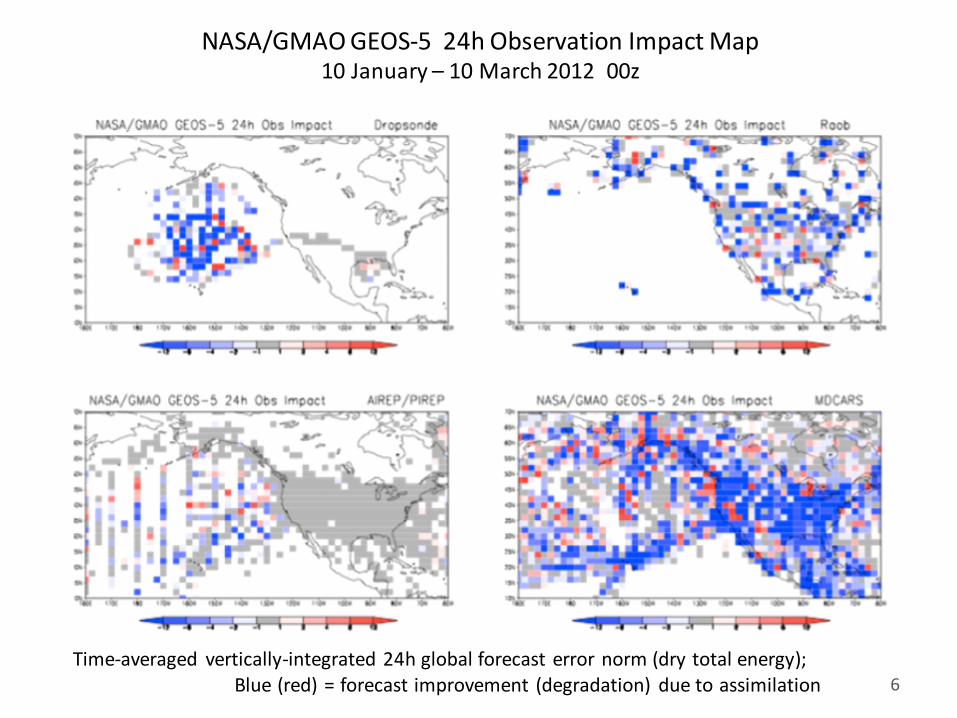
NASA/GMAO GEOS-5 24h Observation Impact Map 10 January – 10 March 2012 00z
Time-averaged vertically-integrated 24h global forecast error norm (dry total energy); Blue (red) = forecast improvement (degradation) due to assimilation