Embed Size (px)
Citation preview

NASA Technical Paper 2901
AVSCOM Tech n ica I Report 88-C-010
1989
National Aeronautics and Space Administration Off ice of Management Scientific and Technical Information Division
Comparison Study of Gear Dynamic Computer Programs at NASA Lewis Research Center
James J. Zakrajesek Propulsion Directorate
Lewis Research Center Cleveland, Ohio
USAAR TA-A VSCOM
https://ntrs.nasa.gov/search.jsp?R=19890011872 2018-06-07T13:02:47+00:00Z

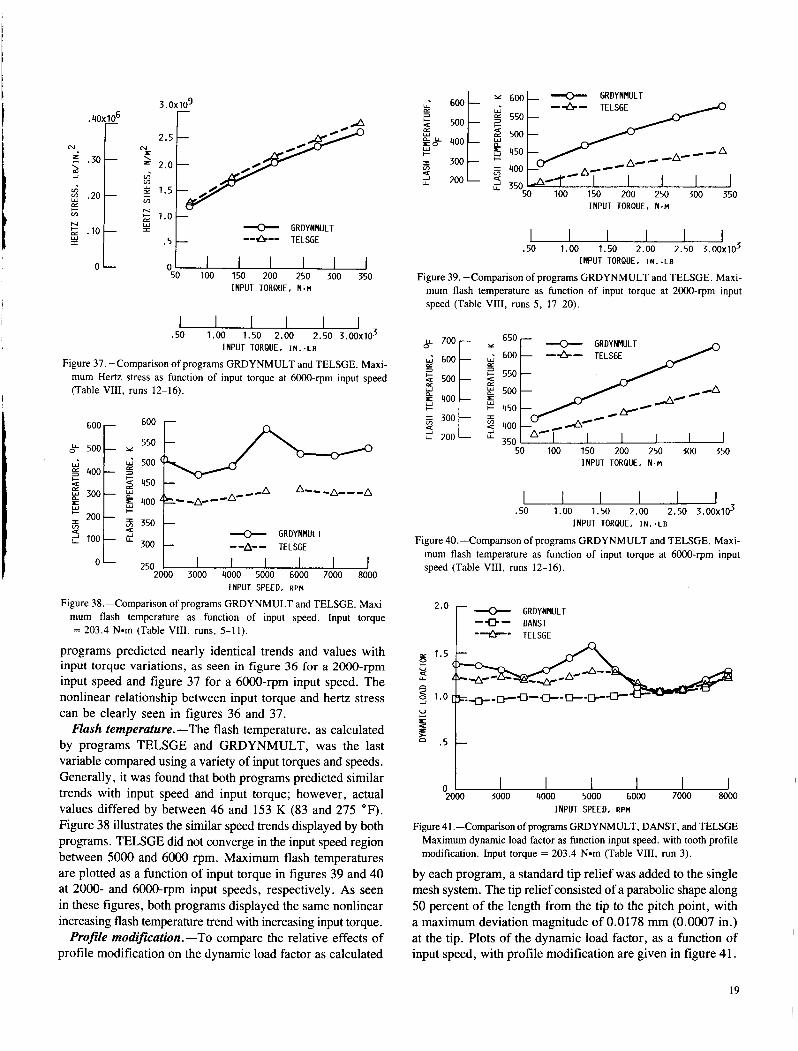
Summary A comparison study was performed on four gear dynamic
analysis computer programs developed under NASA/Army sponsorship. These programs are GRDYNMULT (a multimesh program applicable to a number of epicyclic systems), TELSGE (a single mesh program), PGT (a multimesh program applicable to a planetary system with three planets), and DANST (a single mesh program). The capabilities and features, input and output options, and technical aspects of the programs were reviewed and compared. Results are presented in a concise tabular form. Parametric studies of the program models were performed to investigate the predicted results of the programs as input parameters such as speed, torque, and mesh damping were varied.
In general, the program models predicted similar dynamic load and stress levels as operating conditions were varied. Flash temperature predictions from programs GRDYNMULT and TELSGE indicated similar trends; however, actual values were not in close agreement. The program GRDYNMULT was found to be the most versatile in system size, type, and analysis capabilities. The programs DANST, TELSGE, and PGT are more specialized for specific systems; however, in specific areas they provide a more detailed treatment than GRDYNMULT.
Introduction Since the late 19th century, gearing has become the simplest
and most efficient means of transmitting mechanical power. Gears can be found in almost every application involving mechanical power transfer, and are usually considered a critical link in the power chain of that system. Because of this, gear designers are highly concerned with gear life and reli- ability. In industrial applications this concern is alleviated to some degree by over designing the gears, sacrificing cost, and increasing weight. However, in aerospace applications, where weight and size are premiums, gear systems are usually designed close to their projected limits. As a result, a number of computer programs have been developed in an effort to predict parameters such as dynamic load, surface damage, and surface temperature, that are integral factors in various gear failure modes. Several of these programs have been developed
through NASA Lewis Research Center under NASA/Army sponsorship.
Of all the gear dynamic programs developed at NASA, the programs TELSGE, GRDYNMULT, PGT, and DANST are the most widely used. TELSGE was developed to study the effects of input parameters such as speed, load, and lubricant oil type on predicted quantities such as dynamic tooth mesh loads, surface temperatures, and lubricant film thickness in a single mesh system (refs. 1 and 2). Gear failure modes such as scoring, pitting, and lubrication failures are directly related to these predicted parameters. GRDYNMULT was developed to predict parameters such as tooth mesh loads, tooth stresses, and surface damage factors under a variety of input conditions for a single mesh, or multiple mesh epicyclic system (refs. 3 to 5). These parameters have a direct effect on failure modes such as tooth breakage, scoring, and pitting. The program PGT was developed for the dynamic analysis of a three planet planetary gear system under a variety of input conditions (ref. 6) . The magnitude of the dynamic mesh load output from PGT indirectly influences the probability of tooth failure by breakage. The program DANST was developed to study the effects of input parameters such as tooth profile modifications and external shaft and mass magnitudes on predicted dynamic loads and stresses of a single mesh system (refs. 7 to 9). The tooth root stress parameter predicted is a critical factor in determining gear failure through tooth breakage.
The purpose of tius study is to provide a comprehensive guide on the capabilities and nature of results obtainable from the four gear dynamic programs introduced above, and to provide some program verifications through direct comparisons. The report is divided into two main sections. The first section reviews the capabilities, input and output options, and technical aspects of the programs studied, and presents the results in a concise tabular form. The second section reviews comparison runs that were performed to compare the results obtained from each program using common input models and parameters. Finally, some concluding remarks are presented which generalize the results of the total comparison study.
Program Features and Models Research on each program was conducted to obtain the
general and technical features of the programs on an individual and collective comparison basis. Program features,
1

capabilities, and options were tabulated in an effort to provide an easily accessible reference base for potential program users. Table I presents some general information on each program such as system sizes and types, gear types, and supporting documentation. Table I1 gives a direct comparison among the programs of the type and nature of the parameters calculated by each. A comparison of the input options available for each program with some basic descriptions of these options are presented in table 111. Finally, table IV gives information on the printed and plotted output options available with these programs. In the following sections general program features, as presented in tables I to IV, are discussed, along with the various analytical models used in the programs.
General Capabilities, and Features
Program PGT.-The program PGT (dynamics of Planetary Gear Trains) (ref. 6) is a gear dynamic analysis program for a three planet planetary spur gear system. PGT is capable of modeling a planetary gear train with input and output shafts and masses. It calculates dynamic mesh loads and combined stiffness for each mesh as a function of roll angle. PGT also calculates the sun center movement in the plane perpendicular to the sun gear axis. Along with the standard input parameters, such as tooth geometry, torque, and speed, other parameters can be input, such as profile errors, sun center stiffness and damping, etc., as indicated in table 111. The major features of this program are its ability to include input and output peripherals in the analysis and to calculate the movement of the sun gear center. The major limitation of this program is that it can only be applied to a three planet system. Sample plotted outputs of PGT are given in figure 1. The first two plots represent the dynamic load factor for the sun/planet and ring/planet mesh associated with planet number 1 of run 1 in table V. The dynamic load factor represents the ratio of dynamic to static tooth load, and is commonly used when plotting dynamic mesh loads. The sun center movement plot is the actual displacement of the sun center through one complete steady state revolution. It should be noted at this time that program PGT is not in an easily runable format. Some work would be required to revise the program to a more standard, commercially acceptable status.
Program GRDYNMULT.-The program GRDYNMULT (Epicyclic Gear Dynamic Analysis Program) (ref. 3) is a dynamic analysis program with the capabilities to model a variety of gear types and gear train systems. GRDYNMULT is capable of modeling single mesh, planetary, star, and differential systems with a maximum of 20 planets. This program can model spur or helical gear types, along with involute or buttress tooth forms. GRDYNMULT is capable of calculating a number of variables such as dynamic mesh loads, tooth root stresses, hertz stresses, flash temperatures, etc., as shown in table 11. As illustrated in table 111, nonstandard parameters such as tooth spacing errors, tooth profile modifications, sun center stiffness and damping, etc.,
2.0 r
( a ) 0
DISTANCE ALONG 1.IK OF ACTION
2.0 r
(b ) 0
DISTANCE ALONG ALINE OF ACTION
r ,0005
E I
X-DISPLACEENT, M!
(a) Sunlplanet tooth loads mesh 1. (b) Ring/planet tooth loads mesh 1.
(c) Sun center movement.
Figure I.-PGT sample plotted output. Input torque = 33.9 Nom; input speed = 4000 rpm.
2
can be input in the program. The major feature of this program is its variety in the type of calculations available, and the number of gear train systems it can be applied to. The major limitation of this program is that it cannot include, in the dynamic analysis, the effects of input and output peripherals typically present in actual gear systems.
Sample output plots from GRDYNMULT are given in figures 2 and 3. These plots are for the ring/planet, sun/planet mesh associated with planet number 1 of comparison run 1 in table V. The first plot in each figure is the dynamic load factor for the mesh. The PV plot represents the product of the local contact stress and the sliding velocity. The PV product is used in analyzing surface damage possibilities, such as
r
500~10~ r
scoring. The flash temperature plots represent the instantaneous gear surface temperature, and the hertz stress is the local contact pressure. The planet, ring, and sun gear stress plots refer to the tooth root stresses. The plots associated with GRDYNMULT appear different from those of other programs because GRDYNMULT presents only half of the tooth contact cycle, and the plot includes more than one tooth pair if more than one pair are in contact. Subsequent plots from GRDYNMULT have been replotted for easier comparison with the other programs.
Program TELSGE. -The program TELSGE (Thermal Elasto-Hydrodynamic Lubrication of Spur Gears) (ref. 1) is a dynamic analysis program for a single mesh spur gear
7 x 2 9
loo r
DISTANCE ALONG L I N E OF ACTION (a) Dynamic load plot. (c) Contact stress plot.
(e) Sun gear tooth root stress plot.
(b) PV plot. (d) Flash temperature plot.
(f) Planet gear tooth root stress plot.
Figure 2.-GRDYNMULT sample plotted output of sunlplanet mesh 1. Input torque = 33.9 Nom; input speed = 4000 rpm.
3

(1x10' r PI 1.2 l ' 'C
500X106 r 400
N
\ r
(0 (0 W PI c
. 300
Ln 200 N c PI W X
100
0
t
1 5xS6 N
\ L
Ln Ln W PI
z 10 -
loo r U
W PI 3 c 4 cx W
W c
I Y) U 2 U
n
20x 106 r b- 0
8 15 IN e x o\ o r c
4 0 7 Y W m e c
+ v ) Y z
0
az L A 10
4 5
0 DISTANCE ALONG L I N E OF ACTION
(a) Dynamic load plot. (c) Contact stress plot.
(e) Ring gear tooth root stress plot.
(b) PV plot. (d) Flash temperature plot.
(f) Planet gear tooth root stress plot.
Figure 3.--GRDYNMULT sample plotted output of ringiplanet mesh 1. Input torque = 33.9 Nom; input speed = 4000 'pm.
system. As illustrated in table 11, TELSGE is capable of calculating variables such as film thickness, flash and equilibrium surface temperatures, dynamic mesh loads, and hertz stresses, etc., which are important parameters in gear tooth surface failure models. TELSGE predicts fatigue life of the gears based on these calculated variables. Additional input parameters for TELSGE include tooth profile error/modification array, thermal and viscous properties of the lubricant, etc., as seen in table 111. The major feature of
and thermal effects of the lubricant on the resulting life of the
' I this program is its comprehensive treatment of the dynamic
gears. The major limitation of this program is that it applies only to a single mesh system. Sample plotted outputs of TELSGE are given in figures 4 and 5. The plots shown were constructed using a postprocessing graphics program, as the current CRAY version of TELSGE does not have a plotting routine.
Program DANST. -The program DANST (Dynamic ANalysis of Spur gear Transmissions) (ref. 9) is a dynamic analysis program for a single mesh spur gear system. DANST is capable of modeling a system with input and output peripherals included in the analysis. As illustrated in table 11,
4

2.0 2T t 1.6
2 n 4 5 1 . 2 -
0'
400x10'6 r E 5 300 W L Y
8 I- u 5 200
Z I
DISTANCE ALONG LINE OF ACTION (a) Dynamic load plot.
(c) Combined tooth stiffness plot. (b) Contact stress plot. (d) Film thickness plot.
Figure 4.-TELSGE sample plotted output. Input torque = 203.4 Nom; input speed = 6000 rpm.
r
( a ) 50
r
t C ) 50
*O0 r 1 W U
4 Y LL
2 2 150
(b) 50
200 - U
w
U
4 Y
td )
1 DISTANCE ALMG LINE OF A C T I M (a) Pinion surface temperature plot. (c) Pinion flash temperature plot.
(b) Gear surface temperature plot (d) Gear flash temperature plot.
Figure 5.-TELSGE sample plotted output. Input torque = 203.4 Nom; input speed = 6000 rpm.
5

DANST is capable of calculating dynamic mesh loads, root stresses, combined stiffness, etc., as a function of contact position. Along with standard input parameters, DANST allows input of a user defined tooth profile deviation array, standardized tooth profile modifications, input and output shaft and mass data, etc., as seen in table 111. The major feature of this program is the detailed tooth profile error/modification input available to the user. A major limitation of this program is that it applies only to a single mesh system. Sample plotted outputs from DANST are given in figures 6 and 7. As seen in figure 6, DANST provides a plot of the Fourier transform
I I
, 6
CL 2.0 0 c U 4 L L
9 1.6 0 2
U
x 4
>
CL 0
z
U 4 L L
4
- z 1 . 2 n
2 .8
n
5 . 4
2 U
c -
of both the static transmission error and the dynamic tooth loads. These plots can be useful when comparing the analytical results with test results in the frequency domain.
Program Models
Dynamic models.-To describe the dynamics of the systems, each program uses differential equations of motion based on mathematical models simulating the various masses, springs, and damping present in the actual systems. The mathematical model used in PGT is shown in figure 8. As depicted in this
700x 106 r 600
mx 500 \ L
v)
1100 E c Lo
0 CL
c o 300
I c 8
200
100
( b ) 0
DISTANCE ALONG L INE OF ACTION
2 . 0 ~ 1 0 ~
L
W n 1.0
J
HARRONICS OF TOOTH MESH FREQUENCY (a) Static and dynamic load plot.
(c) Fourier transform of static transmission error. (b) Tooth root stress plot.
(d) Fourier transform of dynamic tooth loads
Figure 6.-DANST sample plotted output. Input torque = 203.4 N*m; input speed = 2000 rpm.

tn-5
1 -
(d )
I \ COMBINED
/ /
1 \ DRIVEN /
ta l 0
DISTANCE ALONG L I N E OF ACTION
I
25
0'
DISTANCE ALONG L I N E OF ACTION
0
k - 3 . 7 1
DISTANCE ALONG L I R E OF ACTION
(a) Normalized tooth deflection plots, ( c ) Tooth stiffness plot.
(e) Torsional torque plot.
E
CL 0 CL CL W
L
v) 0 L3 5 L 4 CL I-
r n 4 s
E
E 4
I c 0
W
I v)
I I-
?
.1(
. oa r
I- 0 u E .06
8
w
0"
I- L
.04 L L LL
V
.02
0
(b)
DISTANCE ALONG L I N E OF ACTION
NORMLIZED CONTACT POSITION
f )
DISTANCE ALONG L I N E OF ACTION
(b) Static transmission error plot. (d) Tooth load sharing plot.
(0 Coefficient of friction plot. Figure 7.-DANST sample plotted output. Input torque = 203.4 Nom; input speed = 2000 rpm.
7

STIFFNESS AND DAPlPING J
( a )
(a) Planetary system model. (b) Overall system model.
Figure 8.-Program PGT system model.
figure, each mesh is represented by an equivalent spring and dashpot. The spring represents the combined stiffness of the gear teeth in mesh, and the dashpot represents the resulting mesh damping. The springs and dashpots shown at the sun center are present to model the flexibility and damping of the sun gear shaft and bearings. The stiffness, masses, and damping associated with the input shaft and driver and output shaft and driven device are also included in the model. Figure 9 illustrates the model used in the program GRDYNMULT. The mesh stiffness and damping, and sun center stiffness and damping, are presented similarly as in the PGT model. As seen in figure 9, additional springs representing flexibilities between ring gear rim segments and between planet carrier segments are included in the GRDYNMULT model. Figures 10 and 11 represent the models for programs TELSGE and DASG, respectively. As seen in figure 11, the DANST model includes the mass and elastic data of the input and output peripherals. Again, the mesh springs represent the combined stiffness of the gear teeth in mesh. For a more thorough description of the individual models and the iterative methods used to solve the resulting differential equations, refer to the supporting documentation for each program as given in table I.
Tooth stiffness models. -To model the complex stiffness of gear teeth during mesh, all of the programs use a nonlinear tooth compliance model. Programs TELSGE, GRDYNMULT, and DANST use R.W. Cornell’s nonlinear compliance model (ref. 10) that formulates tooth stiffness as a function of position along the line of action. This compliance model is based on a combination of the stiffness of the tooth as a cantilever beam, local hertz contact compression, and fillet and tooth foundation flexibility effects. All of the above except the local contact
compression are linear functions of the load. The nonlinearity of the compliance equation is due to the hertzian deflection. PGT uses a “variable-variable mesh stiffness” (VVMS) model for the tooth stiffness. The VVMS model is also nonlinear due to local hertz contact compression. The model includes tooth bending effects and tooth profile errors as a function of contact position.
Tooth root stress models.-Of the four programs investigated, only GRDYNMULT and DANST are capable of calculating tooth root stresses. Both programs use the modified Heywood formula for tooth stress sensitivity as given in reference 11. The modified Heywood formula calculates the maximum root stress as a function of tooth contact position, mesh load, face width, stress concentration factor of the fillet, and basic tooth geometry. The formula is also capable of predicting the location of the maximum root stress on the tooth fillet. The modified Heywood formula expresses the root stress as a linear function of the applied load. It was found that the formula predicts the maximum tensile root stress within about 5 percent of finite-element and other analysis methods (ref. 11).
Input error models. -Actual gear systems inherently have one or more types of errors present. In an attempt to more accurately model actual systems, all of the programs have provided some means of including errors inherent in these systems. The program GRDYNMULT allows three types of errors to be input. These are: sun runout error, helix angle errors, and tooth errors. The sun runout error, applicable to a single mesh system only, converts a sun center displacement input into a sinusoidal tooth spacing error array to simulate errors associated with eccentrically manufactured gears. The
8

DRIVER GEAR 7
\
PLANET GEAR 7
/-RING/PLANET RSH STIFFNESS AND DAPlPING
SEGRENT
,--RING GEAR RIM
STIFFNESS AND DAMPING
Figure 9.-Program GRDYNMULT system model.
,-DRIVEN 1 GEAR
/
\ L MESH STIFFNESS AND DAMPING
Figure 10.-Program TELSGE system model.
,- OUTPUT INPUT DRIVER - DRIVEN MASS - GEAR 7 / GEAR ; MASS
'\ I I I I
n - I I
I \ I
I INPUT SHAFT I' I OUTPUT SHAFT STIFFNESS / LRESH STIFFNESS STIFFNESS AND DAMPING AND DAMPING AND DAMPING
Figure 11 .-Program DANST system model.
helix angle errors allow the user to input a constant angular error for each mesh for single and double helical gears. The tooth errors are comprised of tooth error arrays on five teeth for each sun/planet, ring/planet mesh. This tooth error input represents the statistical sum of tooth pitch error, profile error, and lead (or planet phasing) error. The tooth error is constant along the profile of the tooth. The program PGT indirectly
allows two types of error to be input, phase error and tooth error. The phase error is a constant lead, or lag, tangential positioning error of the planets, representing planet assembly inaccuracies. The tooth error consists of a sinusoidal error imposed on the tooth profile with the amplitude defined by the user. This error models gear tooth profile manufacturing process errors. The single mesh programs (TELSGE and DANST) have available tooth profile deviation arrays. Deviations from the true involute profile can be defined by inputting the corresponding array. Tooth spacing error can be simulated by inputting a constant deviation along the tooth profile.
Profile modification. - Profile modifications are often used in gears to lessen engagement impacts in attempts to reduce noise and vibration in gear systems. The programs GRDYNMULT, TELSGE, and DANST allow some form of modification to the tooth profile. GRDYNMULT incorporates an equation that allows the user to input the deviation magnitude at the tip, length of the modification on the tooth profile, and the shape of the modification curve. To determine the profile modification curve a shape factor is input. The default shape factor (0) produces a parabolic profile modification. A linear profile modification can be approximated with this equation with a shape factor of -0.5. Other shapes associated with different shape factors are given in reference 11. DANST allows two standard profile modifications and a user defined shape to be input. A standard linear or parabolic tooth profile modification can be chosen with the tip deviation magnitude and modification length along the tooth profile input by the user. By virtue of the tooth profile deviation arrays discussed earlier, other user defined profile
9

modifications can be input in DANST. Program TELSGE also allows profile modifications to be input by virtue of its tooth profile deviation array. Standard profile modifications such as linear and parabolic must be added point by point in the array.
0 -
Comparison Runs Study
-0- PGT + GRDYNMULT
I 1
Short of using experimental data, the most effective way of comparing computer programs is to compare their output results based on common input values. In this study the programs were operated using common models and input parameters. Where possible, runs where performed with parameters such as speed, load, and mesh damping varied in order to obtain program comparisons over a broad spectrum of input conditions. Input parameters common to at least two programs, such as sun center stiffness, were also varied for the comparison. Due to the nature of the programs, two types of input models were required; a planetary system with three planets, and a single mesh system. A discussion of the comparison study results are thus grouped under those two categories.
-e- PGT --I- GRDYNMULT
Planetary System Runs
Because of the system limitations of the program PGT, a three planet planetary system was used to compare programs PGT and GRDYNMULT. Table VI gives a description of the planetary model used in the analysis, along with the undamped natural frequencies of the system, as calculated by GRDYNMULT. As seen in table VI, to minimize the influence of the input and output peripherals of PGT in the analysis, external shaft damping and mass moments of inertia were minimized, and external shaft stiffness values were maximized. Table V documents the comparison runs matrix used, illustrating which parameters were varied and their corresponding values. Due to difficulties experienced with the program PGT and with the HP 1000 computer system, only nine comparison runs were achieved. Unfortunately this does not allow a detailed comparison to be made; however, some general observations can be drawn. Discussions on the various parametric runs are given below.
Speed variation runs.-To compare the effect of input speed on the maximum dynamic load factor, the programs were run over a range of speeds from 4000 to 8OOO rpm. Figure 12 is a plot of the maximum dynamic load factor for the sun/planet mesh as a function of input speed, as predicted by both programs. As seen in this figure, both programs show good correlation except at 6000 rpm input speed, where PGT predicts a peak dynamic load. GRDYNMULT predicts a peak at the 7000-rpm input speed point. As seen in table VI, this point (7000 rpm, 1633 Hz) is within 7 percent of the second harmonic of the second natural frequency (1530 Hz), as predicted by GRDYNMULT. The difference in predicted peak
load speeds between PGT and GRDYNMULT could be due to the different mesh stiffness model used in each program. Figure 13 is the same plot as figure 12 except that the maximum ring/planet mesh loads are plotted. Comparison of figures 12 and 13 show the same trends, with the exception that the ring/planet plots show a much poorer correlation between the two programs.
A comparison of the dynamic mesh load plots from each program through one tooth mesh cycle at input speeds of 4000, 6000, and 8000 rpm are illustrated in figures 14, 15, and 16, respectively. As seen in figures 14 and 16, the sun/planet mesh load plots are very similar in form between the two programs. The ring/planet mesh load plots are dissimilar in both form and magnitude. Figure 15 further illustrates the discrepancy between the two programs at the 6000-rpm input speed. Here PGT is shown to predict tooth separation with a maximum
lr
\ \ \
Y)
10

PGT GRDYNMULT
--- - 1.6
-z/2 0 DISTANCE ALONG L I N E OF ACTION
(a) PGT and GRDYNMULT sun/planet mesh. (b) PGT and GRDYNMULT ringlplanet mesh.
Figure 14.-Comparison of programs PGT and GRDYNMULT. Dynamic load factor as a function of contact position. Input torque = 33.9 N-rn; input speed = 4000 rpm (Table V, run 1).
2.8 r --- PGT
2.0 2 * 4 t - GRDYNMULT IP\ I ‘,
\ I
2.0
1.6 p\ 1.2
/ I
I
.4 .8!€LL -2/2 0 t b ) \ 0 I z/2
DISTANCE ALONG L I N E OF ACTION
(a) PGT and GRDYNMULT sunlplanet mesh. (b) PGT and GRDYNMULT ring/planet mesh.
Figure 15.-Comparison of programs PGT and GRDYNMULT. Dynamic load factor as a function of contact position. Input torque = 33.9 Nom; input speed = 6000 rpm (Table V , run 3).
11

2'o 1.6 [
BEGIN CONTACT
T - 0
--- PGT GROYNMULT -
1.2 t i
n 4 0 2
2 2.0
9 > n 1.6
1.2
. 8
.4
r FA- '\ \ A 4
/& /
\ I
0 -z/2 0 z/2
DISTANCE ALONG L INE OF ACTION
(a) PGT and GRDYNMULT sun/planet mesh. (b) PGT and GRDYNMULT ringiplanet mesh.
Figure 16.-Comparison of programs PGT and GRDYNMULT. Dynamic load factor as a function of contact position. Input torque = 33.9 Nom; input speed = 8000 rpm (Table V, run 5 ) .
dynamic load factor in excess of 2.8. Again, the apparent difference in system critical speeds could be due to different mesh stiffness models. It is not known at this time why the ringlplanet mesh loads experienced a poorer correlation than the sun/planet mesh loads.
Sun center stiffness runs.-The sun center stiffness input was varied in each program to compare sun center flexibility effects on the maximum dynamic load factor. Figure 17 plots the relative effects on the maximum dynamic load for the sun/planet mesh for three sun center stiffness values. Three points are not enough to provide a thorough comparison;
however, some general trends can be deduced and compared using these plots. As seen in figure 17, trend results from the two programs do not fully agree. PGT favors a relatively stiff sun center for a minimum dynamic load factor, whereas GRDYNMULT indicates an optimum sun center stiffness exists between the two extremes. Similar plots for the ring/planet mesh are illustrated in figure 18. Some trends can
-e- PGT + GRDYNMULT
---Q --------- -------
n 4 0
0 17.51 175.1 1751 .0x106
SUN CENTER STIFFNESS. N/M
. 1 1 SUN CENTER STIFFNES!;. LB/IN.
Figure 17.-Comparison of programs PGT and GRDYNMULT. Maximum dynamic load factor as a function of sun center stiffness for the sudplanet mesh. Input torque = 33.9 Nom; input speed = 4000 rpm (Table V, runs 1, 6, and 9).
-0- PGT -- GROYNMULT
0 l E ' I 17.51 SUN CENTER 175.1 STIFFNESS. N/M 1751 .0x106
12

be seen in this figure; however, they are not prominent enough to draw any conclusions.
Damping runs.-The mesh damping ratio and sun center damping coefficient were changed to compare the resulting effects on the maximum dynamic load factor calculated by each program. Figure 19 illustrates the effects on the maximum dynamic load factor of the sun/planet mesh at an input speed of 4000 rpm as mesh and sun center damping were changed. As seen in this figure, both programs show an increase in dynamic load (9.0 percent for GRDYNMULT, 12.1 percent for PGT) as the mesh damping ratio value is decreased from 0.10 to 0.03. No significant change was noted in either program as the sun center damping coefficient was changed. Similar plots
8 t-
5
-0- PGT GRDYNMULT
2 -
-0- PGT l3- GRDYNMULT
w 0 t-
U :: 2/-
MESH DAMPING RATIO. InEsH: 0.10 0.10 0.03
SUN CENTER DAMPING COEFFICIENT ,
(LB.s/IN.): 17.51 (0.1) 3.50 (0.02) 17.51 (0.1)
Figure 20. -Comparison of programs PGT and GRDYNMULT. Maximum dynamic load factor at several damping conditions for the ring/planet mesh. Input torque = 33.9 Nom; input speed = 4000 rpm (Table V, runs, 1 , 7 , and 8).
C,,,, N.s/M
for the ring/planet mesh are illustrated in figure 20. The trends seen in figure 20 are similar to those noted in figure 19; however, they are not prominent enough to draw any conclusions from them. Sun center movement. -Sun center movement is calculated
by program PGT only, thus no comparison can be made with GRDYNMULT. PGT predictions of the sun center displacement, however, proved interesting and are discussed below. Figure 21 illustrates the sun center movement for one revolution at a variety of input speeds. The maximum displacement of the sun center is seen to occur at 6000-rpm input speed, the same as with the maximum dynamic load factor. As the speed increases, the sun center displacement approaches a pattern resembling shaft whirl. As expected, the sun center movement decreases with increasing sun center stiffness (see fig. 22). A decrease in mesh damping (from 0.10 to 0.03) results in an increase in sun center displacement of more than two times, as shown in figure 23. Also illustrated in this figure, a change in the sun center damping coefficient had no effect on the sun center displacement at this input speed.
Single Mesh Runs
Because of the system limitations of DANST and TELSGE, a single mesh system was used to compare programs GRDYNMULT, TELSGE, and DANST. Table VI1 gives a description of the single mesh model used in the analysis along with the undamped natural frequencies of the system calculated by each program. As seen in this table, the programs predicted similar natural frequencies for the single mesh system (all within 13 percent of the calculated average of 4532 Hz). Of the three programs, only DANST includes external shafts and masses in the system dynamics. To maintain an equal comparison basis among the three programs, it was necessary to minimize the influence of the peripheral masses in program DANST. This was accomplished by using highly flexible input and output shafts in the program. In the planetary system runs program PGT used short, highly rigid shafts with small peripheral mass inertias to minimize their effects on the system dynamics. This method did not work as well with program DANST, thus the opposite approach of flexible shafts was used to isolate the peripheral mass inertias from the mesh dynamics. Figure 24 illustrates the effect of varying the magnitude of the peripheral masses on the maximum dynamic load factor, as predicted by program DANST with the flexible shaft configuration. As seen in this figure, the dynamic load factor changes minimally with peripheral mass changes, indicating good isolation of the mesh dynamics with this configuration. Table VI11 documents the comparison runs matrix used, illustrating which parameters were varied and their corresponding values. Discussions comparing the effects of the various parametric runs on the variables calculated by the programs are given below.
Dynamic load factor. -A variety of input speeds and torques were used to compare the relative effects of speed and load
13

.001
C
i I2 -.001 L
t X-DISPLACEMENT. Mn
(e ) -.001
-.001 0 .001 x-DISPLACEMENT, W
(a) Input speed = 4000 rpm. (c) Input speed = 6000 rpm.
(b) Input speed = 5000 rpm. (d) Input speed = 7000 rpni.
(e) Input speed = 8000 rpm.
Figure 21.-PGT program sun center movement predictions at various input speeds. Input torque = 33.9 N*m (Table V. runs 1 to 5) .
14

(a ) -.001
- .0005
.001
I
0-
-
( a )
.001
0
-.001 I ( C ) 1
.oa
- . OO( t C )
0 .ooo5 X-DISPLACEMENT. HH
(a) tmesh = 0.10; C,,, = 17.51 N 4 m . (b) imesh = 0.10; C,,, = 3.50 N 4 m . (c) imesh = 0.03; C,,, = 17.51 N 4 m .
Figure 23 .-PGT program sun center movement predictions for various damping values. Input torque = 33.9 Nom; input speed = 4000 rpm (Table V, runs 1, 7, and 8).
15

1.6 1
I I
P W
-&- 0.5 --o- 1.0
I I
--+ 2.0 -+ 4.0 -0- 10.0
1.5 0, U U L L
n d 1 . o c
--s-, GRDYNMULT -+ DANST .5
-A- TELSGE
on the dynamic load factor as calculated by each program. Maximum dynamic load factors are plotted as a function of input speed for an input load of 203.4 Nem (1 800 in. *lb) in figure 25. As seen in this figure, all three programs show good correlation (average difference within 5 percent) except at 5500 rpm, where TELSGE results diverge. This speed is within 8 percent of the speed corresponding to the half harmonic of the natural frequency predicted by TELSGE (5130 rpm). This half harmonic phenomenon is also seen in programs GRDYNMULT and DANST, although at a lesser degree. DANST and GRDYNMULT both indicate peaks at the 5000-rpm data point. The predicted half harmonic speed
peak dynamic load point. The corresponding half harmonic speed of program GRDYNMULT (4246 rpm) is within 15 percent of the peak dynamic load point. Because the mesh stiffness varies with tooth position during mesh, the predicted natural frequencies are only estimates of the actual values, based on assumed constant mesh stiffness quantities. A
I
I of program DANST (5191 rpm) is within 4 percent of this
16
1.6 1
END CONTACT7 r L I N E OF
- GRDYNMULT
_--- TELSGE DANST ---
I I -z/2 0 z/2
DISTANCE ALONG L I N E OF ACTION
Figure 26.-Comparison of programs GRDYNMULT, DANST, and TELSGE. Dynamic load factor as function of contact position. Input torque = 203.4 Nom; input speed = 2000 rpm (Table VIII, run 5) .
END CONTACT7 r L I N E OF
w / ! ACTION
BEGIN , CONTACT ' 4 2 7 '
Y o
1.6 1 GRDYNMULl DANST TELSGE
--- ----
0 z/2 0 -z/2
DISTANCE ALONG L I N E OF ACTION
Figure 27.-Comparison of programs GRDYNMULT, DANST, and TELSGE. Dynamic load factor as function of contact position. Input torque = 203.4 N m ; input speed = 4000 rprn (Table VIII, run 7).

END CONTACT7 r L I N E OF
u i / ~ ACTION
\ 0
GRDYNMULT
TELSGE --- DANST ----
DISTANCE ALONG L I N E OF ACTION
Figure 28.-Comparison of programs GRDYNMULT, DANST, and TELSGE. Dynamic load factor as function of contact position. Input torque = 203.4 Nom; input speed = 60oO rpm (Table VIII, run 9).
GRDYNMULT
TELSGE ---- 1.6 t --- DANST
5 2 5 .a
1.2
4 4
f i .4 P
0 -Z/2 0 z/2
DISTANCE ALONG L I N E OF ACTION
Figure 29.-Comparison of programs GRDYNMULT, DANST, and TELSGE. Dynamic load factor as function of contact position. Input torque = 203.4 N-m; input speed = 8000 rpm (Table VIII, run 11).
4 1.00 GRDYNMULT
u s .75 --*-- TELSGE -+- DANST
E I I I I I I I .50 50 100 150 200 250 300 350
INPUT TORQUE. N.M
INPUT TORQUE. IN..LB
Figure 30.-Comparison of programs GRDYNMULT, DANST, and TELSGE. Maximum dynamic load factor as function of input torque at 2000-rpm input speed (Table VIII, runs 5 , 17-20).
+ GRDYNMUCT -+- DANST
!i 2 0 . 7 5 ~ 50 100 150 200 250 300 350
INPUT TORQUE. N.M
comparison of the actual dynamic load plots from each program for a variety of speeds can be seen in figures 26 to 29. As illustrated in these figures, the dynamic load factor plots are very similar in both magnitude and form. All three programs show a decrease in the frequency of dynamic load fluctuations as the input speed increases, and a condition close to tooth separation at the 8000 rpm input speed (fig. 29). Figures 30 and 31 are plots of the maximum dynamic load factor as a function of input torque for input speeds of 2000 and 6000 rpm, respectively. As seen in these figures, the programs predict a fairly constant dynamic load factor regard- less of the input torque value. This is as expected since the dynamic and static load are both linear functions of the input torque.
Tooth root stress. -Tooth root stress was another variable compared using a variety of input loads and torques. As illus- trated in figure 32, the maximum root stress predicted by DANST and GRDYNMULT correlate reasonably well through the speed range, showing similar form and magnitudes that disagree only slightly (average difference within 16 percent).
17

1000x106 r r 7 1 4 0 ~ 1 0 ~ r
Lo W w ’ 1.5 N
N
-0-d Lo
Lz e 9 600
Lz Lo c
c 8 400 - CL
8 L -2- GRDYNMULT I - 40 c -+- DANST 8 200 c 8 20
-C- GROYNMULT --*-- TELSGE -
0 2000 3000 4000 5000 6000 7000 8000
‘ L 0
INPUT SPEED. RPH
Figure 32.-Comparison of programs GRDYNMULT and DANST. Maxi- mum tooth root stress as function of input speed. Input torque = 203.4 N m (Table VIII. runs 5-1 1).
200x10~
N . 160
120
Lo
80 8 CL
8 c 0 40
1400x 106
1200 c / P N
2 1000-
2 800 - Lo Lo
c Lo
-S-’ GROYNMULT -+- DANST
50 100 150 200 250 300 350 0
INPUT TORQUE. N.H
I .50 1.00 1.50 2.00 2.50 3 . 0 0 ~ 1 0 ~
Figure 33.-Comparison of programs GRDYNMULT and DANST. Maxi- mum tooth root stress as function of input torque at 2W-rpm input speed (Table VIII, runs 5 , 17-20).
INPUT TORQUE, I N . . L B
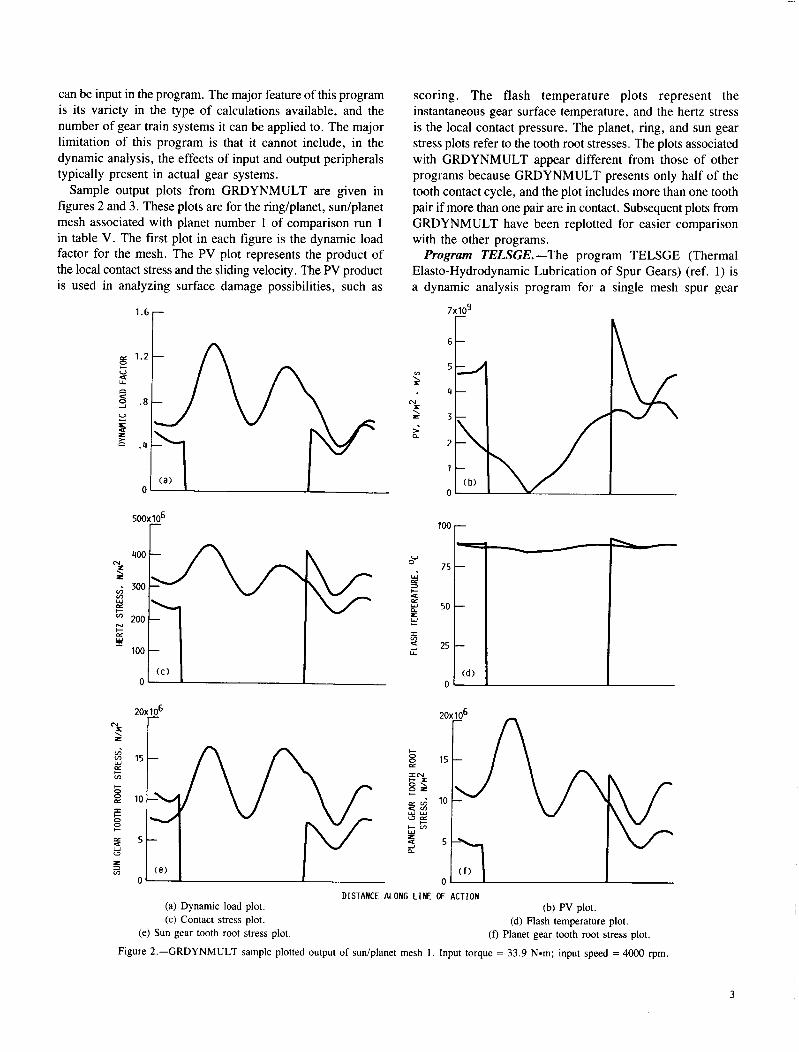
As expected, both show peak values at the 5000 rpm data point. Figures 33 and 34 plot the maximum tooth root stress as a function of input torque at input speeds of 2000 and 6000 rpm, respectively. As seen in these figures, both programs show the tooth root stress to be relatively linear with input torque. This is expected since both use a form of the modified Heywood formula which gives tooth root stress as a linear function of applied load.
Contact stress.-The local contact pressure, or hertz stress, is calculated by programs TELSGE and GRDYNMULT. As seen in figure 35, both programs show similar trends and values (average difference within 4 percent) with input speed with the exception of the TELSGE results between 5000 and 6OOO rpm. Here, due to the close proximity of the half harmonic of the system, TELSGE would not converge. Both
200x10~
-. 160
Lo
8
c 40 e O 0
0 50 100 150 200 250 300 350
INPLIT TORQUE, N.M
I .50 1.00 1.50 2.00 2.50 3 . 0 0 ~ 1 0 ~
INPUT TORQUE. N.H
Figure 34.-Comparison of programs GRDYNMULT and DANST. Maxi- mum tooth root stress as function of input torque at W - r p m input speed (Table VIII, runs 9, 12-16).
N .35x106
Lz c Lo
r L $ l , 1 I 1 2 .15 1.0 2000 3000 4000 5000 6000 7000 8000
INPUT SPEED. RPM
Figure 35.-Comparison of programs GRDYNMULT and TELSGE. Maxi- mum Hertz stress as function of input speed. Input torque = 203.4 N m (Table VIII, runs 5-11).
,4OX106 r
Lo i [ .20
2 . l o W L
0
N
\ r
v) v) W CL e Lo
N e p: Y 8
.5 L --O- GRDYNMULl --A-- TELSGE
0 50 100 150 200 250 300 350
INPUT TORQUE, N.H - .50 1.00 1.50 2.00 2.50 3 . 0 0 ~ 1 0 ~
INPUT TORQUE, I N . . L B
Figure 36.-Comparison of programs GRDYNMULT and TELSGE. Maxi- mum Hertz stress function of input torque at 2000-rpm input speed (Table VIII, runs 5 , 17-20).
18
.40x106
y .20
v)
N
W 1
0 50 100 150 200 250 300 350
INPUT TORQUE, N.M - .50 1.00 1.50 2.00 2.50 3 . 0 0 ~ 1 0 ~
INPUT TORQUE, IN. .LE
Figure 37. -Comparison of programs GRDYNMULT and TELSGE. Maxi- mum Hertz stress as function of input torque at 6000-rpm input speed (Table VIII, runs 12-16).
600
550
500
450
400
350
300
L
+ GRDYNMULl --A-- TELSGE
2000 3000 4000 5000 6000 7000 8000 INPUT SPEED, RPM
Figure 38.-Comparison of programs GRDYNMULT and TELSGE. Maxi- mum flash temperature as function of input speed. Input torque = 203.4 Nom (Table VIII, runs, 5-11).
programs predicted nearly identical trends and values with input torque variations, as seen in figure 36 for a 2000-rpm input speed and figure 37 for a 6000-rpm input speed. The nonlinear relationship between input torque and hertz stress can be clearly seen in figures 36 and 37.
Hush temperuture.-The flash temperature, as calculated by programs TELSGE and GRDYNMULT, was the last variable compared using a variety of input torques and speeds. Generally, it was found that both programs predicted similar trends with input speed and input torque; however, actual values differed by between 46 and 153 K (83 and 275 OF). Figure 38 illustrates the similar speed trends displayed by both programs. TELSGE did not converge in the input speed region between 5000 and 6000 rpm. Maximum flash temperatures are plotted as a function of input torque in figures 39 and 40 at 2000- and 6000-rpm input speeds, respectively. As seen in these figures, both programs displayed the same nonlinear increasing flash temperature trend with increasing input torque.
Profile modific&*on. -To compare the relative effects of profile modification on the dynamic load factor as calculated
x
W CL 3 c
W a
c 1 v)
LL
22
z 5
600 - ,-:-, GRDYNMULT -&- TELSGE
400 -
50 100 150 200 250 300 350 INPUT TORQUE, N.M
4 .50 1.00 1.50 2.00 2.50 3 . 0 0 ~ 1 0 ~
INPUT TORQUE, IN..LB
Figure 39. -Comparison of programs GRDYNMULT and TELSGE. Maxi- mum flash temperature as function of input torque at 2000-rpm input speed (Table VIII, runs 5 , 17-20).
4 400
5 300
2 200
Y ,-I- GRDYNMULT 650--
k 500 - 450 -
v)
LL
5 400 - 350 I I I I
50 100 150 200 250 300 350 INPUT TORQUE. N.M
4 .50 1.00 1.50 2.00 2.50 3 . 0 0 ~ 1 0 ~
INPUT TORQUE, IN..LB
Figure 40.-Comparison of programs GRDYNMULT and TELSGE. Maxi- mum flash temperature as function of input torque at 6000-rpm input speed (Table VIII, runs 12-16).
GRDYNMULT -0- DANST
2 * o r -** TELSGE
0 2000 3000 4000 5000 6000 7000 8000
INPUT SPEED, RPM
Figure 41 .-Comparison of programs GRDYNMULT, DANST, and TELSGE Maximum dynamic load factor as function input speed. with tooth profile modification. Input torque = 203.4 Nom (Table VIII, run 3).
by each program, a standard tip relief was added to the single mesh system. The tip relief consisted of a parabolic shape along 50 percent of the length from the tip to the pitch point, with a maximum deviation magnitude of 0.0178 nun (0.0007 in.) at the tip. Plots of the dynamic load factor, as a function of input speed, with profile modification are given in figure 41.
19

Comparison of figure 41 with figure 25 (same run parameters as fig. 41 but with no profile modification) shows that the most dramatic amplitude reductions occur similarly in programs DANST and TELSGE at speeds near their predicted half har- monic speeds. DANST shows an amplitude reduction of 33 percent at the 5000-rpm data point (predicted half harmonic speed at 5191 rpm). TELSGE reduces from a divergance situation to a maximum dynamic load factor of 1.27 with profile modification at the 5500-rpm data point (predicted half harmonic speed at 5 130 rpm). TELSGE and DANST also experienced similar dynamic load factor reductions at speeds below the peak amplitude speeds with profile modification added, as illustrated in figure 41. GRDYNMULT showed no appreciable difference with profile modification added. It is not known at this time why GRDYNMULT did not show any change with the addition of profile modification in this example.
Mesh damping.-To compare the relative effects of the mesh damping ratio on the dynamic load factor, a number of runs were made with mesh damping ratio input values ranging from 0.03 to 0.17. Because damping effects are more promi- nent at system resonance points, an input speed of 5000 rpm was chosen because of its close proximity to the half harmonic speeds predicted by each program. As illustrated in figure 42, all three programs show good correlation at damping ratios of 0.10 or greater. As seen in this figure, all of the programs predict a reduction in maximum dynamic load factor as the mesh damping ratio value is increased from 0.10 to 0.17 (12 percent reduction for TELSGE, 19 percent reduction for GRDYNMULT, and 14 percent reduction for DANST). At damping ratios lower than 10 percent, the TELSGE program diverged. The close proximity of the 5000-rpm input speed to the half harmonic of the first natural frequency predicted by TELSGE (within 3 percent of 5130 rpm) is most probably the reason TELSGE is highly sensitive to the mesh damping ratio changes at this speed. DANST and GRDYNMULT show good correlation over the whole range of damping ratios used. As seen in figure 42, as the mesh damping ratio increases from 0.03 to 0.17 both programs show a near identical decrease of the dynamic load factor in both form and magnitude (DANST: 22 percent reduction, GRDYNMULT: 23 percent reduction) from an average value of 1.64 to 1.27.
2.0
= 0 c V C ii
5 1.5
! Y
-C-, GRDYNMULT
-&- TELSGE - -+-- DANST
\
- = = n
1.0 0 .05 .10 .15 .20
MESH DAMPING RATIO. t
Concluding Remarks A comparison study was performed with the gear dynamic
analysis computer programs PGT, GRDYNMULT, TELSGE, and DANST at NASA Lewis Research Center. The comparison study consisted of two major parts. The first part involved a direct comparison of the capabilities, input options, and output options of the programs. Results of this study were tabulated and some general comments are as follows:
1. GRDYNMULT appears to be the most versatile in system size, type, and analysis capabilities of all the programs compared.
2 . TELSGE provides the most detailed analysis on lubrication dynamics, yielding quantities such as film thickness and flash temperatures.
3. DANST incorporates the most versatile tooth profile deviation routine, allowing the user to enter standard or user defined shapes and magnitudes.
4. PGT provides a sun center movement routine which allows the user to obtain the displacement of the sun center through one or more revolutions.
The second part of the comparison study involved performing parametric comparison runs using identical input models. Some general results from this study are given below:
1. Computer programs PGT and GRDYNMULT predicted similar levels and form of the dynamic sudplanet mesh loads as the input speed was varied. Ring/planet mesh loads differed significantly between the programs.
2. Programs TELSGE, GRDYNMULT, and DANST all predicted dynamic mesh loads of similar form and magnitudes as the input speed and torque were varied. TELSGE results diverged at input speeds near its half harmonic resonant speed.
3. Root stress predictions from programs DANST and GRDYNMULT showed good trend correlation with input speed and torque variations. Magnitudes correlated reasonably well with only minor variations.
4. Programs TELSGE and GRDYNMULT predicted nearly identical hertz stress levels and trends as input torques and speeds were varied.
5. Programs TELSGE and GRDYNMULT predicted similar flash temperature trends; however, actual values were not in close agreement. GRDYNMULT consistently predicted higher than expected flash temperatures.
Lewis Research Center National Aeronautics and Space Administration Cleveland, Ohio, December 19, 1988
Figure 42.-Comparison of p r o w GRDYNMULT, DANST, and TEUGE. Maximum dynamic load factor as function of mesh damping. Input torque = 203.4 N-m; input speed = 5000 rpm (Table VII, runs 8, 21-24).
I 20

References 7.
8.
9.
10.
11.
12.
13.
Boyd, L.S.; and Pike, J.: Multi-Mesh Gear Dynamics Program Evaluation
Lewicki, D.G.: Predicted Effect of Dynamic Load on Pitting Fatigue
Pike, J.A.: Interactive Multiple Spur Gear Mesh Dynamic Load Program.
Coy, J.J.; Townsend, D.P.; and Zaretsky, E.V.: Gearing. NASA
Choy, F.K.; Townsend, D.P.; and Oswald, F.B.: Dynamic Analysis of Multimesh-Gear Helicopter Transmissions. NASA TP-2789, 1988.
Thomson, W.T.: Theory of Vibration with Applications. 2nd ed., Prentice-Hall, 1981.
Cornell, R.W.; and Westervelt, W.W.: Dynamic Tooth Loads and Stressing for High Contact Ratio Spur Gears. J. Mech. Des., vol. 100, no. 1, Jan. 1978, pp. 69-76.
and Enhancements. NASA CR-174747. 1985.
Life for Low-Contact-Ratio Spur Gears. NASA TP-2610, 1986.
NASA CR-165514, 1981.
RP-1152, 1985.
1. Boyd, L.S.; and Pike, J.A.: Expansion of Epicyclic Gear Dynamic Analysis Program. (HSER-10853, Hamilton Standard; NASA Contract
2. Wang, K.L.; and Cheng, H.S.: Thermal Elastohydrodynamic Lubrication
3. August. R., et al.: Dynamics of Early Planetary Gear Trains. NASA
4. Lin. E.H.H.; Huston, R.L.; and Coy, J.J.: On Dynamic Loads in Parallel Shaft Transmissions, I -Modelling and Analysis. NASA TM-100180, 1987.
5. Lin, E.H.H.; Huston. R.L.; and Coy, J.J.: On Dynamic Loads in Parallel Shaft Transmissions. 11-Parameter Study. NASA TM-100181, 1987.
6. Lin, H.H.; and Huston. R.L.: Dynamic Loading on Parallel Shaft Gears. (UC-MIE-051586-19, Cincinnati University; NASA Grant NSG-3188)
NAS3-24614) NASA CR-179563, 1986.
of Spur Gears. NASA CR-3241, 1980.
CR-3793, 1984.
NASA CR-179473, 1986. 14. Cornell, R.W.: Compliance and Stress Sensitivity of Spur Gear Teeth,
J. Mech. Des., vol. 103, no. 2, Apr. 1981, pp. 447-459.
TABLE 1.-GENERAL INFORMATION
Program name Dynamics of planetary
gear trains, PGT
Epicyclic gear dynamic analysis
program, GRDYNMULT
Thermal elasto- hydrodynamic lubrication of spur gears, TELSGE
Dynamic analysis of spur gear
transmissions, DANST
Documentation NASA CR-3793 NASA CR-179563 NASA CR-3241, NASA TP-2610
NASA CR-179473
Operating system HP IO00 IBM 370 Cray XMP
Single mesh (external-external)
Single mesh
Spur gear
IBM 370
Single mesh (external-external) with input and output peripheral components
System types Planetary with input/output peripheral components
Planetary system, star system, differential system, single mesh (external-external), single mesh (external-internal)
System size Single stage planetary system with three planets
~~
Single mesh, epicyclic gear train with 20 planets maximum
Spur gears, single helical, double helical
Single mesh
Gear types Spur gears Spur gear
Internal, external Internal, external, buttress
External External Tooth forms
Maximum contact ratio
2.0 3.0 2.0 2.0
21

TABLE 11.-COMPARISC
Program
PGT
GRDY NMULT
Gear life calculation
No
No
Calculates tooth root
stress
DANST T
Calculates tooth hertz
stress
Calculates dynamic mesh
load
Yes, maximum value for each $ear in mesh, and as a function If position along line of contact
No
Yes, for each mesh at each planet, as a function of roll angle
Yes. maximum value for each mesh at each planet, and as a function of position along line of contact
Yes. as a function of position along line of contact
~ ~~~
Yes, maximum value for each mesh at each planet, and as a function of position along line of contact
TELSGE Yes, maximum value, and as a function of position along line of contact
Yes, based on dynamic mesh loads
~~
Yes, as a function of roll angle
Yes, for each sear as a function -011 angle
Calculates combined stiffness
NO
Yes, for each mesh at each planet, as a function of roll angle
Yes, compliance function coefficients calculated
Yes, as a function of position along line of contact
~
Yes, as a function of roll angle
Film thickness
calculations
No
No
Yes, as a function of position along line of contact
No
Calculates surface
temperatur
No
No
Yes, gear ar pinion surfat temperature a function o position alor line of conti
No
22

ORIGlNAL PAGE IS OF POOR QUALITY
CAPABILITIES c Calculations Parameter run survey
Calculates dynamic PV
(surface damage) factor
Geometric preprocessor
Natural frequency predictions
Frequency analysis
Sun center movemer calculation ‘ flash
temperature
No No No No No Yes Yes, for tooth geometry input in dynamic load calculation
Yes, for tooth geometry input in dynamic load calculation, and determines optimum profile modification
Yes, speed run, determines maximum dynamic load at each mesh for each speed increment
Yes, maximum value for each mesh at each planet, and as a function of position along line of contact
Yes, predicts iatural frequencies md mode shapes of he system
Yes, with post- processing program “freplot” performs frequency analysis on mesh load variations
No Yes, maximum value for each imesh at each ?lanet, and as a
aosition along
inion flash mperature as a nction of
osition along ne of contact
No Yes, for tooth geometry input in dynamic load calculation
fes, predicts system iatural frequency
No NIA Yes, speed run, load run, face width run, outside radius run, number of teeth run, and surface convection heat transfer coefficient run
Yes, speed run, determines maximum dynamic load at each speed increment
No No Yes, for tooth geometry input in dynamic load calculation
I‘es, predicts irst three natural iequencies of the ystem
Yes, performs frequency analysis on dynamic mesh load, and on the static transmission error
NIA
23

TABLE 111.-PROGRL
No
~~
Damping of
peripheral shafts
Yes
Program 1 Lubrication Iteration convergence
tolerance
Mesh damping ratio
Planet gears phasing constant
Face width crowning parameter
Stiffness of peripheral
shafts
No No N 0 Yes, actual stiffness value entered
Yes, dampir :oefficient :ntered
Yes, choice of several oils in program, or user defined oil
Yes, number of iterations, and :onvergence tolerance :an be input
Yes Yes Yes, length of face width crown, and edge relief are input
No No GRDYNMULT
Yes, user inputs oil type and properties
NIA No No No TELSGE
Yes, user can define one of two lubrication models available
No I Yes
NIA No Yes, user inputs shaft diameter, length, and modulus for bod input and outpuc shafts
No DANST
L
24

IPUT OPTIONS
Planet carrier
flexibility
Load and driver mass moment of
inertia
Ring gear Floating sun rim flexibility gear
Yes
Yes, azimuthal planet carrier stiffness can be input
I
Yes, azimuthal Yes, sun center ring gear rim stiffness and stiffness can be damping coefficien input can be input
I 1 No
Gear material
Yes, Young’s modulus, Poisson’s ratio, material density
Yes, Young’s modulus, Poisson’s ratio, material density
~
Yes, Young’s modulus, Poisson’s ratio, material density, specific heat, thermal conductivity
Yes, Young’s modulus Poisson’s ratio, material density
~
Errors
Yes, planet phase angle error input, tooth profile error input
Yes, tooth spacing errors input, sun gear run-out errror, heli angle error
Yes, 100 point array available for user defined tooth profile deviation
~ ~~
Yes, 121 point array available for user defined tooth profile deviation
~~
Profile modifications
None indicated in documentation
Yes, tooth profile modification shape, length along tooth surface, and magitude can be input
Yes, 100 point array available for user defined tooth profile deviation
Yes, tip relief parameters can be input for a linear or parabolic shape, or, user can define shape using 121 point file deviation array
No No Yes, sun center stiffness and damping coefficien can be input
I I
NIA NIA N/A
NIA NIA NIA
25

TABLE 1V.-PROGRAM OUTPUT OPTIONS
Run Input speed, Sun center number rpm stiffness
Nlm Ibiin.
Printed output available
Mesh damping Sun center ratio, damping
E N o s h Ib*s/in.
'lotted 1utput ivailable
! I
PGT
printed as a function of gear roll angle:
Mesh stiffness Mesh dynamic loads
175.1X10⁶ 1751.0X106 1751.0X 106 17.51X10⁶
'lotted as a function of gear roll angle:
Mesh stiffness Mesh dynamic loads
iun gear center movement
1.0X10⁶ 10.X106 10. X 106 0.1X10⁶
GRDYNMULT ~~ ~
Geometric preprocessor results Involute modification tables Input data Echo Constants for the fourth order
Boundary conditions iteration
Maximum values for each mesh:
compliance function
results
Hertz stress Root stress Dynamic load factor Flash temperature Dynamic PV
System natural frequency results
Plotted as a function of position along line of action
Dynamic load factor Pressure sliding velocity (PV) Hertz stress Flash temperature Root stress-each gear
at each mesh Frequency analysis of mesh loads
TELSGE
Input data Echo Gear life calculations Printed as a fubction of contact position:
Combined stiffness Dynamic load factor Hertz stress Film thickness Pinion temperature Gear temperature Flash temperature-pinion Flash temperature-gear
Mesh natural frequency Maximum dynamic load Average mesh stiffness
Other values printed
Plotted routine not available on Cray version
[nput data Echo Sear teeth deflection Static transmission error Dynamic tooth load Fourier transform of the dynamic mesh loads
Fourier transform of the static transmission error
Plotted as a function of gear roll angle: Tooth deflection Static transmission error Tooth stiffness Tooth load sharing Coefficient of friction Torsional torque Static and dynamic tooth loads Tooth root stress-gear and pinion
Fourier transform plot of dynamic mesh loads
Fourier transform plot of the static transmission error
Dynamic load factor plot for speed survey run
TABLE V.-GRDYNMULT-PGT COMPARISON RUNS MATRIX DESCRIPTION [Input torque = 33.9 Nom (300 in-lb) for all runs.]
I I I I I I
1 1 4000 I 1751.0~106 I 10.~106 1 0.1 I 17.51 1 0.1 5000 6OOo 7000 8000 4000
I .03 . I
3.50 17.51 17.51
DANST
.02
.1
.I
26

TABLE VI.-SYSTEM DESCRIPTION AND NATURAL FREQUENCY PREDICTION OF THE PLANETARY
GEAR TRAIN USED IN PGT-GRDYNMULT COMPARISON RUNS
N
1 2 3
System description
TELSGE GRDYNMULT
fn, Hz w, rpm fn, Hz w, rpm fn, Hz w, rpm
33 71 3963 8492 4788 10260 40
DANST
86 _ _ _ _ ___- ---- _ _ _ _ 4845 10 382 _ _ _ _ _____ ---- ----
System type . . . . . . . . . . . . . . . . . . . . . . . . . . Planetar) Diametral pitc . . . . . . . . . . . . . . . . . . . . . 8.466; Pressure angle, deg . . . . . . . . . . . . . . . . . . . . . . . . 22.:
Sun . . . . . . . . . . . . . . . . . . . . . . . . . . . . . . . . . . . . . . . . . . . . . 14 Planets . . . . . . . . . . . . . . . . . . . . . . . . . . . . . . . . . 2E Ring . . . . . . . . . . . . . . . . . . . . . . . . . . . . . . . . . . . . . . . . . . . . 7C
Number of teeth
1 Number of planets . . . . . . . . . . . . . . . . . . . . . . . . Face width, mm (in.)
Sun . . . . . . . . . . . . . . . . . . . . 30 (1.1811] planets . . . . . . . . . . . . . . . . . . . . . . . . . . 30 (1.1811] r ing . . . . . . . . . . . . . . . . . . . . . . . . . . . . . . . . . . . . . 36 (1.4184)
Natural frequency predictions (from program GRDYNMULT)
fn, Hz
2378 6 2513
~
For PGT input only:
J (driver), N*m*s2 (in.*lb*s2) . . . . . . . . . . . . 113 x 10-6 (0.001) J (load), N*m*s2 (in.*lb*s2) . . . . . . . . . . . . . 113 x 10-6 (0,001) Input shaft stiffness, Nom (Iblin.) . . . . . . . 1 . 7 5 ~ 1 0 9 (lox 106) Output shaft stiffness, Nom (Iblin.) . . . . . . 1.75 x IO9 ( l o x 106) Input shaft damping, Nodm (Ib*slin.) . . . . . . . . . 0.175 (0.001) Output shaft damping, N 4 m (Ib-din) . . . . . . . . 0.175 (0.001)
TABLE VI1.-SYSTEM DESCRIPTION AND NATURAL FREQUENCY PREDICTIONS OF THE SINGLE MESH
COMPARISON RUNS SYSTEM USED IN GRDYNMULT-TELSGE-DANST
I System description
System type.. . . . . . . . . . . . . . . . . . . . . . . . . . . . . . Single mesh Diametral pitch . . . . . . . . . . . . . . . . . . . . . . . . . . . . . . . . . .8.00( Pressure angle, deg . . . . . . . . . . . . . . . . . . . . . . . . . . . . . . . . .2( Number of teeth (pinion). . . . . . . . . . . . . . . . . . . . . . . . . . . . 2t Number of teeth (gear) . . . . . . . . . . . . . . . . . . . . . . . . . . . . . 26 Face width, mm (in.) . . . . . . . . . . . . . . . . . . . . . . . .6.35 (0.25; Lubrication . . . . . . . . . . . . . . . . . . . . . . . . . . . . . . MIL-L-23695
Natural frequency predictions
For DANST input only: J (driver) . . . . . . . . . . . . . . . . . . . . . . . . . . . . . . . . . 1.J (pinion) J (load) . . . . . . . . . . . . . . . . . . . . . . . . . . . . . . . . . . . 1-J (gear) Input shaft diameter, mm (in.). . . . . . . . . . . . . . . . 5.08 (0.20) Output shaft diameter, mm (in.) . . . . . . . . . . . . . . 5.08 (0.20) Input shaft length, mm (in.) . . . . . . . . . . . . . . . . . . 381 (15.0) Output shaft length, mm (in.) . . . . . . . . . . . . . . . . . 381 (15.0)
27

TABLE VIII-DANST-GRDYNMULT-TELSGE COMPARISON RUNS MATRIX DESCRIPTION
[A = GRDYNMULT, B = DANST, and C = TELSGE.]
Run number
1 2 3 4 5 6 7 8 9
10 11 12 13 14 15 16 17 18 19 20 21 22 23 24
Input torque
203.4 71.8
203.4 71.8
203.4
1 71.8
135.6 271.2 339.0 203.4
71.8 135.6 271.2 339.0 203.4
I
- in-lb
1800 635
1800 635
1800
I 635
1200 2400 3000 1800 635
1200 2400 3000 1800
I
Input speed, 'pm
Varied
I 2000 3000 4000 5000 6OOo 7000 8000 6OOo
I 2000
I I
5000
Program used in run
- A
X X X X X X X X X X X X X X X X X X X X X X X X
-
-
- B
X
X
X X X X X X X X X X X X X X X X X X X X
-
-
- C
X X X
X X X X X X X X X X X X X X X X X X X X
-
-
Special rur notes
aMaximum dynamic load speed run; 2000 10 8ooo rpm. step = 500 rpm bMaximum dynamic load speed run with tip relief. Zoo0 to 8000 rpm, step = 500 rpm. tip
relief magnitude = 0.0178 mm (0.0007 in.). parabolic form. applied at 50 percent of length from tip to pitch point.
CUnless otherwise noted. run, used a mesh damping rat10 of 10 percent (C=O.IO).
28
~~ ~~ ~ ~~
m National Aeronautics and Report Documentation Page Soace Administration
7. Key Words (Suggested by Author@))
Comparison study Computer programs Gears Dynamic
2. Government Accession No. NASA TP-2901 AVSCOM TR 88-C-010
1. Report No.
18. Distribution Statement
Unclassified - Unlimited Subject Category 37
4. Title and Subtitle
Comparison Study of Gear Dynamic Computer Programs at NASA Lewis Research Center
9. Security Classif. (of this report) 20. Security Classif. (of this page) 21. No of pages
Unclassified Unclassified 32
7. Author@)
James J. Zakrajesek
22. Price'
A03
9. Performing Organization Name and Address
NASA Lewis Research Center Cleveland, Ohio 44135-3191 and Propulsion Directorate U.S. Army Aviation Research and Technology Activity-AVSCOM Cleveland, Ohio 44135-3127
12. Sponsoring Agency Name and Address
National Aeronautics and Space Administration Washington, D.C. 20546-0001 and U.S. Army Aviation Systems Command St. Louis, Mo. 63120-1798
3. Recipient's Catalog No.
5. Report Date
March 1989 6. Performing Organization Code
8. Performing Organization Report No.
E-4144
10. Work Unit No.
1 L 162209AH76 505-63-51
11. Contract or Grant No.
13. Type of Report and Period Covered
Technical Paper
14. Sponsoring Agency Code
15. Supplementary Notes
l6. Abstract
A comparison study was performed on four gear dynamic analysis computer programs developed under NASA/ Army sponsorship. These programs are GRDYNMULT (a multimesh program applicable to a number of epicyclic systems), TELSGE (a single mesh program), PGT (a multimesh program applicable to a planetary system with three planets), and DANST (a single mesh program). The capabilities and features, input and output options, and technical aspects of the programs were reviewed and compared. Results are presented in a concise tabular form. Parametric studies of the program models were performed to investigate the predicted results of the programs as input parameters such as speed, torque, and mesh damping were varied. In general, the program models predicted similar dynamic load and stress levels as operating conditions were varied. Flash temperature predictions from programs GRDYNMULT and TELSGE indicated similar trends; however, actual values were not in close agreement. The program GRDYNMULT was found to be the most versatile in system size, type, and analysis capabilities. The programs DANST, TELSGE, and PGT are more specialized for specific systems; however, in specific areas they provide a more detailed treatment than GRDYNMULT.
NASA-Langley, 1989