Embed Size (px)
Citation preview
NASA TECHNICAL
MEMORANDUM
CMvnCjl
NASA TM X-2526
COPYILE
ENGINE INVESTIGATION OFAN AIR-COOLED TURBINE ROTOR BLADEINCORPORATING IMPINGEMENT-COOLEDLEADING EDGE, CHORDWISE PASSAGES,AND A SLOTTED TRAILING EDGE
by Robert P. Dengler, Frederick C. Yeh,James W. Gauntner, and Gerald E, Fallon
Lewis Research Center
Cleveland, Ohio 44135
NATIONAL AERONAUTICS AND SPACE ADMINISTRATION • WASHINGTON, D. C. • APRIL 1972
https://ntrs.nasa.gov/search.jsp?R=19720013274 2018-07-14T22:41:06+00:00Z
1. Report No.
NASA TM X-25262. Government Accession No.
4. Title and Subtitle ENGINE INVESTIGATION OF AN AIR-COOLEDTURBINE ROTOR BLADE INCORPORATING IMPINGEMENT-COOLED LEADING EDGE, CHORDWISE PASSAGES, AND ASLOTTED TRAILING EDGE
7. Author(s)
Robert P. Dengler, Frederickand Gerald E. Fallon
9. Performing Organization Name and Address
Lewis Research CenterNational Aeronautics and SpaceCleveland, Ohio 44135
12. Sponsoring Agency Name and Address
C. Yeh, James W. Gauntner,
Administration
National Aeronautics and Space AdministrationWashington, D.C. 20546
3. Recipient's Catalog No.
5. Report DateApril 1972
6. Performing Organization Code
8. Performing Organization Report No.
E-645010. Work Unit No.
764-7411. Contract or Grant No.
13. Type of Report and Period Covered
Technical Memorandum14. Sponsoring Agency Code
15. Supplementary Notes
16. Abstract
Experimental temperatures are presented for an air-cooled turbine rotor blade tested in anengine. The data were obtained for turbine stator inlet temperatures from 1367 to 1644 K (2000°to 2500° F) and for turbine- inlet gas pressures from 22 to 32 newtons per square centimeter(32 to 46 psia). Average and local blade heat-transfer data are correlated. Potential allowableincreases in gas temperature are also discussed.
17. Key Words (Suggested by Author(s))
Turbine blade coolingHeat-transfer characteristicsTurbojet engine tests
19. Security Oassif. (of this report)
Unclassified
18. Distribution Statement
Unclassified - unlimited
20. Security Classif. (of this page)
Unclassified21 . No. of Pages 22. Price"
44 $3.00
* For sale by the National Technical Information Service, Springfield, Virginia 22151
ENGINE INVESTIGATION OF AN AIR-COOLED TURBINE ROTOR BLADE INCORPORATING
IMPINGEMENT-COOLED LEADING EDGE, CHORDWISE
PASSAGES, AND A SLOTTED TRAILING EDGE
by Robert P. Dengler, Frederick C. Yeh, James W. Gauntner,and Gerald E. Fallen
Lewis Research Center
SUMMARY
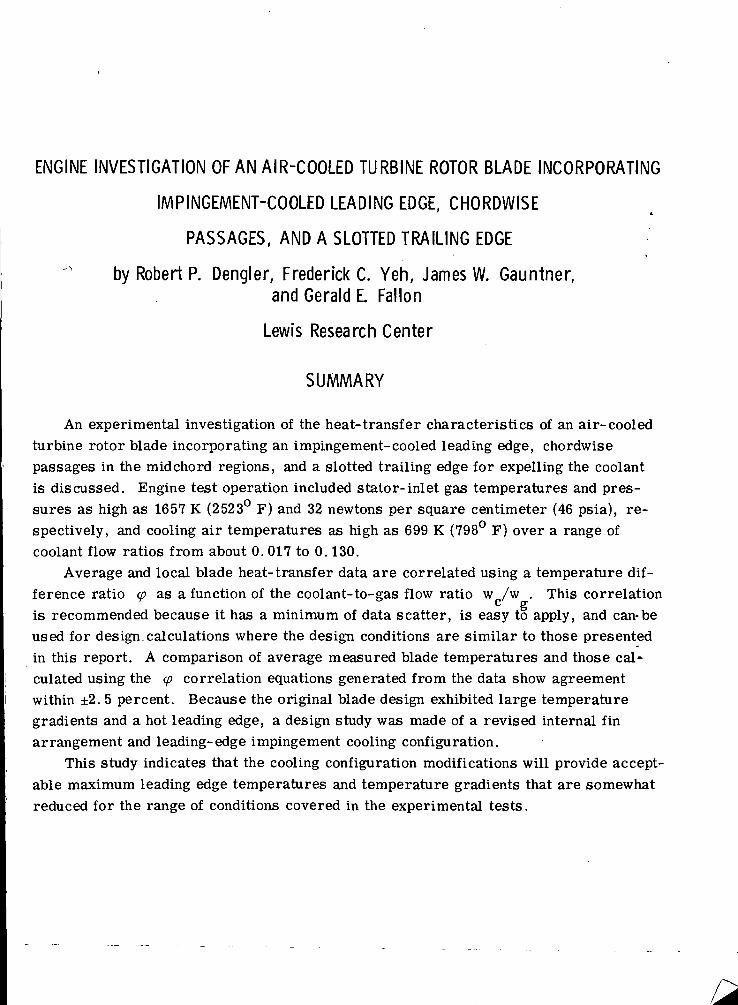
An experimental investigation of the heat-transfer characteristics of an air-cooled
turbine rotor blade incorporating an impingement-cooled leading edge, chordwisepassages in the midchord regions, and a slotted trailing edge for expelling the coolantis discussed. Engine test operation included stator-inlet gas temperatures and pres-
sures as high as 1657 K (2523° F) and 32 newtons per square centimeter (46 psia), re-spectively, and cooling air temperatures as high as 699 K (798° F) over a range ofcoolant flow ratios from about 0. 017 to 0.130.
Average and local blade heat-transfer data are correlated using a temperature dif-ference ratio <p as a function of the cool ant-to-gas flow ratio w /w . This correlation
§>is recommended because it has a minimum of data scatter, is easy to apply, and can-beused for design.calculations where the design conditions are similar to those presented
in this report. A comparison of average measured blade temperatures and those cal-culated using the cp correlation equations generated from the data show agreementwithin ±2. 5 percent. Because the original blade design exhibited large temperaturegradients and a hot leading edge, a design study was made of a revised internal finarrangement and leading-edge impingement cooling configuration.
This study indicates that the cooling configuration modifications will provide accept-
able maximum leading edge temperatures and temperature gradients that are somewhat
reduced for the range of conditions covered in the experimental tests.
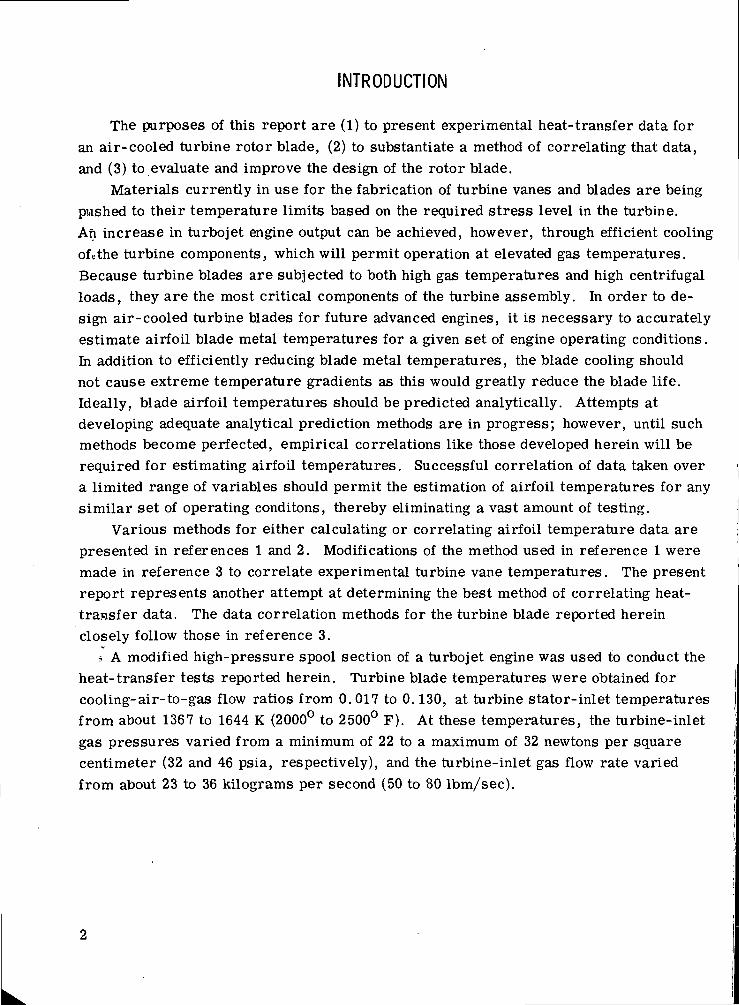
INTRODUCTION
The purposes of this report are (1) to present experimental heat-transfer data foran air-cooled turbine rotor blade, (2) to substantiate a method of correlating that data,and (3) to evaluate and improve the design of the rotor blade.
Materials currently in use for the fabrication of turbine vanes and blades are beingpushed to their temperature limits based on the required stress level in the turbine.An increase in turbojet engine output can be achieved, however, through efficient coolingof«the turbine components, which will permit operation at elevated gas temperatures.Because turbine blades are subjected to both high gas temperatures and high centrifugalloads, they are the most critical components of the turbine assembly. In order to de-sign air-cooled turbine blades for future advanced engines, it is necessary to accuratelyestimate airfoil blade metal temperatures for a given set of engine operating conditions.In addition to efficiently reducing blade metal temperatures, the blade cooling shouldnot cause extreme temperature gradients as this would greatly reduce the blade life.Ideally, blade airfoil temperatures should be predicted analytically. Attempts atdeveloping adequate analytical prediction methods are in progress; however, until suchmethods become perfected, empirical correlations like those developed herein will berequired for estimating airfoil temperatures. Successful correlation of data taken overa limited range of variables should permit the estimation of airfoil temperatures for anysimilar set of operating conditons, thereby eliminating a vast amount of testing.
Various methods for either calculating or correlating airfoil temperature data arepresented in references 1 and 2. Modifications of the method used in reference 1 weremade in reference 3 to correlate experimental turbine vane temperatures. The presentreport represents another attempt at determining the best method of correlating heat-transfer data. The data correlation methods for the turbine blade reported hereinclosely follow those in reference 3.
? A modified high-pressure spool section of a turbojet engine was used to conduct theheat-transfer tests reported herein. Turbine blade temperatures were obtained forcooling-air-to-gas flow ratios from 0.017 to 0.130, at turbine stator-inlet temperaturesfrom about 1367 to 1644 K (2000° to 2500° F). At these temperatures, the turbine-inletgas pressures varied from a minimum of 22 to a maximum of 32 newtons per squarecentimeter (32 and 46 psia, respectively), and the turbine-inlet gas flow rate variedfrom about 23 to 36 kilograms per second (50 to 80 Ibm/sec).
APPARATUS
Engine Facility
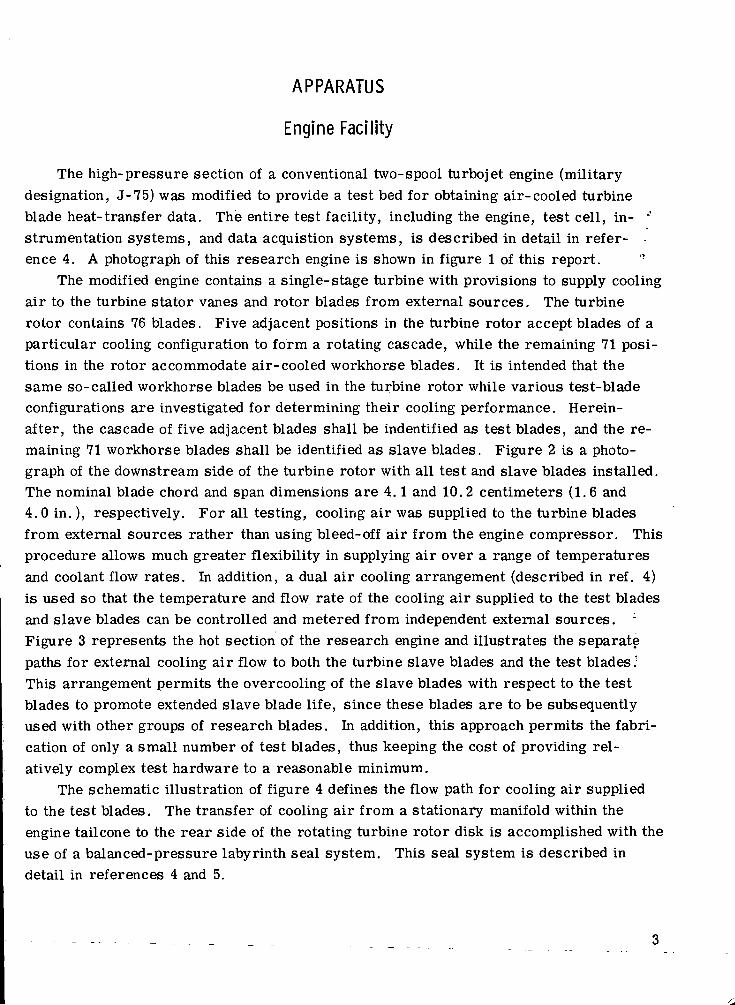
The high-pressure section of a conventional two-spool turbojet engine (militarydesignation, J-75) was modified to provide a test bed for obtaining air-cooled turbineblade heat-transfer data. The entire test facility, including the engine, test cell, in- "'strumentation systems, and data acquistion systems, is described in detail in refer-ence 4. A photograph of this research engine is shown in figure 1 of this report. *
The modified engine contains a single-stage turbine with provisions to supply coolingair to the turbine stator vanes and rotor blades from external sources. The turbinerotor contains 76 blades. Five adjacent positions in the turbine rotor accept blades of aparticular cooling configuration to form a rotating cascade, while the remaining 71 posi-tions in the rotor accommodate air-cooled workhorse blades. It is intended that thesame so-called workhorse blades be used in the turbine rotor while various test-bladeconfigurations are investigated for determining their cooling performance. Herein-after, the cascade of five adjacent blades shall be indentified as test blades, and the re-maining 71 workhorse blades shall be identified as slave blades. Figure 2 is a photo-graph of the downstream side of the turbine rotor with all test and slave blades installed.The nominal blade chord and span dimensions are 4.1 and 10.2 centimeters (1.6 and4. 0 in.), respectively. For all testing, cooling air was supplied to the turbine bladesfrom external sources rather than using bleed-off air from the engine compressor. Thisprocedure allows much greater flexibility in supplying air over a range of temperaturesand coolant flow rates. In addition, a dual air cooling arrangement (described in ref. 4)is used so that the temperature and flow rate of the cooling air supplied to the test bladesand slave blades can be controlled and metered from independent external sources. :
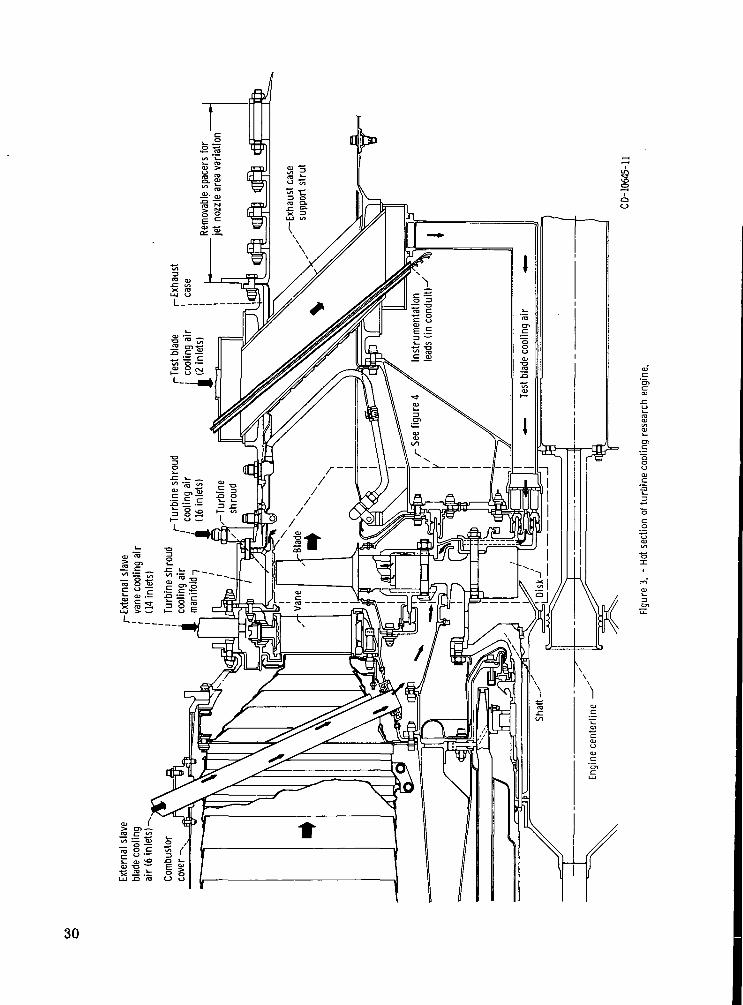
Figure 3 represents the hot section of the research engine and illustrates the separatepaths for external cooling air flow to both the turbine slave blades and the test blades:This arrangement permits the overcooling of the slave blades with respect to the testblades to promote extended slave blade life, since these blades are to be subsequentlyused with other groups of research blades. In addition, this approach permits the fabri-cation of only a small number of test blades, thus keeping the cost of providing rel-atively complex test hardware to a reasonable minimum.
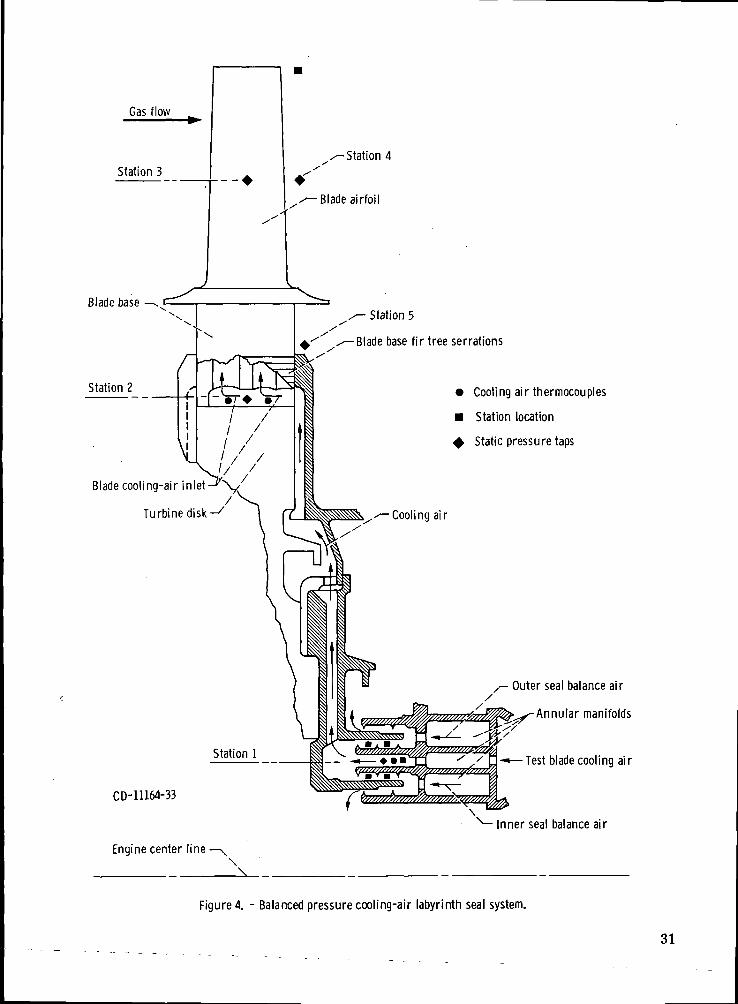
The schematic illustration of figure 4 defines the flow path for cooling air suppliedto the test blades. The transfer of cooling air from a stationary manifold within theengine tailcone to the rear side of the rotating turbine rotor disk is accomplished with theuse of a balanced-pressure labyrinth seal system. This seal system is described indetail in references 4 and 5.
Test Blade
The blade of this report was designed to operate at a gas temperature relative tothe blade of 1533 K (2300° F), a coolant inlet temperature of 922 K (1200° F), and acoolant-to-gas flow ratio of 0.03 with a resulting hotspot metal temperature of 1255 K(1800° F). For a normal amount of dilution from the stator row, the relative gas tem-perature of 1533 K (2300° F) is approximately equal to 9/10 of the stator inlet gas tem-perature of 1703 K (2607° F).
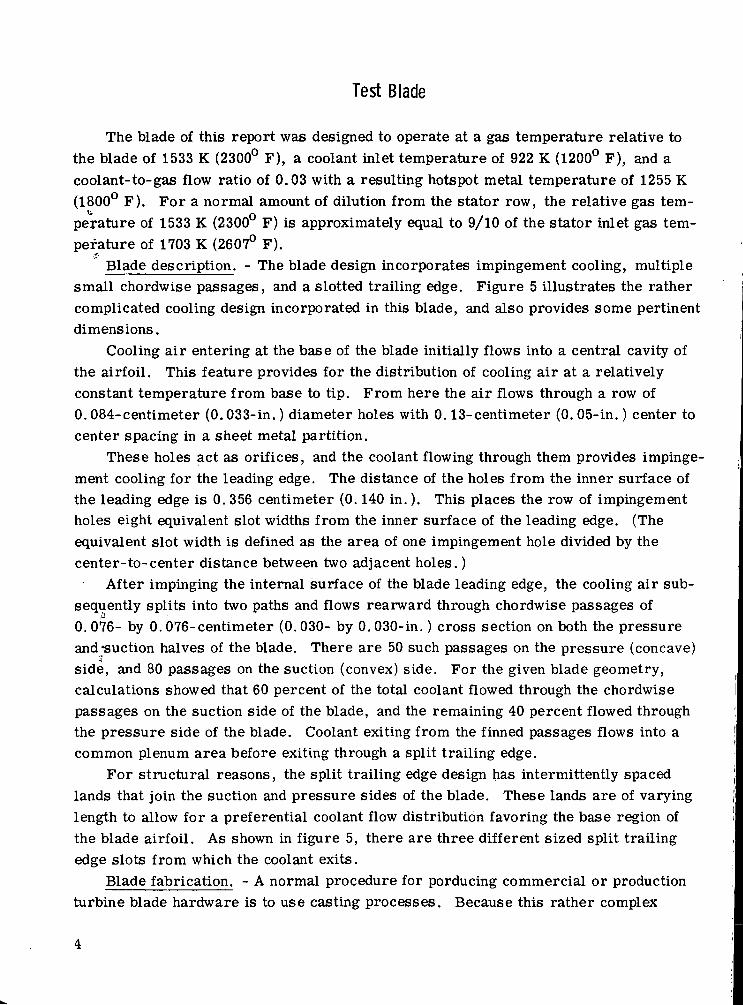
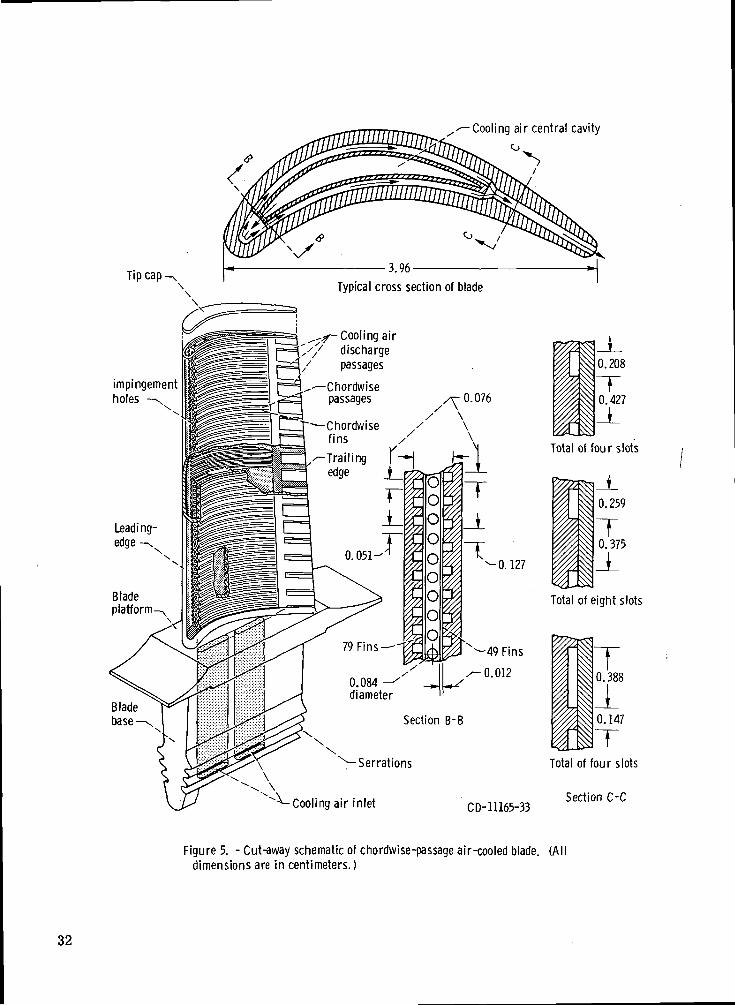
Blade description. - The blade design incorporates impingement cooling, multiplesmall chordwise passages, and a slotted trailing edge. Figure 5 illustrates the rathercomplicated cooling design incorporated in this blade, and also provides some pertinentdimensions.
Cooling air entering at the base of the blade initially flows into a central cavity ofthe airfoil. This feature provides for the distribution of cooling air at a relativelyconstant temperature from base to tip. From here the air flows through a row of0. 084-centimeter (0.033-in.) diameter holes with 0.13-centimeter (0. 05-in.) center tocenter spacing in a sheet metal partition.
These holes act as orifices, and the coolant flowing through them provides impinge-ment cooling for the leading edge. The distance of the holes from the inner surface ofthe leading edge is 0. 356 centimeter (0.140 in.). This places the row of impingementholes eight equivalent slot widths from the inner surface of the leading edge. (Theequivalent slot width is defined as the area of one impingement hole divided by thecenter-to-center distance between two adjacent holes.)
After impinging the internal surface of the blade leading edge, the cooling air sub-sequently splits into two paths and flows rearward through chordwise passages of0.076- by 0.076-centimeter (0.030- by 0.030-in.) cross section on both the pressureand-suction halves of the blade. There are 50 such passages on the pressure (concave)
IT
side, and 80 passages on the suction (convex) side. For the given blade geometry,calculations showed that 60 percent of the total coolant flowed through the chordwisepassages on the suction side of the blade, and the remaining 40 percent flowed throughthe pressure side of the blade. Coolant exiting from the finned passages flows into acommon plenum area before exiting through a split trailing edge.
For structural reasons, the split trailing edge design has intermittently spacedlands that join the suction and pressure sides of the blade. These lands are of varyinglength to allow for a preferential coolant flow distribution favoring the base region ofthe blade airfoil. As shown in figure 5, there are three different sized split trailingedge slots from which the coolant exits.
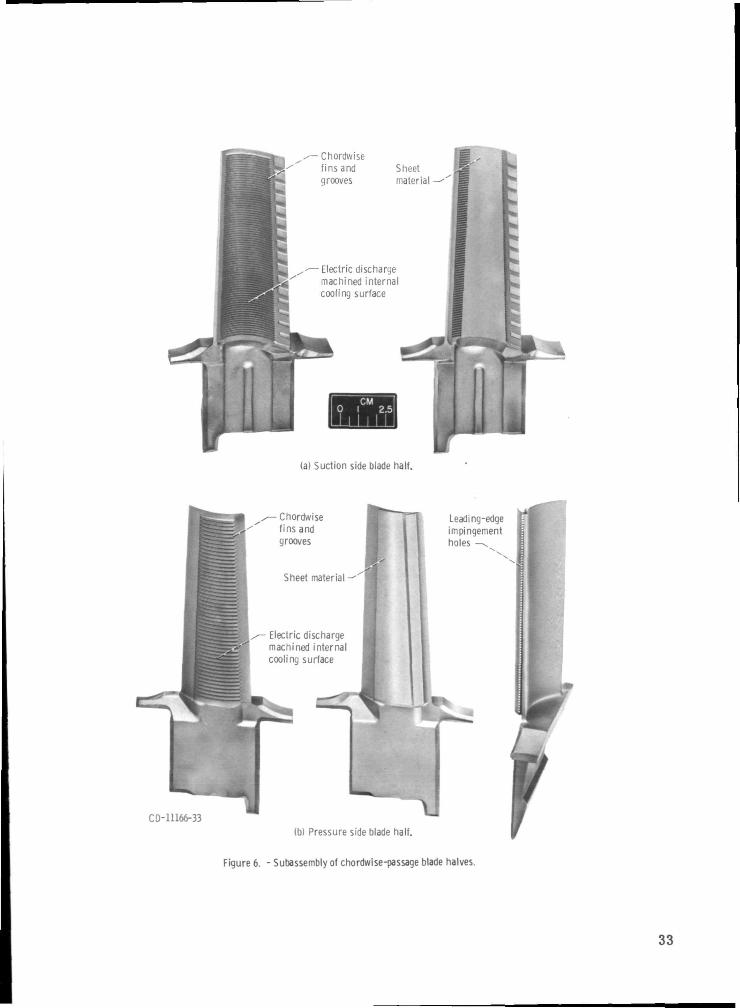
Blade fabrication. - A normal procedure for porducing commercial or productionturbine blade hardware is to use casting processes. Because this rather complex
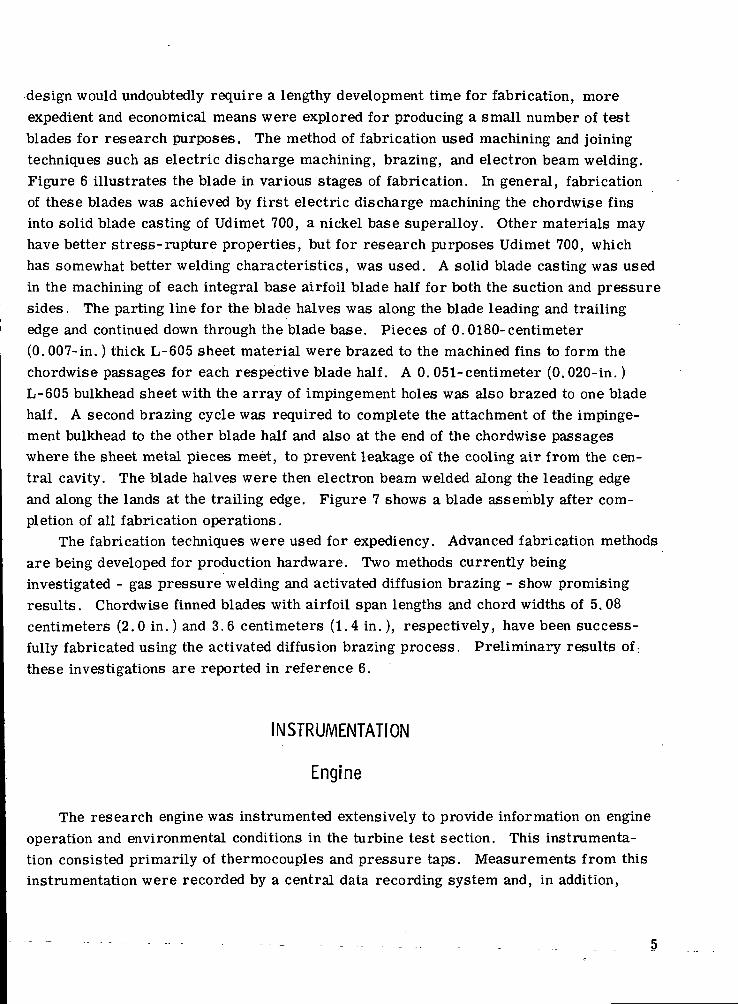
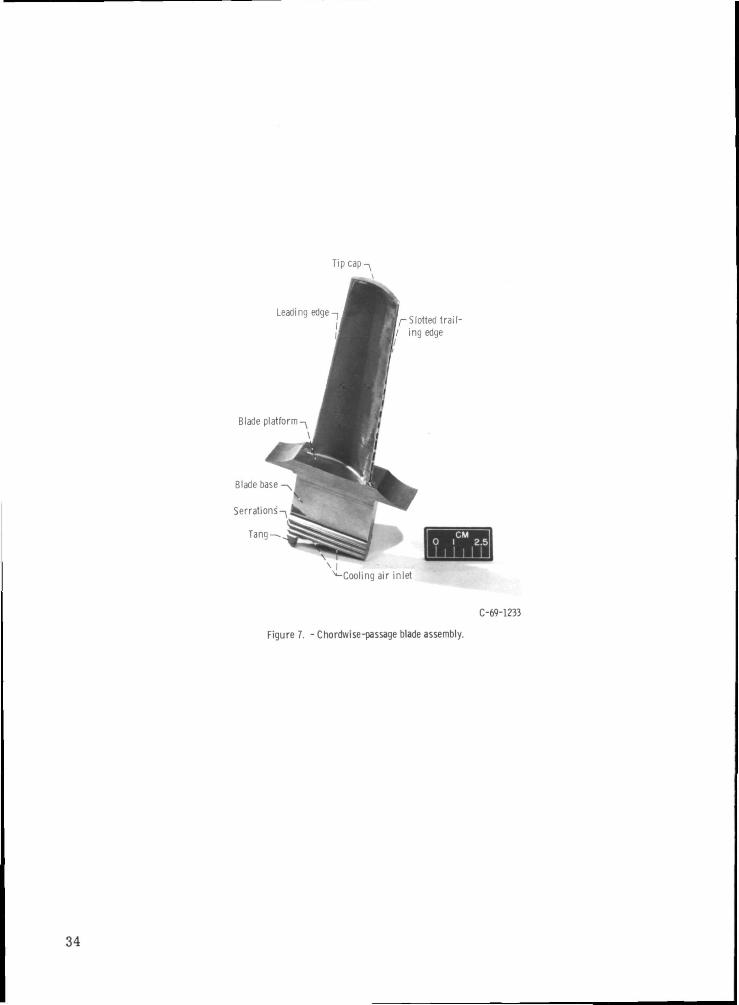
design would undoubtedly require a lengthy development time for fabrication, moreexpedient and economical means were explored for producing a small number of testblades for research purposes. The method of fabrication used machining and joiningtechniques such as electric discharge machining, brazing, and electron beam welding.Figure 6 illustrates the blade in various stages of fabrication. In general, fabricationof these blades was achieved by first electric discharge machining the chordwise finsinto solid blade casting of Udimet 700, a nickel base superalloy. Other materials mayhave better stress-rupture properties, but for research purposes Udimet 700, whichhas somewhat better welding characteristics, was used. A solid blade casting was usedin the machining of each integral base airfoil blade half for both the suction and pressuresides. The parting line for the blade halves was along the blade leading and trailingedge and continued down through the blade base. Pieces of 0.0180-centimeter(0. 007-in.) thick L-605 sheet material were brazed to the machined fins to form thechordwise passages for each respective blade half. A 0.051-centimeter (0.020-in.)L-605 bulkhead sheet with the array of impingement holes was also brazed to one bladehalf. A second brazing cycle was required to complete the attachment of the impinge-ment bulkhead to the other blade half and also at the end of the chordwise passageswhere the sheet metal pieces meet, to prevent leakage of the cooling air from the cen-tral cavity. The blade halves were then electron beam welded along the leading edgeand along the lands at the trailing edge. Figure 7 shows a blade assembly after com-pletion of all fabrication operations.
The fabrication techniques were used for expediency. Advanced fabrication methodsare being developed for production hardware. Two methods currently beinginvestigated - gas pressure welding and activated diffusion brazing - show promisingresults. Chordwise finned blades with airfoil span lengths and chord widths of 5. 08centimeters (2.0 in.) and 3.6 centimeters (1.4 in.), respectively, have been success-fully fabricated using the activated diffusion brazing process. Preliminary results of,these investigations are reported in reference 6.
INSTRUMENTATION
Engine
The research engine was instrumented extensively to provide information on engineoperation and environmental conditions in the turbine test section. This instrumenta-tion consisted primarily of thermocouples and pressure taps. Measurements from thisinstrumentation were recorded by a central data recording system and, in addition,
some of these measurements were also monitored in the facility control room foroperational purposes and for setting and checking test points. The general operationalinstrumentation and the central data recording system are described in more detail inreference 4. The research instrumentation provided measurements of gas streamconditions, cooling-air flow conditions, and test-blade metal temperatures. The in-strumentation for determining gas flow and cooling-air flow conditions is also dis-cussed in reference 4. Eight thermocouple probes are located at various circumferen-tial positions at the exit of the combustors for obtaining the stator-inlet gas tempera-tures. Each of these probes was actuated radially to provide temperatures at ninesimilar spanwise locations to determine a representative average stator-inlet tempera-ture. The turbine rotor test-blade cooling-air flow rate was measured upstream of thepressure-balanced labyrinth seal through the use of a venturi. The temperature andstatic pressure of the cooling air was also measured in the test-blade cooling-airannular chamber immediately before the coolant enters the rotating turbine disk. Thisis the last place in the test-blade cooling-air flow path that the pressure was measured.Thermocouples were installed to measure the temperature of the coolant just before itentered the test blades.
Blade
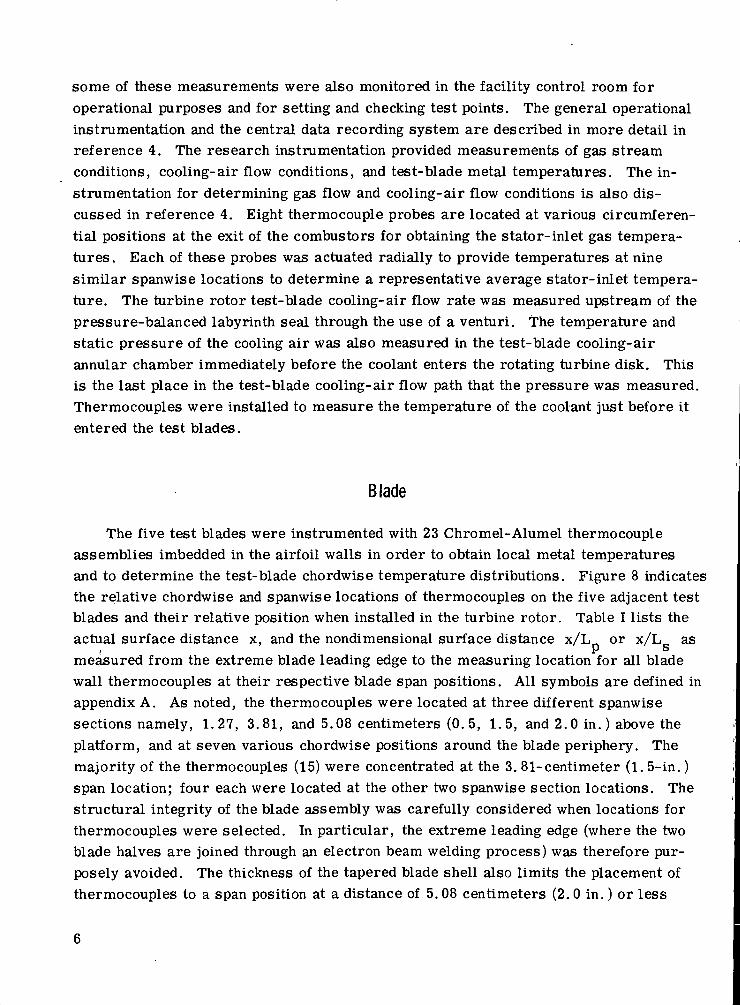
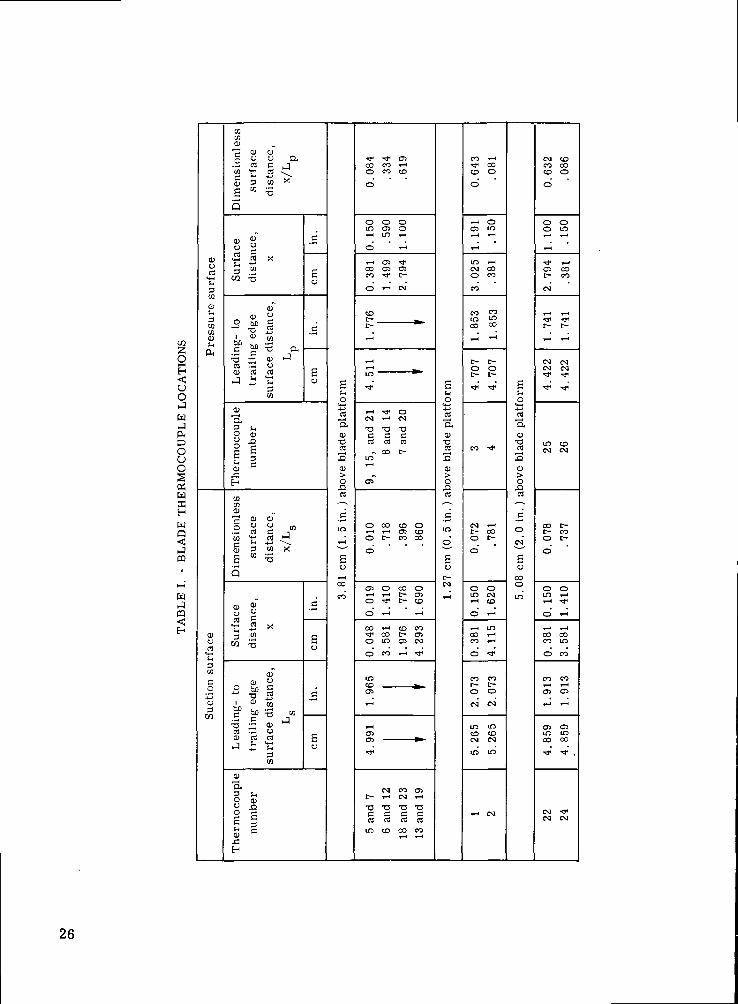
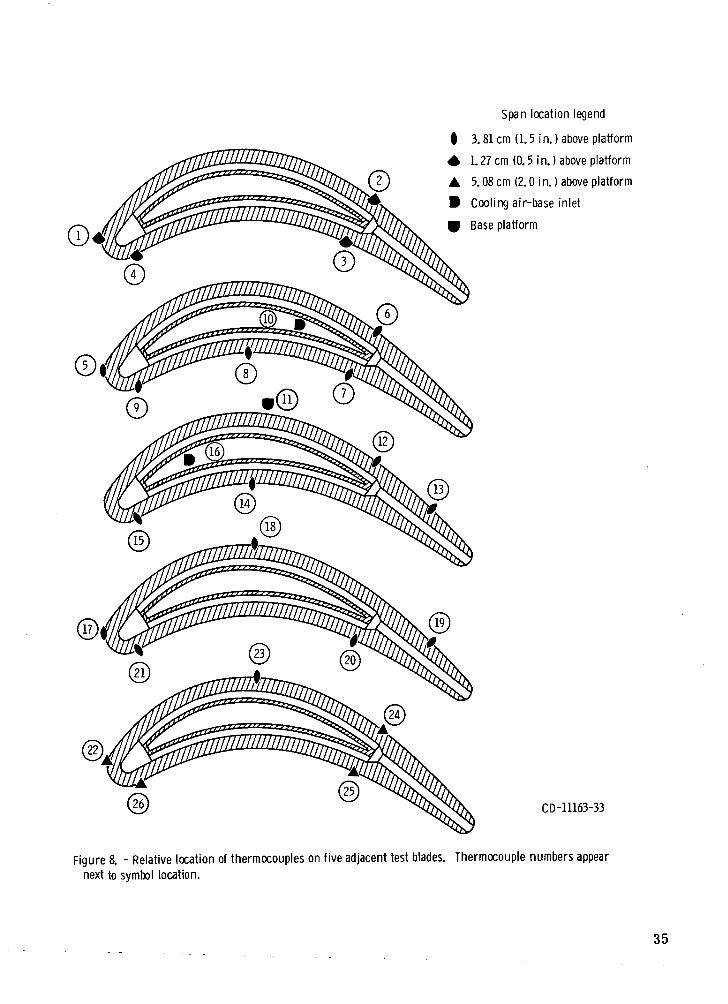
The five test blades were instrumented with 23 Chromel-Alumel thermocoupleassemblies imbedded in the airfoil walls in order to obtain local metal temperaturesand to determine the test-blade chordwise temperature distributions. Figure 8 indicatesthe relative chordwise and spanwise locations of thermocouples on the five adjacent testblades and their relative position when installed in the turbine rotor. Table I lists theactual surface distance x, and the nondimensional surface distance x/L or x/L asmeasured from the extreme blade leading edge to the measuring location for all bladewall thermocouples at their respective blade span positions. All symbols are defined inappendix A. As noted, the thermocouples were located at three different spanwisesections namely, 1.27, 3.81, and 5.08 centimeters (0. 5, 1.5, and 2.0 in.) above theplatform, and at seven various chordwise positions around the blade periphery. Themajority of the thermocouples (15) were concentrated at the 3. 81-centimeter (1. 5-in.)span location; four each were located at the other two spanwise section locations. Thestructural integrity of the blade assembly was carefully considered when locations forthermocouples were selected. In particular, the extreme leading edge (where the twoblade halves are joined through an electron beam welding process) was therefore pur-posely avoided. The thickness of the tapered blade shell also limits the placement ofthermocouples to a span position at a distance of 5. 08 centimeters (2.0 in.) or less
from the blade base platform. The blade airfoil shell thickness decreases from about0.152 centimeter (0. 060 in.) at the blade base region to about 0. 076 centimeter(0. 030 in.) at the blade tip. Allowing for structural considerations and because ofphysical limitations, the maximum number of thermocouples installed on any individualtest blade was five.
Swaged thermocouple assemblies were installed in radial grooves that had beenmachined in the blade surface. These assemblies consisted of 0. 01-centimeter(0.004-in.) diameter Chromel/Alumel wires with magnesium oxide insulation, which,in turn were contained in an Inconel sheathing. The wires and insulation were thenswaged to a final diameter of about 0. 051 centimeter (0. 020 in.). All thermocouplesinstalled on the blade were of the closed-ball type with the thermocouple junction elec-trically grounded to the sheath. The quality control for such thermocouple assemblieswas maintained by following the rigid procedures and recommendations outlined in ref-erence 1
TEST PROCEDURE
For obtaining the required heat-transfer information of this particular cooled-bladedesign, the engine was operated over a range of stator-inlet temperatures from 1367to 1644 K (2000° to 2500° F) with the engine speed varying from about 7300 to 8700 rpm.Three nominal blade cooling-air inlet temperatures were investigated at these engineconditions, with most of the testing being conducted with cooling air at about 380 K(224° F). An individual series of tests was also conducted for cooling air inlet tempera-tures of approximately 489 and 689 K (420° and 780° F). A series of tests is hereindefined as a group of test points made at a constant stator-inlet temperature and con-stant nominal cooling-air inlet temperature (at blade base). For a given series, achange of coolant flow rate was the primary variable from one run to the next. Sincemost of the pertinent instrumentation was located near the midspan position, the stator-inlet temperature was established as the average of the measurements at the middlethree radial positions for each of the eight actuated thermocouple probes, which is anaverage of 24 measurements. A summary of pertinent engine operating conditions foreach series of runs, along with all blade temperature data, is given in table II. Aspecific symbol is designated for each series of runs listed in this table and is used torepresent respective data in all the figures.
The general engine operating procedure for a given series of tests was to start witha relatively large coolant flow rate (ratio of coolant flow to gas flow) supplied to the testblades. For each successive run in a series of tests, the coolant flow rate to the test
blades was reduced from the coolant flow rate for the previous run. This procedure of re-ducing the coolant flow in a stepwise manner was continued until a maximum blade metaltemperature of 1200 K (1700° F) had been reached. Considering the stress-rupturecharacteristics of the blade material, the resulting temperature gradients, and theblade fabrication procedures, the 1200 K (1700° F) temperature level was consideredthe maximum safe operating temperature for the test-blade configuration. After theminimum coolant flow condition was reached, generally two additional runs were madeat intermediate coolant flow rates to serve as check points for data taken previously.Usually about eight data points were taken for each series of tests. The coolant-to-gasflow ratio wc/w varied from 0.017 to 0.130.
ANALYSIS METHODS
Correlation Equations
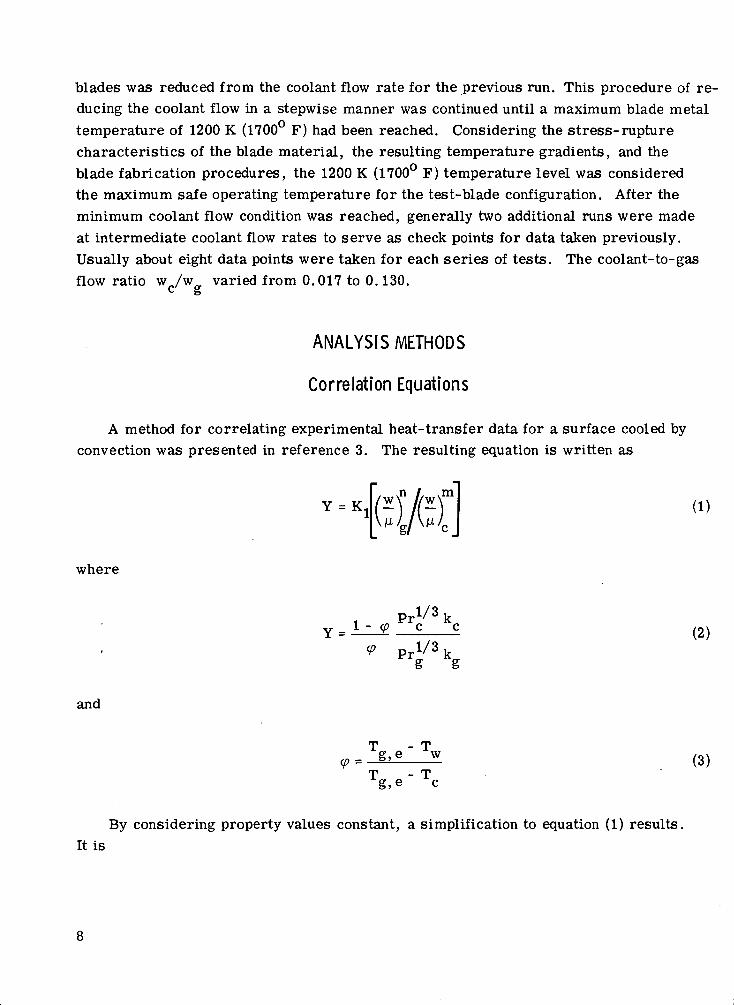
A method for correlating experimental heat-transfer data for a surface cooled byconvection was presented in reference 3. The resulting equation is written as
Y = K, (1)
where
Y = (2)
and
- T
T - Tg,e c(3)
By considering property values constant, a simplification to equation (1) results.It is
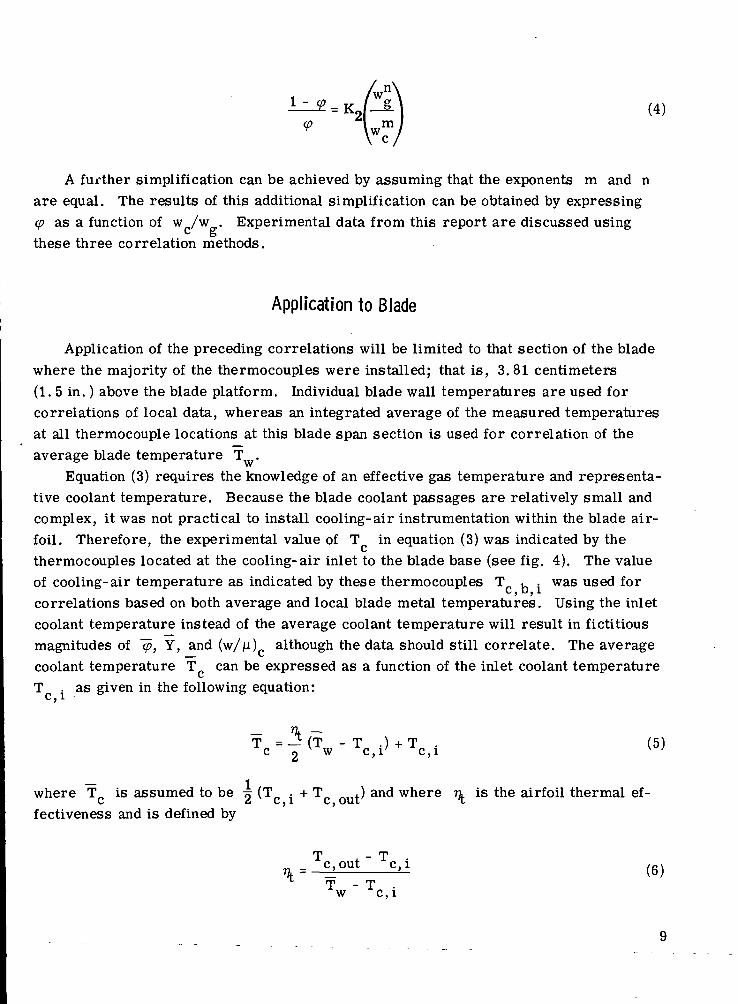
(4)
A further simplification can be achieved by assuming that the exponents m and nare equal. The results of this additional simplification can be obtained by expressing(/) as a function of w /w . Experimental data from this report are discussed usingc gthese three correlation methods.
Application to Blade
Application of the preceding correlations will be limited to that section of the bladewhere the majority of the thermocouples were installed; that is, 3.81 centimeters(1. 5 in. ) above the blade platform. Individual blade wall temperatures are used forcorrelations of local data, whereas an integrated average of the measured temperaturesat all thermocouple locations at this blade span section is used for correlation of theaverage blade temperature T .
Equation (3) requires the knowledge of an effective gas temperature and representa-tive coolant temperature. Because the blade coolant passages are relatively small andcomplex, it was not practical to install cooling-air instrumentation within the blade air-foil. Therefore, the experimental value of T in equation (3) was indicated by the
L>
thermocouples located at the cooling- air inlet to the blade base (see fig. 4). The valueof cooling- air temperature as indicated by these thermocouples T , . was used for
C, u, 1correlations based on both average and local blade metal temperatures. Using the inletcoolant temperature instead of the average coolant temperature will result in fictitiousmagnitudes of Ip, Y, and (w/juL although the data should still correlate. The average
___ C/
coolant temperature T can be expressed as a function of the inlet coolant temperatureL-
T . as given in the following equation:c, i
where T- is assumed to be ^ (T,, . + T _. ) and where n is the airfoil thermal ef-C £t C , 1 C , OUT. T
fectiveness and is defined by
T - T_^out - c,!
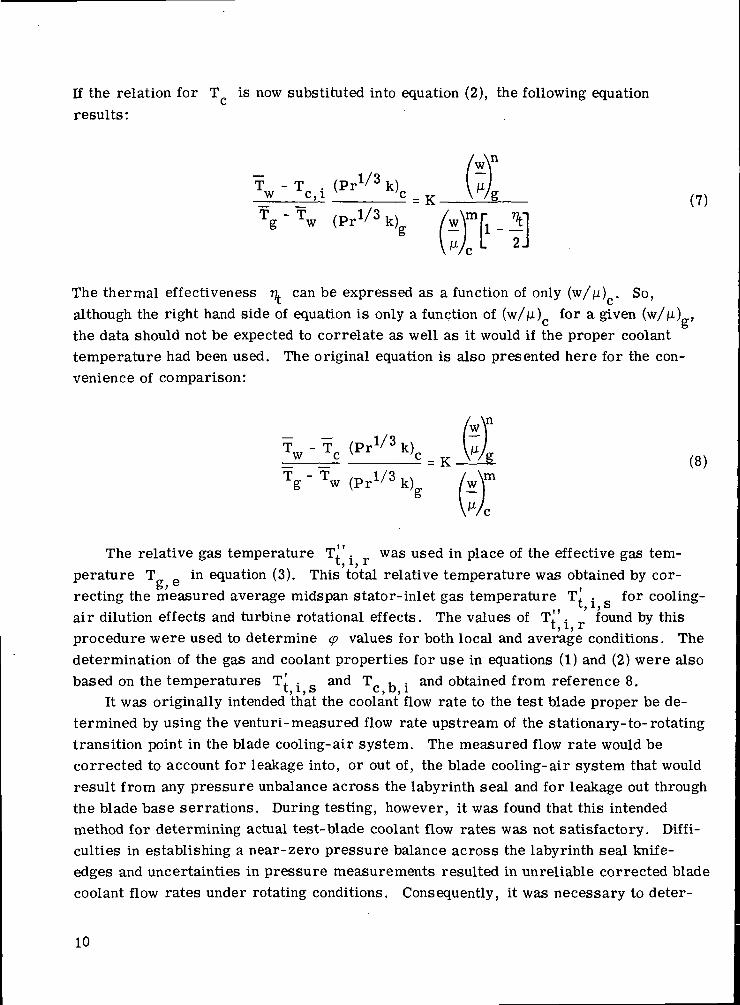
If the relation for T is now substituted into equation (2), the following equationresults:
_Tg - Tw (Pr1/3 k)g
The thermal effectiveness r^ can be expressed as a function of only (w/ju) . So,although the right hand side of equation is only a function of (w/fi) for a given (w, p., ,c gthe data should not be expected to correlate as well as it would if the proper coolanttemperature had been used. The original equation is also presented here for the con-venience of comparison:
- T (Pr1/3
c u „ V/K (8)
Tg - Tw (Pr1/3 k)g
The relative gas temperature T!' . was used in place of the effective gas tem-perature T in equation (3). This total relative temperature was obtained by cor-
&>e ,recting the measured average midspan stator-inlet gas temperature T, . for cooling-
l, 1, S
air dilution effects and turbine rotational effects. The values of T!' . found by thisi, i, rprocedure were used to determine <p values for both local and average conditions. Thedetermination of the gas and coolant properties for use in equations (1) and (2) were alsobased on the temperatures T! . _ and T u . and obtained from reference 8.
t, 1 , 0 C , D, 1
It was originally intended that the coolant flow rate to the test blade proper be de-termined by using the venturi-measured flow rate upstream of the stationary-to-rotatingtransition point in the blade cooling-air system. The measured flow rate would becorrected to account for leakage into, or out of, the blade cooling-air system that wouldresult from any pressure unbalance across the labyrinth seal and for leakage out throughthe blade base serrations. During testing, however, it was found that this intendedmethod for determining actual test-blade coolant flow rates was not satisfactory. Diffi-culties in establishing a near-zero pressure balance across the labyrinth seal knife-edges and uncertainties in pressure measurements resulted in unreliable corrected bladecoolant flow rates under rotating conditions. Consequently, it was necessary to deter-
10
mine the test-blade coolant flow rate analytically. The method used for determining theflow rate is described in appendix B. The correlations of the local and average blademetal temperature data were based on a calculated coolant flow to a blade. The gas flowrate at the inlet to the turbine rotor was considered to be the measured flow through thecompressor plus the fuel flow rate and the turbine vane coolant dilution. This total gasflow was then prorated (divided by the number of blades in rotor assembly) to obtain thegas flow rate per blade. The value of the blade coolant flow ratio w /w was then de-termined.
In order to make use of the Y correlation equation (eq. (1)), it was necessary todetermine the values of the exponents m and n for the quantities (w/fJ.) and ( .c &The technique used for determining these values is described fully in reference 3, so,it will be only briefly described herein. A plot of Y against (W/M.) was made for allthe data on log-log scale to determine the exponent m. Since the value of (w/V) isessentially constant for a given series of test points (essentially constant stator-inlettemperature) the plotted data results in a series of curves (nearly parallel straightlines). A least squares curve fit method was used to establish the curves through theplotted data. The resulting slopes of the individual curves were averaged to obtain thevalue of the exponent m. The above correlation does depend on a knowledge of the localcoolant flow. Although a spanwise variation in local flow through these channels willoccur because of the spanwise variation in trailing- edge gas pressure and cooling- airpressure, the local flow through the midspan passages (where the heat-transfer analysisis conducted) should approximate an average flow and should approach a constant fractionof the total coolant flow per blade. The value of the exponent n was then obtained fromplotting the product Y(w/jJ.)m against (w/ju) on a log-log scale. The slope of the re-c gsuiting curve (a straight line) represents the exponent n. Once again, a least squaresfit method was used to establish the curve through the plotted data. A least-squares fittechnique was used throughout the correlations whenever a slope or equation of a curvewas required.
With the values of the exponents m and n known, the data were plotted on the basisof Y against (w/iu.)"/(w/jLi)m. The slope of the curve through the plotted points corre-g/ c
sponds to an experimentally determined value of the constant K.. in equation (1).When local conditions are considered, exponents m and n are found for each local
position in a manner similar to that just described, except that the local values of Y arenow used as the ordinates. It should be noted that the values of m and n determinedfor each local temperature are likely to be different for each local temperature locationand differ from those obtained when average temperatures are used.
11
RESULTS AND DISCUSSION
Each of the five research blades were flow checked before and after heat-transfertesting to insure that the cooling configurations had remained structurally intact. Afterthis testing had been completed, three of the five blades were cut into three spanwisesections, and the other two blades were cut into two chordwise sections so that visualinspection of the blade interior configuration could be made.
This inspection revealed that on two of the blades the two cover plates on the chord-wise fins had not been properly joined near the trailing edge during fabrication. As aresult, the cooling air entering the internal cavity could be directly expelled through thesplit trailing edge without performing its intended purpose of cooling the leading edgeand midchord regions of the blade.
Since the flow checks indicated that each of the five blades had received approxi-mately equal cooling air flows throughout the heat transfer testing, the temperature datafrom the remaining three blades was still useful. However, one of these three remainingblades had thermocouples at only the hub section. Therefore, the midspan correlationspresented herein contain data from only two of the five blades.
These research blades were tested 355 times of which the first 268 runs are not re-ported herein. Halfway through these first runs thermocouples at positions 17 and 18failed. An attempt was made to salvage data from these positions during the first 100runs since so much other data had to be discarded because of the previously mentionedstructural problem. The quantities 1- (p*n/<P-\n and 1 - -<P-io/VIQ correlated quitewell with 1 - ^20/^20 as ^ev s^ou^ since these three thermocouples are all on thesame blade. These two correlations, established using the early data, were then usedto calculate temperatures at positions 17 and 18 for the later data which are presentedherein. These calculated temperatures were then used to establish an average bladetemperature whenever one was needed. This same procedure could not be used with thetrailing edge thermocouples, positions 13 and 19, since these failed at the very start ofthe test program.
The data, information, and techniques used in an attempt to correlate data over therange of conditions listed in table II are discussed in this section. Successful correla-tion of data will provide empirical methods of calculating blade airfoil temperatures atconditions other than those investigated and will provide a basis for comparing blades ofdifferent cooling geometries designed for conditions similar to those presented in thisreport.
12
Chordwise Blade Temperature Distribution
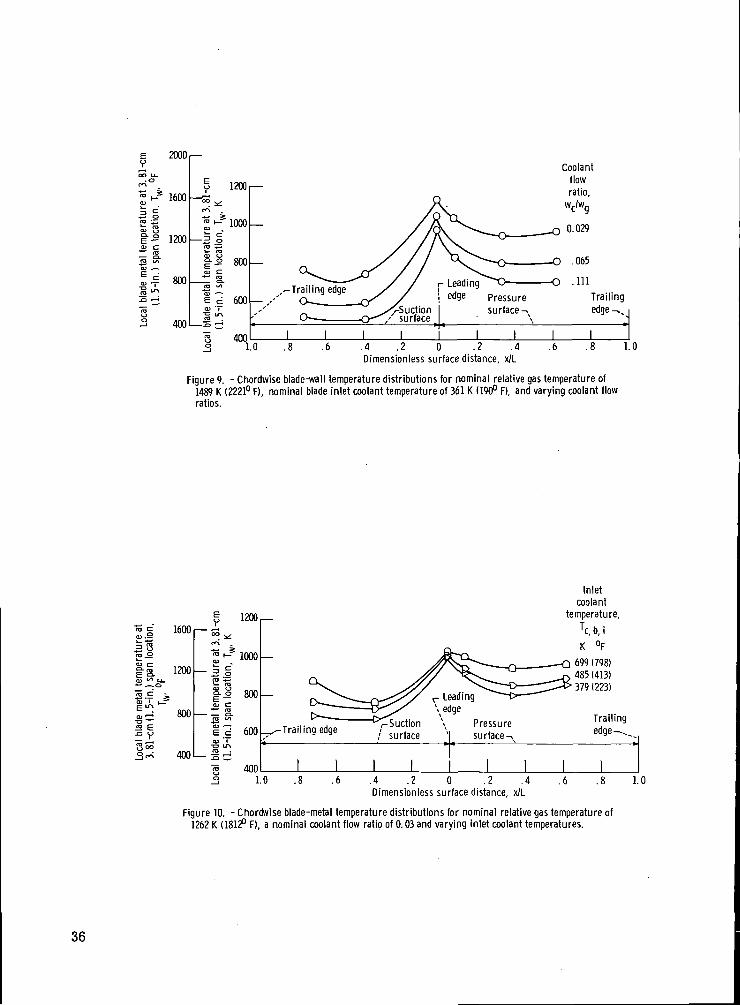
Typical curves of blade wall temperature distributions for the 3. 81-centimeter(1. 5-in.) span position are shown in figure 9 for a nominal inlet gas temperature to thestator T^ i g of 1656 K (2521° F), a nominal blade inlet coolant temperature TC b i
of 361 K (190° F), and varying coolant flow ratios w /w from 0.029 to 0. 111. At thisstator-inlet temperature, the nominal relative gas temperature Tj'. was 1489 K(2221° F). As expected, the blade wall temperature TW increases with an accompany-ing decrease in coolant flow ratio w /w , and the temperature distributions exhibitsimilar general characteristics. It is readily apparent that extreme temperature gra-dients have resulted and that there is also some overcooling of the midchord suctionsurface with respect to that of the midchord pressure surface. This can be explainedby the fact that 60 percent of the cooling airflow is directed to the suction surface of theblade. The curves reveal a maximum temperature difference of 460 K (828° F) (fromthe leading edge to the midchord suction surface), which is considerably higher thanthat which is desirable for extended blade life. A temperature gradient of about 167 K(300° F) is generally acceptable.
Figure 10 shows typical blade wall temperature distributions for a nominal inlet gastemperature to the stator of 1382 K (2028° F), a nominal coolant flow ratio of 0. 03, andinlet coolant temperatures of approximately 379 K (223° F), 485 K (413° F), and 699 K(798° F). For this stator inlet temperature, the relative gas temperature was approxi-mately 1262 K (1812° F). As in figure 9, the curves of figure 10 once again exhibitsimilar trends. For this lower stator-inlet temperature, the maximum chordwise walltemperature difference is approximately 325 K (585° F). As the coolant temperatureincreases, the difference between the maximum and minimum temperatures decreasesuntil, in the limit, it approaches zero when the coolant temperature approaches the gastemperature.
Spanwise Blade Temperature Distribution
Only a limited amount of spanwise temperature data are available because of theinability to instrument the thin wall near the blade tip. The most severe temperaturegradient occurred at the leading edge between the 1. 27- and the 3. 81-centimeter(0. 5- and 1. 5-in.) span positions, where a temperature difference of approximately200 K (360° F) existed. The location of the thermocouples at various spanwise andchordwise positions and the associated temperatures can be obtained from tables I and II.
13
Correlation of Average Blade Temperatures at
3. 81-Centimeter (1.5-in.) Span Position
The successful correlation of the average blade wall temperatures near the blademidspan can provide an indication of the overall effectiveness of the blade coolinggeometry. However, since averaging may mask some extreme temperature gradients,a correlation of local blade wall temperatures is also of importance and will be dis-cussed in a later section.
For the purpose of the following correlations, the average blade temperature Tis considered to be the integrated average of the local thermocouples located on theblades at the 3. 81- centimeter (1. 5-in. ) span position. The correlation parameter ~q>was based on the integrated average blade wall temperature T , the relative gas tem-perature T!' . , and the cooling air temperature at the inlet to the blade base T , ..i, i, r c, u, iThose gas and coolant properties required in the correlation of the data were based onthe respective T! - _ and T K . . The following correlations for average blade tem-
l, I, b C, 0, 1peratures includes the midspan data from thermocouple positions 12, 14, 15, 20, and 21from table II plus correlated values of temperature for thermocouple position 17 and 18.A particular symbol is defined for each series of test points listed and is common forall the figures presented.
Y correlation. - In order to make use of the Y correlation equation, (eq. (1)), itwas necessary to determine the values of the exponents m and n for the quantities(w/jit) and (w/ju) . As described previously, a least squares curve fit method wasc gused to establish the curves through each series of plotted data. The resulting slopes ofthe individual curves were averaged to obtain the value of the exponent m, which forthese data was 0.64. The value of the exponent n was then obtained from plotting theproduct Y(w/ML' against (w/ju) on a log-log-scale. The slope of the resulting
^ Bcurve (a straight line) represents the exponent n, which for these data has a value of0. 59.
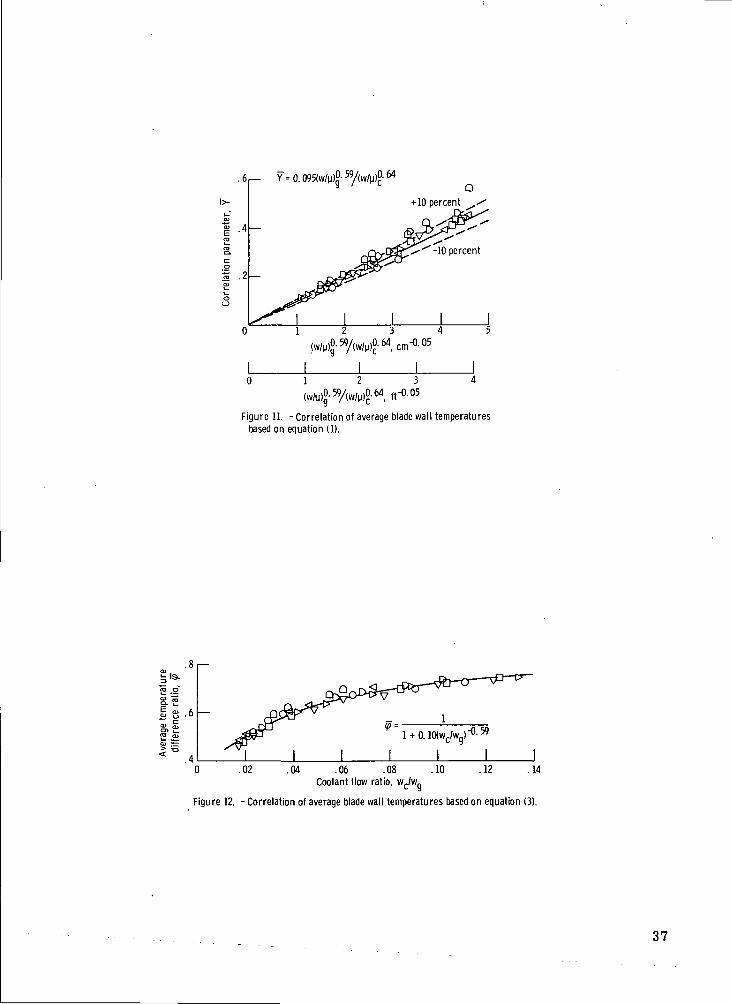
With the values of the exponents m and n known, the data were plotted on the basisof Y against (w/fi) ' /(w/fi) and are presented in figure 11. The slope of theg / c
curve through the plotted points corresponds to an experimentally determined value ofthe constant K1 in equation (1). The value of this slope for the data presented in thefigure is 0.095 (cm0'05). For this plot, equation (1) becomes Y = 0.095 ( w / p t ) '(w/V) where (w/V) has units of centimeters.
\~t
As can be seen from the figure and table II, the data having the higher coolant inlettemperatures (test series 6 and 7 of table II) do not correlate in the same way as do thedata having the lower coolant inlet temperatures (test series 1 to 5). Therefore, these
14
data were not used in establishing the correlation equation. Also, the lines showing thedata scatter refer to only the data having the lower coolant inlet temperature.
The scatter of data lies within a band of about ±10 percent deviation from the leastsquares determined curve fit and is represented in the figure by the dashed lines. Thescatter of data resulting for this correlation may be due in part to the fact that a bladeinlet coolant temperature was used, rather than a more representative coolant tempera-ture within the blade airfoil, for obtaining property values and in the determination ofY. As coolant flow to the blade is decreased, the temperature rise of the coolant fromthe blade inlet to the location within the airfoil being evaluated increases, and the inletcoolant temperature becomes less representative of the average coolant temperaturewithin the airfoil.
Correlation of (1 - lp)/(p. - Elimination of gas and coolant property values fromequation (1) results in a simplified correlation whereby (1 - "cp)/cp can then be plottedagainst (w )m/(w )n. Of course, new values of the exponents m and n must be deter-g / c —mined in the same manner as that for the Y correlation. The values determined forthe exponents m and n were 0. 51 and 0.64, respectively. No figures are presentedfor this correlation method since the scatter of data points was similar to that for theY correlation.
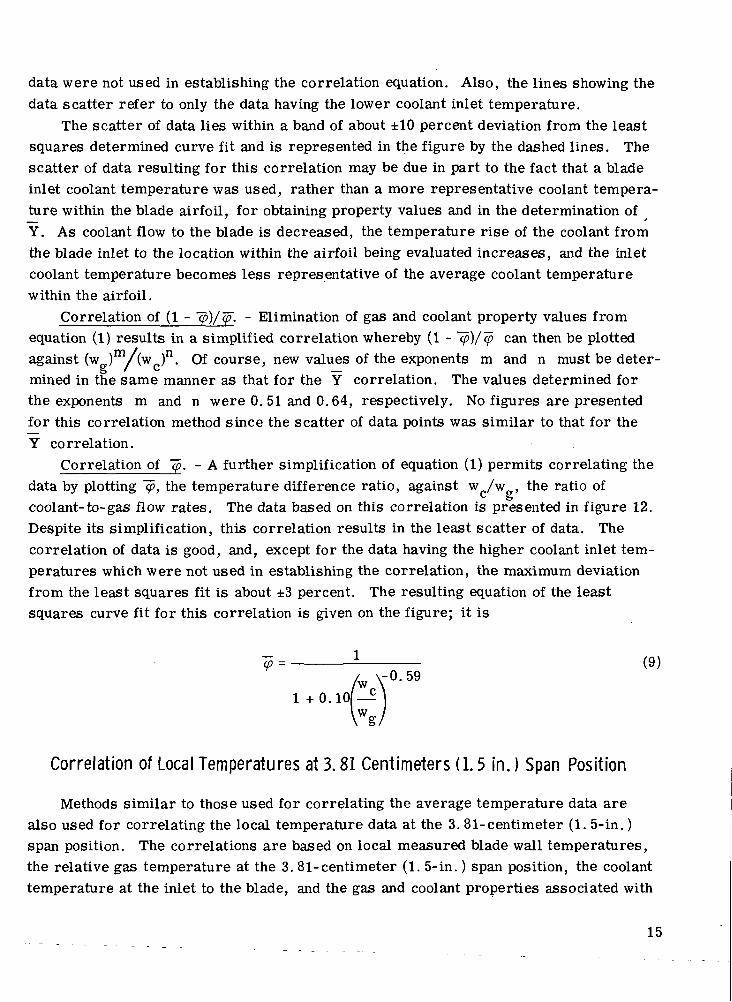
Correlation of lp. - A further simplification of equation (1) permits correlating thedata by plotting ~q), the temperature difference ratio, against w /w , the ratio ofc gcoolant-to-gas flow rates. The data based on this correlation is presented in figure 12.Despite its simplification, this correlation results in the least scatter of data. Thecorrelation of data is good, and, except for the data having the higher coolant inlet tem-peratures which were not used in establishing the correlation, the maximum deviationfrom the least squares fit is about ±3 percent. The resulting equation of the leastsquares curve fit for this correlation is given on the figure; it is
V = 1 (9)\-0.59
Correlation of Local Temperatures at 3. 81 Centimeters (1. 5 in. } Span Position
Methods similar to those used for correlating the average temperature data arealso used for correlating the local temperature data at the 3. 81-centimeter (1. 5-in. )span position. The correlations are based on local measured blade wall temperatures,the relative gas temperature at the 3. 81-centimeter (1. 5-in. ) span position, the coolanttemperature at the inlet to the blade, and the gas and coolant properties associated with
15
the latter two temperatures. In addition, the correlations are based on the total coolantflow rate to the blade airfoil rather than the actual local coolant flow distribution withinthe airfoil.
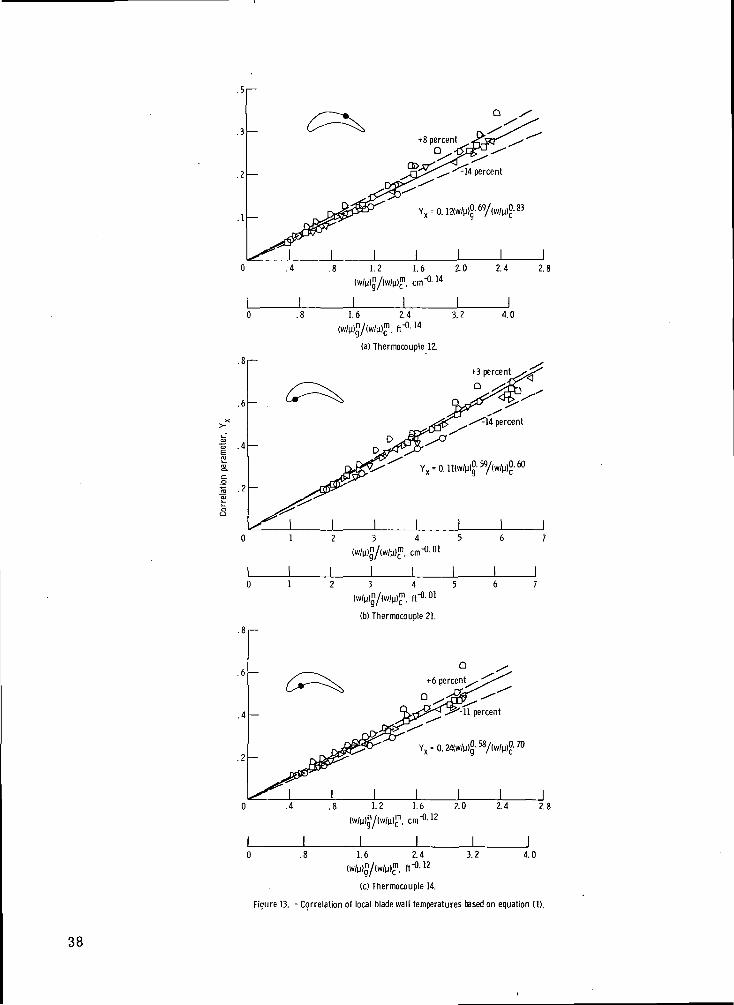
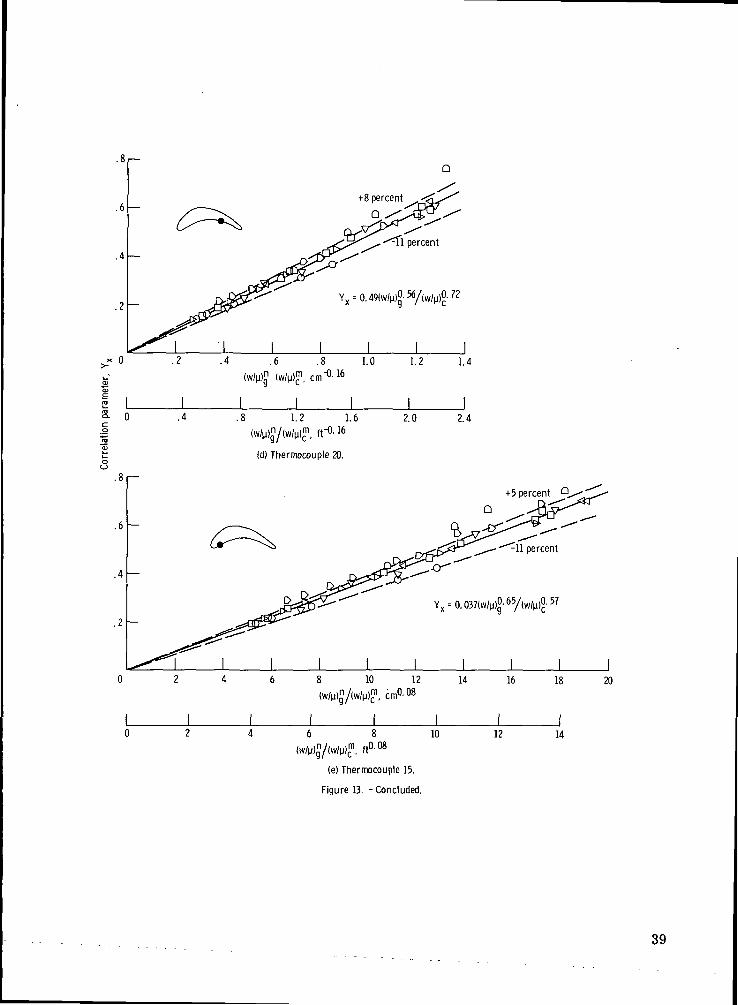
Correlation of Y . - Figure 13 presents the Yv correlation for local blade tern-A. X
peratures at four of the seven thermocouple locations, 12, 14, 15 and 20, around theblade periphery at the 3. 81-centimeter (1. 5-in.) span position. Data from thermo-couple 21 is also presented which is a duplication of position 15 but on an adjacent blade.As can be seen from table n, the thermocouples at the other three locations were lostrelatively early in the test program. The exponents m and n for the two terms(W/M)C and (w/fi) in the abscissa were determined for each thermocouple locationin the same manner as that for the Y correlation and their values are shown in theindividual plots.
As in the case of the Y correlation, the data scatter is attributed in part to theuse of the blade inlet coolant temperature T . . rather than the local coolant tem-perature. In addition, some data scatter may be attributed to the fact that the totalcoolant flow is used in the correlation of data rather than the more representative localcoolant flow rate. This would be particularly true regarding the midchord pressuresurface and midchord suction surface regions because the total flow is divided betweenthese regions. Each individual plot has bands of the data scatter represented by thedashed lines. The best of the local correlations was for thermocouple 15 (fig. 13(e)),which resulted in data scatter bands of +5 and -11 percent deviation from the leastsquares curve through the data points. The worst of the local correlations was forthermocouple 12 (fig. 13(a)), which had data scatter bands of +8 and -14 percent. Asbefore, the data scatter bands refer only to the data of the first five series in table n.
The values of n appearing in figure 13 represent the experimentally obtainedvalues of the exponent of the Reynolds number for the gas-to-wall heat-transfer coeffi-cient. The value of 0. 69 (from fig. 13(a)) represents the exponent near the trailingedge of the suction surface. The values of 0. 58 and 0. 56 (from figs. 13(c) and (d)represent the exponents for the midchord and the trailing edge of the pressure surface,respectively. The values of 0. 59 and 0.65 (from figs. 13(b) and (e)) both represent theexponent for the point 80 from the stagnation point on the pressure surface. Thesefive values around the blade periphery are less than 0. 8, indicating that the flow istransitional. In general, flow over the suction surface is closerto being turbulent thanthat for the pressure surface (0. 69 against 0. 58 and 0. 56, respectively). The data forthe leading edge (0. 59 and 0.65) indicate a deviation from the commonly accepted valueof 0. 5 for laminar flow.
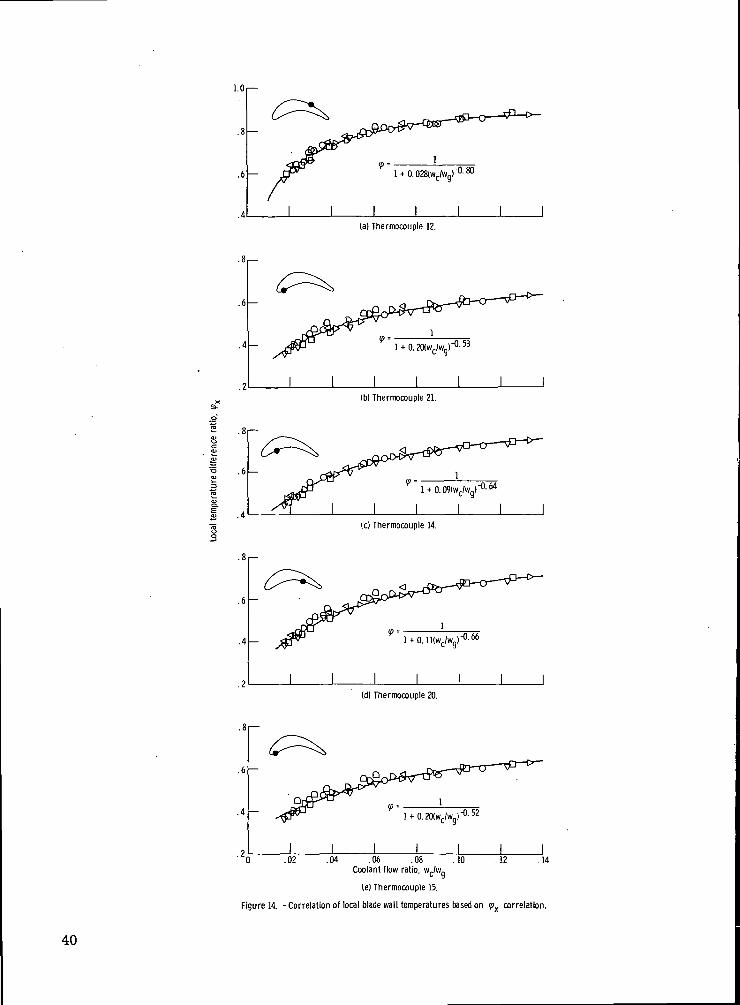
Correlation of cp . - Figure 14 shows the local temperature difference ratio <pX X
as a function of the ratio of total blade coolant to gas flow for the same thermocouples
16
considered in figure 13. The correlation equations for the least squares curves throughthe data are given for each thermocouple in figure 14 and also in table HI. Deviationsof data from the respective correlations were calculated and found to be less than thedeviations of data from the Y correlation for each thermocouple considered. The
Xmaximum deviation of plotted data from any respective curve was found to be about±7 percent (see thermocouple 12, fig. 14(a)).
Although it is not presented in figure 14 thermocouple 18 exhibits a <p value ofA\
0. 69 for a coolant flow ratio of 0.03. This relatively high value of (p can be justifiedA
based on predicted values of the local gas-to-wall and wall-to-coolant heat-transfercoefficients. If the wall-to-coolant heat-transfer coefficient is adjusted to include en-trance effects and fin effectiveness, the resulting analytical value of <p compares
X
very favorably with the experimental results.Impingement cooling of the leading edge resulted in relatively low values of <p .
XAt the location of thermocouple 17 the experimental value of <p was 0. 33 for a
A.
coolant-to-gas flow ratio of 0.03. However, if an optimum impingement geometry hadbeen incorporated in the cooling design for the leading edge region, the local value of<p would have been approximately 0. 42.
A.
Comparison of Measured Temperature with Temperature
Obtained from Correlations
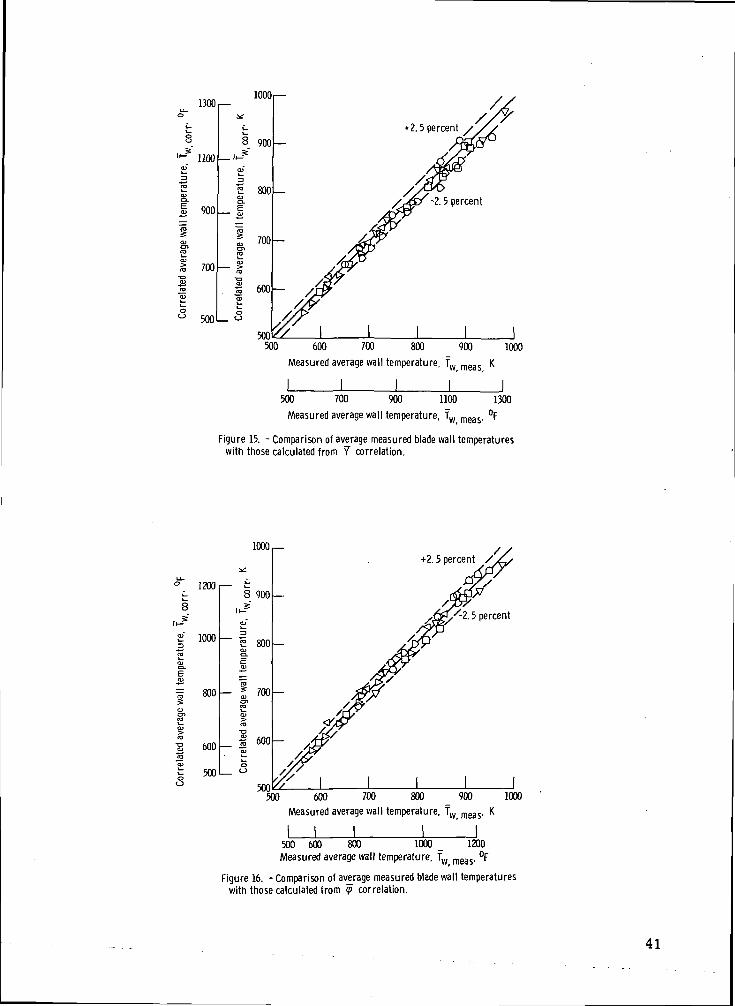
Average temperature. - The scatter bands for the data in figures 11 and 12(Y against (w//i )";/(w/ju)m and ~<p against w /w , respectively) are based on tem-g / c e gperature difference ratios. As such it is often difficult to readily determine what thescatter is in terms of temperature. Figures 15 and 16 show the scatter betweenmeasured temperatures and those determined from the correlation equations in orderto illustrate the scatter based on this method.
Because the data with the higher coolant inlet temperatures were not used when thecorrelation was established, it is significant that these data agree as well as they dowith the temperatures determined using the correlation. Respective error bands of±3 percent and ±2. 5 percent are shown on these figures for the Y and tp correlations,respectively. Inspection of the figures shows the 1p correlation to be superior to theY correlation. This fact, plus the ease in application of the 1p correlation, indicatesthat the lp correlation should be used for estimating average blade temperatures (atleast for the blade considered herein).
Local temperature. - The scatter bands for the data in figures 13 and 14 (Yagainst (w/V)n/(w/M)m and <p against w /w , respectively) are also based on tem-g / c x e g
17
perature difference ratios. The scatter between the measured temperatures and the ex-perimentally determined (p correlation equations are within ±4 percent. The corre-
Xspending scatter of the data from the Y correlation equations as a group are greater
Xthan those from the a> correlation equations.
X
Blade Operating Potential
Because the original rotor blade design exhibited an undesirably high leading edgetemperature and a severe temperature gradient as can be seen in figures 9 and 10, aredesign of the blade was undertaken. The optimum spacing between the impingementholes and the inner surface of the leading edge of the blade to decrease the maximumtemperature was obtained from figure 9 of reference 9. The fin geometry along theblade suction and pressure surfaces was changed to reduce the temperature gradientwhile decreasing the average temperature. The differences between the original andrevised blade designs are that (1) the spacing between the impingement holes and theinner blade leading edge surface was reduced from 8 to 2 equivalent slot widths, (2) thefin thickness along the blade suction surface was increased from 0. 0508 centimeter(0. 02 in.) to 0. 084 centimeter (0.033 in.); and (3) the fin thickness along the pressuresurface was decreased from 0.127 centimeter (0. 05 in.) to 0. 0508 centimeter (0. 02 in.).These changes in fin thickness resulted in a reduction of the number of chordwise pas-sages along the suction surface from 80 to 64 and an increase along the pressure sur-face from 50 to 80.
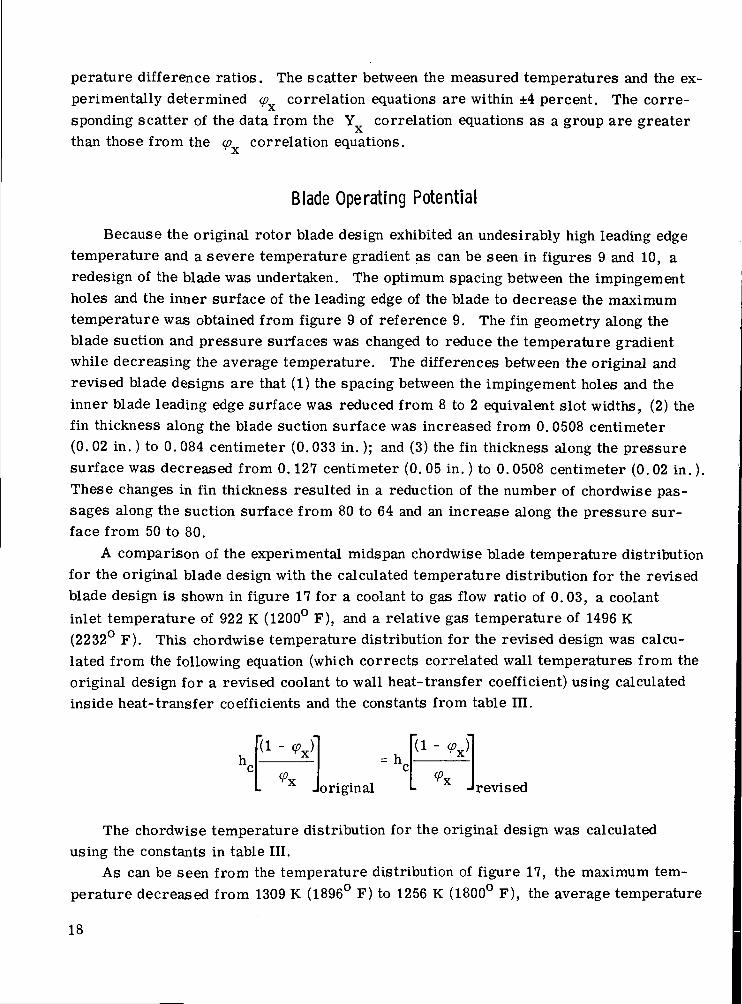
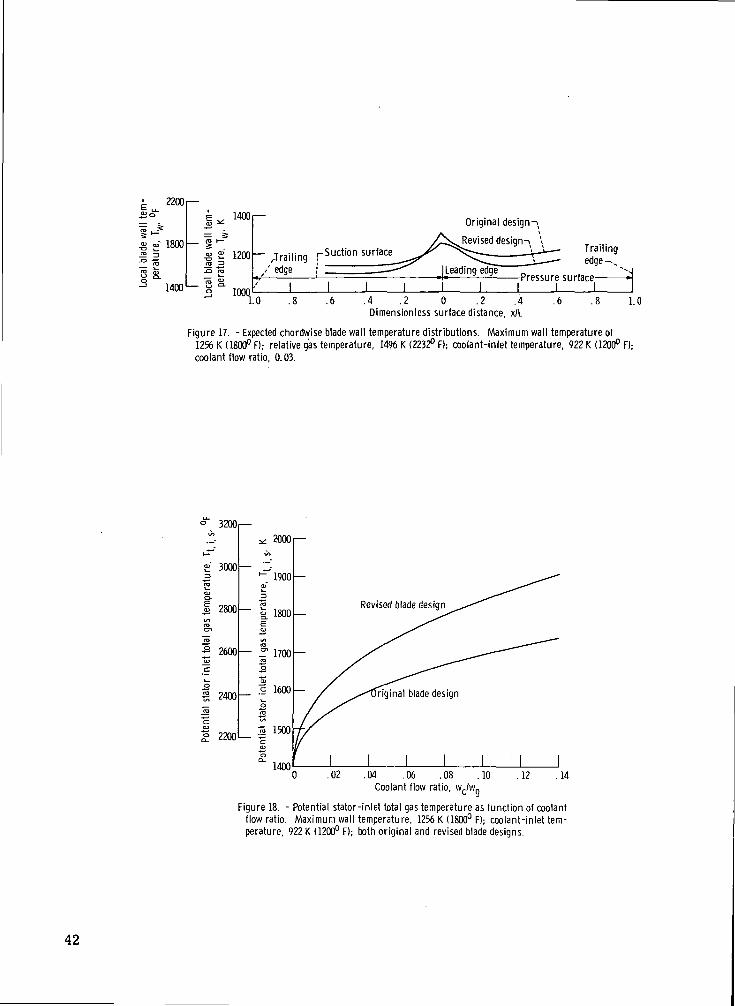
A comparison of the experimental midspan chordwise blade temperature distributionfor the original blade design with the calculated temperature distribution for the revisedblade design is shown in figure 17 for a coolant to gas flow ratio of 0. 03, a coolantinlet temperature of 922 K (1200° F), and a relative gas temperature of 1496 K(2232° F). This chordwise temperature distribution for the revised design was calcu-lated from the following equation (which corrects correlated wall temperatures from theoriginal design for a revised coolant to wall heat-transfer coefficient) using calculatedinside heat-transfer coefficients and the constants from table III.
hc1(1 - *x)j
<?x
- hncoriginal
(1 - <PJ
<?x -I revised
The chordwise temperature distribution for the original design was calculatedusing the constants in table III.
As can be seen from the temperature distribution of figure 17, the maximum tem-perature decreased from 1309 K (1896° F) to 1256 K (1800° F), the average temperature
18
decreased from 1175 K (1655° F) 1166 K (1639° F) and the difference between the maxi-mum and minimum temperatures decreased from 212 K (382° F) 120 K (216° F). Thereason that temperature gradients are lower in figure 17 than in figure 9 for similarcoolant flows and gas temperatures results from the very low cooling-air temperatureused in obtaining the experimental data in figure 9. The intent of presenting the chord-wise temperature distribution for the blade with the revised geometry is merely todemonstrate that a blade design having an impingement cooled leading edge and chord-wise coolant passage is feasible.
The hot spot on the original design was found to be the blade leading edge. Usingthe local correlation for this position, and coolant and metal temperatures of 922 K(1200° F) and 1256 K (1800° F), respectively, the potential stator-inlet temperature wascalculated for a range of values of w /w . The relation between stator-inlet temper-c gature and relative gas temperature is a function of the stator-exit Mach number and therelative rotor-inlet Mach number. For an experimentally determined midspan stator-exit Mach number of 0. 885 and a design relative rotor-inlet Mach number of 0. 475, theratio of stator-inlet total temperature to relative rotor-inlet temperature is 10/9. Thisvalue is substantiated by the direct calculation of the relative gas temperature. Thedecreases in the effective gas temperature due to both dilution from the stator and rota-tion of the turbine wheel are calculated separately and then subtracted from the stator-inlet temperature to yield the relative gas temperature. Results of such calculationsare presented in the discussion of figures 9 and 10. For the conditions listed in thesefigures the ratios of the stator inlet total temperature to relative gas temperature are1.124 and 1.104, respectively, or approximately 10/9. This value of 10/9 was used tocalculate potential stator-inlet temperatures from relative gas temperatures.
The potential stator-inlet gas temperature for both the original and new blade de-signs are plotted in figure 18. The figure shows, for example, that for wc/wg = 0.03the redesigned blade can operate at a stator-inlet temperature of 1662 K (2532° F)whereas the original designed blade can operate at 1574 K (2374° F). In addition, theblade with the original design would have large temperature gradients that would limitits life.
SUMMARY OF RESULTS
The results of the experimental investigation reported herein are summarized asfollows:
1. Experimental heat-transfer data for an air-cooled turbine rotor blade design in-corporating an impingement-cooled leading edge, chordwise-coolant passages in themidchord region, and a slotted trailing edge for expelling coolant were successfully
19
correlated at stator-inlet gas temperatures up to 1657 K (2523° F). Both average andlocal blade temperatures were included.
2. The simplest of the correlations, the temperature difference ratio <y? as afunction of the coolant flow ratio w
c/w resulted in the best agreement of the data. Itis therefore the recommended correlation for obtaining additional blade temperatureinformation for similar test conditions.
3. The maximum deviation of measured local and average temperatures at the3.81-centimeter (1. 5-in.) span position from those calculated using the <p and ~q>correlations, respectively, was ±3 percent. The value 1p for the blade tested in theengine was 0. 56 for a coolant-to-gas flow ratio of 0. 03.
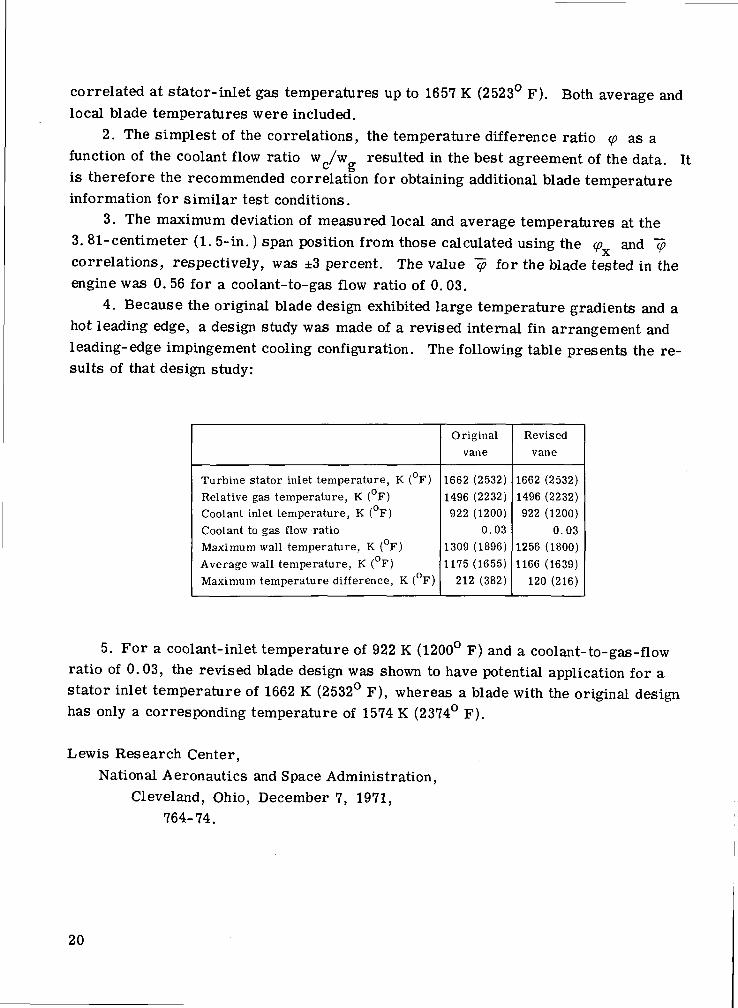
4. Because the original blade design exhibited large temperature gradients and ahot leading edge, a design study was made of a revised internal fin arrangement andleading-edge impingement cooling configuration. The following table presents the re-sults of that design study:
Turbine stator inlet temperature, K (°F)Relative gas temperature, K (°F)Coolant inlet temperature, K (°F)Coolant to gas flow ratioMaximum wall temperature, K (°F)Average wall temperature. K (°F)Maximum temperature difference, K (°F)
Originalvane
1662 (2532)1496 (2232)922 (1200)
0.031309 (1896)1175 (1655)
212 (382)
Revisedvane
1662 (2532)1496 (2232)922 (1200)
0.031256 (1800)1166 (1639)
120 (216)
5. For a coolant-inlet temperature of 922 K (1200° F) and a cool ant-to-gas-flowratio of 0.03, the revised blade design was shown to have potential application for astator inlet temperature of 1662 K (2532° F), whereas a blade with the original designhas only a corresponding temperature of 1574 K (2374° F).
Lewis Research Center,National Aeronautics and Space Administration,
Cleveland, Ohio, December 7, 1971,764-74.
20
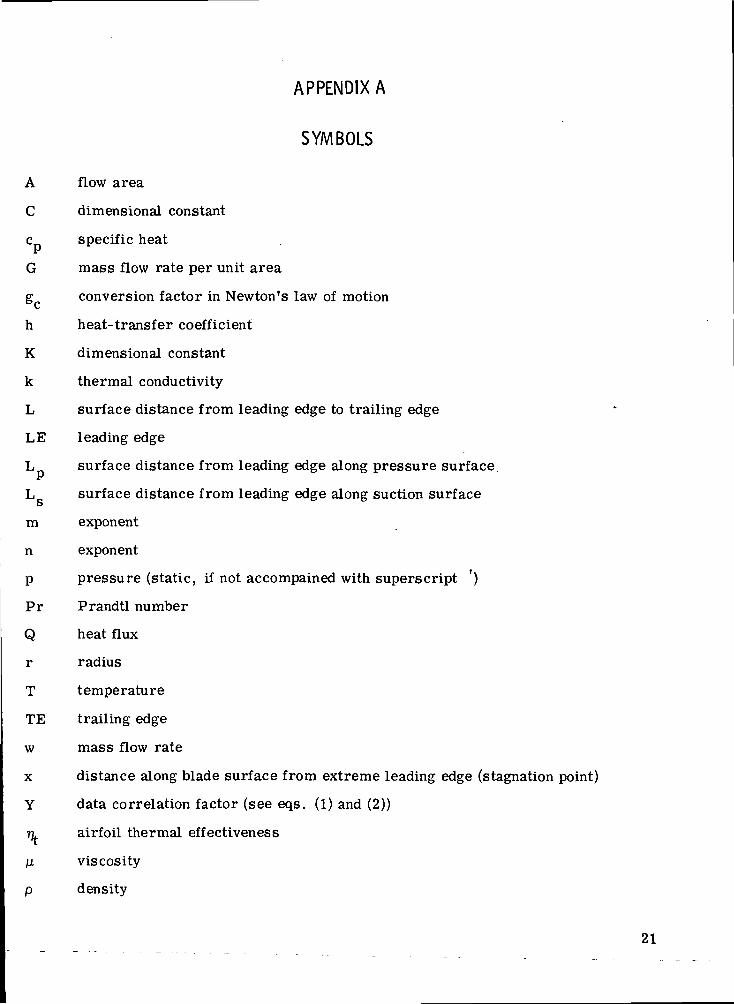
APPENDIX A
SYMBOLS
A flow area
C dimensional constant
c specific heat
G mass flow rate per unit area
g conversion factor in Newton's law of motion{*
h heat-transfer coefficient
K dimensional constant
k thermal conductivity
L surface distance from leading edge to trailing edge
LE leading edge
L surface distance from leading edge along pressure surface
L surface distance from leading edge along suction surfacesm exponent
n exponent
p pressure (static, if not accompained with superscript ')
Pr Prandtl number
Q heat flux
r radius
T temperature
TE trailing edge
w mass flow rate
x distance along blade surface from extreme leading edge (stagnation point)
Y data correlation factor (see eqs. (1) and (2))
n airfoil thermal effectiveness
ju. viscosity
p density
21
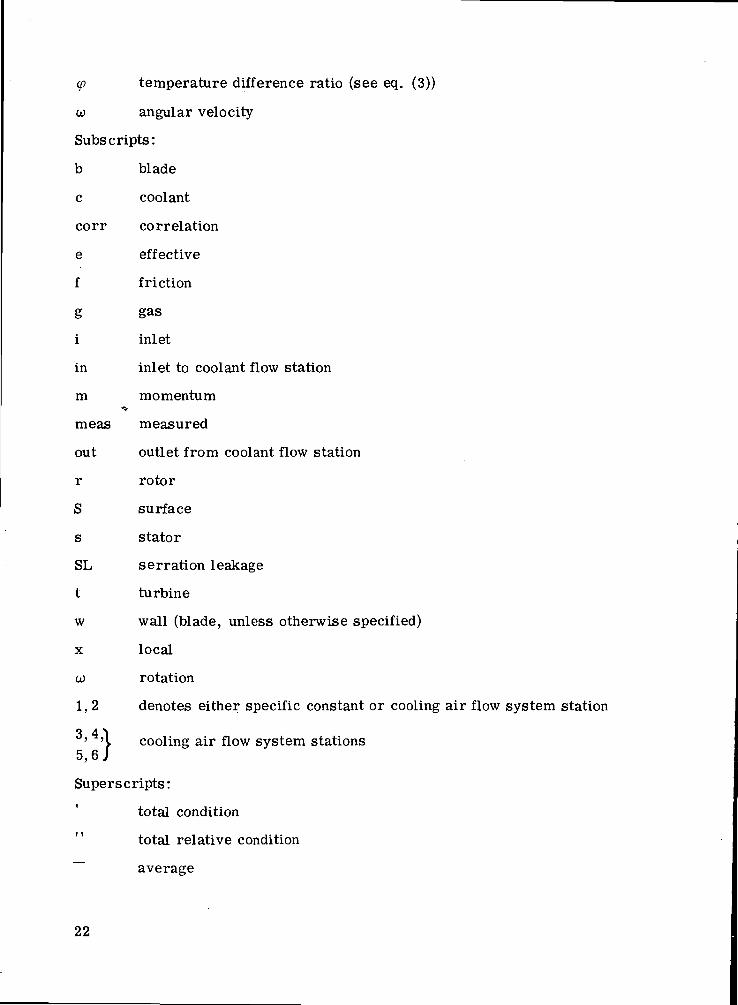
(p temperature difference ratio (see eq. (3))
co angular velocity
Subscripts:
b blade
c coolant
corr correlation
e effective
f friction
g gas
i inlet
in inlet to coolant flow station
m momentum«&
meas measured
out outlet from coolant flow station
r rotor
S surface
s stator
SL serration leakage
t turbine
w wall (blade, unless otherwise specified)
x local
co rotation
1, 2 denotes either specific constant or cooling air flow system station
3 4 ^' 'I cooling air flow system stations
5,6J
Superscripts:
total condition
total relative condition
~~ average
22
APPENDIX B
DETERMINATION OF TEST BLADE COOLANT FLOW
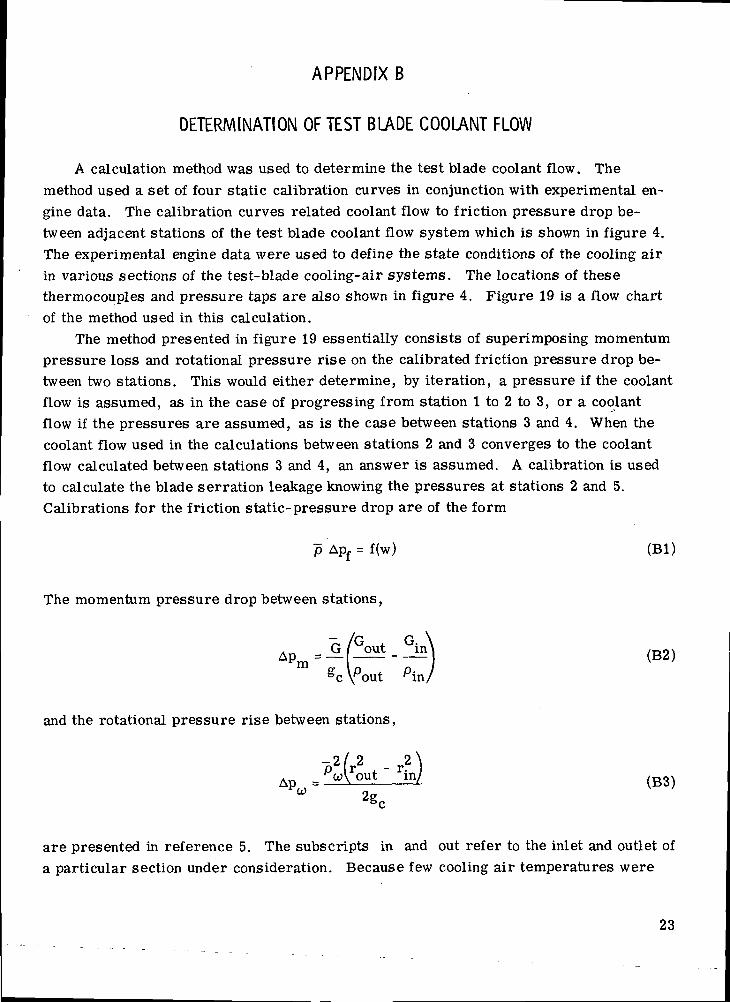
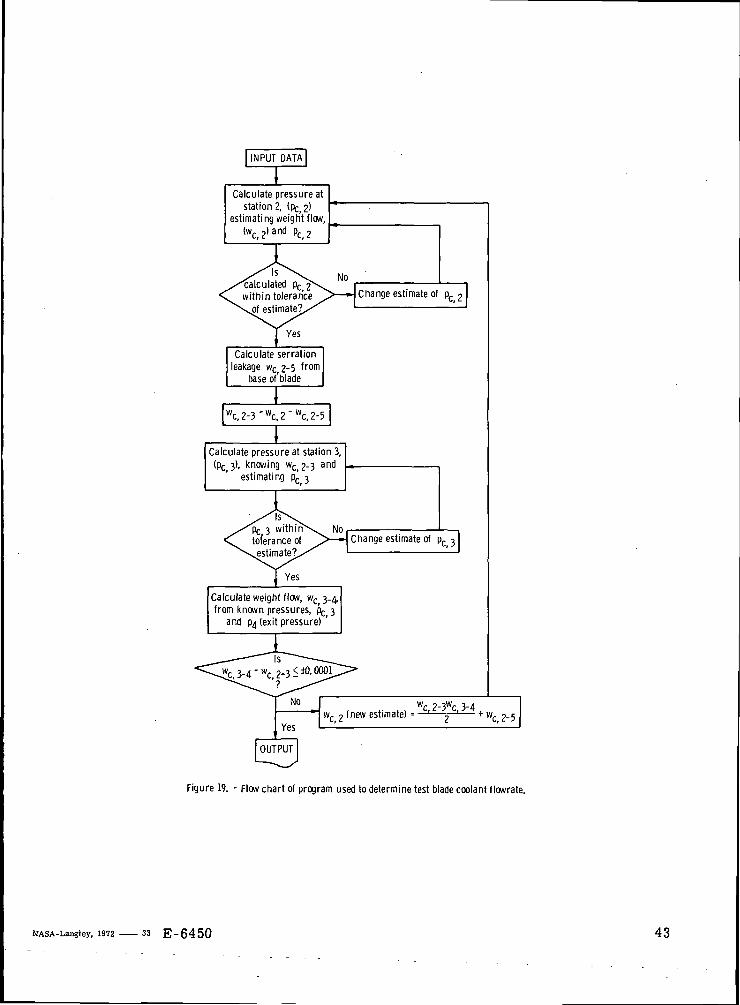
A calculation method was used to determine the test blade coolant flow. Themethod used a set of four static calibration curves in conjunction with experimental en-gine data. The calibration curves related coolant flow to friction pressure drop be-tween adjacent stations of the test blade coolant flow system which is shown in figure 4.The experimental engine data were used to define the state conditions of the cooling airin various sections of the test-blade cooling- air systems. The locations of thesethermocouples and pressure taps are also shown in figure 4. Figure 19 is a flow chartof the method used in this calculation.
The method presented in figure 19 essentially consists of superimposing momentumpressure loss and rotational pressure rise on the calibrated friction pressure drop be-tween two stations. This would either determine, by iteration, a pressure if the coolantflow is assumed, as in the case of progressing from station 1 to 2 to 3, or a coolantflow if the pressures are assumed, as is the case between stations 3 and 4. When thecoolant flow used in the calculations between stations 2 and 3 converges to the coolantflow calculated between stations 3 and 4, an answer is assumed. A calibration is usedto calculate the blade serration leakage knowing the pressures at stations 2 and 5.Calibrations for the friction static- pressure drop are of the form
p Apf = f(w) (Bl)
The momentum pressure drop between stations,
(B2)
and the rotational pressure rise between stations,
Ap = "\u^ ii£ (B3)
are presented in reference 5. The subscripts in and out refer to the inlet and outlet ofa particular section under consideration. Because few cooling air temperatures were
23

measured, various assumptions about coolant temperatures were made in these calcu-lations .
24
REFERENCES
1. Stepka, Francis S.; and Richards, Hadley T.: Experimental Investigation of MetalTemperatures of Air-Cooled Airfoil Leading Edges at Subsonic Flow and GasTemperatures up to 2780° F. NASA TN D-127, 1959.
2. Livingood, John N. B.; and Brown, W. Bryon: Analysis of Spanwise TemperatureDistribution in Three Types of Air-Cooled Turbine Blades. NACA Rep. 994, 1950.
3. Gladden, Herbert J.; Gauntner, Daniel J.; and Livingood, John N. B.: Analysisof Heat-Transfer Tests of an Impingement, Convection, Film Cooled Vane in aCascade. NASA TMX-2376, 1971.
4. Calvert, Howard F.; Cochran, Reeves P.; Dengler, Robert P.; Hickel, Roberto.;and Norris, James W.: Turbine Cooling Research Facility. NASA TMX-1927,1970.
5. Yeh, Frederick, C.; Poferl, David J.; Cochran, Reeves P.; and Richards,Hadley T.: Cooling Airflow Study Through a Stationary Turbine Disk and Blade.NASA TMX-2171, 1971.
6. Kaufman, A.; Berry, T. F.; and Meiners, K. E.: Joining Techniques for Fabrica-tion of Composite Air-Cooled Turbine Blades and Vanes. Paper 71-GT-32, ASME,Mar. 1971.
7. Growl, Robert J.; and Gladden, Herbert J.: Methods and Procedures for Evaluating,Forming, and Installing Small-Diameter Sheathed Thermocouple Wire and SheathedThermocouples. NASA TMX-2377, 1971.
8. Poferl, David J.; Svehla, Roger A.; and Lewandowski, Kenneth: Thermodynamicand Transport Properties of Air and the Combustion Products of Natural Gas and ofASTM-A-1 Fuel with Air. NASA TN D-5452, 1969.
9. Metzger, D. E.; Yamashita, T.; and Jenkins, C. W.: Impingement Cooling ofConcave Surfaces with Lines of Circular Air Jets. Paper 68-WA/GT-l, ASME,Dec. 1968.
25
co
Oojw
ooiosw33H
WQ
m
w
IDoC!
3totuI*3toCO0
ft
CDCJca
S+-I
3tncoCJ3
CO
toto
"S OJ 0)§ 0 0 D ,.- ea c jto f ca <Tc '"'•'-' 7>Jj 3 0) *
E M £S
o a>o ^S 5 x3 .,2
CO -o
o"
O hfi C"'""' "O ^' ^ "w21 bD £ rvC :Ir tJ <-M• i— i C ~|
73 — 0) i-lrt ^ 00> rt 03
"^ -1-1 35
C
Eu
c
S0
53* L,O d)
§ -se iQ C
H
totn
^ CO CD
§ s y »._• ra c -is t: 5 <S 3 to X
S tO ""*'O
Q
m 4>"0 «
t2 03 b^!H -̂
3 .2CO 73
cuo °
-" 73° CS1 ^ (/]
C* W 73 tO
73 -̂ d>rt S oO rt ca
3to
c
SCJ
c*^
Eu
a;"aO QJCJ ^o
p s5 3
X
SL,
ot*-lca"H.CD•oca3o>0
ca* *C
inT-f
" '
£0
1— 100
CO
TI< -* enCO CO »-HO CO CO
o
0 0 0in en o*— < in i— i0 ' -H
CO •* t-
O »H CM
COt— ^^
•̂1— 1
»— 1
in "̂
-*'
eg IH CM73 73 73C C Crt rt rt- oo r-
i-H
en"
O CO CD O^H i-i en CDo tr- co co0 '
en o co oi-H i-l C- O5o -^ t- CDo" i-< -̂i
CO »H CO CO•& CO £- Oo tn en CMO CO l-H -*l
J2en,_(
»— 1en
•*r
CM co ent- T-I CM i— 1
73 T3 73 T3
£ £ S S03 TO TO Co
in CD oo co
£uo£8
"ft
CU
C3
cu0
ca' ^c
ino
Soc-c*a1— 1
CO i-H•̂ COCD O
O
i-< OO5 IO
_TH
in I-HCQ OOO coCO
co c*}IT5 Ln
co co
i-H ^^
c- c-0 0t- c-'̂ ^*
CO "̂
CM i-lC- COo c-o'
o oin cxiIH CO
O I-H
-̂< inCO •-!CO *— 1
O Tj<
CO COc- c-0 0
CM' CM
in inCO CDCM CM
in in
*-l CM
£t-io
C4-I
"a.CD
3CD
0
ca"̂ ^coCM' '
£0
000
in
CM COCO COCO O
o'
o oo in
j— i
en coC- CO
CM
i— 1 i— ITf ^*t- t-
i-l i— 1
CM CMCM CM
•*' T(<
in coCM CO
CO C-t- CO0 C-
o'
0 0in -j
o' --<
T-H l-H00 00co inO CO
CO COl-H l-Hen ent-H lH
en enin inCO CO
"3" •* .
CM Tj*CM CM
26
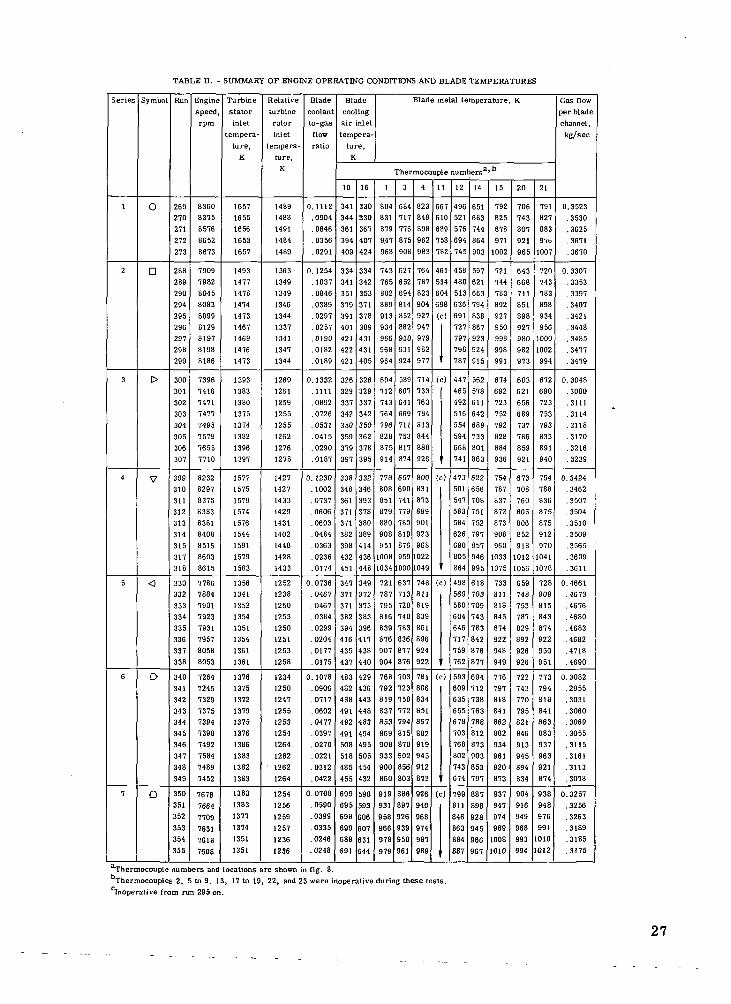
TABLE II. - SUMMARY OF ENGINE OPERATING CONDITIONS AND BLADE TEMPERATURES
Series
1
2
3
4
5
6
7
Symbol
O
D
t>
V
<
D
Q
Run
269270
271
272
273
288
289
290
294
295
296
297298
299
300
301
302
303
304
305
306
307
309
310
311312
313
314
315
317318
330
332
333
334
335
336
337338
340
341
342
343344
345
346
347
348
349
350
351
352
353
354
3551
Engine
speed,rpm
83608375
8576
8652
8673
7909
7982
8045
8083
8099
8129
8197
8198
8186
7396
7416
7471
7477
7495
7579
7655
7710
82328297
8375
83838381
8408
8516
8603
8615
77867884
7901
7923
7931
7957
8058
8053
7264
7245
7329
73757394
7398
7492
7584
7489
7452
7676
7664
7709
7631
7618
7608
Turbine
stator
inlet
tempera-
ture,
K
1657
1655
1656
1653
1657
1493
1477
1478
1474
1473
1467
1469
1476
1473
1393
1383
1380
1375
1374
1382
1396
1397
1577
1575
15791574
15761544
1591
1579
1583
13561341
1352
1354
13511354
1361
1361
1376
1375
1372
1379
1375
1376
1386
1383
1382
1383
1383
1383
1377
1374
1351
1351
Relativeturbinerotor
inlet
tempera-
ture,
K
14891488
1491
1484
1489
1363
1349
1349
13461344
1337
1341
1347
1344
1269
1261
1259
1255
1255
1262
1276
1278
1427
1427
1433
1429
14311402
1448
1428
1433
1252
1238
1250
1253
1250
1251
1253
1258
1234
1250
1247
1255
1253
1254
1264
1262
• 1262
1264
1254
1256
1259
1257
1236
1236
Bladecoolantto-gasflowratio
0.1112.0904
.0646
.0356
,0291
0.1254
.1037
.0846
.0389
.0297
.0257
.0190
.0182
.0189
0.1332
.1111
.0892
.0726
.0531
.0415
.0290
.0187
0.1230
.1002
.0737
.0606
.0603
.0484
.0363
.0236
.0174
0.0736.0467
.0467
.0384
.0299
.0204
.0177
.0175
0.1078
.0906
.0717
.0602
.0477
.0397
.0270
.0221
.0312
.0422
0.0708
.0590
.0399
.0335
.0246
.0248
Blade
cooling
air inlet
tempera-ture,
K
Blade metal temperature, K
Thermocouple numbers3'
10
341
344
361
394
409
334
341
351
379
391
401
421
422
421
326
329
337
342
350
359
379
397
338
348
361
371
371
382
398
432
451
347
371
371
382
394
416
435
437
483
482
488
491492
491508
518
485
455
699
695
698
699
688
691
16
330
330
367
407
424
334
342
353
371
378
389
431
431
405
326329
337
342
350
362
378
395
332
346
393
378
380
389
414
436
448
349
372
373
383
396
417
438
440
429
436
443
448
483
494
495
505
454
432
598
593
606
607
631
644
1
804
831
879
9.47
968
743
765
802
889
913
934
966
968
964
694
712
743
764
796
828
875
914
778
808
851
879
880
908
951
1008
1034
721
787
795
816
839
876
907
904
768
792
819
837
853
869908
933
900
860
919
931
958
966
978
979
3
684717
776
875
908
627
652
694
814
852
882
930
931
924
589
607
641
669
711
753
817
874
657
690
741
779
780
819
876
959
000
637
713
720
740
783
836
877
876
703
723
750
772794
815
870
902
856
803
886
897
926
939
958
961
4
823849
898
962
983
764
787
823
904
927
947
979
982
977
714
733
763
784
813
844
888
926
800831
873
899901
923
968022
049
748
811
819
839
861
896
924
922
781
806
834
851
867
882919
945
912
873
926
940
968
974
987
989
11
667610
689
758
782
461
534
604
698
(c)
(c)
(c)
(c)
(c)
(c)
12
496521
576
694
745
458
480
513
636
691
727
797
798
787
447
465
492
516
554
594
668
741
473
501
547
583
584
626
690
805
864
498
569
580
604
646
717
759
762
593
609
635
655678
703
768
802
743
674
799
811
846
863
884
887
14
651
683
744
864
903
597
621
663
794
838
867
923
924
915
562
578
611
642
689
733801
863
622
656
708
751
752797
857
946
995
618
703
709
743
783
842
876877
694
712
738
763788
812
873
903
853
797
887
898
928
945
966
967
15
792
825
878
971
1002
721
744
783892
927
950998
998
991
674
692
723
752
792
828
884
936
754
787
837
872
873908
960
1033
1075
733
811818
845
874
922
948
949
776797
818
841
862
882
934
961
920
873
937
947
974
989
1008
1010
20
706
743
807
921
965
643
668
711
851
898
927
980
982
973
603
621
656
689
737
786
859
921
673708
760
805
806
852
918
1012
1056
659
748
753
787
829
892
926
926
722
743
770
795821
846
913
945
894
834
904
916
949
968
993
994
21
791
827
883
9'ID
1007
720
743
783898
934
956
1000
1002
994
672
690
723
753
793
833
891
940
754
788
836
875
875
912
970
1041
1078
728
809
815
843
874
922
950
951
773
794
818
841
883
883
937
963
921
874
938
948
976
991
1010
012
Gas flowper bladechannel,
kg/sec
0.3523
.3530
.3625
.3671
.3670
0.3307
.3353
.3397
.3407
.3421
.3448
.3485
.3477
.3479
0.3048
.3080
.3111
.3114
.3118
.3170
.3216
.3239
0.3424
.3462
.3507
.3504
.3510
.3509
.3565
.3609
.3611
0.4661
.4673
.4676
.4680
.4683
.4682
.4718
.4690
0.3082
.2955
.3031
.3060
.3069
.3055
.3115
.3161
.3113
.3078
0.3257
.3256
.3263
.3189
.3185
.31751
Thermocouple numbers and locations are shown in fig. 8.
Thermocouples 2, 5 to 9, 13, 17 to 19, 22, and 23 were inoperative during these tests.clnoperative from run 295 on.
27
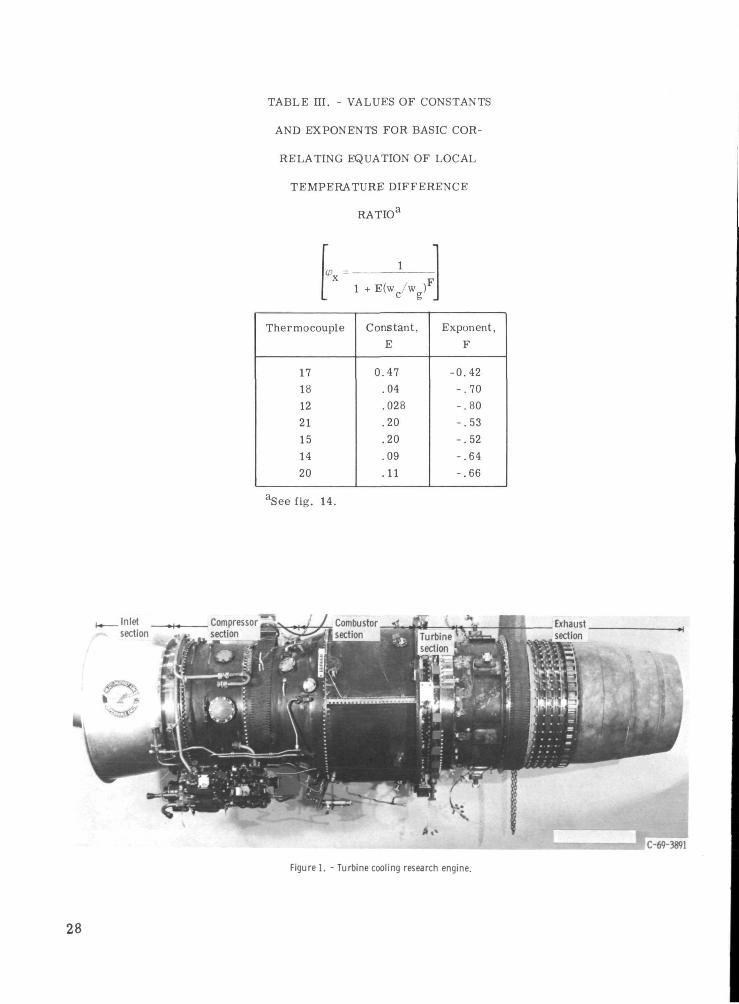
TABLE HI. - VALUES OF CONSTANTS
AND EXPONENTS FOR BASIC COR-
RELATING EQUATION OF LOCAL
TEMPERATURE DIFFERENCE
RATIO3
E(wc/w
Thermocouple
1718
1221
151420
Constant,E
0.47.04
.028
.20
.20
.09
. 11
Exponent,F
-0.42- .70- .80- .53- .52- .64-.66
aSee fig. 14.
M Inletsection
C-69-3891
Figure 1. - Turbine cooling research engine.
28
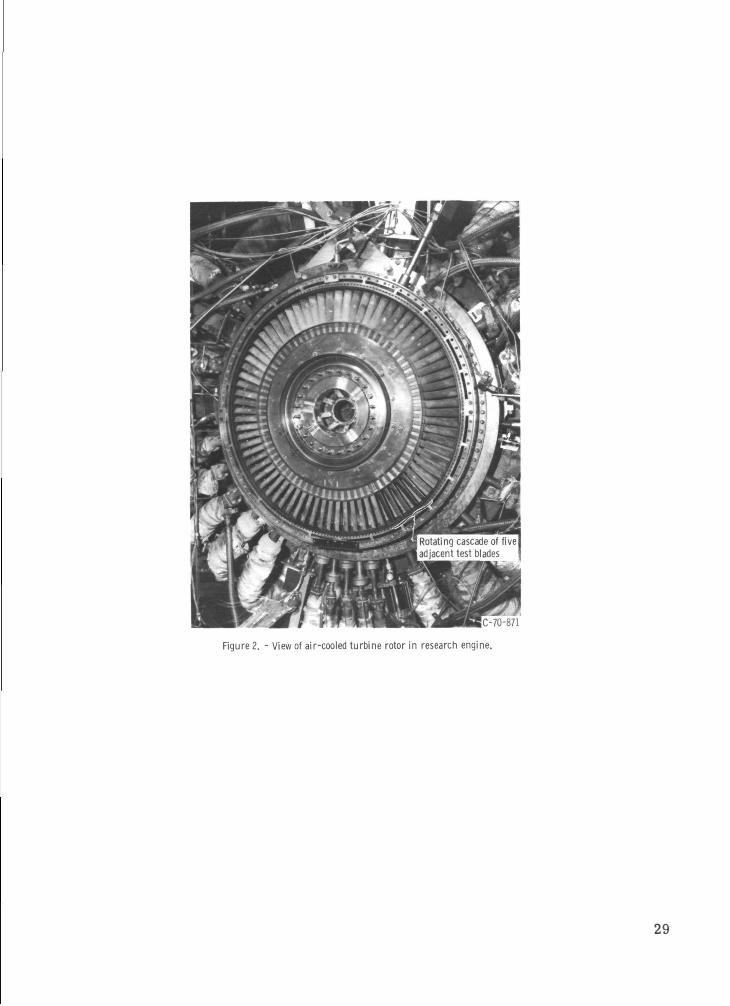
Rotating cascade of fiveadjacent test blades
SMI MKlJMKEC-70-871
Figure 2. - View of air-cooled turbine rotor in research engine.
29
30
Gas flow
Station 3-Station 4
•Blade airfoil
Blade baseStation 5
Blade base fir tree serrations
Station 2
MlBlade cooling-air inlet
Turbine di
Cooling air thermocouples
Station location
Static pressure taps
CD-11164-33
Engine center line •
Outer seal balance air
Annular manifolds
-*—Test blade cooling air
Inner seal balance air
\\
Figured - Balanced pressure cooling-air labyrinth seal system.
31
Cooling air central cavity
Tip cap
impingementholes
Leading-edge
Typical cross section of blade
.^-Cooling airdischarge
' passages
XV 0.076/' \
0.127
-49 Fins
0.012
Section B-B
Serrations
«uibl~rIP7
Total of four slots
*&
0.259
T0.375
Total of eight slots
0.388
_L0.147
-V Cooling air inlet CD-11165-33
1-Total of four slots
Section C-C
Figures. - Cut-away schematic of chordwise-passage air-cooled blade. (Alldimensions are in centimeters.)
32
Chordwisefins and Sheetgrooves material
Electric dischargemachined internalcooling surface
(a) Suction side blade half.
Chordwisefins andgrooves
Sheet material
Electric dischargemachined internalcooling surface
CD-11166-33
Leading-edgeimpingementholes
(b) Pressure side blade half.
Figure 6. - Subassembly of chordwise-passage blade halves.
33
Tip cap -^
Leading edge-jf- Slotted trail-
/ ing edge
Blade platform-.
""-Cooling air inlet
C-69-1233
Figure 7. - Chordwise-passage blade assembly.
34
Span location legend
| 3.81cm (1.5 in.) above platform
4 1.27 cm (0.5 i n.) above platform
A 5.08 cm (2.0 i n.) above platform
Cooling air-base inlet
Base platform
CD-11163-33
Figure 8. - Relative location of thermocouples on five adjacent test blades. Thermxouple numbers appearnext to symbol location.
35
V
o> 3E-2
20001—
1600
1200
£ 800
400
EV
a;E -
e cI*
I _Q ;—i
3
1200,—
' 1000 —
Coolantflowratio,
Vwg
0.029
.6 .4 .2 0 .2 .4Dimensionless surface distance, x/L
.6 1.0
Figure 9. - Chordwise blade-wall temperature distributions for nominal relative gas temperature of1489 K (2221° F), nominal blade inlet coolant temperature of 361 K (190° F), and varying coolant flowratios.
•go
-° V
1600
1200
800
400
EV 1200
1000
CUo 800
^rl4B ^03 ^~E dCU 'l
600
400
.^-Trailing edge -Suctionsurface
Pressuresurface^
Inletcoolant
temperature,Tc,b,i
K °F
699 (798)485(413)379 1223)
Trailing
1.0 .6 .4 .2 0 .2 .4Dimensionless surface distance, x/L
.6 1.0
Figure 10. - Chordwise blade-metal temperature distributions for nominal relative gas temperature of1262 K (1812° F), a nominal coolant flow ratio of 0.03 and varying inlet coolant temperatures.
36
.6
H .4
•S .2
0.095tw/M)°-59/(w/(j)0-M
+ 10 percent
(w/u) ).64cm-0.05
"0-05
Figure 11. - Correlation of average blade wall temperaturesbased on equation (1).
S .6
oI
.02 .12.04 .06 .08 .10Coolant flow ratio, wc/w.
Figure 12. - Correlation of average blade wall temperatures based on equation (3).
14
37
•S .4
£s.
I .2
0
0.12(w/M>2-69/<w/|j){!-83
.4
10 .8
.8 1.2 1.6 2.0 2
(w/u)n/(w/Mlcm, cm"0-14
1 1 11.6 2.4 3.2
lw/nln/lw/nlm ff°-14
4 2.
J
4.0
(a) Thermocouple 12.
0.11(w/Ml°-59/(w/M)°-60
1
10 1
2 3 4 5
(w/Ml£/(w/u)|P, cm"0-01
I I I !
2 3 4 5
<w/M)"/<w/(j)jP, ft"0-01
6
1 1
6 7
(b) Thermocouple 21.
.4
1
8 1.2 1.6 2.0
(w/plq/lw/plj1, cm""- I2
1 1 1
2.4 2.
13.2 4.0.8 1.6 2.4
(w/M)£/(w/u){F, ft"0'12
(c) Thermocouple 14.
Figure 13. - Correlation of local blade wall temperatures based on equation (1).
38
2 .4 .6 .8 1.0 1.2 1.4
3- 0 .4 1.2 1.6 2.0 2.4ft-0.16
(d) Thermocouple 20.
10 12(w/M)g
n/(w/p)cm, ft0-08
(e) Thermocouple 15.
Figure 13. - Concluded.
14
39
1.01—
I I I
.6
.2
(a) Thermocouple 12.
1 + 0.20(wc/wg)-0.53
J I(b) Thermocouple 21.
(c) Thermocouple 14.
-0.661 + 0. ll(wc/wg)
I I I I I I(d) Thermocouple 20.
1 + 0.20(wc/wg)-0.52
0 .02 .04 .06 .08 .10 .12 .14Coolant flow ratio, wc/wg
(e) Thermocouple 15.
Figure 14. -Correlation of local blade wall temperatures based on <px correlation.
40
1300
1100
ilS.E 900
700
lOOOr—
8 900 —
s.
•§
500 600 700 800 900 1000
Measured average wall temperature, Tw meas K
I I I I I500 700 900 1100 1300
Measured average wall temperature, Tw meas, °F
Figure 15. - Comparison of average measured blade wall temperatureswith those calculated from 7 correlation.
1000 r—
°_ 1200
8
.*-*"
2f 1000uroOJo.
o>
i 800
CDCDCO
I| 600O3Q>
^ 500
- * 700-
500 600 700 800 _ 900 1000
Measured average wall temperature, fw meas, K
I I i 1 I500 600 800 1000 _ 1200
Measured average wall temperature, Tw meas, °F
Figure 16. - Comparison of average measured blade wall temperatureswith those calculated from q> correlation.
41
2200
o>- 1800
1400
1400
1200
_ 3
,-T railing/ edge
-Suction surface
Original design-i,
Revised design-v \ T .,.' ' Trailing
edge-.,I Leading edge
•4« E—-- Pressure surfaceI I I I I
10 .6 .4 .2 0 .2 .4Dimensionless surface distance, x/L
.6 1.0
Figure 17. - Expected chordwise blade wall temperature distributions. Maximum wall temperature of1256 K (1800° F); relative gas temperature, 1496 K (2232° F); coolant-inlet temperature, 922 K (1200° F);coolant flow ratio, 0.03.
3200
3000
| 2800
-2 2600
3~ 2400
2200
2000 r—
.02 .04 .06 .08Coolant flow ratio,
.10 .12 .14
Figure 18. - Potential stator-inlet total gas temperature as function of coolantflow ratio. Maximum wall temperature, 1256 K (1800° F); coolant-inlet tem-perature, 922 K (1200° F); both original and revised blade designs.
42
INPUT DATA
Calculate pressure atstation 2, (pc_ 2)
estimating weight flow,(wc 2) and pc 2
NoIscalculatedwithin tolerance
estimate?Change estimate of pc 2
Yes
Calculate serrationleakage wc 2-5 from
base of'blade
Iw c ,2-3 = w c ,2~ w c ,2-5
ICalculate pressure at station 3,(pCj3), knowing wC;2-3 and
estimating p'c 3
PC 3 within\^ Notolerance of.estimate?.
Change estimate of pc 3
Yes
Calculate weight flow, wc> 3-4from known pressures, pc_ 3
and P4<exit pressure) '
wc 2 (new estimate)wc,2-3wc.3-4
' 2 + wC,2-5
Figure 19. - Flow chart of program used to determine test blade coolant flowrate.
NASA-Langley, 1972 33 E-6450 43

Page Intentionally Left Blank
NATIONAL AERONAUTICS AND SPACE AOMISTRATIONWASHINGTON. D.C. 20546
OFFICIAL BUSINESSPENALTY FOR PRIVATE USE $300
FIRST CLASS MAILNATIONAL AERONAUTICS AND
SPACE: ADMINISTRATION
nnc-ru i ci ill .POSTMASTER . I' Unddivet »ble ( Section 1p^, Mima ,, >
'The aeronautical and space activities of the United States shall beconducted so as to contribute . . . to the expansion of bunion knowl-edge of phenomena in the atmosphere and space. The Administrationshall provide for the widest practicable and appropriate disseminationof information concerning its actirities and the results thereof."
—NATIONAL AERONAUTICS AND SPACE ACT OF 1958
NASA SCIENTIFIC AND TECHNICAL PUBLICATIONS
TECHNICAL REPORTS: Scientific andtechnical information considered important,complete, and a lasting contribution to existingknowledge.
TECHNICAL NOTES: Information less broadin scope but nevertheless of importance as acontribution to existing knowledge.
TECHNICAL MEMORANDUMS:Information receiving limited distributionbecause of preliminary data, security classifica-tion, or other reasons.
CONTRACTOR REPORTS: Scientific andtechnical information generated under a NASAcontract or grant and considered an importantcontribution to existing knowledge.
TECHNICAL TRANSLATIONS: Informationpublished in a foreign language consideredto merit NASA distribution in English.
SPECIAL PUBLICATIONS: Informationderived from or of value to NASA activities.Publications include conference proceedings,monographs, data compilations, handbooks,sourcebooks, and special bibliographies.
TECHNOLOGY UTILIZATIONPUBLICATIONS: Information on technologyused by NASA that may be of particularinterest in commercial and other non-aerospaceapplications. Publications include Tech Briefs,Technology Utilization Reports andTechnology Surveys.
Details on the availability of these publications may be obtained from;
SCIENTIFIC AND TECHNICAL INFORMATION OFFICE
NATIONAL AERONAUTICS AND SPACE ADMINISTRATIONW«fbinston, D.C. 20546