Embed Size (px)
Citation preview
N A S A T E C H N I
M E M O R
\ c
C A L
A N D U M N A S A TM X-1500 11
PERFORMANCE OF A 16.6-METER-DIAMETER MODIFIED RINGSAIL PARACHUTE I N A SIMULATED MARTIAN ENVIRONMENT
by Charles H. Whitlock, Allen B. Henning, und Lzlcille C. Coltrune
Langley Reseurch Center Lanpley Stution, Humbton, Vu.
U J I
1
c
NATIONAL AERONAUTICS AND SPACE ADMINISTRATION WASHINGTON, D. C. JANUARY 1968
https://ntrs.nasa.gov/search.jsp?R=19680004623 2018-07-13T08:37:40+00:00Z
NASA TM X- I500
PERFORMANCE O F A
16.6-METER-DIAMETER MODIFIED RINGSAIL PARACHUTE
IN A SIMULATED MARTIAN ENVIRONMENT
By Charles H. Whitlock, Allen B. Henning, and Lucille C. Coltrane
Langley Research Center Langley Station, Hampton, Va.
Technical Fi lm Supplement L-984 available on request
NATIONAL AERONAUTICS AND SPACE ADMINISTRATION
For sale by the Clearinghouse for Federal Scientific and Technical Information Springfield, Virginia 22151 - CFSTI price $3.00
PERFORMANCE OF A
16.6 -METER- DIAM E TER MODIFIED RINGSAI L PARACHUTE
IN A SIMULATED MARTIAN ENVIRONMENT
By Charles H. Whitlock, Allen B. Henning, and Lucille C. Coltrane
Langley Research Center
SUMMARY
Inflation, drag, and stability characteristics of a 54.5 -foot nominal-diameter (16.6-meter) modified ringsail parachute deployed in the wake of a 15-foot-diameter (4.6-meter) spacecraft traveling at a Mach number of 1.6 and a dynamic pressure equal to 11.6 psf (555 N/m2) were obtained from the third balloon-launched flight test of the Planetary Entry Parachute Program. After deployment, the parachute inflated rapidly to a full condition, partially collapsed, and reinflated to a stable configuration. After reinflation, an average drag coefficient near 0.6 based on nominal surface area w a s obtained. During descent, an aerodynamic t r im angle was observed in a plane near several torn sails. Amplitude of the tr im was approximately 15' and oscillation about t r im was less than 1l0.
INTRODUCTION
The NASA Planetary Entry Parachute Program (PEPP) was established to provide test data on several parachute configurations for applications, such as the Voyager mis- sion. Such applications require performance characteristics in a low-density environ- ment. Large-scale flight testing of parachutes deployed behind blunt bodies at super- sonic speeds w a s undertaken because no test facilities suitable for investigating this application existed. In addition, little confidence existed in extrapolating large-scale parachute characterist ics f rom small-scale parachute data. The combination of para- chute size, deployment Mach number, and density environment was outside the limits of applicable experience.
Flight tests which simulate conditions expected in the Martian atmosphere during parachute operation have been conducteu with the use of born rocket-iaunched and balloon-launched spacecraft. (See ref. 1 .) Modified ringsail, disk-gap-band, and cross parachutes have been tested. References 2 to 4 present the results presently published
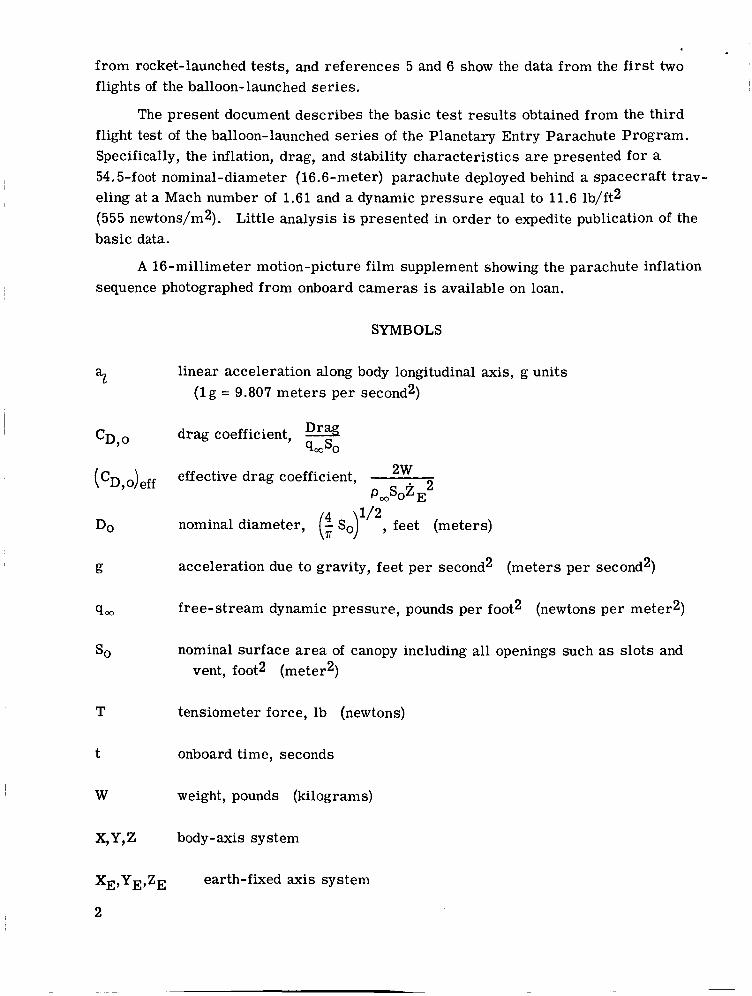
from rocket-launched tests, and references 5 and 6 show the data from the first two flights of the balloon-launched ser ies .
The present document describes the basic test results obtained from the third flight test of the balloon-launched ser ies of the Planetary Entry Parachute Program. Specifically, the inflation, drag, and stability characteristics a r e presented for a 54.5-foot nominal-diameter (16.6-meter) parachute deployed behind a spacecraft trav- eling at a Mach number of 1.61 and a dynamic pressure equal to 11.6 lb/ft2 (555 newtons/m2). basic data.
Little analysis is presented in order to expedite publication of the
A 16-millimeter motion-picture film supplement showing the parachute inflation sequence photographed from onboard cameras is available on loan.
SYMBOLS
az linear acceleration along body longitudinal axis, g units ( l g = 9.807 meters per second2)
drag coefficient, Drag q,S0
2w effective drag coefficient, P,SOZ E2
nominal diameter , (: so)1’2, feet (meters)
acceleration due to gravity, feet per second2 (meters per second2)
free-stream dynamic pressure, pounds per foot2 (newtons per meter2)
nominal surface a r e a of canopy including all openings such as slots and vent, foot2 (mete?)
tensiometer force, lb (newtons)
onboard time, seconds
weight, pounds (kilograms)
body-axis system
earth-fixed axis system
2
, pa3 free-stream upper air density, slugs per foot3 (kilograms per meter3)
e,+,* payload attitude angles relative to earth-fixed axis system, radians or degrees
6 payload resultant pitch-yaw angle from the local vertical, radians or degrees
Dots over symbols denote differentiation with respect to time. Velocities, dynamic pressures, and Mach numbers a r e free-stream values unless otherwise noted.
PARACHUTE DESCRIPTION
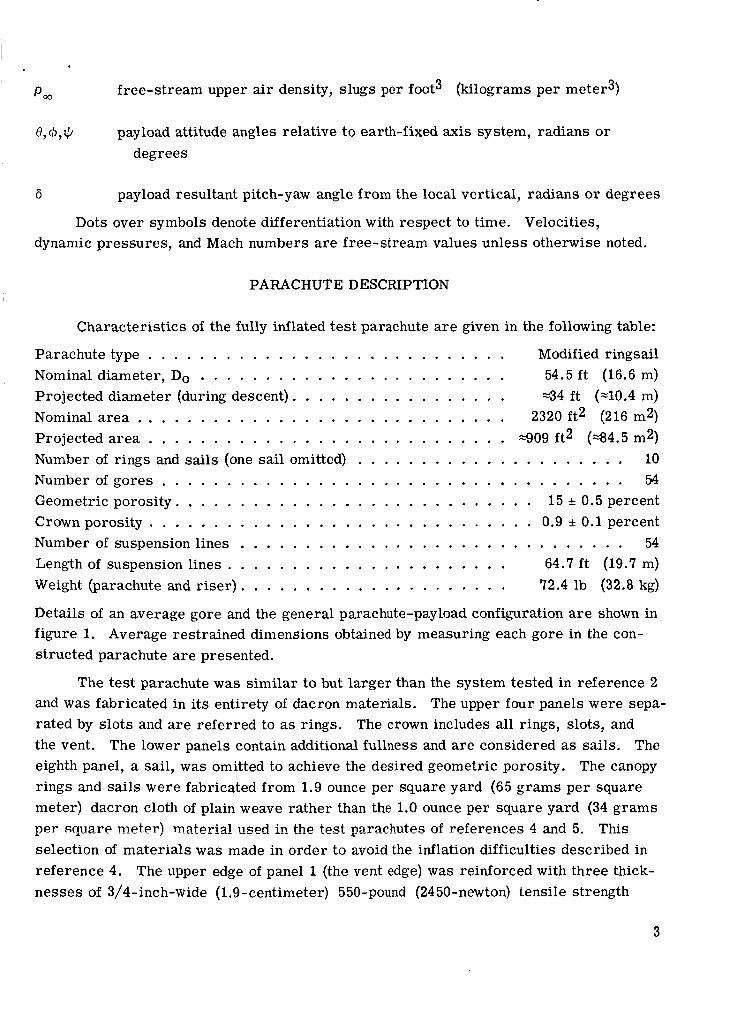
Characteristics of the fully inflated test parachute a r e given in the following table:
Parachute type . . . . . . . . . . . . . . . . . . . . . . . . . . . . Modified ringsail Nominal diameter, Do . . . . . . . . . . . . . . . . . . . . . . . . 54.5 f t (16.6 m) Projected diameter (during descent) . . . . . . . . . . . . . . . . . ~ 3 4 f t (~10.4 m) Nominal a r e a . . . . . . . . . . . . . . . . . . . . . . . . . . . . . 2320 f t 2 (216 m2) Projected a rea . . . . . . . . . . . . . . . . . . . . . . . . . . . . 4 0 9 f t2 (434.5 m2) Number of rings and sails (one sail omitted) . . . . . . . . . . . . . . . . . . . . . 10 N u m b e r o f g o r e s . . . . . . . . . . . . . . . . . . . . . . . . . . . . . . . . . . . . 54 Geometric porosity. . . . . . . . . . . . . . . . . . . . . . . . . . . . 15 f 0.5 percent Crown porosity . . . . . . . . . . . . . . . . . . . . . . . . . . . . . . 0.9 * 0.1 percent Number of suspension lines . . . . . . . . . . . . . . . . . . . . . . . . . . . . . . 54 Length of suspension lines . . . . . . . . . . . . . . . . . . . . . . 64.7 f t (19.7 m) Weight (parachute and r i s e r ) . . . . . . . . . . . . . . . . . . . . . 72.4 lb (32.8 kg)
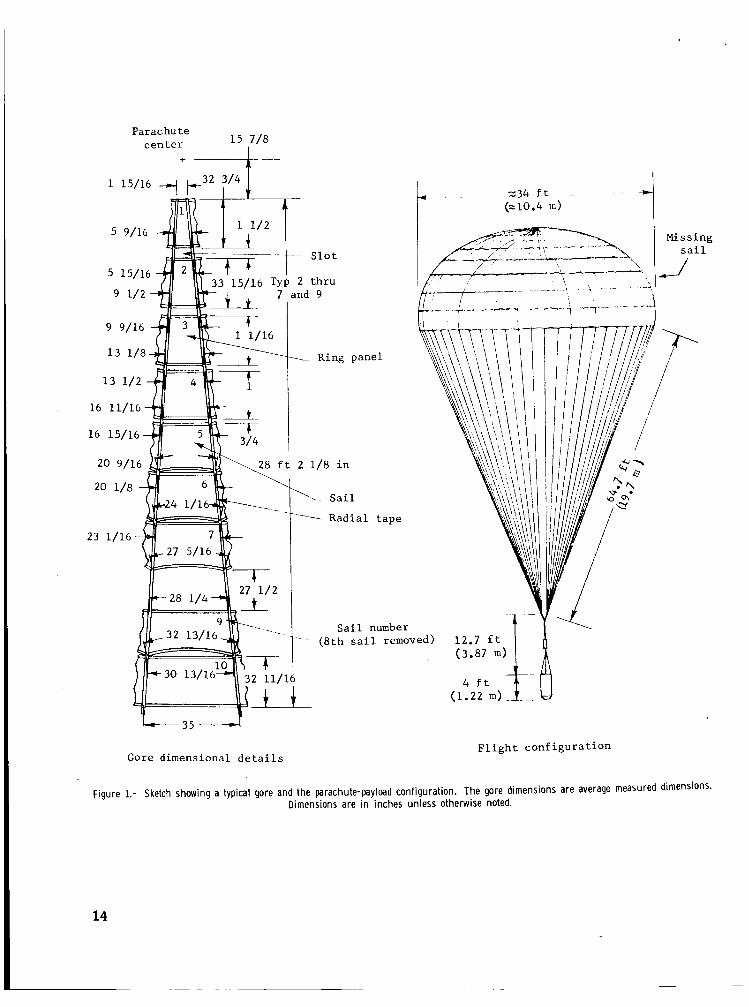
Details of an average gore and the general parachute-payload configuration a r e shown in figure 1. Average restrained dimensions obtained by measuring each gore in the con- structed parachute a r e presented.
The test parachute was similar to but larger than the system tested in reference 2 and was fabricated in its entirety of dacron materials. The upper four panels were sepa- rated by s lots and are referred to as rings. The crown includes all rings, slots, and the vent. The lower panels contain additional fullness and a re considered as sails. The eighth panel, a sail, was omitted to achieve the desired geometric porosity. The canopy rings and sails were fabricated from 1.9 ounce per square yard (65 grams per square meter) dacron cloth of plain weave rather than the 1.0 ounce per square yard (34 grams per square meter! material w e d in the test parachides of references 4 m-d 5. This selection of materials was made in order to avoid the inflation difficulties described in reference 4. nesses of 3/4-inch-wide (1.9-centimeter) 550-pound (2450-newton) tensile strength
The upper edge of panel 1 (the vent edge) was reinforced with three thick-
3
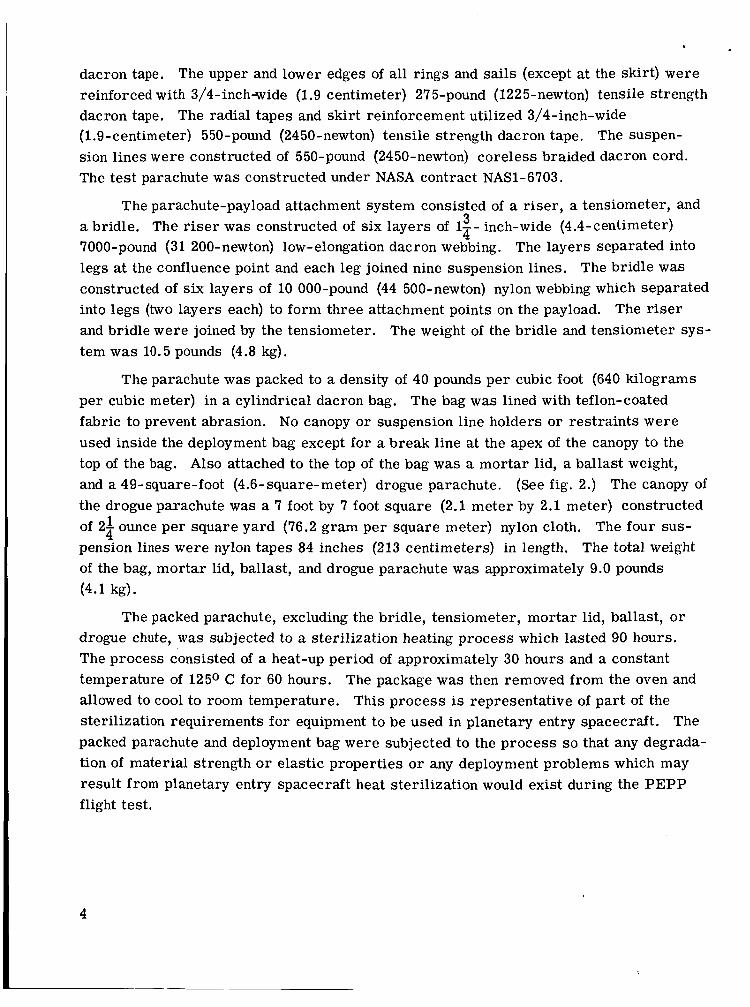
dacron tape. The upper and lower edges of all rings and sails (except at the skirt) were reinforced with 3/4-inch-wide (1.9 centimeter) 275-pound (1225-newton) tensile strength dacron tape. The radial tapes and skirt reinforcement utilized 3/4-inch-wide (1.9-centimeter) 550-pound (2450-newton) tensile strength dacron tape. The suspen- sion lines were constructed of 550-pound (2450-newton) coreless braided dacron cord. The tes t parachute w a s constructed under NASA contract NAS1-6703.
The parachute-payload attachment system consisted of a r i se r , a tensiometer, and a bridle. The r i s e r was constructed of six layers of 1-- inch-wide (4.4-centimeter) 7000-pound (31 200-newton) low-elongation dacron webbing. The layers separated into legs at the confluence point and each leg joined nine suspension lines. The bridle was constructed of six layers of 10 000-pound (44 500-newton) nylon webbing which separated into legs (two layers each) to form three attachment points on the payload. The r i s e r and bridle were joined by the tensiometer. The weight of the bridle and tensiometer sys- tem was 10.5 pounds (4.8 kg).
3 4
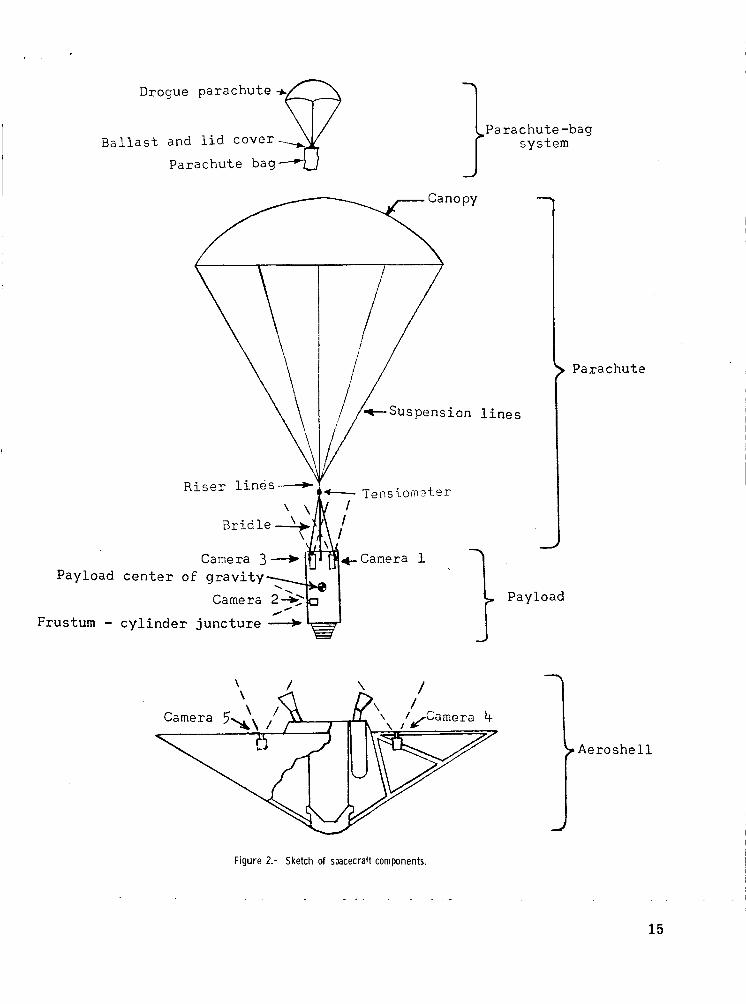
The parachute was packed to a density of 40 pounds per cubic foot (640 kilograms per cubic meter) in a cylindrical dacron bag. The bag was lined with teflon-coated fabric to prevent abrasion. No canopy or suspension line holders or restraints were used inside the deployment bag except for a break line at the apex of the canopy to the top of the bag. Also attached to the top of the bag was a mortar lid, a ballast weight, and a 49-square-foot (4.6-square-meter) drogue parachute. (See fig. 2.) The canopy of the drogue parachute was a 7 foot by 7 foot square (2.1 meter by 2.1 meter) constructed of 2- ounce per square yard (76.2 gram per square meter) nylon cloth. The four sus- pension lines were nylon tapes 84 inches (213 centimeters) in length. The total weight of the bag, mortar lid, ballast, and drogue parachute w a s approximately 9.0 pounds (4.1 kg).
1 4
The packed parachute, excluding the bridle, tensiometer, mortar lid, ballast, o r drogue chute, w a s subjected to a sterilization heating process which lasted 90 hours. The process consisted of a heat-up period of approximately 30 hours and a constant temperature of 1250 C for 60 hours. The package was then removed from the oven and allowed to cool to room temperature. This process is representative of par t of the sterilization requirements for equipment to be used in planetary entry spacecraft. The packed parachute and deployment bag were subjected to the process so that any degrada- tion of material strength or elastic properties or any deployment problems which may result from planetary entry spacecraft heat sterilization would exist during the PEPP flight test.
4
TEST SYSTEM DESCRIPTION
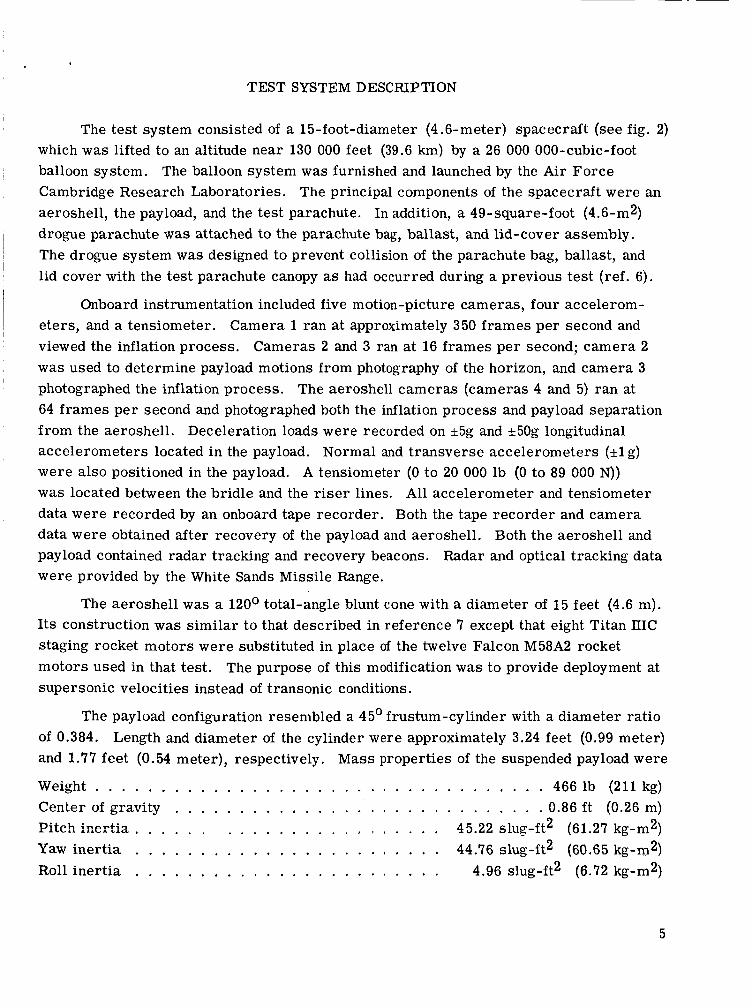
The test system consisted of a 15-foot-diameter (4.6-meter) spacecraft (see fig. 2) which was lifted to an altitude near 130 000 feet (39.6 km) by a 26 000 000-cubic-foot balloon system. The balloon system was furnished and launched by the Air Force Cambridge Research Laboratories. The principal components of the spacecraft were an aeroshell, the payload, and the test parachute. In addition, a 49-square-foot (4.6-mZ) drogue parachute w a s attached to the parachute bag, ballast, and lid-cover assembly. The drogue system was designed to prevent collision of the parachute bag, ballast, and lid cover with the test parachute canopy as had occurred during a previous test (ref. 6).
Onboard instrumentation included five motion-picture cameras, four accelerom- eters, and a tensiometer. Camera 1 ran at approximately 350 frames per second and viewed the inflation process. Cameras 2 and 3 ran at 16 frames per second; camera 2 was used to determine payload motions from photography of the horizon, and camera 3 photographed the inflation process. The aeroshell cameras (cameras 4 and 5) ran at 64 frames per second and photographed both the inflation process and payload separation from the aeroshell. Deceleration loads were recorded on *5g and *50g longitudinal accelerometers located in the payload. Normal and transverse accelerometers (4 g) were also positioned in the payload. A tensiometer (0 to 20 000 lb (0 to 89 000 N)) was located between the bridle and the r i s e r lines. All accelerometer and tensiometer data were recorded by an onboard tape recorder. Both the tape recorder and camera data were obtained after recovery of the payload and aeroshell. Both the aeroshell and payload contained radar tracking and recovery beacons. Radar and optical tracking data were provided by the White Sands Missile Range.
I
The aeroshell was a 120° total-angle blunt cone with a diameter of 15 feet (4.6 m). I t s construction was similar to that described in reference 7 except that eight Titan IIIC staging rocket motors were substituted in place of the twelve Falcon M58A2 rocket motors used in that test. The purpose of this modification was to provide deployment at supersonic velocities instead of transonic conditions.
The payload configuration resembled a 45' frustum-cylinder with a diameter ratio of 0.384. Length and diameter of the cylinder were approximately 3.24 feet (0.99 meter) and 1.77 feet (0.54 meter), respectively. M a s s properties of the suspended payload were
Weigh t . . . . . . . . . . . . . . . . . . . . . . . . . . . . . . . . . . . 4661b (211kg) Center of gravity . . . . . . . . . . . . . . . . . . . . . . . . . . . . . 0.86 ft (0.26 m) Pitch inertia . . . . . . . . . . . . . . . . . . . . . . . 45.22 slug-ft2 (61.27 kg-m2) Yaw inertia . . . . . . . . . . . . . . . . . . . . . . . . 44.76 slug-ft2 (60.65 kg-m2) Roll iner t ia . . . . . . . . . . . . . . . . . . . . . . . . 4.96 slug-ft2 (6.72 kg-m2)
5
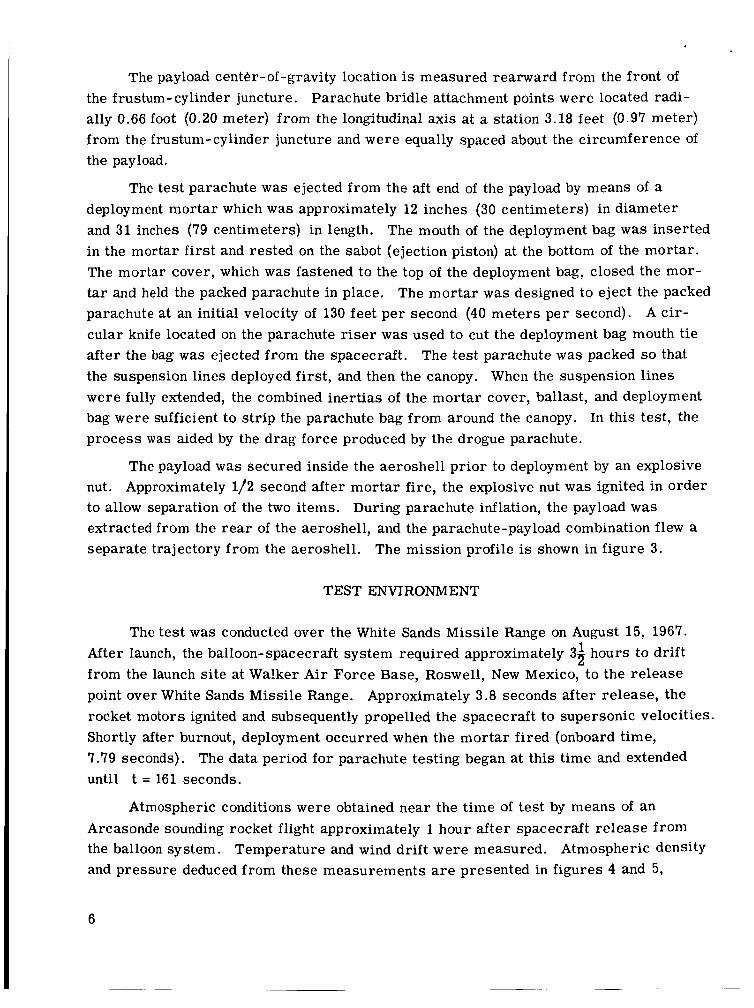
The payload center-of-gravity location is measured rearward from the front of the frustum- cylinder juncture. Parachute bridle attachment points were located radi- ally 0.66 foot (0.20 meter) from the longitudinal axis at a station 3.18 feet (0.97 meter) from the frustum-cylinder juncture and were equally spaced about the circumference of the payload.
The tes t parachute was ejected from the aft end of the payload by means of a deployment mortar which was approximately 12 inches (30 centimeters) in diameter and 31 inches (79 centimeters) in length. The mouth of the deployment bag was inserted in the mortar first and rested on the sabot (ejection piston) at the bottom of the mortar . The mortar cover, which was fastened to the top of the deployment bag, closed the mor- t a r and held the packed parachute in place. The mortar was designed to eject the packed parachute at an initial velocity of 130 feet per second (40 meters per second). A cir- cular knife located on the parachute riser was used to cut the deployment bag mouth tie after the bag was ejected from the spacecraft. The test parachute was packed s o that the suspension lines deployed first, and then the canopy. When the suspension lines were fully extended, the combined inertias of the mortar cover, ballast, and deployment bag were sufficient to s t r ip the parachute bag from around the canopy. In this test, the process was aided by the drag force produced by the drogue parachute.
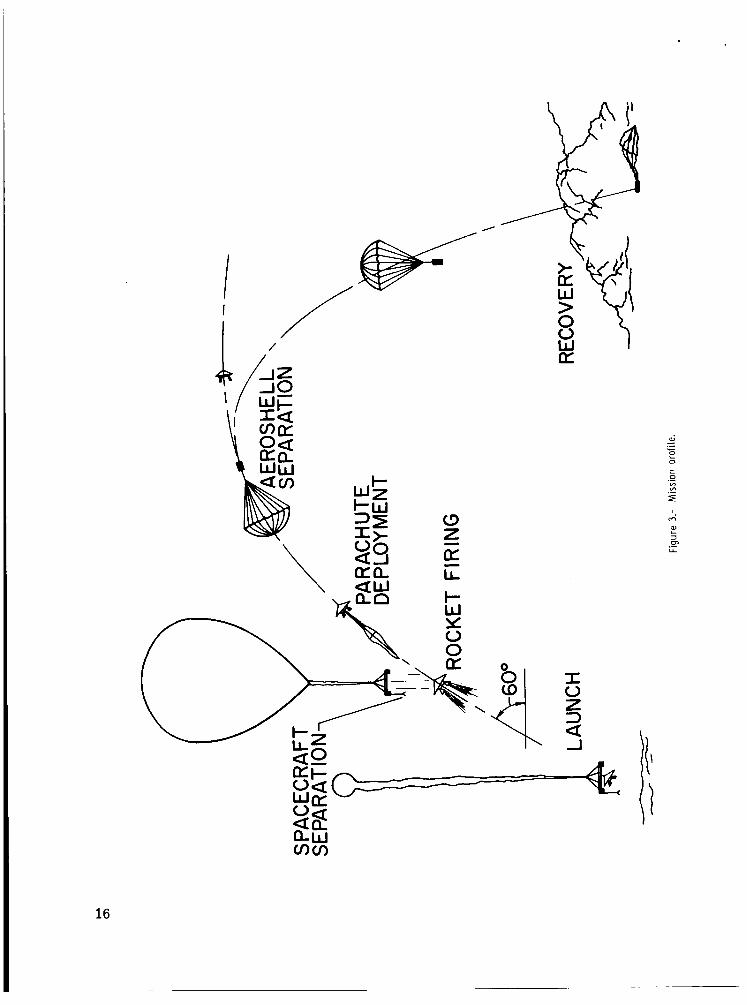
The payload was secured inside the aeroshell pr ior to deployment by an explosive nut. Approximately 1/2 second after mortar fire, the explosive nut was ignited in order to allow separation of the two items. During parachute inflation, the payload w a s extracted from the rear of the aeroshell, and the parachute-payload combination flew a separate trajectory from the aeroshell. The mission profile is shown in figure 3.
TEST ENVIRONMENT
The test was conducted over the White Sands Missile Range on August 15, 1967. After launch, the balloon-spacecraft system required approximately 32 hours to drift from the launch site at Wa!ker Air Force Base, Roswell, New Mexico, to the release point over White Sands Missile Range. Approximately 3.8 seconds after release, the rocket motors ignited and subsequently propelled the spacecraft to supersonic velocities. Shortly after burnout, deployment occurred when the mor ta r f ired (onboard time, 7.79 seconds). The data period for parachute testing began at this time and extended until t = 161 seconds.
1
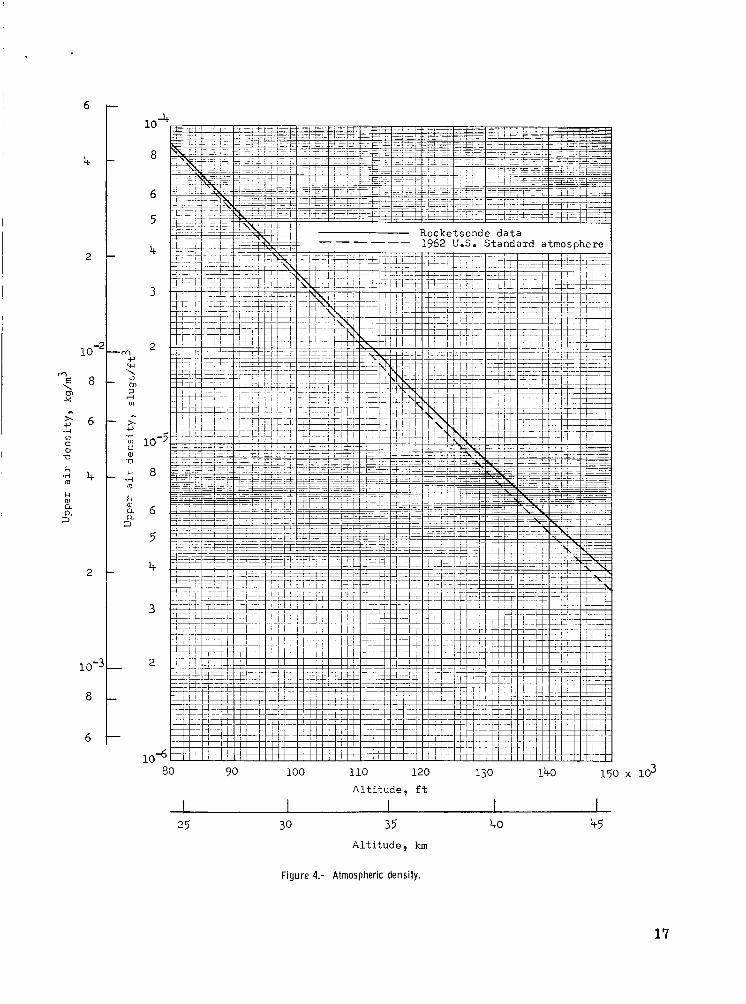
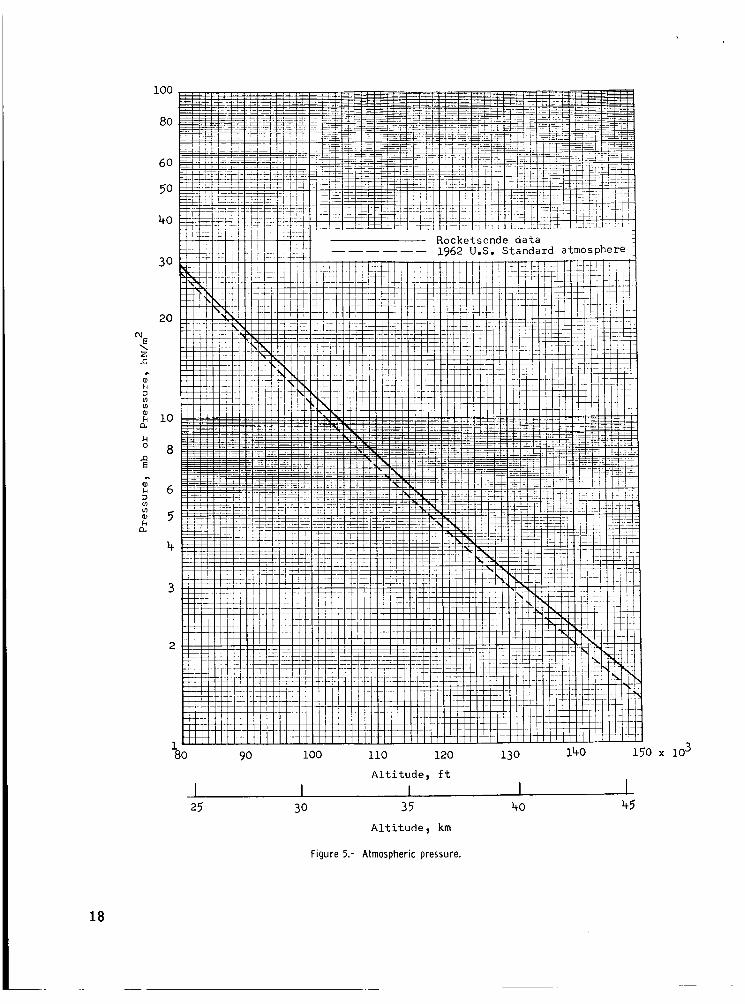
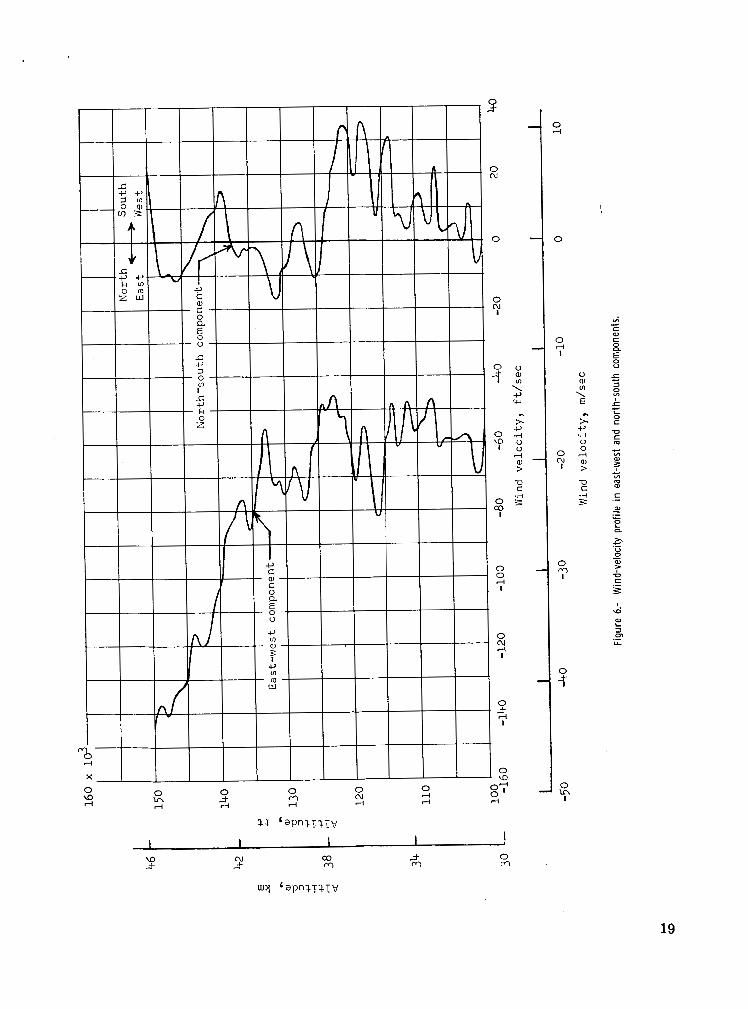
Atmospheric conditions were obtained near the t ime of test by means of an Arcasonde sounding rocket flight approximately 1 hour af ter spacecraft re lease from the balloon system. Temperature and wind dr i f t were measured. and pressure deduced from these measurements are presented in figures 4 and 5,
Atmospheric density
6
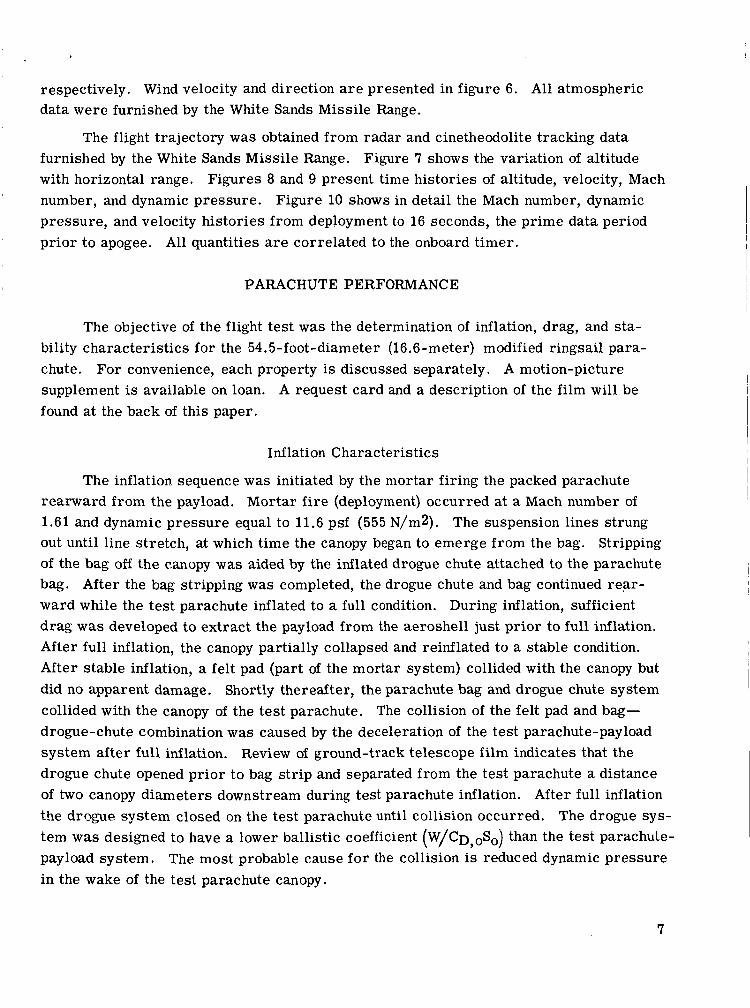
respectively. Wind velocity and direction a r e presented in figure 6. All atmospheric data were furnished by the White Sands Missile Range.
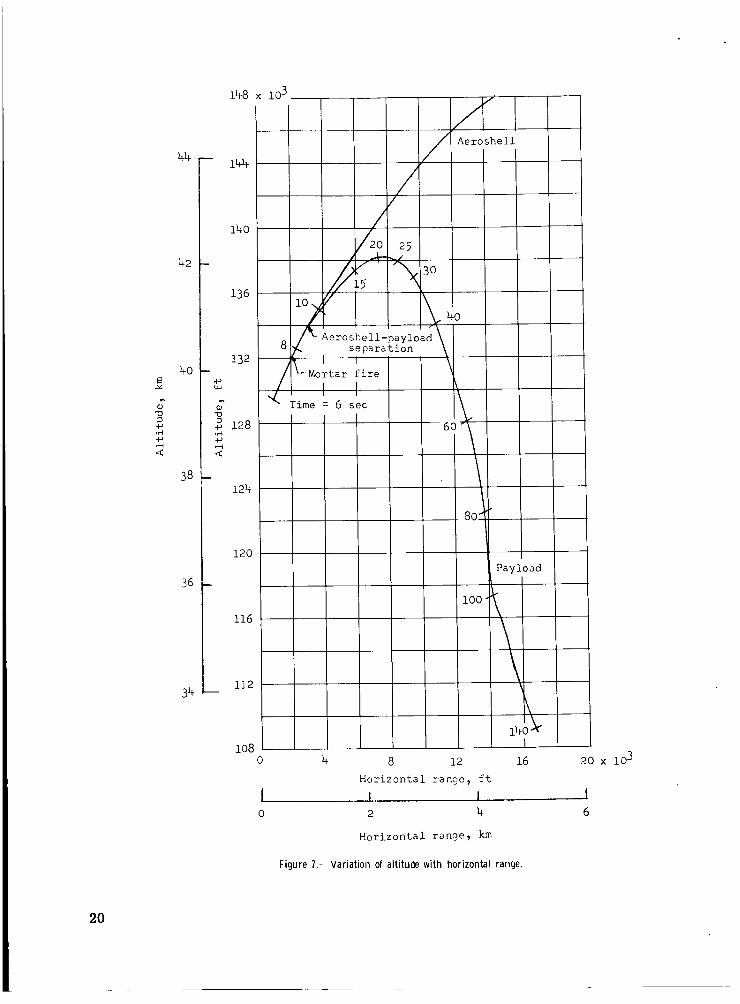
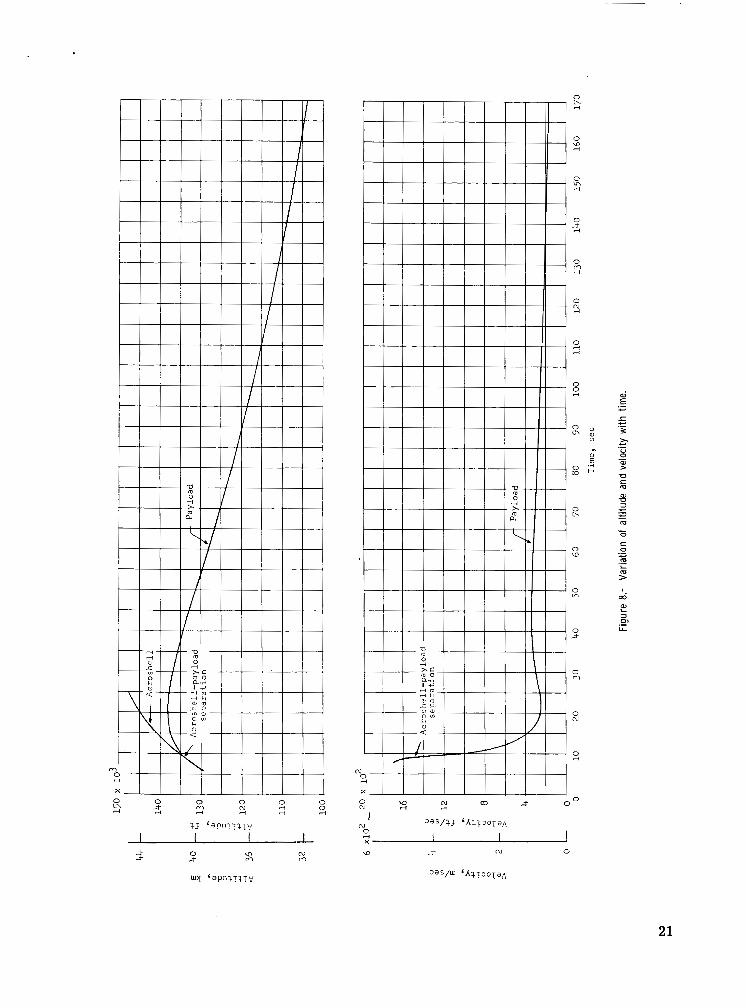
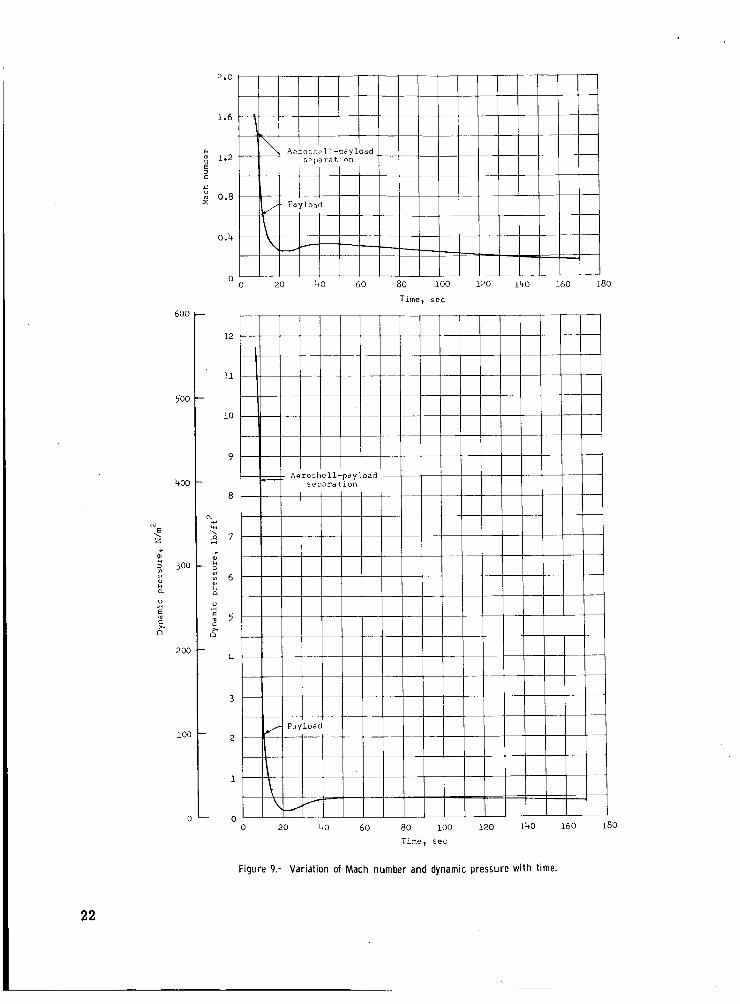
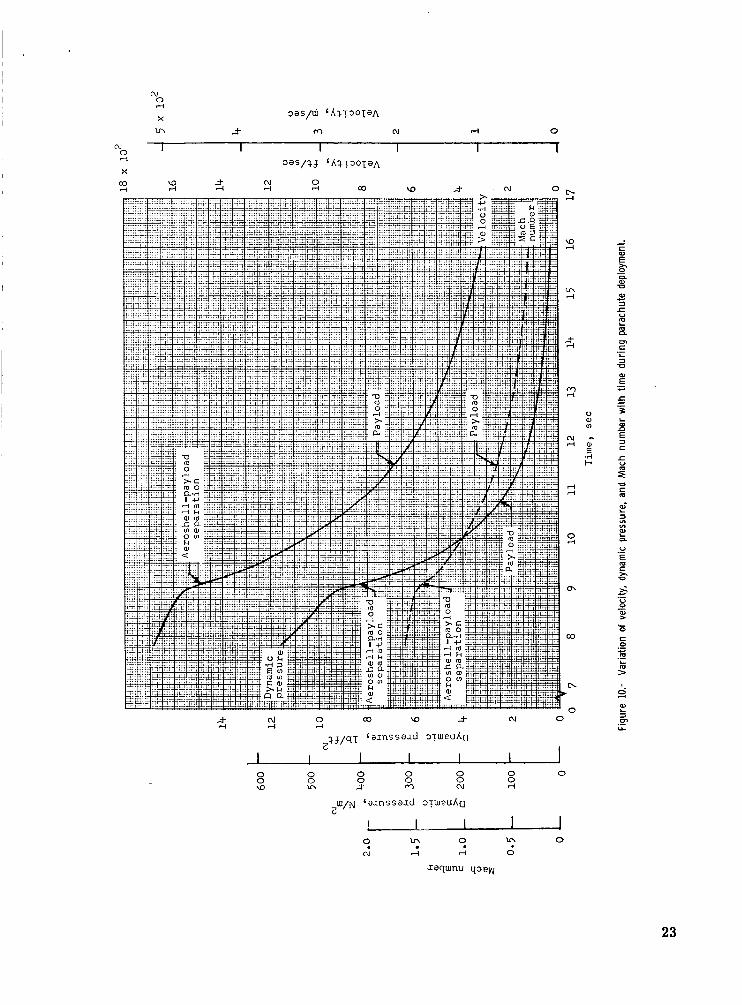
The flight trajectory was obtained from radar and cinetheodolite tracking data furnished by the White Sands Missile Range. Figure 7 shows the variation of altitude with horizontal range. Figures 8 and 9 present time histories of altitude, velocity, Mach number, and dynamic pressure. Figure 10 shows in detail the Mach number, dynamic pressure, and velocity histories from deployment to 16 seconds, the prime data period prior to apogee. All quantities are correlated to the onboard t imer.
PARACHUTE PERFORMANCE
The objective of the flight test w a s the determination of inflation, drag, and sta- bility characteristics for the 54.5-foot-diameter (16.6-meter) modified ringsail para- chute. For convenience, each property is discussed separately. A motion-picture supplement is available on loan. A request card and a description of the film will be found at the back of this paper.
Inflation Characteristics
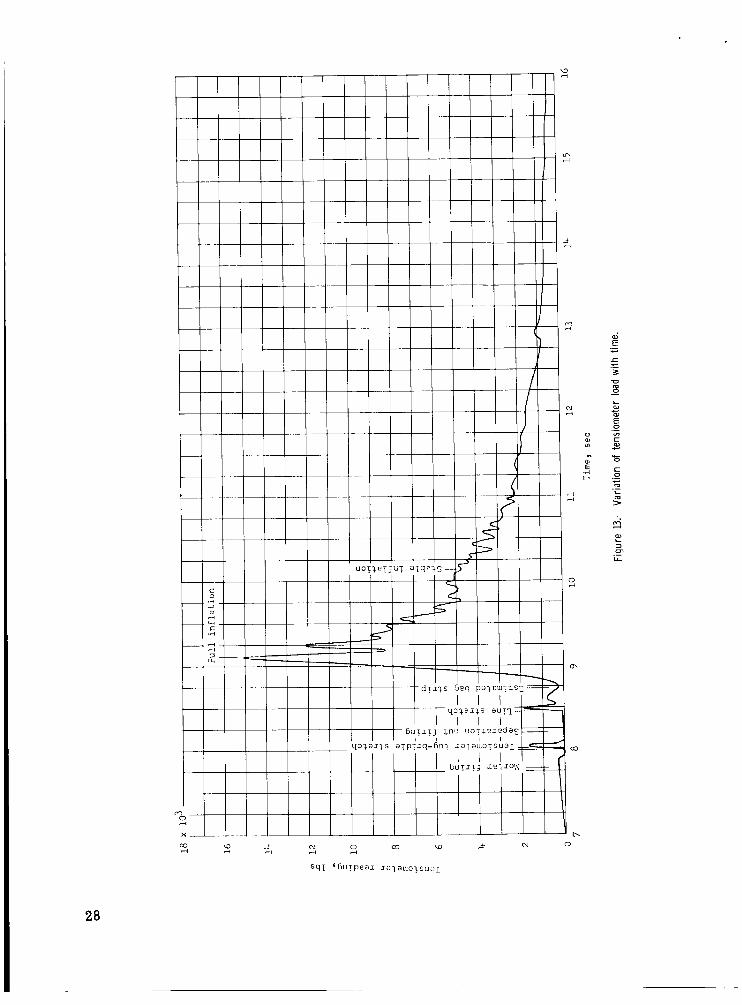
The inflation sequence was initiated by the mortar firing the packed parachute rearward from the payload. Mortar f i re (deployment) occurred at a Mach number of 1.61 and dynamic pressure equal to 11.6 psf (555 N/m2). The suspension lines strung out until line stretch, at which time the canopy began to emerge from the bag. Stripping of the bag off the canopy w a s aided by the inflated drogue chute attached to the parachute bag. After the bag stripping was completed, the drogue chute and bag continued rear- ward while the test parachute inflated to a full condition. During inflation, sufficient drag was developed to extract the payload from the aeroshell just prior to full inflation. After full inflation, the canopy partially collapsed and reinflated to a stable condition. After stable inflation, a felt pad (part of the mortar system) collided with the canopy but did no apparent damage. Shortly thereafter, the parachute bag and drogue chute system collided with the canopy of the test parachute. The collision of the felt pad and bag- drogue-chute combination was caused by the deceleration of the test parachute-payload system after full inflation. Review of ground-track telescope film indicates that the drogue chute opened prior to bag strip and separated from the test parachute a distance of two canopy diameters downstream during test parachute inflation. After full inflation the drogue system closed on the test parachute until collision occurred. The drogue sys- tem was designed to have a lower ballistic coefficient (W/CD,~S~) than the test parachute- payload system. The most probable cause for the collision is reduced dynamic pressure in the wake of the test parachute canopy.
7
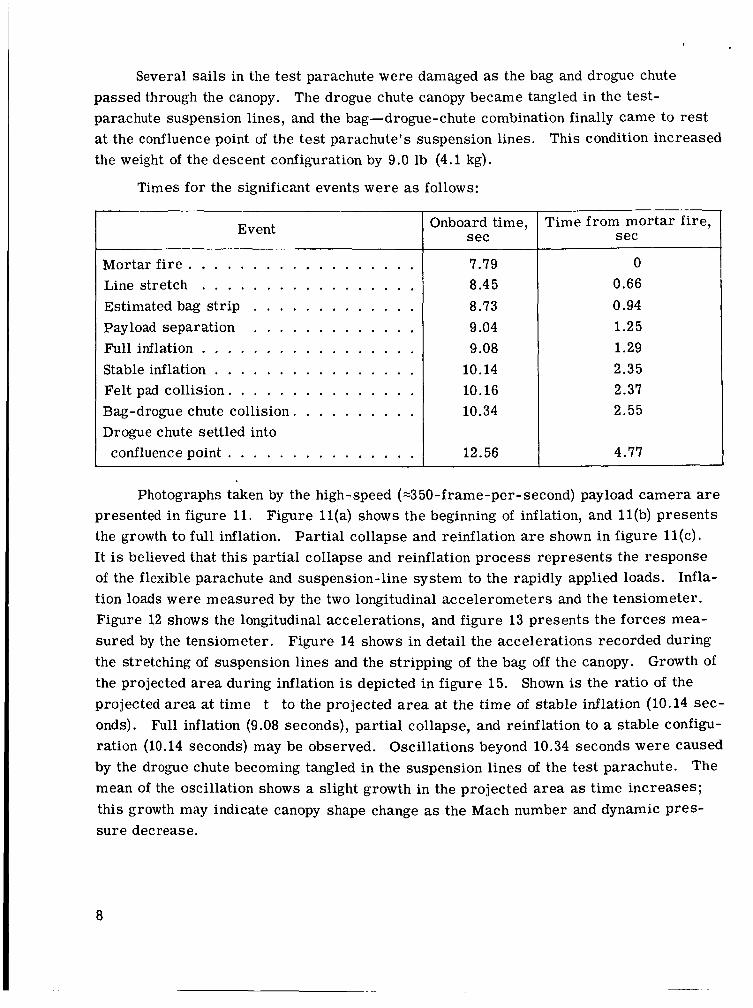
Several sails in the test parachute were damaged as the bag and drogue chute passed through the canopy. The drogue chute canopy became tangled in the test- parachute suspension lines, and the bag-drogue-chute combination finally came to rest at the confluence point of the test parachute's suspension lines. This condition increased the weight of the descent configuration by 9.0 lb (4.1 kg).
Times for the significant events were as follows:
Event
Mortar f i r e . . . . . . . . . . . . . . . . . . Line stretch . . . . . . . . . . . . . . . . . Estimated bag st r ip . . . . . . . . . . . . . Payload separation . . . . . . . . . . . . . Full inflation . . . . . . . . . . . . . . . . . Stable inflation . . . . . . . . . . . . . . . . Felt pad collision. . . . . . . . . . . . . . .
Onboard time, s ec
7.79 8.45 8.73 9.04 9.08
10.14 10.16 10.34
12.56
Time from mortar fire, sec
0 0.66 0.94 1.25 1.29 2.35 2.37 2.55
4.77
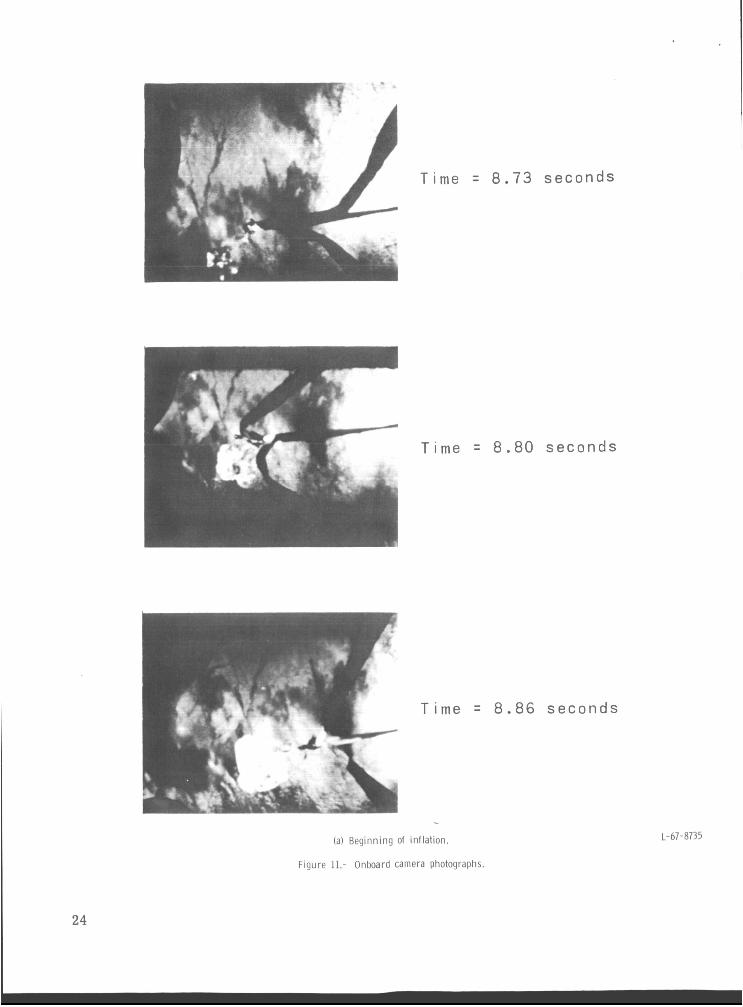
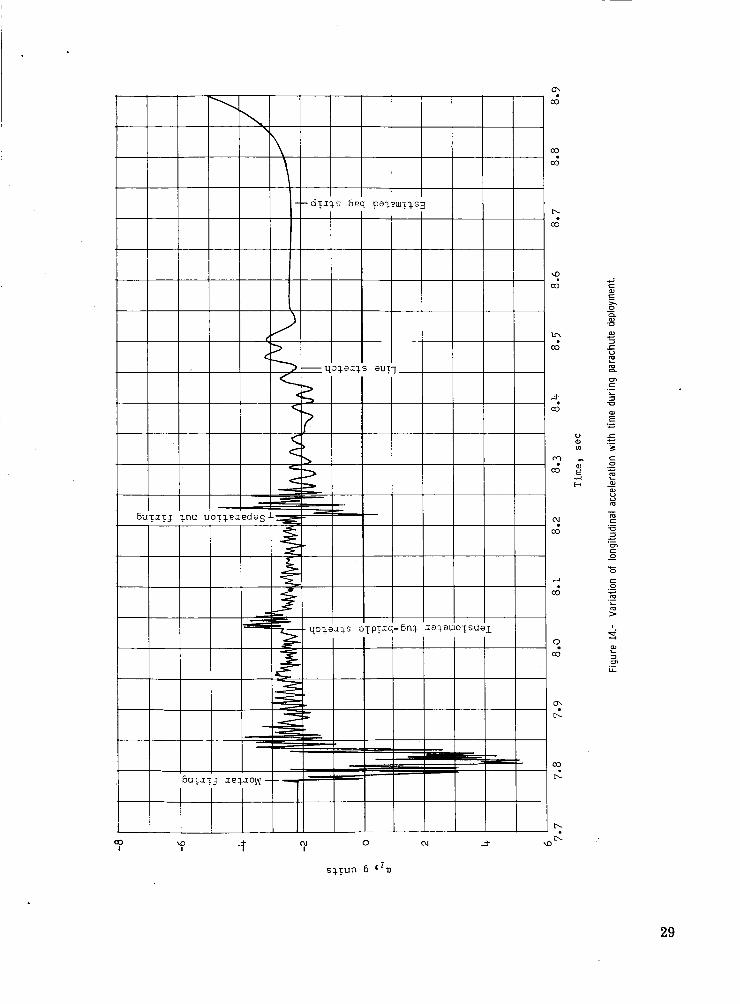
Photographs taken by the high-speed (-350-frame-per-second) payload camera are Figure ll(a) shows the beginning of inflation, and l l(b) presents presented in figure 11.
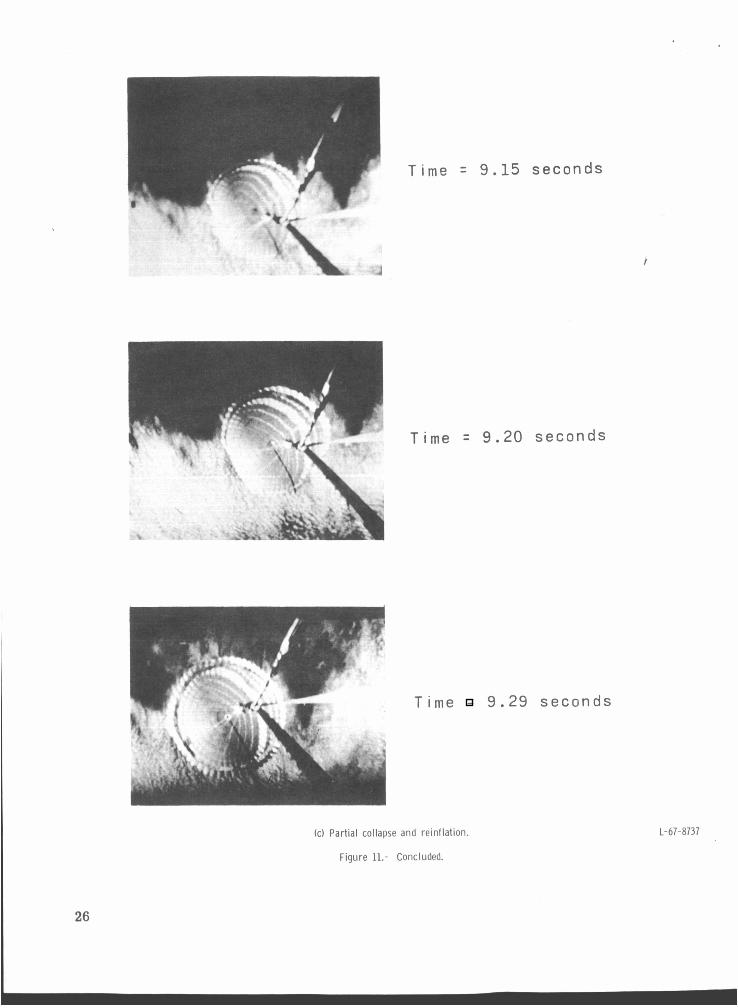
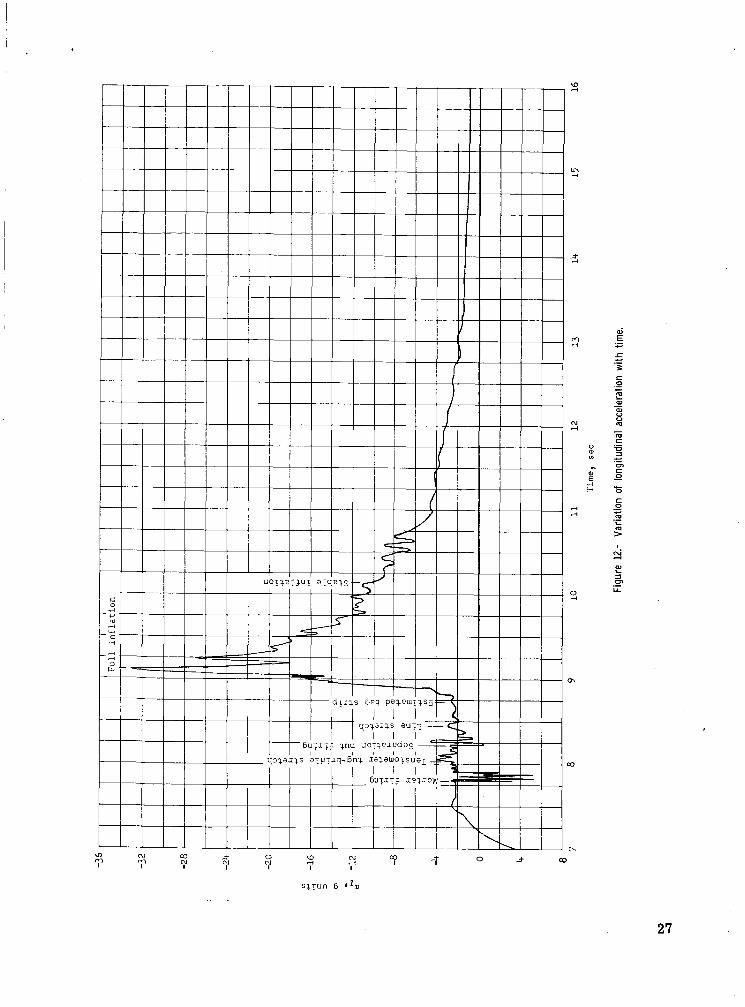
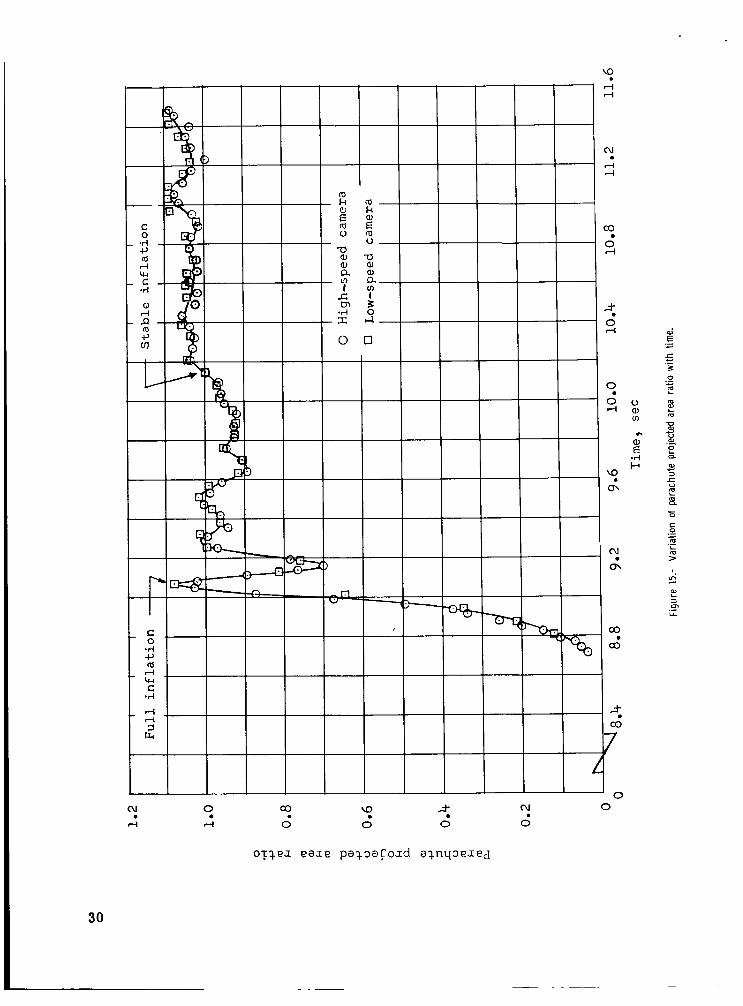
the growth to full inflation. Partial collapse and reinflation are shown in figure l l (c) . It is believed that this partial collapse and reinflation process represents the response of the flexible parachute and suspension-line system to the rapidly applied loads. Infla- tion loads were measured by the two longitudinal accelerometers and the tensiometer. Figure 12 shows the longitudinal accelerations, and figure 13 presents the forces mea- sured by the tensiometer. Figure 14 shows in detail the accelerations recorded during the stretching of suspension lines and the stripping of the bag off the canopy. Growth of the projected area during inflation is depicted in f igure 15. Shown is the ratio of the projected area at time t to the projected area at the t ime of stable inflation (10.14 sec- onds). Full inflation (9.08 seconds), partial collapse, and reinflation to a stable configu- ration (10.14 seconds) may be observed. Oscillations beyond 10.34 seconds were caused by the drogue chute becoming tangled in the suspension lines of the test parachute. The mean of the oscillation shows a slight growth in the projected area as time increases; this growth may indicate canopy shape change as the Mach number and dynamic Pres- su re decrease.
8
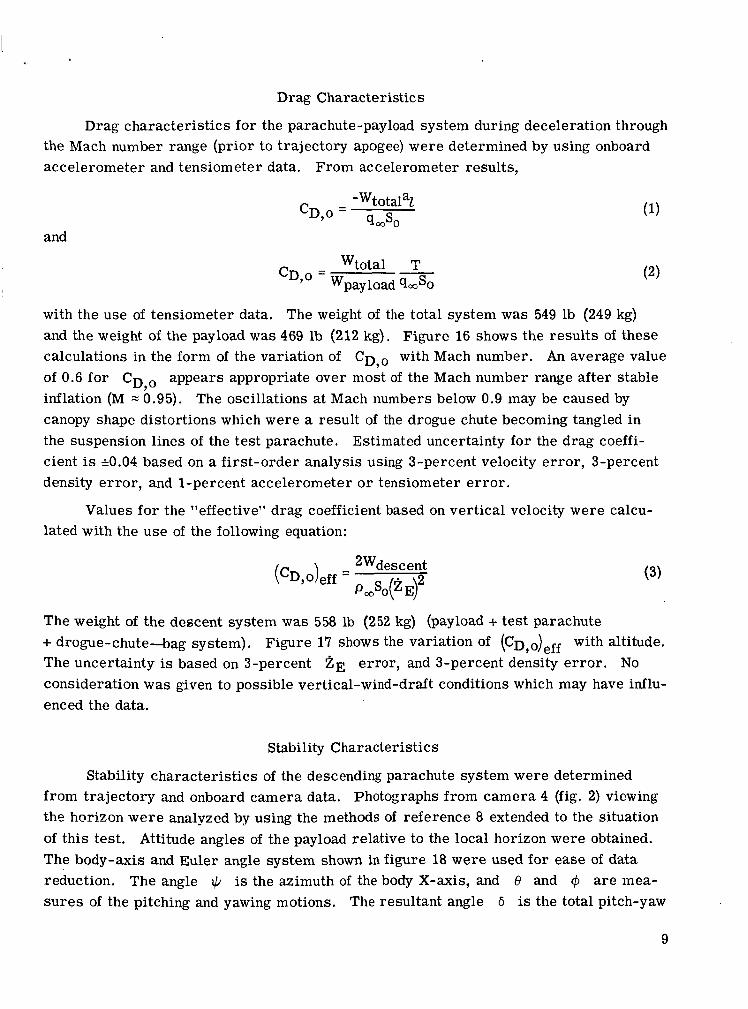
Drag Characteristics
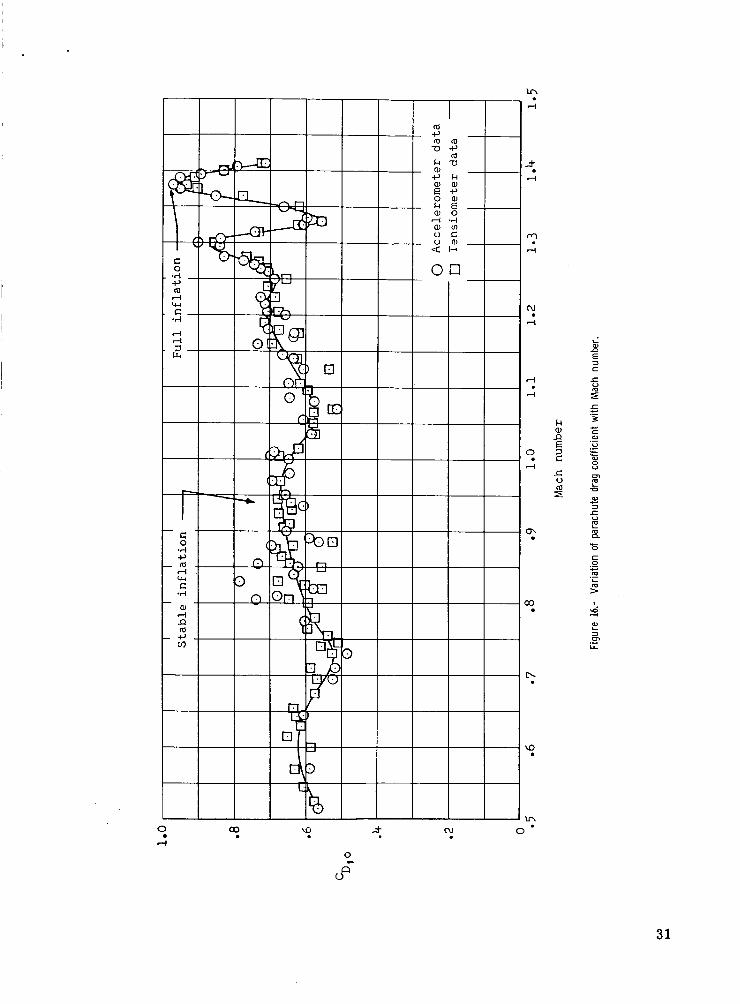
Drag characteristics for the parachute-payload system during deceleration through the Mach number range (prior to trajectory apogee) were determined by using onboard accelerometer and tensiometer data. From accelerometer results,
and
with the use of tensiometer data. The weight of the total system was 549 lb (249 kg) and the weight of the payload was 469 lb (212 kg). Figure 16 shows the results of these calculations in the form of the variation of C D , ~ with Mach number. An average value of 0.6 for CD,o appears appropriate over most of the Mach number range after stable inflation (M =: 0.95). The oscillations at Mach numbers below 0.9 may be caused by canopy shape distortions which were a result of the drogue chute becoming tangled in the suspension lines of the test parachute. Estimated uncertainty for the drag coeffi- cient is 50.04 based on a first-order analysis using 3-percent velocity e r ror , 3-percent density e r ror , and l-percent accelerometer or tensiometer e r ro r .
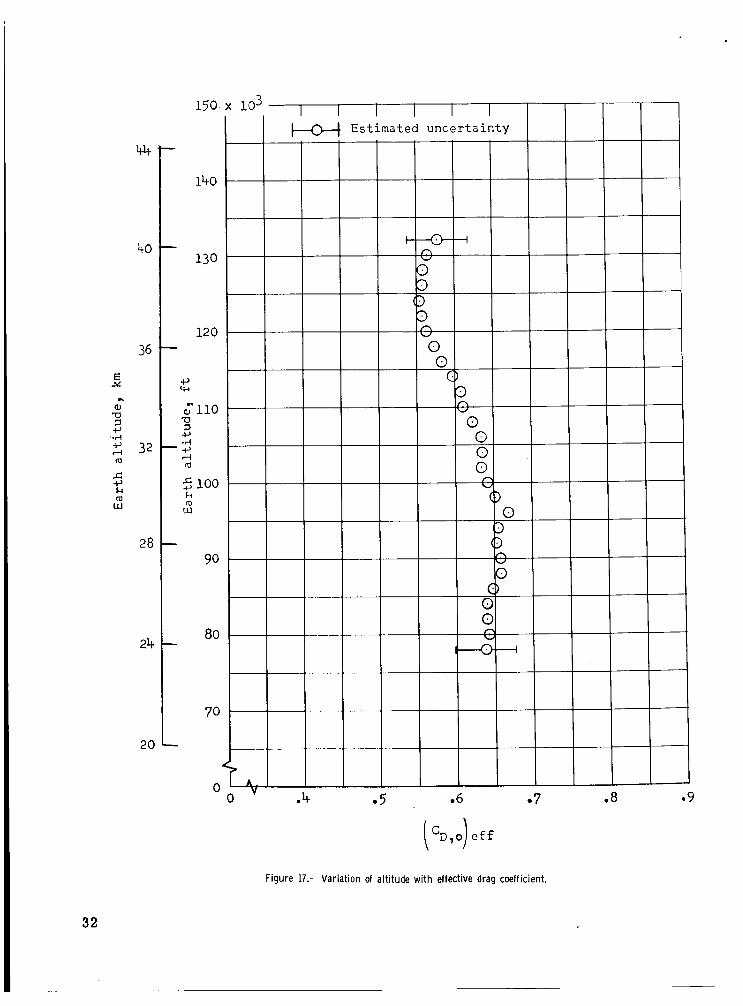
Values for the "effective" drag coefficient based on vertical velocity were calcu- lated with the use of the following equation:
The weight of the descent system w a s 558 lb (252 kg) (payload + tes t parachute + drogue-chute-bag system). Figure 17 shows the variation of ( C D , ~ ) ~ ~ ~ with altitude. The uncertainty is based on 3-percent ZE error, and 3-percent density e r ro r . No consideration was given to possible vertical-wind-draft conditions which may have influ- enced the data.
Stability Characteristics
Stability characteristics of the descending parachute system were determined from trajectory and onboard camera data. Photographs from camera 4 (fig. 2) viewing the horizon were analyzed by using the methods of reference 8 extended to the situation of this test. Attitude angles of the payload relative to the local horizon were obtained. The body-axis and Euler angle system shown in figure 18 were used for ease of data reduction. The angle 1c/ is the azimuth of the body X-axis, and 8 and c$ are mea- s u r e s of the pitching and yawing motions. The resultant angle 6 is the total pitch-yaw
9
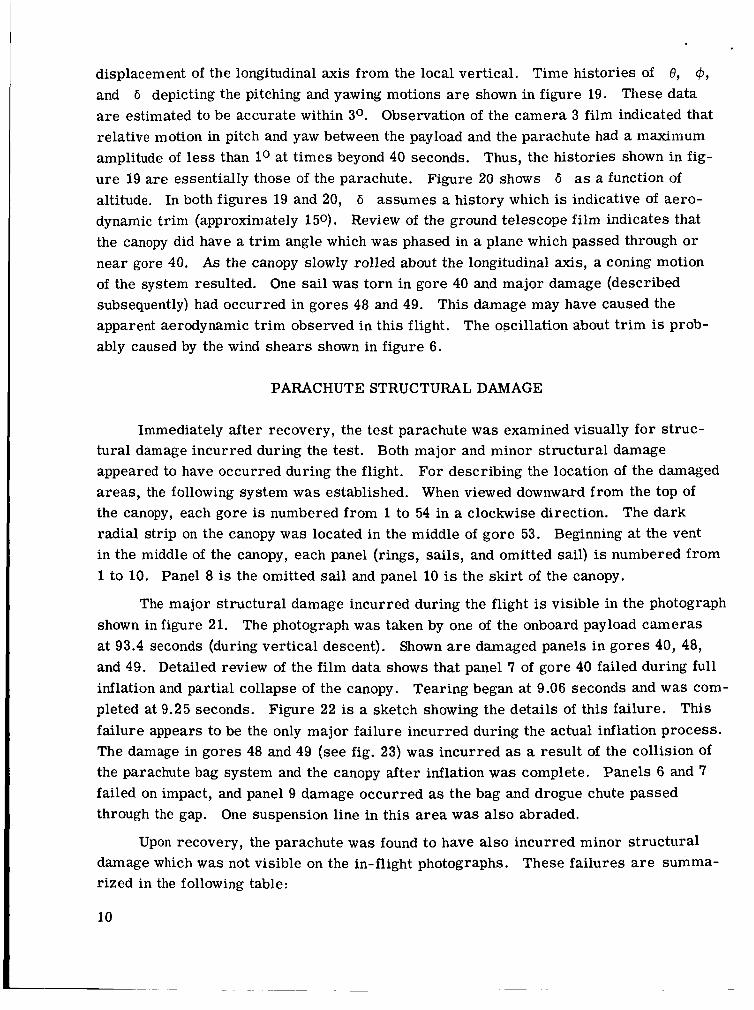
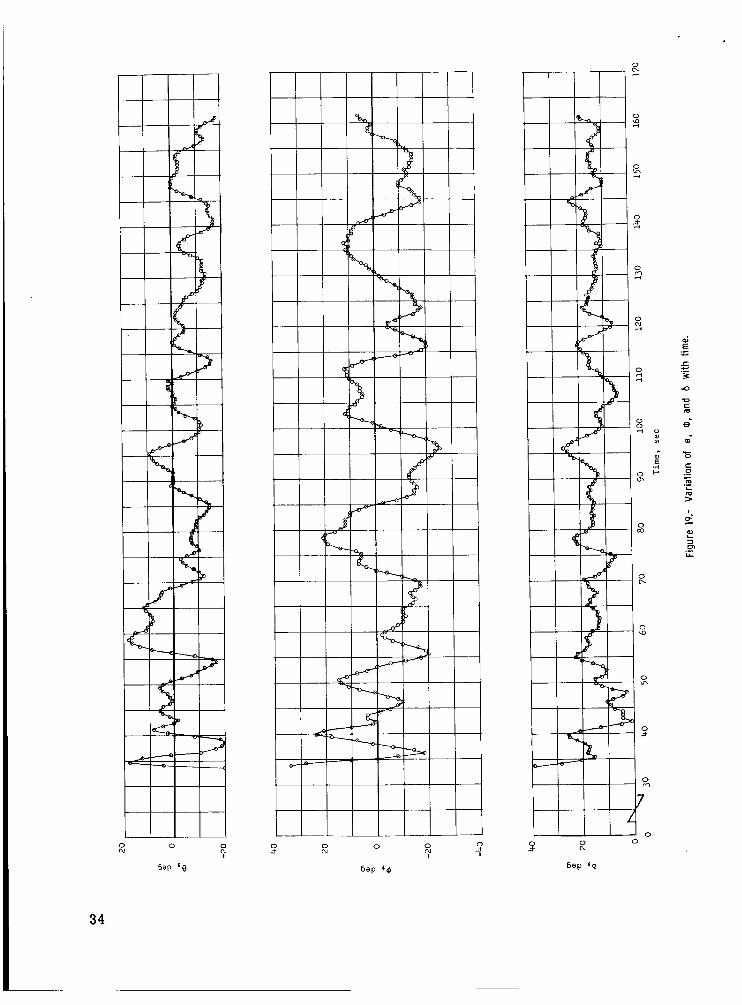
displacement of the longitudinal axis from the local vertical. Time histories of 8, @,
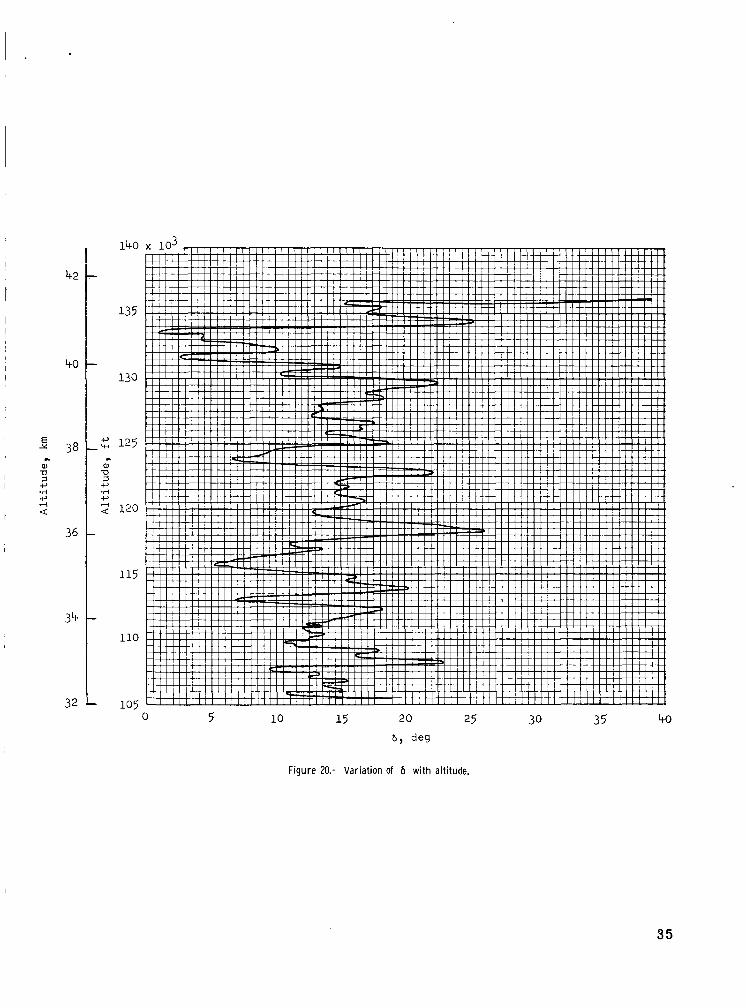
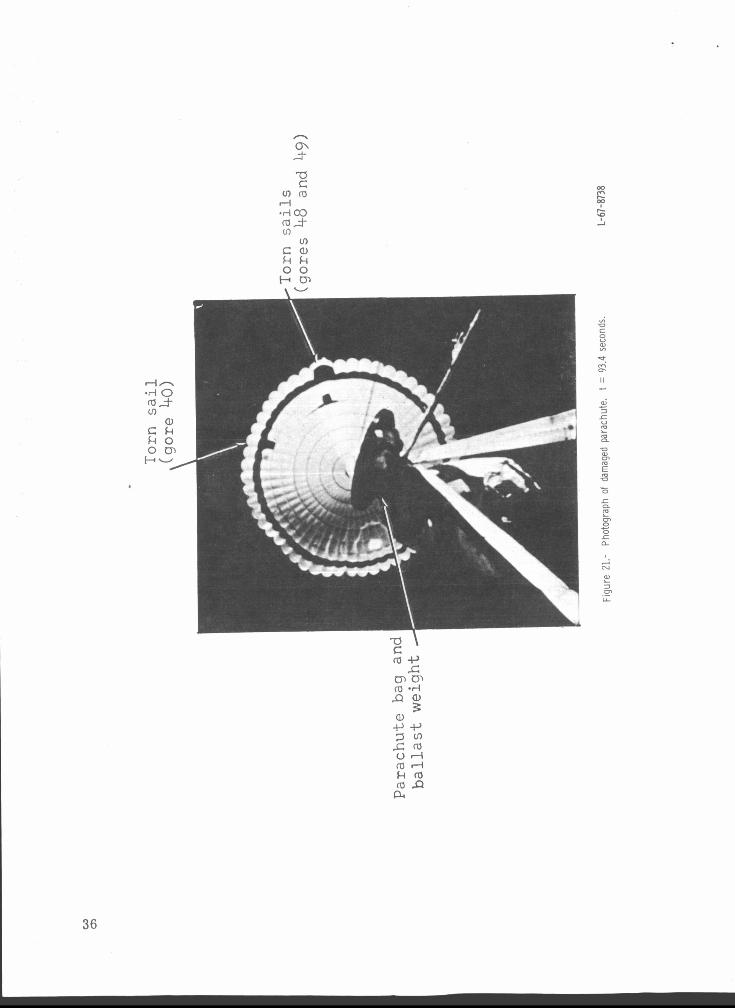
and 6 depicting the pitching and yawing motions a r e shown in figure 19. These data a r e estimated to be accurate within 3O. Observation of the camera 3 film indicated that relative motion in pitch and yaw between the payload and the parachute had a maximum amplitude of less than lo at t imes beyond 40 seconds. Thus, the histories shown in fig- ure 19 a re essentially those of the parachute. Figure 20 shows 6 as a function of altitude. In both figures 19 and 20, 6 assumes a history which is indicative of aero- dynamic t r im (approximately 150). Review of the ground telescope film indicates that the canopy did have a t r im angle which was phased in a plane which passed through or near gore 40. As the canopy slowly rolled about the longitudinal axis, a coning motion of the system resulted. One sail was torn in gore 40 and major damage (described subsequently) had occurred in gores 48 and 49. This damage may have caused the apparent aerodynamic t r im observed in this flight. The oscillation about t r im is prob- ably caused by the wind shears shown in figure 6.
PARACHUTE STRUCTURAL DAMAGE
Immediately after recovery, the test parachute was examined visually f o r struc- tural damage incurred during the test. Both major and minor structural damage appeared to have occurred during the flight. For describing the location of the damaged areas , the following system was established. When viewed downward from the top of the canopy, each gore is numbered from 1 to 54 in a clockwise direction. The dark radial strip on the canopy w a s located in the middle of gore 53. Beginning at the vent in the middle of the canopy, each panel (rings, sails, and omitted sail) is numbered f rom 1 to 10. Panel 8 is the omitted sail and panel 10 is the skir t of the canopy.
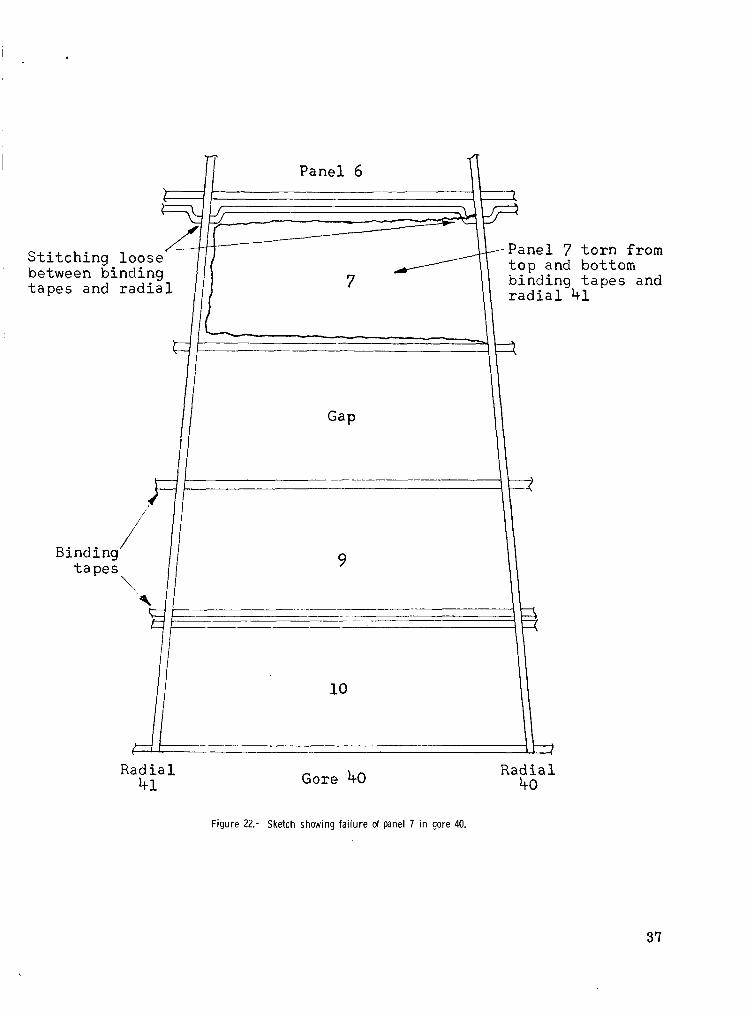
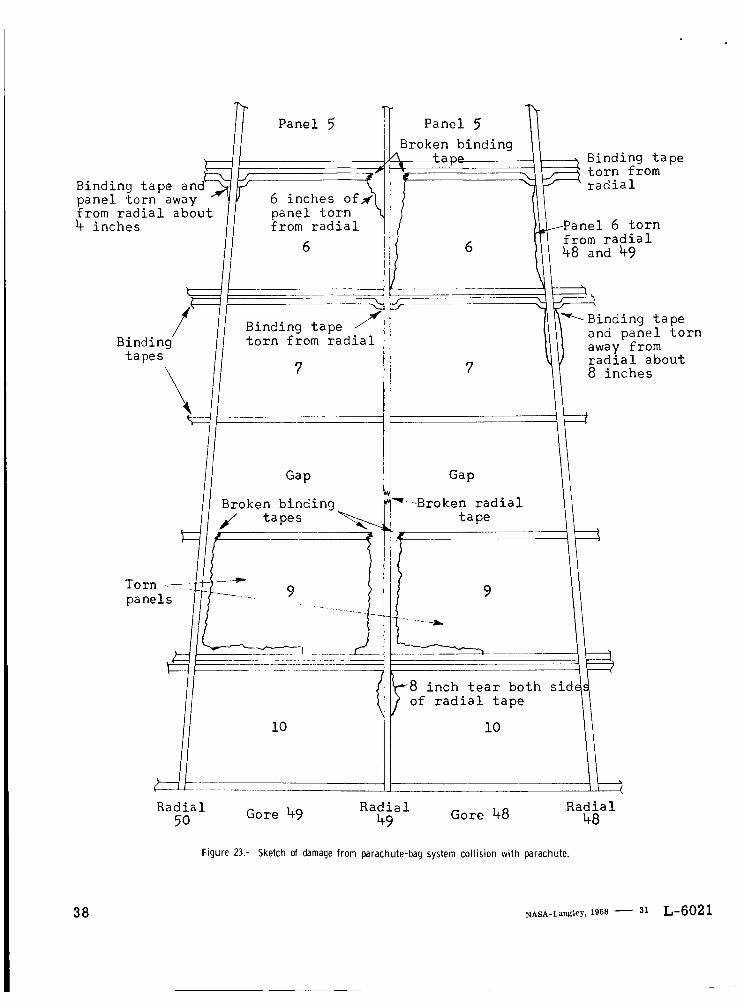
The major structural damage incurred during the flight is visible in the photograph shown in figure 21. The photograph w a s taken by one of the onboard payload cameras at 93.4 seconds (during vertical descent). Shown are damaged panels in gores 40, 48, and 49. Detailed review of the film data shows that panel 7 of gore 40 failed during full inflation and partial collapse of the canopy. Tearing began at 9.06 seconds and was com- pleted at 9.25 seconds. Figure 22 is a sketch showing the details of this failure. This failure appears to be the only major failure incurred during the actual inflation process. The damage in gores 48 and 49 (see fig. 23) was incurred as a result of the collision Of
the parachute bag system and the canopy after inflation was complete. Panels 6 and 7 failed on impact, and panel 9 damage occurred as the bag and drogue chute passed through the gap. One suspension line in this area was also abraded.
Upon recovery, the parachute was found to have also incurred minor structural damage which w a s not visible on the in-flight photographs. These failures a r e summa- rized in the following table:
10
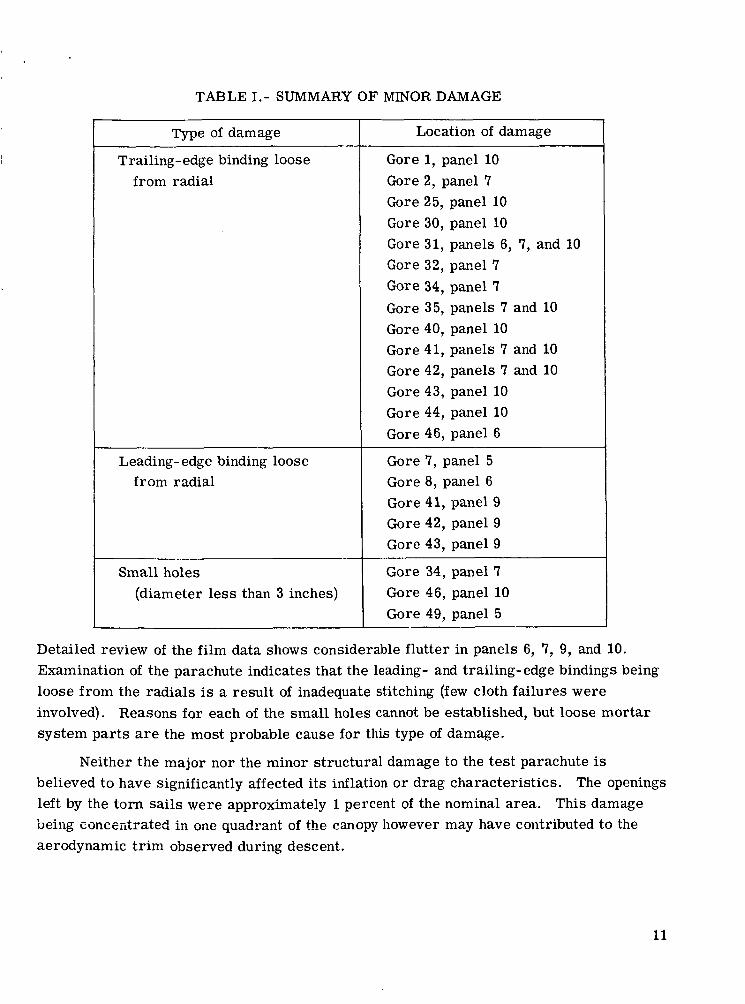
TABLE I.- SUMMARY O F MINOR DAMAGE
Type of damage Location of damage
Trailing-edge binding loose from radial
Leading- edge binding loose from radial
Small holes (diameter less than 3 inches)
Gore 1, panel 10 Gore 2, panel 7 Gore 25, panel 10 Gore 30, panel 10 Gore 31, panels 6, 7, and 10 Gore 32, pmel ? Gore 34, panel 7 Gore 35, panels 7 and 10 Gore 40, panel 10 Gore 41, panels 7 and 10 Gore 42, panels 7 and 10 Gore 43, panel 10 Gore 44, panel 10 Gore 46, panel 6
Gore 7, panel 5 Gore 8, panel 6 Gore 41, panel 9 Gore 42, panel 9 Gore 43, panel 9
Gore 34, panel 7 Gore 46, panel 10 Gore 49, panel 5
Detailed review of the film data shows considerable flutter in panels 6, 7, 9, and 10. Examination of the parachute indicates that the leading- and trailing- edge bindings being loose f rom the radials is a result of inadequate stitching (few cloth failures were involved). Reasons for each of the small holes cannot be established, but loose mortar system par t s a r e the most probable cause for this type of damage.
Neither the major nor the minor structural damage to the test parachute is believed to have significantly affected its inflation o r drag characteristics. left by the torn sails were approximately 1 percent of the nominal area. This damage ueiiig concentrated in one cpadrant of the canopy however may have contributed to the aerodynamic t r im observed during descent.
The openings
,. -.
11
CONCLUDING REMARKS
Inflation, drag, and stability characteristics of a 54.5-foot nominal-diameter (16.6-meter) ringsail parachute were obtained from the third flight of the balloon- launched ser ies of the Planetary Entry Parachute Program. Deployment occurred at Mach number 1.6 and at a dynamic pressure of 11.6 psf (555 N/m2). After the stretching of the suspension line and the stripping of the bag off the canopy, the parachute inflated rapidly to a full condition. a stable condition. After stable inflation, the parachute bag and attached drogue chute collided with and passed through the canopy of the test parachute, Several sails were torn in the test parachute, but this damage did not appear to have a significant effect on i ts inflation and drag characteristics. After inflation, the ringsail parachute developed an average drag coefficient near 0.6 based on nominal surface area. During descent, an aerodynamic t r im angle (approximately 15O) was observed. The phasing was such that the tr im angle was in a plane which passed through or near the major damaged areas in the canopy. parachute may have been affected by the torn sails.
The canopy then partially collapsed and reinflated quickly to
For this reason, it is concluded that the stability characterist ics of the
Langley Research Center, National Aeronautics and Space Administration,
Langley Station, Hampton, Va., December 18, 1967, 124-07-03-05-23.
REFERENCES
1. McFall, John C., Jr.; and Murrow, Harold N.: Parachute Testing at Altitudes Between 30 and 90 Kilometers. AIAA Aerodynamic Deceleration Systems Conference, Sept. 1966, pp. 116-121. '
2. Preisser, John S.; Eckstrom, Clinton V.; and Murrow, Harold N.; Flight Test of a 31.2-Foot-Diameter Modified Ringsail Parachute Deployed at a Mach Number of 1.39 and a Dynamic P res su re of 11.0 Pounds Per Square Foot. NASA TM X-1414, 1967.
3. Eckstrom, Clinton V.; and Preisser, John S.: Flight Test of a 30-Foot-Nominal- Diameter Disk-Gap-Band Parachute Deployed at a Mach Number of 1.56 and a Dynamic Pressure of 11.4 Pounds Per Square Foot. NASA TM X-1451, 1967.
4. Eckstrom, Clinton V.; Murrow, Harold N.; and Pre isser , John S.: Flight Test of a 40- Foot-Nominal-Diameter Modified Ringsail Parachute Deployed at a Mach Number of 1.64 and a Dynamic P res su re of 9.1 Pounds Per Square Foot. NASA TM X-1484, 1967.
5. Whitlock, Charles H.; Bendura, Richard J.; and Coltrane, Lucille C.: Performance of a 26-Meter-Diameter Ringsail Parachute in a Simulated Martian Environment. NASA TM X-1356, 1967.
6. Bendura, Richard J.; Huckins, Earle K., 111; and Coltrane, Lucille C.: Performance of a 19.7-Meter-Diameter Disk-Gap-Band Parachute in a Simulated Martian Environment. NASA TM X- 1499, 1967.
7. Darnell, Wayne L.; Henning, Allen R.; and Lundstrom, Reginald R.: Flight Test of a 15-Foot-Diameter (4.6 Meter) 120° Conical Spacecraft Simulating Parachute Deployment in a Mars Atmosphere. NASA TN D-4266, 1967.
8. Anon.: Manual of Photogrammetry. Sec. ed., American SOC. Photogrammetry, c.1952.
13
1 5 7 / 8 Parachute center
1 1 5 / 1 6 -+ +i- p32 3 / 4
Slot
thru 9
Ring panel
1 / 8 in
‘-1- Sail
---- Radial tape
Sail number
4 2 3 4 f t -
(210.4 m)
f - ’ - - (8th sail removed) 12.7 ft
(3.87 m)
4 ft
-i
I Flight configuration
Gore dimensional details
Figure 1.- Sketch showing a typical gore and the parachute-payload configuration. The gore dimensions are average measured dimensions. Dimensions are i n inches unless otherwise noted.
14
. .
Drogue p a r a c h u t e -L
B a l l a s t and l i d cover,, Q P a r a c h u t e -bag 1 system
Payload
Frustum -
J P a r a c h u t e bag -&/
S u s p e n s i o n l i n e s
Payload c e n t e r of g r a v i t y
c y l i n d e r j u n c t u r e __t
Camera 1
0 - 1 - I ’ 1 Payload
5 P a r a c h u t e
A e r o s h e 11 I Figure 2.- Sketch of spacecraft components.
- - . - . -
15
16
2 I
lo-' i
6 i .rl m k a, a. Q 3
lo-.
8
6
10'
10- 80 100 110 120 130 140 150 103
A l t i t u d e , f t I
- / 9< 30 35 40 45 A l t i t u d e , krn
Figure 4.- Atmospheric density.
17
100
80
60
50
40
20
.. m 3 ul
a E CI
P E
0,
1 ul a,
a
..
10
8
3
2
80 90 100 110 120 130 140 150 103 1
A l t i t u d e , ft I I I 25 30 35 40 45
A l t i t u d e , km
Figure 5.- Atmospheric pressure.
18
19
44
42
40 E Y
38
36
34
148 X
- 144
140
136
132
128
124
120
116
112
108 0 4 8 12 16 20 x 103
1 I 1 I H o r i z o n t a l r a n g e , f t
0 2 4 6
H o r i z o n t a l r a n g e , km
Figure 7.- Variation of altitude with horizontal range.
20
0 c m
al n 3
E m c .- c 0
c 0 m .- c
I .- 5
21
600
500
400
N E \ z
0 I
2 300 “7 aJ
2
5 U .3
>.
200
100
0
22
2.0
1.6
I-r
E C
C
p” 1.2
2 0.8
0.4
0 0 20 40 60 80 100 120 140 160 180
12
11
10
9
8
N + ’u \
0 7 rl
0) L - a
z 6 L a
U .3
5 5 z cl
4
3
- 2
1
0 - 80 100 120 140 160 180 T i m e , sec
0 20 40 60
Figure 9.- Variation of Mach number and dynamic pressure with time.
0 a, a
0 0 0 0 0 0
rl 0 rr) (u
0 0
0 0 0 0 v) Ih 3-
U c m
2: c .- U 0
m > -
c 0 .- c
L m .- 5
23
6
m e - - '1
T i m e = 8.73 s e c o n d s
T i m e = 8.80 s e c o n d s
T i m e = 8 .86 s e c o n d s
- (a) Beg inn ing of i n f l a t i on .
F igu re 11.- Onboard camera photographs.
24
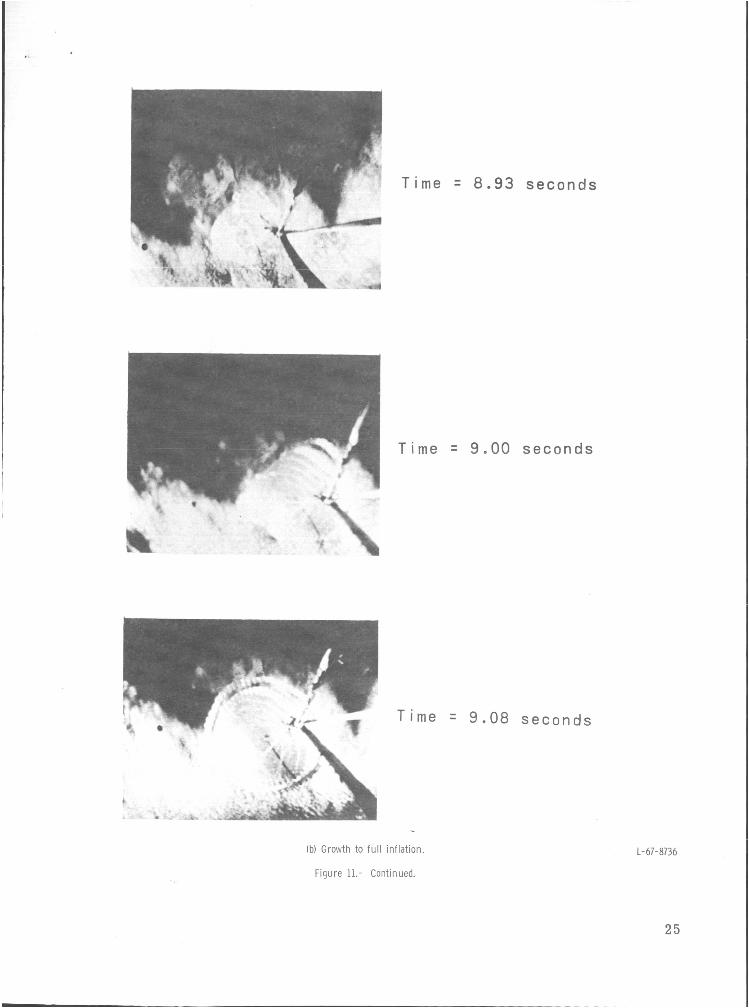
T i m e
T i m e
T i m e
~
(bl Growth to full inf lat ion
Figure 11.- Continued.
= 8.93 s e c o n d s
= 9.00 s e c o n d s
= 9.08 s e c o n d s
L-67-8736
25
26
T i m e = 9.15 s e c o n d s
T i m e = 9.20 s e c o n d s
T i m e 9.29 s e c o n d s
(c) Part ia l collapse a n d reinf lat ion.
F igu re 11.- Concluded.
L-67-8737
27
L W c OI
.- 5 o m m c “ 3 . . c m o 5 5 .- c m
L m .- >
29
30
31
44
40
36
E 24
aJ -0 3 +
..A
0.
2 32 03
J: iJ k m
W
28
24
20
32
Figure 17.- Variation of altitude w i th effective drag coefficient.
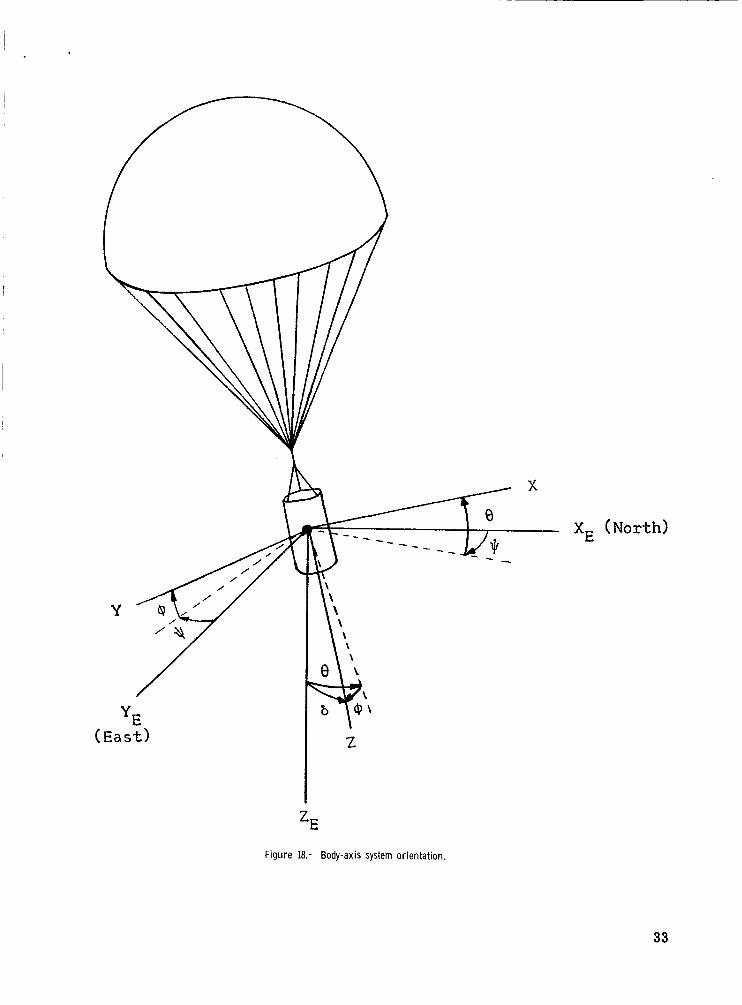
Figure 18.- Body-axis system orientation.
(North)
33
0 N 0 0 N
‘ e
34
I .
42
40
38
36
34
32
140
135
130
125
120
115
110
Figure 20.- Variation of 6 with altitude.
35
U
._ Y
bA
36
7
I
9 Binding t a p e s
\ .-
;Q ____ c
__ -
-4
t
10
Figure 22.- Sketch showing failure of panel 7 i n gore 40.
37
Binding t a p e p a n e l t o r n away from r a d i a l a b o u t pane l t o r n 4 i n c h e s f rom r a d i a l
Binding t a p e 2 Binding t o r n from r a d i a l
38
I
Broken b i n d i n g
10
%
P a n e l 5 Broken b i n d i n g
\ +an@ Binding t a p e . 4 t o r n from r a d i a l
,,Panel 6 t o r n from r a d i a l
I I 6 48 and 49
. -
and p a n e l t o r n away f rom r a d i a l a b o u t
7 i n c h e s
-Broken r a d i a l t a p e
9
4-8 i n c h t e a r b o t h s i d of r a d i a l t a p e
10
Gore 49 50 Gore 48 R a d i a l
49 R a d i a l
48
Figure 23.- Sketch of damage from parachute-bag system coll ision wi th parachute.
NASA-Langley, 1968 - 31 L-6021
A motion-picture film supplement L-984 is available on loan. Requests will be filled in the order received. You will be notified of the approximate date scheduled.
The film (16 mm, 4 min, color, silent) shows parachute deployment, inflation, and payload separation.
Requests for the film should be addressed to:
Chief, Photographic Division NASA Langley Research 8 . Center Langley Station Hampton, Va. 23365
Date Please send, on loan, copy of film supplement L-984 to
I TM X-1500 I
I I Name of organization I
I
I Street number
1 City and State Zip code
I
I
Attention: M r . I Title I
Chief, Photographic Division NASA Langley Research Center Langley Station Hampton, Va. 23365
_ _ _ _ _ _ _ _ _ _ - _ _ _ _ _ - - _ _ - _ _ - _ _ - - - - - - - - - El I
I
I
I
I
I
I
I
I
I
I
I
I
I
I
I
I
L
<'The aerotkautical and space activities of the United States shall be conducted so a.r to contribwte . . . to the expansion of human Rnowl- edge of phenomena in the UtmoJphere and space. The Admittistration sbdl protide for the widest practicable and appropriate dissemination of mformation concerning its activities and the results tbereof!'
-NAnONAL AERONAUTICS AND SPACB ACT OF 19SB
TECHNICAL REPORTS: Scientific and technical information considered important, complete, and a lasting contribution to existing knowledge.
TECHNICAL NOTES: Information less broad in scope but nevertheless of importance as a contribution to existing knowledge.
TECHNICAL MEMORANDUMS: Information receiving limited distribu- tion because of preliminary data, security classification, or other reasons.
CONTRACTOR REPORTS: Scientific and technical information generated under a NASA contract or grant and considered an important contribution to existing knowledge.
TECHNICAL TRANSLATIONS: Information published in a foreign language considered to merit NASA distribution in English.
SPECIAL PUBLICATIONS Information derived from or of value to NASA activities. Publications include conference proceedings, monographs, data compilations, handbooks, sourcebooks, and special bibliographies.
TECHNOLOGY UTILIZATION PUBLICATIONS: Information on tech- nology used by NASA that may be of particular interest in commercial and other non-aerospace applications. Publications include Tech Briefs, Technology Utilization Reports and Notes, and Technology Surveys.
Details on the availability of these publications may be obtained from:
4
SCIENTIFIC AND TECHNICAL INFORMATION DIVISION
NATIONAL AERONAUTICS AND SPACE ADMINISTRATION
Washington, D.C PO546