Embed Size (px)
Citation preview

NASA Contractor Report 182191 *-•
The Relationship Between ObservedFatigue Damage and LifeEstimation Models
(NASA-CR-182191): THE RELATIONSHIP B E T W E E N N88-27611OBSERVED FATIGUE D A M A G E AND LIFE ESTIMATIONMODELS Final Contractor Beport (IllinoisUniv.). 43 p CSCL 20K Onclas
G3/39 •-. 0157424\ ^
Peter Kurath and Darrell F. Socie
University of Illinois at Urbana-ChampaignUrbana, Illinois
August 1988
Prepared forLewis Research CenterUnder Grant NAG3-465
NASANational Aeronautics andSpace Administration
https://ntrs.nasa.gov/search.jsp?R=19880018227 2018-05-19T19:58:25+00:00Z

THE RELATIONSHIP BETWEEN OBSERVED FATIGUEDAMAGE AND LIFE ESTIMATION MODELS
Peter Kurath and Darrell F. SocieDepartment of Mechanical and Industrial Engineering
University of Illinois at Urbana-ChampaignUrbana, IL 61801
SUMMARY
Observations of the surface of laboratory specimens subjected to axial
and torsional fatigue loadings has resulted in the identification of three
fatigue damage phenomena; crack nucleation, shear crack growth, and tensile
crack growth. Material, microstructure, state of stress/strain, and loading
amplitude all influence which of the three types of fatigue damage occurs
during a dominant fatigue life fraction. Fatigue damage maps are employed as
to summarize the experimental observations. Appropriate bulk stress/strain
damage parameters are suggested to model fatigue damage for the dominant
fatigue life fraction. Extension of the damage map concept to more complex
loadings is presented.

NOMENCLATURE
b,t>0 Axial, torsional fatigue strength exponent
C,CQ Axial, torsional fatigue ductility exponent
E,G Axial, shear linear elastic modulus
k Biaxial material constant
Nf Cycles to failure
2N Reversals
Ay/2 Shear strain amplitude v
Ae /2 Strain amplitude normal to a shear strain direction
Ae;/2 Principal strain amplitude
At/2 Shear stress amplitude
Ao,/2 Principal stress amplitude
£f»Yf Uniaxial, torsional fatigue ductility coefficient
°f»Tf Uniaxial, torsional fatigue strength coefficient
o Mean stress normal to a shear strain directionno
o Yield stress
omax Maximum stress normal to a shear strain directionn
omax Maximum stress in the direction of the principal strain

1. INTRODUCTION
Fatigue life estimates represent one aspect of durability assessment of
components and structures. Bulk deformation models for fatigue life pre-
diction analyses include both stress-life and strain-life approaches, the
latter being more appropriate for deformations involving plastic strains.
These approaches are most often employed to assess the influence of changes in
service usage, material or local geometry on the fatigue life. The resulting
life estimate may include a substantial fatigue life fraction of micro crack
growth relative to the total fatigue life which is not adequately described by
traditional fracture mechanics approaches, as well as some long crack
growth. Often microcrack formation and growth consume the majority of the
usable fatigue life in a component or test specimen. Although both crack
formation and growth are recognized as contributing factors to the fatigue
life, bulk deformation data are often interpreted as the life to some
arbitrary crack size, and are often referred to as crack initiation
approaches.
In bulk deformation models, stresses and strains in the critical location
(usually a geometric feature) are assumed to govern the fatigue life. Cracks
are assumed to nucleate and grow in the structure in the same manner as in the
smooth laboratory specimens that are used to determine the baseline fatigue
properties. Even for the materials category of metals, no universally
acceptable fatigue damage model has been forwarded. Numerous fatigue damage
models have been formulated to relate simple laboratory tests to more complex
stress states [1,2]. Almost any of these models provides reasonable
correlation for one simple laboratory stress or strain state. For extrapo-
lation of damage models to other stress-strain states recognition of the
physical damage process is required to select the most appropriate fatigue

damage model. Material (including processing variables), stress or strain
amplitude, and state of stress are some of the factors which should influence
this choice.
1.1 Background
August Wohler, while not the first, is one of the more famous early
fatigue researchers. During the period from about 1850 to 1875, experiments
were conducted to establish a safe alternating stress below which failure
would not occur [3]. Full scale axles as well as smaller laboratory specimens
were employed to establish the endurance limit concept for design. It should
be noted that the laboratory rotating bending test which Wohler developed in
many respects mirrors the component loading. Nearly one hundred years of
research has been performed to experimentally establish the effects of the
many variables that influence the long life fatigue strength of metals.
In 1903 Ewing and Humphrey [4], motivated by the work of Wb'hler and
Bauschinger, published their classic paper. Flat fatigue specimens made from
high quality Swedish iron were tested in the annealed condition. Optical
microscopy was employed to examine the same region of the specimen at various
stages during the fatigue life. They stated, "The coarse of the breakdown was
as follows: —The first examination, made after a few reversals of the stress,
showed slip-lines on some of the crystals, ... the slip-lines were quite
similar in appearance to those which are seen when a simple tensile stress
exceeding the elastic limit is applied ... After many reversals they changed
into comparatively wide bands with rather hazily defined edges, ... As the
number of reversals increased this process of broadening continued, and some
parts of the surface became almost covered with dark markings ... When this
stage was reached it was found that some of the crystals had cracked. The

cracks occurred along broadened slipbands; in some instances they were first
seen on a single crystal, but soon they joined up from crystal to crystal,
until finally a long continuous crack was developed across the surface of the
specimen." Slip bands observed were oriented in the direction of maximum
shear stress. In addition, the authors recognized that: "Once an incipient
crack begins to form across a certain set of crystals, the effect of further
reversals is mainly confined to the neighborhood of the crack." Thus, at the
turn of the century, an understanding of the basic cause of fatigue for many
wrought metals, to-and-fro slip, was established. Later work using electron
microscopy, X-ray techniques and other powerful tools has provided further
substantiation that the basic cause of fatigue crack nucleation in many metals
is a result of alternating shear stresses and strains.
Forsyth [5] noted that slip band cracking is dependent on the shear
stress range acting on the slip plane. Therefore, it was hypothesized that
cracks would initiate in the maximum shear stress orientation, which is
referred to as Stage I cracking direction. Fatigue crack propagation can
occur on the same plane as crack initiation or it can occur on planes perpen-
dicular to the maximum principal stress. Forsyth referred to propagation
perpendicular to the maximum principal stress as Stage II cracking. This
change in cracking direction is dependent upon strain amplitude, loading mode,
state of stress, and material type.
State of stress effects were studied by several investigators with the
work of Gough [6] being noteworthy. Studies of the fatigue limit in bending
and torsion were performed and results indicated that the ratio of the fatigue
limit in torsion to that in bending varied with material tested. These
observations lead to' models that would reduce to the maximum shear stress
theory for ductile materials and the maximum principal stress theory for

brittle materials such as mild steel and cast iron, respectively. Guest [7]
also proposed a single model with a material dependent constant that could
change the theory from maximum shear stress to maximum principal stress.
These formulations were among the first to incorporate the failure mode of the
material in the damage model.
This early research showed that it is not necessary to consider the
entire fatigue process in order to make engineering estimates of the fatigue
life of a structure or component. Rather, a model that is representative of
the damage process during the majority of the fatigue life is sufficient. The
ensuing discussion will focus on the implementation of bulk deformation models
for biaxial stress-strain states. Fatigue damage observations for two
materials will be employed to justify the life analysis methods proposed.

2. FATIGUE DAMAGE
2.1 Damage Maps
Observation of the surface of a laboratory specimen subjected to cyclic
loading has been employed by many researchers [4,5,8-13] to characterize
fatigue damage. For metals, three regimes of .fatigue damage have been noted:
1) crack formation, 2) crack growth oriented with the maximum shear stress or
strain amplitude, and 3) crack growth perpendicular to the maximum principal
stress or strain amplitude. Material, loading amplitude, and stress-strain
state will influence the type of fatigue damage occurring. Different bulk
deformation stresses and/or strains may adequately characterize each of the
three types of fatigue damage observed. The dominance of one of these
phenomena should dictate the choice of bulk deformation parameters chosen for
the damage parameter.
For a given material and stress-strain state a damage map (Fig. 1) is
employed to illustrate the change in fatigue damage with fatigue life (i.e.
change in stress or strain amplitude). The vertical, axis for this plot is in
terms of fatigue life fraction and the horizontal scale represents total
fatigue life. An arbitrarily chosen surface crack dimension is employed as a
demarcation between crack formation and growth, and is represented by the
solid line. It could be argued that nucleation occurs at some other
observable dimension, but this would simply shift the line without changing
the qualitative phenomena represented by the plots. The dashed line separates
observed crack growth perpendicular to the maximum principal stress or strain
amplitude direction from crack growth along a shear direction. If any one
damage model were appropriate for the entire range of fatigue life, then the
solid and dashed lines would be horizontal. Horizontal lines in Figure 1
would imply that regardless of fatigue life, identical life fractions of crack

nucleation, shear crack growth and tensile crack growth would be observed in a
material. The fatigue analysis would then reflect the dominant, damage
mechanism. Three regions of fatigue damage are noted in these plots. In
Region A shear crack growth dominates the fatigue life fraction. Region B is
characterized by crack nucleation and perhaps some Stage I crack growth
followed by a dominant life fraction of crack growth perpendicular to the
maximum principal strain amplitude (Forsyth's Stage II cracking). Crack
nucleation is the dominant life fraction in Region C. Damage maps are
employed in the ensuing discussion to formulate appropriate damage models for
specific materials.
Detailed crack observations have been made on two materials, AISI 304
stainless steel and Inconel 718. These materials exhibit different regions of
fatigue damage, and illustrate discrepancies with regard to the type of damage
classically assumed for ductile and brittle materials. Experimental data and
crack observations can be found in earlier publications [12,14]. Two regions,
Regions A and B, are shown in Fig. 2 for AISI 304 stainless steel tubular
specimens loaded in torsion. A crack dimension of 0.1 mm was used as a
demarcation between crack nucleation and crack growth for this material (i.e.
solid line). In Region A, microscopic observations of specimen surface
acetate tape replicas showed that cracks initiated in the maximum shear strain
amplitude orientation and at grain boundaries. Once initiated, the cracks
became more distinct but showed no significant increase in length. At
failure, a large density of small, coarse cracks dominated the surface of the
specimen. A small amount of branching onto tensile planes (Stage II planes)
was observed late in the fatigue life. Macroscopic failure cracks grew in
either a shear orientation (Stage I) or tensile (Stage II) direction by
linking of previously initiated shear cracks. Region B behavior was observed
8

at intermediate fatigue lives in torsion (5 x 10⁴ to 2 x 10⁶ cycles). The
fraction of fatigue life spent growing the crack in a shear direction was
reduced, as was the crack density for this range of fatigue lives. A small
number of shear cracks initiated but quickly branched to a Stage II
direction. Growth of these cracks occurred by the propagation of the main
crack rather than by a linking process. Although no region C behavior was
experimentally observed for torsional loading, the data trends would infer its
existence at fatigue lives greater than 10 cycles.
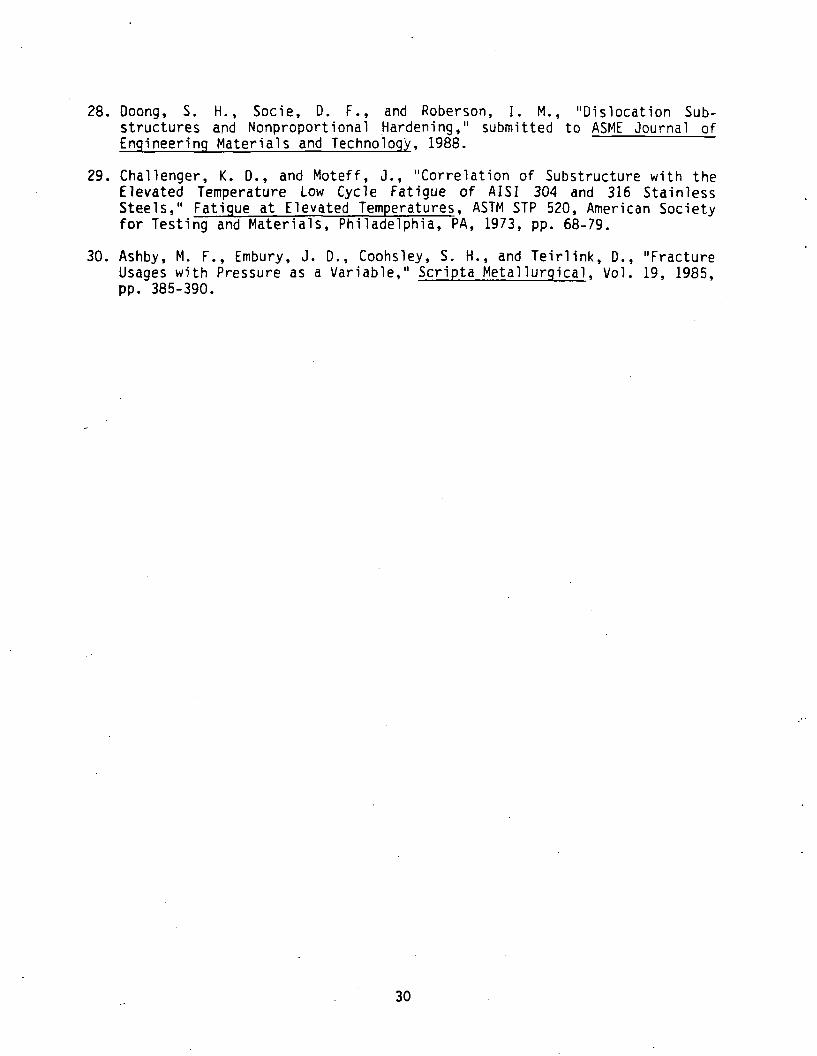
Surface replicas and scanning electron microscopic examination of the
fracture surfaces of AISI 304 specimens tested in tension revealed no percep-
tible shear crack growth. As a result, no Region A behavior is shown in
Fig. 3. It should be noted that uniaxial solid specimens with a 6 mm gage
diameter were used for the tension experiments with 304 stainless steel while
tubular specimens were employed for all the loading cases discussed. Fracto-
graphy revealed that striations could be traced to the origin of the failure
crack [15]. Forsyth [9] has categorized striations as either brittle or
ductile. Brittle striations are observed to propagate along crystallographic
facets (i.e. grain boundaries), whereas ductile ones are essentially parallel
to the fracture surface. (It should be noted that ductile striations are
those associated with the beach mark pattern typically attributed to
striations.) Brittle striations were typical at the point of origin of the
failure crack for all except the highest strain amplitude (shortest life
tests). Crack formation was the dominant life fraction for all cyclic tensile
tests conducted, even though plasticity was observed throughout the fatigue
life range (10 to 106) for all specimens. Hence for axial loading, only
Region C is depicted in Fig. 3 for AISI 304. This does not imply that there
was no shear or tensile crack growth, merely that crack growth from a 0.1 mm

dimension was not the dominant life fraction. Use of an alternate crack
dimension, such as 0.01 mm, would probably result in a Region B for this
loading condition.
The torsional behavior of Inconel 718 tubular specimens is summarized in
Fig. 4. Again a 0.1 mm crack dimension was used as an experimental
demarcation between initiation and propagation phenomena. Unlike the
stainless steel which displayed mixed behavior, results of the Inconel 718
torsion tests showed that cracks nucleated and grew in a maximum shear strain
amplitude direction. Region A behavior was observed at all values of shear
strain amplitude investigated (10 to 10° cycles). Even at the lowest strain
amplitude, for which the nominal stress-strain response was essentially
elastic, cracks initiated and remained on shear planes throughout the life.
Crack density decreased with increasing fatigue life as it did in 304
stainless steel but no branching onto tensile planes was observed. Again, the
life range tested did not reveal either Region B or C behavior, though at
longer fatigue (>10 ) they may dominate the fatigue process.
Final failure in all tension tests of Inconel 718 was in a macroscopic
tensile direction. For short and intermediate fatigue lives a substantial
amount of microscopic shear formation and growth was observed, and is
reflected by Region A in Fig. 5. Low cycle fatigue damage accumulation in
Inconel 718 appears to be shear dominated. The high density of precipitates
in this material restricts slip to localized regions. Crack propagation then
occurs along the bands with extensive shear crack growth exhibited throughout
the fatigue life investigated (102 to 106 cycles). Stage II crack growth may
occur at longer fatigue lives (>10 ), but since in this life regime crack
nucleation plays the dominant role, it would be classified as Region C. One
could argue that using an alternate definition of an initiated crack, there
10

could conceivably be a Region B for this tensile data. For tensile loading
cracks grow in a shear orientation on a scale of 0.1 to 0.2 mm, and perpen-
dicular to the principal strain direction on a scale of 1 mm. Therefore the
crack growth for a portion of the fatigue life could be interpreted as either
tensile or shear. The absence of Region B will be discussed in a subsequent
section.
Ease of experimental testing has resulted in much of the multiaxial
research employing combinations of axial and torsional loads (bending-
torsional loading is considered to be part of this category). For both
materials investigated combined axial-torsional loads resulted in damage maps
whose characteristics were bounded by the axial only and torsional only
cases. As an initial effort to incorporate state of stress into the damage
modeling process, the hydrostatic stress was employed in Figs. 6 and 7 for
AISI 304 and Inconel 718 respectively to summarize individual loading con-
ditions. Hydrostatic stress is the vertical axis and fatigue life is the
horizontal axis. Torsion, tension and biaxial-tension have normalized hydro-
static stresses of 0, 1/3, and 2/3, respectively. One may choose some
deformation parameter such as strain range should be chosen for the horizontal
axis rather than fatigue life. Since different bulk stress-strain deformation
parameters will best represent the fatigue damage for the three regions
proposed, it remains a perplexing problem of which variable to choose. Once a
damage parameter has been established to represent a particular region a
similar plot could be constructed with a band of validity for that parameter
versus some state of stress term such as hydrostatic stress, which for the two
materials discussed renders an adequate representation for combined loading
cases.
11

2.2 Fatigue Models
Once the dominant life fraction leading to failure has been identified,
an appropriate life estimation model can be selected. Each region may require
a separate damage model that is based on the fatigue damage observations. The
following damage models are proposed, although it is important to note that
alternative methods could have been selected as long as the model captures the
driving force for the fatigue damage observed. Bulk stress-strain deform-
ations were chosen to represent the driving force for each fatigue damage
region.
2.2.1 Region A
Crack formation and growth in the direction of maximum shear strain
amplitude was the dominant damage feature observed for this region, hence
maximum shear strain amplitude wi l l be the primary bulk stress-strain param-
eter chosen to represent fatigue damage. Since this type of fatigue damage is
often typical of low cycle fatigue, incorporation of.strain rather than stress
mirrors other researchers efforts when modeling this life regime. The torsion
test has only shear strains and stresses in the maximum shear strain amplitude
orientation, and displays a larger Region A than any of the other strain
states. Other combinations of tension and torsion may have crack growth in
the direction of the maximum shear strain amplitude, however other stresses
and strains normal to this plane are present. A classical fracture mechanics
approach to this type of cracking would consider a mixed mode stress intensity
factor. For a bulk deformation approach, additional terms reflecting the
normal stress and/or strains would serve an analogous purpose. This notion
has been imbedded in previous high cycle bulk stress life predictive methods
for some time. Nadia [16] quoted Mohr: "The shearing stress, S$, in the
12
planes of slip reaches, at the limit, a maximum value dependent on the normal
stress, Sn, in the same planes." Findley [17] later states, "The principle
stress (maximum shear stress) theory modified by the influence of the
complementary normal stress may be the most satisfying theory for combined
stress fatigue." Similar arguments have been forwarded by Orowan [18] with
regard to dislocation motion.
The following model was proposed by Kandil, Brown and Miller [19] and
modified by Socie, Kurath, and Koch [14] to include mean stress effects.
- + = Y (2N)C° +
In this approach maximum shear strain amplitude is modified by the strain
amplitude and mean stress normal to the maximum shear strain amplitude. These
terms are interpreted to account for changes in crack closure that have been
observed for different stress-strain states. The right hand side of the
equation represents the constants generated from fully reversed torsional
testing. Differences in interpretation could arise for out-of-phase loadings,
where the maximum value of the composite parameter could differ from the value
of the parameter on the maximum shear strain amplitude plane [15]. Constants
for the non-shear strain terms have been proposed and may be calculated using
fatigue-life results for other stress-strain states [20].
Recently for materials which display Region A, damage and exhibit sub-
stantial out-of-phase hardening, an alternate shear based model has been
forwarded by Fatemi and Socie [21]. Fatemi and Kurath (22] evaluated the
applicability of this parameter for multiaxial mean-stresses loadings.
omax c T; b1 (i + k_D_) = (2N) ° + 1 (2N) ° (2)
13

The maximum stress normal to the maximum shear strain amplitude is the modi-
fying parameter employed in this approach. This format also reflects that no
shear direction growth should occur in a shear orientation if no shear
alternation occurs for a fatigue event. This concept should play a greater
role when variable amplitude and out-of-phase biaxial loadings are investi-
gated. The maximum normal stress term allows experimentally observed out-of-
phase hardening to be incorporated in the damage parameter, while mean normal
stress would not. Again the constant, k, may be calculated by employing
fatigue life results for other stress-strain states.
Torsional strain-life constants are employed in these analyses because
the torsion test is most likely to display Region A fatigue damage. Only
tests displaying Region A behavior should be used when fitting the torsional
strain-life constants. It should be noted that both Eqs. (1) and (2) are
identical for the torsional test. Also, both equations have been related to
uniaxial constants, but since the uniaxial test is less likely to display
Region A behavior and the other modifying terms are present for uniaxial
testing, the implementation of torsional test data is more appropriate from a
conceptual and physical standpoint.
2.2.2 Region B
Crack growth is again a dominant fatigue life fraction for this
region as was the case in Region A. However crack growth perpendicular to the
maximum principal strain plays a dominant role. The primary bulk deformation
for Region B would be maximum principal strain amplitude. This would imply
the traditional strain-life approach be invoked. Mean stress has been shown
to effect the fatigue life of uniaxial specimens. Smith, Watson, and Topper
14

[23j proposed a uniaxial parameter to account for mean stress effects which
was modified for multiaxial loadings by Bannantine and Socie [12].
, f= °fef
In this format the maximum principal strain amplitude is modified by the
maximum stress in the direction of maximum principal strain amplitude that
occurs during a cycle. For in-phase loadings, where principal stress and
strain directions coincide, there is no difference between this interpretation
and the maximum value of the composite parameter. Again for out-of-phase
loadings discrepancies exist [15]. The maximum value of the composite param-
eter does not always coincide with the plane of maximum principal stress. As
with Eq, (2) the maximum stress term allows experimentally observed or
analytically predicted out-of-phase hardening to be incorporated in the damage
parameter.
Since Region B fatigue damage is more dominant in the uniaxial test than
in torsional testing, axial strain life constants are conceptually appropriate
and more practical for this analysis. Again only uniaxial tests which display
Region B behavior should be employed to fit the strain life constants.
2.2.3 Region C
Crack formation dominates Region C damage accumulation. The macro-
scopic crack direction observed for failure renders minimal information for
this region since it comprises such a minimal life fraction. In the longer
life region, which is typical of Region C, two types of fatigue damage may
occur; i) highly localized shear slip and ii) dominance of defects or grain
boundaries in fatigue damage accumulation.
15

Nisitani [24] and Nisitani and Kawano [25] made extensive observations of
long life fatigue failures in low carbon steels. They concluded that at the
fatigue limit, cracks formed within single grains but were unable to propagate
into neighboring grains because of the differences in crystallographic orien-
tation. Hence long life damage could be controlled by cyclic shear
stresses. For cases where classical slip concepts of fatigue are appropriate
the concepts of Findley [19] are appropriate
(4)
For nominally elastic in-phase loadings it should be noted that Eqs. (1) and
(4) are identical. Similarities to the terms in Eq. (2) can also be identi-
fied. For materials where this extension of these models is appropriate, the
fatigue damage at a macroscopic crack tip and for macroscopic cracks are
probably identical. It is cautioned, and will be the subject of subsequent
discussion that a distinct Region A does not imply that Region C behavior can
be modeled with Eq. (4).
It is postulated that other materials are flaw dominated at longer
fatigue lives, or microstructurally have a greater ability to resist slip
failure, hence a tendency to develop tensile damage, at lower strain or stress
amplitudes. Region C behavior for these materials can be modeled using
Eq. (3) converted to a stress format;
maxflol max ,2— — = °f
It is assumed that the deformation at the critical location is elastic
for both Eqs. (4) and (5). If nonlinear behavior (i.e. nominal plasticity) is
16

present, extensions of Eqs. (1) and (2) or Eq. (3) are suggested for Eqs. (4)
and (5), respectively. The common feature of these damage models is that they
are evaluated on an orientation consistent with the observed damage phenomenon
that dominates the fatigue life fraction. Bulk deformation terms are chosen
to reflect the dominant fatigue life fraction damage characteristics.
17

3. DISCUSSION
Inconel 718 and AISI 304 stainless steel were chosen for discussion
because they illustrate agreements and differences commonly associated with
ductile and brittle metals. True fracture strains of 0.33 and 1.61 have been
reported for monotonic tensile tests of Inconel 718 and" AISI 304,
respectively. During cyclic'loading the stainless steel displayed nominally
plastic deformation even at fatigue lives greater than 10 cycles, while the
nominal deformation was elastic at lives greater than 10 cycles for Inconel
718. Classical concepts would dictate that shear type failures are more
likely for the more ductile material. Surface crack observations [12,14]
refute this concept for the low cycle fatigue of these materials.
For most of the Inconel 718 specimens tested shear crack formation and
growth dominated the fatigue damage accumulation. This implies Region A
dominance, hence damage modeling via a shear parameter. Fifteen biaxial
strain paths including mean-stress and out-of-phase loadings were investigated
[14]. When a shear based parameter, Eq. (2), is .employed to evaluate the
data, it falls within a reasonable scatterband (Fig. 8). Torsional baseline
data was used to construct the solid line in Fig. 8. It should be noted that
this material experienced little out-of-phase hardening, and that imple-
mentation of Eq. (1) for this material provides comparable results. Axial or
bending combined with torsional loading comprise the majority of the biaxial
data examined. Recent research [26] for biaxial-tension loadings has
indicated that shear damage also dominates for this stress state at shorter
fatigue lives (>105 cycles), but that Eq. (2) better represents the
experimental fatigue results. It is interpreted that the stress normal to the
maximum shear direction rather than the normal strain alters the damage
accumulation behavior.
18

Uniaxial fatigue behavior of Inconel 718 can be fit utilizing the
traditional strain-life approach. If the damage mechanism is not properly
understood, and Eq. (3) is used to quantify the fatigue data in Fig. 8, the
scatter in the data increases considerably (Fig. 9). The solid line in Fig. 9
represents the fully reversed uniaxial baseline data. Most of the uniaxial
testing was conducted at strain amplitudes that resulted in fatigue lives less
than 10 cycles. Since Region A damage is characteristic of these specimens,
it is conceptually incorrect to employ these data to fit Eq. (3). This error
is reflected in the lack of correlation when considering other stress-strain
states. Macroscopic observations of the tensile specimens at failure would
reveal an appreciable dimension of Stage II crack growth. However,
examination of acetate tape replicas of the specimen surface taken
periodically during the fatigue life reveal that small crack growth in a shear
orientation dominated the fatigue life fraction. Examination of the fracture
surface can provide useful information regarding the mode of failure, however
the dimension of Stage I and Stage II crack growth regions are not necessarily
indicative of their life fraction. In other words at failure, the lack of a
Stage II cracking region can imply that it is not a dominant life fraction.
However, its presence does not imply that a dominant life fraction was Stage
II cracking or Region B behavior. Periodic observations are required to
establish the material's fatigue damage accumulation characteristics.
Inconel 718 is a nickel-based superalloy strengthened by y1 apd Y" super-
alloy precipitates (precipitate size - 300-400 A), with some carbides at the
grain boundaries. The purpose of the precipitates is to impede crystal-
lographic slip due to mechanical loading and resist plastic deformation at
higher temperatures. At higher stress levels (i.e. higher strain amplitudes)
cracks originate at carbides which serve as stress concentrators (27). The
19

precipitates are subsequently sheared at these stress-strain levels, leading
to a dominance of shear cracks resulting in failure.
, While at longer fatigue lives.the carbide particles would continue to
serve as initiation sites, the reduced stress level probably is insufficient
to'shear the precipitates. The carbide particle size and shape could play a
dominant role in the number of cycles required to initiate a fatigue crack.
When the crack is initiated, it rapidly propagates as a Stage II crack, during
a nominal life fraction. This would imply defect dominance of this material
at longer fatigue lives similar to that observed for cast iron at short and
long fatigue lives. The scatter of the fatigue data increases dramatically at
longer fatigue lives for Inconel 718, similar to the observations over the
entire life range for defect controlled materials such as cast iron. Hence
Eq. (5) is appropriate for this material if the preceding hypotheses are
valid. At present no experimental data is available to validate this
proposition.
No Region B damage has been identified for Inconel 718 in either Figs. 4,
5, or 7. It could be argued that the 0.1 mm demarcation for a crack is the
cause of this discrepancy. For tensile loading cracks in a shear orientation
range in size from 0.1 to 0.2 mm while on a scale of 1 mm crack growth is
perpendicular to the maximum principal strain. Metallographic examination of
the microstructure revealed grain size, dimensions ranging from 0.01 mm to 0.2
mm. Hence the initial dimension may correspond to either ten grains or a
crack within a grain. Now if the crack is ten grains in dimension, most
researchers will agree that it is a crack, while within a grain no consensus
exists. The nagging question of when is a crack a crack persists.
It is not necessary for a material to display all three damage regions.
Further implications are that if a Region A is experimentally determined at
20

shorter fatigue lives where shear cracking is a dominant life fraction, it
does not infer that a shear based parameter such as Eq. (4) is appropriate
when crack formation (i.e. Region C) is the dominant life fraction. Also, if
Regions A and C are experimentally identified the existence of Region B for
that material is not implied. Since most of the experimental data displays
Region A damage accumulation, it is not surprising that adequate fatigue life
estimates are obtained by implementing either Eq. (1) or (2). Minimal out-of-
phase hardening is observed for low cycle fatigue of Inconel 718, hence
comparable results are obtained for combinations of axial and torsional loads
utilizing either Eq. (1) or (2). The high cycle fatigue (>106 cycles)
behavior of this material is not well documented, but a trend indicating a
change in damage mechanism for this life regime has been hypothesized.
Initial low cycle torsional fatigue testing (<5 x 10 cycles) of AISI 304
stainless steel indicates shear crack growth dominated the damage accumulation
process. At longer fatigue lives (5 x 10⁴ to 107 cycles) Forsyth's Stage I
cracks formed, but branched to a Stage II orientation for a dominant life
fraction, indicating Region B fatigue damage. Although conceptually in-
correct, considering the change in fatigue damage over the experimental life
range for torsional loading, the data may be fit to either Eqs. (1), (2) or
(3) with satisfactory results for a single state of stress. The changes in
damage mode will be embedded in the material constants for each equation.
Without considering the physical damage process it is difficult to correlate
the data for different states of stress. An order of magnitude difference in
fatigue life exists between torsional and axial experimental data in Fig. 10
for the same value of the shear damage parameter. Consideration of out-of-
phase loadings increases the scatter of the data for this material when
evaluating fatigue life with a shear parameter. Ignoring the dominant
21

physical fatigue damage process makes it difficult to correlate data for
different states of stress.
Scanning electron microscopic examination of axial specimens [15]
revealed brittle striations at the origin of fatigue damage for all fatigue
lives greater than 10^ cycles. Again the crack size used as a demarcation
between crack initiation and propagation phenomena could' be employed as an
argument to suggest that a Region B exists for axial testing at shorter
fatigue lives. Compared to a similar Stage II crack for torsional loading,
crack propagation from a common dimension occupies a smaller life fraction for
similar fatigue lives. However the brittle striations observed for initial
crack formation in AISI 304 stainless steel for axial loadings could be
construed such that it is interpreted that the damage accumulation during
crack nucleation is dependent on principal stresses or strains. Even though
it occupies a small life fraction, evidence of tensile type damage at the
crack nucleation site could be hypothesized to be indicative of the damage
occurring during crack nucleation. Alternately one could postulate that
smaller dimensions of shear damage occur for tensile loading (much smaller
than can be inferred by presently existing SEM fractography) and the same
mechanism that caused a change in crack direction in torsion, occurs at a
different dimension for axial loading. For either hypothesis implementation
of the tensile model, Eq. (3), is appropriate. Both tension and torsional
data can be correlated with this approach (Fig. 11).
Inconel 718 displayed similar damage accumulation for both tension and
torsion over the fatigue life range experimentally investigated, but not AISI
304 stainless steel. However for the stainless steel, most of the experi-
mental data falls within the Region B and Region C on the damage maps. Figure
11 shows an improved correlation of the fatigue data for AISI 304 stainless
22

steel employing Eq. (3). The modified Smith-Watson-Topper parameter pre-
viously showed promise as a damage analysis technique for materials such as
cast iron where Stage II cracking dominates the damage accumulation. This
would explain the success of this parameter when modeling the Region B damage
observed for torsional testing and the Region C damage for axial loading.
Studies of the dislocation substructure for proportional and non-
proportional loadings of AISI 304 stainless steel [28] indicate that this
material is a planar slip material. The out-of-phase hardening which this
material experiences has been explained via these dislocation observations.
This suggests that cross slip is more difficult for this material, and may be
partially responsible for the principal stress or strain dominated damage
inferred from the choice of damage model (i.e. Eq. (3)). Where nominal
plastic deformation occurs and nucleation phenomena dominate, implementation
of Eq. (3) has been suggested for materials whose damage accumulation is best
characterized by principal stresses. During the investigation of Inconel 718
combined axial-torsional loading, damage was shown to be bounded by axial and
torsional loadings. Therefore after establishing the baseline damage charac-
teristics of AISI 304 stainless steel via axial and torsional tests, the
analytical and experimental focus of the research was on out-of-phase
loadings. Again most of the experimental data corresponds to damage where
Eq. (3) is suggested, and is reflected by the analytical success demonstrated
in Fig. 11, for both in-phase and out-of-phase loadings.
Other researchers [29] have observed a change in dislocation structure
from planar slip to cell structures at elevated temperatures (650 - 800°C). A
change in fatigue damage could also be hypothesized at this increased temper-
ature. This could imply that Eqs. (1), (2) or (4) (i.e. region A) would
successfully model the damage phenomena (i.e. shear controlled) at the
23

elevated temperatures. When evaluating components that are thermally cycled,
the temperature dependence of damage type could further complicate the
analytical evaluation of actual service conditions with regard to fatigue life
estimation.
Inconel 718 and AISI 304 stainless steel illuminate differences in damage
accumulation commonly associated with classical brittle and ductile
engineering metals. However, there are materials such as SAE 1045 steel that
are considered to be ductile and display shear dominated fatigue damage
accumulation [4,13]. Brittle materials such as cast iron (12] follow the
classical concepts. Especially with non-ferrous alloys, it is important to
investigate the individual material's fatigue damage accumulation rather than
using rules of thumb developed for ferrous materials, the primary structural
material prior to 1950. Over most of the fatigue life range both the Inconel
718 and stainless steel demonstrate damage accumulation that lends itself to
correlation with a single damage parameter. Over another range of fatigue
life neither of these materials may allow this convenience. However, this
should not restrict the consideration of multiple damage regions. A
complication that arises is how these regions of damage interact when variable
amplitude fatigue cycling is analyzed. An understanding of these interactions
will clarify many of the uncertainties associated with current cumulative
damage methods. Surface cracking observations may suffice for low cycle
fatigue interactions, but microscopic dislocation and microstructural evidence
will probably provide more information for high-cycle fatigue interactions
where testing time is prohibitive.
Previous observations have been for un-notched laboratory specimens.
Most significant engineering applications involve a notch, or strain
concentration. Some implications of the damage map concept will be summarized
24

in the following discussion. The traditional strain-life method considers
uniaxial constant amplitude strain-life data as a baseline. Using Neubers
hypothesis to account for non-linear notch deformation, a principal strain
range is calculated. That is related to the uniaxial data in order to
calculate a fatigue life. This is only conceptually in agreement with the
damage map concept for Region B, and some Region C fatigue damage states.
Often no consideration of notch constraint (e.g. plane stress or plane strain)
is considered in the traditional strain-life approach. For some loading cases
this factor may dictate the type of fatigue damage that occurs. Therefore
even when considering notched members, damage maps afford the opportunity to
choose the appropriate bulk stress/strain parameter based on the material,
microstructure, and state of stress/strain for the loading amplitude.
For simple loading histories such as 90° out-of-phase tension torsion
loading, the damage parameter can be interpreted in two ways. The damage
parameter could always be evaluated on the plane experiencing the largest
cyclic strain range. An alternate interpretation would compute the fatigue
life for the largest value of the damage parameter including both cyclic
strain and normal stresses. For in-phase loadings both interpretation result
in identical results. For a variable amplitude history with a phase
difference between some of the events, the shear or principal strain
orientation experiencing the maximum damage may not correspond to the event
with the maximum amplitude. A simple hypothetical example of this would
involve one axial cycle, followed by only torsional fatigue cycles with a
smaller shear strain amplitude (note: this also implies a smaller principal
strain amplitude) than the axial loading. In a cumulative damage analysis for
a shear dominated material the maximum shear strain orientation of the
torsional cycles would experience a greater damage because of the larger
25

number of cycles than the maximum shear strain amplitude direction for the
history, which corresponds to that for the axial loading. An orientation that
does not correspond with the maximum principal stress or strain amplitude
direction for the largest event in the history could be identified as the most
damaging. For these situations, the value of the entire bulk stress-strain
parameter could be evaluated for all possible orientations, with the direction
of the maximum damage for the history being interpreted as the anticipated
direction of fatigue cracking. Damaging events would be inferred from a
closed path in nominal stress/strain space. Again it is conceivable that an
orientation that does not correspond to the maximum appropriate stress or
strain amplitude direction for any individual event in the history could be
identified as the most damaging. Also, for this method it is possible to
predict an orientation that does not correspond to the maximum amplitude of
the primary damage parameter for a loading that involves repetitions of a
single event [15].
The dimension of some components may result in tensile or shear long
crack propagation being a dominant fatigue life fraction, even if it is not so
identified from damage maps constructed from unnotched laboratory specimens.
For these cases a mixed mode fracture mechanics approach is probably adequate
to insure that life predictions are not overly conservative. In order to
improve fatigue life estimation techniques for simple and more complex stress
states, a knowledge of the type of fatigue damage that occurs for a given
material and loading is essential.
26

CONCLUSIONS
The concept of fatigue damage maps, analogous to fracture maps of Ashby
et al. [30] has been employed to characterize fatigue damage. Material, state
of stress and/or strain, loading amplitude, and microstructure all influence
the' type of fatigue damage observed. Hydrostatic stress has been used to
summarize three major categories (shear crack growth, tensile crack growth,
and crack nucleation) of fatigue damage from various stress-strain states.
Successful extrapolation of data from simple to more complex constant ampli-
tude loadings has required that similar fatigue damage occurs for both stress-
strain states. When this similarity in damage exists for a material,
appropriate bulk stress-strain parameters are used to correlate both in-phase
and out-of-phase experimental data. Further research is required to extend
these concepts to general variable amplitude loadings.
27

REFERENCES
1. Guard, Y. S., "Multiaxial Fatigue: A Survey of the State of the Art,"Journal of Testing and Evaluation. Vol. 9, No. 3, 1981, pp. 165-178.
2. Krempl, E., "The Influence of State of Stress on Low-Cycle Fatigue ofStructural Materials: A Literature Survey and Interpretive Report." ASTMSTP 549, American Society for Testing and Materials, Philadelphia, 1974,
' 46 pp.
3. Wbhler, A., Zeitschrift fur Bauwesan, Vol. 8, 1858, p. 641.
4. Ewing, J. A., and J. C. W. Humphrey, "The Fracture of Metals and RepeatedAlterations of Stress," Philosophical Trans, of the Royal Society ofLondon, Series A, Vol. 200, 1903, Part 1, pp. 241-250.
5. Forsyth, P. J. E., "A Two Stage Process of Fatigue Crack Growth,"Proceedings of the Symposium on Crack Propagation, Cranfield, England,1961, pp. 76-94.
6. Gough, H. J., "Crystalline Structure in Relation to the Failure of Metals-Especially Fatigue," Proc. ASTM, Vol. 33, Part II, 19XX, pp. 3-14.
7. Guest, J. J., "Recent Research on Combined Stress," ProceedingsInstitution of Automobile Engineers, Vol. 35, Dec. 1940, pp. 33-72 and146-171.
8. Jacquelin, B., Hourlier, F., and Pineau, A., "Crack Initiation under Low--Cycle Multiaxial Fatigue in Type 316L Stainless Steel," Transactions ASME,Vol. 105, 1983, pp. 138-143.
9. Forsyth, P. J. E., "Fatigue Damage and Crack Growth in Aluminum Alloys,"ACTA Metallurgica, Vol. 11, 1963, pp. 703-715.
10. Fash, J. W., "Fatigue Crack Initiation and Growth in Gray Cast Iron,"Fracture Control Program, Report No. 35, College of Engineering,University of Illinois at Urbana-Champaign, 1980, pp. 47-50.
11. Dowling, N. E., "Crack Growth during Low-Cycle Fatigue of Smooth AxialSpecimens," Cyclic Stress-Strain and Plastic Deformation Aspects ofFatigue Crack Growth, ASTM STP 637, American Society for Testing andMaterials, 1977 pp. 97-112.
12. Bannantine, J. A., and Socie, D. F., "Observations of Cracking Behavior inTension and Torsion Low Cycle Fatigue," presented at ASTM Symposium on LowCycle Fatigue-Directions for the. Future, to be published as an STP,American Society for Testing and Materials, Philadelphia, 1985.
13. Hua, C. T., and Socie, D. F., "Fatigue Damage in 1045 Steel Under ConstantAmplitude Biaxial Loading," Fatigue of Engineering Materials andStructures, Vol. 2, No. 3, 1984, pp. 165-179.
28

14. Socie, D. P., Kurath, P., and Koch, J., "A Multiaxial Fatigue DamageParameter," presented at the Second International Symposium on MultiaxialFatigue, Sheffield, U.K., 1985.
15. Jones, D. J., and Kurath, P., "Cyclic Fatigue Damage CharacteristicsObserved for Simple Loadings Extended to Multiaxial Life Predictions,"NASA Publication NASA/CR/182126, 1988.
16. Nadia, A., Plasticity. A Mechanics of the Plastic State of Matter, McGraw-Hill Book Co., Inc., New York, 1931.
17. Findley, W. N., Mather, P. N., and Martin D. E., "Fatigue Failure underCombinations of Stresses," Theoretical and Applied Mechanics Report No.61, University of Illinois, 1954.
18. Orowan, E., Dislocations in Metals, The American Institute of Mining andMetallurgical Engineers, Inc., New York, NY, 1954, pp. 188-194.
19. Kandil, F. A., Brown, M. W., and Miller, K. J., "Biaxial Low-Cycle Fatigueof 316 Stainless Steel at Elevated Temperatures," The Metals Society,Vol. 280, London, 1982, pp. 203-210.
20. Socie, D. F., and Shield, T. W., "Mean Stress Effects in Biaxial Fatigueof Inconel 718," ASME Journal of Engineering Materials and Technology,Vol. 106, 1984, pp. 227-232.
21. Fatemi, A., and Socie, D. F., "A Critical Plane Approach to MultiaxialFatigue Damage Including Out-of-Phase Loading," to be published in theJournal of Fatigue and Fracture of Engineering Materials and Structures,1987.
22. Fatemi, A., and Kurath, P., "Multiaxial Fatigue Life Predictions under theInfluence of Mean Stresses," submitted to the ASME Journal of EngineeringMaterials and Technology, 1987.
23. Smith, K. N., Watson, P., and Topper, T. M., "A Stress-Strain Function forthe Fatigue of Metals," Journal of Materials, Vol. 5, No. 4, 1970, pp.767-778.
24. Nisitani, H., Japan Society of Mechanical Engineers Bulletin, Vol. 11, No.48, 1968, pp. 947-957.
25. Nisitani, H., and Kawano, K., Japan Society of Mechanical EngineersBulletin, Vol. 15, No. 82, 1972, pp. 433-438.
26. Morrow, D. L., "Biaxial-Tension Fatigue of Inconel 718," Ph.D. Thesis,Department of Mechanical Engineering, University of Illinois at Urbana-Champaign, 1987, 113 pp.
27. Bashir, Shahid, "High Temperature Low Cycle Fatigue of Nickel Based Super-alloys Rene '95 and Inconel 718," Ph.D. Thesis, Department of MaterialsScience and Metallurgical Engineering, University of Cincinnati,Cincinnati, OH 1982, 189 op.
29
28. Doong, S. H., Socie, D. F., and Roberson, I. M., "Dislocation Sub-structures and Nonproportional Hardening," submitted to ASME Journal ofEngineering Materials and Technology, 1988.
29. Challenger, K. D., and Moteff, J., "Correlation of Substructure with theElevated Temperature Low Cycle Fatigue of AISI 304 and 316 StainlessSteels," Fatigue at Elevated Temperatures, ASTM STP 520, American Societyfor Testing and Materials, Philadelphia, PA, 1973, pp. 68-79.
30. Ashby, M. F., Embury, J. D., Coohsley, S. H., and Teirlink, D., "FractureUsages with Pressure as a Variable," Scripta Metallurgical, Vol. 19, 1985,pp. 385-390.
30

1.0
Torsional Loading
• Region A *>|^—Region B
M
M
Region C
)5
0.4
0.2
Tensile Crack Growth
Shear Crack GrowthCrack Nucleation
10' 10*Nf (cycles)
10s 10' 10'
Fig. 1 Hypothetical fatigue damage map for torsional loading
31

1.0|
0.8
.0.6
0.4
0.2
0
10 :
304 Stainless, Torsion.Region A ^U Region B
Tensile Crack Growth
Shear Crack Growth
N} (cycles)10 10
Fig. 2 Fatigue damage for torsional loading of AISI 304 stainless steel
32
304 Stainless, Axial
.Region C
0.4
0.2
Crack Nucleation
10'N{ (cycles)
10' 10' 10'
Fig. 3 Fatigue damage for axial loading of AISI 304 stainless steel
33

1.0
0.8
-0.6
0.4
0.2
IN-718, Torsion
•Region A
Shear Crack Growth
Crack Nucleation
10' 10 10'
Nf (cycles)10'
Fig. 4 Fatigue damage for torsional loading of Inconel 718
34

_0.6Zz
0.4
0.2
IN-718, Axial
Region A
Shear Crack Growth
Tensile CrackGrowth
I
Crack Nucleation
10' 10' 10* 10'N{ (cycles)
10' 10'
Fig. 5 Fatigue damage for axial loading of Inconel 718
35

304 Stainless Steel
2/3
Region C
1/3
10' 10' 10* 10'N( (cycles)
10' 10
Fig. 6 Fatigue damage map for AISI 304 stainless steel
36

t>tf
10'
I
10 10 10'Nf (cycles)
Region C
10v
Fig. 7 .fatigue damage map for Inconel 718
37

CD 4^ J> —5 52- 2
CD O'x rH
~6"5"B "o oQ-CLCLCLF
D > I
5o
oQco
Ico
CD
II
CDQ
inQ
en_CDo>%O
4-OJ
4->O)
1C (O4-> I-C (OQ) Q.
1- CDQ> fCQ. Ex fdQJ T3
00 QJ»-< 3
QJ CBc u-oo s-C ro
I-H QJ
.cQJ (/IJ=•<-> (O
u- 01o cc >>o o•^ ^-1
4-> Q.<0 E
I— QJ
QJS- rot. 4->O ro
<_> -D
CD
•Cr>
roQ
38

IT - Q
DQ
cO
IcO
"toCCD
00 J
i
Xjz -c £ £ g"o B B "5 " cQ-CLCLCL 13
toQ
CO
•fc
a.-4J<D
(T3 (O-M S-(tf W•O Q.
r— O)rtf CD*J (OC EO) <O
>_ O)O> 3D. cr>X -r-
oo **-
t-- C
QJ S-C 4->O </>u
^-. <oQ.
QJ •!-
£ U4-> C
C WO
•f- CD*-> c
O) O1- t—U O.O EO Ol
cr>
roQ
QCM
CM
39

oco _to oV- .—O x
CDCD
CO
(f)cnJDc"oCO
orO
inQ
_CDo>o
QJ4->Ol
Q.
QJ
O) (O•— -o• i- GJIB 3
1/1 o>
QJ T3
CT)C
CO
H3 -o
0; r~i- O)V. QJO •!->O 1/1
XDUJXV

CDjL>CO
0>c/>D
O —O n Q
cn —
c"oCO
£>;=;•- *- oo^fe8m
Oro
(f)
(U
fOs-rBQ.
<— 01GJ tO
*J (Ol/l T3
O) CT>
C 4->•i- rarO H-
+->Irt C
*T rdO S-
u<: o.•n*O) o.c c4-J -r-
(-<4- 0.o
COcO en•i- C4_> .r—(O i/)
r— 3O)
O<_>
cn
DdlAI( XDULJ
41

NASANational Aeronautics andSpace Administration
Report Documentation Page
1. Report No.
NASA CR-1821912. Government Accession No. 3. Recipient's Catalog No.
4. Title and Subtitle
The Relationship Between Observed Fatigue Damage andLife Estimation Models
5. Report Date
August 1988
6. Performing Organization Code
7. Authors)
Peter Kurath and Darrell F. Socie
8. Performing Organization Report No.
None
10. Work Unit No.
505-63-1B9. Performing Organization Name and Address
University of Illinois at Urbana-ChampaignDepartment of Mechanical and Industrial EngineeringUrbana, Illinois 61801
11. Contract or Grant No.
NAG3-465
12. Sponsoring Agency Name and Address
National Aeronautics and Space AdministrationLewis Research CenterCleveland, Ohio 44135-3191
13. Type of Report and Period Covered
Contractor ReportFinal
14. Sponsoring Agency Code
15. Supplementary Notes
Project Manager, Alan D. Freed, Structures Division, NASA Lewis Research Center.
16. Abstract
Observations of the surface of laboratory specimens subjected to axial and torsional fatigue loadings has resultedin the identification of three fatigue damage phenomena; crack nucleation, shear crack growth, and tensile crackgrowth. Material, microstructure, state of stress/strain, and loading amplitude all influence which of the threetypes of fatigue damage occurs during a dominant fatigue life fraction. Fatigue damage maps are employed to sum-marize the experimental observations. Appropriate bulk stress/strain damage parameters are suggested to modelfatigue damage for the dominant fatigue life fraction. Extension of the damage map concept to more complexloadings is presented.
17. Key Words (Suggested by Authors))
FatigueMultiaxial fatigueDamage maps
18. Distribution Statement
Unclassified - UnlimitedSubject Category 39
19. Security Classif. (of this report)
Unclassified
20. Security Classif. (of this page)
Unclassified
21. No of pages
41
22. Price'
A03
NASA FORM 1826 OCT 88 *For sale by the National Technical Information Service, Springfield, Virginia 22161

National Aeronautics andSpace Administration
Lewis Research CenterCleveland, Ohio 44135
Official BusinessPenalty for Private Use $300
FOURTH CLASS MAIL
ADDRESS CORRECTION REQUESTED
Postage and Fees PaidNational Aeronautics andSpace Administration
.NASA-451
NASA