Embed Size (px)
Citation preview

NASA CONTRACTOR REPORT 177436
Hover Performance Tests of Baseline Metal and
Advanced Technology Blade (ATB) Rotor Systemsfor the XV- 15 Tilt Rotor Aircraft
K. Bartie, H. Alexander, M. McVeigh, S. La Mon, and H. Bishop
Prepared by
B_EIN_ VESTAL _AHIPANY
Philadelphia, PAfor
Ames Research Center
under contractNAS2-11250
NASANational Aeronautics andSpace Administration
Ames Research CenterMoffett Field, California 94035
y
]]
https://ntrs.nasa.gov/search.jsp?R=19880016983 2018-06-29T12:26:49+00:00Z


N
CR177436
FOREWORD
The research and development activity reported in this document
was performed by the Boeing Vertol Company for the National Aero-
nautics and Space Administration, Ames Research Center, underContract NAS2-11250. Mr. M.D. Maisel (Aeroflightdynamics, AVSCOM,
Ames Research Center) was the NASA program manager, and Mr. D.J.
Giulianetti (NASA) was deputy program manager. Other Ames Research
Center personnel who made a significant contribution to this phase
of the program included Messrs. M.K. Betzina, F.F. Felker Ill, L.A.Young, and D.B. Signor. Mr. H.R. Alexander was the Boeing Vertol
Company program manager.
The following Boeing Vertol personnel made significant contributions
to this test program:
D. Ekquist }
K. Farrance
W. Grauer
I. Walton
F. Devlin }N. Ross
K. Bartie }
R. Benson
C. Coleman
M. McVeigh
Wind Tunnel Test Engineering
Instrumentation and Control System Design
Aerodynamics
H. Bishop 1
M. Cawthorne
S. La MonH. Silcox
Stress
S. Botwinik 1
D. Reed
R. Smith
R. Ricks
Dynamics
J. Mayer }W. McLean
D. Podgurski
Wind Tunnel Design and Project Management
Mr. Hank Silcox and Mr. Joseph Mayer merit special mention for their
design of the balance system used to measure rotor performance. Thiswas a major advance in balance technology and the accuracy and relia-
bility of the measured performance data was an important component in
the success of the program.
H.R. Alexander
pRF_.,_ING PAGE BLANK NOT FILM]_I)
iii

CR177436
ABSTRACT
Rotor hover performance data were obtained for the full scale Advanced Tech-
nology Blade (ATB) designed for the XV-15. The ATB rotor thrust-weightedsolidity is 0.10. The test was conducted as part of contract NAS2-11250 atthe NASA-Ames Outdoor Aeronautical Research Facility (OARF). The XV-15
basic rotor (solidity = .089) was also tested. Variations of the ATB tipplanform and cuff planform were also tested. A peak figure of merit of0.806 was demonstrated for the ATB and a value of 0.791 for the XV-15 steelblades. Measurements of the downwash in the wake at O.4R below the disc are
also presented.
KEY WORDSim
Rotor
Hover PerformanceTilt Rotor
XV-15
Rotor BladeRotor Loads
Static Performance Test
iv

CR177436
TABLE OF CONTENTS
LIST OF FIGURES
LIST OF TABLES
LIST OF SYMBOLS
1.0 SUMMARY
2.0 INTRODUCTION
3.0 DESCRIPTION OF TEST INSTALLATION
3.1 Test Stand3.2 Motor and Drive System
3.3 Balance3.5 Hub and Controls
3.6 Rotors3.6.1 Advanced Technology Blade Rotor
3.6.2 XV-15 Rotor
4.0 INSTRUMENTATION
4.1 Instrumentation - General
4.2 Rotor Balance Instrumentation4.3 Blade and Hub Instrumentation
4.4 Wake Rake4.5 Anemometer4.6 Acoustical Measurements
5.0 DATA ACQUISITION AND REDUCTION
5.1 Data Acquisition
5.2 Data Processing
6.0 TEST RECORD AND DATA ACCURACY
7.0 ROTOR PERFORMANCE
7.1 XV-15 Metal Blade Performance
7.2 Baseline ATB Performance7.3 Performance of ATB with Extended Cuff
7.4 Performance of ATB with No Cuff7.5 Performance of ATB with Swept Tip and Extended Cuff
7.6 Performance of ATB with Square Tip and Extended Cuff
7.7 Configuration Performance Comparisons
7.8 Theory - Test Comparison
vii
xiii
xiii
6
99
13
13
1322
22
22
22
2227
27
27
27
27
29
30
50
5O
62
6262
76
7676
96
V

CR177436
TABLE OF CONTENTS (Continued)
7.8.1 Rotor Wake Model
7.8.2 Airfoil Behavior at High Angles of Attack
7.8.3 Spanwise Flow Effects
8.0 ROTOR AND CONTROL SYSTEM LOADS
8.1 XV-15 Metal Blade
8.2 Baseline Advanced Technology Blade (ATB)
8.3 Alternate Configurations: Advanced Technology Blade
9.0 ACOUSTICS
10.0 CONCLUSIONS AND RECOMMENDATIONS
10.1 Conclusions10.2 Recommendations
11.0 REFERENCES
Appendix A - Corrections for Effects of Wind
A.I Introduction
A.2 Correction for Wind Effects
A.3 Data Reduction and Correction Procedure
Page
96
99
99
99
101
101
125
125
128
128129
129
130
130
130
132
vi

CR177436
Figure No.
1.1
1.2
3.1
3.2
3.3
3.4
3.5
3.6
3.7
3.8
3.9
3.10
3.11
3.12
3.13
3.14
3.15
3.16
3.17
LIST OF FIGURES
Title
XV-15 Tilt Rotor Research Aircraft in
Cruise, Transition, and Hover
Baseline ATB Mounted on NASA-Ames
OARF (Outdoor Aerodynamic Research Facility)
Advanced Technology Blade
Pretest Predictions and OARF Test Results for
XV-15 Metal Blade and Baseline ATB Rotor
Plan View of NASA-Ames OARF
Three-View of Test Stand
Gearbox Operating Envelope
Six-Component Rotor Balance System
Schematic of Balance System
Baseline ATB Chord Distribution
Baseline ATB Twist Distribution
Baseline ATB Thickness/Chord Distribution
Baseline ATB Chordwise Stiffness Distribution
Baseline ATB Flapwise Stiffness Distribution
Baseline ATB Torsional Stiffness Distribution
Baseline ATB Pitch Inertia Distribution
Baseline ATB Mass Distribution
Comparison of Pretest Frequency Predictions withPer Rev Crossings and Spectral Analysis Peaksfor Collective and Cyclic Modes
Advanced Technology Blade Basic Material Assembly
Baseline ATB with Alternate Tip and Cuff Configurations
Planform, Twist, and Airfoil Distributions for XV-15
Blades
Paqe
5
7
8
10
11
12
15
15
16
16
17
17
18
18
19
20
21
23
vii

CR177436
Figure No.
4.1
4.2
6.1
6.2
6.3
6.4
6.5
6.6
6.7
6.8
6.9
6.10
6.11
7.1
7.2
7.3
7.4
7.5
LIST OF FIGURES (Continued)
Title
Summary of Instrumentation
Wake Rake Details
Test Schedule for XV-15 and ATB
XV-15 and ATB Test Run Log
Check Calibration Results:
Check Calibration Results:
Check Calibration Results:
Check Calibration Results:
Check Calibration Results:
Check Calibration Results:
Check Calibration Results:
Check Calibration Results:
Thrust (From Rotor Balance)
Thrust (From NASA Load Cells)
Torque (From Rotor Balance)
Torque (From NASA Load Cells)
Thrust with Torque Load
Applied (From Rotor Balance) 45
Thrust with Torque Load
Applied (From NASA Load Cells) 46
Torque with Thrust LoadApplied (Corrected for Friction
Torque and AFFLEX Interaction) 47
Torque with Thrust Load
Applied (From NASA Load Cells) 48
Effect of RPM on the Correlation of Balance Thrustwith Load Cell Thrust
XV-15 CT vs. Cp
XV-15 Figure of Merit
XV-15 Thrust Coefficient vs. Collective Pitch
Variation of Cp with CT3/z for XV-15 Rotor
Variation of Induced Efficiency Factor with ThrustCoefficient for XV-15 Rotor
Paqe
24
28
31
32
41
42
43
44
49
51
52
54
55
56
viii

CR177436
Figure No.
7.6
7.7
7.10
7.11
7.12
7.13
7.14
7.15
7.16
7.17
7.18
7.19
7.20
7.21
7.22
7.23
7.24
LIST OF FIGURES (Continued)
Title
Effect of Tip Mach Number on Thrust/Power
for XV-15 Blades
Effect of Tip Mach Number on Figure ofMerit of XV-15 Blades
Tip Vortices of XV-15 Metal Blades
Contracted Wake Shape of XV-15 Rotor Deduced
from Tip Vortex Photographs
Distribution of Downwash Velocities for Various
Thrust Coefficients for XV-15 Rotor
CT vs. Cp for Baseline ATB
Figure of Merit for Baseline ATB
Thrust Coefficient vs. Collective Pitch for
Baseline ATB
Variation of Cp with CT3/2 for Baseline ATB
Distribution of Downwash Velocities for Various Thrust
Coefficients for Baseline ATB
CT vs. Cp for Baseline ATB with Extended Cuff
Figure of Merit for Baseline ATB with Extended Cuff
Thrust Coefficient vs. Collective Pitch for Baseline ATB
with Extended Cuff
Variation of Cp with CT3/z for Baseline ATB withExtended Cuff
CT vs. Cp for Baseline ATB with No Cuff
Figure of Merit for Baseline ATB with No Cuff
Thrust Coefficient vs. Collective Pitch for Baseline ATB
with No Cuff
Variation of Cp with CT3/2 for Baseline ATB with No Cuff
CT vs. Cp for ATB with Swept Tip
Paqe
57
58
59
60
61
63
64
65
66
67
68
69
70
71
72
73
74
75
77
ix

CR177436
LIST OF FIGURES (Continued)
Fiqure No. Title
7.25 Figure of Merit for ATB with Swept Tip
7.26 Thrust Coefficient vs. Collective Pitch for ATB with
Swept Tip
7.27 Variation of Cp vs. CT_/2 for ATB with Swept Tip
7.28 CT vs. Cp for ATB with Square Tip
7.29 Figure of Merit for ATB with Square Tip
7.30 Thrust Coefficient vs. Collective Pitch for ATB with
Square Tip
7.31 Variation of Cp vs. CT_/z for ATB with Square Tip
7.32 Comparison of CT vs. Cp for XV-15 Metal Blade andBaseline ATB as Measured on OARF
7.33 Comparison of Figure of Merit for XV-15 Metal Bladeand Baseline ATB as Measured on OARF
7.34 Effect of Tip Shape on CT vs. Cp for ATB with
Baseline Elliptical, Swept, and Square
Tips vs. XV-15 Metal Blade
7.35
7.36
Effect of Tip Shape on Figure of Merit for ATBwith Baseline Elliptical, Swept, and Square
Tips vs. XV-15 Metal Blade
Effect of Cuff on CT vs. Cp for Baseline ATB with
Elliptical Tip-Comparison of Truncated (Baseline),Extended, and No Cuff vs. XV-15 Metal Blade
7.37 Effect of Cuff on Figure of Merit for Baseline ATB
with Elliptical Tip-Comparison of Truncated (Baseline),Extended, and No Cuff vs. XV-15 Metal Blade
7.38 Effect of Tip Shape on Cp vs. VTI - RPM, and MTI P -Comparison of Baseline EllipticalPTip and Swept Tip
7.39 Effect of Tip Shape on C! vs. Collective - Comparison ofBaseline ATB Elliptical _ip, Swept, and Square Tips
Page
78
79
8O
81
82
83
84
85
86
87
88
89
90
91
92

CR177436
Figure No.
7.40
7.41
7.42
7.43
7.44
7.45
8.1
8.4
8.5
8.6
8.7
8.8
8.9
8. i0
LIST OF FIGURES (Continued)
Title
Effect of Tip Shape on Induced Efficiency Factor -
Comparison of Baseline ATB Elliptical Tip with
Swept and Square Tips
Effect of Cuff Shape on Induced Efficiency Factor -
Comparison of Truncated (Baseline), Extended, and
No Cuff
Comparison of Downwash Distributions for XV-15Metal Blade and Baseline ATB Rotor
Tip Vortices of Baseline ATB with Extended Cuff
Comparison of Calculated and Measured Performance
on the Advanced Technology Blade Rotor
Local Lift Coefficients, C_, at Various RadialSections on a Rotating Propeller (Reference 7)
XV-15 Metal Blade:
Moments vs. CT
XV-15 Metal Blade: Pitch Link Loads vs. CT
Baseline ATB: Hub Spindle Resultant Flap Bending
Moments vs. CT (Runs 32 and 36)
Baseline ATB: Hub Spindle Resultant Flap Bending
Moments vs. CT (Run 50b)
Baseline ATB: Hub Spindle Steady Flap Bending
Moments vs. CT - Effect of RPM
Baseline ATB: Hub Spindle Alternating Flap Bending
Moments vs. CT - Effect of RPM
Baseline ATB: Hub Spindle Steady Chord Bending
Moments vs. CT - Effect of RPM
Baseline ATB: Hub Spindle Alternating Chord
Bending Moments vs. CT - Effect of RPM
Baseline ATB: Hub Spindle Steady Flap Bending
Moments vs. RPM
Baseline ATB: Hub Spindle Alternating Flap Bending
Moments vs. RPM
Hub Spindle Resultant Flap Bending
93
94
95
97
98
100
102
103
104
105
-I06
107
108
109
II0
111
xi

CR177436
LIST OF FIGURES (Continued)
Figure No.
8.11
8.12
8.13
8.14
8.15
8.16
8.17
8.18
8.19
8.20
8.21
8.22
8.23
g.1
9.2
A.1
A.2
Title
Baseline ATB: Hub Spindle Steady Chord BendingMoments vs. RPM
Baseline ATB: Hub Spindle Alternating Chord
Bending Moments vs. RPM
Baseline ATB: Pitch Link Loads vs. CT (Runs 32 and 36)
Baseline ATB: Pitch Link Loads vs. CT (Run 50b)
Baseline ATB: Steady Pitch Link Loads vs. CT -Effect of RPM
Baseline ATB: Alternating Pitch Link Loads_vs. CT -Effect of RPM
Baseline ATB: Steady Pitch Link Loads vs. RPM
Baseline ATB: Alternating Pitch Link Loads vs. RPM
Baseline ATB: Flap Bending Moments at O.IOR vs. CT
Baseline ATB: Flap Bending Moments at O.IOR vs. CT
Baseline ATB: Steady Flap Bending Moments at 0.85R
vs. CT - Effect of RPM
Baseline ATB: Alternating Flap Bending Moments at0.85R vs. CT - Effect of RPM
Effect of Blade Sweep (Lag Angle) and Tip Shape on SteadyPitch Link Loads
Typical Near-Field Noise Data for XV-15 Metal Bladeand ATB
Typical Far-Field Noise Data for XV-15 Metal Bladeand ATB
Effect of Wind on Induced Power
Effect of Wlnd on Hover Performance
Page
112
113
114
115
116
117
118
119
120
121
122
123
124
126
126
133
134
xii

CR177436
Table No.
3.1
4.1
9.1
LIST OF TABLES
Title
Rotor Balance Load Range and Accuracy
Placement of Blade Strain Gages
Acoustic Data Recorded During Rotor Tests at NASA-Ames
Outside Aeronautical Research Facility (March 'B4 -
August '84)
14
25
127
LIST OF SYMBOLS
a
A1
B
B1
CT
Cd
C_
CNF
Cp
Cppro
Definition
airfoil section lift-curve slope
lateral cyclic
number of rotor blades
longitudinal cyclic
blade chord
blade thrust-weighted chord,
section drag coefficient
I_cx2dx
section lift coefficient
rotor normal force coefficient, NF/pnR2VT 2
rotor power coefficient, HPxSSO/p_R2VT 3
rotor profile power coefficient, profile power/p_R2VT3
Unit____ss
rad- i
degrees
degrees
ft.
ft.
xiii
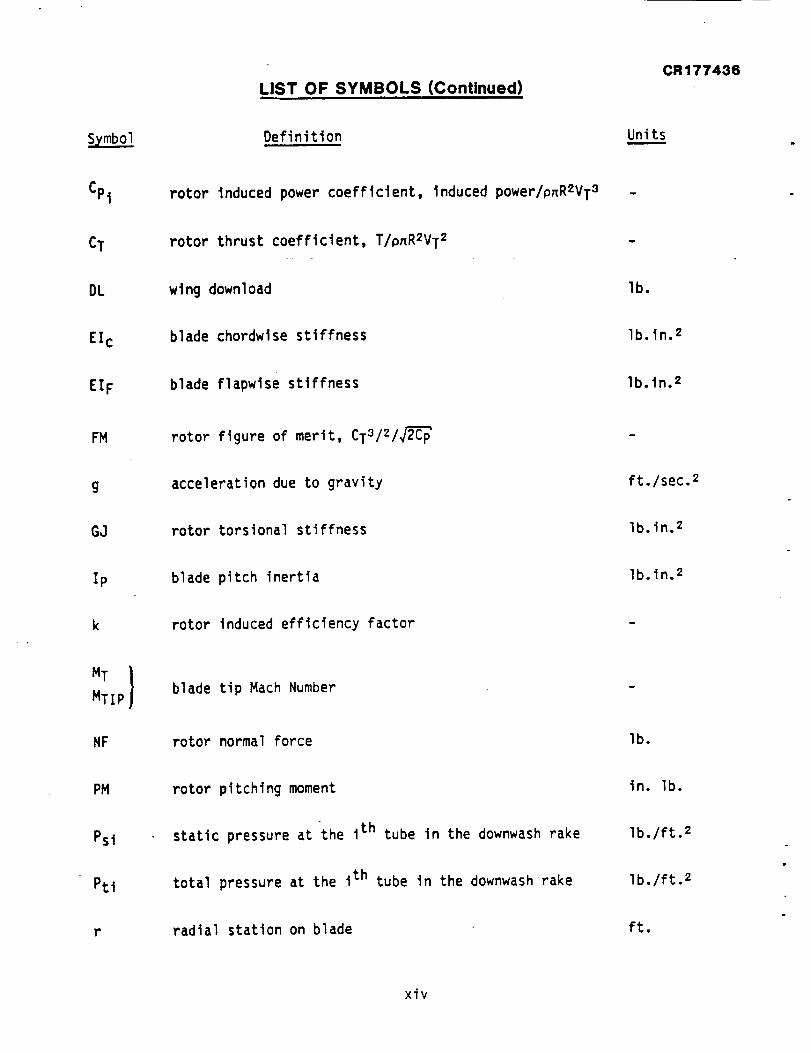
LiST OF SYMBOLS (Continued)
CR177436
Definition Units
CP1 rotor induced power coefficient, induced power/p_R_VT3 -
CT
DL
rotor thrust coefficient, T/p_R2VT2
wing download lb.
EIc
EIF
blade chordwlse stiffness
blade flapwise stiffness
Ib.ln. 2
Ib.ln. 2
FM rotor figure of merit, CT312/V_
acceleration due to gravity ft./sec. 2
GJ rotor torsional stiffness Ib.in. 2
Ip blade pitch inertia Ib.in. 2
MT}MTIP
NF
rotor induced efficiency factor
blade tip Mach Number
rotor normal Force lb.
PM
Psi
Pti
r
rotor pitching moment
static pressure at the ith tube in the downwash rake
total pressure at the ith tube in the downwashrake
radial station on blade
in. lb.
lb./ft. 2
lb./ft. 2
ft.
xiv

|
)
R
R e
RM
SF
T
Too
vi
VT
VTIp }
VWIND
X
YM
Of
_w
LIST OF SYMBOLS (Continued)
Definition
blade radius
airfoil Reynolds Number
rotor rolling moment
rotor side force
rotor thrust
rotor thrust out of ground effect
induced velocity
rotor tip speed
wind velocity
wind velocity
nondimensional blade position, r/R
rotor yawing moment
shaft angle of attack
hub gimbal angle
rotor rotational speed
ambient wind azimuth
CR177436
Units
ft.
in. lb.
lb.
lb.
lb.
ft./sec.
ft./sec.
ft./sec.
knots
in. lb.
degrees
degrees
radians/sec.
or RPM
degrees
XV

LIST OF SYMBOLS (Continued)
CR177436
air density
Definition Units
slugs/ft. 3
o local rotor solidity, Bc/_R
OT
6)o
thrust weighted rotor solidity, BCT/_R
blade root collective pitch angle degrees
e.75 blade collective pitch angle at r/R - 0.75 degrees
rotor advance ratio, V/VTI P
Subscript Definition Units
conditions when wind velocity is zero
xvi

CR177436
4
1.0 SUMMARY
This document presents isolated rotor test results conducted in two phasesat Ames Research Center in March and July/August 1984. In March a benchmark
test of the XV-15 steel blades was performed and in July/August the Advanced
Technology Blade, including a number of variations, was tested. Betweenthese two test periods, the facility was occupied by a scaled version of theV-22 rotor. All rotors tested were 25 Ft. in diameter. The V-22 test is
reported in Reference I.
Figure 1.1 shows the XV-15 aircraft in several modes of operation. Figure1.2 shows the baseline version of the ATB mounted on the test stand at NASA-
Ames. Figure 1.3 shows the untwisted blade planform and distribution ofairfoil sections for the baseline configuration.
The performance indices of both the XV-15 rotor and the ATB rotors turnedout to be significantly better than expected. Predicted and test values of
figure of merit as a function of CT for both rotors are shown in Figure 1.4.These results, along with those from configuration variations, are discussedin detail in Section 7.0. Possible reasons for the poor quality of the pre-
dictions are identified, and suggestions are made for improvements in pre-
dictions capability.
The test facility used for this program was the Outdoor Aeronautical Re-
search Facility at Ames Research Center. Major improvements to the power
transmission and performance measuring components of the NASA test rig were
funded under the program. These included provision of a 4:1 reduction gearbox which permitted testing beyond the power levels available in the XV-15
aircraft. A major improvement in the test hardware was the development of a
six-component balance with minimal load interaction, absence of thermaldrift, and direct measurement of rotor thrust and torque. These features of
the program are discussed further in Section 3.0 and in more detail in Refer-
ence 2, ......
The tests provided definitive thrust and torque data for the XV-15 steelblade and the Advanced Technology Blades. Hover performance for both rotors
(and for the V-22 rotor tested using the same equipment) was significantlybetter than that predicted using contemporary theory. The measured peak
figures of merit were all in the region .79 - .B1, whereas predicted valuesdid not exceed .79. In addition, peak performance occurs at a higher value
of CT than predicted, and does not drop off as Fast as predicted at the
higher values of CT.
The airflow velocity distribution was measured at a distance approximatelyO.4R downstream from the rotor plane. Vapor trails of the tip vortices were
generated at high CT'S in some atmospheric conditions and photographs ofthese have been used to estimate the rate of wake contraction and velocity
variation as a Function of distance from the rotor planes. These additionaldata have been used to initiate improvements in prediction methodology.

ORIG_,TAILPAG_ L_
OF POOR QUALYI_
Figure 1.1 XV-15 Tilt Rotor Research Aircraft in Cruise,Transition, and Hover
CR17743!

CR177436
ORIGINAL PAGE Ig
p_ !_OOR QUALITY
Figure 1.2 Baseline ATB Mounted on NASA-Ames OARF(Outdoor Aerodynamic Research Facility)
3

CR177436ii i
!
:z
z
o.
z
z
l--
Z
wJ
o
li
I--(/1I,-.4
®"0
m
m
0m
0C
t.1@
I--
"00_JCe8)
"0,<
O0
@
14.

CR177436
.84
.80
.56
.52
.48
.44
XV-15
TEST
ATBOARF TEST FAIRING
XV-15OARF TEST FAIRING
_.____.__ .....I "_ _ ATB LIFTING-LINE
/ _-"\/_'_._ \ THEORYPREOICTIO_
,, \ ,
/ XV-15 LIFTING-LINE \
THEORY PREDICTION
II
/I
I
/I
!
/I
l XV-15 METAL BLADEE
WRIGHT-PATERSON AFB
ATB WITH BASELINE ELLIPTICAL TIP
AND TRUNCATED CUFE
..... LIFTING-LINE PRE-TEST PREDICTION
Figure 1.4
* VTI P = 740 FPS
** VTI P = 766.2 FPS
*** = 743.5 FPSI I I VTIP I . I I
.006 .008 .010 .012 .014 .016
ROTOR THRUST COEFFICIENT (CT)
-I.004
Pretest Predictions and OARF Test Results forXV-15 Metal Blade and Baseline ATB Rotor
_------_ OARF TEST (FAIRING OF*'*RUNS 15,22,23,25,26)
!.01_
WHIRL TOWER TEST
LIFTING-LINE PRE-TEST PREDICTION* ..-.- OARF TEST (FAIRING OF***"--" RUNS 32,33,36,37 ,SO}

CR177436
Blade bending moments were recorded at a number of stations and criticalstation_were monitored for safety. This included data near the tip which
has been used to improve the mathematical modelling in this region. The
test included eight hours of endurance and structural validation testing
during which control inputs were cycled and blade frequency data wasaccumulated.
Over the test period Ames Research Center engineers monitored the near and
far-field noise levels generated by rotor operation. The Advanced Tech-
nology Blades were found to generate significantly less noise than the XV-15metal blades.
A summary of the rotor performance results along with conclusions and
recommendations are given in Section 10.0.
-. 2.0 INTRODUCTION
The XV-15 tilt rotor demonstrator aircraft has been flying successfullysince 1977 using rotor blades of the original design. These blades have a
rectangular planform and the material is steel. The blade design was opti-
mized for a 9000 Ibs. gross weight aircraft and there was no change to therotor design when the gross weight became 13,000 Ibs.
This, along with a number of other factors including fatigue strength limita-tions of the metal blades, led NASA to initiate a program to develop compos-
ite blades optimized to different performance criteria and exploiting the
range of design options made feasible by composite materials. Other objec-tives of the Advanced Technology Blade program were to demonstrate fabrica-
tion techniques appropriate to highly twisted composite blades suitable for
tilt rotor applications.
This report documents the XV-15 Advanced Technology Blade Rotor Test con-ducted at the Outdoor Aeronautical Research Facility (OARF) at NASA-Ames
during April 1984 and July 1984. The report includes a description of thetest apparatus and instrumentation, a presentation of the results, and adiscussion of the implications of the results. The detailed, fully-cor-
rected test data may be obtained from NASA-Ames 40' x 80' wind tunnel staff
in the form of computer tabulations.
3.0 DESCRIPTION OF TEST INSTALLATION
3.1 Test Stand
The Outside Aerodynamic Research Facility at NASA-Ames consists of a large
concrete pad (Fig. 3.1) with a steel platform at the center of which is
mounted a test stand carrying the propeller test rig. Details of the layoutof the stand are given in Fig. 3.2. The supporting test stand consists of a
horizontal frame carrying the motor and drive system. This frame is sup-ported in front by two braced vertical steel beams and in the rear by a
single, smaller beam. The rotor centerline lies 22 feet above the metal

CR177436
N
CONCRETE PAD
METALPLATFORM
/
- ]
\PROP. RIG
\75 TON
TRAVELLING CRANE
r --- m _ _ "_)MPUTER
INSTRUMENTATION IRACKS
CONTROL ]CONSOLE
ELEVATED ._
OBSERVATIONPLATFORM
CONTROL ROOM MOTOR-GENERATOR ROOM
(BELOW GROUND)
Figure 3.1 Plan View of NASA-Ames OARF

CR177436
_q
"0¢:
cn
W
l'-
qlm
0
@m
I
@l,,
.I=I'-
_N
@im
I.I..

CR177436
platform providing 9.5 feet of clearance between the blade tips and the
ground. The rotor hub, controls, six-component balance, gearbox and elec-tric motor with services are mounted in-llne within a 28-inch diameter cy-
lindrical cowling. The motor housing is mounted on three load cells to
provide rotor force and moment data that is independent of, and supplementalto, data from the main balance. The propeller test stand is described inmore detail in Reference 2. Additional details and strength and safety
analyses are provided in Reference 3.
3.2 Motor and Drive System
The test stand is powered by an electric motor driving through a new 4:1
reduction gearbox. The gearbox is oil cooled; the motor is water cooled.
Gearbox output shaft torque limit is 252,000 in.lb, corresponding to theelectric motor limit of 3,000 HP at 3000 RPM. This was sufficient to test
well beyond the current (design maximum 163,000 in.lb.) operating torquelimit of the XV-15. The gearbox is a Cincinnati Gear Co. epicyclic gearunit with a modified aft case to interface with the NASA motor package. The
gearbox unit mounts directly to the Face of the motor unit and supports therotor balance through the balance mounting ring. The system consists of a
sun gear around which are arranged a number of planets rolling within anannulus providing a coaxial design with power transmission at more than one
point. Fig. 3.3 presents the gearbox operating envelope and shows that thehover RPM of the ATB and XV-15 rotors (565 RPM) is within the available
operating range. Maximum RPM was limited to 625 RPM by the blade retentionstrap. Operating time below 370 RPM is also limited because of gear tooth
and bearing lubrication considerations. However, this RPM is below the
present range of interest. The motors and gearbox may rotate in either di-rection, however all the rotors tested were designed to rotate in the clock-
wise direction (viewed from the rear).
3.3 Balance
The test stand is furnished with a six-component balance. As shown in Fig-
ures 3.4 and 3.5, the rotor balance system is mounted between the hub/stack
assembly baseplate and the transmission (through the balance mounting ring).The balance has two sections. The front section is a multi-flexured,
torque-sensing element which measures the frictional torque of the bearings.The rear thrust-measuring section of the balance system consists of two
flexure plates mounted on either end of cylindrical spacer units. Theseflexure elements measure thrust and also normal force, side force, pitching
moment and yawing moment. The primary torque measurement is made by strain
gages mounted on the drive shaft forward flexible coupling. Additionalstrain gages on the flexible couplings measure the axial load in the driveshaft. This is a function of the axial motion of the main thrust measuring
flexures and amounts to approximately 3% of the total load.
Balance strain gages are of the foil type and are temperature compensated.
The primary sensitivities are in the thrust and torque directions with amaximum error of 50 lb. of thrust and 25 in.lb, of torque. The balance is
designed to withstand the loss of one rotor blade without yielding and has
9

CR177436
280000
240000
200000
Iz
_" 160000
m 120000
80000
40000
MAX ROTOR SPEED " 625 RPM
(AS LIMITED BY BLADE RETENTION)
MAX ROTOR TORQUE" 252,000 IN-LB
BOEING VERTOL
DESIGN REQUIREMENTSMIN & MAX RPM FOR MAX-
TORQUE = 360 - 650 RPM
XV-15DESIGNHOVER
RPM
100 200 300 400 500
OUTPUT SHAFT SPEED (RPM)
600
Figure 3.3 Gearbox Operating Envelope
700
lO

CR177436
(
\
.ORIGINAU PAGE IS
DE POOR QUALITY.
\
\\
\
EQi
,ll
tO
@OC
u
m
o
oee
CIDC0Q.
E0oIx
c_
,It
c4@L_
IJ.
11

CR177436
t
g,
,-r
12

CR177436
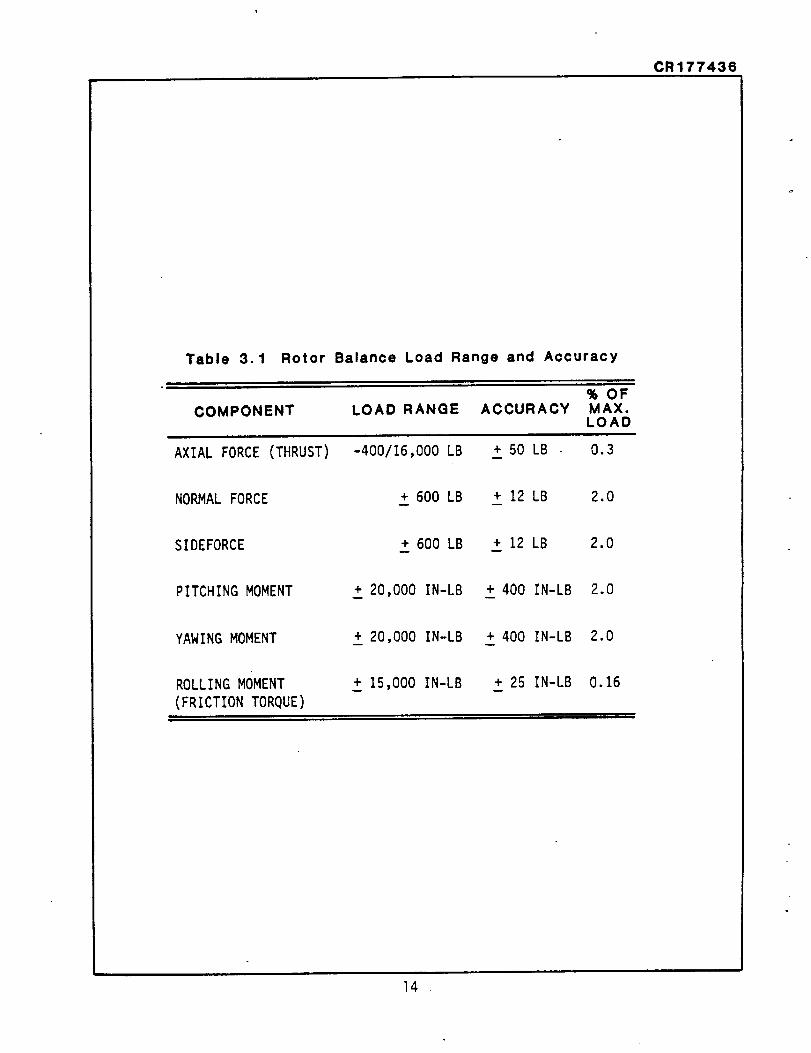
infinite life over the normal operating load range. Axial load range is
-400 to 16,000 lb. and _he torque range is 0 to 252,000 in.lb. Table 3.1
summarizes the design load ranges and accuracies for the rotor balance. The
flexible couplings are designed to measure a maximum torque of 252,000 in.lb.
with an accuracy of ± 120 in.lb.
3.5 Hub and Controls
The 3-bladed gimballed rotor hub and upper controls are XV-15 rotor compo-nents defined by BHT Drawing No. 300-018-012. The ATB pitch housing was
designed to be compatible with this hub. The upper controls provided con-trol by collective, longitudinal and lateral pitch. Collective pitch motionwas transmitted through the center of the shaft and was controlled by a hy-
draulic actuator. Longitudinal and lateral cyclic motion was provided
through the rotating swashplate. The motions of the nonrotating swashplatewere controlled by electric linear actuators. Both collective and cyclic
pitch actuator control systems were open loop with the electric cyclic pitchactuators rate-limited to 0.5 deg/sec. Collective pitch motion was limited
to a range of -4 to 25 degrees; cyclic pitch was electrically limited to ±
3.0 degrees and a mechanical stop was provided at ± 4.0 degrees.
The complete hub/stack assembly was mounted on a base plate (actuator plate)which was also the mounting point for the control actuators and the connect-
ing element to the balance system. A slipring assembly with 48 rings wasincorporated within the stack to provide transmission of data from the ro-
tating components to the data acquisition system.
A cowling covered the upper controls and balance and was attached to the
motor casing. The cowling provided weather protection.
3.6 Rotors
3.6.1 Advanced Technology Blade Rotor
The ATB rotor is a three-bladed, 25 ft. diameter rotor with a thrust-weight-
ed solidity (oT) oF 0.10, which is 12.3% more than the solidity of the XV-15steel blades (.089). The blades are of composite construction. Theoretical
blade chord, twist, and thickness/chord distributions for the baseline ATB
are given in Figures 3.6, 3.7, and 3.8 respectively. Sectional propertiesare given in Figures 3.9 through 3.13. Estimated blade frequencies in the
cyclic and collective modes are shown in Figure 3.14 along with test measure-ments. The blades were inspected for fidelity to the design values of twist,
chord, airfoil contour and surface condition, and were Found to be acceptable.
The rotor blades were instrumented to record flap, lag, and torsional mo-
ments at selected spanwise positions. Details of the instrumentation are
given in Section 4.0, Table 4.1.
Figure 3.15 is an exploded view of the advanced technology blade with call-outs of the various materials. Figure 3.16 presents the baseline ATB con-
figuration with the alternate tip and cuff sections that were tested.
13
CR177436
Table 3.1 Rotor Balance Load Range and Accuracy
COMPONENT LOAD RANGE ACCURACY%OFMAX.LOAD
ii
AXIAL FORCE (THRUST) -400/16,000 LB + 50 LB 0.3
NORMAL FORCE + 600 LB + 12 LB 2.0
SIDEFORCE + 600 LB + 12 LB 2.0
PITCHING MOMENT + 20,000 IN-LB + 400 IN-LB 2.0
YAWING MOMENT + 20,000 IN-LB + 400 IN-LB 2.0m
ROLLING MOMENT
(FRICTION TORQUE)• ,,r I
+ 15,000 IN-LB + 25 IN-LB 0.16
14

CR177436
I,i-r-
Z
i,i
v
I--
28
24
20
16
12
m
8 --
4 --
0
40 --
30--
20 -
I0 -
00
I I 1 I l I.2 .3 .4 .5 .6 .7
RADIAL STATION (r/R)
I I I.8 .9 1,0
Figure 3.6 Baseline ATB Chord Distribution
.1 .2 .3 .4 .S .6 .7
RADIAL STATION (r/R)
Figure 3.7 Baseline ATB Twist Distribution
15

CR17743(
(J-....4J
0
¢.J
,,,1-F-
.4 -
.3 -
o_ _
o I I , I I I I I I I• [ .2 .3 .4 .5 .6 .7 .8 .9
RADIAL STATION (r/R)
Figure 3.8 Baseline ATB Thickness/Chord Distribution
I1.0
lO00
800
X
oa 600
_ 400
_J ZO(]
00
m
I I I I I I I I.1 .2 .3 .7 ,8.4 .5 .6
RADIAL STATION (r/R)
,9 I.O
Figure 3.9 Baseline ATB Chordwise Stiffness Distribution
]6

CR177436
5OO
40O
e,-i
x
300z
I
"" 200
_JI.z.
1,--4I00
120
100
x 80
z
I60
40
2O
w
I t I I I I i I I I
,1 .2 .3 .4 .S .6 .7 .8 .9 I.O.
RADIAL STATION (r/R)
Figure 3.10 Baseline ATB Flapwise Stiffness Distribution
370
I I I I I I 1 I "--P----_ I• l .2 .3 .4 .5 .6 .7 .8 .9 1.0
RADIAL STATION (r/R)
Figure 3.1 1 Baseline ATB Torsional Stiffness Distribution
17

CR177436
12 -
ZI,-q
z
I
..J
• _ 6 -
c_L_Jz
-r
_- 2 -
0
3.2
2.8
_-_ 2.4z
I
co.J_-_ 2.0
z0h-q
:_ 1.6 -CO
1.2 -
(.r)
.8 -
00
I I I I I I
.1 .2 .3 .4 .5 .6
RADIAL STATION (r/R)
WEIGHTS
I r I "I.7 .8 .9 1.0
Figure 3.12 Baseline ATB Pitch Inertia Distribution
B
I I
.1 .2
Figure 3.13
I I " I I I 1
.3 .4 .5 .6 .7 .8
RADIAL STATION (r/R)
Baseline ATB Mass Distribution
I I
.9 l.o
18

CR177436
v
>-_.)zw
CD"
IJ.
ATB COUPLED ROTOR NATURAL FREQUENCIES
N
:)..OZ
C"
,.,.,l.i.
70-
60-
50-
40-
PRETEST PREDICTIONS_
TEST RESULTS x (e.75
COLLECTIVE MODES
/
• I0°)
/
,/ xx/
/
/ 3/REV
/21REV
0 o
Figure 3.14
I00 2oo 3oo 4o0 5oo 6oo 7uoROTOR SPEED (RPM)
Comparison of Pretest Frequency Predictionswith Per Rev Crossings and Spectral AnalysisPeaks for Collective and Cyclic Modes
19

CR177436
_00"
m
.12
E
!
m
@
m
Io
i
m
0u
0c
I-,
(.1
>
<
tD
@L_
20

CR177436
ILlZm
..IUJ
m
a.l-
IJJZ..J--<"JoIJJ--O_l--<a.m.j
..IIJJ
M.IL
0
W
<0Z
rrI-
a.I-
O.UJ
U)
a.m
ILl
<
0U)
r
U.u.0U.U.
0
U.1,1._
com4_
(0b.
mq_m
c0
b
0
"ot.-
0.!
I,.-
G)4,,*
cL
04dm
,<
J::4_!
mI-.-<
o
(0rn
(D_m
otm
u.
21

CR177436
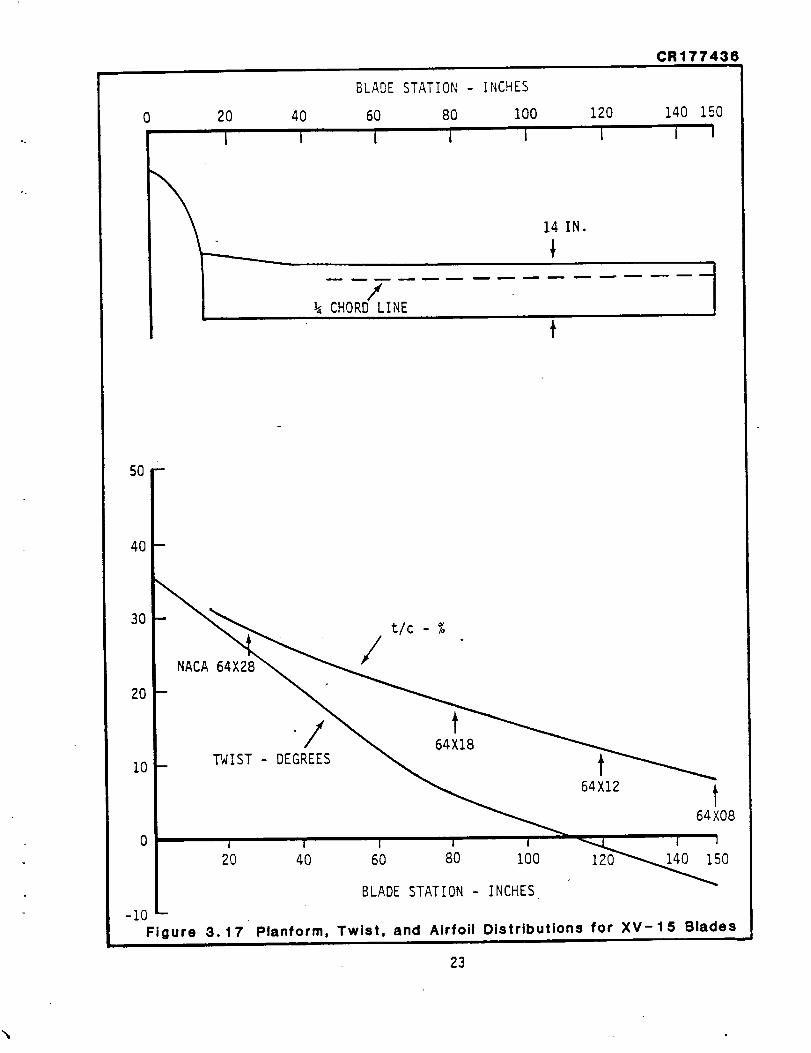
3.6.2 XV-15 Rotor
The XV-15 blades tested in this program were the same full scale blades that
had been previously tested" by Bell Helicopter Textron Corporation on the
Wright Patterson Air Force Base (WPAFB) whirl tower during the XV-15 devel-
opment program (Reference 4). The planform, twist, airfoil and thickness/chord distributions are shown in Fig. 3.17.
4.0 INSTRUMENTATION
4.1 Instrumentation - General
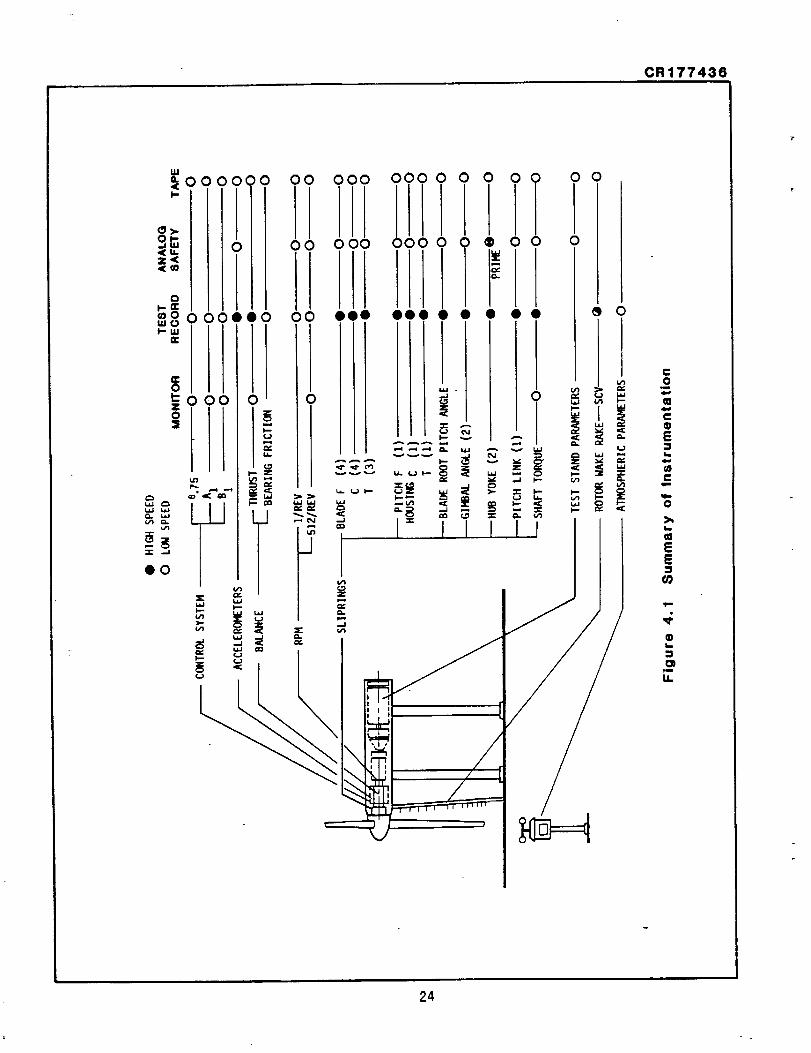
The instrumentation installed for the ATB and XV-15 steel blade tests is
indicated in Figure 4.1. This shows the type of data measured and whichvariables were monitored for safety. All data was recorded on magnetic
tape. All non-steady state variables were subject to high speed sampling.
4.2 Rotor Balance Instrumentation
The rotor balance was instrumented to measure six components of rotor force
and moment: thrust, sideforce, normal force, pitching moment, yawing mo-
ment, and rolling moment. Thrust and rolling moment measurements were sig-
nificantly more sensitive than the others, as indicated in Table 3.1. Thedrive shaft flexible coupling was instrumented to measure torque and axial
force. The balance rolling moment (bearing friction torque) was subtracted
from the shaft torque to provide the net rotor torque. The drive shaftaxial force was added to the balance thrust measurement to give the rotor
thrust. Balance temperature was continuously monitored by thermocouples.
4.3 Blade and Hub Instrumentation
The instrumented blade was strain gaged to measure torsion, flap bending,
and chord bending at the radial stations shown in Table 4.1. All gages were
mounted on the spar beneath the airfoil contour.
Hub instrumentation was provided to measure control system position (e.75,
At, BI), hub gimbal angles, root collective, pitch-link load, and hub yokemoments. Transducers were installed in the rotating system Chub and drive
system) to measure the following:
(a) Blade pitch angle - measured by a potentiometer mounted on the blade
housing. The potentiometer was a custom-fit resistance element with
wiper arm.
(b) Hub gimbal angle - measured by a potentiometer attached to the gimbalinside the hub.
(c) Hub yoke bending moments - measured by strain gages mounted on the hub
spindles; both flapwise and chordwise gages were provided.
22
CR177436
BLADE STATION - INCHES
20 40 60 80 100 120 140 150
CHORD LINEi
t
3O
2O
I0
0
NACA 64X28/
t/c - %
./ t64X18
TWIST - DEGREES t64X12 t
64X08
20 40 60 80 I00 I 140 150
BLADE STATION - INCHES
-i0Figure 3.17 Planform, Twist, and Airfoil Distributions for XV-15 Blades
nl
23
CR177436
,oooo,ooo iooTToTTT°' ii....0,o°°iTT!!°°iii
o __" '" " I" I I
eo I
_ ..J
\.-,..
X
I/I
Z
w-,.Jv1
J
I: 11I'I
i _ t rS"
J
[
/
CO
!
EL_
u
O
SE
4OL_
U.
24

CR177436
Table 4.1 Placement of Blade Strain Gages
PERCENT RADIUS
FLAP
CHORD
TORSION
10.0 (1) 20.6 29.0 49.0 69.0 84.0
10.0 (1) 20.6 30.0 50.0 70.0 85.0
- - 30.0 51.0 71.0 -
NOTE: 1) ON PITCH HOUSING
2) ON HUB SPINDLE THERE WERE IN- AND OUT-OF-PLANEBENDING GAGES AT 6% RADIUS
3) SEE RUN LOG FOR ADDITIONAL INFORMATION
25

CR177436
(d) Pitch link load - measured by a strain gage bridge on the pitch link.
(e) Flexible coupling torque - measured by strain gage bridges (active andspare) on the forward flexible coupling of the drive shaft.
(f) Flexible coupling axial load - measured by strain gage bridges on theforward Flexible coupling.
(g) Forward shaft bending - measured by (2) perpendicular bending bridgesmounted on the rotor shaft.
(h) Rotor I/rev and 512/rev - measured by a phototachometer on the drive
shaft.
(i) Hub acceleration - measured by accelerometers mounted on support struc-ture near the hub.
The signals from the rotating system were transferred to the Fixed system
through a 48-ring slipring assembly. As configured, the test stand was lim-ited to 10 channels on the slipring. For the hover performance test, the
recorded parameters and their corresponding slipring channels requirements
were as follows:
Parameter Channels Required
*Shaft torque
*Shaft axial load (AFFLEX)
*Pitch housing flap bending @ r/R = .10
*Pitch housing chord bending @ r/R z .10
*Pitch link load
Root collective
*Gimbal angle
Blade flap bending @ r/R = .31
*Hub yoke chord bending
*Hub yoke flap bending
*Required for safety
Although only 10 channels were available on the slipring at any one time,these channels could be reassigned to read other strain gages, if desired.
26

CR177436
4.4 Wake Rake
A wake rake consisting of 22 pitot-static tubes was mounted behind the rotor
disc plane at the station corresponding to the wing upper surface. The pur-pose of the rake was to measure the isolated rotor slipstream velocities and
angles under different rotor operating conditions and to use this data tounderstand the structure of the rotor slipstream and the wing download andits distribution. The wake rake was connected to a Scanivalve to measure
the pressures. The wake rake and the spacing of the pitot-static tubes is
shown in Fig. 4.2.
4.5 Anemometer
A wind speed and direction transducer was installed on a narrow tower ap-
proximately 200 feet north and 200 feet east of the rotor hub centerline.The indicator was on approximately the same level as the rotor hub. The
signals from the transducer were fed to the data acquisition equipment inthe control room.
4.6 Acoustical Measurements
Near-field and far-field noise levels were measured. The near-field micro-
phone represented a point on the side of the fuselage of a typical tiltrotor in hover. Far-field noise was recorded by an array of microphones at
250 ft (76m) and 650 ft (198m) radius at O, 15, 30 and 45 degrees behind therotor disc.
5.0 DATA ACQUISITION AND REDUCTION
5.1 Data Acquisition
The NASA-Ames OARF data system provided signal conditioning and amplifica-tion for 50 data channels. Steady-state data were recorded on digital tape.
A quick-look short-form print-out was provided at the end of each run and a
detailed print-out was processed overnight. A monitor program displayed upto 15 steady-state parameters on the Test Engineer's CRT. Two analog tape
recorders were used for safety monitoring and acquisition of dynamicdata.
Complete details of the assignments of the data acquisition equipment are
given in References 2 and 5.
The following quantities were measured:
Rotor balance thrust, T (lb.)
Rotor balance normal force, NF (lb.)Rotor balance side force, SF (Ib)
Rotor balance pitching moment, PMB (in.lb.)
Rotor balance yawing moment, YMB (in.lb.)Rotor balance rolling moment, RMB (in.lb.)
Load cell axial, normal, and sideforces (lb.)Rotor RPM
Shaft torque (in.lb.)
27

CR177436
TUB_._EE r/R
I .2O2
2 .2C53 .221
4 .265
5 .289
6 .3347 .428
8 .5679 .627
I0 .655ii .72012 .75613 ,80114 .80615 .85816 .90517 .956
18 1.02319 1,07C20 1.18721 1.1722 1.22
5-POINT YAW
(9 PLACES)
PLAIN
PITGT-STATIC
PROBE
(13 PLACES)
Flgure 4.2
O
STA 84.05"
Wake Rake. Details
TUBE DETAIL
28

CR177436
Shaft axial load AFFLEX (lb.)
Hub gimbal angle, B (degrees)Blade root collective, eo (degrees)Lateral cyclic (swashplate axes), A1 (degrees)
Longitudinal cyclic (swashplate axes), BI (degrees)
Blade collective pitch, e.75 (degrees)
Blade flap moment at 31% radius (in.lb.)Blade chord moment at 10% radius (in.lb.)
Pitch housing flap moment at 10% radius (in.lb.)
Pitch housing chordwise moment (in.lb.)
Pitch-link load (lb.)
Ambient wind speed, VWIND (knots)
Ambient wind azimuth, _w (degrees)Ambient temperature (°F)Ambient barometric pressure (psi)
Relative humidity, (percent)
Hub horizontal acceleration (g)Hub vertical acceleration (g)
5.2 Data Processing
The data reduction program (Reference 6) performed the following operations:
(a) Subtracted non-rotatlng zero values.
(b) Converted corrected voltages to engineering units.
(c) Computed rotor forces and moments from load cell readings.
(d) Computed rotor balance forces and moments from balance flexure
outputs.
(e) Corrected rotor balance forces and moments for component interac-
tions through the respective balance calibration matrices.
(f) Corrected rotor balance data for temperature effects, if
significant.
(g) Corrected rotor balance thrust for flexible coupling axial load.
(h) Corrected rotor shaft torque For bearing friction (balance rolling
moment).
(i) Transferred rotor balance data to the reference body axis (rotor
hub centerline).
(j) Corrected rotor torque for wind effects, using the method present-
ed in Appendix A.
29

CR177436
(k) Computed atmospheric data from temperature, humidity, and pressuremeasured at the test site.
(1) From the corrected data, computed rotor parameters (VTIP and MTIP)
and coefficients (CT, Cp, etc.) as well as rotor horsepower and
figure of merit.
Provisions were made to harmonically analyze all rotating parameters (blade,
hub, shaft and control System) and vibratory balance flexure and fixed
system accelerometer data at Boeing Vertol.
6.0 TEST RECORD AND DATA ACCURACY
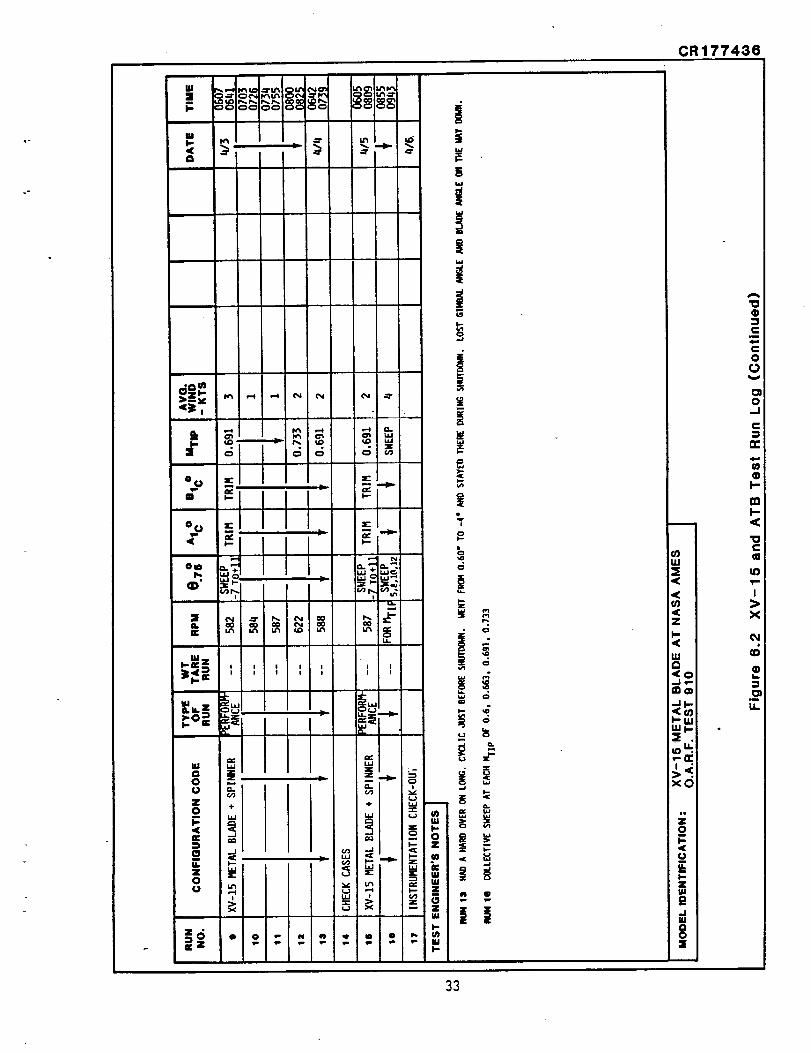
The chronology of the testing is presented in Fig. 6.1 and the XV-15/ATB
Test Run Log in Flg. 6.2. A rigorous calibration of the rotor balance had
been performed at the place of manufacture before assembly of the propellertest rig at the OARF. Following installation of the rig at Ames, anothercalibration was made which included checks for thermal drift effects on bal-
ance readings and a determination of the interaction between the torque andaxial forces at the flexible coupling. The contribution of the flexible
coupling axial load (AFFLEX) was also determined. This accounts for approx-imately 4% of the net rotor thrust. This check calibration showed that theinstalled balance was behaving to specification and that the data obtainedfrom the load cells was in close agreement with the balance data.
The XV-15 blades were installed, checked out, and testing commenced.
Initial results indicated that the rotor performance was lower than
expected. This was caused by an improper pretest procedure for obtainingR-cals in which the collective actuator was moved to maximum stroke andinduced a false load indication in the balance. When this was understood, a
new check calibration was performed using the minimum collective setting for
zeroes. The results are presented in Figures 6.3 t_rough 6.11. The check
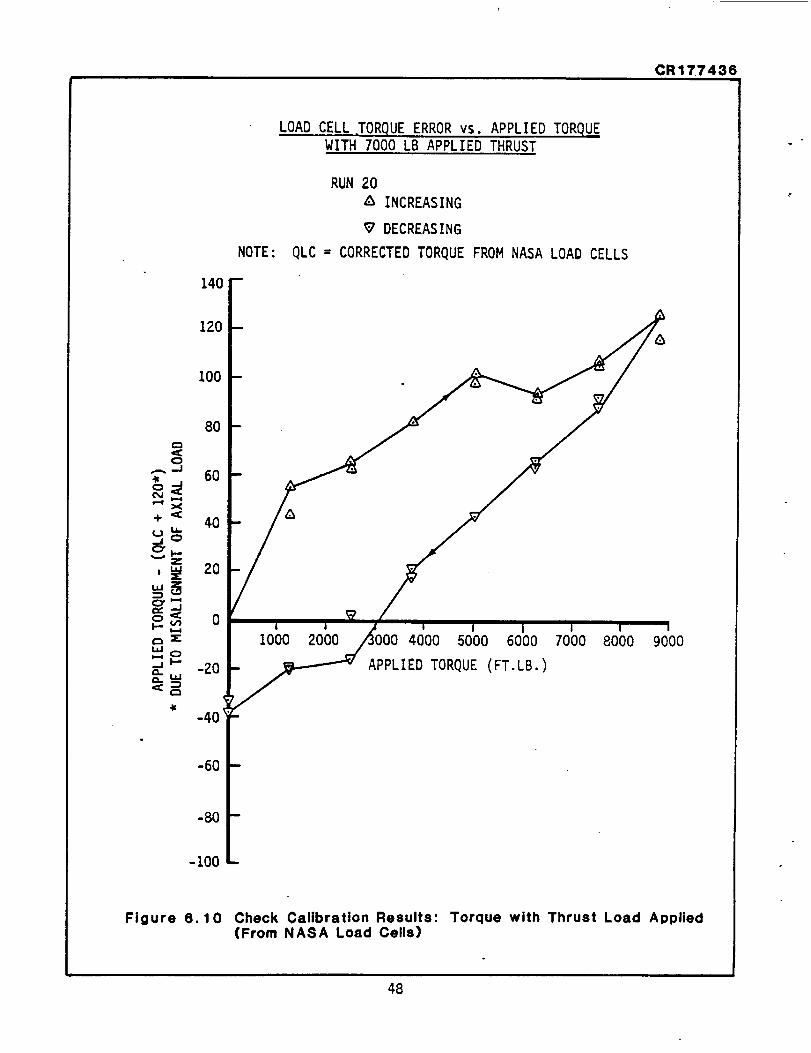
calibration was made with thrust and torque loads applied singly and incombination. The maximum applied thrust was 7000 lb. which corresponds to a
CT of .01 at hover RPM. At this condition the error'In rotor thrust wasonly 0.03 percent, as read from the balance (Fig. 6.3). The load cellresult was 0.4 percent off (Fig. 6.4). Some hysteresis is evident in both
systems. Figures 6.5 and 6.6 present the variation of the differencebetween the actual and measured torque for a range of applied torque levels.
The torque balance error is 0.3 percent (Fig. 6.5). The load cell checkcalibration shows considerable hysteresis compared to the balance (Fig.
6.6). Figures 6.7 and 6.8 present the variation of the difference between
the applied and measured thrust at various torque levels, for a constant
applied thrust of 7000 lb. Figures 6.9 and 6.10 show the variation betweenthe applied and measured torque with a constant applied thrust of 7000 lb.The errors are essentially the same as for the case with zero torque
applied. Figure 6.11 shows the effect of RPM on the correlation of balance
and load cell thrust.
30

L_
l.U
>-,<
<I
CR177436
mI-'-,<
"0c:
tO
I
X
0tim
¢)
"o
(.ICO
I-.
,t,m
Im
om
1.6
31

CR177436
32
CR177436
i!
i
r-.
--, o
.J
c
-I
c
rr
mi-<"oc
LOtim
I>x
_N
@
.__tL
33

I Q ),. o,,a:= z
LM
IM ,m I_J 0
Qe'3o
°Wm _" Z i,-
_z
mQ
|P
I
|
CR177436
=:
o=..J
n-4mW®
I-.
rn
<
tt_1ira
I=)x;
qD
t.,
..=U.
34

CR177436
C_C r-I,,-1 OC:
35
+

%
0 I _. _ p,_
°; _ . _
4 .,
il•_ ®t
,,N ,,g
t l m! s i!-oE_
36
ORIG/NAU PAGE IS
OF POOR QUALITY
CR177436
C
==
o_.J
n-
.<
_0
[X ¸
Im
I.I.

CR177436
°
!
!B[
. _ ._ __• _ _._.
. .o_ _
.... _ z
_
" i[/s, __
Iw I I I I
c
=.
-J
I-
m ¸
I
X
I*i
37

CR177436
C
=:
--I
I-
tO
x
38

CR177436
!
i
o _ _
. _" _ g' ?
°_._ _
_ -_[_ _o"
"||||1
w..J
I---
uJI-
u.
o
i,i
,<
.1{U),<Z
p..<
m).-.<
n
l0
,<
I-Ilu
Ikl
0I
39

CR177436
lU
4[ co coa
aE,c
IQ
i
°
!Q-
"o!==i
--I
Cm
tOim
I
C_i
L..
u_
40

CR177436
BALANCE THRUST ERROR Vs. APPLIED THRUST
RUN 20® INCREASING LOAD
G DECREASING LOAD
i000 4000 5000 6000 )0
APPLIED THRUST LOAD (LB)
(FROM SINGLE AXIS LOAD CELL)
Figure 6.3 Check Calibration Results: Thrust (From Rotor Balance)
41

Figure 6.4
CR177436
LOAD CELL THRUST ERROR vs. APPLIED THRUST
RUN 20
_INCREASING LOAD
DECREASING LOAD
2O
_ .
' 0 I I / I I I I I I. looo/2000_ooo4000500060007000/
_-lOJ[-- _PPLIED THRUST LOAD (LB)
(FROM SINGLE AXIS LOAD CELL)
_ -20_-3o
Check Calibration Results: Thrust (From NASA Load Cells)
42

CR177436
120 -
i00 -
"" 80 -
,_J
i,-._ 60 -
" 40 -
I
"' 20 -
I-.-
_ 0
BALANCE TORQUE ERROR vs. APPLIED TORQUE
RUN 19® INCREASING LOAD
0 DECREASING LOAD
NOTE: TORQUEC : CORRECTEDTORQUE FROM ROTOR BALANCE
-20
-40 --
-60 -
_ "-' I i 'I
000
®
Figure 6.5 Check Calibration Results: Torque(From Rotor Balance)
43

CR177436
LOAD CELL TORQUE ERROR vs. APPLIED TORQUE
RUN 19& INCREASING LOAD
DECREASING LOAD
NOTE: QLC = TORQUE FROM NASA LOAD CELLS
120
100
i000 2000 3000 5_bo 6000 7000 8000
ACTUAL TORQUE (FT.LB.)
9000
Figure 6.6 Check Calibration Results: Torque(From NASA Load Cells)
44

CR177436
._J
]--
..rp-
40
30
20_J
.._]
_- 10
I
)--
= 0-r-)-.
'-_ -10z
..J<:
_- -20O
-30
BALANCE THRUST INTERACTION DUE TO TORQUE
WITH 7000 LB APPLIED THRUST LOAD
RUN 2O
® INCREASING
O DECREASING
I00_/2o0o 30'00_000 s_o'_OOO-_80-0-0-_oo
- APPLIED TORQUE (FT.LB.)
Figure 6.7 Check Calibration Results: Thrust with, Torque Load Applied (From Rotor Balance)
45

CR17743!
LOAD CELL THRUST INTERACTION DUE TO TORQUE
WITH 7000 LB APPLIED THRUST LOAD
RUN 20
INCREASING
DECREASING
40
30
20==-r.).-
t-,w
-_ 10a.
,.c
I
_- 0f,.,r):D
.n,-
-10._I
'-'-20,,={:C_
-30
I I I i I I I I I
I000 2000 3000 4000 5000 6000 7000 8000 9000
APPLIED TORQUE (FT.LB.)
Figure 6.8 Check Calibration Results: Thrust withTorque Load Applied (From NASA Load Cells)
46

CR177436
BALANCE TORQUE ERROR vs. APPLIED TORQUE
WITH 7000 LB APPLIED THRUST
RUN 2O
® INCREASING
140
120
100
80
no,-,, 60e,,
+_40
20
,3
d: 0X
Ro
-60
-80
NOTE:
0 DECREASING
TORQUEC = ROTOR TORQUE CORRECTED FORFRICTION TORQUE (RMRBI) AND
AFFLEX INTERACTION
RMRBI = ROLL MOMENT (CORRECTED) FROM
ROTOR BALANCE
' ' ' '
0 8000 9000
_ APPLIED TORQUE (FT.LB.)_
-i00 -
Figure 6.9 Check Calibration Results: Torque with Thrust Load Applied(Corrected for Friction Torque and AFFLEX Interaction)
47
CR177436
LOAD CELL TORQUE ERROR vs. APPLIED TORQUE
WITH 7000 LB APPLIED THRUST
NOTE:
140 -
120 -
100 -
RUN 20
INCREASING
DECREASING
QLC = CORRECTED TORQUE FROM NASA LOAD CELLS
&
80
"-"-J 60.m
N
x
+ ,_40
la.
.....,l...-z
, _ 20
g- -J
_ Z
_ _ -20_. u.l
.Ic-40
-60
-80
-I00
1000 2000 4000 5000 6000 7000 8000 9000
APPLIED TORQUE (FT.LB.)
Figure 6.10 Check Calibration Results: Torque with Thrust Load Applied(From NASA Load Cells)
48

CR177436
O0
$
(_7) l_n_Hl 773_ OV07 - lsn_H1 _NV7V8
tm
J:I--
00
0_1
J_
W
i-.
I'-
0
C
m
0
0
@
0
@
0
a.
0
@
@
i1_
49

CR177436
The rake to measure rotor induced velocity was installed and calibrated to-
ward the end of the XV-15 blade testing and only a limited amount of suchdata is available for these blades.
At the completion of the benchmark testing on the XV-15 steel blades the rig
was handed over to the V-22 program (formerly known as the JVX) for rotor
performance and download testing of a scaled rotor and semispan wing instal-lations. This V-22 test program is reported in Reference I.
At the conclusion of the V-22 testing the rig was refurbished and an inter-
mittent problem with the force readout from the drive system flexible cou-
pling gages (AFFLEX) was resolved. The AFFLEX signal is a measurement ofthe thrust force in the drive shaft when this is stretched or compressed by
flexure motions In the main balance. This component of thrust was measured
by bridges located 180 degrees apart in the flexible coupling so that i perrev components of force would cancel. One set of gages was found to be
malfunctioning and these were disconnected. The AFFLEX signal was thenrecalibrated with the rotor in the azimuthal location where the i per rev
component passed through zero.
In subsequent testing the rotor was set to this position while pre- and
post-test zeroes were being taken.
The Advanced Technology Blades were installed and testing commenced in thebaseline configuration (i.e., elliptical tip and truncated cuff). This was
followed by configuration variations which included a full airfoil cuff,
swept and square tips, cuff removed, and changes In blade sweep. A checkcalibration of all measuring systems was performed at the conclusion of
testing. This confirmed that accuracy was to the same standard of excel-
lence as at the beginning of the test program.
7.1
7.0 ROTOR PERFORMANCE
xv-15 Metal Blade Performance
The performance of the XV-15 metal blades at the nominal operating tip Machnumber of 0.69 is presented In Fig. 7.1 as a plot of rotor thrust coeffi-
cient vs. rotor power coefficient corrected to zero wind conditions. The
data was gathered during six separate runs and the data scatter is small. Amean line was faired through this data and used to calculate the rotor fig-
ure of merit shown on Figure 7.2. Note that this figure of merit curve al-
ways falls below the line faired through the individual values of figure ofmerit, calculated from each test point. This is the correct method for de-
fining the average rotor figure of merit; the average thrust - power rela-
tionship for the rotor is first determined, then quantities, such as figureof merit, which are functions of this relationship, may be computed. Peak
figure of merit for the XV-15 rotor Is 0.791 at a thrust coefficient of
0.0105. Also shown in Figure 7.2 is the performance of the XV-15 rotor astested on the Wright Patterson AFB whirl tower in 1973 (Reference 4). The
data has been adjusted for the effects of the tower. This comparison shows
that the shape of the curve is the same. The peak figure of merit occurs atthe same thrust coefficient but has a lower value.
50

CR177436
f
I
1,0 ,d"
(I_) IN31gI_30D ISQ_HI _010_
0
I'-0
I
X
b.
m
U.
51

CR177436
.84 0
•80
.76
.72
g_ .6a
_ .64
•60
NASA-AMES O.A.R.F. TEST 910
XV-15 METAL BLADE
_YMBOL RUN RPM VTIP MI'IP VWIND
0 15 587.7 769.3 .690 1.0
22 582.8 762.9 .691 0.4
23 583.7 764.1 .689 1.1
25 586.1767.2690 2626 586.2767.3.68_2_7
0
0
O0 <> OARF TEST FAIRING
/
WPAFB TEST FAIRING
(CORRECTED FOR WHIRL TOWERBLOCKAGE EFFECTS)
.56
.52
m
0
.48 - !.004
I• 006
NOTE:
.008
LINE IS FROM FAIRING OF CT vs. Cp DATA
POWER COEFFICIENT CORRECTED =OR WI._IDVELOCITYAND OIRECTION
RPM, TIP SPEED, TIP MACH NO., AND WIND VELOCITYARE THE AVERAGED VALUES FOR EACH RUN
I I I I•010 .012 .014 .016
I.018
ROTOR THRUST COEFFICIENT (CT)
Figure 7.2 XV-15 Figure of Merit
52

CR177436
Figure 7.3 presents the variation of thrust coefficient with collective
pitch. The collective pitch values have not been corrected to zero windconditions. It is estimated, however, that the correction would reduce the
collective by 1 degree, at most. Also shown on Figure 7.3 is data (withoutcorrection to collective for tower blockage) from the whirl tower test of
Reference 4. It is not known why there is a 4 degree difference between thetwo sets of data. The collective pitch settings recorded in the present
test of the XV-15 metal blades appear to be incorrect, and are presented
only as confirmation of the shape of the curve of CT vs. e.75 Calculationsusing performance codes support the WPAFB values of collective as does
flight test experience.
Maximum thrust was not reached because alternating loads increased rapidly
above a CT value of .0161. Figure 7.3 suggests, however, that a reasonable
value for maximum thrust coefficient for XV-15 would be .0165, i.e. CT/aTMAX= .185.
One measure of rotor induced efficiency is k, as defined by
CT3/2
Cp + k: CPo
where k = 1.0 corresponds to ideal induced efficiency. The value of CPo is
defined by linear extrapolation to zero thrust of the curve of CT3/2 vs. Cp.This data is presented in Figure 7.4 and was used to compute the values of k
presented in Figure 7.5.
The sensitivity of the XV-15 rotor performance to tip Mach number is pre-
sented in Figures 7.6 and 7.7. Tip Mach number was varied From 0.60 to0.73. No well-defined trend is evident although there is a tendency for
reduced performance to accompany increases in Mach number.
The distribution of downwash velocity in the wake of the rotor was measured
by the wake rake described in Section 4.5. The rake was positioned so that
the ends of the probes would coincide with the probable location of the up-per surface of a wing. At 75 percent radius the distance from the rotor
disc to the XV-15 wing surface is O.40R.
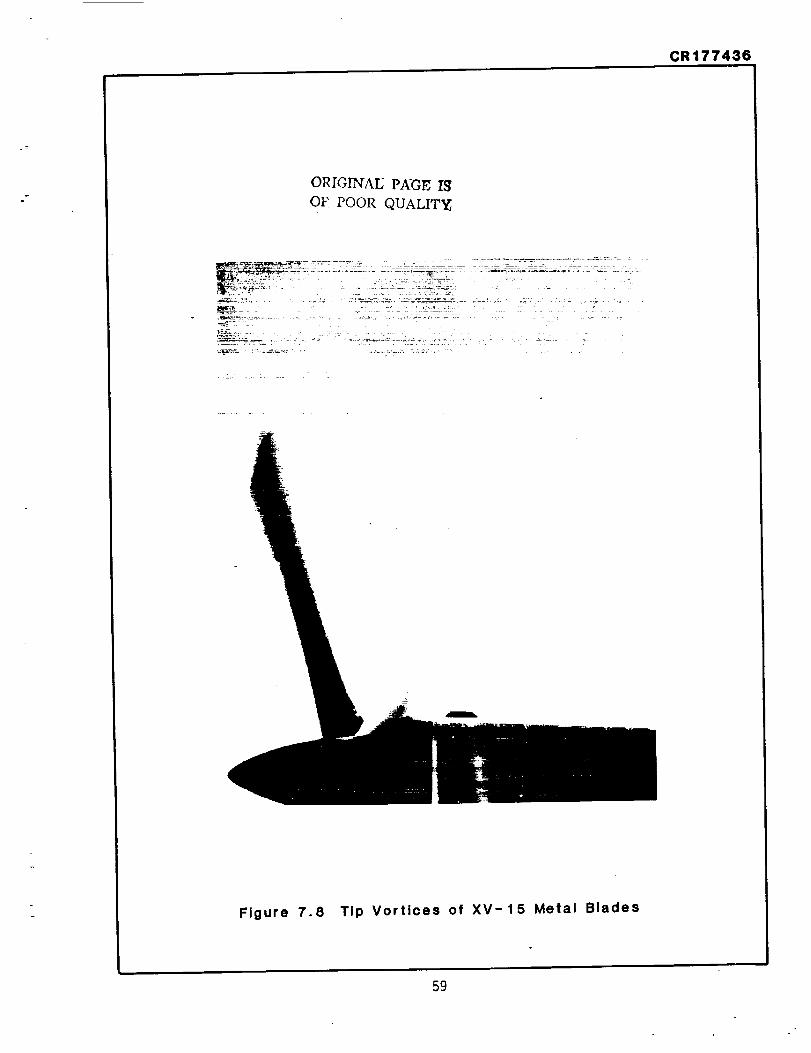
In addition to measurements of the wake, a limited series of photographswere obtained of the tip vortices made visible by water vapor condensation.
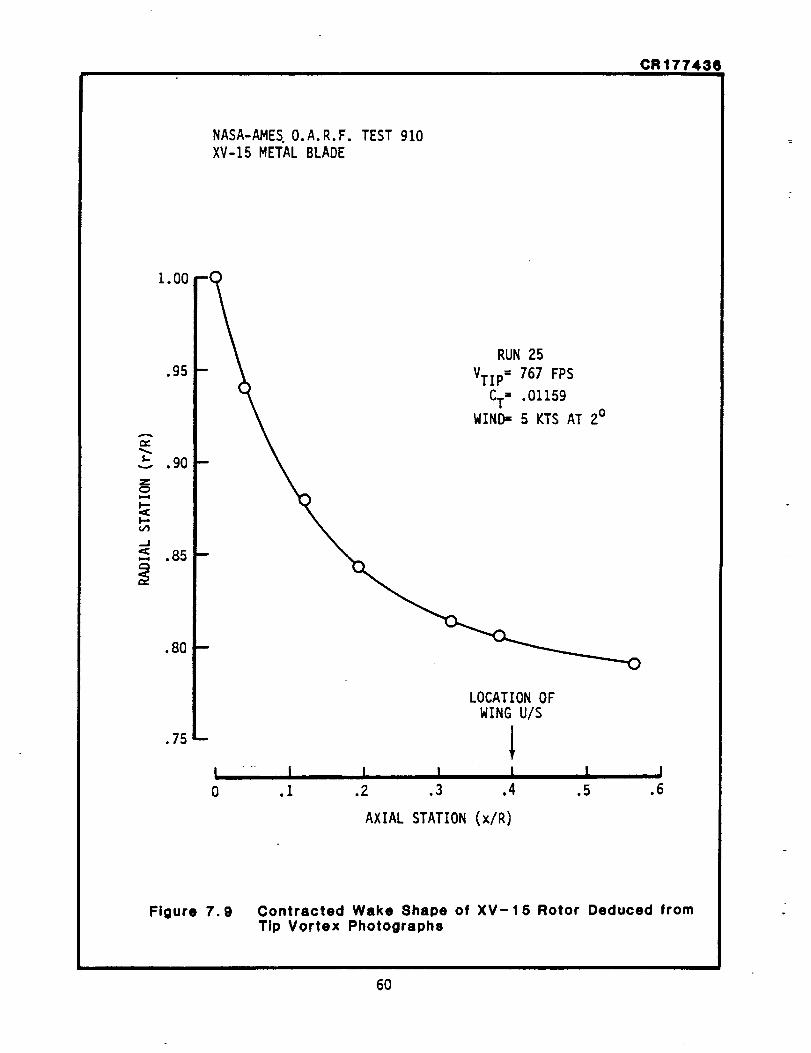
Figure 7.8 is a typical example and shows clearly the helical path of thevortices from each blade. By measuring from these photographs, M. Maisel of
NASA Ames succeeded in constructing the shape of the outer wake. Figure 7.9
shows that, for CT " .0116, the wake contracts to approximately .79R at .55Rdownstream of the disc. At O.4R where the probe lies, the tip vortex is
located at O.80R. This value is confirmed by the data of Fig 7.10 whichshows the radial distribution of downwash for selected values of rotor
thrust coefficient. Lines have been faired through the data obtained from
the pure pitot-static probes only. The data from the 5-hole angle of attackprobes was considered to be less reliable. At all the values of CT shown,
the edge of the wake appears to lie at 80 percent radius.
53

•02O
NASA-AMES O.A.R.F. TEST 910
XV-15 METAL BLADE
CR177436
.018
.016
.014
•006
0
@
o
o
o
0
o
v/"
WPAFB WHIRL TOWER (REF 3)
• VT = 740
@V T - 600
&V T - 786
0 SYM RUN RPM VTIP MTIP
22 582.8 762.9 .691 0.4
0 23 583.7 764.1 .689 1.1
0 25 586.1 767.2 .690 2.6
0 _ 26 586.2 767.3 .688 2.7
VWIN[
.004
0
-4 0
NOTE: RPM, TIP SPEED, TIP MACH NO., AND WIND VELOCITYARE THE AVERAGED VALUES FOR EACH RUN.
I ,, I I I I I
4 8 12 16 20 24
COLLECTIVE PITCH (e.75)
Figure 7.3 XV-15 Thrust Coefficient vs. C?llective Pitch
54

CR177436
oo
8
55

CR177436
o1
u'lLJJI.-
c_:_
I, I ! ! I I I
..?j..(°dO_ do)• _ _OlOV_ION3TOIJ_3a30naNI
llm
0
o r,.C,.l
o tO
I
XoO,--4 I--
o 0
C
_e
0 @• 0
0
-i_ .=I--
.-,. r.I-- .,-*
v 3
illu.
Ii0a0
clSm
0
ko
o o
I._
Q)t,,,
9o 1.6
4'
56

CR177436
I i
c_
u
E
3
o
_w
I
¢:)
cO
J
J
b
• 0
C_ W
0_L
C_
57

CR177436
NASA-AMES O.A.R.F. TEST 910
XV-15 METAL BLADE
RUN 16
.84 -- SY._MMRP__M.MVTI.....PPMTIP VWIND
._0
.76
.72
X
_- .68e,,
i,i.0
'" .64
I.I.
.60
.56
.52
0 510.9 668.8 .599 3.4
0 565.8 740.6 .663 4.7
& 589.2 771.2 .690 4.8
V 624.8 817.8 .731 4
NOTE: LINE IS FROM FAIRING OF CT vs. Cp DATA
POWER COEFFICIENT CORRECTED FOR WIND VELOCITY
ANO OIRECTION
.48 -I I [ I I , I I.004 .006 .008 .010 .012 .014 .016 .018
ROTOR THRUST COEFFICIENT (CT)
Figure 7.7 Effect of Tip Mach Number on Figure of Merit of XV-15 Bladesi im ill iiii al ii
58
CR177436
ORIGINAI2 PA-GIg Ig
OF POOR QUALITG
Figure 7.8 Tip Vortices of XV-15 Metal Blades
59
CR177436
NASA-AMES O.A.R.F. TEST 910
XV-15 METAL BLADE
1.00
.95
A
p..
90
_J
--< .85
.80
.75 _
I I. I0 .i .2
RUN 25
VTIP= 767 FPS
CT- .01159
WIND- 5 KTS AT 20
LOCATION OF
WING U/S
I L, I I
.3 .4 .5 .6
AXIAL STATION (x/R)
Figure 7.9 Contracted Wake Shape of XV-15 Rotor Deduced fromTip Vortex Photographs
60

CR177436
NASA-AMES O.A.R.F. TEST 910
XV-15 METAL BLADE
Z/R= Q.4 RUN 25
SYMTP CT RPM VTIP MTIP VWIN_D
1:3 16 .00796 585.9 766.9 .690 2.9_7 20 .01053 585.7 766.7 .690 2.4
0 22 .01246 585.5 766.4 .689 3.3
0 24 °01422 586.9 768.3 .690 2.9
V_
0 °
2O
40
V
___6o
80==
IO0
120
140
NOTE: SOLID SYMBOLS DENOTE DATAFROM ANGLE OF ATTACK PROBES
RADIAL STATION (r/R)
.2 .4. .6 .8 1.0 1.2 1.4
_ , i i , __--"--i
jNACELLE
JiiI
V
Figure 7.10 Distribution of Downwash Velocities for Various ThrustCoefficients for XV- 15 Rotor
61
CR177436
The shape of the downwash distribution changes with increasing thrust coef-
ficient, becoming more skewed toward high downwash values Just inside thetip vortex. Outside the tip vortex, the wake-lnduced velocity Is essen-tially zero; the non-zero values of downwash shown are attributable to theambient wind.
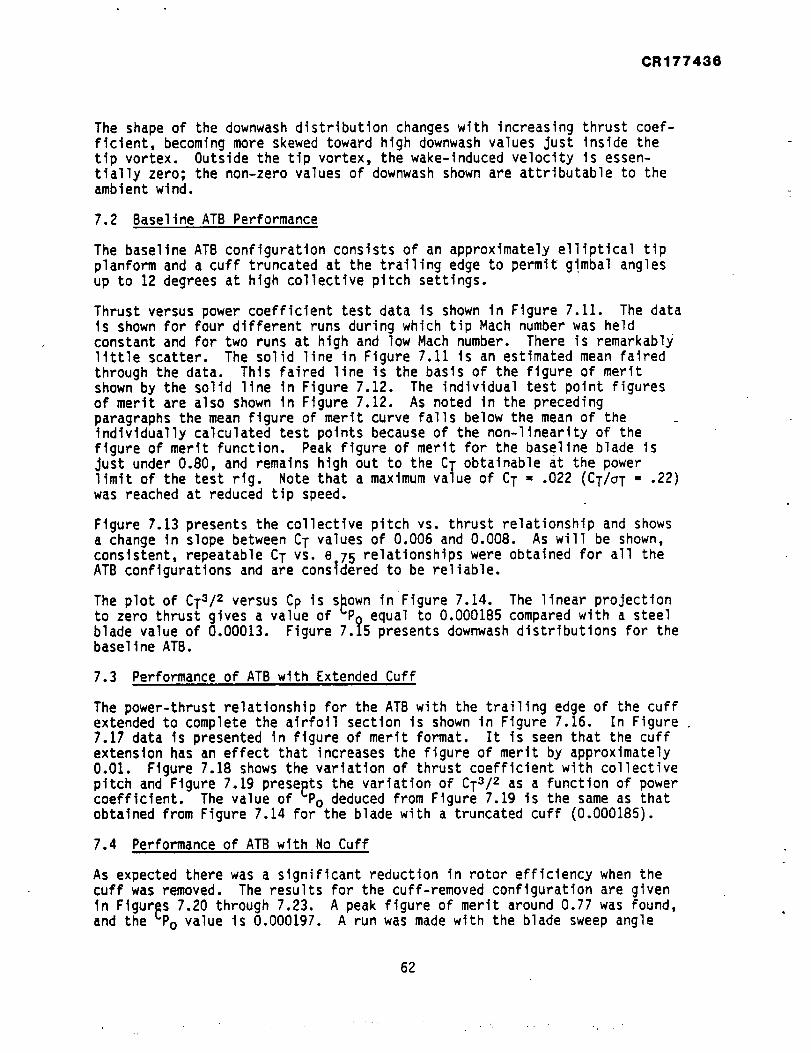
7.2 Baseline ATB Performance
The baseline ATB configuration consists of an approximately elliptical tip
planform and a cuff truncated at the trailing edge to permit g!mbal anglesup to 12 degrees at high collective pitch settings.
Thrust versus power coefficient test data is shown in Figure 7.11. The datais shown for four different runs during which tip Mach number was held
constant and for two runs at high and low Mach number. There is remarkablylittle scatter. The solid llne in Figure 7.11 is an estimated mean Faired
through the data. This Faired line is the basis of the figure of meritshown by the solid line in Figure 7.12. The individual test point figures
of merit are also shown in Figure 7.12. As noted in the precedingparagraphs the mean Figure of merit curve falls below the mean of theindividually calculated test points because of the non-linearity of the
Figure of merit function. Peak figure of merit for the baseline blade is
Just under 0.80, and remains high out to the CT obtainable at the powerlimit of the test rig. Note that a maximum value of CT - .022 (CT/oT - .22)was reached at reduced tip speed.
Figure 7.13 presents the collective pitch vs. thrust relationship and showsa change in slope between CT values of 0.006 and 0.008. As will be shown,
consistent, repeatable CT vs. e.75 relationships were obtained for all theATB configurations and are considered to be reliable'
The plot of CT3/2 versus Cp is s_own in Figure 7.14. The linear projectionto zero thrust gives a value of Po equal to 0.000185 compared with a steelblade value of 0.00013. Figure 7.15 presents downwash distributions for thebaseline ATB.
7.3 Performance of ATB with Extended Cuff
The power-thrust relationship for the ATB with the trailing edge of the cuffextended to complete the airfoil section is shown in Figure 7.16. In Figure7.17 data is presented in figure of merit format. It is seen that the cuff
extension has an effect that increases the figure of merit by approximately
0.01. Figure 7.1B shows the variation of thrust coefficient with collective
pitch and Figure 7.19 preseBts the variation of CT3/z as a Function of powercoefficient. The value of _Po deduced from Figure 7.19 is the same as thatobtained from Figure 7.14 for the blade with a truncated cuff (0.000185).
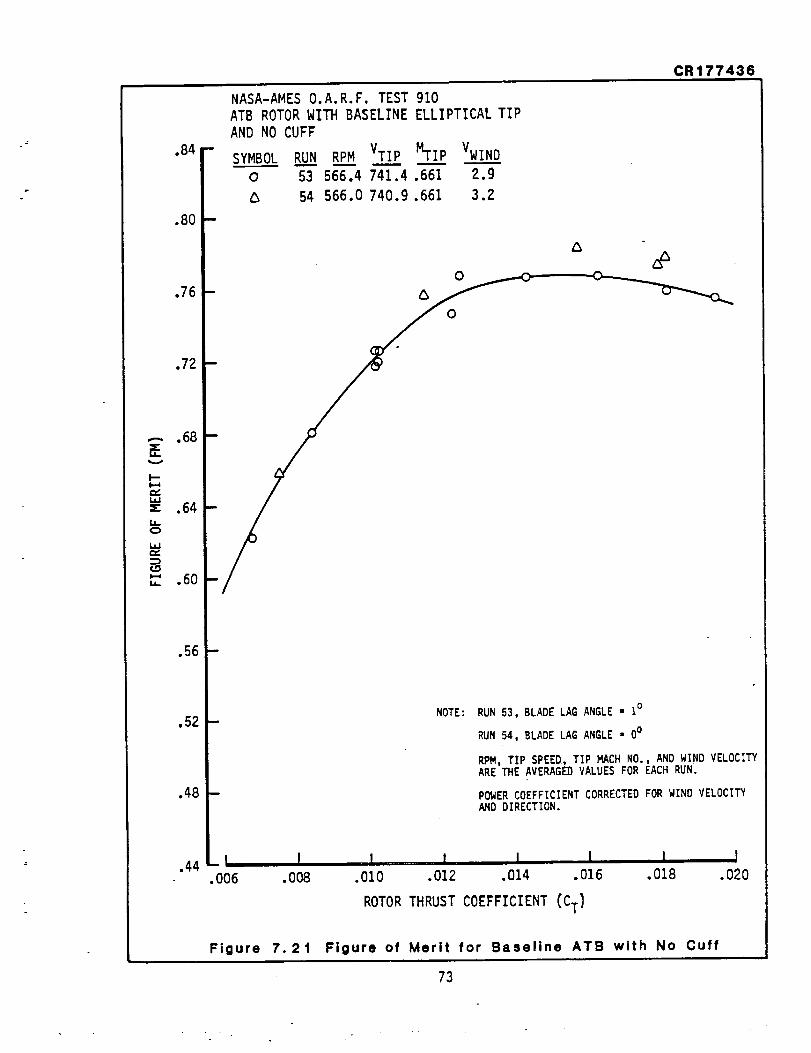
7.4 Performance of ATB with No Cuff
As expected there was a significant reduction in rotor efficiency when thecuff was removed. The results for the cuff-removed configuration are given
in Figures 7.20 through 7.23. A peak figure of merit around 0.77 was Found,and the _Po value is 0.000197. A run was made with the blade sweep angle
62

CR177436
63
, - , /, . . .

CR177436
.84
.80
.76
.72
.68
.FI--
p,,
.64
I.k.
I.&J
,,_ .60
.56
.52
.48
.44
NASA-AMES O.A.R.F. TEST 910ATB ROTOR WITH BASELINE ELLIPTICAL TIP
AND TRUNCATED CUFF
0 •
• 0#
e
e
SYMBOL RUN RPM VTIP MTIP VWIND
0 32 570.1 746.2 .663 0.9
& 33 570.7 747.1 .662 2.5
0 36 569.1 744.9 .661 2.0
'0 37(TpIs-zo)571.4748.0 .663 4.8
50(rP3-Iz)561.0 734.4 .661 1.8
_2 50(TP40-49)565.5740.3 .661 1.4• 50(TPX3-39)500.5655.2 .585 1.3• 45(TP47-63)625.1 818.3 .731 1.3NOTE: RPM, TIP SPEED, TIP MACH NO., AND WIND VELOCITY
ARE THE AVERAGED VALUES FOR EACH RUN.
POWER COEFFICIENT CORRECTED FOR WIND VELOCITY
AND DIRECTION.
-I.006
I , 1 I , i I I
.008 .010 .012 .014 .016 .018
ROTOR THRUST COEFFICIENT ._(CT)
I.020
Figure 7.12 Figure of Merit for Baseline ATB
I
.022
64

CR177436
.022
.020
.018
.016
.006
.004
i
o
Figure
NASA-AMES O.A.R.F. TEST 910ATB ROTOR WITH BASELINE ELLIPTICAL TIP
AND TRUNCATED CUFF
/
SYMBOL RU....NN RP.._.MM0 32 5?0.1
33 570.7
0 36 569.1
"E} 37(TP'S-_0)571.4
50(TP 3-12)561.0
50(,.40-_9)565.5
• 50(TP13-39)500.5
• 45(TP47-63)625.I
VTIP MT!p VWIND
746.2 .663 0.9
747.1 .662 2.5
744.9 .661 2.0
748.0 .663 4.8
734.4 .661 1.8
740.3 .661 1.4
655.2 .585 1.3
818.3 .731 1.3
VELOCITYNOTE: RPM, TIP SPEED, TIP MACH NO., AND WIND
ARE THE AVERAGED VALUES FOR EACH RUN.
7.13
I I I I I4 8 12 16 20
COLLECTIVE PITCH (0.75)
Thrust Coefficient vs. Collective Pitchfor _seline AT
65
I24

CR177436
(Z/El3) IN3131_303 ISfl_Hi _010_
66

CR177436
_P
NASA-AMES O.A.R.F. TEST 910
ATB ROTOR WITH _ASELIN[ ELLIPTICAL TIP
AND TRUNCATED CUFF
l,
v
>-F-
,.JW=m,
NOTE: SOLID SYMBOLS DENOTE DATAFROM ANGLE OF ATTACK PROBES
00
20 -
40 -
6O
8O
:3=Z
_: 100 -O
120 -
140 -
160 --
RADIAL STATION (r/R)
.2 .4 .6 .8 1.0 1.2
i , , ,SIDE _I /
"-- NAOEFLLE
RUN 50 Z/R- 0.4SYM C TP RPM MTI.____PVTI___.PVWIND
0 .0_866 7 561.2 .661 734.6 1.9
0 .01242 9 560.9 .660 734.2 2.2
.01647 11 560.5 .660 733.6 2.2
@ .01859 12 560.1 .659 733.2 2.2
.01917 49 564.5 .660 738.9 2.9
Figure 7.15 Distribution of Downwash Velocities for VariousThrust C0efficlents for Baseline ATB
67
1.4

CR177436
I I I I I I I I I ,. I
[io]Ix]_o_o3 lsn_.L _010_
. cO
o
=.
a
0
0L_
o_ =
• U.
_D
000
0
68

CR177436
NASA-AMES O.A.R.F. TEST 910
ATB ROTOR WITH BASELINE ELLIPTICAL TIP
AND EXTENDED CUFF
.84 F SYMBOLo _ 56T.gRPM7"3_'.IVTIP MTIP_(EST.)VWIND2.2
00
0
0
0
0
0 0
,56
.52
.48
.44
NOTE: RPM, TIP SPEED, TIP MACH NO., AND WIND VELOCITY#.RETHE AVERAGED VALUES FOR EACH RUN.
POWERCOEFFICIENTCORRECTEDFORWINDVELOCITYAND DIRECTION,
_! I L,, I I I I I
.006 .008 .010 .012 .014 .016 .018 .OZO
ROTOR THRUST COEFFICIENT (CT}
Figure 7.17 Figure of Merit for Baseline ATB with Extended Cuft
69

CR177436
=wL_
L_£k.I.;J
0
I"Ul
I'-
I"
I-4
•020
.018
.016
.014
.012
.010
.008
.006
.004
Figure
NASA-AMES O.A.R.F. TEST 910ATB ROTOR WITH BASELINE ELLIPTICAL TIP
AND EXTENDED CUFF
SYMBOl. RUN RPM VTIP MTIPVWIND0 55 563.9 738.1 .663 2.2
(EST. )
NOTE: RPM, TIP SPEED, TIP MACH NO., AND WIND VELOCITYARE THE AVERAGED VALUES FOR EACH RUN.
7.18
l l I I I
4 8 12 16 20
COLLECTIVE PITCH (e.7 5]
Thrust Coefficient vs. Collective Pitchfor Baseline ATB with Extended Cuff
70

CR177436
r_
I°
I ! I I
0 0 0 00 C_ 0 0
I I ! I I ! I I
0 0 0 0 _D 0 0 00 C_ 0 0 0 0 0 0
{Z/_I"3} IN31DI-_303 .LSn_Hi _O.L08
\
,,(
*uJ (W
._o
_. 0.o ,'-" f,_o o
(
m
F,,
0 "-
u+
71

I I I i I I I I I I
0 0 0 0 0 0 0 0 0 0
( ) IN'313[-_-g33 lsn_l I HOIO'L"
72
CR177436
t_m
°i_ -
"_,
° '_
° '_
O
0
0
0
4
CR177436
c
.F
I--I--4
:E:
la-D
laJc_
l.k.
.84
.80
.76
.72
.68
.64
.60
.56
.52
.48
.44
NASA-AMES O.A.R.F. TEST 910
ATB ROTOR WITH BASELINE ELLIPTICAL TIP
AND NO CUFF
SYMBOL RUN RPM VTIP MTIP VWIND
0 53 566.4 741.4 .661 2.g
54 566.0 740.9 .661 3.2
o
o
NOTE: RUN 53, BLADE LAG ANGLE • i°
RUN 54, BLADE LAG ANGLE - 0°
RPM, TIP SPEED, TIP MACH NO., AND WIND VELOCITY
ARE THE AVERAGED VALUES FOR EACH RUN.
POWER COEFFICIENT CORRECTED FOR WIND VELOCITY
AND DIRECTION.
-I I I I I I I I.006 .008 .010 .012 .014 .016 .018 .020
ROTOR THRUST COEFFICIENT (CT]
Figure 7.21 Figure of Merit for Baseline ATB wlth No Cuff
73

CR177436
I'--
Iml
LLW
U
I"Vl
C_"r-
#,,0I--"
I-4
.020
NASA-AMES O.A.R.F. TEST 910
ATB ROTOR WITH BASELINE ELLIPTICAL TIP
AND NO CUFF
SYMBOL RUN RPM VTIP MTIP VWIND
0 53 566.4 741.4 .661 2.9
54 566.0 740.9 .661 3.2
.018
.016
.014
.012
.010
.008&
.006
•004
.002
0
Figure
i
7.22
NOTE : RUN 53, BLADE LAG ANGLE - 10
RUN 54, BLADE LAG ANGLE - 0°
RPM, TIP SPEED, TIP MACH NO., AND WINO VELOCITY
ARE THE AVERAGED VALUES FOR EACH RUN.
I I _, I I I
4 8 12 16 20
COLLECTIVE PITCH (O.n75}Thrust Coefficle t vs. Collectivefor Baseline ATB with No Cuff
Pitch
74

CR177436
(Z/_I9) iN3I_I_303 ISA_H± _010_
75
CR177436
set to zero degrees and there is an apparent increase of efficiency at thissetting. The apparent increase in efficiency is however, within the scatter
of earlier testing and is not considered to be significant.
Figure 7.22 indicates that the collective pitch required for a given CT maybe less when the blade sweep/droop is reduced to zero. The control systemflexibility accounts for most of this difference. The recorded values of
collective reflect the control setting at the actuator input. Because ofthe nose down pitching moments associated with blade sweep, the control
blade setting is less in this case by the amount of control flexibility
windup. At a nominal collective input of 16 degrees the difference betweenthe swept and non-swept conditions is estimated to be 0.82 degrees. Figure
7.22 indicates a difference of almost 2 degrees suggesting that some addi-tional mechanism may be involved.
7.5 Performance of ATB with Swept Tip and Extended Cuff
Test results For the ATB with the swept tip are shown in Figures 7.24, 25,26 and 27.
The rate of growth of pitch link loads was almost twice that for the base-
line tip and this restricted testing to a maximum CT of .016 (compared witha CT of 0.020 with the baseline tip at the same RPM). However at this value
of CT the figure of merit (Figure 7.25) is 0.795 and is still trendingupward.
7.6 Performance of ATB with Square TIp and Extended Cuff
Test data with the square tip installed (and extended cuff) is given in Fig-ures 7.28 through 7.31. There is a slight reduction in efficiency through-
out the CT range compared with the baseline tip configuration.
7.7 Configuration Performance Comparisons
Figures 7.32 through 7.42 summarize the comparative performance of the base-line ATB and the XV-15 blades, and of the various ATB alternate
configurations. ,
Figure 7.32 shows that at values of CT above .0125 the power required Forthe ATB becomes progressively less than that for the XV-15 blades. Figure7.33 shows the same information in figure of merit format. Figures 7.34 and
7.35 summarize the comparative behavior of the alternate tip configurationand the XV-15 blades. Figures 7.36 and 7.37 summarize the comparative be-
haviors of the different cuff configurations.
It is seen that the baseline design elliptical tip outperforms the alterna-
tives although the trend For the swept tip suggests that it might be better
at CT values beyond 0.016. The cuff comparisons clearly demonstrate thatextending the trailing edge of the cuff to Form a Full airfoil has a signi-ficant beneficial effect on hover performance.
76

CR177436
(I0) J.N31313_303 ISFI_JHJ._010_
77

CR177436
.84
.80
.76
.72
--- .68E
z .64LLC_
_- .60
.56
.52
.48
.44
NASA-AMES O.A.R.F. TEST 910
ATB ROTOR WITH SWEPT TIP
AND EXTENDED CUFF
SYMBOL RUN RPM VTIP MTIP
0 60 566.1741.0 .664(EST.)
VWIND
1.9
0
NOTE: CT MAX LIMITED BY PITCH LINK LOADS
RPM, TIP SPEED, TIP MACH NO., AND WIND VELOCITY
ARE THE AVERAGED VALUES FOR EACH RUN.
POWER COEFFICIENT CORRECTED FOR WIND VELOCITY
AND DIRECTION.
_I..006
I•008
Figure 7.25
I I I I I.010 .012 .014 .016 .018
ROTOR THRUST COEFFICIENT (CT)
Figure of Merit for ATB with Swept Tip
I.020
78
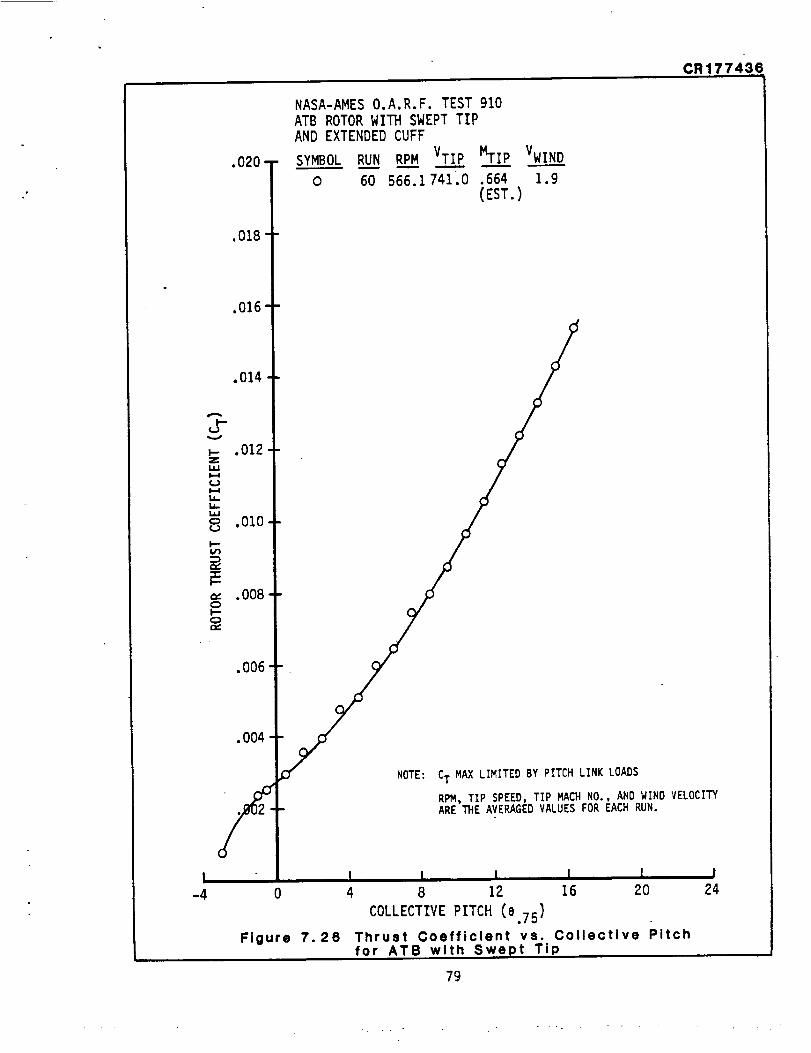
•020 -
•018 "
.016 -
.014
•006
•004
-4 0
Figure
CR177436
NASA-AMES O.A.R.F. TEST 910
ATB ROTOR WITH SWEPT TIP
AND EXTENDED CUFF
S__YMBO....__L.LRUJ RPM VTI___[PMTI._..[PVWIN__.__.D
0 60 566.1741.0 .664 1.9
(EST.)
NOTE: CT MAX LIMITED BY PITCH LINK LOADS
RPM, TIP SPEED, TIP MACH NO., AND WIND VELOCITY
ARE THE AVERAGED VALUES FOR EACH RUN.
7.26
4 8 12 16 20
COLLECTIVE PITCH (0.75)
Thrust Coefficlent vs. Collective Pitchfor ATB with Swept Tip
24
79
, . .. .
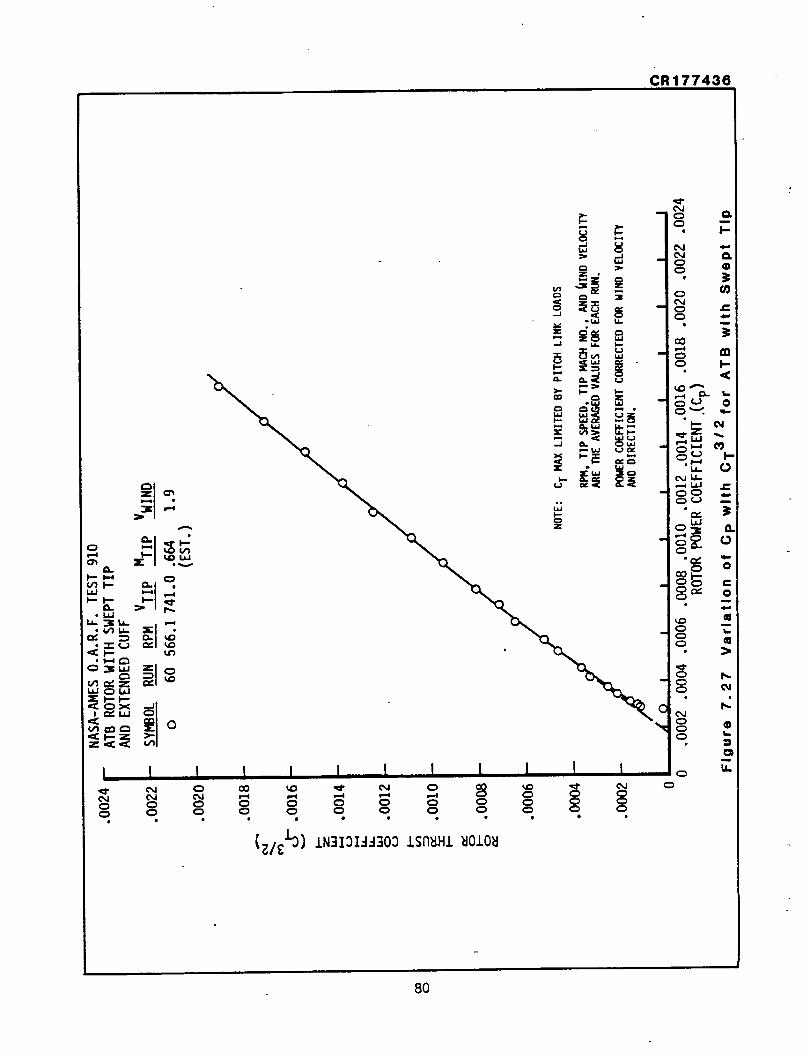
CR177436
/=D ..J J_l i=.
(_ =b --lr-_ •
__ Cl_ m i _ VJ'
;;-_ _ - i o. _..,,_ _ _:_ 8 I <
::"" I-,- 1,,,- / __ _ ..,,.--_ " "' -_ _ -'1_ o"%. L=l _l(_ "_ • / t"_ _-_ ql--
,-* a.W U.,-, / I1 (M_. z w> t,._-- / .. Z .. ,
•..., _ r,j _Ia.l
"_ x _--= ,-, a _ _,,,-_ l"-I_ I '=" _I_ "=" / .III . I
|" o_ 7-1L i t I I n _ I I !
{_/EI_) 1N3131_303 1S_H1 _010_
8O

CR177436
81

CR177436
NASA-AMES O.A.R.F. TEST 910
ATB ROTOR WITH SQUARE TIP
AND EXTENDED CUFF
"84 I SYMBOL RUN RPM VTIP-;-- 6-2---
63
.80
.76
.72
I-..
,.,,,..i,i
_" .64l,,k.
l,.iJp,,,.
I,-4
.60
.56
.52
.48
.44
MTIP VWIND
565.9 740.8 .661 2.3
571.0 747.5 .662 2.1
&
NOTE: RPM, TIP SPEED, TIP MACH _I0., AND WIND VELOCITY
ARE THE AVERAGED VALUES FOR EACH RUN.
POWER COEFFICIENT CORRECTED FOR WIND VELOCITY
ANO DIRECTION.
_I I I i I I I I
.006 .008 .010 .012 .014 .016 .018 .020
ROTOR THRUST COEFFICIENT (CT)
Figure 7.29 Figure of Merit for ATB with Square TIp
82

CR177436
NASA-AMES O.A.R.F. TEST 910
ATB ROTOR WITH SQUARE TIP
AND EXTENDED CUFF
S_.YMBOL RUN RPM VTIP MTIP
0 62 565.9 740.8 .661
63 571.0 747.5 .662
VWIND
.016
.014
.006
.004
.002_;_ NOTE: RPM TIP SPEED, TIP HACH _IO., AND WIND VELOCITY
-4 0 4 8 12 16 20 24
COLLECTIVE PITCH (0.75 )
Figure 7. 30 Thrust Coefficient vs. Collective Pitchfor ATB with S_
83
- .° ....

CR177436
84
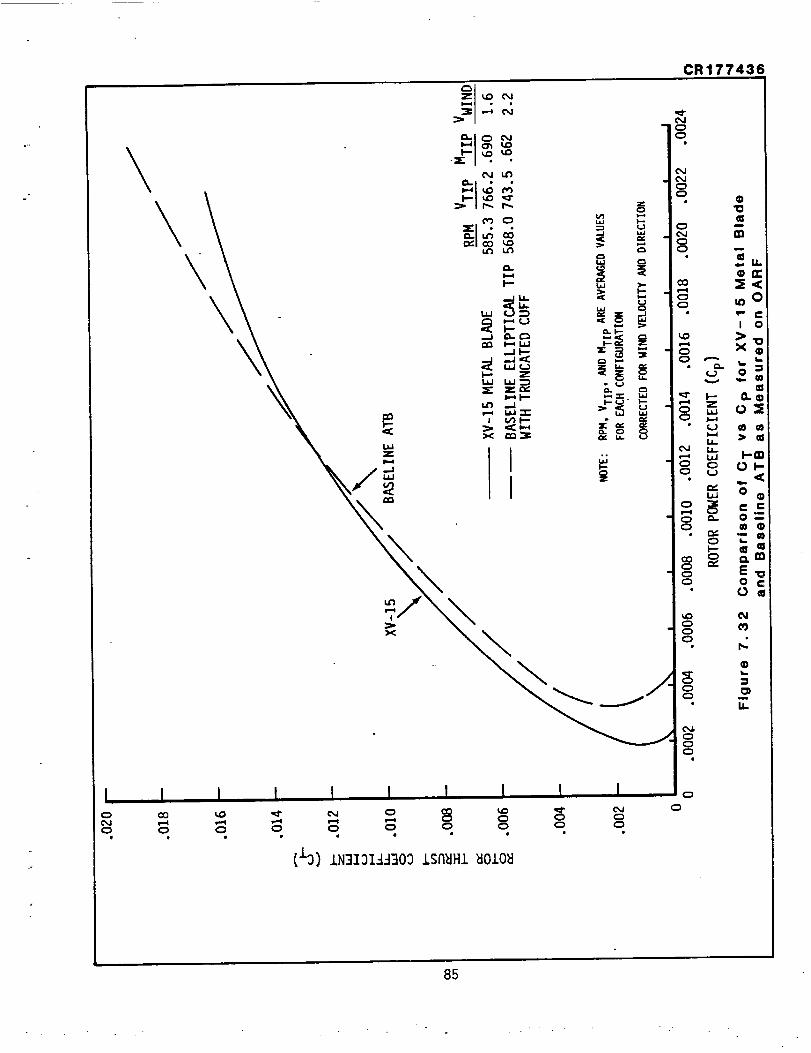
CR177436
\
T_
N _ =-=_m
85

CR177436
.84
.80
.76
.72
i .68.64
,,,,,,,
l,,-t
_- .60
.56
.52
.48
BASELINE ATB
__
//
RPM VTIp MTIp VWIND
XV-15 METAL BLADE 585.3 766.2 .690 1.6
BASELINE ELLIPTICAL TIP 568.0 743.5 .662 2.2WITH TRUNCATED CUFF
NOTE: RPM,VTiP, ANDMTIP AREAVERAGEDVALUESFOREACHCONFIGURATION
CORRECTEDFORWINDVELOCITYANDDIRECTION
.44 -I I I I I, I _ I.006 .008 .010 .012 .014 .016 .018 ,020
ROTOR THRUST COEFFICIENT CCT_
Figure 7.33 Comparison of Figure of Merit for XV-15 Metal Bladeand Baseline ATB as Measured on OARF
86

CR177436
\
!
x
(J'3).LN3131_3303 ISn_Hl _010_
87
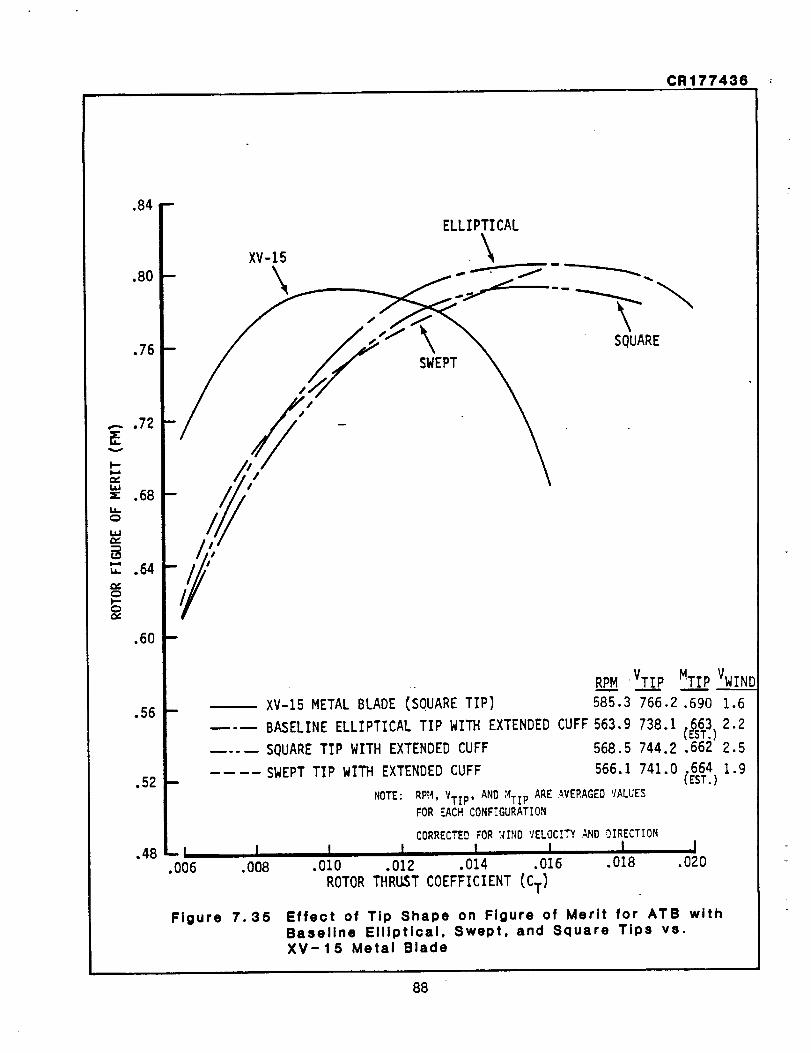
CR177436 -;
.84
.80
.76
_-_.72
_ .68
,."r' .64
.60
.56
.52
,48
m
ELLIPTICAL
XV-15
_ \ ....--.-_- _.
_ SQUARE
-L I•006 .008
Figure 7.35
RPM VTIP MTIp VWIND
XV-15 METAL BLADE (SOUARE TIP) 585.3 766.2 .690 1.6
BASELINE ELLIPTICAL TIP WITH EXTENDED CUFF 563.9 738.1 (_63) 2.2
SQUARE TIP WITH EXTENDED CUFF 568.5 744.2 .662 2.5
SWEPT TIP WITH EXTENDED CUFF 566.1 741.0 .664 1.9(EST.)
NOTE: RPI4, VTI P, AND ;4TIP ARE AVERAGED VALUES
FOR EACH CONF_.GURATION
CORRECTEB FOR :_IND VELOCITY AND OIRECTION
I I ,, I I I I.010 •012 .014 .016 •018 .020
ROTOR THR_T COEFFICIENT (CT}
Effect of Tip Shape on Figure of Merit for ATB withBaseline Elliptical, Swept, and Square Tips vs.XV-15 Metal Blade
88

cR177436
I I I I
!
x
! I t ] ! ! obJ
m
IL
89

CR177436 :_
c¢
L/.
_'FEXTENDED TRUNCATED
I _.._ k_._.80 I'- XV-15 i// _ • _..
J _-'+1- / .-;;" ..--"\ \------'--NOCUFF
.72
p, •64L,J
/.60- I
I
.56 -
.52 -
.48 -
•44 -|
.006
Figure 7.37
RPM VTIP MTIP VWIND
XV-15 METAL BLADE 585.3 766.3 .690 1.6
----TRUNCATED (BASELINE)568.0 743.5 .662 2.2
EXTENDED 563.9 738.1 .663 2.2(EST.)
NO CUFF 566.2 741.2 .661 3.1
I•008
NOTE: RPM, VTIp, AND MTI P ARE AVERAGED VALUES
FOR EACH CONFIGURATION
CORRECTED FOR WIND VELOCITY AND DIRECTION
I I I I I I
-•010 •012 .014 .016 .018 .020
ROTOR THRUST COEFFICIENT CCT}Effect of Cuff on Figure of Merit for Baseline ATB withElliptical Tip - Comparison of Truncated (Baseline),Extended, and No Cuff vs. XV-15 Metal Blade
90

CR177436
.0014 -
.0013 --
.0012 --zw
0011 --0 •{..}
= .0010 --o
<D
.0009 -
.0008 --
I720
I555
,I
.650
Figure 7.38
SYMBOL RUN
0 55 2.2
s6 3.2
/T 56 3.6
[] 60 1.9
_7 61 4.0
BASELINE ELLIPTICAL TIP WITH EXTENDED CUFF
v / v" J v"
SWEPT TIP WITH EXTENDED CUFF
CT - .012 (CROSS-PLOT FROM CT vs. Cp)
SWEPT TIP
/ELLIPTICAL TIP
•NOTE: VTIP, MTIP, VWIND, AND RPMARE AVERAGED VALUES FOR EACH RUN
I I I I I I
740 760 780 VTI P 800 820 840
I ! I I I I I I565 575 585 595 605 615 625 635
I I RPM I I I
.670 .690 .710 .730 .750MTIP
Effect of Tip Shape on Cp vs. VTI P, RPM, and MTI P-Comparison of Baseline Elliptical Tip and Swept Tip
gl

CR177436
Figure
p-. ¢.j
)--Z
LLILLI.Ll
(.I
l--t_
C¢:
p--
L-4
7.39
.020
.018
.016
.014
.012
.010
.008
ELLIPTICAL TIPSQUARE TIP
!PT TIP
.006
.004
Effect of TipBaseline
I4
RPM VTI_.._PPMTI.__PVWIND
;ELINEELLIPTICAL TIP 563.9 738.1 .663 2.2
WITH EXTENDED CUFF (EST.)
SOUARE TIP WITH_._568.5 744.2 .662 2.5EXTENDED CUFF
SWEPT TIP WITH 566.1 741.0 .664 1.9EXTENDED CUFF (EST.}
NOTE: RPM,VTIp,MTIP ANDVWIND AREAVERAGEDVALUESFOREACHCONFIGURATION.
VALUESLISTEDFORSOUARETI° ARE AVERAGES
I OF RUNS621AND63. I ! I8 12 16 20 24
COLLECTIVE PITCH (e.75}
Shape on C T vs. Collective- Comparison ofATB Elliptical Tip, Swept and Square Tips
92

CR177436
I I Ic_J C_l
$3
\
d3)
I'--
(._LL
I'-- ¢'-,,)
__.lhl
LdZ
,..,IL_J "r
,_ o--.+
I I I I
• e D •
' _O.L3V.-IXON3IOIJJ3 (133R(]NI
NC_
O@O0
0
@
I '-
_g0
"(,9
o _®
,,,=
"@l--u. c
,., ,(_ ww• I-'-
,,.,.= _r,,F- 0'1.-
_ ,,- o
0.._
N
0
L_
m
t_
93
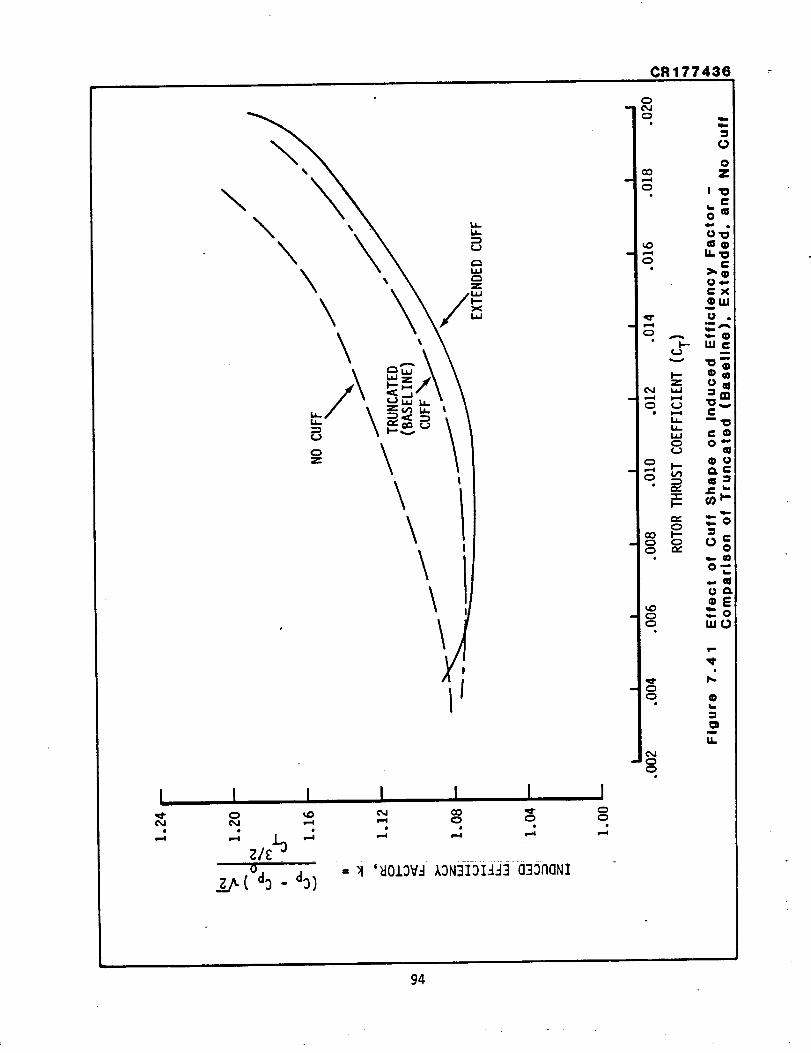
CR177436
I
Pq
\\
\
! I
,,.4 ,.4Z/_;'L3
z_/,.(°d3 - do)
%
\
\ \
0
\\\\1/
I ! I I
- _! '_IO.L3V.-IA3_31_I_3 (]33naNI
¢,j
• b
0oO Z
- ,-, 1.6"0
CX
o,,,o .
i
q N-e. o
,9- =®_ o'_
"°1o. _ ,=
_ ,.oN o_ =,.
-- 0
• tm
m
U.
c_0
g4

CR177436
0
20
40
v= 60
120 -
14°I160
,30
=
I00
RADIAL STATION (r/R)
0 .2 .4 .6 .8 1.0 1.2 1.4
- I SIDE
- /XV-15 METAL BLADE
CT- .00796
j XV-15 METAL BLADECT- .01246
BASELINE ATBELLIPTICAL TIP AND
CT .00866
BASELINE ATB WITH ELLIPTICAL TIP
AND TRUNCATED CUFF CT- .01242
RUN TP CT RPM MTIP VTIp VWIND
•----.-- XV-15 METAL BLADE 25 16 .00--7-96585.9 .690 771.5 2.9
25 22 .01246 585.5 .689 770.9 3.3
R-- ATB ROTOR 50 7 .00866 561.2 .661 734.6 1.9
50 9 .01242 560.9 .660 734.2 2.2
Figure 7.42 Comparison of Downwash Distributions forXV-15 Metal Blade and Baseline ATB Rotor
95

CR177436
In Figure 7.38 the effect of tip shape on power required is shown as a Func-tion of tip speed, RPM, and tip Mach number. A comparison is made betweenthe swept and the baseline elliptical planforms. The extended cuff config-uration was used for this crossplot. At the normal operating RPM (nominally
565), and at maximum RPM (625), the elliptical tip maintains a slight advan-
tage at CT = .012.
Figure 7.39 compares the baseline elliptical, swept, and square tips on a CTvs. collective basis. As in Figure 7.40, the extended cuff was used for this
plot. As expected, the baseline elliptical tip has slightly better perfor-mance than the other tip configurations.
Figures 7.40 and 7.41 present the effect of tip shape and cuff configurationon induced efficiency as a function of rotor thrust coefficient.
Figure 7.42 compares downwash distributions for the metal blade and thebaseline ATB at nearly similar thrust coefficients.
The photograph In Figure 7.43 show tip vortices for the elliptical tip withthe extended cuff configuration. (Compare with Figure 7.8).
7.8 Theory-Test Comparison
The predictions for the XV-IS metal blades and for the Advanced Technology
Blades are compared with measured performance in Figure 1.4. The figure of
merit is generally underestimated at high values of _ The predicted per-formance of the XV-15 metal blades and the baseline blades was calculated
using a current lifting-line/blade element program. The program, which cor-relates well with low twist helicopter blades, appears to overestimate the
induced power for highly twisted propellers/rotors. Possible reasons forthe discrepancies are discussed in the following paragraphs.
7.8.1 Rotor Wake Model
Because over 70 percent of the power absorbed by a hovering rotor is wake-
induced, the successful prediction of performance depends on how well theeffects of the vortex wake are modelled. An accurate wake model is One in
which the strength and positions of the vortices forming the wake are cor-rectly represented. The current wake model is semi-empirlcal and contains
many correction factors determined by correlation of the analysis withmeasured helicopter rotor and prop-rotor performance. While the modelyields practical results in cases where the rotor geometry and operatingconditions are within the range of the empirical factors, extensions to
configurations outside the data base are less reliable. This semi-empiricalwake representation is outdated and is currently being replaced with a
modern wake representation based upon experimentally observed rotor wakestructures following Landgrebe, Kocurek, and Gray.
A comparison of the effect of the different wake representations on thecalculation of figure of merit for the ATB rotor is presented in Figure7.44. With the current wake, the peak figure of merit level is underpre-
dicted and performance at CT values greater than O.OOg is also underpre-dicted. When the empirical wake is replaced by the Kocurek wake model,
96

CR177436
Figure 7.43
ORIGINAI-_ PAGE Ig
DE POOR QUALITY
Tip Vortices of Baseline ATB with Extended Cuff
97

CR177436
.84 --BLADE ELEMENT/MOMENTUM THEORY
\_--
//
ATB BASELINE ELLIPTICAL TIP
AND TRUNCATED CUFF
TEST DATA FAIRING
/
_! IMPROVED
ANALYSIS
%%
CURRENTANALYSIS
\
I I I I _ , I.010 .012 .014 .016 i-08 .020
ROTOR THRUST COEFFICIENT (CT)
Figure 7.44 Comparison of Calculated and Measured Performanceon the Advanced Technology Blade Rotor
98
CR177436
prediction of peak figure of merit is improved. Note that neither modulepredicts the high figures of merit at high thrust coefficients. Also shownare the results of a blade element/momentum analysis (using the same airfoil
data) which somewhat overpredicts the performance but yields a better over-
all shape for the curve.
Although there has been much work on experimentally observed rotor wakestructures for helicopter rotors, there have been no tests conducted spe-
cifically for highly twisted rotors or propellers. Some progress in this
direction was made during this test as described in sections 7.1 and 7.7.Further detailed experiments using pressure instrumented blades and lasersto measure the detailed wake structure should be conducted for representa-tive rotors. These results can be mathematically modelled and incorporated
into suitable analysis techniques.
While the introduction of more realistic wake models may improve the pre-
diction techniques, other areas also require attention.
7.8.2 Airfoil Behavior at Hiqh Angles of Attack
Highly twisted tilt rotor blades operate in hover with the root sections ator beyond stall angles of attack. Two-dimensional airfoil data obtainedfrom the wind tunnel usually does not define the post-stall lift, drag, and
pitching moment behavior because testing is rarely conducted beyond stall.It has been shown by the OARF results and elsewhere that the root area can
influence rotor performance significantly. Additional test data both atmodel and full scale is therefore required on representative airfoils at
high angles of attack to establish the basic shape of the post-stall be-havior for the root section.
7.8.3 Spanwise Flow Effects
There is evidence that two-dimensional airfoil data is not entirely appli-
cable near the root of a rotating blade. Figure 7.45 from Reference 7
shows that propeller blade sections near the root appear to have extendedlift-curves and higher lift-curve slopes than those obtained from two-dimensional wind tunnel tests. The mechanism suggested for this improved
performance is boundary layer thinning arising from centrifugal spanwisepumping and the effect of Coriolis forces on the boundary layer. Develop-ment of a method to account for this effect is recommended and could be
conducted as part of the previously recommended experiments on pressureinstrumented blades.
8.0 ROTOR AND CONTROL SYSTEM LOADS
Rotor and control loads were continuously monitored throughout the hover
testing of the XV-15 Metal Blade and Advanced TeChnology Blades to ensurethat static and dynamic limits were not exceeded. In general, testing was
limited by steady spindle flap bending at the extremes of the thrust range.
While oscillatory loads did not limit performance testing, it was necessary
99

CR177436
RADIALSECTION
r/R= 0.8 _,
0.7(
0.6(o.5(0.4i(Z
"3--4 B._
.-q
---WIND TUNNEL
-15 -I0 -5 0 s 10 15
ANGLEOF ATTACK(_)(DEG.)
20 25 30
Figure 7.45 Local Lift Coefficients, C_, at Various Radial Sectionson a Rotating Propeller (Reference 7)
lO0

CR177436
to use cyclic to control flapping and flap-induced loads to acceptable lev-els. Even with cyclic control, transient bending loads frequently exceededthe endurance limit of the hub yoke spindle necessitating frequent damage
counts to determine the percentage of spindle life used. (Total life used
did not exceed 5 per cent.)
The sign convention used in reporting the measured loads is as follows:
+ Flap Bending -- Compression In the blade upper surface
+ Chord Bending -- Compression in trailing edge
+ Pitch Link Load -- Consistent with blade torsion leading edge up
It should be noted that, in any given run, substantial scatter is present in
the loads data because of cyclic adjustments and variations in wind direc-
tion and magnitude. However, although not ideal for correlation studies,the data indicate general trends.
8.1 XV-15 Metal Blade
The rotor system, blades, hub, and controls were essentially the same as
previously tested on the Aero Propulsion Laboratory Whirl Stand at Wright-Patterson Air Force Base and documented in Bell Helicopter Report No.
300-099-010 (CR 114626), Reference 4.
Figures 8.1 and 8.2 present a summary of the measured steady and oscillating
yoke spindle and pitch link loads as a function of CT. Comparing the datafrom the previous testing at Wright-Patterson with the current Ames testing
does not indicate any significant differences in the measured loadings.
The upper end of the thrust range was generally limited by blade stall asevidenced by an increase in rotor noise, a rapid increase in oscillatory
pitch link loads, and difficulty in controlling gimbal angle. In the pre-liminary run-ups, operation was limited by oscillatory loads in the hub yoke
spindle. Bending moment allowables initially imposed on the spindle for
this test, (± 20,000 in.lb, as compared to ± 58,000 in.lb, in the previouswhirl test) were based on later knowledge of the endurance limits for thetitanium material and were routinely exceeded during spln-up and shut-down.This limitation was overcome by utilizing an S-N curve for the spindle toallow short time exceedance of the ± 20,000 in.lb, endurance limit. A run-
ning damage count was maintained to ensure safety of operation.
8.2 Baseline Advanced Technoloqy Blade (ATB)
Figures 8.3 through 8.22 present a summary of the measured steady and oscil-lating yoke spindle, pitch link, and flap bending loads as a function of CTand RPM.
I01

NASA-AMES O.A.R.F. TEST 910
XV-15 METAL BLADE
CR177436
140,000
RUN22
5
23
MAXIMUM--0--
ALTERNATING
-_
120,000
_ 80,000
I;i 60,000
.,-,,.
_ 40,000
¢m
20,000
0
MAXIMUM
(STEADY + ALTERNATING)
- o_°ALTERNATING
0 .004
Figure 8.1
.oo8- .o12 .o16 .o2o
ROTOR THRUST COEFFICIENT (CT)
XV-15 Metal Blade: Hub Spmd_ Resultant FlapBending Moments vs. C T
.024_
102

CR177436
100
-200
-300
-400
NASA-AMES O.A.R.F. TEST 910
XV-15 METAL BLADE
ROTOR THRUST COEFFICIENT (CT)
.008 .012 .016 .020 .Oz,
0 _kLTERNATING
A mO
° o
<>__0 MAXIMUM
(STEADY ÷ ALTERNATING)
%
L_
Figure 8.2 XV-15 Metal Blade: Pitch Link Loads vs. C T
I03

CR177436
NASA-AMES O.A.R.F. TEST 910
ATB ROTOR WITH BASELINE ELLIPTICAL TIP
AND TRUNCATED CUFF
140,000 -
120,000
.-. q
_'_'l.O0,000
_60,000
W
40,000
RU.__NNMAXIMUM ALTERNATING
32 _ --_--
36 _ --0"--
MAXIMUM
(STEADY + ALTERNATING),,_
A
0
2o,ooo- /_ ,,_-__
00 .004 .008 .012 .016 .020 .024
ROTOR THRUST COEFFICIENT (CT)
Figure 8.3 Baseline ATB: Hub Spindle Resultant Flap BendingMoments vs. C T (Runs 32 and 36)
I
104

CR177436
160,000
140,000
..-.120,000
_J
g
I00,000
'_ 80,000
_=6o,oooIJ.I
I.iJ.-I
40,000
20,000
L__
NASA-AMES O.A.R.F. TEST 910
ATB ROTOR WITH BASELINE ELLIPTICAL TIP
- AND TRUNCATED CUFF ?/
RUN MAXIMUM ALTERNATIN_ /50b "_ -
m
m
m
MAXIMUM /
m
- /
ALTERNATING I
.004 .008 .012 .016 .020 .024
ROTOR THRUST COEFFICIENT (CT}
Figure 8.4 Baseline ATB: Hub Spindle Resultant Flap BendingMoments vs. C T (Run 50b)
105

CR177436
NASA-AMES O.A.R.F. TEST 910
ATB ROTOR WITH BASELINE ELLIPTICAL TIPAND TRUNCATED CUFF
120,000
ee_..I
80,000
v')l,--z_JX0
40,0oo
z
er_
e_
_ o
p-
..J
_-40,000
.004 .012 .016
ROTOR THRUST COEFFICIENT (CT)
.020 •024
Figure 8.5 Baseline ATB: Hub Spindle Steady Flap Bending Moments vs. C T- Effect of RPM
106

CR177436
NASA-AMES O.A.R.F. TEST 910
ATB ROTOR WITH BASELINE ELLIPTICAL TIPAND TRUNCATED CUFF
SYM RPM VTI__._P
500 654
•_. 571 747
--Z_--. 626 819
.004 .008 .012 .016 .020 .0240
0
ROTOR TBRUST COEFFICIENT (CT)
Figure 8.6 Baseline ATB: Hub Spindle Alternating FlapBending Moments vs. C T -Effect of RPM
107
• , . . . ,,

CR177436
n__J
z
v1I.-
i.iJ
_=Zi,ie_
-'1-(J
>-r_,,¢laJPu'}
-J
Z
0.V1
-r"
NASA-AMES O.A.R.F. TEST 910
ATB ROTOR WITH BASELINE ELLIPTICAL TIP
AND TRUNCATED CUFF
SY..__HRPM VTIp
"E}-- 500 654
•"0-" 571 747
--A-- 626 819
80,000 -
0,000
40,000
20,000
• .,_/
.024
-20,000 k ROTOR THRUST COEFFICIENT (CT)
Figure 8.7 Baseline ATB: Hub Spindle Steady Chord-Bending Moments vs. CT-Effect of RPM
I08

CR177436
30,000
25,000
Z
v
2o,ooo0X
rv,
_=i5,ooo(..}
_i,I0,000
Z
5,000
0
NASA-AMES O.A.R.F. TEST 910
ATB ROTOR WITH BASELINE ELLIPTICAL TIP
AND TRUNCATED CUFF
SYM RPM VTI.____P
500 654
•_. 57! 747
-A--626 8i9 Io/ /
• 004
Figure 8.8
.008 .012 .016 .020 .024
ROTOR THRUST COEFFICIENT (C-)Baseline ATB: Hub Spind_ Al_ernat_g Chord Bending
Moments_ vs. C T- Effect of_RPM
I09

CR177436
NASA-AMES O.A.R.F. TEST 910ATB ROTOR WITH BASELINE ELLIPTICAL TIP
AND TRUNCATED CUFF
I CT - .010 1
20,000 F
15,000 L
i /ii0,000 I
I I I300 400 500
ROTOR SPEED (RPM)
I60C
Figure 8.9 Baseline ATB: Hub Spindle Steady Flap Bending Moment vs. RPM
II0

CR177436
NASA-AMES O.A.R.F. TEST 910
ATB ROTOR WITH BASELINE ELLIPTICAL TIP
AND TRUNCATED CUFF
20,000
z 15,000
.=.,
,-.,10,000
._:_,.,5,00_0
o:
-r
I CT - .0101
z,,
A
,e,
o_ I I I300 400 500 600
ROTOR SPEED (RPM)
Figure 8.10 Baseline ATB: Hub Spindle Alternating Flap Bending Moments vs. RPM
Ill
•. ,. •

CR177436
NASA-AMES O.A.R.F. TEST 910
ATB WITH BASELINE ELLIPTICAL TIPAND TRUNCATED CUFF
30,000 I
,,.,25,000
20,000
oLI
300
A /x
I I I400 500 600
ROTOR SPEED (RPM)
Flgure 8.11 Base,m) ATB: Hub Spindle Steady Chord Bend|ng Moments vs. RPM
ll2

CR177436
20,000
15,000
g
,.=,
1o,ooo(..}
C.gZ ""
Zew,
,=C
.._ 5,000
Z
O-
-r
NASA-AMES O.A.R.F. TEST 910
ATB ROTOR WITH BASELINE ELLIPTICAL TIP
AND TRUNCATED CUFF
. ICT-.°12]
A A A&
O m
I , ,, I I300 400 500
ROTOR SPEED (RPM)
Figure 8.12 Baseline ATB: Hub Spindle Alternating ChordBending Moments vs. RPM
t600
ll3

CR177436
-I00
-200
_J
,,-,,
"_ -300,J
J-4
..J
-r-
p-
-400
-500
-600
0
NASA-_ESO.A.R.F.TEST910ATB ROTORWITHBASELINEELLIPTICALTIPANDTRUNCATEDCUFF RUN MAXIMUM ALTERNATING
32 _ --_--
36 --_ --_
-700
ROTOR THRUST COEFFICIENT (_)
.004 .008 .012 .016
"1 I I l
ALTERNATING
m
.020
I
.02_
I
MAXIMUM
(STEADY + ALTERNATING)
1
Figure 8.13 Baseline ATB: Pitch Link Loads vs. C T (Runs 32 and 36)
114

CR177436
-I00
-200
,_J
-300
.,_I
,._ -400I--
-500
-600
-700
NASA-AMES O.A.R.F. TEST 910
ATB ROTOR WITH BASELINE ELLIPTICAL TIP
AND TRUNCATED CUFF
SYM RUN
50b
ROTOR THRUST COEFFICIENT (CT)
.004 .008 .012 .016
I i I I
.020
I
MAXIMUM(STEADY + ALTERNATING)
f
C) 0 C)
Figure 8.14 Baseline ATB: Pitch Link Loads vs. C T (Run 5Oh)
,024
I
ll5

CR177436
-100
-2oo,,,,.,,,
,,..i
z
-300
!..-
,,,-,
-4oo(,t3
-500
-600 -
-700 -
NASA-AMES O.A.R.F. TEST 910ATB ROTOR WITH BASELINE ELLIPTICAL TIP
AND TRUNCATED CUFF
SYM RPM VTI_._..PP
500 654
•,-(_),-.571 747
--_-- 626 819
•004ROTOR THRUST COEFFICIENT (CT)
.008 .012 .016 .020
\
\
\
\
\
[]
Figure 8.15 Baseline ATB: Steady Pitch Link Loads vs. C T -Effect of RPM
.024
I16

CR177436
..Jv
--J
-,#Zl--q_J
I--
:Z
1-'-
Z
i,i
,..I
200 -
150 --
100 --
50
(
0
NASA-AMES O.A,R.F. TEST g10
ATB ROTOR WITH BASELINE ELLIPTICAL TIP
AND TRUNCATED CUFF
SYM RPM VTIE
-'E}'-- 500 654
•--Q-. 571 747
-A-- 626 819
x,,
C)
I, I I I I•004 ,008 .012 .016 .020
ROTOR THRUST COEFFICIENT (CT)
Figure 8.16 Baseline ATB: Alternating Pitch Link Loads vs. C T-Effect of RPM
ll7
I.024

CR177436
NASA-AMES O.A.R.F. TEST 910
A?B ROTOR WITH BASELINE ELLIPTICAL TIP
AND TRUNCATED CUFF
_oo- lcT . .OlOI
ii m
-loo..,.I
.J
P- -200
-300
-400 - I I I300 400 500 600
ROTOR SPEED (RPM)
Figure 8.17 Baseline ATB: Steady Pitch Link Loads vs. RPM
118

CR177436
200
NASA-AMES O.A.R.F. TEST 910
ATB ROTOR WITH BASELINE ELLIPTICAL TIPAND TRUNCATED CUFF
I CT - .010 1
A
0I I I I
300 400 500 600
ROTOR SPEED (RPM)
Figure 8.18 Basellne ATB: Alternatlng Pitch Link Loads vs. RPM
ll9

CR177436
NASA-AMES O.A.R.F. TEST 910
ATB ROTOR WITH BASELINE ELLIPTICAL TIPAND TRUNCATED CUFF
-160,000
120,000
RU..NNMAXIMUH ALTERNATING
.004
MAX IMUM
(STEADY + ALTERNATING)
"x /x
ALTERNATING
08 .012 .016
ROTOR THRUST COEFFICIENT (CT)
.020
-80,000
Figure 8.19 Basellne ATB: Flap Bendlng Moments at 0.10R vs. C T
120
•024

CR17743._..__6
160,000 --
120,000 --
-80,000 --
NASA-AMES O.A.R.F. TEST 910
ATB ROTOR WITH BASELINE ELLIPTICAL TIP
AND TRUNCATED CUFF
RUN MAXIMUM ALTERNATING
SOb _ -C_-
MAXIMUM
(STEADY + ALTERNATING
•004
ALTERNATING
-_ __c_/_c___ - _ --_ --_
008 .012 .016 .020
ROTOR THRUST COEFFICIENT (CT)
Figure 8.20 Baseline ATB: Flap Bending Moments at 0.10R vs. C T
.02_
121
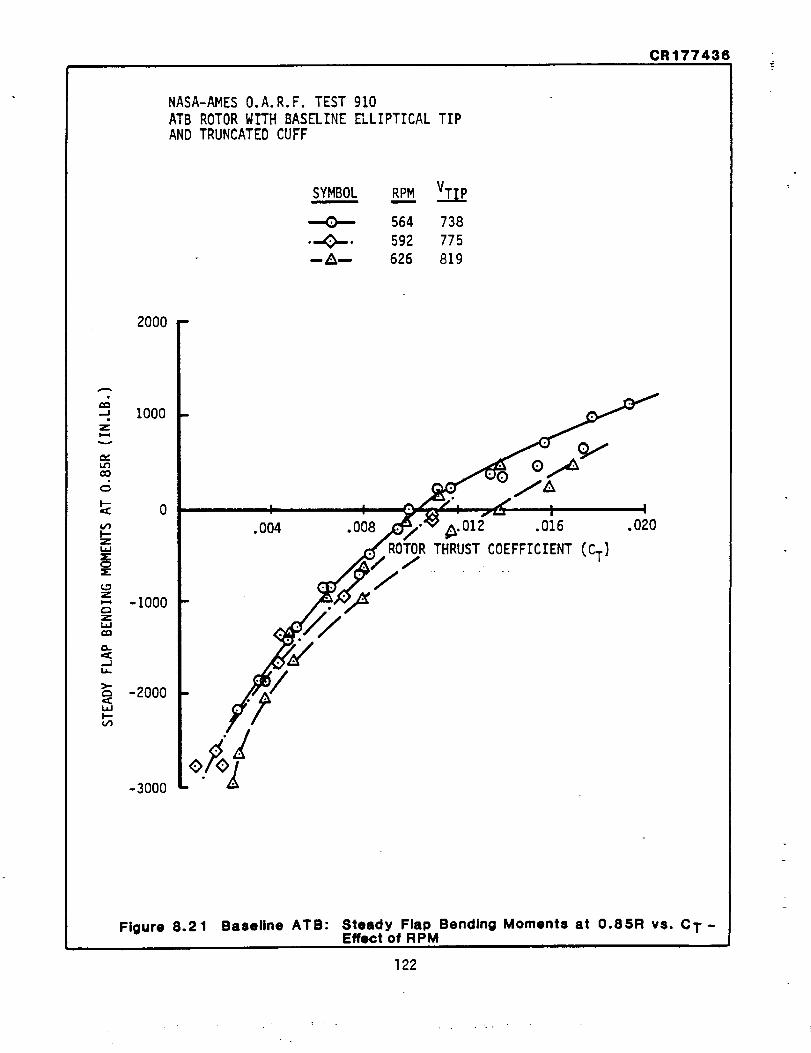
CR177436
w
.-I
Z
CO
I--
u')I--Z
Z:
_JC_
>.-
,:CL_JI-"(.n
NASA-AMES O.A.R.F. TEST 910
ATB ROTOR WITH BASELINE _LLIPTICAL TIPAND TRUNCATED CUFF
SYMBOL RPM VTIp
564 738
•_. 592 775--Am 626 819
2000 I
1000
0
-I000
-2000
-3000
•004 .008 _.012 .016 .020
ROTOR THRUST COEFFICIENT (CT}/
/
Figure 8.21 Baseline ATB: Steady Flap Bending Moments at 0.85R vs. C T -Effect of RPM
i i
122
, . . , .

CR1774361
g
C_
NASA-AMES O.A.R.F. TEST 910
ATB ROTOR RITFI BASELINE ELLIPTICAL TIP
AND TRUNCATED CUFF
2000 -
SYMBOL RPM VTIP
•--0--" 564 738
•.-_,-. 592 775
-A-- 626 819
.,:..
"-" 1600
CO
C)
I'--
1200
Z
,.,z,._800<
.JI.I.
<.'3
=:. 400
I'--.,.I
-e
z_ ,A
I I I I i0 i0 .004 .008 .012 .016 .020
ROTOR THRUST COEFFICIENT CCT)
Figure 8.22 Baseline ATB: Alternating Flap Bending Moments at 0.85R vs. C T -Effect of RPM
123

CR177436i
8OO
mm
600
Gele-_
O
.,...
_= 400.,J
:E
I,--
N 200
I,--
THRUST BEARING LIMITII_*l*lnt#Zlll/ll/#/##ll_ll IIIIIIIIIIIIlllllllnlllllllllllllllllll//lll/lllt/I
MONITORING LIMIT-_LLL_ 44#,.U._.U.CJ.4J._ .U.¢4.4._ Hill''" , s _ / I t , _ _ / / H , t / , i / / t / _ / _l , / / / /
/ / BASELINE "
m ./ / ELLIPTICAL TIP
/" / ..... 765 RPM .
SWEPT TIP / _ BLADE LAG ANGLE-1 u
// / / ELLIPTICALTIP// / / 565 RPM
0 .004 .008 i012 .016 .020 .024
ROTOR THRUST COEFFICIENT ..(CT)
Figure 8.23 Effect of Blade Sweep (Lag Angle) and Tip Shapeon Steady Pitch Link Loads
124

CR177436
A comparison of the ATB loads with the XV-15 Metal Blade loads indicatesthat load trends are similar, with the greatest difference being in the os-
cillatory loads. This is to be expected since oscillatory loads are depen-dent on wind conditions and cyclic control adjustments, and it was evidentthat the the oscillatory loads were affected by these.
In general, the ATB blades were tested to significantly higher thrust
coefficients (CT) than the metal blade without encountering any signs ofinstability, flutter, or excessive loads. As expected the steady spindlebeam moments and steady pitch link loads were proportionately higher than
the metal blade for the same CT due to the increased chord of the ATB.
Load trends with RPM followed expected patterns. For the same CT,
increasing the RPM increases blade thrust and blade loads.
8.3 Alternate Configurations: Advanced Technology Blade
Two alternate configurations had a notable effect on blade loads. Thesewere the 0.0 degrees blade sweep (the baseline has 1 degree sweep) and the
swept tip configurations. As expected there was an effect on steady pitchlink loads as shown in Figure 8.23. As noted in sections 7.5 and 7.7, the
swept tip performance data was following a trend which suggested that peak
performance might be better than the baseline ATB when pitch link loadsrestricted the test before peak figure of merit was reached.
9.0 ACOUSTICS
Near-field and Far-field noise levels were measured during the hover test
program. The near-field microphone location represented a point on thefuselage side of a typical tilt rotor in hover. The microphone locationsimulates a point on a fuselage 8 ft aft (2.4 meters) and with 2 ft (O.6m)radial clearance from the tip path plane. Far-field noise was recorded with
an array of microphones at 250 ft and 650 ft radius, at O, 15, 30 and 45
degrees behind the rotor disc.
Figure 9.1 shows comparative XV-15 metal blade and ATB overall near-fieldsound pressure levels as a function of rotor thrust. The ATB noise level is
approximately 2-3 dB lower than the metal blades over the normal operating
range.
Far-field noise data for the 15 degrees aft location is shown in Figure 9.2.
The ATB OASPL is approximately 5-6 dB lower than that from the XV-15 metalblades.
These comparative trends are expected since the tip pressure loading is lessfor the tapered, higher solidity ATB with its more even thrust distribution
over the span.
Table 9.1 summarizes runs during which acoustics data was acquired during
the OARF testing in 1984. This includes JVX isolated rotor runs as well asXV-15 metal blades and ATB test runs. The acquisition and analysis of theacoustics data from these tests was an Ames Research Center activity. Addi-
tional information may be obtained from Ames personnel (M.D. Maisel).
125

CR177436
_" 132 -
41_ 2 FT
MICROPHONE
128 -XV-15 METAL BLADES
MTI P = 0.69>__ 124 -
i_ _
120 -- i/ ,
116 _
_112 r """
d-io8_--0 I l,r, 1
0 2,000 4,000 6,000
\ADVANCED TECHNOLOGY BLADES
MTIP = 0.69
I I I8,000 I0,000 12,000
ROTOR THRUST (LB)
I14,000
Figure 9.1 Typical Near-Field Noise Data for XV-1 5 Metal Blade and ATB
C¢3
"" i00 ---JL_J>
"' 96--,..,.I
= 92
IX
" 88
Z
° 84
--J
u. 0
.
/ 2-.50$'r MICROPHONE
,/
m
_ _ ,=,.= m =,=., J,.=,
m
XV-15 METAL BLADES _"
MTIP = 0.69 "_-__._._'_" _ .
_ ADVANCED TECHNOLOGY BLADES
MTI P = 0.69
I I I I ..... ! ..... ! !2 ,000 4,000 6 ,000 8 ,000 10,000 12,000 14 ,DO0
ROTOR THRUST (LB)
Figure 9.2 Typical Far-Field Noise Data for XV-15 Metal Blade and ATB
126
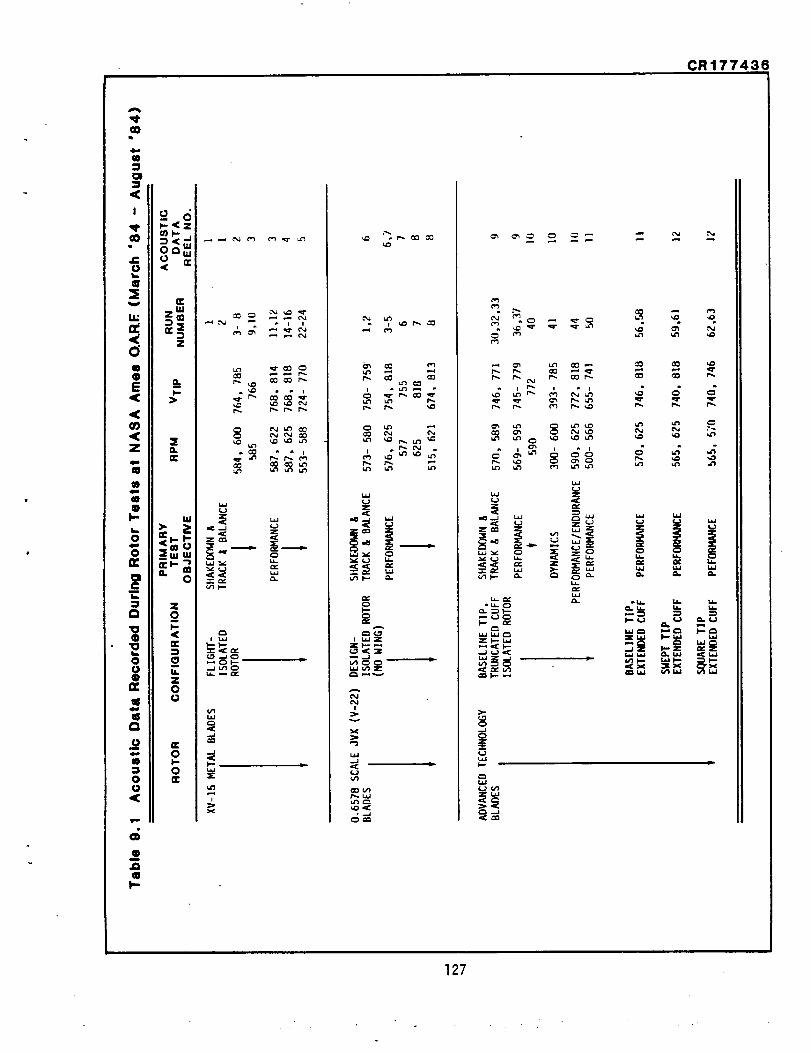
127

CR177436
10.0 CONCLUSIONS AND RECOMMENDATIONS
10.1 Conclusions
Full scale rotor hover performance was obtained for the basic XV-15 rotorand the Advanced Technology Blade (ATB). The following conclusions can be
drawn from the results:
Io Accuracy and reliability of the performance data is very high asshown by the low level of scatter in the data and repeatabilityof data taken at different times. (See for example, Figure 7.11).
. Both the ATB and the XV-15 rotors performed at levels signifi-
cantly better than anticipated from theoretical estimates.Measured peak values of figure of merit were in the range 0.79 to0.81 whereas predicted values did not exceed 0.79. Peak perfor-mance occurred at higher values of CT and did not drop off as
quickly as predicted (Figure 1.4).
. The performance of the baseline XV-15 rotor is higher than thatmeasured during a previous test of the same blades on the WPAFBwhirl tower when corrected for tower blockage effects (Figure 7.2).
o
.
Of the three tip shapes tested on the ATB blades, the elliptical
tip outperformed a rectangular tip and a swept tip (Figure 7.35).The swept tip and elliptical tips had the same solidity; thesolidity of the rectangular tip was slightly higher. However,
testing of the swept tip was curtailed but did indicate that its
performance might match or exceed that of the elliptical tip at
high thrust.
Testing of the ATB with no cuff, truncated cuff, and full cuffshowed that performance is improved as more blade area is added to
-the cuff region (Figure 7.37).
. A value of CT/OT = .22 was reached with the ATB before loadslimited further testing (Figure 7.11). The corresponding valuefor the XV-15 was .IB, (Figure 7.1).
a
.
Comparison of the ATB and XV-15 blade loads indicates that loadtrends are similar. The ATB blades were tested to significantly
higher thrust levels than the XV-15 without encountering anyinstability, flutter, or excessive loads.
Acoustical measurements show (Figures 9.1 and 9.2) that the ATB
with the elliptical tips was 2-3 dB lower than the XV-15 metalblades in the near-field and 5-6 dB lower in the far-field.
128

CR177436
10.2 Recommendations
A program of research should be initiated aimed at developingbetter wake models for use in tilt rotor hover performance anal-
yses. The program would consist of experimentally determining thewake vortex structure for different rotor operating conditions
(tip speed, collective) for representative blade planforms, twistdistributions, and number of blades. It would also be desirable
to make these measurements with blades having pressure instrumen-tation so that the blade circulation distribution can be deter-
mined. The combination of blade circulation distribution and wake
geometry can then be used to derive wake models for use in hover
performance analyses.
eThere is a need to acquire a better understanding of behavior of
the thick root sections used on tilt rotor blades especially near
and beyond stall. A program of wind tunnel test and analysis todefine the stall and post-stall behavior should be initiated.This would include two-dimensional testing as well as measurements
on the root sections of rotor blades.
1.
.
.
e
.
.
.
8.
11.0 REFERENCES
McVeigh, M. A. and Bartie, K., "V-22 Large-Scale Rotor Hover Perfor-mance and Wing Download Test", Bell Boeing Document D901-99140-1,
March 1985.
Benson, R. G., Ekquist, D., et al, "XV-15/Advanced Technology BladeHover Test Plan for NASA-Ames OARF", Boeing Document D210-12262-I,
December 1983.
Silcox, H. F., et al, "System Safety Analysis for Advanced Technology
Blades (ATB) on NASA-Ames Test Rig", Boeing Document D210-12256,
Volumes 1-5, January 1984.
Hell, S., et al, "Full-Scale Hover Test of a 25-Foot Tilt Rotor", BHT
Report 300-099-010, NASA CR114626, May 1973.
Devlin, J. F., "Instrumentation Requirements for Advanced TechnologyBlade Rotor Test at NASA-Ames OARF", Bell Boeing Document D901-gg025-2,
May 1984.
Walton, I., "Data Reduction Requirements for JVX/XV-15 Large-ScaleRotor Test at NASA-Ames OARF", Bell Boeing Document D901-gg050-3,
October 1983.
Schlichting, H., "Boundary Layer Theory", McGraw-Hill, NY, 1968.
Hoerner, S. Fo, "Fluid Dynamic Drag", published by Hoerner Fluid
Dynamics, 1965.
129

CR177436
APPENDIX A - CORRECTIONS FOR EFFECTS OF WIND
A.1 Introduction
The XV-15 and ATB rotor diameters are 25 Feet. The ATB rotor has a thrust-
weighted solidity of 0.10, the XV-15 rotor has a solidity of 0.089. The ro-tor data was generally acquired in conditions where the ambient windvelocity was not zero. A correction for the effect of wind is therefore
required to arrive at true hover performance. The method used to correctfor the effect of wind on hover performance is presented below.
A.2 Correction for Wind Effects
In a wind of speed V at an angle o to the rotor shaft, the rotor develops athrust T and a normal force NF. The rotor power is
Cp = CPPRo + p CT cos_ - p CNF sina + k _i CT(1)
where _ = V/VT, _i = vi/VT, v_ is the mean induced velocity, and k is acorrection factor for the ideal induced velocity.
During the test the rotor was trimmed to zero flapping. The rotor balancemeasured T and NF. Wind speed (V) and direction (o) were measured by an
anemometer mounted at a height above the ground. Using Hoerner's recom-mended model for the wind boundary layer, (Reference 8), it was determinedthat if the anemometer were positioned at the same height as the hub, the
mean wind speed would be read. The effect of the wind can be calculated as
follows.
The power required to hover in zero wind conditions is:
= + kH " CTCPH CppR0 vlH
Since CPpR0 does not vary significantly with small changes in ambient wind
conditions, we may substitute for CPPRofrOm Equation (1).
The adjusted power for hover in zero wind may then be written:
CPH= Cp p (CT cos_ - CNF sine) + kHViH I kH-ViH CT (2)
130

CR177436
The ratio v, = _i / _iH is obtained by solving
v,4 + 2 v, 3 V, cosa SIGN CT + v,2 V,z - i = 0 (3)
where V, = V/ViH
Equation (3) is solved for V, by iteration using the Newton-Raphson method
V,n+1 = V,n - (F/F')n
where F = v,4 + 2v,3 V, cosa SIGN CT + v, 2 V,2 - i
F' = 4v, _ + 6v, 2 V, cosa SIGN CT + 2v, V, 2 (4)
and a starting value is given by an approximation developed by Wayne Johnson.vlz
v, = i - Ucosalq_Tl = 1 - 0.5V, cosa
Figure A.1 shows the induced velocity ratio (and ideal power ratio) for dif-ferent wind speeds and directions for CT = .015. The effect of not applyinga wind correction is shown in Figure A.2 where true hover performance is
compared to that which would be calculated from measurements made in a 3knot wind. The effect of the wind is substantial, amounting to approximate-
ly 2 points in figure of merit when the flow Is axial.
On the basis of the above analysis the method for wind correction is:
i)
2)
Calculate v, using the full iterative quartic solution.
Calculate the hover power using equation (2). From estimated hover
performance the value of kH is 1.16. It is assumed that k = kHsince only very low advance ratios are involved.
131

CR177436
A.3 Data Reduction and Correction Procedure
The following are the steps in the data reduction and correction procedure.
I. Record the main balance thrust (axial force), rolling moment
(friction torque), normal force and shaft torque. Record meanwind speed (V) and direction (a).
2. Subtract the friction torque from the shaft torque to yield a true
rotor torque.
3. Put data in coefficient form, CT, Cp, etc.
4. Calculate the following:
(a) V. - VI ( VT 4T_)
(b) v. = I - .5 V. cosa
(c) F and F' from equation (4)
(d) V.n+ I = V.n - F/F'
(e) _ = - F/F'
If I_I _ .00001 set v.n = V.n+ 1 go to step (b) and iterate until
< .o00oi.
(f) set v. = V.n_ I
5. Calculate the corrected hover power coefficient from
CPH = Cp - p (CT cosa - CNF slna) + kH (l-v.) ICTI_'zvT
132

CR177436
.80 -
.76 -
.52
NOTES :
-|.006
TRUE HOVER PERFORMANCE
APPARENT I S=HOVER
PERFORMANCE
LIFTING-LINE ANALYSIS
WIND - 3 KTS
VTIP= 779 FPS
CNF= 0
kH= 1.15
I•008
I I I I.010 .012 .014 .016
ROTOR THRUST COEFFICIENT ..(CT)
i.018
Figure A.2 Effect of Wind on Hover Performance
134
I•020
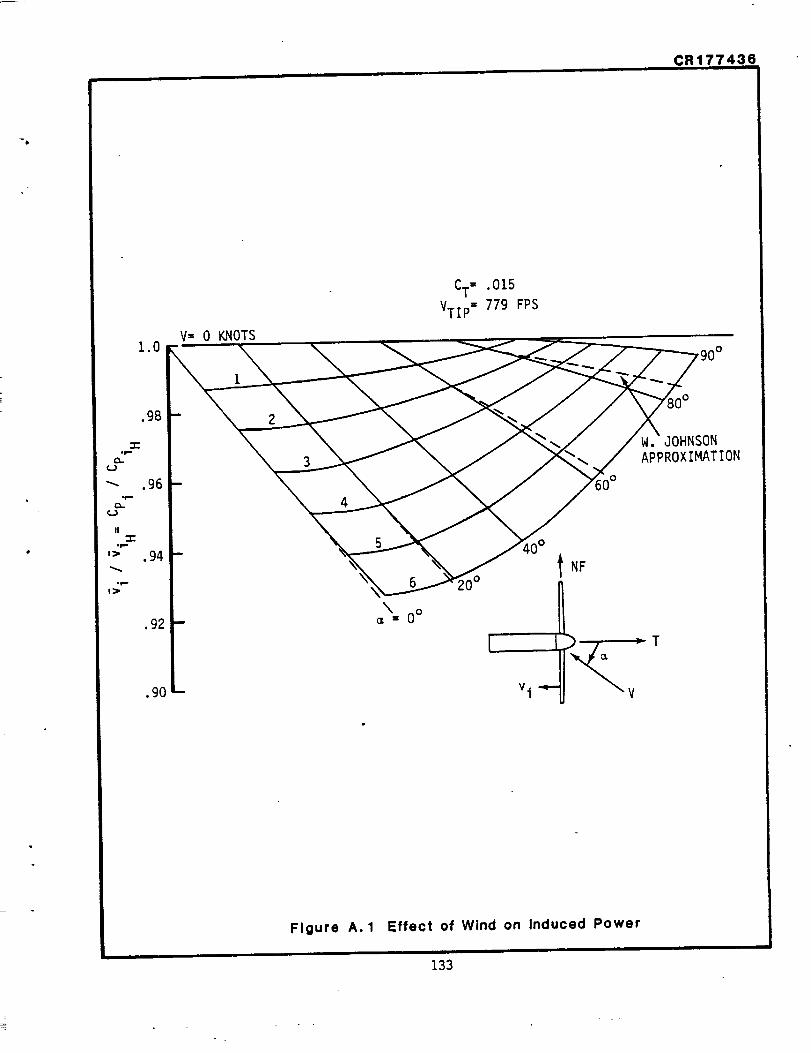
CR177436i
1.0
.98
-r"
0..
"_ .96.1'--
0.
II
itm
'> .94
,l,--
.92
.90
CT- .015
VTIP- 779 FPS
Figure A.1 Effect of Wind on Induced Power
133

I. Rel_ort No. 2. Government Accmaion No.
CR 177436
4. Title irtd Subtitle
Hover Performance Tests Of Baseline Metal and
Advanced Technology Blade (ATB) Rotor Systems for
the
7. Author(s)
K. Bartie, N. Ale_apder, M. McVei_h, S. La Mon,
g. _f_ming Or_n:_tion Name and Addr_
Boeing Vertol Company
P.O. Box 16858
Philadelphia, Pennsylvania 19142
Sgor_oring Agency Name and Address
NASA/AMES RESEARCH CENTER
MOFFETT FIELD, CALIFORNIA 94035
3. RecJOient's CatalOg No.
October 19866. _m,.g O,_an, zaz0o- Code
8. _.,_orm_ng Orginization Report No.
D210-12380-I
10. Work Unit No.
11. Contrlct or Grant No.
_?-1 1 '_13. Type of Rel3o_ and Plriod Covered
F INAL
14 Soonsorincj Agency Code
505-61-51
15 _D_em_tarV Not_
POINT OF CONTACT: TECHNICAL MONITOR, MARTIN D. MAISEL
M/S 237-5, NASA AMES RESEARCH CENTER
MOFFETT FIELD CA 94035 (415) 694-6372
16 Amtrect: Rotor hover performance data were obtained for two full-scale rotor
systems designed for the XV-15 Tilt Rotor Research Aircraft. One rotor
employed the rectahgular planform metal blades (rotor solidity=0.089) which
were used on the initial flight configuration of the XV-15. The second
rotor configuration examined the non-linear taper, composite-construction,
Advanced Technology Blade (ATB), (rotor solidity = 0.10) designed to replac_
the metal blades on the XV-15. Variations of the baseline ATB tip and cuff
shapes were also tested.
A new six-component rotor force and moment balance designed to obtain highly
accurate data over a broad range of thrust and torque conditions is describe,
in the report. The test data are presented in non-dimensional coefficient
form for the performance results, and in dimensional form for the steady and
alternating loads. Some wake and acoustics data are also shown.
7. Key W_ (Suggest_ _v Auth.(s))
ROTOR
HOVER PERFO_4ANCE
TILT ROTOR
XV-15
18. Oistr_tl_ Staten,n(ROTOR LOADS UNLIMITED
STATIC PERFORMA_E SUBJECT CATEGORY 05
- TEST L .
20. Security Cie_f. (of mi| I:age) 21, No. of PMll4 22. _ice"UNCLASSIFIED UNCLASSIFIED 151
"For _le by the NItionll TKhnical Inf_mati_ _lce, SOft,field, Virgiml 22161