Embed Size (px)
DESCRIPTION
NASA Earth Science Information Systems Capability Vision. Prepared by the Earth Science Data Systems Working Group. Why a Capability Vision for Information Systems?. Helps us focus our efforts What capabilities are needed to achieve the Earth science goals? - PowerPoint PPT Presentation
Citation preview
NATIONAL AERONAUTICSAND SPACE ADMINISTRATION
NASA Earth Science Information Systems NASA Earth Science Information Systems Capability VisionCapability Vision
Prepared by the Earth Science Data Systems Working Group
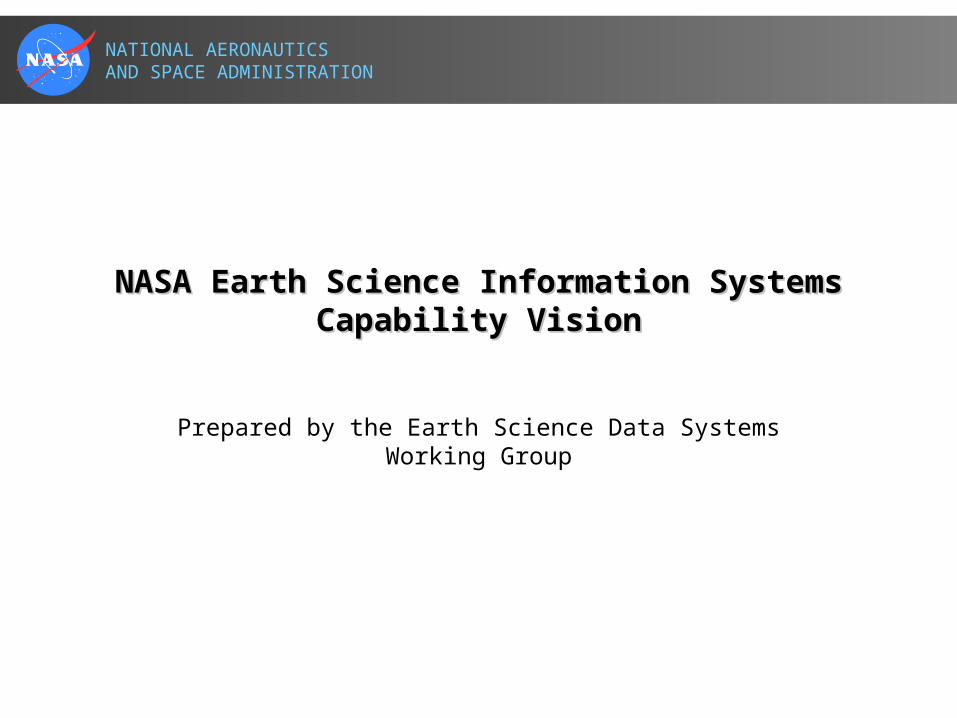
Why a Capability Vision for Information Systems?Why a Capability Vision for Information Systems?
• Helps us focus our efforts– What capabilities are needed to achieve the Earth science goals?– What technologies need to be infused most?– What standards are needed most?– What reusable components are needed most?
• Helps us measure progress– What is the roadmap for deploying new capabilities?– How much progress have we made toward achieving the vision?
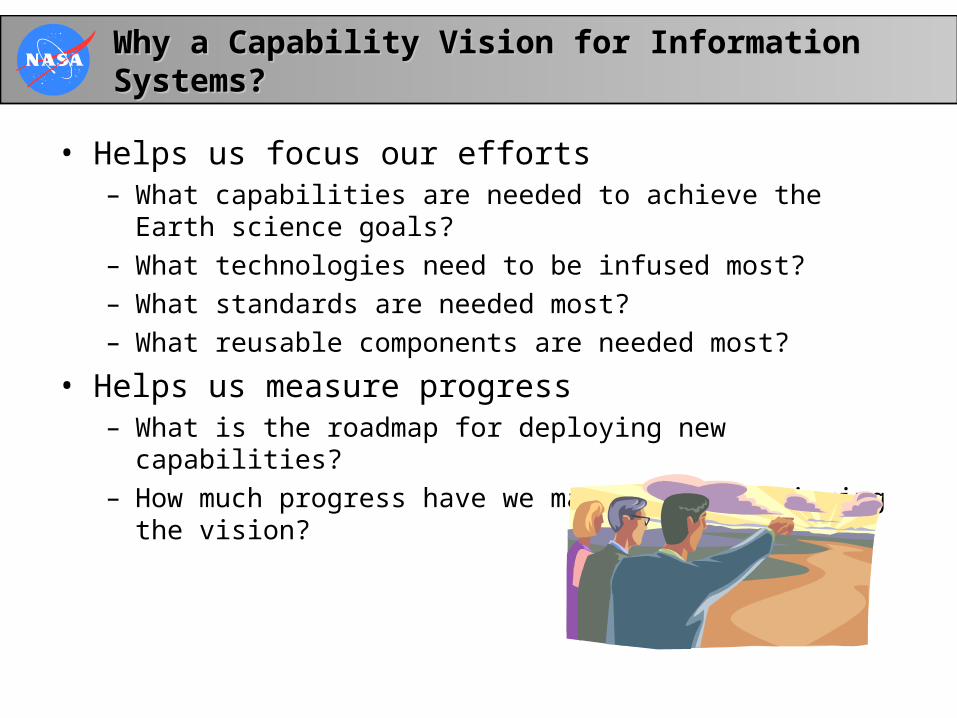
Earth Science Provides Important Information to Individuals, Earth Science Provides Important Information to Individuals, Organizations, and SocietiesOrganizations, and Societies
• Global observations from Earth observing satellites provide useful data on weather, climate, and natural hazards
• Knowledge gained through Earth science research has improved our understanding of Earth systems and global change
• NASA’s focus in the future will be on improving modeling and prediction capabilities
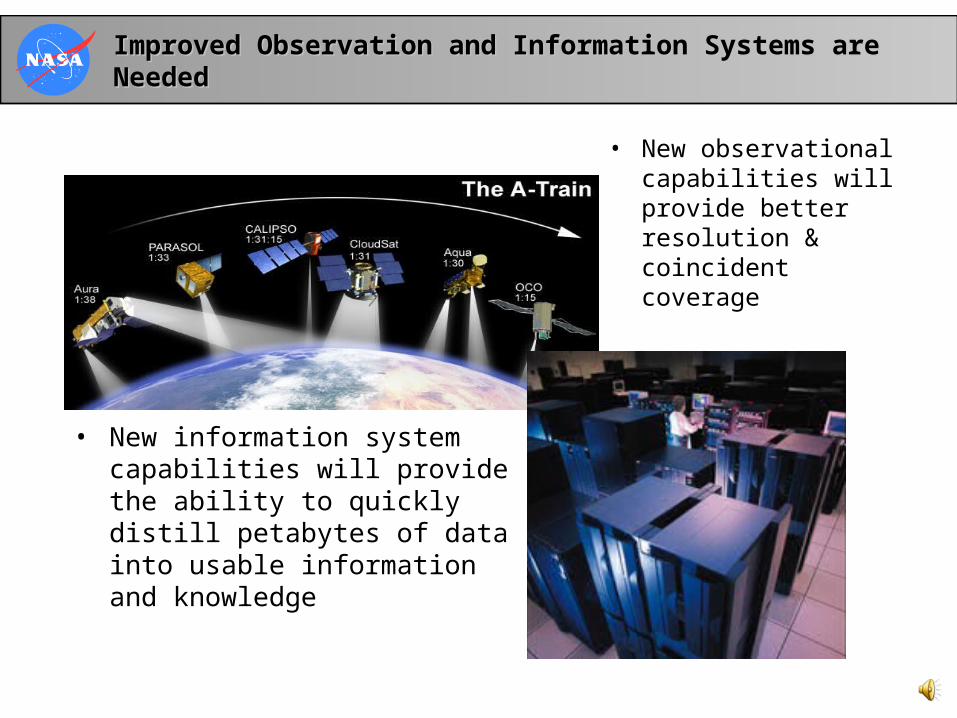
Improved Observation and Information Systems are NeededImproved Observation and Information Systems are Needed
• New observational capabilities will provide better resolution & coincident coverage
• New information system capabilities will provide the ability to quickly distill petabytes of data into usable information and knowledge

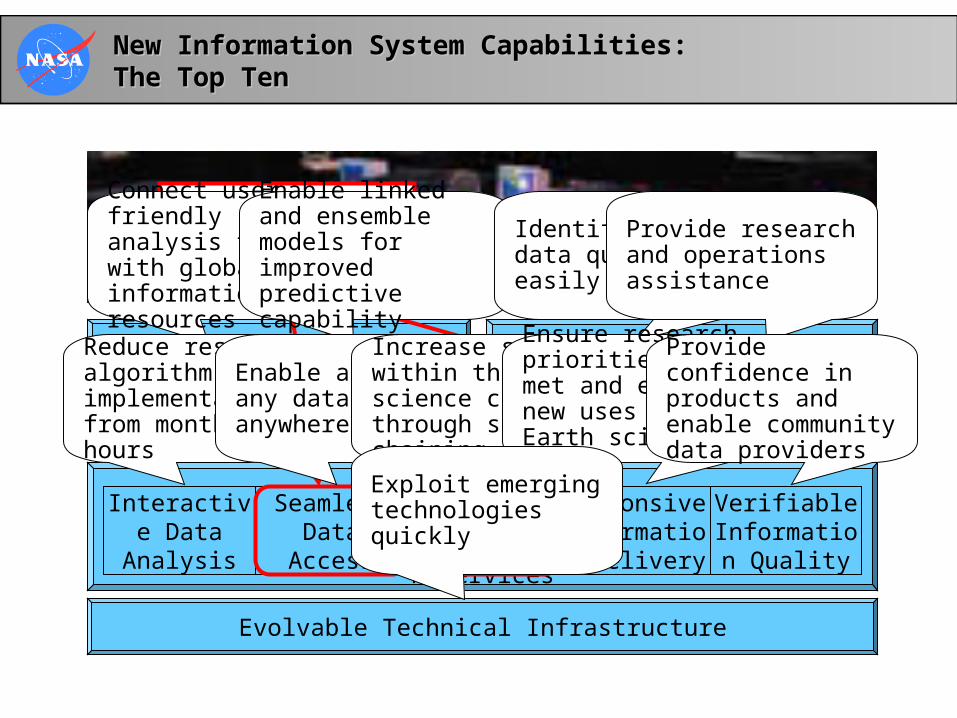
New Information System Capabilities:New Information System Capabilities:The Top TenThe Top Ten
Interactive Data Analysis
Interoperable Information
Services
Seamless Data Access
Assisted Data & Service Discovery
Assisted Knowledge
Building
Community Modeling
Frameworks
Responsive Information
Delivery
Verifiable Information
Quality
Evolvable Technical Infrastructure
Scalable Analysis Portals
Interactive Data Analysis
Interoperable Information
Services
Seamless Data Access
Assisted Data & Service Discovery
Assisted Knowledge
Building
Community Modeling
Frameworks
Responsive Information
Delivery
Verifiable Information
Quality
Evolvable Technical Infrastructure
Scalable Analysis Portals
New Information System Capabilities:New Information System Capabilities:The Top TenThe Top Ten
Capabilities Emphasized at This
Conference
Connect user friendly analysis tools with global information resources
Enable linked and ensemble models for improved predictive capability
Identify needed data quickly and easily
Provide research and operations assistance
Reduce research algorithm implementation from months to hours
Enable access to any data from anywhere
Increase synergy within the Earth science community through service chaining
Ensure research priorities are met and enable new uses of Earth science data
Provide confidence in products and enable community data providers
Exploit emerging technologies quickly
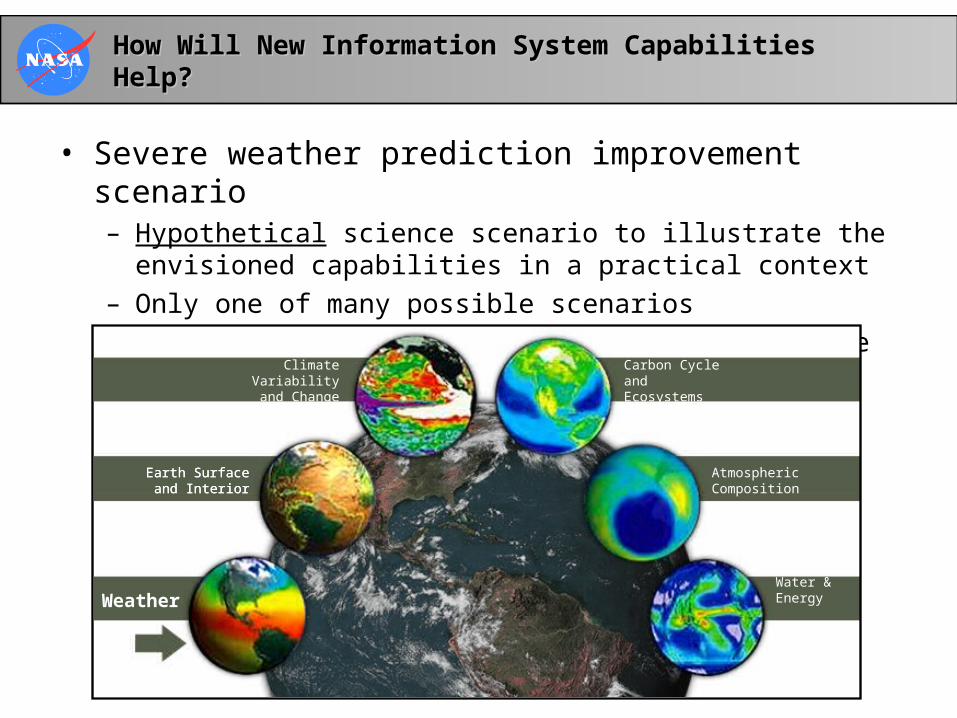
How Will New Information System Capabilities Help?How Will New Information System Capabilities Help?
• Severe weather prediction improvement scenario– Hypothetical science scenario to illustrate the envisioned
capabilities in a practical context– Only one of many possible scenarios– Based on one of six science focus areas in the Earth Science
Enterprise Strategy (Oct 2003)
Climate Variabilityand Change
Earth Surfaceand Interior
Weather
Carbon Cycleand Ecosystems
AtmosphericComposition
Climate Variabilityand Change
Earth Surfaceand Interior
Weather
Carbon Cycleand Ecosystems
Earth Surfaceand Interior
AtmosphericComposition
Water &Energy
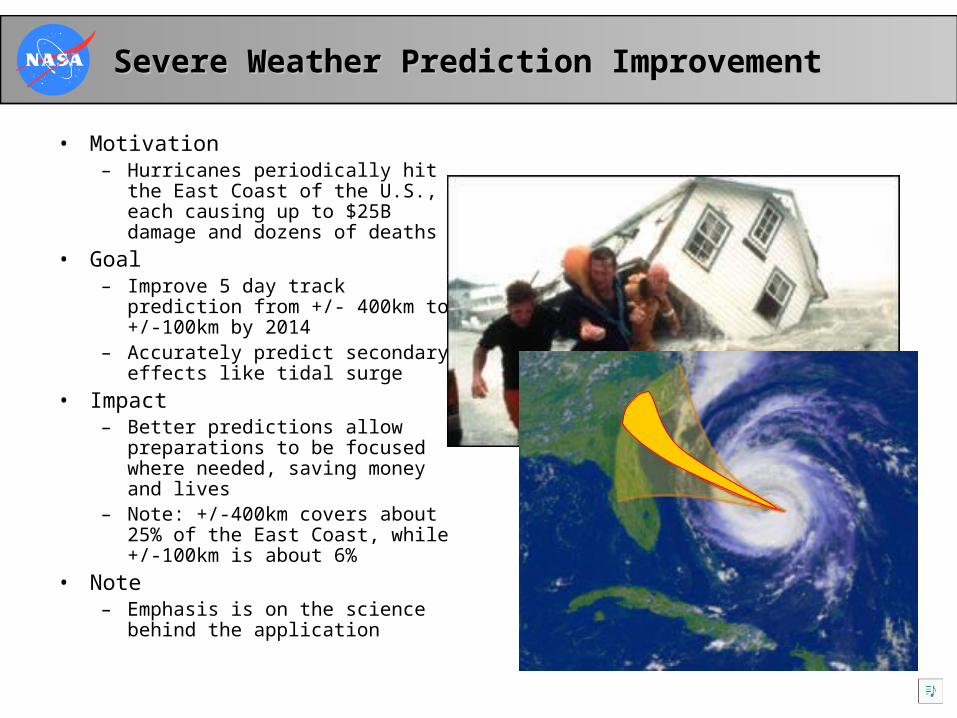
Severe Weather Prediction ImprovementSevere Weather Prediction Improvement
• Motivation– Hurricanes periodically hit the East
Coast of the U.S., each causing up to $25B damage and dozens of deaths
• Goal– Improve 5 day track prediction
from +/- 400km to +/-100km by 2014
– Accurately predict secondary effects like tidal surge
• Impact– Better predictions allow
preparations to be focused where needed, saving money and lives
– Note: +/-400km covers about 25% of the East Coast, while +/-100km is about 6%
• Note– Emphasis is on the science behind
the application
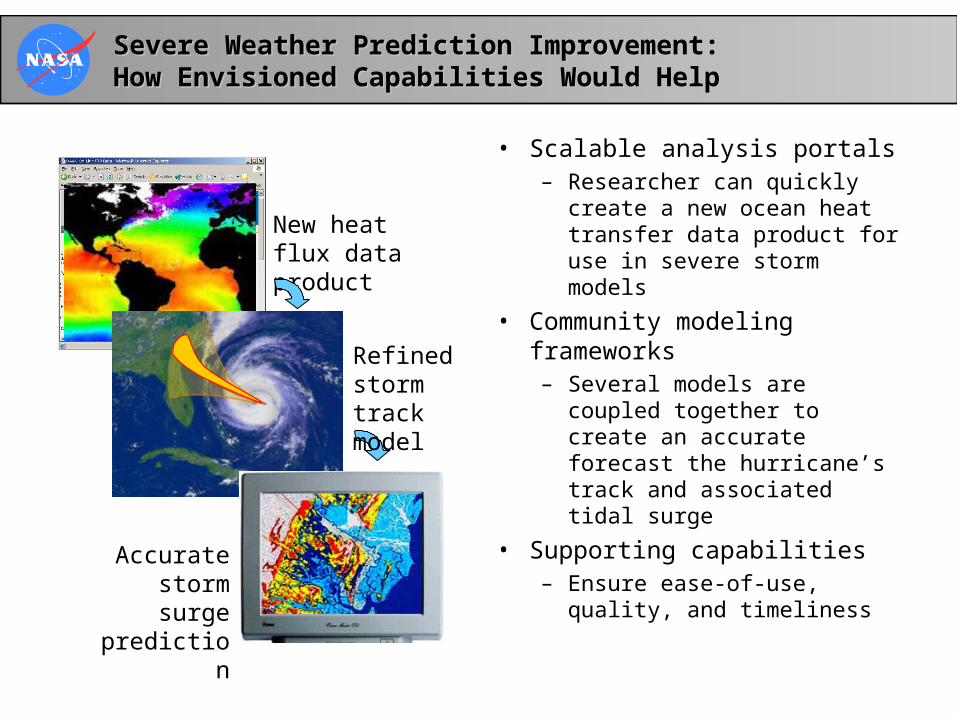
Severe Weather Prediction Improvement: Severe Weather Prediction Improvement: How Envisioned Capabilities Would HelpHow Envisioned Capabilities Would Help
• Scalable analysis portals– Researcher can quickly create
a new ocean heat transfer data product for use in severe storm models
• Community modeling frameworks– Several models are coupled
together to create an accurate forecast the hurricane’s track and associated tidal surge
• Supporting capabilities– Ensure ease-of-use, quality,
and timeliness
New heat flux data product
Refined storm track model
Accurate storm surge
prediction
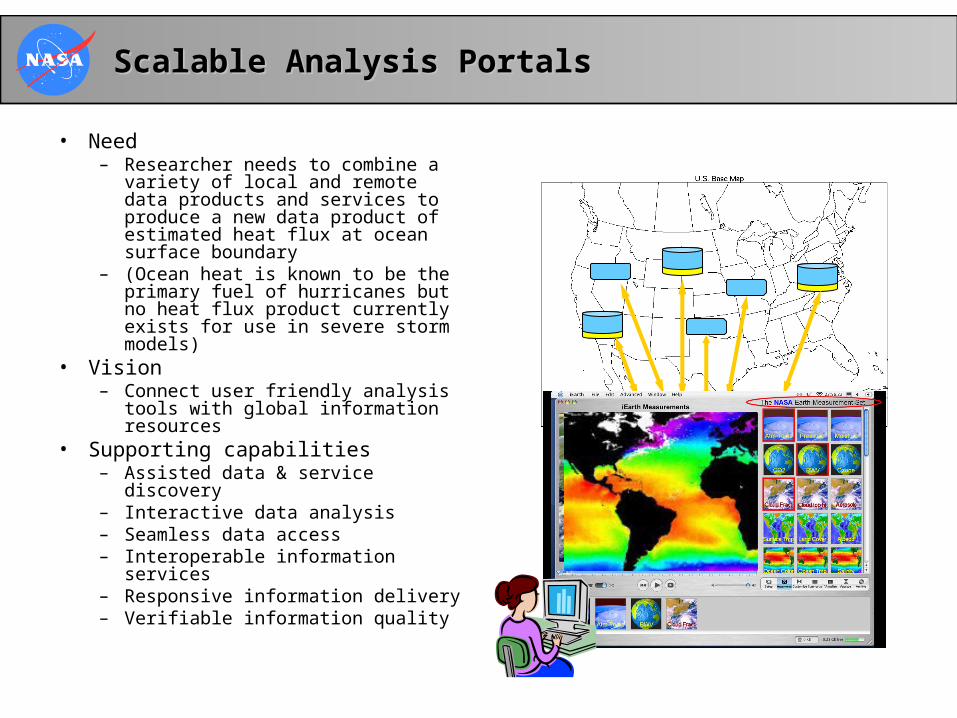
Scalable Analysis PortalsScalable Analysis Portals
• Need– Researcher needs to combine a
variety of local and remote data products and services to produce a new data product of estimated heat flux at ocean surface boundary
– (Ocean heat is known to be the primary fuel of hurricanes but no heat flux product currently exists for use in severe storm models)
• Vision– Connect user friendly analysis
tools with global information resources
• Supporting capabilities– Assisted data & service discovery– Interactive data analysis– Seamless data access– Interoperable information services– Responsive information delivery– Verifiable information quality
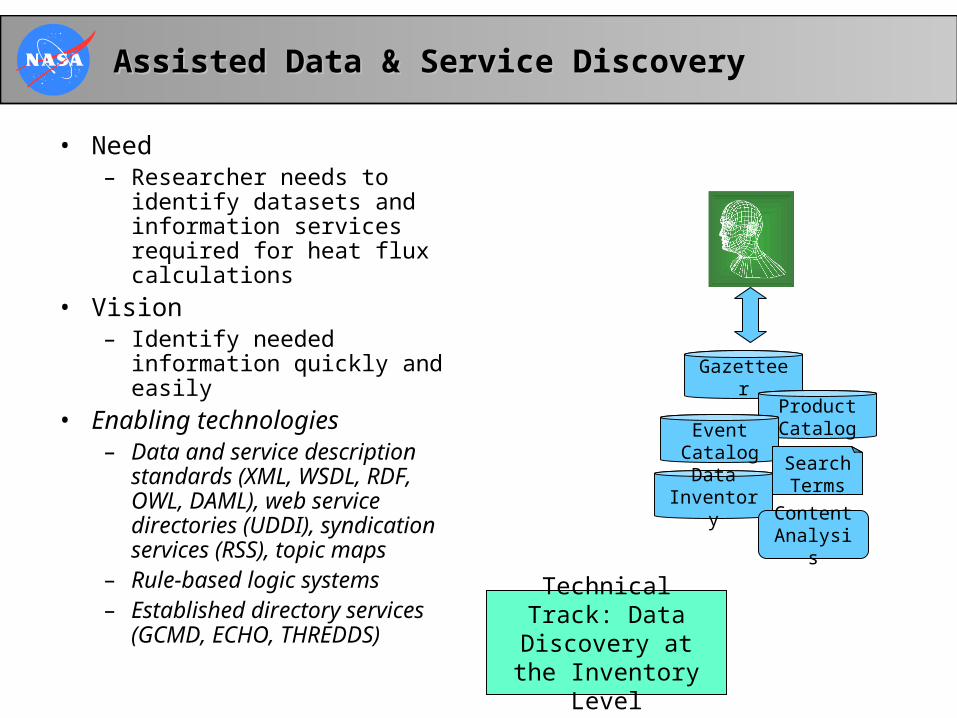
Assisted Data & Service DiscoveryAssisted Data & Service Discovery
• Need– Researcher needs to identify
datasets and information services required for heat flux calculations
• Vision– Identify needed information
quickly and easily
• Enabling technologies– Data and service description
standards (XML, WSDL, RDF, OWL, DAML), web service directories (UDDI), syndication services (RSS), topic maps
– Rule-based logic systems– Established directory services
(GCMD, ECHO, THREDDS)
Gazetteer
Product CatalogEvent
CatalogSearch TermsData
InventoryContent Analysis
Technical Track: Data Discovery at the Inventory Level
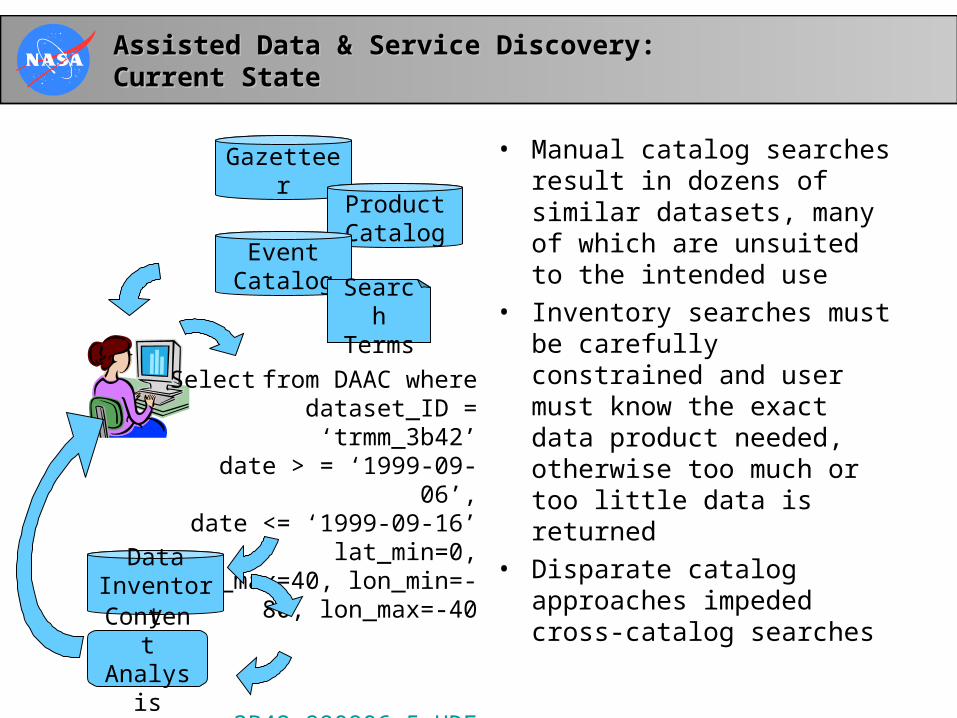
Assisted Data & Service Discovery:Assisted Data & Service Discovery:Current StateCurrent State
• Manual catalog searches result in dozens of similar datasets, many of which are unsuited to the intended use
• Inventory searches must be carefully constrained and user must know the exact data product needed, otherwise too much or too little data is returned
• Disparate catalog approaches impeded cross-catalog searches
Select from DAAC where dataset_ID = ‘trmm_3b42’
date > = ‘1999-09-06’, date <= ‘1999-09-16’
lat_min=0, lat_max=40, lon_min=-80, lon_max=-40
> 3B42.990906.5.HDF
GazetteerProduct Catalog
Data Inventory
Event Catalog
Search Terms
Content Analysis
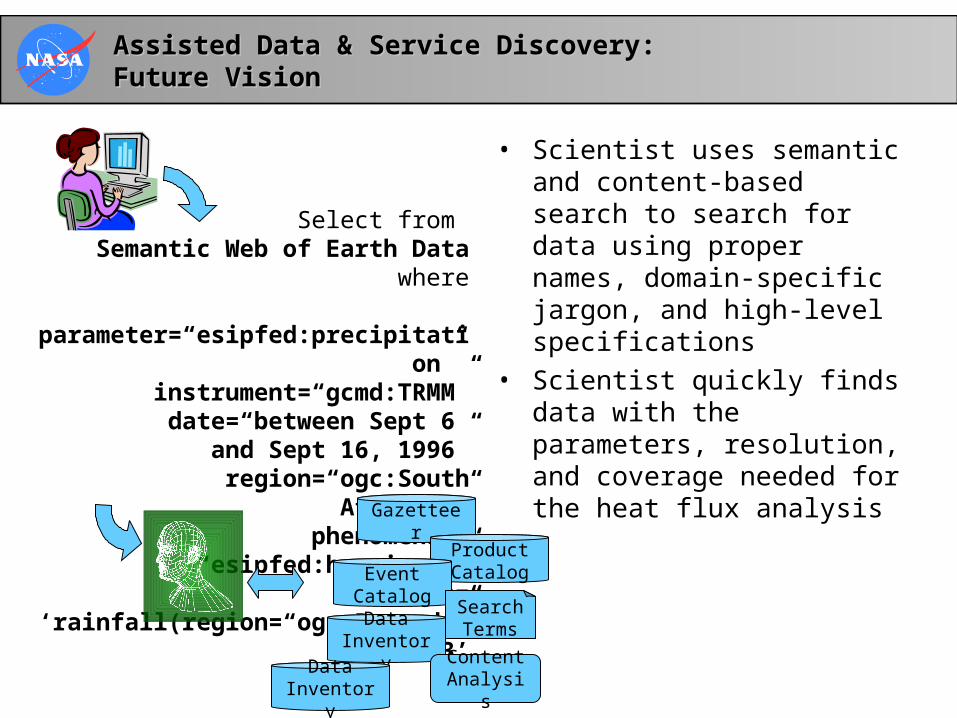
Assisted Data & Service Discovery:Assisted Data & Service Discovery:Future VisionFuture Vision
• Scientist uses semantic and content-based search to search for data using proper names, domain-specific jargon, and high-level specifications
• Scientist quickly finds data with the parameters, resolution, and coverage needed for the heat flux analysis
Select from Semantic Web of Earth Data where
parameter=“esipfed:precipitation” instrument=“gcmd:TRMM”
date=“between Sept 6 and Sept 16, 1996”
region=“ogc:South Atlantic” phenomena = “esipfed:hurricane”
function= ‘rainfall(region=“ogc:Bermuda”) > 3’
Gazetteer
Product CatalogEvent
CatalogSearch TermsData
InventoryContent Analysis
Data Inventory
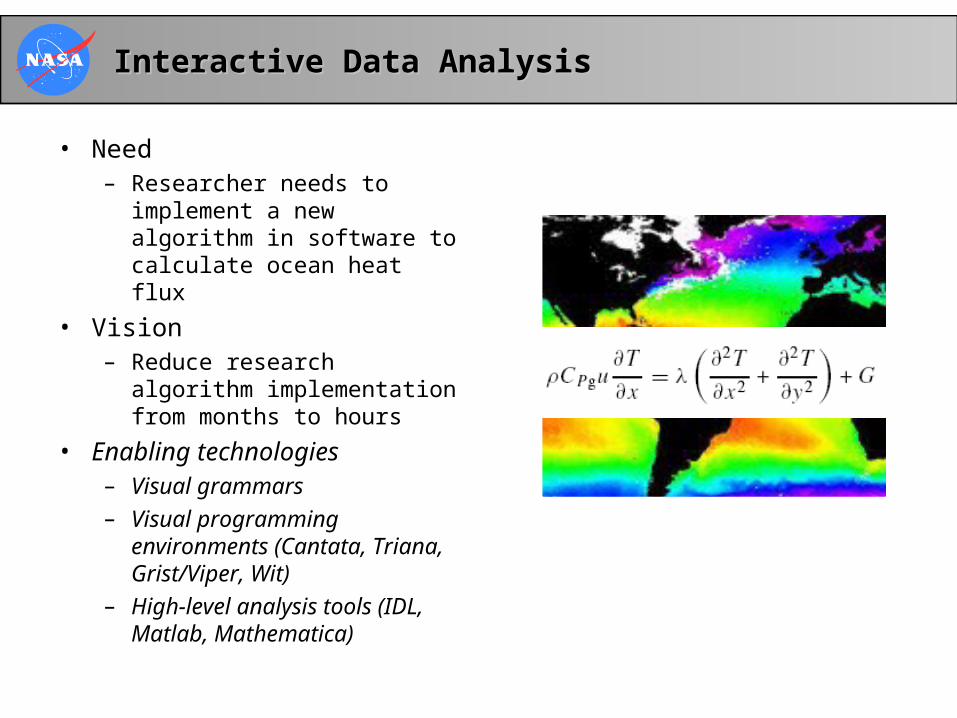
Interactive Data AnalysisInteractive Data Analysis
• Need– Researcher needs to
implement a new algorithm in software to calculate ocean heat flux
• Vision– Reduce research algorithm
implementation from months to hours
• Enabling technologies– Visual grammars
– Visual programming environments (Cantata, Triana, Grist/Viper, Wit)
– High-level analysis tools (IDL, Matlab, Mathematica)
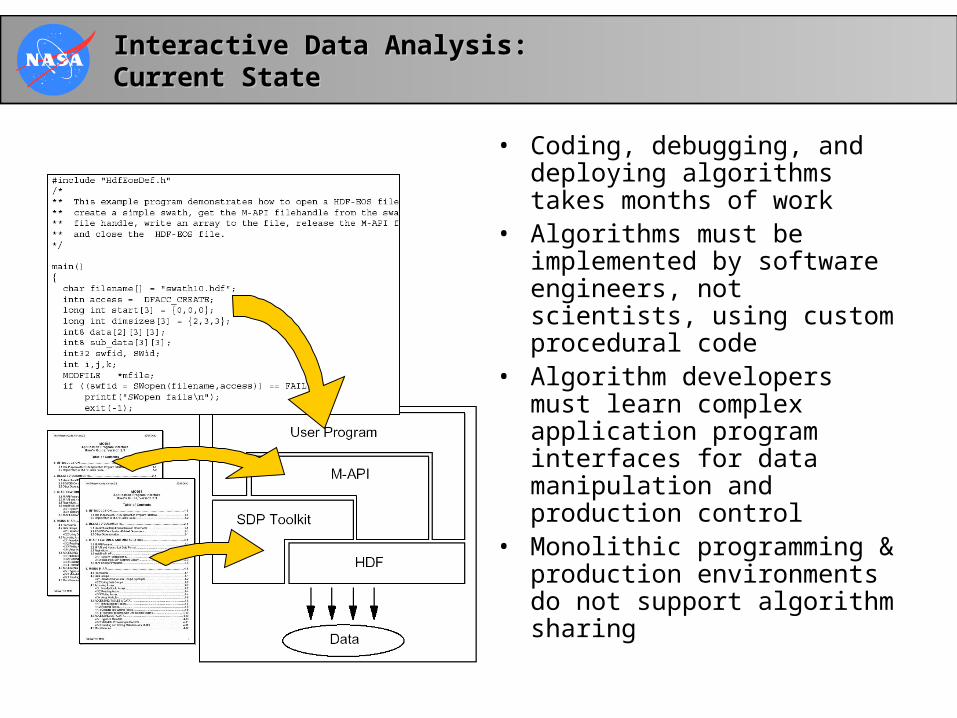
Interactive Data Analysis:Interactive Data Analysis:Current StateCurrent State
• Coding, debugging, and deploying algorithms takes months of work
• Algorithms must be implemented by software engineers, not scientists, using custom procedural code
• Algorithm developers must learn complex application program interfaces for data manipulation and production control
• Monolithic programming & production environments do not support algorithm sharing

Interactive Data Analysis:Interactive Data Analysis:Future VisionFuture Vision
• Scientist uses a visual programming environment to create a new heat flux product in hours rather than months
• Scientist plugs useful transforms created by others into the visual programming environment as needed
• Scientist analyzes data with interactive tool to identify and quantify relationships between sea surface winds, temperature, topography, and heat transfer
• Scientist publishes analysis results as a data product for use in hurricane models
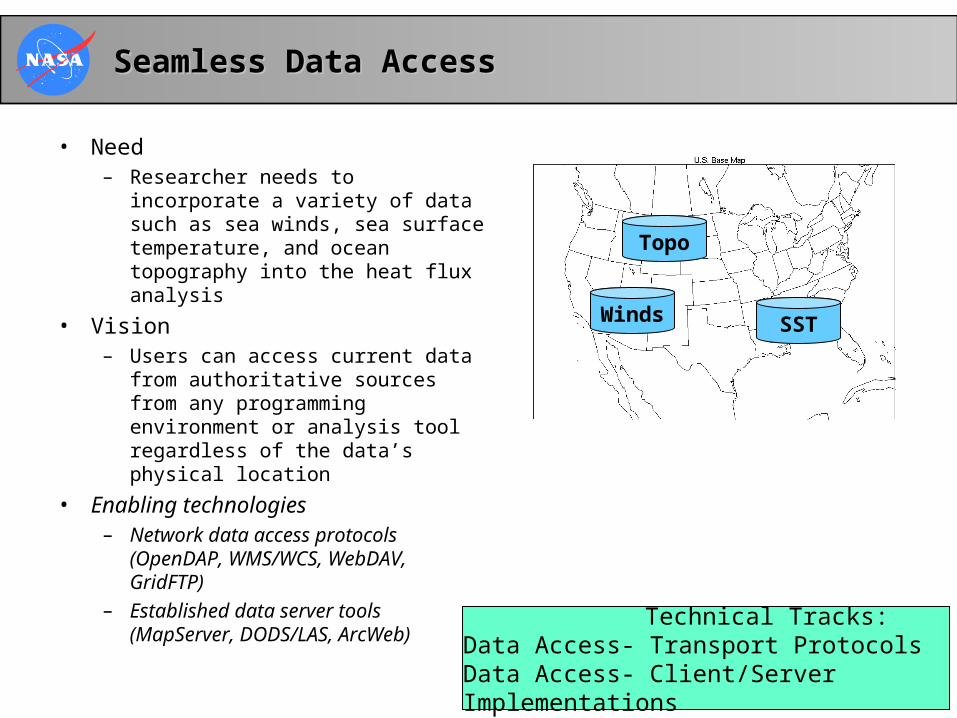
Seamless Data AccessSeamless Data Access
• Need– Researcher needs to incorporate a
variety of data such as sea winds, sea surface temperature, and ocean topography into the heat flux analysis
• Vision– Users can access current data from
authoritative sources from any programming environment or analysis tool regardless of the data’s physical location
• Enabling technologies– Network data access protocols
(OpenDAP, WMS/WCS, WebDAV, GridFTP)
– Established data server tools (MapServer, DODS/LAS, ArcWeb)
Winds SST
Topo
Technical Tracks:Data Access- Transport ProtocolsData Access- Client/Server Implementations
Seamless Data Access:Seamless Data Access:Current StateCurrent State
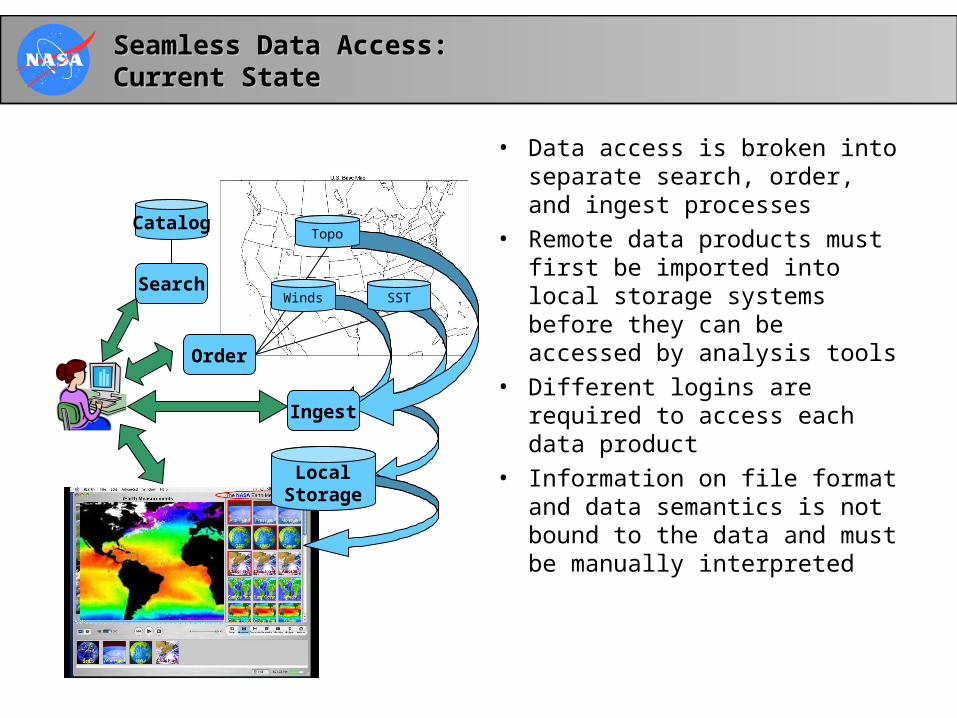
• Data access is broken into separate search, order, and ingest processes
• Remote data products must first be imported into local storage systems before they can be accessed by analysis tools
• Different logins are required to access each data product
• Information on file format and data semantics is not bound to the data and must be manually interpreted
Search
Catalog
Order
Ingest
Winds SST
Topo
Local Storage
Seamless Data Access:Seamless Data Access:Future VisionFuture Vision
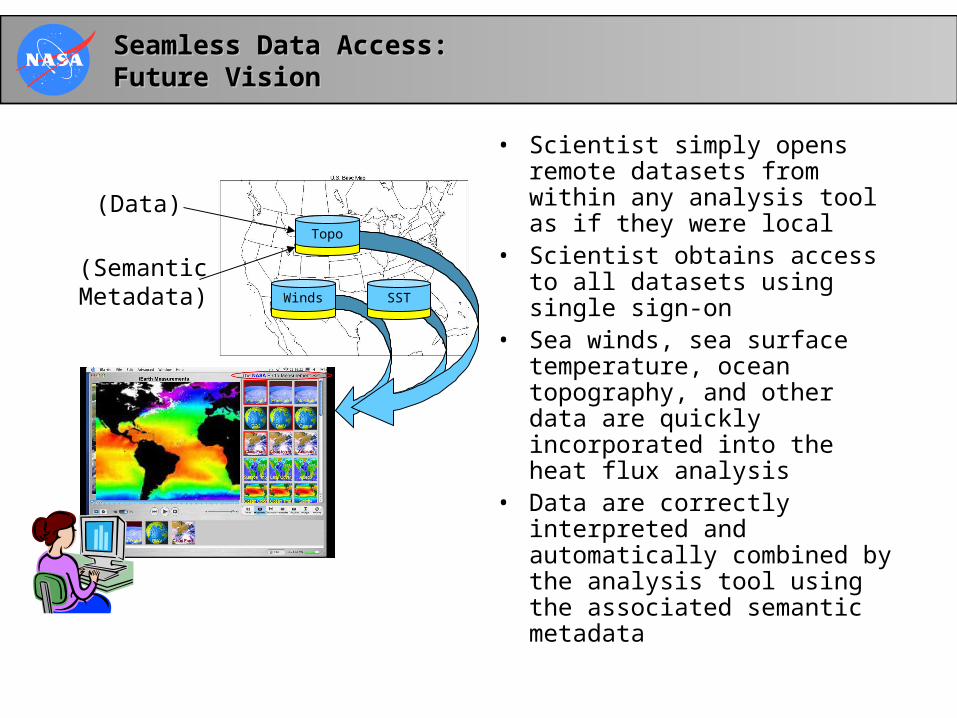
• Scientist simply opens remote datasets from within any analysis tool as if they were local
• Scientist obtains access to all datasets using single sign-on
• Sea winds, sea surface temperature, ocean topography, and other data are quickly incorporated into the heat flux analysis
• Data are correctly interpreted and automatically combined by the analysis tool using the associated semantic metadata
Winds SST
Topo
(SemanticMetadata)
(Data)
Interoperable Information ServicesInteroperable Information Services
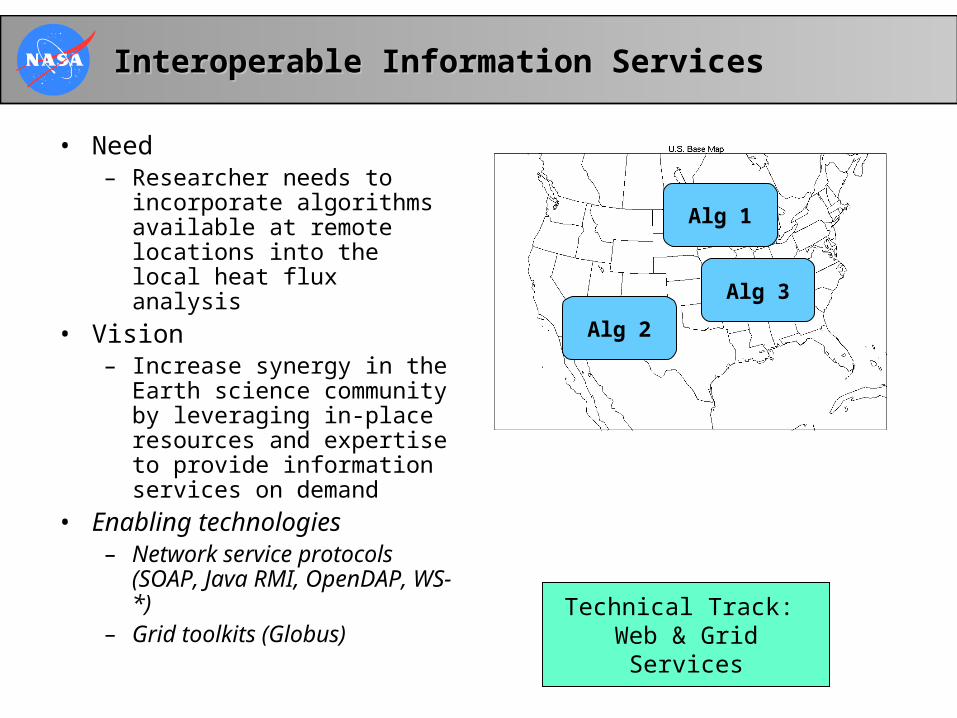
• Need– Researcher needs to
incorporate algorithms available at remote locations into the local heat flux analysis
• Vision– Increase synergy in the Earth
science community by leveraging in-place resources and expertise to provide information services on demand
• Enabling technologies– Network service protocols
(SOAP, Java RMI, OpenDAP, WS-*)
– Grid toolkits (Globus)
Alg 1
Alg 2
Alg 3
Technical Track: Web & Grid Services
Alg 1
Alg 2
Interoperable Information Services:Interoperable Information Services:Current StateCurrent State
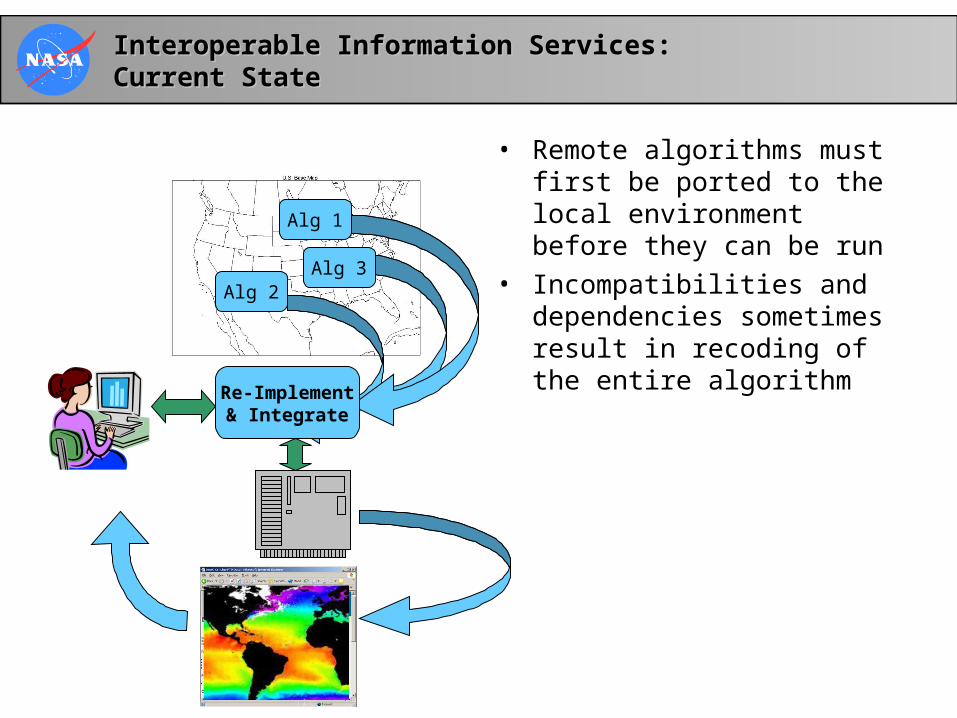
• Remote algorithms must first be ported to the local environment before they can be run
• Incompatibilities and dependencies sometimes result in recoding of the entire algorithmRe-Implement
& Integrate
Alg 3
Interoperable Information Services:Interoperable Information Services:Future VisionFuture Vision
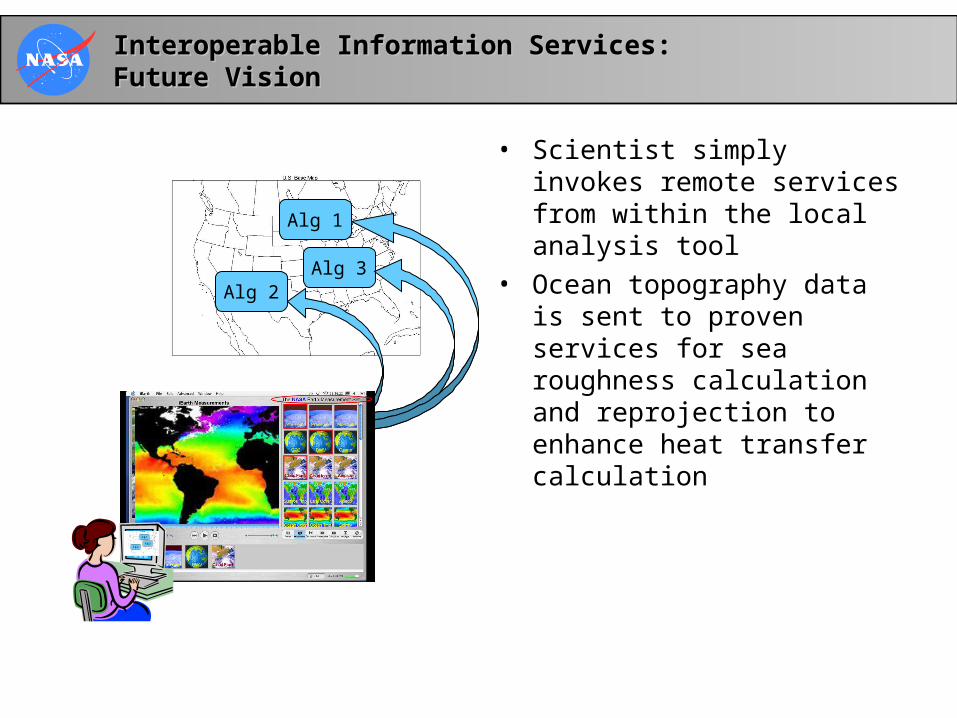
• Scientist simply invokes remote services from within the local analysis tool
• Ocean topography data is sent to proven services for sea roughness calculation and reprojection to enhance heat transfer calculation
Alg 1
Alg 2Alg 3
Alg 1
Alg 2Alg 3
Alg 1
Alg 2Alg 3
Assisted Knowledge BuildingAssisted Knowledge Building
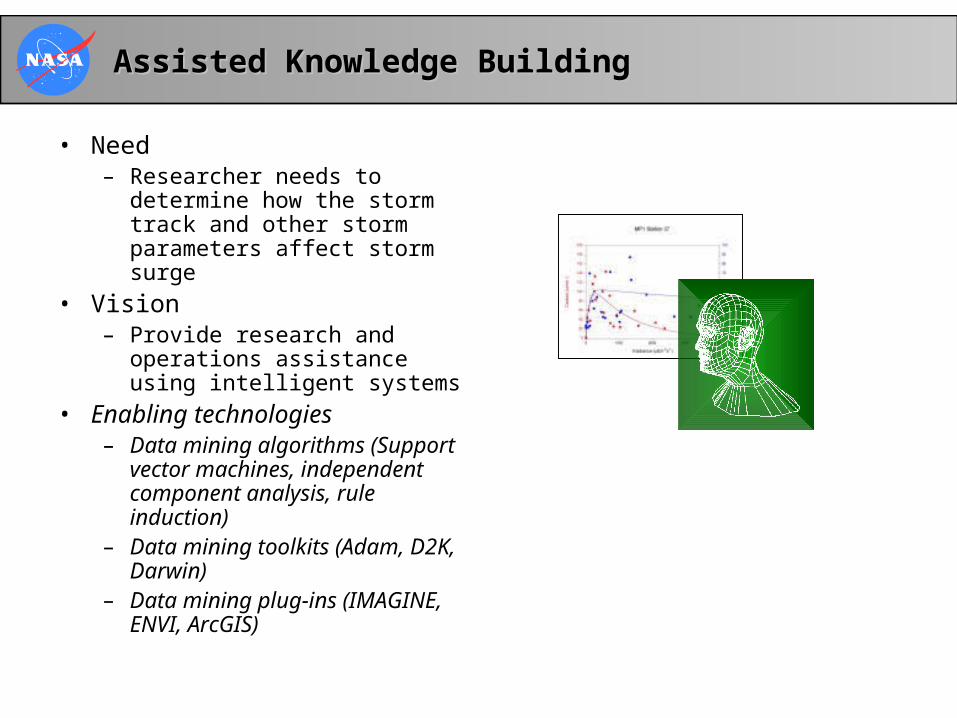
• Need– Researcher needs to
determine how the storm track and other storm parameters affect storm surge
• Vision– Provide research and
operations assistance using intelligent systems
• Enabling technologies– Data mining algorithms
(Support vector machines, independent component analysis, rule induction)
– Data mining toolkits (Adam, D2K, Darwin)
– Data mining plug-ins (IMAGINE, ENVI, ArcGIS)
Assisted Knowledge Building:Assisted Knowledge Building:Current StateCurrent State
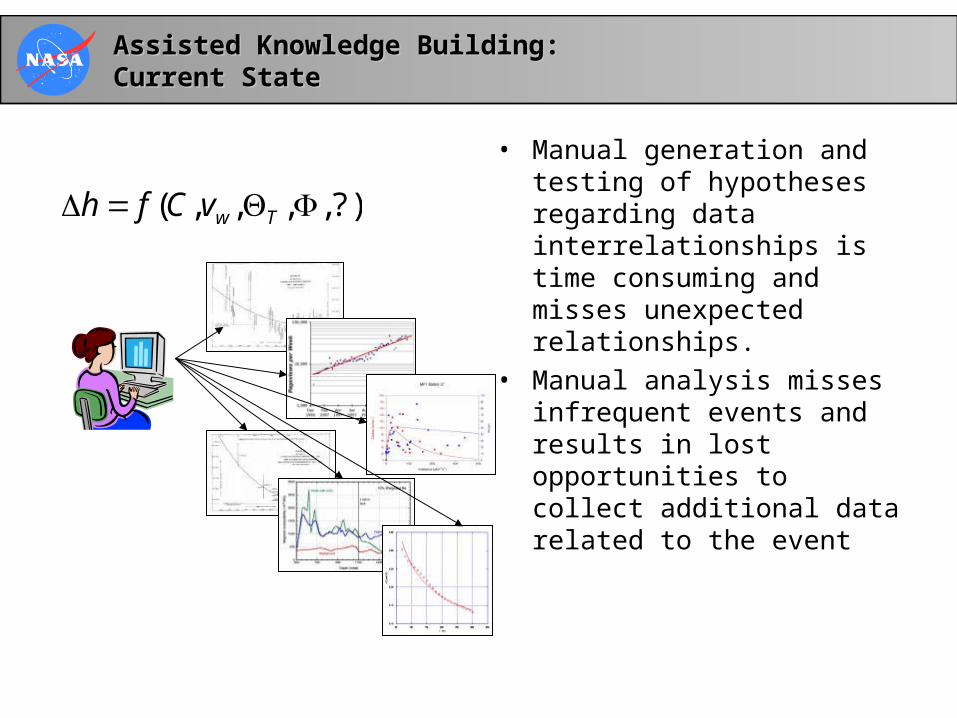
• Manual generation and testing of hypotheses regarding data interrelationships is time consuming and misses unexpected relationships.
• Manual analysis misses infrequent events and results in lost opportunities to collect additional data related to the event
?),,,,( TwvCfh
Assisted Knowledge Building:Assisted Knowledge Building:Future VisionFuture Vision
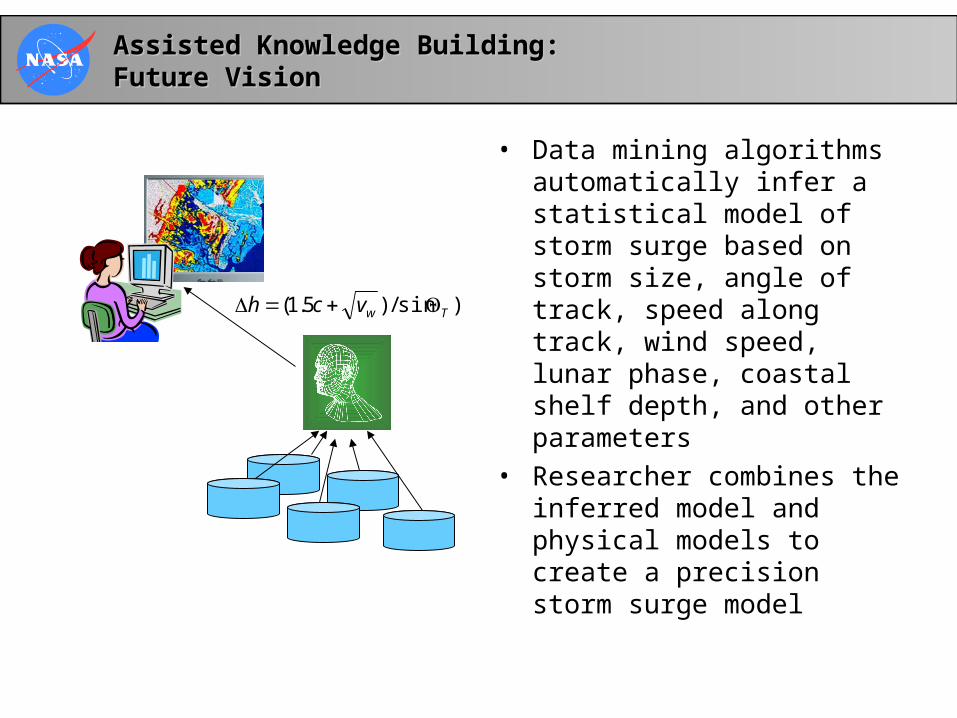
• Data mining algorithms automatically infer a statistical model of storm surge based on storm size, angle of track, speed along track, wind speed, lunar phase, coastal shelf depth, and other parameters
• Researcher combines the inferred model and physical models to create a precision storm surge model
)sin/)5.1( Twvch
Community Modeling FrameworksCommunity Modeling Frameworks
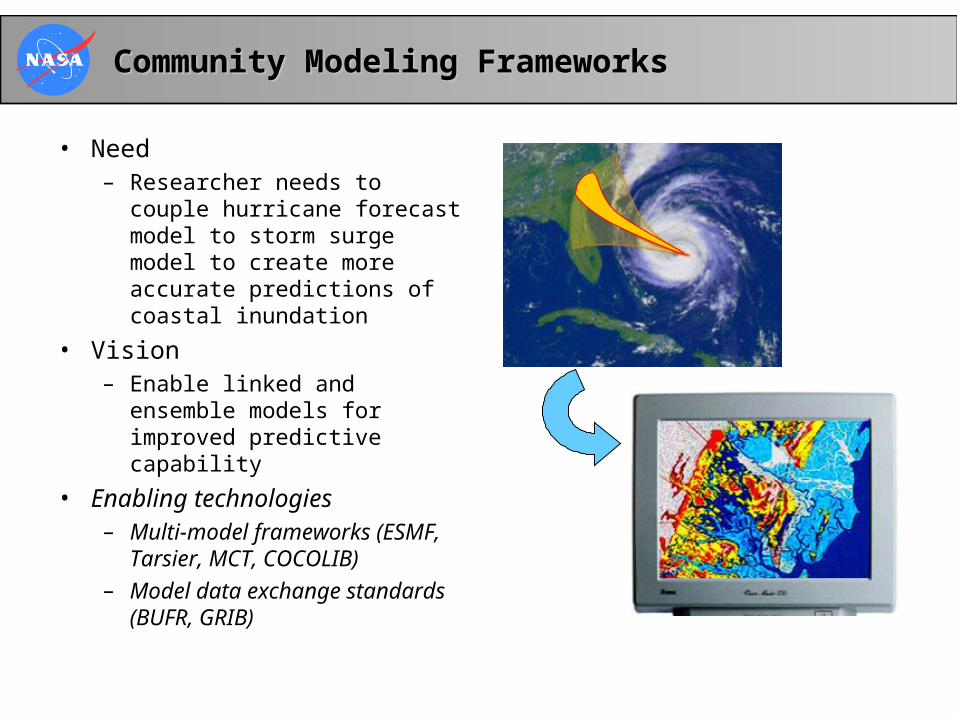
• Need– Researcher needs to couple
hurricane forecast model to storm surge model to create more accurate predictions of coastal inundation
• Vision– Enable linked and ensemble
models for improved predictive capability
• Enabling technologies– Multi-model frameworks
(ESMF, Tarsier, MCT, COCOLIB)
– Model data exchange standards (BUFR, GRIB)
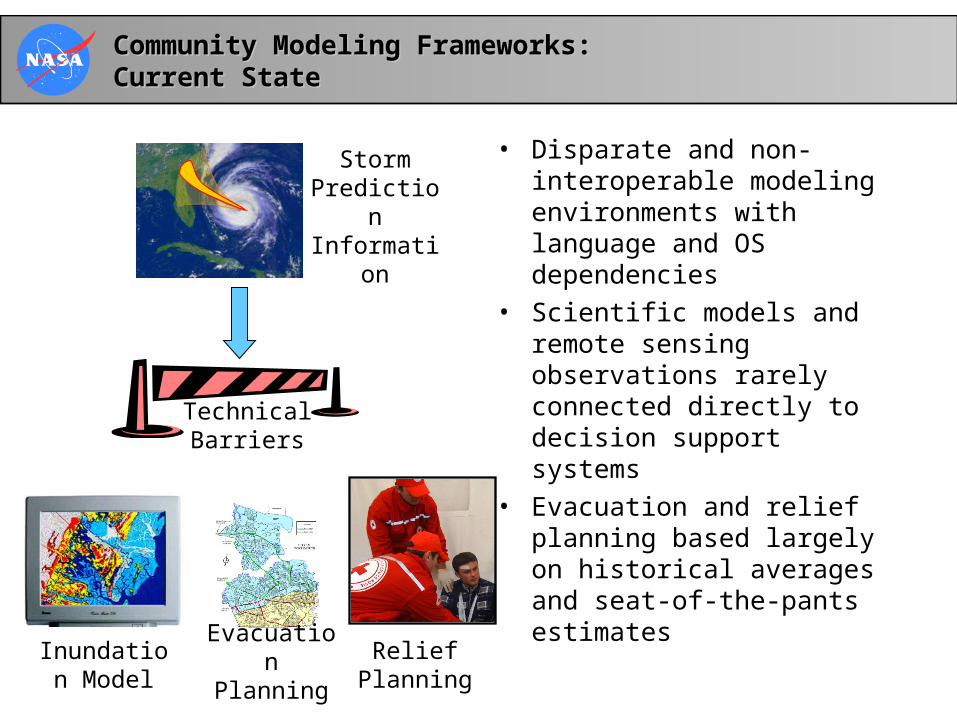
Community Modeling Frameworks:Community Modeling Frameworks:Current StateCurrent State
• Disparate and non-interoperable modeling environments with language and OS dependencies
• Scientific models and remote sensing observations rarely connected directly to decision support systems
• Evacuation and relief planning based largely on historical averages and seat-of-the-pants estimates
Relief Planning
Evacuation Planning
Storm Prediction
Information
Technical Barriers
Inundation Model
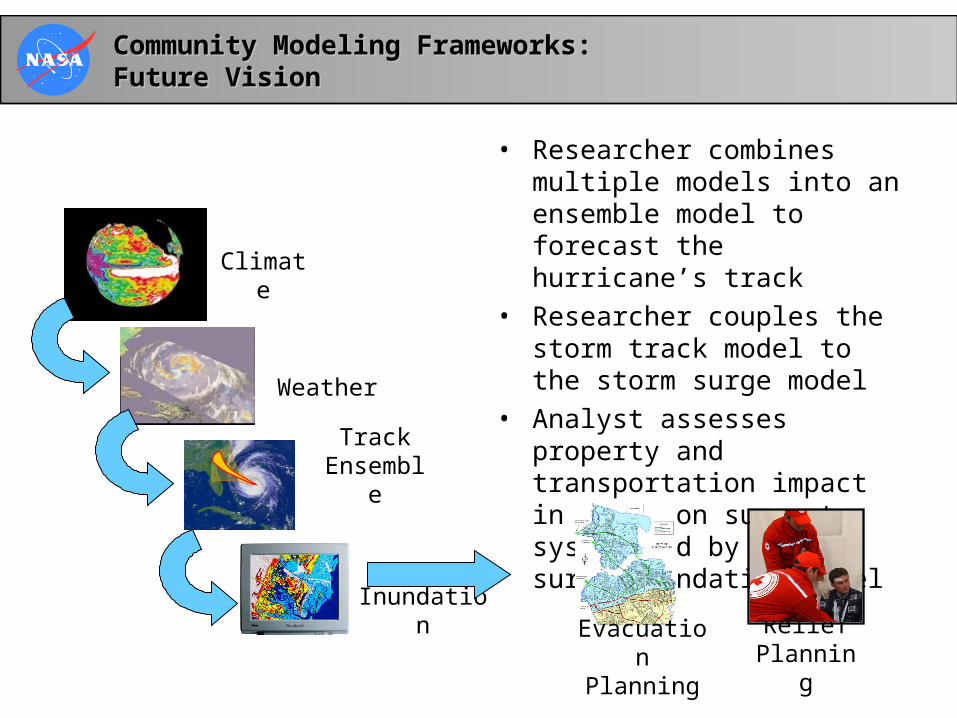
Community Modeling Frameworks:Community Modeling Frameworks:Future VisionFuture Vision
• Researcher combines multiple models into an ensemble model to forecast the hurricane’s track
• Researcher couples the storm track model to the storm surge model
• Analyst assesses property and transportation impact in decision support system fed by storm surge/inundation model
Weather
Climate
Track Ensemble
InundationRelief
PlanningEvacuation Planning
Verifiable Information QualityVerifiable Information Quality
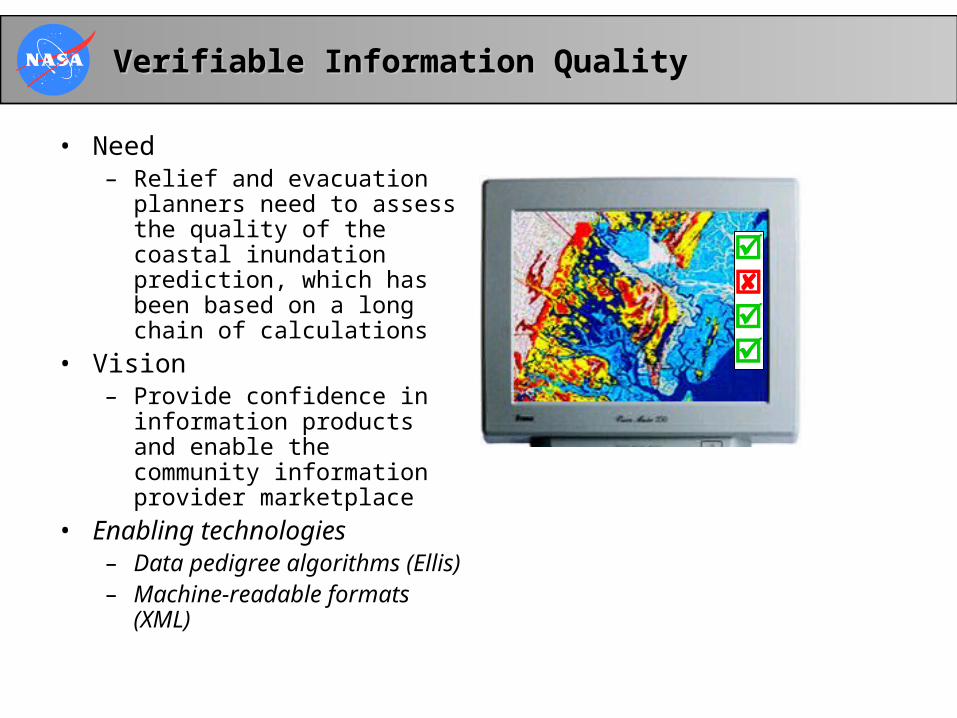
• Need– Relief and evacuation
planners need to assess the quality of the coastal inundation prediction, which has been based on a long chain of calculations
• Vision– Provide confidence in
information products and enable the community information provider marketplace
• Enabling technologies– Data pedigree algorithms
(Ellis)– Machine-readable formats
(XML)
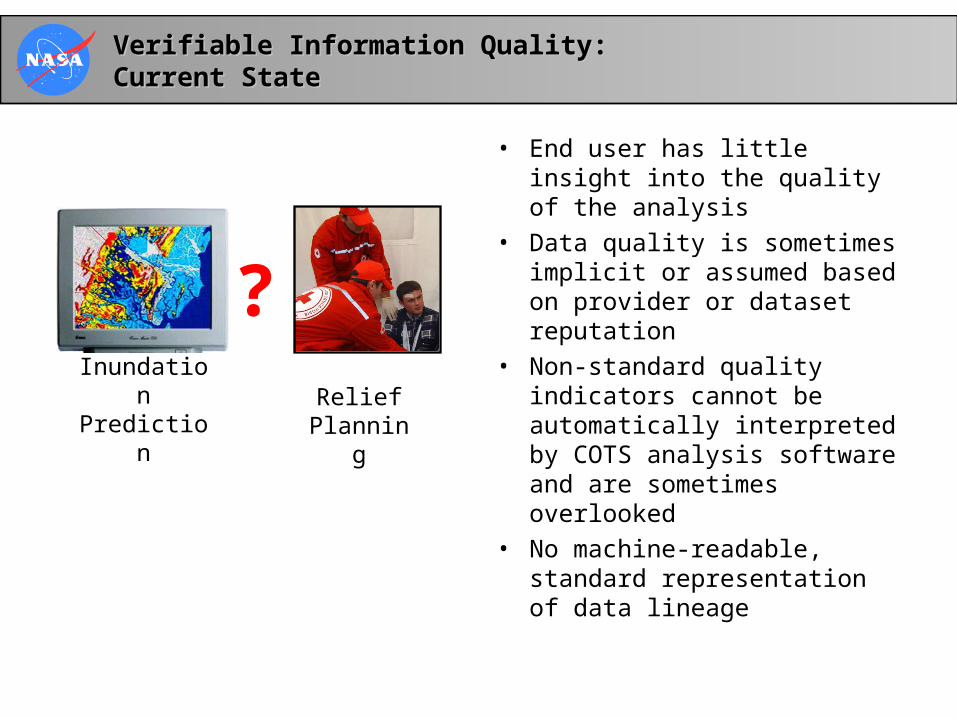
Verifiable Information Quality:Verifiable Information Quality:Current StateCurrent State
• End user has little insight into the quality of the analysis
• Data quality is sometimes implicit or assumed based on provider or dataset reputation
• Non-standard quality indicators cannot be automatically interpreted by COTS analysis software and are sometimes overlooked
• No machine-readable, standard representation of data lineage
?Inundation Prediction Relief
Planning

Verifiable Information Quality:Verifiable Information Quality:Future VisionFuture Vision
• Users can easily explore data pedigree determine its reliability
• Commercial tools understand data quality flags and automatically handle issues such as missing data
• Researcher and end user can quantify the quality of the inundation prediction and use the results appropriately
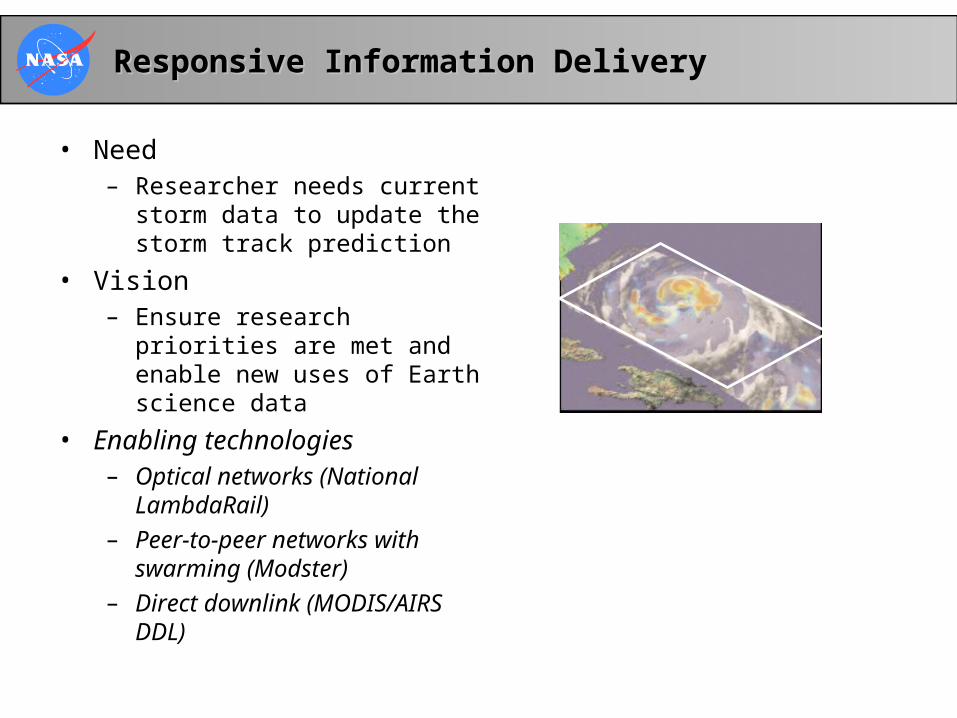
Responsive Information DeliveryResponsive Information Delivery
• Need– Researcher needs current storm
data to update the storm track prediction
• Vision– Ensure research priorities are
met and enable new uses of Earth science data
• Enabling technologies– Optical networks (National
LambdaRail)
– Peer-to-peer networks with swarming (Modster)
– Direct downlink (MODIS/AIRS DDL)
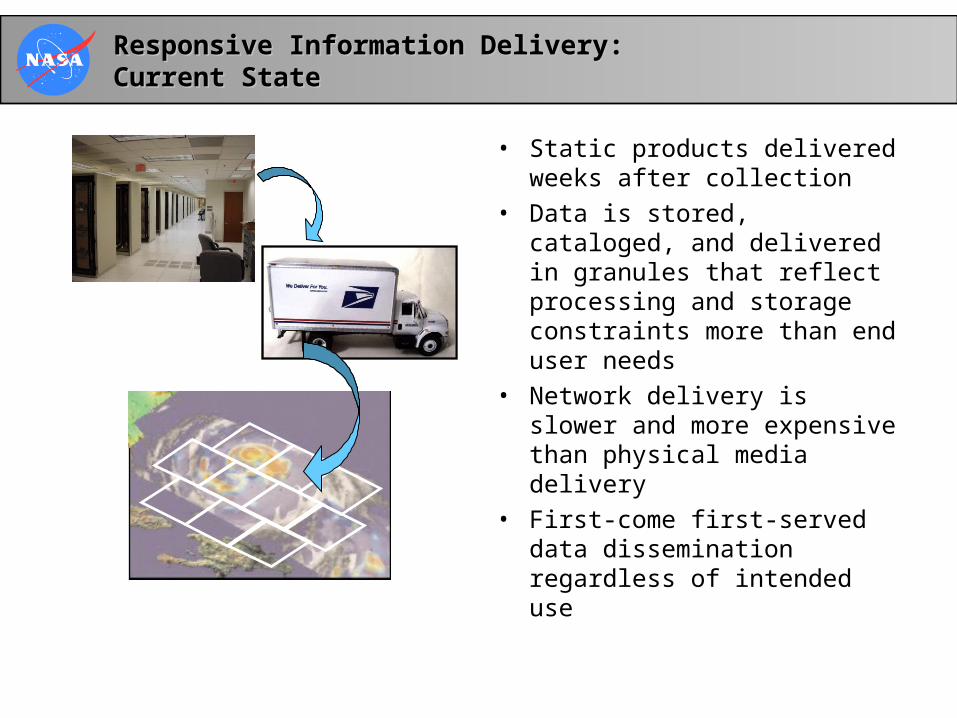
Responsive Information Delivery:Responsive Information Delivery:Current StateCurrent State
• Static products delivered weeks after collection
• Data is stored, cataloged, and delivered in granules that reflect processing and storage constraints more than end user needs
• Network delivery is slower and more expensive than physical media delivery
• First-come first-served data dissemination regardless of intended use
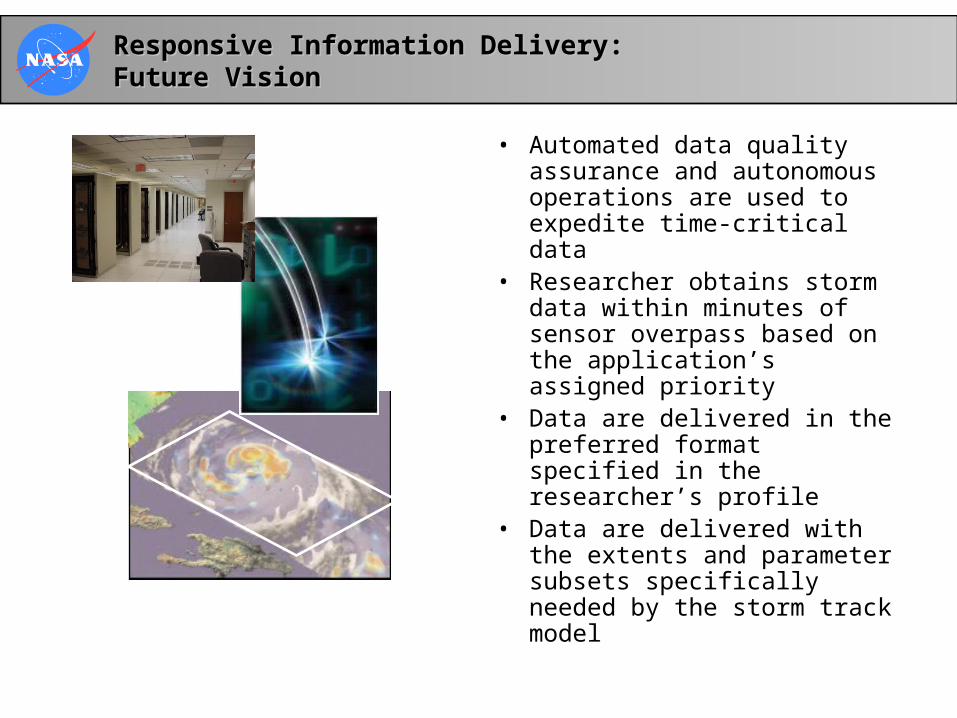
Responsive Information Delivery:Responsive Information Delivery:Future VisionFuture Vision
• Automated data quality assurance and autonomous operations are used to expedite time-critical data
• Researcher obtains storm data within minutes of sensor overpass based on the application’s assigned priority
• Data are delivered in the preferred format specified in the researcher’s profile
• Data are delivered with the extents and parameter subsets specifically needed by the storm track model
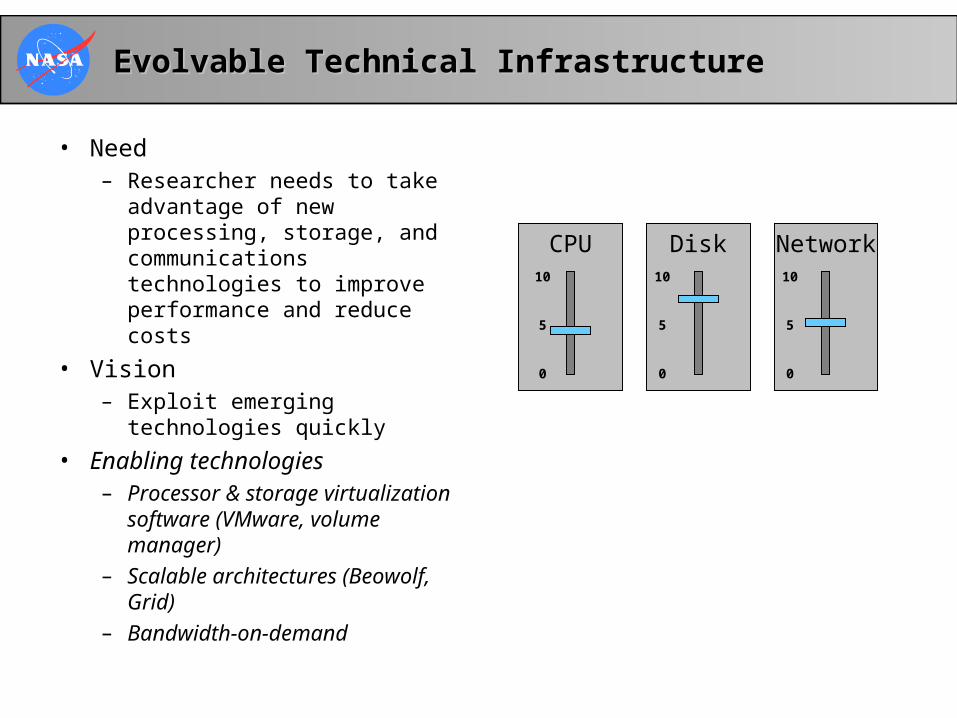
Evolvable Technical InfrastructureEvolvable Technical Infrastructure
• Need– Researcher needs to take
advantage of new processing, storage, and communications technologies to improve performance and reduce costs
• Vision– Exploit emerging technologies
quickly
• Enabling technologies– Processor & storage
virtualization software (VMware, volume manager)
– Scalable architectures (Beowolf, Grid)
– Bandwidth-on-demand
CPU Disk Network10
5
0
10
5
0
10
5
0
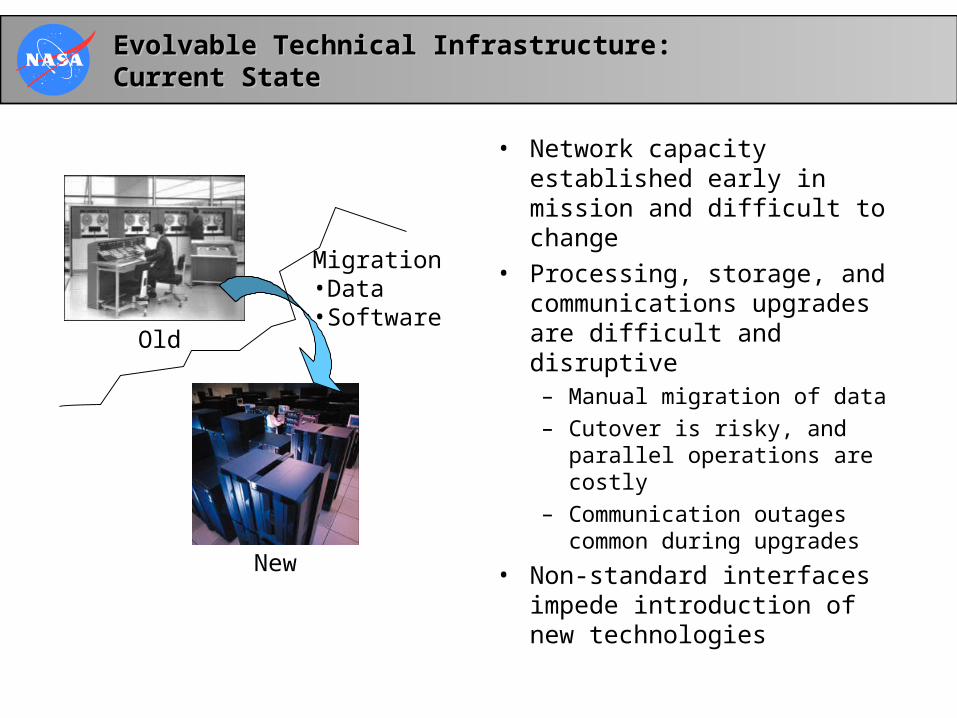
Evolvable Technical Infrastructure:Evolvable Technical Infrastructure:Current StateCurrent State
• Network capacity established early in mission and difficult to change
• Processing, storage, and communications upgrades are difficult and disruptive– Manual migration of data
– Cutover is risky, and parallel operations are costly
– Communication outages common during upgrades
• Non-standard interfaces impede introduction of new technologies
Old
New
Migration•Data•Software
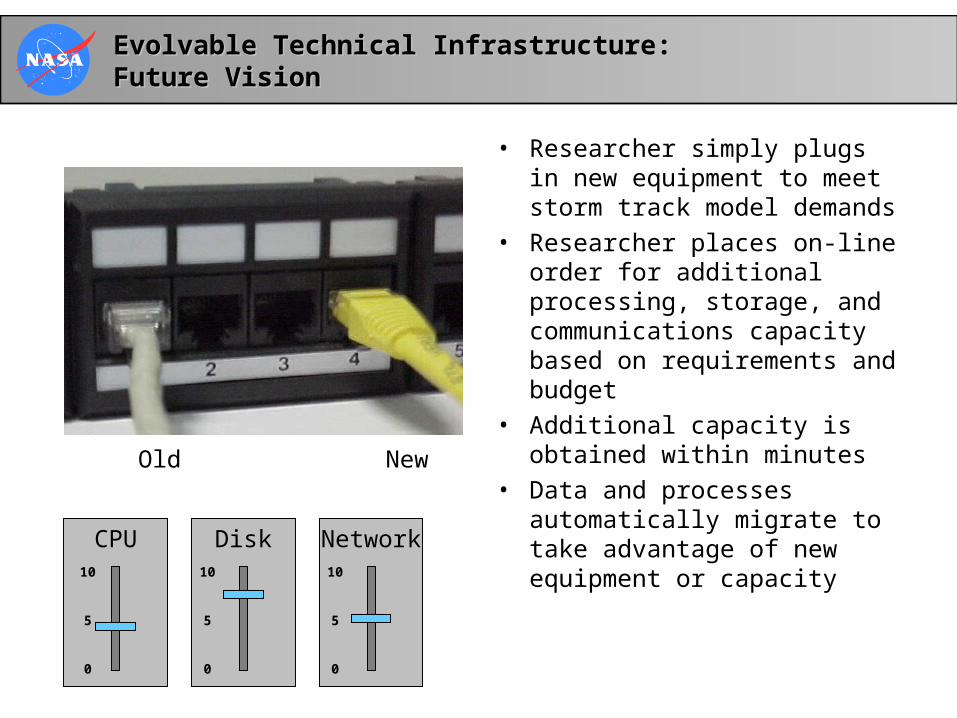
Evolvable Technical Infrastructure:Evolvable Technical Infrastructure:Future VisionFuture Vision
• Researcher simply plugs in new equipment to meet storm track model demands
• Researcher places on-line order for additional processing, storage, and communications capacity based on requirements and budget
• Additional capacity is obtained within minutes
• Data and processes automatically migrate to take advantage of new equipment or capacity
Old New
CPU Disk Network10
5
0
10
5
0
10
5
0
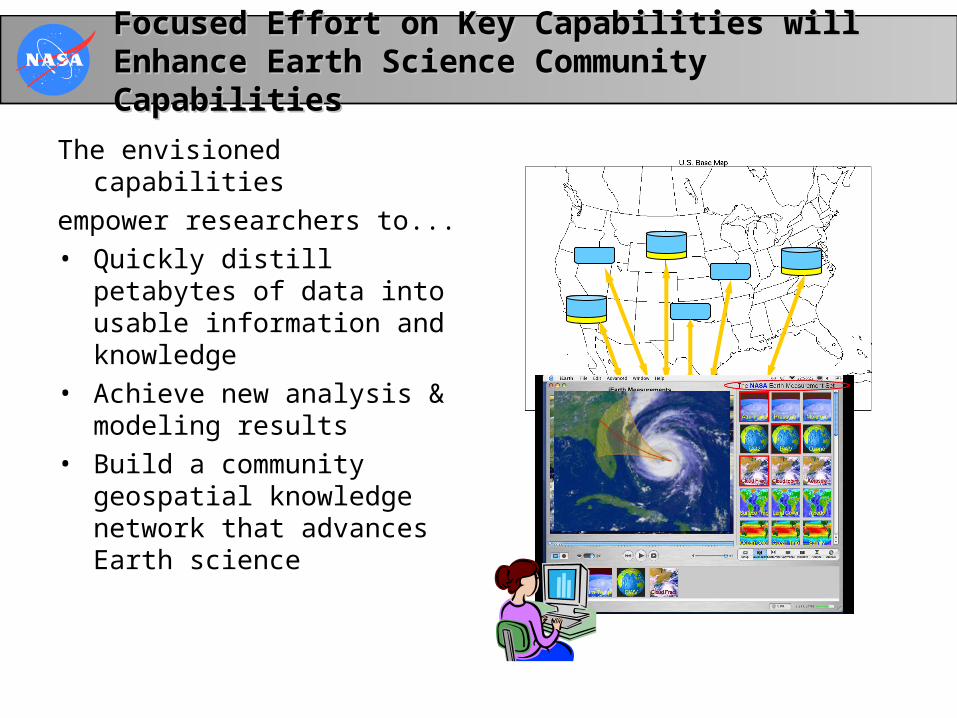
Focused Effort on Key Capabilities will Enhance Focused Effort on Key Capabilities will Enhance Earth Science Community CapabilitiesEarth Science Community Capabilities
The envisioned capabilities
empower researchers to...• Quickly distill petabytes of data
into usable information and knowledge
• Achieve new analysis & modeling results
• Build a community geospatial knowledge network that advances Earth science
Interactive Data Analysis
Interoperable Information
Services
Seamless Data Access
Assisted Data & Service Discovery
Assisted Knowledge
Building
Community Modeling
Frameworks
Responsive Information
Delivery
Verifiable Information
Quality
Evolvable Technical Infrastructure
Scalable Analysis Portals
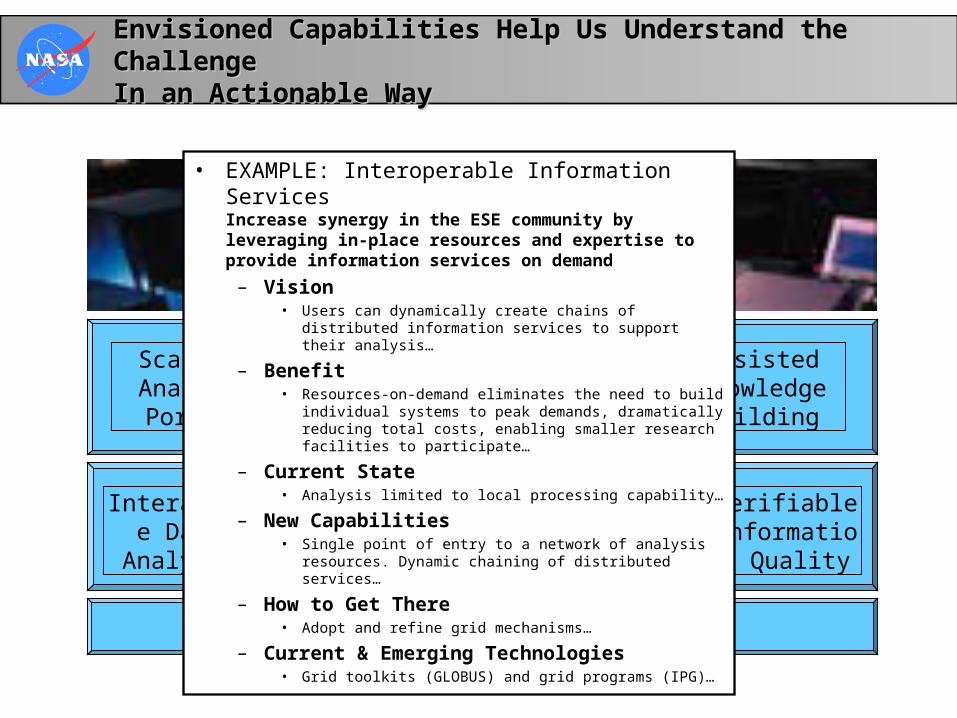
Envisioned Capabilities Help Us Understand the Challenge Envisioned Capabilities Help Us Understand the Challenge In an Actionable WayIn an Actionable Way
• EXAMPLE: Interoperable Information ServicesIncrease synergy in the ESE community by leveraging in-place resources and expertise to provide information services on demand
– Vision• Users can dynamically create chains of distributed
information services to support their analysis…
– Benefit• Resources-on-demand eliminates the need to build
individual systems to peak demands, dramatically reducing total costs, enabling smaller research facilities to participate…
– Current State• Analysis limited to local processing capability…
– New Capabilities• Single point of entry to a network of analysis resources.
Dynamic chaining of distributed services…
– How to Get There• Adopt and refine grid mechanisms…
– Current & Emerging Technologies• Grid toolkits (GLOBUS) and grid programs (IPG)…