Embed Size (px)
Citation preview

, {
NASA CONTRACTOR REPORT· 168428
NEW CONSIDERATIONS ON SCALE EXTRAPOLATION OF WING PRESSURE DISTRIBUTIONS AFf:=ECTED BY TRANSONIC . SHOCK-INDUCED SEPARATION
Mohammad M. S. Khan
Jones F. Cahill
Contract NAS2-10855 October 1984
Nl\SI\ National Aeronautics and· Space Adn'linistration
'0011111111111111111111111111111111111111111 '1 NF02367 \
NASA-CR-166426 19830023326
.... -
lrBR A.RV COpy AUG 1 ~ 1'18.'
LANGLEY RESEARC~ CirHER LIBRARY NASA. ~~.';P70N. VA.
https://ntrs.nasa.gov/search.jsp?R=19830023326 2018-05-20T16:24:47+00:00Z

NASA CONTRACTOR REPORT 166426
NEW CONSIDERATIONS ON SCALE EXTRAPOLATION OF WING PRESSURE DISTRIBUTIONS AFFECTED BY TRANSONIC SHOCK-INDUCED SEPARATION
Mohammad M. S. Khan
Jones F. Cahill
Lockheed-Georgia Co.
Contract NAS2-1085S
NI\S/\ NatIonal AeronautIcs and Space Administration
AMES RESEARCH CENTER Moffett Field, California 94035

r'j'
NASA CONTRACTOR REPORT 166426
NEW CONSIDERATIONS ON SCALE EXTRAPOLATION OF WING PRESSURE DISTRIBUTIONS AFFECTED BY TRANSONIC
SHOCK-INDUCED SEPARATIONS
Part I.
Part II.
ANALYTICAL CONSIDERATIONS OF SHOCK-BOUNDARY
LAYER CORRELATIONS - MOHAMMAD M. S. KHAN
REFINED EXTRAPOLATION OF WING LOAD DISTRI
BUTIONS WITH TRANSONIC SHOCK-INDUCED
SEPARATION - JONES F. CAHILL
PREPARED FOR:
NASA-AMES RESEARCH CENTER
BY THE LOCKHEED-GEORGIA COMPANY
PREFACE
NASA Contractor Report 3178 (published in 1979) presented a method for
predicting the effects of change in Reynolds number on wing pressure
distributions which are affected by transonic shock induced separations. That
prediction was made possible by the discovery that the variation of
trailing-edge pressure recovery with angle of attack and Mach number could be
collapsed into a Single curve through use of an empirically derived correlation
parameter.
The information presented in this report consists of the results of studies
identified as Tasks 2.1 and 2.2 of Contract NAS2-10855. These studies are concerned respectively with the derivation of an analytical parameter to replace
the empirical parameter of CR3178 t and with the refinement of the correlation
process by use of the analytical parameter and other considerations.
This report is also identified as Lockheed Report LG83ER005~.
1

,~'
2
PART I. ANALYTICAL CONSIDERATIONS OF
SHOCK BOUNDARY LAYER CORRELATIONS
Mohammad H. S. Khan
SUMMARY
Wing trailing-edge separations that occur at transonic speeds as a result
of shock-boundary layer interactions are known to pr.oduce large adverse effects
on aircraft aerodynamic characteristics. Large losses in lift and changes in
wing torsional loads have been shown to result from such separations. Infor
mation on this subject for aircraft design must rely on wind tunnel test
results. In currently existing wind tunnels, however, data can be obtained only
at Reynolds numbers an order of magnitude less than flight values.
A procedure for extrapolating low Reynolds number pressure distribution
data to flight conditions has been published in a previous NASA Contractor'
Report by Cahill and Connor. The correlation of trailing-edge separation data,
which is vi tal to that extrapolation procedure, was developed purely from an
empirical analysis of experimental data.
This report presents the results of a study that examines the basic fluid
dynamic principles underlying shock-boundary layer interactions and develops an
analytical parameter that should describe conditions leading to trailing-edge
separation. The essential features of the interaction region are defined by
using a triple-layer conceptualization of the controlling fluid dynamic
phenomena. By matching conditions at the boundaries of the three layers, a
parameter is derived that defines flow similarity in terms of susceptibility to
separation downstream of the shock. It is concluded that a successful cor
relation of the separation data should include this similiarity parameter and a
shape factor of the incoming boundary layer. Comparisons show a linear relationship between the similarity parameter developed here and the correlating
parameter that successfully collapsed data on the development of trailing-edge
separation in the previous work of Cahill and Connor.

T-B1/2 =
C
Cf
Cp
k
K =
L
M
P
Re
til u
u'T
x
y
"I
0
0+
€
Jl
P
'Tw
NOMENCLATURE
(P/Ps)~- A
y" -X/C empirical correlation parameter obtained by Cahill and Connor
Airfoll Chord
Wall friction coefficient
Pressure cQefficient
vonKarman constant
(Me2
- n ('Y+n € M 2
e
Similarity parameter
Reference length
Mach number
Pressure
Reynolds number
Velocity parallel to the wall
Friction velocity
Coordinate in streamwise direction
Coordinate normal to the wall
Ratio of specific heats of air
Boundary layer thickness
Wall layer thickness
Small perturbation parameter
Viscosity
Density
Shear stress at wall
3
4
Superscripts
* Dimensional quantities
Subscripts
o Quant~ties related to incoming profile
e Boundary layer edge quantities
·s Quantities at shock location
INTRODUCTION
The interaction of shock waves with boundary layers in transonic flows over
wings is known to produce significant effects on the aerodynamics of high-speed
aircraft. Local effects of the interaction include an increase in the
displacement and momentum thickness, and a decrease in skin friction for some
considerable distance, causing a possible separation of the boundary layer. Of
greater importance is the modification introduced by the interaction to the
boundary layer approaching the airfoil trailing edge that may change conditions
for separation at the trailing edge. In such cases, the shock-wave
boundary-layer interaction produces local as well as global effects represented
by a loss in lift, increase in drag, and other adverse effects of separated
flows, such as buffeting. Therefore. accurate prediction of shock boundary layer interaction and its effects on trailing-edge separation at flight
conditions are critical for improved aircraft design.
Since the flow structure in shock-induced separation at transonic speeds is
complex, the solution to the full Navier-Stokes equations must be considered for
accurate prediction. Significant progress has been achieved in the development
of methods for the direct numerical solution of the full Reynolds equation of
turbulent flows. Although these methods ho~d the promise of offering the most
complete and accurate solution for viscous flow, they have been limited in
practice because of their large computing requirements. Experimental data
obtained from wind tunnel testing are of great help to a designer in
establ1shing a criterion for shock-induced trailing-edge separation. However,
due to size limitations, much of the data are obtained at Reynolds numbers that
are lower than flight condition Reynolds numbers. An effort to extrapolate wind
tunnel data to flight conditions (Reynolds number and Mach number) has been

undertaken by Cahill and Conner (Ref. 1). Their correlation is based purely on
an empirical analysis of experimental data. An extrapolation derived from
consideration of fluid mechanics principles could be applied with much greater
confidence.
The purpose of the present study is to develop analytical parameters that
characterize the shock-wave boundary-layer interaction at transonic speeds. The
intent is to illuminate the Cahill-Connor correlation and/or point to a more
fundamental paramete~ for the interaction. Here we adopt an asymptotic analysis
of the governing equations under conditions of incipient separation. This is
because asymptotic solutions include the essential physics of the phenomenon of
interaction as was demonstrated by Melnik and Grossman (refs. 2, 3) and Adamson,
Liou, and Messiter (ref 4). In this report, we briefly describe the analyses
and findings of these authors and then relate the basic parameters derived to
those due to Cahill and Connor (ref. 1).
PROBLEM FORMULATION
Asymptotic Theory of Interaction
Several interrelated flow characteristics of the shock boundary-layer
interaction region are shown in Figure 1. The incoming turbulent boundary-layer
flow is slightly supersonic, except in a thin region near the wall where the
flow is subsonic. The shock wave weakens as it penetrates into the boundary
layer and terminates at the sonic line. Thus, the shock pressure-rise
attenuates in the subsonic region beneath the shock, resulting in a smooth
pressure distribution on the wall. It is clear that the pressure gradient
normal to the wall in the interaction region is not small; hence, the classical
boundary-layer formulation is inappropriate.
Melnik and Grossman (refs. 2, 3) considered a simplified model of a weak
normal shock wave interaction with a fully developed turbulent boundary layer
over a flat plate, as shown in Figure 2.
location is defined by
• • • • Re = U P L IIJ. e e e'
The Reynolds number at the shock
5

6
C P
SHOCK
EWPTIC LEAKAGE PRE-SHOCK I BENEATH SHOCK - COMPRESSION
I VIRTUAL SHOCK r--THICKNESS
, SURFACE PRESSURE DISTRIBUTION
FlOW UNSTEADY
INTERACTION COMPLEX
UPSTREAM INFLUENCE
SHOCK WEAKENS AS IT PEN ETRA TES VELOCITY PROFILE
NOTE: o P B. L. APPROX. I) * CONCEPT _ ft. 0 -INVAUD __ r INVAUD oy
Figure--l :----Ffow -StructUre-tn the Shock/Boundary-layer Interaction Region

.. . i
NORMAL SHOCK WAVE
* u • ...-____ ""t
* -po. 1-----;
M > 11-----'"1 • I' * 1------... •
,. * * * R.=P utiI' •• •
-1 e = 0 (In R.>
2 M -l t e-O; (M -l)/e .. CONSTANT. • •
Figure 2. Melnik-Grossman--Model of Weak Shock/BoundaryLayer Interaction
•• • where U e' P and Jl are the undisturbed free-stream values of velocity, e e_ density, and viscosity, and L 1s the distance from the plate leading edge to
the shock location. The wall shear stress and friction coefficient of the in
coming boundary layer are related by
A small parameter, defined by
€ = ( C f /2) 1/2 , o
(1)
7

is introduced, and we note'that
1. -1 € = 0 ( nHe) (2)
thus €-o as He-oo
* The friction velocity is also given by ·uT
= € U e. Let Me denote the un-
disturbed Mach number. The analysis of Melnik and Grossman is based on a formal
asymptotic expansion of the full Reynolds averaged Navier-Stokes equations in
the double - limi t M -1 and € -0 (which implies Re-oo) while X = (M 2 - 1) I € is e - e held fixed. The parameter X can be interpreted as a normalized shock strength
because (M 2 - 1) is the proportional to the shock strength and € characterizes e the "fullness" of the incoming velocity profile. The value of X controls the
relative rates at which the two basic parameters Me and € approach their respec
tive limits. If the fixed value assigned to X is 0(1), then this limit is
called "weak" shock limit.
Undisturbed Boundary Layer
Before considering the analysis in the interaction region, we review first
the basic features of the asymptotic solution of the undisturbed compressible
boundary layer over a flat plate in limit R---oo. The turbulent boundary layer
at high Reynolds number develops a two-layer structure, as illustrated in Figure
3. In the outer region there is a balance between turbulent stress and convec
tion of momentum. This region comprises most of the boundary layer, and the
velocity profile is well represented by the small defect form of the law of the
wake
U = 1 +E Uo (x,y/o)
where 0 is the boundary layer thickness and x' and yare cartesian axes, x is
parallel, and y is normal to the plate. (Lengths and velooities are made
* * dimensionless by using Land U , respectively). As a consequence of the e
8

U-e
.-/
J / O(
/-e)
7
INVISCID FLOW
VELOCITY DEFECT LAYER
MOMENTUM + PRESSURE + TURBULENT STRESS
WAll LAYER
VISCOUS STRESS + TURBULENT STRESS
-1 e = 0 (In RJ ' 6 = 0 ( e ) 6+= 0 [ e -1 EXP (- ~ ]
Figure 3. Schemati c of the Undisturbed Boundary Layer
9

balance between the turbulent stress term and the convective terms in the x-momentum equation, we obtain the estimate
0= o(E) (4 )
In the inner region, in a very thin layer near the wall, there is a balance
between turbulent and viscous stress while the convective terms are of smaller order of magnitude. , The velocity profile takes on a law-of-the-wall form
(5 )
where 0+ is the thickness of the wall layer, and it is related to 0 and Re by
(6)
In the overlap region, y 10 «1 «y 10+, the velocity profiles in the outer
and inner regions should match, and it follows from the matching that
and
-1 0= aCE) = a (lnRe)
r+ -1 -1 u = a [E exp (- E )]
(7)
(8)
Equation (8) shows that, for high Reynolds number flows (E-O) , the wall
layer is exponentially thin compared with the overall thickness of the boundary
layer. From the matching of the velocity profiles it is also established that
the profile has a logarithmic form in the overlap region,
U-1 + k-1E ln (y/o) + ••• , as (y/o)-o
and
+ , as (y/o )_00
10

with k = 0.41, the von Karman constant and c = 5.0. Therefore, the velocity
profile in the defect layer does not satisfy the no-slip condition on the r· surface.
----r .
Finally, we notice that the pressure gradient, dp/dx, does not affect the wall layer unless it is 0[€3 Exp (€-1 ).]. This follows from equating the order of
dp/dx to that of the viscous stress term in the x-momentum equation.
Interaction Region
Upstream of the interaction region, the boundary layer has a two-layer, law of the wake/law of the wall, form. Outside the boundary layer there is an
inviScid, irrotational flow that contains a weak normal shock wave. In the interaction region, sketched in Figure 4, the boundary layer develops a three-
layer structure. The extent of the interaction region in the streamwise direction is 0(€3/2), and it is the same for the three layers. The main deck
has a thickness O(€) and thus extends over most of the boundary layer. Because
the streamwise extent of the interaction is small in comparison with the
boundary-layer thickness, Reynolds stresses are assumed to be "frozen" at their
upstream undisturbed values. Thus, the disturbances in this layer are inviscid
in character, and to the lowest order the velocity disturbance is irrotational.
However, the total flow is rotational due to the vorticity in the defect layer.
Since the disturbance in this layer does not satisfy the no-slip condition at
the surface, an additional inner viscous layer is required. In the inner
region, which is a continuation of the upstream wall layer, the viscous and turbulent stresses are in equilibrium with the changing wall shear stress. The
+ thickness of this layer is 0(5). At the interface between the wall layer and
the main deck, where turbulent stress dominates viscous stress, there will be a
mismatch in the turbulent stress, because on the wall layer side, turbulent
stress is in equilibrium with a variable wall shear stress; on the main-deck
side, it is frozen at its upstream value. Hence, a third layer, intermediate
between the main deck and the wall layer, is required to resolve the mismatch in
turbulent stress. This layer is called the blending layer, and here inertia terms, pressure gradient, and turbulent stress terms are of the same order.
thickness of the blending layer is 0(€5/2).
The
11

-11.1 ...-Q
12
SHOCK WAVE
M>t
MAIN
ROTATIONAL INVISCID FROZEN
'\ I
./ ---- - -SO~Cln'olE
DECK
MEAN FLOW DISTURBANCE TURBULENT STRESS
M<t
--~~--------------------------------~
11.1 -Q
, ,
BLENDING lAYER
UNEARIZED BOUNDARY LAYER: I NERTlMf'RESSURE+ TURBU LENT STRESS
~ WALL lAYER ttl
(TURBULENT + VISCOUS) = SKIN FRICTION 0 ( e - • - Ie ) 7.7 I I I , I " , I " f' II ,
II--. __ -.:...0 e.;...-.3/1~_---f.1

Main deck - The solution in the main deck is represented by the expansion,
v = ('Y+ 1) 1/2 M E3/2 v(i,y) e
-where the stretched variables x and yare defined by
(9 )
(10 )
i = x/[ ('Y+ 1) 1 /2 Me EO] (11)
y = Y/O (12)
where x = 0 at the shock location in the absence of interaction, and 'Y is the
ratio of specific heats. In Eq. (9), (1 + E U 0) represents the incoming boundary
layer and E u is the perturbation produced by the shock. A disturbance velocity
potential; ~i is introduced, where
- aq, u =~ (13)
ai
- aif; v=- (14 )
ay
Substitution of the above expansions into the full Navier-Stokes equations
produces the following nonlinear partial differential equation for the dis-
turbance potential:
where
2 2 [K + u (y) + a~] aiP a~ = 0
o - ---
K =
ax ax-2 ay - 2
M 2 _ 1 e
(,,(+1 )EM 2 e
(15 )
(16 )
13

. ' 1"
~, ( ,
Boundary conditions for Eq. (15) are provided by matching to the solutions in the adjacent regions. For large y, the solution to Eq. (15) must approach
the discontinuous normal shock solution, hence
0 - > 0 y_OO
X
- - a~ u = = ( 17) ax -2K x > 0, y-OO
Far upstream and far downstream, the disturbance produced by the interaction must vanish, hence
fo
ii; aq, ax -2K
as X-OO, -all y
( 18) as x_oo, all y
The boundary condition as y-o (Le. on the surface) is provided by
matching with the solution in the blending ~ayer, details are given in (Ref~ 2),
and the result is
v -; aif) = 0 at Y = 0
ay ( 19)
That means that the solution in the blending layer does not affect the v-component to order E3/2. Equation (15) subject to boundary conditions (17),
(18), and (19) is to be solved numerically for a specified value of K and a
profile Uo (y), e.g. law of the wake/law of the wall,
{ ko-l
Uo = lny +~W(y)] o<y<l l<y
where ~and W (y) are Coles' wake parameter and wake function.
(20)
We notice that the solution in the main deck, when expressed in terms of x
and y, depends only on two parameters,lYof the velocity profile and a similarity
14

parameter K.
property,
In particular the pressure coefficient has the similarity
C P
where
* * * * p (x ,y) -p e
(1/2) p. U· 2 - e e
(i, y; K,1T) = 2 a~ ai
(21)
(22)
Thus, flows with the same values of the viscous transonic similarity para
meter, K, and Cole's wake parameter,1f, are similar.
Blending and wall layers - The flow in the blending layer is governed by
linearized boundary-layer equations. The upper-edge boundary conditions are
provided by matching with the solution in the main deck. It is established from
the matching that the flow in the blending layer is developing under the in
fluence of the pressure distribution given by Cp (i,o; K,~).
In the wall layer, the governing equations reflect the fact that the total
shear stress (viscous plus turbulent) is in equilibrium with the changing wall
shear stress. An expression for. the skin friction coefficient is obtained by
matching the solutions in the wall and blending layers. The details are given
by Melnik and Grossman (ref. 2), and the result is
2 Cflef = (2-R) [1+(A1 + A2 E .in E) E C + 0 (E )]
0 p
(23)
where -1 1 2 2
R = {1 + 2 E 'YM [E C + 0 (E )]} e p
A1 = 1/q
A2 = 3 [1 + (1 + m )q] /q2 e
15
-1/2-1[ q = m Sin 1 e
me = (1/2) ('Y - 1)
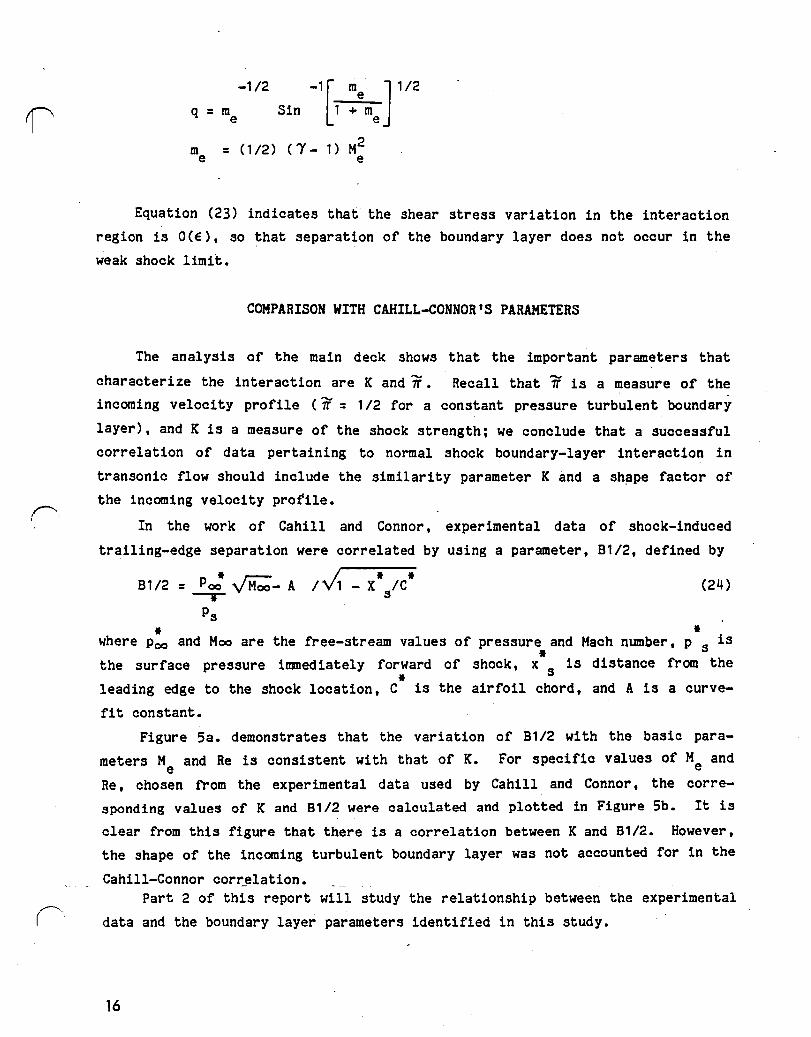
Equation (23) indicates that the shear stress variation in the interaction region is O(E), so that separation of the boundary layer does not occur in the
weak shock limit.
COMPARISON WITH CAHILL-CONNOR'S PARAMETERS
The analysis of the main deck shows that the important parameters that
characterize the interaction are K and 1f. Recall that 1f is a measure of the incoming velocity profile (1F = 112 for a constant pressure turbulent boundary
layer), and K is a measure of the shock strength; we conclude that a successful correlation of data pertaining to normal shock boundary-layer interaction in
transonic flow should include the similarity parameter K and a sh~pe factor of
the incoming velocity protile.
In the work of Cahill and Connor, experimental data of shock-induced
trailing-edge separation were correlated by using a parameter, B1/2, defined by
B1/2 = .!..i- v'Moo- A IV; - X* /c* (24)
* the free-stream values of pressure and Mach number, psis *
* where Poo and Moo are
the surface pressure iumediately forward of * leading edge to the shock location, C is the
fit constant.
shock, x s is distance from the
airfoil chord, and A is a curve-
Figure 5a. demonstrates that the variation of B1/2 with the basic para
meters Me and Re is consistent with that of K. For specific values of Me and
Re, chosen from the experimental data used by Cahill and Connor, the corre
sponding values of K and B1/2 were calculated and plotted in Figure Sb. It is
clear from this figure that there is a correlation between K and B1/2. However, the shape of the incoming turbulent boundary layer was not accounted for in the
Cahill-Connor cor~elation. Part 2 of this report will study the relationship between the experimental
data and the boundary layer parameters identified in this study.
16

K M2 - 1
= e
(1'+1) €M~
WHERE €= ~ C ) 1/2 fo ~ (L ~ Re)
(Poe IPs) ../Moe - A
B1/2 = ../1 (x/c) -
x B 1/2 t (1 - ~)
t c
.~ x s
LnRe • K •
1 + 1'-1 2 1'/ I' -1
t Poe
-/IAe 2 -- B 1/2·
P 1 + 1'-1 2
s -M 2
K •
Figure Sa. Comparison of Correlation Parameters
17

A A
-0.40
18
10.00
- K
2.00
-0.20 0.00
a RE= 3.43 E-+6
o RE= 10.41 E-+6
A RE= 90.00 E-+6
0.20 0 • .010 0.60
B 1/2 0.80
Figure 5b. Comparison of Correlation Parameters
1.00

REFERENCES
1 • Cahill, J. F.; and Connor, P. C.: Correlation of Data Related to Shock-Induced Trailing-Edge Separation and Extrapolation to Flight Reynolds Number. NASA CR-3178, Sept. 1979.
2. Melnik, R; E., and Grossman, B: Analysis of the Interaction of a Weak Normal Shock Wave with a Turbulent Boundary Layer. AIAA Fluid and Plasma Dynamics Conference, Paper No. 74-598, June 1974.
3. Melnik,' R. E.: Turbulent Interactions on Airfoils at Transonic Speeds-Recent Developments. AGARD-CP-291, Paper No. 10, Feb. 1981.
4. Adamson, T. C., Jr., Liou, M. S., and Messiter, A. F.: Interaction Between a Normal Shock Wave and a Turbulent Boundary Layer at High Transonic Speeds. NASA CR-3194, 1980. .
19

20

PART II. REFINED EXTRAPOLATION OF WING LOAD
DISTRIBUTIONS WITH TRANSONIC SHOCI
INDUCED TRAILING-EDGE SEPARATION
Jones F. Cahill
SUMMARY
An investigation has been conducted to seek improvements in a quantitative
prediction of full scale transonic wing shock-induced separation data from
wind tunnel test results. Previous studies had shown that such predictions
can be made through use of an empirical correlation which collapses the
variation of trailing-edge pressure recovery against Mach number and angle of
attack into a single curve. More recently, a purely analytical correlation
rr" parameter was recommended by Mohammad Khan, based on analyses by Melnik and
Grossman. In this study, ,that analytical correlation parameter has been used
to improve the previous correlation and extrapolation process.
As a result of using the analytical parameter it was demonstrated that
data influenced by local bubble separations at the shock could be isolated
from those controlled by trailing-edge separations. Collapsing of the
trailing-edge separation data was then shown to be much improved over previous
empirical correlations. Very good correlation was shown for a series of, wings
varying from pre-supercritical transport aircraft types to those incorporating
a full utilization of supercritical concepts.
For those cases where data are available over a wide range of Reynolds
number (two "conventional" transport wings and one "moderately supercritical"
wing), the scale effect on the correlated data follows a single curve. By
using this newly developed information, the extrapolat10n of w1ng load data to
flight Reynolds number can be accomplished with a high degree of confidence
for cases which extend well into separated flow conditions.
21 .

/"\ ,
A
B 1/2
Cf
CPFOOT
CPTE
CPTEO
6CPTEO
H
K
KO
6KO
M
Re
XCSH
€
22
NOMENCLATURE
Arbitrary constant
Empirical correlating parameter
Local skin friction coefficient just forward of shock
Pressure coefficient at foot of shock
Pressure coefficient at trailing edge
Reference value of trailing-edge pressure coeefficient
Increment of trgiling-edge pressure coefficient from its value at Rc = 10 x 10 •
Boundary layer shape factor
Analytical correlating parameter
Reference value of analytical correlating parameter
Increment of a~lytical correlating parameter from its value at R = 10 x 10 c
Freestream Mach number
Local Mach number at edge of boundary layer
Local static pressure immediately forward of shock
Freestream static pressure
Reynolds number based on local wing chord
Reynolds number based on boundary layer momentum thickness
Shock location, fraction of wing chord
Ratio of specific heats of air
Small perturbation parameter
\ 1

INTRODUCTION
The question of scale effects on shock-induced trailing-edge separations
has been a serious concern since the 1960 's when comparisons between wind
tunnel and, flight test data first indicated serious discrepancies. In 1968,
Pearcey, Haines, and Osborne published Reference 1, in which the distinction
was made between modern (at that time) heavily loaded wings that experienced
those discrepancies resulting from separations originating at the trailing
edge, as opposed to earlier, more conservatively designed wings, that
separated only as a result of the expansion of bubble separations originating
at the shock. Those earlier wing types had previously been shown to be free of
scale effects if wind tunnel tests were made at Reynolds numbers of at least
".5 million and if turbulent boundary. layers at the shock were assured. With
separations' origil'l:ating at the trailing edge, shock location differences of
20S chord or more have been observed between wind tunnel and flight
conditions. ,The resulting changes in lift and pitching moment cause large
changes in airloads on the wing structure, and large changes in tail load
required for trim.
A considerable effort has been devoted to this subject since that time.
In 1971, an AGARD conference (Reference 2) was devoted to test facilities and
techniques for high Reynolds number investigations at transonic speeds in
recognition of this and other transonic scaling problems. High Reynolds
number wind tunnels are now being constructed both in this country and in
Europe.
In spite of the forthcoming availability of wind tunnel facilities for
investigations of this subject, there is still a need for analytical and
empirical methods to evaluate scale effects on these aerodynamic phenomena.
Much testing will continue to be accomplished in low Reynolds number
facilities and it must be possible to predict aerodynamic data for flight
condi tions from results of those tests even if later tests will be performed
in the newer facilities. Furthermore, some of the new facilities will not
match flight Reynolds numbers for large aircraft and extrapolation will still
be required.

I'
A method for prediction of the scale effects in this area waa evolved at
Lockheed, and in 1979, Reference 3 was published with an extended version of
that method. This prediction was based on an empirically derived correlation
of the development of trailing~edge separation which for each spanwise station
on a wing, collapses the variation of trailing-edge pressure recovery with
Mach number and angle of attack into a single curve. The variation with
Reynolds number of' this curve has been found to be rather straight-forward and
to be identical for a wide variety of wing designs.
More recent effort on this subject has resulted in a recommendation by
Mohammad Khan (Reference 4) that the similarity parameter K, which had·
previously been discussed by Melnik and Grossman, should be an appropriate
correlation parameter for this phenomenon. It is the purpose of this report
to discuss evaluations of that correlation parameter against a large bank of
previously available experimental data, and to provide further refinements of
the entire correlation and extrapolation method.
24

REVIEW OF PRIOR CORRELATION CONCEPT
The scale_effect extrapolation method presented in Reference 3 depended on
several empirical correlations and generalizations which were sufficienty
convincing that the extrapolation process could be approached with confidence.
Current effort on this subject is intended to increase that confidence by
attempting to put the correlation on a firmer scientific foundation (see
Reference 4), and to refine and expand the technique. Since the basic extra
polation concept is not changed in this process, the following paragraphs will
review those correlations and generalizations.
The outstanding discrepancies observed between wind tunnel and flight data
in this area have been large increases in local lift and pitching moment on
the wing for conditions which -experience separations in the wind tunnel but
are unseparated at flight Reynolds numbers. By observing pressure distribu
tion measurements, it quickly became apparent that when the wing trailing edge
separated, the shock moved forward. Local separations at the _shock might be
followed by reattachment, but no perturbation of shock location was noted
unless the trailing edge separated. Trailing-edge pressure coefficient has
therefore been used throughout as an indicator of significant separations.
Variation of Shock Location with Trailing-Edge Pressure Coefficient
The relationship between trailing-edge pressure coefficient and shock
location has been found to be adequately defined by a single curve for a given
Mach number at a given location on a particular wing. Figure 1 shows such
curves defined for a single case at two different Mach numbers. In each case,
data from a bare wind tunnel model, from that model with vortex generators on
the wing upper surface at 551 chord, and from flight tests are shown. Within
an acceptable scatter, these data form a single curve for each Mach number,
establishing a unique relationship so that when trailing-edge pressure is
known, shock location can be estimated to a reasonable accuracy. In this
case, changes in angle of attack did not result in significant deviation from
the single curve. In the data examined to date in fact, no case has shown
r-" significant deviations. Intuitively, it would seem that cases might exist for
25

.1
.2
.3L-____ -L ____ ~~ ____ ~
.S .6 .7 .8 .4 XCSH
Figure 1. Variation of Shock Location with Trailing Edge Pressure Recovery
26
which angle of attack might need to be accounted for as an additional vari
able. Such variations could be accommodated in application of this method
with only a slight increase in effort.
EMPIRICAL CORRELATION
As stated previously, the correlations of shock-induced separation data
described in Reference 3 were purely empirical, they were evolved simply from
a recognition that the pressure rise through the shock and through the
subsequent subsonic pressure recovery must be- the outstanding factors in
determining the occurrence and severity of any resulting separation. Addi
tional terms were added to the correlation parameter and the form of the
parameter presented in Reference 3 was the result of several iterations. It
~as successful in collapsing (to a convincing degree), data from C-141 and C-5
wind tunnel and flight data, wind tunnel data on a "moderately supercritical"
wing developed by the RAE in the United Kingdom, and flight data on the F-8
airplane which had been modified by NASA to explore the characteristics of
supercritical wings. That correlation parameter,
B1/2 = PolP 1M -A
J1-XCSH
contained the arbitrary constant A which was used to accomplish the final
tailoring of the correlations. A value of A· was selected to minimize the
scatter in the data being correlated. All of the available data were included . in the correlations, and although it was known that those data included cases
involving a variety of modes of separation, no attempt was made to discrimi
nate among those modes. While it was apparent from the density of points
clustered around the correlation curves that the separation development was
being collapsed into a single curve which could then be further utilized to
account for scale effects, the number of test points which eluded collapSing
was disappointing. Furthermore, in some cases (see Figures 20 and 23 in
Reference 3 for the RAE wing model at Wing Station 17 = 0.793), the departure
from the correlation curve was obviously a systematic effect influencing only
27

a specific group of test conditions. These partial failures of the empirical
correlation parameter, coupled with the fact that an analytically supported
correlation would be perceived as more rigorous and therefore more universally
applicable, provided a major incentive for this, and the associated study
reported in Reference 4.
Scale'Effect on the Correlated Separation Development
The real key to successful extrapolation of the wind tunnel data to flight
conditions is the fact that the shape of the curve describing the development
of trailing-edge separation is independent of Reynolds number. This fact is
illustrated in Figure 2 where data for one station of the C-141 wing are shown
for a number of Reynolds numbers from both wind tunnel and f~ight tests. As
tpe Reynolds number is increased, the curve moves bodily to more posi ti ve
values of CPTE and P. In this subsection P refers simply to a given
correlating parameter, PO to a reference value of that parameter, and A PO to
the vari~tion of PO from its value at a Reynolds number of -'10 x 106• The
l' comments herein apply equally to the empirical parameter B 1/2 and the new
analytical parameter K. Figure 3 (top left) shows this shift by superimposing
the curves into a single plot.
The 'scale effect can now be fully described by plotting values of CPTEO
and PO, at the break in the separation development curve, against Reynolds
number. As shown in Reference 3, these variations were sufficiently similar
for a wide variety of wings that a single curve could be used for all of the
data available. These scale effect plots are reproduced at the bottom of
Figure 3 as increments of CPTEO or PO from their values at Rc = 10 x 106•
A graphic demonstration of the validity of these concepts can be obtained
by subtracting the appropriate values of CPTEO and PO from all of the data for
each Reynolds number. By this means, the data are all collapsed into a single
curve which provides a SUbstantial validation of the curve shape and its
independence of Reynolds number. A sample of such plots is shown at the top
right of Figure 3. The analysis presented in Reference 3, therefore, demonstrated the feasi
biU ty of collapSing the variation of trailing edge pressure recovery with
angle of attack and Mach number into a single curve. It was shown further
28
II
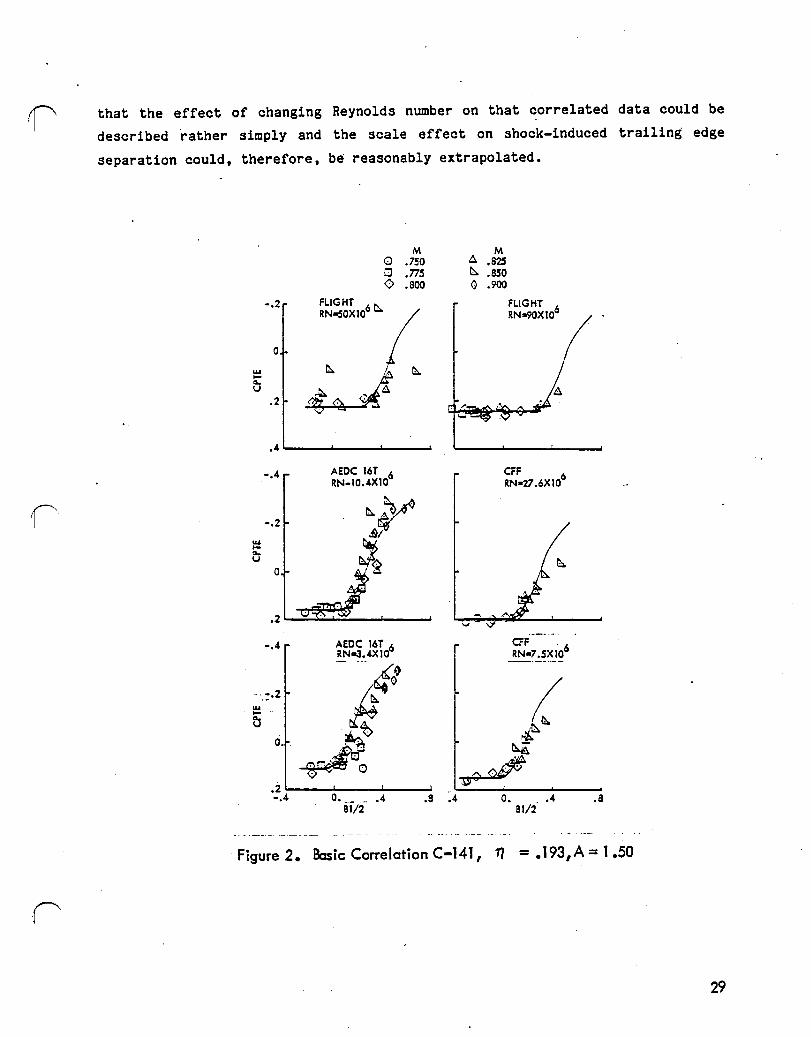
that the effect of changing Reynolds number on that correlated data could be
described 'rather simply and the scale effect on shock-induced trailing edge
separation could, therefore, be reasonably extrapolated.
M M 0 .750 A .825 a .775 t::.. .850 0 .800 0 .900
-.2 FLIGHT FLIGHT 6 'NoSOX10' .. ( RN~Xl0
0
w t::.. " .. ~ ~ u ~
.2 ~~
.4
-.4 AEDC 16T RN_l0.4Xl0
6 CFF RN-27.6Xl0
6
-.2 t::..~ JJI
w
~ ~
b 0
.2 ....
-.4 AEDC 16T 6 CFF . 6 RN-J.4Xl0 RN .. 7.5Xl0 ----- .. --It 0
t -·.:.2 ~ w ~ ~ u
~+.; r:i.~ O.
~~ ~ m o (.)# .... 0
.2 ~
-.4 0. __ .4 .8 .4 O. _ .4 .8 61/2 61/2
Figure 2. Basic Correlation C-141, 1'1 = .193,A = 1.50
29

'1' R - 106 c
,.. 3." -.3
, / , 10.4
I -0.50 _ 106 I SOURCE R SVM
I ,,27 .6 c: ~ , I / CFF 27.6 .CJ
-.2 I / 50.2 CFF 19.0 C)
I ,90 Ci'F 10.2 ~ I , ,
-0.40 CFF 7.5 + / , I CFF 3.4 X-,
I 16T 6.0 ~ I ¢
16T 10." ... -.1 16T 3.4 -;f
0-0·30 FLT 50.2 Z ~ w FLT 70." Y ... FLT 90.0 ):( ... U
I W ...
~O ... U
l.l -0.20
.1 -0.10
A· .. • <>' • ItOI
.2 • ¢" ---- ----<>--<>~ ,
<> <> ' . ~, o • 0'" c..' - - 00_ ;-:<:a- -0-1:>-~' I - CPTEO
o '2P~ PO
0.00
.3~--------~---------~---------~---------~-------0.lg+----------~---------~---------r----------r-------~ -.8 a .8 -.8 -.4 a .4 .8
~PO
30
.4
-.4
P .. P-PO
o
<>
o C-141 o <>
<><> 0 o l:l0 0
~
1'/
.193
.389
.637
~ C-S .450
'i1 .700 o RAE864 .793
Q .595 o .434
.1~ __________ ~ _________ ~~ ________ L-___________ -J ________ ~
2 5 100 10
R _106 c
20 so
Fig~re-'3~--ReynoTdS-Num.lJer-Variation·-0f Correlafec(Data

EVALUATIOI OF ANALYTICAL CORRELATIOI PARAMETER
The correlation parameter derived in Reference 4 is defined as:
Where: € = JCr'2
. K =
and Me and Cf are, respectively, the boundary layer edge Mach number and skin
friction. coefficient immediately ahead of the shock. The Mach number, M , is e
defined for the flow direction normal to the local element (constant percent
chord) line of the wing as an approximation to the flow direction normal to
the shock. Since this parameter provides some accounting for the condition of
the boundary layer through the inclusion of the term Cf
, the possibility
exists that it could produce significantly improved correlations. Skin
friction coefficients for the correlation parameter were calculated using the
method presented in Reference 5.
Initial attempts to assess the correlation of separation development using
the parameter, K, met with mixed results. Data for Station 11 = 0.193 of the
C-141 wing, which are shown in Figure 4, indicate an excellent collapsing of
data in the case of both the empirical parameter B1/2 and the analytical
parameter K. Data in Figure 5 for Station 11 = 0.434 of the RAE 864 wing,. on
the other hand, had produced rather a poor correlation with the empirical
parameter, and the analytical parameter now groups the data into two distinct
and rather well defined variations. Data are shown in Figure 4 for only a
single Reynolds number. Similar comparisons made at other Reynolds numbers
produce the same conclusion. Figure 5 contains data from all of the Reynolds
numbers for which these tests had been conducted. Data in the abrupt decrease
in pressure recovery for values of K near 4.5 are all from tests at a local
chord Reynolds number of 5.5 x 10⁶• All of the remaining data collapse into a
reasonably tight band showing the deterioration in pressure recovery at
significantly higher values of K. The reasons for this different behavior
were. sought in a detailed examination of the basic data from which these
0· correlations had been developed.
31

-.3 -.3 0
0
-.2 -.2
CPTE
B l/2 K
Figure 4. Comparison of Correlations. C-141 Wing, 11 = .193, R = 10.4 X 10⁶
c -.6
-.5
-.4
0-.3 w ... a.. y w ... a.. u_.2
-.1
o
x
o~
~ o
o
o
x ~
+
~ 0
+ +
o
o
o
o
-.S
-."
o -.3
-.2
CPTE
-.1
o
.1
o + .1~-------7----------~----~7-------~----~ -.8 -.4 0 ... .8 1.2 .2.. 6
o o
+ {) +
+ ~
~~
<>
o +
8
___ ~_y2-B Y.3-_____ ________ _ ___ _ ____ ______ K
Canp~son of Correlations .. RAE 864 Wing 11 = .434, -R ~-5:-5- 10-12 X 10.6 __ --__ c Figure 5.
32

Local Separation at the Shock
The progression of' separation development with variations in angle of
attack is shown for several Mach numbers in Figure 6 using data for a single
Reynolds number from Figure 5. As the angle of attack is increased, the
trailing-edge recovery deteriorates along a curve very much like the usual
correlations illustrated by Figure 4. At an angle of attack near 40, the
curve is suddenly displaced to a significantly higher value of K at the same,
or a somewhat improved pressure recovery. Further increase in angle of attack
shows the pressure recovery deteriorating further along a new curve.
Figure 7 shows plots of the chordwise pressure distribution for the Mach
number 0.85 points of Figure 6. The displacement to the higher .values of K
between angles of attack of 30 and 40 is obviously associated with the
appearance of a separation bubble at the shock which is indicated by the local
supersonic Mach number at the shock foot and the concave shape of the pressure
distribution downstream of the foot. In this instance, the separaton bubble
appears very suddenly as a result of the downstream sweeping of a root shock
on this wing. The merging of the root shock with the shock terminating the
local supercritical region of the upper surface flow causes an abrupt increase
in the pressure rise through the terminal shock and' therefore produces the
local separation. Similar pressure distribution data for a Mach number of
0.875 are shown in Figure 8. The fact that the departure from the normal
correlation is a result of the presence of the separation bubble rather than
the simple merging of shocks as illustrated in Figure 9 where data are
presented for Station'~ = 0.45 of the C-5 wing showing a more gradual bubble
development in the absence of a root shock. Presence of the separation bubble
causes a deviation from the basic correlation curve in this case just as it
does in the other cases presented previously.
Figure 10 shows pressure distribution plots illustrating the character of
the separation development on the C-141 wing at Station ~ = 0.193. In this
case, the trailing-edge separation (indicated by a deterioration in pressure
recovery) is obviously the dominant separation mode. A separation bubble is
apparent at the foot of the shock, if at all, only after the trailing-edge
separation has become quite pronounced. A close examination of all the data
(\ available for this case ( ~ = 0.193), in fact, shows that separation bubbles
33

r
-.5
-.4 M
O.BS 0.815
-.3 CJ .90
-.2
CPTE
-.1
0
• 1 ... ....
---,..,.""
.2 0 2 4 6 B
K
Figure 6. Details of Separation Development. RAE 864 Wing, 11 = .434, R = 5.5 X 10⁶
c
34

o~--------------------~~
Figure 7. Illustration of Separation Bubble Developg'ent. RAE Wi ng 864, "1 = .434, R = 5.5 X 1 0 , M = 0.85
c
35

o~----------__________ ~~
Figure 8. Illustration of Separation Bubble Development.
RAE Wing 864, 11 = 434, R= 5.5 X 10⁶-;-M = .875
c
36

o~--------------------~_
Figure 9. Separation Bubble Development in Absence of Root Shock. C-S Wing, Tl= .45, R =6.6 X 10⁶, M = .80 .
c
37

38
-1.0
O*-------------------~~~
Figure 10. Trailing Edge Separation Development. C-141 Wing, 1'/ = .193, R = 10.4 X 10 , M = .825
c

rr··
at the foot of the shock occur very rarely and the correlations shown in
Figure 4 are typical of those observed for that wing station in all of the
various pressure tests made on the C-141 wing.
The pressure distributions for all of the data available for analysis in
this study have been reviewed to determine those cases affected by the pre-
sence of separation bubbles at the shock foot. During this review, the
connection· between. bubble separations, as indicated by the shape of pressure
distributions, and deviation from the basic correlation plots was strongly
reinforced. Another fact also became obvious however. As angle of attack or
Mach number are increased beyond the initial separation, the eventual si tua
tion is a separation of the entire flow from the shock to the trailing-edge.
At that point, the bubble separation conditions should return to agreement
with the basic correlation curve which is related to cases where separations
ini tiate at the trailing-edge. This is in fact the case as indicated by the
data. A Simple criterion was evolved to define those points to be retained as
a result of observing a large number of these data pOints. This criterion is
illustrated "by the plot shown in Figure 11 where the slope
CPFOOT - CPTE
1-XCSH
is plotted against the value of the correlation parameter K for a nt.mber of
test conditions. Above the upper curve, nearly all points deviate from the
basic correlation curve. Below the lower curve, nearly all points agree. In
the intermediate range between the two lines, it is impossible to di scrim i
nate. This criterion was used to determine whether to retain each of the data
points for which the pressure distribution shape indicated the pres.ence of a
separation bubble. Those points falling between the two lines on Figure 11
were retained if they were in reasonable agreement with the correlation curve.
It should be emphasized that this criterion is not an aerodynamic assessment
of which points should be inclUded with the bubble separation cases. It
simply uses a low value of the slope of the pressure distribution downstream
of the shock as an indicator of complete separation.
Exercising the obvious conclusion from the foregoing discussion, only
j~ those data pOints in Figure 5 which show an abrupt deterioration in pressure
39

SLOPE
40
2.5
2.0
1.5
1.0
.5
o FITS CORRELATION
• NO FIT
-RETAIN
•
SIGNIFICANT SEPARATION BUBBLE -0 ElETE
o -----..---..~---..----~----~----~~----~----~---2
K
Figure 11. Criterion for Retention of Bubble Separation Cases

recovery at values of the correlation parameter K near 11 to 11.5 should be
retained in this study. The remaining points are dominated by the separation
at the foot of the shock and are not solely dependent on trailing-edge separa
tions. Figure 12 shows data from several other cases. For each case shown,
the plot on the left contains all measured test points, the plot on the right
contains the test points remaining after deletion of those points experiencing
bubble separations at the shock foot. This sampling of available data showing
only those points dominated by trailing-edge separation provides a strong sub
stantiation of validity of the analytical correlation parameter K suggested by
Khan in Reference 11.
The distinctions just discussed between shock-induced separation develop
ments which are dominated on one hand by trailing-edge separation and on the
other hand by local separation bubbles near the shock should not be surprising
in view of the differences pointed out by Pearcey, Haines, and Osborne in
Reference 1. In that reference, the very substantial differences in behavior
between Hodel A flows where separations initiate at the foot of the shock, and
Hodel B flows where separations initiate at the trailing-edge are clearly
displayed. The ambiguity inherent in the presence of the arbitrary constant A
in the empirical parameter of Reference 3 allowed data to be artificially
compressed in a number of cases so ,that a conclusion of complete generality
seemed warranted by the reasonably tight collapsing of points displayed by the
preponderance of data considered. The uniqueness of the analytical parameter
K precludes this artificial compressing and leaves the unquestionable indica
tion of two distinctly different phenomena which is provided by Figure 5.
The conclusion reached in Reference 1 was that' significant scale effects
should be anticipated for Hodel B flows, but that in the case of Model A
flows, wind tunnel data obtained with turbulent boundary layers should pro
perly represent the flight condition in spite of large differences in Reynolds
number. The data points showing the deterioration of pressure recovery at
high values of K in Figure 5 would tend to support that conclusion. Data
measured over a range of Reynolds numbers from 5.5 x 10⁶ to 12 x 106 fall
within a rather narrow band.
In handling wind tunnel data during evaluation of a new configuration, those
{'\ data points suffering significant separations at the shock are re~dily
41

CPTE
42
-0.40
1/ -0.40
-0.30 -0.30 ++ /+
-0.20 +. , -0.20 +.
+.
-0.10 -0.10 +.
CPTE
0.00 +. 0.00 +.
0.10 +. +. +. 0.10 +. +.
* +. +. * +. +. +.
WITH BUBBLE SEPARATION POINTS +.
WITHOUT +. 0.2O+-------~----~------_r----__, 0.2O+-------~------r_----~------~
0.00 2.00 •. 00 6.00 8.00 0.00 2.00 •• 00 6.00
K 6
a C-5 Wing, ETA = .45, R = 6.6 X 10 c
k
Figure 12., Comparison of Correl~tions .with and without Bubble Separation Points
-0.40
-0.30
-0.10
em
0.00
0.10
WITH BUBBLE SEPAP.ATION POINTS
..
-0.40
-0.30
-0.10
CPTE
0.00
0.10
• -. ... .
0.2O+-------~------r_---~r___----__, 0.20 iii 0.00 2.00 4.00 6.00 8.00 0.00 2.00 4.00 6.00
K __________ ~ _______ ~. __ . ________________________ K - -- - 6 Figure 12.b C-5 Wing, ETA = .70, Rc = 5.3 X 10
8.00
i 8.00

recognized by the fact that measured pressures near the foot of the shock
indicate supersonic velocities. As a result of the flow around the bubble,
the shape of the pressure distribution in this region tends to become convex.
Figures 7, 8 and 9 are good guides to the pressure distribution changes which
accompany separation bubble appearance. The pressure distribution points
experiencing separation bubbles are simply set aside during the Reynolds
number extrapolation process and then re-integrated with the extrapolated data.
Exceptional Pressure Recovery
In a m.mber of instances, the separation bubble at the foot of the shock
occurs prior to any trailing-edge separation. In many of these instances, the
trailing-edge pressure recovery improves by a noticeable increment. Such
cases are illustrated In Figure 5, where the highest nomal recovery, at low
values of K or B1/2, is 0.1 to 0.12. Following the onset of the bubble
separation, the trailing-edge recovery increases to 0.175 or 0.185. No
measurements are available to demonstrate the mechanism by which this improve
ment is developed. It is possible that turbulence induced by the separation
and reattachment results in an entrainment by the boundary layer of higher
energy flow and, therefore, in an effect comparable to that produced by vortex
generators. Reference 6 discusses several mechanisms by which boundary layer
turbulence is amplified in passing through a shock wave.
Low-Speed Stall
Data presented in Figure 23 of Reference 3 for wing station 11 = 0.793 of
the RAE Model 864 wing showed an outstanding example of data points in a
narrow range of test conditions for which the empirical correlation failed
completely. The majority of test points for this station collapsed rather
nicely in tems of the empirical parameter B1/2, but high angle of attack data
for the lowest Mach number tested (0.785) consistently departed from tbe
collapsed curve. Correlations in tems of the analytical parameter K produced
the same result. Figure 13 shows a series of pressure distribution plots for
test conditions which encounter this kind of departure. For angle of attack o up to 3.4 , the shock is a well defined, nearly instantaneous, pressure rise
.-
43

which is preceeded by a leading-edge pressure peak and a small shock-free
recompression. At 3.70 angle of attack and above, the well defined, recompres
sion and shock give way to a single snloothed-out pressure recovery similar to
that experienced near low-speed maximum lift conditions. The precise mechan
ism producing the pressure recovery from supercri tical to subcri tical flow in
these cases is not known, but the pressure distribution shapes give the impres
sion of a merging of many weak waves originating in the flow near the leading
edge rather than ,a discrete shock-type pressure rise. These cases therefore
experience phenomena significantly different from the more usual transonic
shock cases and, therefore, fail to correlate. Pressure distributions for all
available data have been surveyed, and those data points that show low-speed
stall characteristics of this kind have been deleted.
44
-1.4
o~------------------~~
Figure 13. Illustration of Low Speed Stall Characteristics for Low Mach Numbers and High Angl es of Attack. RAE'Wing 864, 11 = .793, R = 3.7 X 10⁷, M = .785.
c

SUMMARY OF DATA CORRELATIONS
A thorough evaluation of the correlating parameter, K has been performed
by correlating all of the data previously considered in Reference 3. The
following data sets are included: (1) Wind tunnel and flight data for several
stations of the C-141 and C-5 wings, (2) three stations on a wind tunnel semi
span wing model called the RAE Model 864, (3) data from two spanwise stations
on the wing of the F-8 SCW research airplane which was developed and flown by
NASA to demonstrate supercritical wing technology. The RAE Model 864 wing has
been called moderately supercritical, it shows high aft loading resulting from
a cusped aft lower surface and some isentropic recompression before the shock.
This group of data sets, therefore, covers a wide range of wing types and as
will be shown by the data which follow, the parameter K is successful in
collapsing data for all of these cases.
Data points suffering either from separation bubbles at the shock or from
low speed stall characteristics were deleted and composite plots were prepared
wi th the data from all of the test Reynolds numbers collapsed into a single
curve by subtracting from the data measured at any given Reynolds number, the
values CPTEO and KO which are used to describe the Reynolds number effects on
the correlated data. Defini tions of the reference values CPTEO and KO are
illustrated in the sketch below.
CPTE
CPTEO
KO
K
45

The composite plots showing CPl'E - CPl'EO plotted against K-KO for the
C-141 wing are shown in Figure 14 and are typical of other sets of data which
will be presented later. This method of presentation provides an excellent
way to judge the entire correlation concept. The "tightness" of the data
correlation not only confirms the collapsing of trailing-edge pressure
recovery data for angle of attack and Mach number variations, but also
demonstrates the invariance of curve shape as Reynolds number is changed. As
shown in Figure 14, the quality of the correlation is much improved over that
shown in Reference 3. This improvement results partially from deletion of the
bubble separation and low speed stall data discussed previously, but also
because the unique correlating parameter K collapses the pertinent trailing
edge separation data without the compromise which was inherent in attempting
to include the extraneous cases when using the empirical parameter.
The data for the C-141 wing cover a variety of aerodynamic conditions.
The inboard station, 17 = 0.193, is completely free of bubble separation. At
the mid station, 17 = 0.389, approximately 30%, and at the outboard station,
71=0.637, 10 to 15 percent of the wind tunnel measured points were deleted
because they showed evidence of separation bubbles. Relatively fewer points
needed to be deleted from the flight results because the penetration into deep
separations was not as great as in the wind tunnel tests. The scatter of data
points around the correlation curves is somewhat greater for the two outboard
stations than for 71 = 0.193, but in no case is the scatter great enough that
the effect of trailing-edge separation is likely to be significantly mis
represented. The good correlation shown here is rather remarkable when
consideration is given to the variety of test data which are included. One
test was performed in 'the PWT 16T tunnel at AEDC using a C-141 wing on a C-5
fuselage covering mean chord Reynolds nunbers from about 3 million to 8-1/2
million. The second was obtained from tests of a semi-span wing-fuselage
model in the Lockheed-Georgia compressible flow wind tunnel at Reynolds
numbers from 3. million to nearly 25 million.· The third set was measured in
flight tests of the airplane, and lift coefficient and Reynolds nunber were
varied by measuring data at altitudes of 20,000 and 40,000 feet with the
airplane in turns or push-overs at load factors from 0 to 2. The airplane was
flown into Mach number and load factor conditions where significant buffet was
encountered. Because of the large built-in twist of the C-141 wing (5.50),
46

Ei a < -....
8 .. 8 ..
8 .. • 8
~~--~-~~-----~~----~2~----~8------~2f' ~ ~ ~ ~ a a
ou.o - u.c
• • D
8 ..
8 ~ · . Q ,.;
8 ~~.------~~----~~------~2----~·~8~· ------s~· f ~ ~ ~ ~ .a a
It
•
8 .. 8 ..
8 .. · 8
~~------~~--------~--------=~------~------~2f ~ ~ ~ 9 Q a
ou.c-ll4~
-'o:t' "'i u '-
.2 ~ .2 -a e '-o
U Q) -.-8 0-
S U
• 'o:t' -Q) ':J C) .-u.
47

rr·· the farthest outboard station, 11 = 0.637, very rarely showed any evidence of
separation. Although the few points showing degraded trailing-edge pressure
recovery were utilized in Reference 3 to establish separation develolJllent
curves, they have now been abandoned because they are clearly not conclusive.
Pressure distributions were measured at two spanwise stations in both wind
tunnel (AEDC 16T) and flight tests of the C-5 airplane. Composite correla
tions of these data are shown in Figure 15. In this case significant pene
tration into separated conditions was experienced at both spanwise stations
and the available Reynolds numbers range from about 3 million to 90 million.
The twist of the C-5 wing is substantially less than the C-141 and conditions
are more nearly constant across the span. Approximately 30 percent of the
wind tunnel points and 7 percent of flight points have been deleted because of
bubble separations.
Data for the RAE model 864 are presented in Figure 16. At the two inboard
stations for this wing, data were retained only for the lowest Reynolds number
tested.
deleted.
All other data encountered bubble separations and were therefore
At the most outboard station considered, 11 = 0.793, bubble separa-
tions were absent in a sufficient number of cases to enable a complete correla
tion of data for Reynolds numbers from 3-1/2 to 7-1/2 million. In this case,
a large number of data points (approximately 25~) showed characteristics of
low-speed stalls and were deleted.
Correlated data for two stations of the wing of the F-8SCW airplane are
shown in Figure 17. These data were obtained from Reference 7, which presents
the results of flight tests at several Mach numbers quite close to 1. The
range of Reynolds numbers covered by these tests is rather limited and no
Reynolds number effects are discernable within that range. The characteristic
shape of the correlation curves is very much different from that shown by the
other wings which have been considered. This is perhaps not surprising in
view of the radically different type of wing and the Mach number range covered
by these tests. The basic test data (CPTE vs. Mach number and angle of
attack) for which the:se correlations have been developed are shown in Figure
18. The correlating parameter K is successful in collapsing these data into
reasonably narrow bands in spite of the large and somewhat disorganized
variations which are shown in Figure 18.
48

ETAO.4S0 ETA 0,700
R - 106 SYM R - 106 SYM c c
4.7 .to 3.7 C)
6.6 + ~.3 .to
42 )( 30 Y
57 • 42 72 X 57
90
-4.40 -4.40
-4.~ -4.~
Q -4.20 53 -4.20 ... t- t-o.. eJ u ... ... t- t-o.. 0.. u -4.10 u -4.10
r"" )(
• )(
0.00 • 0.00
~ •
0.10 0.10 I I I -4.00 -2.00 0.00 2.00 4.00 -4.00 -2.00 0.00 2.00 4.00
K-KO K-KO
Figure 15. Composite Correlations for C-5 Wirg
49

~ ... . , 'r
8 ..;
.-.-., p ~
c:I
'" .... .-~
:J; I
c:I • 8 fI/I OJ "e 9~ c:I I.:
-c a 8. ... .... ~
~l >- El • • ... -OS!
~ N
... -0-0 I
I ••• ....... ... .... 8
~ ~ /il g 8 gT "i "i "i "i a Q
ou.o -uoO g>
3: 8 -.:I" cD -0
CX)
~ 8 0::: .0 ...
.2 c -
~ 8 8 ·r ... .. ~ a ~
c .... -Os .2 -x ... ~ ...5! .. N OJ ...
R ... . ~ 0 U
8 • /il 51 S g /il lila -0 ... "i "i a a Q Q OJ
ll.oO ... :J
.El u-
S cD
9 .0
... coo S .... Q ... ~ ~ -Os • ....
X ... .,;
I~ II
,.'"
is ,
'1' /il = S i! /il
i::j ~
"i "i a Q Q Q llAJ
50

01 -
))
\!:! fj
ETA 0.306
RN SYM
9.0 X
12. • IS •. +
-0.«1
-0.30
-0.20
-0.10
0.00
•
0.10 I I I I I 0.00 2.00 ~.OO 6.00 8.00
K
) )
~ A-U
ETAO.6S3
RN SYM 7.5 + 9.0 X
-0.«1 x
x
-0.30
-0.20
-0.10 _
Y-0.00
0.10 I I I 1 0.00 2.00 ~.OO 6.00 8.00
K
Figure 17. Correlations for F-8 SCW Flight Data
) ")
x

l'
- ., -, ,
It is wise at this time to point out again (this was previously discussed
in Reference 3) the fact that data points selected to calculate the local Mach
number M in the correlation parameter are those points immediately ahead of e
the terminal shock, regardless of prior pressure peaks. Pressure distribution
plots for several cases are shown in Figure 19 to illustrate this point. The
F-8 sew data are the most striking example. -The conditions which enable a
successful correlation, and therefore apparently control the developnent of
separation, are those conditions immediately ahead of the shock, even though
significantly ~igher local Mach numbers are encountered farther forward on the
wing chord. Those farther forward conditions obviously contribute to the
boundary layer developnent and, therefore, influence separation. but the
strength of the terminal shock seems to provide the primary control over
separation.
-.S / M
1/=.306 0 .90
0 .95 -.4 0 .97
Cl .98 (). .99
-.3
W I- -.2 tJ
-.1
o
.1~ ______ ~ _________ -L _________ ~ ______ ~
2 2 8 10
ANGLE OF ATTACK, 4 -
- .. - . _.. --- -- - -----. ..--
Figure 18. Variation of Trailing Edge Pressure Recovery with Mach Number and Angle of Attack, F8-SeW
52

111 Co.)
-j
C-IU, 'I ~ .1~3 M & .T14
-'Mcl\L -1.2
--O'SIl
-.' -.1
g Q
\ .
~\ ~>-!!.,,,~.
I '~) 0 .j
l
-..
o
-.4
o--~ ! ! ! !
• .4 •• 6 •• 1.0 0
lVC
f\v
~
KAf 864, 'I ~ .434 M~,~I
-CPS"
I~\ \ 7 . \ ~ ! I !
, . .
.2 .4 .6
lVC
-.8
-.4
•
~
f-ilSCW, 'I~ .:104 M~ ,.004
(-\._." ....
\ \
.\ /-CP~H 'r \
. "-.-i \ ----~r
• ./1-. •
Or /-. ~ /' .. '\. I \
I \ I
'. · . ..~ ~ 1.0 O· .2 ... .6 lVC .8 1.0
Figure 19. Illustration of Local Flow Conditions used to Define Correlation Parameter

SCALE EFFECTS
A simple observation of the data presented in the previous section shows
that Reynolds number effects on the separation development are similar to
those shown previously in Reference 3. Quantitatively, however, the Reynolds
number effects must be different because the correlation parameter K contains
the Reyno~ds number dependent term Cf • The variations of CPTEO and KO are
shown in Figure 20. These data show rather convincingly that the effects of
Reynolds number on the separation development (as displayed by the correlation
of pressure recovery versus K) is identical for all of the cases considered.
These cases include a number of spanwise stations on both the C-141 and the
C-5 wings which cover a large Reynolds number range from both wind tunnel and
flight test results, and from one spanwise station of the RAE 864 wing. This
latter wing includes the primary features of modern supercritical wings
including an isentropic recompression ahead of the terminal shock and large
pressure gradients in· traversing the trailing edge from lower to upper
surface.
The close grouping of test data around the faired curves in Figure 20
rr-" provides sUbstantial confidence in the applicability of these scale effects to
transonic wings in general, although additional cases of combined wind tunnel
and flight test results would be desirable for modern transport wing designs.
A review was made of scale effects utilizing Re as a scaling parameter
rather than R. It was thought that refined correlations might be obtained c owing to the fact that variations in boundary layer development due to angle
of attack changes in pressure distribution are given some accountability in
Re but not,of course in Rc. No improvement was observed in correlation or
scaling. In a similar way, the concept of using the skin friction coefficient
itself as a scaling parameter, or of using the calculated value of H just
forward of the shock, were examined. None of these showed advantages over the
use of chord Reynolds number.
54

~KO
rj .. ~CPTEO
2
O~----------+-----~--~~~~-------4----------+-----4-----~
-I
-.1
0 2
.1
10
4 6 00 00
R- -- 106 c
20 40
oes o ~ C-141 ~
0-V RAE 864
Figure 20. Scale Effect on Shock-Induced Separation Correlations
55

T EXTRAPOLATING PROCEDURE
The procedure for utilizing the concepts discussed in this report for
predicting the effect of changes in Reynolds number on wing pressure distri
butions in the presence of shock-induced trailing-edge separations is dis
cussed in some detail in Reference 3. The principal points of that procedure
are listed below and are not changed by the refinements presented in this
report:
56
1. Measure pressure distributions with transition fixed near the leading
edge at whatever Reynolds numbers can be achieved in available test
facilities. (The impact of precision of the prediction process is of
course minimized by starting at the highest possible Reynolds num
ber.) The remaining steps are then undertaken utilizing the measured
data at each spanwise station individually.
2. Make plots of shock location, XCSH, against trailing edge pressure
coeff1cient, CPTE for each of the test Mach numbers. The definition
of this relationship can be refined by including data measured at
additional Reynolds numbers, or with the transition strip removed, or
with vortex generators installed on the wing. This relationship is
independent of Reynolds number and will be used to define the flight
shock location from extrapolated values of CPTE.
3. The values of the correlation parameter K are calculated from mea
sured pressure data and calculated skin friction coefficients. The
variation of trailing-edge pressure coefficient with Mach number and
angle of attack is collapsed into a single curve of CPTE vs K. Values
of CPTEO and KO for the test Reynolds number are picked off that
curve.
4. Values of CPTEO and KO for the flight Reynolds number are now ob
tained by adding increments from Figure 20 to those values for the
test Reynolds number. The relationship between CPTE and K for the

5.
flight Reynolds number is produced by shifting the curve from step 3
by those increments.
For any given value of K, the values of CPTE and XCSH can be picked
off the curves from steps 4 and 2, respectively. The pressure
coefficient at the beginning of the shock can be calculated from K,
the freestream Mach number, and the appropriate value of Cf • The
chordwise location for that pressure coefficient is obtained from
shock location and the slope of the shock pr.essure rise, enabling the
definition of a locus of shock initiation points.
Figure 21 illustrates the outcome of this process, using test data at
several angles of attack from station 11 = 0.193 of the C-141 wing for a
chord Reynolds number of 3.4 x 10⁶ and extrapolating to a chord Reynolds
ntlllber of 100 x 106• The locus of points at which the shock can start for
each Reynolds number is shown on the plot for each angle of attack. The
fairing of pressure coefficient to the new shock location can be aided by
taking guidance from calculated pressure distributions, and the fairings of
pressure distributions from the foot of the shock to the trailing-edge is
copied from test data experiencing similar trailing-edge pressure recoveries.
The test data at an angle of attack of 40 shows the presence of a separation
at the foot of the shock and, therefore, requires no scale extrapolation.
The extrapolated pressure distributions are applicable at equivalent
angles of attack for the pertinent spanwise station. Proper prediction of
spanwise load distributions must take account of the aeroelastic deflection of
the wing.
The concepts which underlie this extrapolation procedure show that in
general, there is no "magic" Reynolds number beyond which scale effects no
longer exist. From a practical point of view however, there is for each Mach
number and angle of attack a Reynolds number at which this procedure would
predict that these conditions result in a value of K less than the "knee"
value at which CPTE begins to deteriorate. At Reynolds numbers above that
value, the scale effect on CPTE is reduced to a much smaller rate of change
than that for lower Reynolds numbers.
57

-1.2
r
58
----- WIND TUNNEL TEST DATA --- EXTRAPOLATED
R C
SHOCK OCCURRENCE lOCUS
R = 100 X 106
c
6 = 3.4 X 10 \ , , , ,
r 'J( 0\,
0,0 : 0-"",0'
0<)- -v
,0 00 o , I
-----.q.
, , , , "'/
.0,0, " ~n.._.0 \'
,0 cru-<-r " o I I I , o I , I -----~- -
I o
, \ I , \ , [t!.tf.-A-~
: 6..A-A-A-~, I I ,
I "
. I', I ' I '
I I
<? \ I
---' '0--'0
I "
I '-" '
- --
Figure 21. Illustration of Pressure Distribution Extrapolation. C-141; Tl= .193, M= .825

CONCLUDING REMARKS
The study which is covered by this report was conducted to refine the
Reynolds number extrapolation process previously presented in Reference 3, and
to exploit the newly derived analytical correlation parameter of Reference 4.
Substantial improvements in the correlation of shock-induced separation
data for transonic wings has been demonstrated by use of the analytical
parameter rather than the previously used empirical parameter.
A portion of this improvement results from an isolation of data points
that are influenced either by local separations at the shock or by phenomena
similar to low speed stalls. The presence of either of these factorsinvali
dates the correlation which is directed toward trailing-edge separations.
Specific criteria are not yet known to predict those wings which will
experience local separations at· the shock. The occurrence of these separa
tions is obviously dependent on Mach number as well as wing geometry. They
occur with great frequency at inboard stations of the RAE 864 wing, especially
at low Mach numbers; less frequently outboard or at high Mach numbers. They
are almost completely absent from inboard stations of the C-141 wing, but
occur with moderate frequency farther outboard. It has been shown previously,
by other researchers, that flow situations dominated by bubble separations
experience no change due to changes in Reynolds number. The fact that these
situations are rejected by the current correlation concept is therefore no
great loss.
The scale extrapolation process previously presented in Reference 3 is
still valid, is possibly somewhat improved in precision, but is quantitatively
changed due to the inclusion of skin friction coefficient in the analytical
correlation parameter.
59

REFERENCES
1. Pearcey, H.H., Haines, A. B., and Osborne, J. "The Interaction Between
Local Effects at the Shock and Rear Separation" in AGARD Conference
Proceedings 35, September 1968.
2. AGARD CP83 "Facilities and Techniques for Aerodynamic Testing at Transonic
Speed and High Reynolds Number" April 1971.
3. Cahill, J. F., and Connor, P. C. "Correlat1:.on of Data Related to
Shock-Induced Trailing-Edge Separation and Extrapolation to Flight
Reynolds Number" NASA CR-3178, September 1979.
4. Khan, Mohammad "Analytical Considerations of Shock-Boundary Layer
Correlations" NASA CR-166426, Part I, March 1983
5. McNally, William D. "Fortran Program for Calculating Canpressible Laminar
and Turbulent Boundary Layers in Arbitrary Pressure Gradients" NASA
TND-5681 May 1970.
6. Anyiwo, Joshua C., and Bushnell, Dennis M. "Turbulence Amplification in
Shock-Wave Boundary-Layer Interaction" AlAA Journal Vol. 20, No.7, July
1982 P. 893.
7. t-bntoya, Lawrence C., and Banner, Richard D. "F-8 Supercritical Wing
Flight Pressure, Boundary-Layer t and Wake Measurements and Canparisons
with Wind Tunnel Data" NASA THX-3544, June 1977.
60

End of Document