Embed Size (px)
Citation preview

N A S A C O N T R A C T
R E P Q R T
N h 0 N
= U
I
LOAN COPY: RETURN TQ
KIRTLAND AFB, M, Me - 1 A W L (DOUL)
CORRELATION OF STRESS-WAVE-EMISSION CHARACTERISTICS WITH FRACTURE I N ALUMINUM ALLOYS
by C. E . Hurtbower, We G. Reuter, , .;.
C. 'F. Moruis, und P. P. Crimmins . . \
. . " .
Prepared by ADVANCED TECHNOLOGY AEROJET SOLID PROPULSION COMPANY
Sacramento, Calif.
, : . rl , . , .
, ,
' 1
. . . ,
for
N A T I O N A L A E R O N A U T I C S A N D S P A C E A D M I N I S T R A T I O N W A S H I N G T O N , D. C. JULY 1972
https://ntrs.nasa.gov/search.jsp?R=19720022820 2018-05-30T07:27:03+00:00Z

4. TITLE AND SUBTITLE 5. "EPORT DATE
CORRELATION OF STRESS-WAVE-EMISSION CHARACTER- July 1972 ISTICS WITH FRACTURE IN ALUMINUM ALLOYS 6. PERFORMING ORGANIZATION CUDE
7. AUTHOR(S) -r8IPERFORMING ORGANIZATION REPORT C. E. Hartbower, W. G. Reuter, C. F. Morais, &Z P. P. Crimm$s
9. PERFORMING ORGANIZAT~ON NAME AND ADDRESS 110. WORK UNIT NO. "
Advanced Technology Aerojet Solid Propulsion Company Sacramento, California
1 1. CONTRACT OR GRANT NO.
"
NAS 8-21405 13. TYPE OF REPORT & PERIOD COVER'E
12. SPONSORING AGENCY NAME AND ADDRESS Contractor Report
I National Aeronautics and Space Administration Washington, D. C. 20546
I "
15. SUPPLEMENTARY NOTES ~~
16. ABSTRACT
T h i s r e p o r t p r e s e n t s t h e f i n d i n g s o f a s t u d y t o c o r r e l a t e stress-wave-
e m i s s i o n c h a r a c t e r i s t i c s w i t h f r a c t u r e i n w e l d e d a n d unwelded aluminum a l l o y s
t e s t e d a t room and cryogenic temperatures . The stress-wave-emission charac-
t e r i s t i c s i n v e s t i g a t e d were those which serve t o p r e s a g e c r a c k i n s t a b i l i t y ;
v i z . , a marked i nc rease i n (1) s i g n a l a m p l i t u d e , ( 2 ) s i g n a l r e p e t i t i o n ra te
and (3 ) t he s lope of cumula t ive count p lo t ted versus load . The a l loys were
7075-T73, 2219-T87 and 2014-T651, welded with MIG and TIG u s i n g 2319 and 4043
f i l l e r w i r e . The t e s t i n g w a s done with both unnotched and part-through-crack
(PTC) tens ion spec imens and wi th 18- in . -d ia subsca le p ressure vesse ls . In the
la t ter t e s t i n g , a rea l - t ime , acous t i c -emiss ion , t r i angu la t ion sys t en was used
t o l o c a t e t h e s o u r c e of each stress-wave emission. With such a s y s t e m ,
mu l t ip l e emis s ions f rom a g i v e n l o c a t i o n were c o r r e l a t e d w i t h d e f e c t s f o u n d by
c o n v e n t i o n a l n o n d e s t r u c t i v e i n s p e c t i o n .
17 . KEY WORDS I Aluminum alloys Welding Stress-wave-emission characteristics
I 19. SECURITY CLASSIF. (d thls rapart) 20. SECURITY CLASS
~~
Unclassified Unclassified
18. DIS'TRIBUTION STATEMENT
IF. (Of t h l B P.W) 21. NO. OF PAGES 22. PRICE
I 232 I $3.00 ~ F C - Form 32'
*For sale by the National Technical Information Service, Springfield, Virginia 22151

This document reports on an inves t iga t ion by t he Aero je t So l id
Propuls ion Company from July 1968 t o November 1971, to determine the
co r re l a t ion be tween acous t i c emis s ion and f r ac tu re i n s e l ec t ed aluminum
a l loys under Cont rac t NAS 8-21405. The work was administered under
t h e d i r e c t i o n o f M r . W. C l o t f e l t e r o f t h e NASA Marshall Space Flight
Center .
Aerojet personnel who p a r t i c i p a t e d i n t h e i n v e s t i g a t i o n i n c l u d e
C. E. Hartbower, Associate Scient is t , W. G. Reuter , Senior Engineer ;
C. F. Morais, T e s t Engineer and P. P. Crimmins, Manager of the Metal lurgy
Sec t ion of Advanced Technology, Aerojet Solid Propulsion Conlxmy,
Sacramento, Cal i fornia .
iii


CORRELATION OF STRESS-WAVE EMISSION CHARACTERISTIeS WITH FRACTURE IN ALUMINUM ALLOYS
I. INTRODUCTION
A. Development of the Technolopv
1. Historical .Background
2. Subcritical Crack Growth
B. Scope of the Research
11. SUMMARY
111. TEST PROCEDURE
A. Materials
B. Fabrication of Test Specimens
C. Test Specimens and Fracture Testinp
1. Specimen Configuration and Test Procedure
2. Fracture-Mechanics Considerations
3 . Instrumentation for Tension Testing
IV.
Page
1
1
1
2
6
7
11
11
11
19
1:)
2 1
25
D. Hydrotest Procedure and Instrumentation 27
1. Details of Hydrotest Procedure 27
2. Acoustic Emission Instrumentation System for Pressure Vessel Testing
3 . SWAT Sensor Location and Attachment
TEST RESULTS
A. Fracture Toughness
1. Parent Metal
2. Welded Plate
B. Acoustic Emission
1. Stress-Wave Emission as a Precursor of Failure
29
31
3 3
3 3
3 3
33
36
36
40 2. Effect of Delamination
V

-3. Procedura l Var iab les
Page
4 1
4. Kaiser E f f e c t i n Welded .Aluminum 43
5. E f f e c t of Flaw S i z e 44
6. Rela t ionsh ip Between Acoustic-Emission 48 Couni and S t r e s s - I n t e n s i t y F a c t o r
7. Ef fec t o f T e s t Temperature 54
8 . E f f e c t of T r a n s d u c e r S e n s i t i v i t y in 57 Cryogenic Test ing
C. Subsca le Pressure Vessel R e s u l t s 64
1. Room Temperature T e s t of 2014-T6 A l u ~ n Z n u m 64 P r e s s u r e Vessei
2. Room Temperature T e s t of 2219-T87 Aluminum 66 P r e s s u r e Vessel
3. Cryogenic Temperature (-32'0OF) T e s t of 7 1 2014-T6 Aluminum P r e s s u r e Vessel
4. Cryogenic Temperature (-320OF) T e s t of 73 the .2219-T87 P r e s s u r e Vessel
5. Discuss ion of Pressure Vessel T e s t R e s u l t s 76
V . CONCLUSIONS 79
APPENOIX (BIBLIOGRAPHY) A-l
vi

Title
Chemistry of Parent Metal
Table
I Page 12
I1 Tensile Properties 13
14
15
I11
IV
Chemistrv of Wire
Summary of Test Specimens
17
18
Welding Parameters V
Pressure Vessel Fabrication Sequence VI
20
34
VI1 Weld Parameters
Summary of Part-Through-Crack (PTC) Parent-Metal Apparent Fracture Toughness
VI11
35 Summary of Part-Through-Crack (PTC) Weld Apparent Fracture Toughness
IX
50 X Summary of Stress-Wave-Emission Strain-Gage Fracture Data for 7075-T73 Aluminum 0.30-in. Thick, Single- Edge-No tch Tens ion
51
52
XI Summary of Stress-Wave-Emission Strain-Gage Fracture Data $or 2014-T651 Aluminum 8.30-in. Thick Single- Edge-No t ch Tens ion
XI1 Summary of Stress-Wave-Emission Strain-Gage Fracture Data for 2219-T87 Aluminum 0.30-in. Thick Single- Edge-Notch Tension
Increase in Count (2213 Accelerometer) 61 XI11
vii

Figure No.
1
2
3
4
5
6
7
8
9
10
11
12
13
14
15
16
17
Title
Typical Microstructure of 2014-T651 Aluminum Alloy 0.3-in. Thick Plate Material
Typical Microstructure of 7075-T73 Aluminum Alloy 0.3-in. Thick Plate
Typical Microstructure of 2219-T87 Aluminum Alloy 0.3-in.-Thick Plate Material
Typical Macrostructure of TIG Welds (4043 Filler Wire) in 2014-T651 Aluminum Alloy Plate
Typical Macrostructure of MIG Weld (4043 Filler Wire) in 0.3-in. Thick 2014-T651 Aluminum Alloy Plate
Typical Macrostructure of TIG Weld (2319 Filler Wire) in.0.3-in. Thick, 2014-T651 Almnum Alloy Plate
Pressure Vessel D E s i g n
Part-Through-Crack Tension Specimen and Knife-Edge Attachments to Accommodate the Crack-Opening- Displacement Gage
Longitudinal Weld Metal Unflawed and Preflawed Tensile Specimen Part Through Precrack Centrally Located in Gage Area of Weld Transverse to the Specimen Longitudinal Axis.
Effect of Pin-Hole Irregularities on Acoustic-Emission Count Rate on Initial Loading
Fixture for. Compressive Loadfng Specimen Luading Holes
Flaw Shape Parameter, Q, for Surface and Embedded Flaws
Comparison of the Irwin and Paris and Sih Approximations for Calculating Stress-Intensity Factors for Surface Cracks
Effect of Crack Depth and Flaw Shape on the K Value
Schematic of Instrumentation Used in Phase 1 of the Investigation
Effect of Counter Triggering Level on the Plot of SWE-Count vs Load. 7075-T73 Parent Metal Tested at -320°F.
Effect of Triggering Level on the Plot of SWE-Count vs Load. 2014-T6 TIG-welded with 4043 Filler Wire and Tested at -423°F with Three Flaw Sizes
IC
i ;
Page
85
86
87
88
89
90
91
92
93
94
95
96
97
98
99
100
101
viii

Figure No. Page
102
103
T i t le
P r e s s u r e Vessel T e s t Set-up
SWAT Mobile Test Laboratory
Schematic Diagram - Real T i m e Acoust ic E m i s and Triangulat ion System
Burs t Type S t r e s s Wave E m i s s i o n s
18
19
20 alY
Location of S t r e s s Wave Emission Monitoring Sensors,
s i o n An ,sis 104
105 2 1
22 S t r a i n Gage and Area Surrounding the Vessel Long i tud ina l Weld Which was Monitored During Hydrotest 106
107
108
23
24
25
Senso r A t t ached t o t he P res su re Vessel
P u l s e r A t t a c h e d t o t h e P r e s s u r e Vessel
Schematic Representation of Sensor and Pulser Mounting Techniques Used f o r Vessel Hydrotest 109
26 P recu r so r of P l ane S t r a in F rac tu re o f 2014-T6 PTC- Tension Specimen No. 2 Tested a t Room Temperature 110
111
112
2 7 E f f e c t o f T r i g g e r Level on SWE P r e c u r s o r i n 2014-T6 Tested a t 75°F
28 E f f e c t of Trigger Level on SWE P r e c u r s o r i n 2219-T87 Tested a t 75°F
Background 'lNoise'l Levels a t t h e Start and End of PTC Tension Tests a t 75 and -320°F. 2014-T6 Parent Metal with Surf ace Flaws
29
113
30 Background "Noise" Levels a t t h e S t a r t and End of PTC Tension Tests a t 75, -320 and 423°F. 2014-T6 TIG Welded wi th 4043 Wire 114
31 Background "Noisel' Levels a t t h e S t a r t and End of Tension Tests a t 75, -320 and -423°F. With No D e l i b e r a t e F laws . 2014-T6 TIG Welded with 4043 Wire 115
116
117
118
119
32 Schemat ic o f the Ef fec t o f Tr igger -Level Se t t ing on the Precursor ( room-tempera ture t es t ) .
33 Schematic of the Effect of Trigger-Level Set t ing on the P recu r so r at Cryogenic Temperature
34 Effec t o f Tr igger Level on Precursor a t -320°F. 7075-T73 Unwelded
35 SWE P r e c u r s o r i n a 7039-T61 Compact Tension Specimen. Note the Ef fec t o f Tr igger Level
ix

Figure No. Page
120
T i t l e
36 Comparison of PTC and WOL Tension Tests a t -320'F
37 Effect of Delamination-Type Flaws on SWE Count for T e s t s a t 75'F. 7075-T73 Pa ren t Metal Tested a t -320'F 121
122 38 Effec t o f Tape Playback on Cumulative Count i n 2219-T87
Specimen No. 32 Tested a t -320'F
39 Effect of Tape Playback on the RMS-Voltage P recu r so r (same tes t as Figure 38) 123
40 Schematic Showing t h e S i g n i f i c a n c e o f S e t P o i n t i n t h e Dunegan T o t a l i z e r 124
125 41 Kaiser E f f e c t i n L o n g i t u d i n a l l y Welded, Unnotched,
Tension Specimens
42 Kaiser Ef fec t i n Th i rd Cyc le o f Specimen No. 27 (second cycle to 38 k i p s ) 126
43 Comparison of Welded and Unwelded, Unnotched 2219 Specimens t e s t e d a t R.oom Temperature 127
44 Kaiser E f f e c t i n L o n g i t u d i n a l l y Welded PTC-Tension Specimens 128
45 Chmulative SWE Count vs Load f o r Three Flaw Sizes. 2014-T6 TIG Welded wi th 4043 Wire, Specimens 0.30-in. Thick, Tested a t 75°F 129
130 '4 6
47
Flaws in the Tension Specimens of Figure 45
Cumulative SWE Count srs Load for Three Flaws. 2014-T6 T I G Welded wi th 4043 Wise, Specimens 0.18-in. Thick, Tested a t 75'F 131
132 48
49
Flaws in the Tension Specimens of Figure 47
Effect of Flaw S ize on SWE Count. 2014-T.6 T I G WElded wi th 2319 Wire 133
134 50
51
Flaws in the Tension Specimens of Figure 49
Comparison of P r e c u r s o r s i n Notched (PTC) and Unnotched Tension Tests (Specimen No. 2 and C) 135
52 Summation of Acoustic Emission as a Funct ion of S t r e s s - Intensity Factor-7075T6 (Dunegm) 136
X

Figure No. Title Page
53 Relationship Between Stress Intensity and Cumulative Count for Materials Under Constant Load and Subjected to Stress-Corrosion Cracking in 70°F Water 137
54 Relationship Between Cumulative Acoustic-Emission Count and Stress Intensity Factor in SEN-Tension Tests of 7075-T6 138
55 Relationship Between Cumulative Count and K in SEN-Tension Tests of 2014-T6 and 2219-T87 139
56 Correlation Between Crack-Opening-Displacement Measurement and Acoustic Emission in a SEN-Tension Test of 2014-T651 140
57 Effect of Temperature on SWE Count. 2014-T6 TIG Welded With 2319 Wire; Nearly Identical Flaws 141
142 58
59
Flaws in the Tension Specimens of Figure 57
Effect of Temperature on SWE Count. 2014-T6 TIG Welded with 4043 Wire; Nearly Identical Flaws 143
144 60
61
Flaws in the Tension Specimens of Figure 59
First Load Cycle for 2219 Specimen I at -320'F (32.5 kips maximum load , 500.000 counts) 145
62 Second Load Cycle for 2219 Specimen I at -320°F (max. laad 50 kips; at 32.5 kips, 850,000 counts) 146
63 Third and Fourth Load Cycle for 2219 Specimen I at -320'F (in the 3rd and 4th cycles, the count at 32.5 kips was 55,000 and 5,000, respectively) 14 7
64 Effect of X-Y Plot Scale Factor on the Precursor of Failure for 2219 Specimen I at -320'F 148
65 Effect of Specimen Thickness on SWE Count. 2014-T6 TIG Welded with 4043 Wire; Tested at -320°F 149
150
15 1
66
67
68
Flaws in the Tension Specimens of Figure 65
Cumulative Count at -320'F With Sensor Mounted on a Wave Guide
Comparison of Two Transducers Mounted on 2014-T6 Unnotched Tension Specimen No. C 15 2
69 Comparison of Spring-Mounted and Wave-Guide-Mounted Output from 2213 Accelerometers on 2219-T87 Specimen No. 28 153
70 Comparison of Two Transducers Mounted on 2014-T6 Specimen No. 3 for the First Cycle to 20.2 kips
xi 154

Figure No.
T i t l e Page
71
72
73
74
75
76
77
78
79
80
81
82
83
84
85
86
Comparison of Two Transducers Mounted on 2014-T6 Specimen No. 3 f o r t h e Second Cycle t o F a i l u r e 155
2014-T6 Aluminum Vessel Hydroburst a t Room Temperature 156
u o s e - u p V i e w s o f t h e F a i l u r e O r i g i n o f t h e 2014-T6 Aluminun; Vessel Hydroburst a t Room Temperature 15 7
S t r a i n Gage Data (Hoop O r i e n t a t i o n ) f o r F i n a l P r e s s u r e C y c l e o f t h e 2014-T6 Aluminum Vessel Tested a t Room Temperature. Note e l a s t i c behavior of t h e p a r e n t metal c y l i n d e r s e c t i o n where the page w a s mounted.
Cumulative Stress Wave Emission vs P r e s s u r e f o r t h e 2014-T6 Aluminum Vessel Hydroburst a t Room Temperature ( 3 pages)
Locat ion o f SWE Sources Detected When P r e s s u r i z i n g 2014-T6 Aluminum Vessel t o 460 p s i a t Room Temperature
Locat ion of SWE Sources Detected When P r e s s u r i z i n E t h e 2014-T6 Aluminum Vessel t o 690 p s i a t Room Temperature
158
159
160
161
Location of SWE Sources Detected When P r e s s u r i z i n g t h e 2014-TG Aluminum Vessel t o F a i l u r e a t 880 p s i a t Room Temperature 162
Longi tudina l Weld Defec.ts - 2014-T6 Aluminum P r e s s u r e Vessels 163
Longi tudina l Weld Frac ture Faces - 2014-T6 Aluminum Vessel Hydroburs t a t Room Temperature 164
Areas of Longi tudina l Weld Non-Fusion, I n c l u s i o n s and Poros i ty on t h e F r a c t u r e S u r f a c e of t h e 2014-T6 Aluminum Vessel Burst a t Room Temperature 165
2219-T87 Aluminum Vessel Hydroburst a t Room TemperaturE 166
Close-up V i e w o f 2219-T87 Aluminum Vessel F r a c t u r e A f t e r Hydroburst a t Room Temperature 167
Longi tudina l Weld Frac ture Faces - 2219-T87 Aluminum Vessel Hydroburst a t Room Temperature 168
S t r a i n Gage Data (Hoop O r i e n t a t i o n ) f o r F i n a l P r e s s u r e Cycles o f the 2219-T87 Aluminum Vessel T e s t e d a t Room Temperature 169
Cumulat ive Stress Wave Emission vs P r e s s u r e f o r t h e 2219-T87 Aluminum Vessel Hydroburst a t Room Temperature ( 4 s h e e t s ) 170
xii

Figure No. Page Title
Location of SWE Sources D-ected When Pressurizing (1st Cycle) the 2219-T87 Aluminum Vessel to 300 psi at Room Temperature
87 174
175 88 Location of SWE Sources Detected When Pressurizing (2nd Cycle)
the 2219-T87 Aluminum Vessel to 400 psi at Room Temperature
89 Location of SWE Sources Detected When Pressurizing (4th Cycle) the 2219-T87 Aluminum Vessel to 400 psi at Room Temperature 176
90 Location of SWE Sources Detected When Pressurizing (5th Cycle) the 2219-T87 Aluminum Vessel to 500 psi at Room Temperature 177
178
179
91 Location of SWE Sources Detected When Pressurizing (6th Cycle) the 2219-T87 Aluminum Vessel to 680 psi at Room Temperature
Location of SWE Sources Detected When Pressurizing (7th Cycle) the 2219-T87 Aluminum Vessel to 860 psi at Room Temperature
92
Location of SWE Sources Detected When Pressurizinp (8th Cycle) the 2219-T87 Aluminum Vessel to 1250 psi at Room Temperature. Weld Preflaw Location also Shown.
93
180
94 Location of SWE Sources Detected When Pressurizing (10th and 11th Cycles) the 2219-T87 Aluminum Vessel to 1500 and 1530 psi (failure) at Room Temperature 181
182
183
95
96
97
Longitudinal Weld Defects - 2219-T87 Aluminum Pressure Vessel
2014-T6 Aluminum Vessel After Burst at -320°F
2014-T6 Aluminum Vessel After Burst at -320'F and Reassembly on Floor of Test Cell 184
185
186
188
189
190
98 Fracture Surfaces in the Cylinder Section Near the Longitudinal Weld. 2014-T6 Vessel Tested at -320°F.
99 Cumulative Stress Wave Emisslon vs Pressure for the 2014-T6 Vessel Tested at -320'F. (2 Pages)
100 Location of SWE Sources Detected When Pressurizing (1st Cycle) the 2014-T6-Aluminum Vessel to 550 psi at -320°F.
10 1 Location of SWE Sources Detected When Pressurizing the 2014-T6 Aluminum Vessel to Failure (2nd Cycle) at -320°F
10 2 Longitudinal Weld Fracture Faces - 2014-T6 Aluminum Vessel Hydro- burst at -320°F
xiii

Figure No. "
T i t l e
103
104
105
106
10 7
108
109
110
111
Areas of Longi tudina l Weld Non-Fusion, Inc lus ions and Poros i ty on the Frac tu re Su r face o f the 2014-T6 Aluminum Vessel Burst a t -320°F
Areas (o the r t han p r imary f r ac tu re Area A) of Longi tudinal Weld Non-Fusion, Inc lus ions and Po ros i ty on t he F rac tu re Surface o f the 2014-T6 Aluminum Vessel Tested a t -320°F
Frac tured 2219-T87 Aluminum Chamber i n Test Cell After Tes t ing a t -320°F
Fracture Cylinder Section and Close-up V i e w of the Longi tu- d i n a l Weld PTC Flaw f o r t h e 2219-T87 Aluminum Vessel Hydro- b u r s t a t -320°F
Longi tudina l Weld Frac ture Faces - 2219-T87 Aluminum Vessel Hydroburst a t 320°F
Cumulat ive Stress Wave Emission vs P r e s s u r e f o r t h e 2219-T87 Vessel Tested a t -320°F. (3 pages)
Locat ion of SWE Sources Detected When Pressur iz ing (3rd Cycle) t h e 2219-T87 Aluminum Vessel t o 1000 psi a t -320°F
Locat ion of SWE Sources Detected When Pressur iz ing (4 th Cycle) t h e 2219-T87 Aluminum Vessel t o 1000 p s i a t -320°F
Location of SWE So-urces Detected When Pressur iz ing (5 th Cycle) t h e 2219-T87 Aluminum Vessel t o F a i l u r e ( 9 4 5 p s i ) a t -320°F
Page
191
192
193
194
195
196
199
200
201
xiv

I. INTRODUCTION
A. DEVELOPMENT OF THE TECHNOLOGY
1. H i s t o r i c a l Background
The use o f stress-wave emission as a nondes t ruc t ive i n spec t ion
technique has been under development for over a decade. The technique is based
upon t h e e las t ic energy which is spontaneous ly re leased when a material undergoes
plast ic deformation and/or cracking. Thus, stress-wave emiss ion cons t i t u t e s a
un ique nondes t ruc t ive i n spec t ion method i n t h a t t h e material d e f e c t when pro-
p a g a t i n g , t r a n s m i t s i ts own s i g n a l , w i t h t h e s e n s o r a c t i n g as t h e r e c e i v e r .
I n o t h e r w o r d s , t h e material undergoing crack growth both generates and t r a n s -
mits t h e s i g n a l ( s t r e s s wave emission) which then can be detected by s u i t a b l e
in s t rumen ta t ion and t he sou rce l oca t ed u s ing seismic techniques.
I n Germany, K a i s e r ( l ) * r e p o r t e d what w a s a p p a r e n t l y t h e f i r s t
comprehensive invest igat ion of stress-wave emiss ion in 1950. In the U.S.A.,
t he r e sea rches o f Schof i e ld , e t a1 (2-4) and s t u d i e s a t Aerojet-General
Corporation (5-28) were l a r g e l y r e s p o n s i b l e f o r t r i g g e r i n g t h e c u r r e n t h i g h
a c t i v i t y i n t h i s new f i e l d of nondes t ruc t ive i n spec t ion . Dunegan
the Un ive r s i ty o f Ca l i fo rn ia Lawrence Radiation Laboratory also did pioneering
work i n t h i s area, but most of h i s e a r l y r e s e a r c h w a s f o r t h e U.S. Atomic
Energy Commission and, therefore, w a s no t pub l i c i zed . Gradua te s tud ie s a t
Mich igan S t a t e Un ive r s i ty s t a r t ed work ing i n t h i s f i e ld a round 1960 and
c o n t i n u e t o work with the s t ress-wave emission phenomenon (33-36). Likewise,
o ther co l leges and un ivers i t ies have been encouraging work on t h e phenomenon
i n t h e last f i v e y e a r s
(29-32) at
(37-45)
*References 1-45 are l i s t e d on pages 81 - 8 4 .
1

I n a d d i t i o n t o t h e above re ferences , an e x t e n s i v e l i t e r a t u r e
survey was undertaken during this program. The art icles d e a l i n g w i t h t h e
g e n e r a l area of acous t ic emiss ion technology uncovered and rev iewed dur ing th i s
survey are shown i n Appendix A. Al though this background is ex tens ive , no
r e p o r t e d work was found which involved appl icat ion of t h e t e c h n i q u e t o m o n i t o r i n g
of c r a c k i n i t i a t i o n and growth a t c ryogenic t empera tures . Pr imar i ly , the work
has involved room tempera ture l abora tory tests and the monitor ing of s t r u c t u r e s ,
p r i n c i p a l l y p r e s s u r e vessels, a l s o a t room temperature. The r e s u l t s of these
pr ior programs are i n c o r p o r a t e d i n t h i s r e p o r t w h e r e a p p l i c a b l e t o t h e r e s u l t s
o f t h i s s t u d y
2 . Subc r i t i ca l Crack Growth
Examinat ion of fa i led rocket motor cases has indicated the
t y p i c a l f a i l u r e o r i g i n t o b e a small crack or crack-l ike f law. The f law is
s o m e t i m e s s u f f i c i e n t l y l a r g e t o c a u s e f r a c t u r e on i n i t i a l l o a d i n g a n d some-
times i t i s s o small t h a t t h e s t r u c t u r e c a n w i t h s t a n d many l o a d c y c l e s o r a
prolonged period of s u s t a i n e d stress b e f o r e t h e f l a w a t t a i n s c r i t i c a l s i z e
f o r f a i l u r e . From s e r v i c e - f a i l u r e a n a l y s e s , i t i s clear t h a t f a b r i c a t e d
s t r u c t u r e s and even r a w materials con ta in de fec t s o f va r ious k inds . Se rv ice
l i f e t h e n i s c o n t r o l l e d by (1) t h e i n i t i a l f l a w s i z e , ( 2 ) t h e rate of slow
crack growth in the environment of the proof test and/or service, and (3) t h e
f l a w s i z e ( c r i t i c a l c r a c k s i z e ) t o c a u s e f r a c t u r e a t t h e o p e r a t i n g stress.
The l a t t e r is determined by a quan t i t a t ive measu re of f r ac tu re t oughness . The
rate of subcri t ical crack growth and the threshhold stress i n t e n s i t y below
which slow crack growth w i l l no t occur i s determined by l a b o r a t o r y e v a l u a t i o n
and can be monitored by nondestructive inspection using the Stress-Wave Analysis
Technique (SWAT). The i n i t i a l f l a w s i z e i s e s t ima ted by q u a l i t y c o n t r o l and
v e r i f i e d by proof test .
The basic philosophy of the proof test is tha t once a p r e s s u r e
vessel has withstood tne proof p ressure , subsequent loading to a lesser p r e s s u r e
w i l l no t p roduce fa i lure , Obvious ly , th i s assumes tha t there w i l l be no fa t igue
c r a c k i n g i n service and no s low c rack g rowth o f ex i s t ing subc r i t i ca l de fec t s
due t o time-dependent mechanisms such as hydrogen, stress cor ros ion and/or
s t ra in ag ing . Wi thout SWAT, expe r i ence shows t h a t f a i l u r e c a n o c c u r i n p r o o f
t e s t i n g as a r e s u l t of undetected subcri t ical crack growth. Moreover , when a
material is suscept ible to s low crack growth, the concept of the proof test is
i n v a l i d ; i .e . , a f t e r p r o o f t e s t i n g , t a n k a g e can f a i l at a lesser l o a d i f stress-
co r ros ion , s t r a in ag ing , hydrogen o r cyc l i c l oad ing are invo lved i n s e rv i ce .
There are numerous examples t o i l l u s t r a t e t h e f a c t o f s u b c r i t i c a l c r a c k g r o w t h
i n p r o o f t e s t i n g as w e l l as i n service.
Consider the second-stage Minuteman, a 42-in.-dia rocket
motor case which w a s p r o o f t e s t e d w i t h i n h i b i t e d water w i t h t h r e e cycles of
n ine ty s econds each t o 1.1 of t h e mean expec ted ope ra t ing p re s su re (MEOP). One chamber fa i led "premature ly" dur ing the four th cyc le ( a t e s t - r i g m a l -
f unc t ion on t h e f i r s t c y c l e n e c e s s i t a t e d a f o u r t h c y c l e t o p r o o f p r e s s u r e ) .
The f a i l u r e o c c u r r e d a f t e r 40 seconds a t p r e s s u r e d u r i n g t h e las t c y c l e of
p roof t e s t ing . Thus , t he chamber withstood a t o t a l of 220 seconds a t maxi-
mum p r e s s u r e . The f a b r i c a t o r ' s f a i l u r e a n a l y s i s r e p o r t e d t h a t f a i l u r e
i n i t i a t e d i n t h e LD su r face , i n t he fu s ion and hea t - a f f ec t ed zone of t h e
cen te r g i r th we ld . No cracks w e r e found by nondes t ruc t ive inspec t ion pr ior
t o p r o o f t e s t i n g . The only explana t ion for such a f a i l u r e i s s u b c r i t i c a l
crack growth during proof tes t ing.
I- - ~- -
Consider a lso a f i r s t - s t a g e P o l a r i s r o c k e t m o t o r case which
w a s p r o o f t e s t e d w i t h i n h i b i t e d water at 1150 p s i g a n d h e l d a t p r e s s u r e f o r
180 seconds, wi th two o r more p re s su re cyc le s . In t he ea r ly deve lopmen t o f
t h e P o l a r i s , t h e r e were numerous f a i l u r e s i n Droof t es t , and some had a l l
t h e c h a r a c t e r i s t i c s of s u b c r i t i c a l c r a c k g r o w t h . One chamber, f o r example,
f a i l e d a f t e r 120 seconds a t proof p ressure on the second tes t cyc le . The
chamber had been inspected by magnetic-particle, dye-penetrant, radiographic
and v i sua l p rocedures ; a l l f a i l e d t o r e v e a l c r a c k i n g . A n o t h e r P o l a r i s
.
3

chamber f a i l e d a f t e r t h e s e c o n d p r o o f c y c l e d u r i n g the first few seconds of
d e p r e s s u r i z a t i o n , a f t e r w i t h s t a n d i n g a t o t a l of 360 seconds at proof pressure. "- -
The above examples show t h a t i n c i p i e n t f l a w s i n a p r e s s u r e
vessel can i n c r e a s e i n s i z e as a r e s u l t o f p r o o f t e s t i n g . The concern here
is n o t o n l y w i t h t h o s e p r e s s u r e vessels t h a t f a i l d u r i n g p r o o f tes t ( an
economic l o s s ) bu t a l so w i th t hose t ha t su f f e r subc r i t i ca l c r ack g rowth
w i t h o u t f a i l u r e i n the p roof test . The l a t te r t h e n e n t e r s e r v i c e w i t h
en la rged cracks which may b e s u b j e c t t o addi t ional s low crack growth a t
service loads . However, i f t h e proof test does no t f a i l t h e p r e s s u r e vessel
and i f a system is employed t o d e t e c t and l o c a t e f l a w ( s ) u n d e r g o i n g s u b c r i t i c a l
crack growth, the information gained from the proof test outweighs the damage
done by slow crack growth. Furthermore, with the safeguard of SWAT, proof
t e s t i n g s i g n i f i c a n t l y a b o v e t h e p r e s s u r e a n t i c i p a t e d i n service can be
advantageous. For example, Sf a vessel s u r v i v e s t h e f i r s t c y c l e t o 1 . 5
MEOP, t h e n t h e l a r g e s t f l a w t h a t can b e p r e s e n t i n t h e s u c c e s s f u l l y p r o o f - t e s t e d
tankage is smaller t h a n t h a t at 1.1 MEUP . Thus, a vessel which su rv ives t he
f i r s t c y c l e a t a proof pressure of 1 .5 MEOP is less l i k e l y t o f a i l i n service
because of t h e s i g n i f i c a n t l y smaller de fec t s demons t r a t ed t o be p re sen t by t h e
proof t es t , However, i f SWAT is no t u sed t o de t ec t f l aw g rowth and permit
unloading before a c rack reaches cri t ical s i z e , the h igher p roof p ressure
(1.5 MEOP) w i l l i n c r e a s e t h e p r o b a b i l i t y o f f a i l u r e i n t h e p r o o f test i t s e l f .
*
The examples of s u b c r i t i c a l c r a c k g r o w t h c i t e d i n ear l ier
paragraphs involved high-strength materials. Some who are pr imari ly concerned
with lower-s t rength materials w i l l t ake comfor t i n t h i s . However, one o t h e r
example should be cons idered . Dur ing the rou t ine a i r - leak tes t of a l a r g e
* C. F. T i f f a n y , F. A. P a l l , "An Approach t o t h e P r e d i c t i o n of P res su re Vessel Minimum Fa t igue L i f e Based Upon Applied Fracture Mechanics," Boeing Doc. D2-22437 (163) . Unl imi ted Dis t r ibu t ion . ASTM S p e c i a l Committee on F r a c t u r e Tes t ing of High S t rength Shee t Materials F i f th Repor t , Materials Research & Standards , Vol . 4 (3) , March 1964.
4

steel p r e s s u r e vessel, a c a t a s t r o p h i c b r i t t l e f a i l u r e o c c u r r e d a t a p r e s s u r e
of about 3 ,200 psig, even though the vessel previously had passed two hydro-
s ta t ic tests a t 7,500 ps ig . The p r e s s u r e vessel w a s i n the form o f a
sausage-shaped f lask. about 15-f t long with a 19-1/2-in. I D and a 1-1/4-in.
minimum w a l l t h i ckness ; it w a s manufactured i n accordance with ASTM Spec.
A372 Class 4 , modi f i ed t o a minimum y ie ld s t r eng th r equ i r emen t of 80,000 p s i .
I n v e s t i g a t i o n of t h e f a i l u r e r e v e a l - e d t h a t , f o l l o w i n g t h e h y d r o s t a t i c tests,
p r i o r t o l e a k test , the p ressure vesse l .had been ga lvanized twice, inc luding
a f i v e t o e i g h t h o u r w a r m - a c i d - s t r i p p i n g o p e r a t i o n p r i o r t o t h e s e c o n d
ga lvan ize . Hydrogen embr i t t l ement a r i s ing f rom the ac id s t r ipp ing w a s
s u s p e c t e d t o b e a f a c t o r c o n t r i b u t i n g t o t h e b r i t t l e f a i l u r e . S t a n d a r d
Charpy V-notch impact tests r e v e a l e d t h e 1 5 - f t - l b t r a n s i t i o n t o b e 1 0 0 ° F
and t h e FATT to be 125°F; the drop-weight NDT was approximately 80°F. Thus,
t h e b r i t t l e c . o n d i t i o n o f t h e s teel w a s confirmed by t h e h i g h t r a n s i t i o n
temperatures of t he p re s su re -vesse l material ( a l though t he material m e t a l l
requirements of t h e a p p l i c a b l e MTM s p e c i f i c a t i o n ) . N e v e r t h e l e s s , t h e f a i l u r e
w a s considered t o be unusual inasmuch as the p re s su re ves se l had success fu l ly
passed two cyc le s of proof test t o 7,500 ps ig and t hen f a i l ed a t 3 ,200 psig
i n a r o u t i n e a i r - l e a k ttst.
*
Pos i t ive a s su rance of t h e s t r u c t u r a l i n t e g r i t y of p re s su re
vessels depends upon determinat ion of (1) t h e i n i t i a l f l a w s i z e , ( 2 ) t h e
rate a t which pre-exis t ing f laws grow under operat ing condi t ions, and (3) the
maximum f l a w s i z e t h e material can t o l e ra t e unde r ope ra t ing cond i t ions .
B e f o r e p r o o f t e s t i n g ( o r l e a k t e s t i n g , as in t he p reced ing example ) , t he on ly
b a s i s f o r e s t i m a t i n g t h e i n i t i a l f l a w s i z e is a knowledge of t h e q u a l i t y -
con t ro l p rocedures employed dur ing fabr ica t ion . For example , i f X-ray is t h e
* R. C. Bates and H . D. Greenberg, “A Study of t h e F r a c t u r e R e s i s t a n c e o f S t e e l P r e s s u r e Vessels by Means of Charpy, Drop-Weight, and Full-Size Burst Tests,’’ AIME Met. SOC. Conf., Vol. 31, APPLICATION OF FRACTURE TOUGHNESS PARAMETERS TO STRUC’rlJRAL METALS, Edi ted by H . D. Greenberg, Chainnan of the Symposium Committee, Gordon and Breach S c i . Pub. N e w York, 1964.
5

is t h e n o n d e s t r u c t i v e i n s p e c t i o n me thod u sed , t hen t he l a rges t c r ack i n t he
p r e s s u r e vessel at t h e time of p roof t e s t ing migh t be e s t ima ted as being
2 pe rcen t of t h e t h i c k n e s s . I f t h e c r i t i ca l c r a c k s i z e a t the p roof p ressure
i s less than 2 percent o f the w a l l t h i c k n e s s , t h e n t h e p r e s s u r e v e s s e l may
f a i l d u r i n g proof tes t , (With acoust ic emission as a nondes t ruc t ive i n spec -
t i o n method employed during proof t es t , one shou ld be ab le t o de t ec t t he
growth of such a d e f e c t a t loads w e l l below the p roof p ressure and d i scont inue
t h e test b e f o r e f a i l u r e o c c u r s . ) I f t h e r e are n o c r a c k s i n t h e p r e s s u r e vessel
of c r i t i ca l s i z e a t Droof p re s su re , t hen one can estimate t h e l a r g e s t f l a w a t
t h e start of s e r v i c e t o b e no l a r g e r t h a n t h e c r i t i c a l c r a c k s i z e a t the proof
p re s su re . Th i s t hen i s t h e e s t i m a t e d i n i t i a l f l a w s i z e .
B . SCOPE OF THE RESEARCB
The o b j e c t i v e o f t h e r e s e a r c h r e p o r t e d h e r e was t o i n v e s t i g a t e t h e
c o r r e l a t i o n o f s t r e s s -wave-emiss ion cha rac t e r i s t i c s w i th f r ac tu re of aluminum
a l loys i n env i ronmen t s of pa r t i cu la r i n t e re s t fo r l i qu id - rocke t - eng ine t ankage .
Se lec t ed aluminum a l l o y s were i n v e s t i g a t e d , i n c l u d i n g 7075-T73, 2219-T87 and
2014-T6. The 2014-T6 a l l o y was T I G welded with 4043 and 2319 f i l l e r wire and
MIG welded with 4043. The materials were t e s t e d as smooth (unflawed) tension
specimens and as part-through-crack (PTC) tension specimens a t room and a t
c ryogenic t empera tures . In addi t ion , 18- in . -d ia subsca le p ressure vesse ls
were t e s t e d u s i n g a computerized SWAT sys t em fo r de t ec t ion and l o c a t i o n of
s t ress-wave sources .
6

11. SUMMARY Previous programs a t Aero je t have ex tens ive ly u t i l i zed t he stress-wave-
ana lys i s t echn ique (SWAT) as a crack-monitoring system a t room and e leva ted temp-
p e r a t u r e . One obse rva t ion common t o t h e earlier s t u d i e s , r e g a r d l e s s o f t h e
material i n v e s t i g a t e d , i s t h a t t h e s t r e s s - w a v e - e m i s s i o n s i g n a l s h a v e c h a r a c t e r i s t i c s
which serve t o i d e n t i f y p l a n e - s t r a i n i n s t a b i l i t y a n d p r e s a g e p l a n e - s t r e s s i n s t a b i l i t y .
The c h a r a c t e r i s t i c s which have been found t o s e r v e as a p recu r so r of f a i l u r e are
(1) a marked inc rease o f t he ampl i tude o f t he s igna l s as o b s e r v e d i n real time on
a n o s c i l l o s c o p e , (2) a marked i n c r e a s e i n t h e s i g n a l r e p e t i t i o n ra te (count per
second) and (3) a marked inc rease i n t he s lope o f t he cumula t ive coun t -ve r sus -
l o a d p l o t .
Koom-temperature data from PTC-tension tests i n t h e s t u d y r e D o r t e d h e r e i n
conf i rmed the usefu lness of t he above cha rac t e r i s t i c s and provided a p recu r so r
o f t he p l ane - s t r a in . i n s t ab i l i t y . However, t h e c h a r a c t e r i s t i c marked i n c r e a s e i n
acoust ic-emission count ra te observed a t room temperature w a s n o t g e n e r a l l y
observed in c ryogenic tes Ling PTC-tension specimens. Nevertheless, crack growth
was d e t e c t e d i n all o f the cryogenic tests and a t l oads su f f i c i en t ly be low c r i t i -
ca l stress intensi ty to permit unloadi-ng and confirmation by convent ional non-
d e s t r u c t i v e i n s p e c t i u n . H i g h l i g h t s o f t h e f i n d i n g s upon which these general
obse rva t ions were b a s e d a r e sununarized below.
"I" L g b o r a t x - T e n s i o n Tests. Acoustic-emission measurements in cryogenic
t e s t i n g were fomld to b e complicated by t h e fo l lowing f ac to r s :
1. bubbli.ng (bo-iling) o f the c ryopenic medium
2 . formation of i c e OTI t h e tool ing above and below t h e c r y o s t a t
3 . low s e n s i t i v i t y of t h e Model 2 2 4 2 acce lerometer used in low-
t empera tu re t e s t ing .
Solu t ion to these p roblems w a s o b t a i n e d i n t h e t e s t i n g o f t e n s i o n s p e c i m e n s b y
t h e u s e of 60 KHz t o 60(3 KHz band-pass f i l t e r i n g , m e t i c u l o u s care t o a v o i d t h e
formation of i ce around the cryostat , and the use of a Model 2213 acc le rometer
mounted on a wave guide ex tending ou t o f the c ryogenic . ba th .
Larger cumulat ive counts were obtained from unnotched tension specimens
than from part-through-crack tension specimens. The large count recorded f rom the
unnotched specimens occurred primarily as a p r e c u r s o r a t l o a d s c l o s e t o f a i l u r e .
The fo l lowing t abu la t ion summar izes t he r e su l t s of both the room-temperature
tests and the cryogenic-temperature tests where ice w a s el iminated and a model
2213 accelerometer w a s used mounted on a wave guide.
7

PRECURSOR I N NOTCHED AND UNNOTCHED TENSION TESTS
Thousands of Counts (b 1 Test Material Temp. Condition (a) Specimen
Unnotched 2014 RT BM Tension WM
WM
C 120
1,750 240
22 25
2219 RT BM
WM WM
13 145
1,000 61
28 27
20 14 -320 BM BM BM BM
WM
D E F G
36
35 70
140 120
300
2219 -320 BM BM BM BM
WM
H I J K
32
200 40 70 90
35
PTC- Tens ion
2014 RT BM m WM
2
3 21
60
330 200
2219 RT BM
WM WM
18
29 30
50 100
2014 -320°F BM BM
8 9
WM 26
Neg . (C) 2 219 -320°F BM
WM WM
19
31 32
(4 Neg 1 C) Neg .
""""""""""
(a ) BM, base-metal t e s t ; WM, weld-metal tes t . (b) increase in count occur r ing in the p recursor o f fa i lure . ( c ) no s i g n i f i c a n t i n c r e a s e i n c o u n t j u s t b e f o r e f a i l u r e .
3
From t he . above sumnlary, it w i l l b e 'seen t h a t a t room temperature .both the,
unnotched and the PTC-tension specimens gave usefui precursors(, bht a t cryogenic
t e m p e r a t u r e , t h e r e . . w a s l i t t l e o r no w a r n i n g o f f a i l u r e i n t h e p l a n e - s t r a i n (PTC)
t e n s i o n tests.
.. .
TWO ins t rumenta t ion cons ider .a t ions were found t o a f f e c t t h e room-
t e i p p e r a h u r e p r e c u r s o r , v i z . , t h e t r i g g e r l e v e l u s e d i n c o u n t i n g , and t h e scale
. fac tor used i n p lo t t i ng cumula t ive coun t ve r sus ' l oad . I f t he t r i gge r l eve l is
set. c l o s e t o t h e background noise , th is is e f f e c t i v e l y a n i n c r e a s e i n gain and
t h e p r e c u r s o f g i v e s a n e a r l y w a r n i n g o f f a i l u r e . I f a h i g h e r v o l t a g e t r i g g e r
s e t t i d g is used ( e f f ec t ive ly less ga in) , the warn ing comes j u s t b e f o r e ' f a i l u r e .
I f t h e &TY p l o t of count is recorded a t lo6 f u l l scale, t h e p r e c u r s o r may b6
somewhat inde terminant . With hi-gh s e n s i t i v i t y , a lo5 f u l l - s c a l e c o u n t s e t t i n g
f o r t h e X-Y, p lo t p rov ided t he bes t p recu r so r .
The l a c k o f p r e c u r s o r i n t h e PTC-tension tests a t c ryogen ic t empera tu re
p o i n t s up (1 ) t he advan tage o f p roo f t e s t ing t ankage a t room temperature where
l a r g e c o u n t s g e n e r a l l y p r e s a g e f a i l u r e and (2) t he need fo r a real-time acous t ic -
emis s ion t r i angu la t ion sys t em in c ryogen ic t e s t ing . In c ryogen ic t e s t ing , t he
compute r , u s ing t he t r i angu la t ion t echn ique , de t e rmines t he l oca t ion o f each
s igna l source , and , thus permi ts judgements based on mult iple emissions f rom a
s i n g l e s o u r c e . I n g e n e r a l , s i n g l e e v e n t s are disregarded but mult iple emission 's
from a s i n g l e l o c a t i o n serve as the p recu r so r o f f a i lu re a t c ryogen ic t empera tu re .
P res su re Vessel Tests. A t room tempera ture the p ressure-vesse l tests
demonst ra ted tha t acous t ic emiss ion moni tor ing can be employed t o d e t e c t and
l o c a t e growing defec ts in the aluminum a l l o y s tested, .and p r o v i d e s t h e b a s i s f o r
te rmina t ing a p res su re test p r i o r t o f a i l u r e . A marked i n c r e a s e i n b o t h t h e
count rate and stress-wave ampl i tude (as observed on an osc i l loscope in real
t ime) served as p r e c u r s o r s o f f a i l u r e . The ex i s t ence o f t he Ka i se r e f f ec t du r ing
s t r u c t u r a l l o a d i n g a l s o w a s v e r i f i e d i n t h e room temperature tests; i .e . , s i g -
n i f i c a n t SWE a c t i v i t y w a s n o t o b s e r v e d i n s u c c e s s i v e c y c l e s u n t i l p r d o r p r e s s u r e
l e v e l s were exceeded. However, when d e f e c t s ( o r d e l i b e r a t e f l a w s ) were a t t h e
o n s e t o f i n s t a b i l i t y , t h e Kaiser e f f e c t no longer was o p e r a t i v e . P r a c t i c a l
a p p l i c a t i o n o f t h e Kaiser e f f e c t lies i n i t s u s e t o d e t e r m i n e p r i o r maximum
p r e s s u r e ( s t r e s s ) levels.
9

I-
At cryogenic t empera ture the p ressure-vesse l tests again demonstrated
t h e c a p a b i l i t y t o d e t e c t and loca te s t ress -wave-emiss ion sources in real t i m e .
f i r e o v e r , i n s p i t e o f t h e low s e n s i t i v i t y of t h e t r a n s d u c e r u s e d i n c r y o g e n i c
t e s t i n g , i t was st i l l p o s s i b l e t o d e t e c t a n d a p p r o x i m a t e l y l o c a t e t h e f a i l u r e
o r i g i n i n e a c h vessel. Mul t ip l e emis s ions f rom we ld de fec t s and /o r de l ibe ra t e
flaws served t o i n d l c a t e i n c i p i e n t f a i l u r e .
I n t h e 2219-T87 cryogenic t e s t , t h e e r r o r i n d e f e c t s o u r c e l o c a t i o n
based on s igna l t r i angu la t ion w a s approximately 4 inches; a similar e r r o r
( 1 t o 3 - i n . ) i n s o u r c e l o c a t i o n w a s observed i n t h e room-temperature tes t of
t h e same material. During each pressure-vessel test , mul t ip le emiss ions were
observed f rom the defect area w h i c h i n d i c a t e d p o t e n t i a l f a i l u r e . I n s p i t e o f
t h e e r r o r , t h e i n d i c a t e d s o u r c e was within the zone which would have to be
u l t imate ly inspec ted us ing convent iona l NDT methods t o e s t a b l i s h t h e s i z e ,
o r i e n t a t f o n and l o c a t i o n of t he sou rce de fec t .
A comparison of the performance of the 2219 and t h e 2014 p r e s s u r e vessels
' i n d l c a t e d t h a t t h e 2219 a l l o y w a s much s u p e r i o r t o t h e 2014 a l loy bo th a t
room temperature and -320°F. A t both temperatures , the 2219 chambers b u r s t a t
hoop stresses approx ima t ing t he un iax ia l u l t ima te s t r eng th level; whereas, a t
cryogenic temperature the 2014 a l l o y b u r s t a t a hoop stress s i g n i f i c a n t l y below
t h e u l t i m a t e s t r e n g t h . The poor performance of t he 2014 a l l o y may have been
a t least i n p a r t t h e r e s u l t of 2014 welding problems which required extensive
weld repair t o remove weld p o r o s i t y and cracking i n t h e 2014 material. However,
from an acoustic-emission-monitoring s t a n d p o i n t , i . e . , t h e a b i l i t y t o d e t e c t and
locate f law propagat ion, there appeared to be no difference between the two a l l o y s .
10

111. TEST PROCEDURE
A. MATERIALS
The aluminum a l loys eva lua ted dur ing th i s p rogram inc luded
2014-T651, 2219-T87 and 7075-T73. The nominal chemical compositions of these
materials are shown i n T a b l e 1:. The 7075-T73 a l l o y was procurred from a
commercial source (Reynolds Metals Co.) wh i l e t he 2014 and 2219 a l loys were
supp l i ed by NASA-MSFC.
The p a r e n t metal ' sile a n d m e t a l l u r g i c a l p r o p e r t i e s are shown
in Table I1 and F igures 1 through 3 , respec t ive ly . Both the t ens i le and
m e t a l l u r g i c a l p r o p e r t i e s a re considered t y p i c a l of the materials t e s t e d . The
mic ros t ruc tu res i nd ica t e va ry ing deg rees of res idua l co ld working and a l so
c o n t a i n r e l a t i v e l y la rge amounts of non-metal l ic inclusions. The micro-
s t r u c t u r e s shown i n F i g u r e s 1 through 3 are r e p r e s e n t a t i v e of t h e materials
employed t o f a b r i c a t e b o t h t h e t e n s i l e s p e c i m e n s and t h e s u b s c a l e p r e s s u r e
vessels.
Welding was performed using both 2319 and 4043 f i l l e r wires. The
nominal compositions of t h e s e materials are shown i n T a b l e 111. Both a l loys
were used i n f a b r i c a t i n g t e n s i l e s p e c i m e n s w h i l e t h e s u b s c a l e p r e s s u r e v e s s e l s
were welded only with the 2319 a l l o y .
B. FABRICATION OF TEST SPECIMEXS
1. " Uniaxial Tensile Specimens
Table I V shows t h e test p l a n f o r t h e u n i a x i a l t e n s i l e
program. Various specimen configurations were employed as d i scussed i n
subsequent sec t ions of t h i s r e p o r t .

TABLE I
NOMINAL CHEMICAL COMPOSITION OF ALUMIN” PLATE MATERIALS EVALUATED
Element
S i l i c o n
Iron
Copper
Manganese
Magnesium
Ch romi um
Zinc
Titanium
Zirconium
Aluminum
Alloy Type 2014 2219 7075 - -
0.50 - 1.2 1.0
3.9 - 5.0
0.40 - 1.2 0.20 - 0.80
0.10
0.25
0.15
Bal .
0.20
0.30
5.8 - 6.8 0.20 - 0.40
0.20
-
- 0.02 - 0.10
0.10 - 0 .25
Bal .
0.50
0.7
1.2 - 2.0
0.30
2 . 1 - 2 . 9
0.18 - 0.40 5.1 - 6.1
0.20
- Bal .
1 2

Alloy
2014-T6
2219-T87
7075-T73
TABLE I1
PARENT METAL TENSILE PROPERTIES ('1 -- a - --------- - ----
Specimen No.
4-12 4-11
19-2 19-1
7 3-1 7 3-2
Ultimate Strength (ks i )
70.5 70.1 -
Avg 70.3
68.3 67.8 -
Avg 68.1
73.8 65.5 -
A% 69.7
0.2% Offset Yield Strength (ks i )
62.6 62.8
62.7 -
56.4 56.1
56.3 -
67.0 60.0
63.5 -
(1) All specimens oriented parallel to the direction of plate rolling.
13
"
TABLE I11
NOMINAL COMPOSITION OF ALUMINUM FILLER MATERIALS
Element
S i l i c o n
I ron
Copper
Manganese
Magnesium
Zinc
Titanium
Zirconium
Vanadium
Aluminum
A l l o y T y p e 2 319 4043
0.20
0.30
5.8 - 6.8
0.20 - 0.40
0.20
0.10
0.10 - 0.20
0.10 - 0.25
0.05 - 0.15
Bal.
4.5 - 6.0
0.8
0 .03
0.05
0.05
0.10
0.20
-
Bal.
14

F 1 aw
PTC*
PTC
None
PTC
PTC
PTC
None
PTC
PTC
None
SEN
Specimen Thickness T e s t
( i n . ) Temp.
0.180
0.300
0.300
0.500
0.180
0.300
0.300
0.500
0.300
0.300
0.300
75 OF
75°F
75°F
75°F
-320'F
-320'F
-320°F
-320°F
-423°F
-423°F
75°F
TABLE I V
SUMMARY OF TEST SPECIMENS
7075- 2014-T6 2219-T87 T73
DC TIG Weld MIG Weld ~
4043 2319 4043 ~ ~~ "_
P a r e n t F i l l e r F i l l e r F i l l e r P a r e n t P a r e n t
X x X X X X X X
X X X X X X
X X
X X
X X
X X
X X
X X
X X
X
X
X
"""-""""" *Fat igue precracked par t - through-crack tensi le specimen.
**Fatigue precracked single-edge-notch-tensile specimen.
15
X x X X
X
x X
X

The p a r e n t metal specimens were obta ined wi th the longi tu-
d i n a l axis o r i e n t e d p a r a l l e l t o t h e p l a t e r o l l i n g d i r e c t i o n a n d t e s t e d i n t h e
as-received (-T73, -T87, o r -T651) condition. Both 0.3 and 0.5-in. t h i c k
materials were supplied; 0.18-in. thick specimens were machined from
t h e 0.3-in. thick material by removing s tock equal ly f rom both s ides of
t h e p l a t e . No s u r f a c e p r e p a r a t i o n was r e q u i r e d f o r t h e 0 . 3 and 0.5-in.
thick specimens.
Table V shows the welding parameters used i n f a b r i c a t i n g
the weld tensile specimens. Both tungsten-inertAgas (TIG) and metallic-
ine r t -gas (MIG) welding processes were employed. Welding head o s c i l l a t i o n
(TIG welding process) was employed t o make the s econd ( f i l l e r ) we ld pas s ;
a l l weldments were t e s t e d i n t h e as-welded condi t ion with the re inforcement
removed p r i o r t o t e s t i n g .
F igu res 4 through 6 show t y p i c a l weldment macrosections.
The c h a r a c t e r i s t i c s of these macrosect ions vary, depending on the number of
w e l d i n g p a s s e s , f i l l e r metal and weld process employed. A l l weldments were
dye penetrant and X-ray inspected. No c racks were detected; however,
s c a t t e r e d f i n e p o r o s i t y w a s observed i n most of t h e weldments produced. Some
s c a t t e r e d l a r g e p o r o s i t y w a s a l s o o b s e r v e d i n t h e TIG weldments i n t h e
0.18-in. t h i c k p l a t e , a l t h o u g h t h e l a r g e r p o r o s i t y was not genera l ly observed
i n t h e weldment areas from which the test specimens were obtained. The
po ros i ty de t ec t ed t h rough nondes t ruc t ive i n spec t ion is e v i d e n t i n t h e macro-
s e c t i o n s shown i n F igures 4 through 6; i n o t h e r r e s p e c t s , t h e m a c r o s t r u c t u r e
is c o n s i d e r e d t y p i c a l f o r t h e s e materials and weld processes.
2. Subsca le Pressure Vessels
Subsca le p ressure vessels were f a b r i c a t e d u s i n g b o t h t h e
2014 and 2219 aluminum a l l o y s . The vessel c o n f i g u r a t i o n is shown i n F i g u r e 7
whi le Table V I s chemat i ca l ly shows t h e f a b r i c a t i o n s e q u e n c e employed f o r

TABLE V
TYPICAL WELDING PARAMETERS USED I N PREPARING TENSILE SPECIMEN WELDMENTS
DC-TIG MIG - 0.312
Weld Process
Nominal Thickness, (in.)
F i l l e r Metal
Joint Design
0.18
4043
Butt
- - 16 5
9.5
8
12.5
1/16
50
95% 5%
0.312*
4043
Single "V"
60'
0.050/0.060
170
9.5/9.7
8
0.312*
2 319
Single 'IV"
60'
0.5*
4043 4043
Double "V"
S ingle 1'v"
60° 60' Included Angle
Root Land, ( in . ) 0.050/0.060
170
9.5/9.7
8
0.050/0.060 0.050/0.060
120 b p s
Volts
240
9.5
5
32
10 Head Travel Speed ( in . /min)
40/60
1/16
50
95% 5%
40/60
1/16
50
95% 5%
Wire Feed ( in . /min) 2 15
Wire d ia , ( i n . ) 1/ 16 1/16
Gas (cfm)
Helium Argon
50 50
95% 5%
95% 5%
*Weld Head Osc i l l a to r u sed on 2nd weld pass of 0.3-in. t h i c k and both passes on 0.5-in. thick material.
17

HEADS 2014 A1
T451 CONDITION
2219 A1
T-37 CONDITION
CY LlNDER 2014 A1
T-651 CONDITION
2219’Al
T.37 CONDITION
Shear Spin
Age to T651 Condition (10 hrs at 340OF)
Machine Outer Diameter
Prepare Girth Weld (Single “V”, 3Oov bevel - 0.06 in. land)
Dr i l l and Tap ANPT Fitt ing (314 in.- 14)
Shear Spin
Age to T87 Condition (24 hrs at 325OF)
Machine Outer Diameter
Prepare Girth Weld (Single “V”, 30Obeve - 0.06 in. land)
Dri I I and Tap ANPT Fi t t ing (3/4 in. - 14)
Roll Form
Prepare Long. Weld (Single “V”, 30’ bevel - 0.06 in. land)
Prepare Girth Weld (Single “V”, 30’ bevel - 0.06 in. land)
Weld Longitudinal Joint (TI(;-2319 Fi l ler Wire)
Inspect (X-Ray Dye Penetrant)
Trim Length
Prepare Girth Weld (Single ‘“4’; 30Obevel - 0.06 in. land)
Weld Girth Joints TIG - 2319 Wire)
Inspect Girth Welds
(X Ray, Dye Penetrant)
Roll Form
Prepare Long. Weld (Single “V”, 3OObevel - 0.06 in. land)
Prepare Girth b l d (Single “V”, 30Obevel - 0.06 in. land)
Age to T87 Condition (24 hrs at 325 OF)
Weld Longitudinal Joint (TIG - 2319 Wire)
Inspect (Dye Penetrant, X-Ray)
Trim Length
Prepare Girth Weld (Single “V”, 30Obevel - 0.06 in. land)
Table V I . Fabricat ion Sequence Used i n P rocess ing t he Subsca le P re s su re Vessels

each material. Both aluminum a l l o y s were TIG welded using 2319 f i l ler wire.
The cy l inde r - sec t ion l ong i tud ina l t7el.d was produced us ing head osc i l la t ion
(2nd f i l l e r p a s s ) w h i l e t h e g i r t h w e l d s were not. The welding parameters
are shotm i n T a b l e VI1 (0;3 i n . t h i c k p l a t e a n d 2319 f i l l e r wire). A l l
chambers sere t e s t e d i n t h e as-welded condition; the weld reinforcement
was n o t removed.
A s i n d i c a t e d i n T a b l e V I , a l l vessel welds (both gir th and
l o n g i t u d i n a l ) were dye pene t ran t and X-ray in spec ted . In gene ra l , the
2219 vessels requ i r ed min ima l r epa i r and u s u a l l y o n l y f o r r e m o v a l o f s c a t t e r e d
poros i ty . Converse ly , the 2014 a l l o y vessels r equ i r ed ex tens ive we ld r epa i r
for removal of excess ive poros i ty , non-meta l l ic o r t u n g s t e n i n c l u s i o n s a n d
c racks . Most of t h e d e f e c t s , i n c l u d i n g a l l o f t he c r acks , were removed dur ing
r e p a i r of t h e 2014 vessels. However, as i n d i c a t e d i n s u b s e q u e n t s e c t i o n s o f
t h i s r e p o r t , some p o r o s i t y a n d t u n g s t e n i n c l u s i o n s were n o t removed and were
found to be sources of SWE; ' t ungs t en i nc lus ions r ema in ing i n t he l ong i tud ina l
weld of the 2014 v e s s e l t e s t e d a t room temperature were found t o b e t h e o r i g i n
of f a i l u r e .
C. TEST SPECIMEXS AND FRACTURE TESTING
1. Specimen Configuration and Test Procedure
Smooth (unf lawed) and part-through-crack tension specimens
were t e s t e d of each a l loy . The part-through-crack (PTC) tension specimen
was o r i g i n a l l y d e v e l o p e d f o r t h e p u r p o s e o f s i m u l a t i n g f l a w s o f t h e t y p e
f r e q u e n t l y e n c o u n t e r e d i n service. PTC-tension specimens are sometimes used
t o o b t a i n i n f o r m a t i o n o n t h e e f f e c t s o f realist ic f l aws i n terms of f r a c t u r e
s t r e n g t h v e r s u s crack d e p t h o r area; t h e test a l s o is used t o o b t a i n p l a n e -
s t r a in f r ac tu re - toughness da t a (K >. Figures 8 and 9 show the specimen
designs used. The PTC tests were performed i n two major series. I n i t i a l l y ,
t ransverse weld t ens i le spec imens (F igure 8) were t e s t ed fo l lowed by a
second series of specimens incorporat ing a longi tudina l weld (F igure 9 ) .
I C
19

TABLE V I 1
TYPICAL WELDING PARAMETERS
USED I N WELDING SUBSCALE PRESSURE VESSELS
Weld Process
Nominal Thickness
F i l l e r Metal
Jo in t Des ign
Included Angle.
Root Land
Amps
Vo l t s
Head Travel Speed
Wire Feed
Wire Dia.
Gas
Helium
Argon
TIG
0.312 i n .
2319
Sing le "V"
60 O
0.060 i n .
175
9.5
8 i n . /min.
50-65 in./min.
1/16 i n .
50 cfm
75
25
*
*Weld Head Osc i l l a to r u sed on 2nd weld pass of vessel longi tudina l weld .
20

This p rocedure w a s employed t o e v a l u a t e e f f e c t s o f h i g h l o c a l i z e d s t r a i n
( t ransverse weld) vs l o w e r f r a c t u r e s t r a i n ( l o n g i t u d i n a l l y w e l d e d ) o n t h e
s t ress -wave-emiss ion weld- f rac ture charac te r i s t lcs . Note tha t two specimen
s i z e s were used i n c ryogen ic t e s t ing ; a t -423OF, because of c r y o s t a t s p a c e
l i m i t a t i o n s , a smaller specimen w a s t e s t e d (1.5-in. gage width by 11-in. long).
Two loading systems were used i n t h e program: (1) a Ualdwin-
Tate-Emery 60,000-lb hydraul ic tes t ing machine and ( 2 ) a 50,000-lb Research
Incorpora ted Material T e s t System. I n i t i a l l y , t h e s p e c i m e n s were i n s t r u -
mented with two pos t -y ie ld s t ra in gages . I f there had been spec imen mis-
a l i g n m e n t i n t h e t e n s i l e m a c h i n e , t h e o u t p u t o f t h e two gages on an X-Y
r eco rde r would have shown bending. When i t was conf i rmed tha t there w a s no
s ign i f i can t bend ing , a s i n g l e a x i a l s t r a i n g a g e w a s used i n t h e r e m a i n d e r of
t h e program.
The i n i t i a l tests of unflawed specimens produced a h igh
r a t e of stress-wave emission a t very low load . F igure 1 0 is a p l o t of both
stress v e r s u s s t r a i n as measu red by an ax ia l e l ec t r i c - r e s i s t ance s t r a in gage ,
and acoust ic-emission count r a t e v e r s u s s t r a i n . N o t e t h e h i g h i n i t i a l stress-
wave count ra te followed by a s h o r t p e r i o d of r e l a t i v e i n a c t i v i t y a n d t h e n
a r i s i n g c o u n t r a t e j u s t be fo re f a i lu re . Expe r imen ta t ion showed t h a t t h e
h i g h i n i t i a l SWE counts were due t o de fo rma t ion a t the specimen pin holes and
i f t h e p i n h o l e s were p re loaded i n compress ion i n t he manner shown i n F i g u r e 11,
t h e i n i t i a l l y h i g h c o u n t r a t e was subs t an t i a l . l y r educed o r e l imina ted . A l l
of the subsequent tension specimens were p r e l o a d e d i n t h i s manner. Note t h a t
w i th t h i s t ype o f p re load ing , t he p rec racked s ec t ion w a s u n s t r a i n e d i n t h e
pre loading opera t ion .
2. Fracture Mechanics Considerat ions
F r a c t u r e t e s t i n g w a s done with a PTC-tension specimen. The
PTC s u r f a c e f l a w s were s t a r t e d f r o m a n e l e c t r i c - d i s c h a r g e - m a c h i n e d s l o t i n
one su r f ace of t h e test specimen. The s l o t s were tl len extended by tens ion-
t e n s i o n b e n d i n g f a t i g u e i n a Burke mi l l ing machine conver ted for th i s use .

The specimen was loaded as a c a n t i l e v e r beam. By use of d i f f e r e n t i n i t i a l
s l o t c o n f i g u r a t i o n s a n d s i z e s , d i f f e r e n t f l a w shapes (a /2c) and s izes were
produced for tes t ing. Al though the PTC-tension specimen is n o t recommended
by ASTM Committee ‘E-24, i t i s used by many i n v e s t i g a t o r s f o r d e t e r m i n i n g
The p l ane - s t r a in va lue of f r ac tu re t oughness is gene ra l ly
considered a more fundamenta l un i t of f r ac tu re t oughness t han t he p l ane -
stress va lue because , w i th in ce r t a in limits of c rack and specimen s ize , it
is independent of specimen dimensions. Furthermore, p lane-st rain f racture
toughness is concerned with the most dangerous type of f l a w ; v i z , a f law
which i n i t i a t e s c a t a s t r o p h i c f r a c t u r e b e f o r e g r o w i n g t h r o u g h t h e t h i c k n e s s .
With such a f l a w , b o t h i n i t i a l g r o w t h a n d i n s t a b i l i t y are c o n t r o l l e d by t h e
p l ane - s t r a in f r ac tu re t oughness , K I c
The e x p r e s s i o n u s e d f o r c a l c u l a t i n g t h e p l a n e - s t r a i n f r a c t u r e
toughness value w a s :
where FG = g r o s s stress and @ i s t h e commonly t a b u l a t e d e l l i p t i c i n t e g r a l
(1 - k s i n 0 ) 2 2 1 / 2 de
where k = l-(AO/C)’, and C and A0 are one half the major and minor axes,
respec t ive ly , o f an e l l ipse . Wi th a p l a s t i c - z o n e c o r r e c t i o n , t h e e q u a t i o n
becomes
where FTY is t h e 0 . 2 p e r c e n t o f f s e t y i e l d s t r e n g t h .
22

I f t h e e l l i p t i c - i n t e g r a l f u n c t i o n a n d p l a s t i c - z o n e c o r r e c t i o n are rep resen ted
by 0, t h e e q u a t i o n becomes
2 KIc
F igure 1 2 is a p l o t of
depth- to- length ra t ios
= 1.217rAO-FG /Q 2 (Eq 1)
the f law shape parameter Q as a f u n c t i o n of f law
(A0/2C) f o r v a r i o u s f r a c t u r e stress levels.
The c r i te r ia u s e d f o r a s s e s s i n g t h e v a l i d i t y of t h e K I C
measurements were as fol lows: (a) g r o s s f a i l u r e stress should not exceed
t h e y i e l d s t r e n g t h (FG/FTY < 1) and (b) the crack depth should not exceed
50% of the specimen thickness (AO/B - < 0 . 5 ) .
Paris and Si l l " have art app rox ima te so lu t ion fo r a serni-
e l l i p t i c a l s u r f a c e c r a c k . T h i s a p p r o x i m a t i o n g i v e s t h e stress i n t e n s i t y
a t tlle rntl o t tlle semi-minor a x i s (AO). Par is nnd S i l l estimate tile accuracy
of t l le above c q u a ~ i o n t o b e w i t h i n a b o u t - +5% f o r h 0 / 2 C from 0.5 t o 0.05 and f o r
AO/li from zero to 0.5. For AO/U up t o a b o u t 0 . 7 5 , tile accuracy i s s t i l l
probnb Ly Letter t l lan - +lo%.
In u s ing t he so lu t ion o f Paris and Sih, l r t h e c r a c k - t i p
plast ic-zone subtends a ma jo r po r t ion ( s ay ha l f ) of t h e d i s t a n c e between t h e
crack f ront and the back of t h e test specimen, the use of the equat ion i s
doub t fu l . I n t h i s connec t ion , i t should be noted that the crack-Kip plast ic-
zone extends much fu r the r ahead of t h e c r a c k as i t approaches the back surface
than i t does near mid th ickness ; t he f r ee - su r face e f f ec t ex t ends i n to t he
th i ckness of the spec imen for a dis tance which is p r o p o r t i o n a l t o (K /FI'Y) . 2 I C
* P a r i s , P. C. and Sih, G. C. , "Stress Analysis of Cracks" ASTM S p e c i a l Techn ica l Pub l i ca t ion (STP) 381, pp.30-33, April 1965.
33

Thus, when t h e t h i c k n e s s a n d / o r t h e c r a c k d e p t h is less than some c r i t i c a l
v a l u e that is p r o p o r t i o n a l t o (K /FTY) , t h e c o n s t r a i n t - r e l i e v i n g i n f l u e n c e
of t h e f r e e s u r f a c e s w i l l r e s u l t i n f i c t i t i o u s K measurements. On t h e
b a s i s of these observa t ions , i3rown and Srawley have suggested another
c r i t e r i o n f o r v a l i d K measurements, v i z , t h a t t h e c r a c k d e p t h s h o u l d e x c e e d
2.5 (KIc/FTY) in. , where FTY is t h e 0.2% o f f s e t y i e l d s t r e n g t h .
2 I C
I C
2 I C
F igu re 13 compares the I rwin and Par i s approximat ions ; for
a l l p r a c t i c a l p u r p o s e s t h e two gave t h e same value of KIc. I n t h i s s t u d y ,
t h e t h i c k n e s s of t h e material under test w a s sometimes less than 1.0
(KIc/FTY) and almost always less than 2.5 (K /FTY) . For example? with a
f r a c t u r e t o u g h n e s s of t h e o r d e r of 30 ksi-in.1/2 and a y i e l d s t r e n g t h of
60 k s i a t room temperature .
2 I C
(KIC/FTY)* = Oi250 i n .
2.5 (KIc/FTY)2 = 0.625 i n .
and f o r a yPe ld s t r eng th of 7 0 k s i a t -320°F
(K,c/FTy)2 = 0.184 i n .
2.5 (KIc/FIY) = 0.459 i n . 2
a n d f o r a y i e l d s t r e n g t h of 30 k s i a t -423°F
(KIc/FTY) = 0.141 in . 2
2.5 (KIc/FTY)L = 0.352 i n .
Thus, according t o the 2 .5 (K /FTY) c r i t e r i o n , f e w of the d a t a are v a l i d , 2
I C
and yet from Figure 1 4 , i t will b e s e e n t h a t t h e c a l c u l a t e d v a l u e s of I<
were remarkably constant when p l o t t e d as a func t ion o f (1) normalized crack
depth, a/Q, ( 2 ) crack-depth-to-thickness, AO/B, r a t i o a n d ( 3 ) crack-depth-
t o l e n g t h , A0/2C, r a t i o . Moreover, when t h e tests were inva l ida ted by too
deep a c rack ( A / B > 0.5) and/or when t h e g r o s s stress exceeded the yield
I C
24

s t r e n g t h (FG/FTY > l . .O) , as shown i n Figure 14, t h e r e w a s l i t t l e o r no
d i f f e r e n c e betweefl t h e v a l i d and'' " i n v a l i d . " . ~ ~ ~ t " r ' ~ ~ l t s .
3. Acoustic-Emission Instrumentation fo r ' Tension Test ing
The bas ic ins t rumenta t ion sys tem used in Phase 1 of the
inves t iga t ion ( t ransverse ly welded spec imens) is shown schemat ica l ly i n
Figure 15. The system consisted of (1) an Endevco p i ezoe lec t r i c acce l e romete r ,
(2) voxtage ampl i f ica t ion , (3) f i l t e r i n g , ( 4 ) an o sc i l l o scope , (5) t a p e
r eco rde r , (8) elekt-ronic councer-pr inter , ant1 ( 7 ) X-Y p l o t t e r . With t h i s
system, a real-time d a t a d i s p l a y w a s obtained on both X-Y p l o t t e r s and an
osc i l l o scope , wh i l e a l l d a t a were taped for record purposes . To compensate
f o r t h e c h a n g e i n t r a n s d u c e r s e n s i t i v i t y a t t h e r e s p e c t i v e t e s t i n g temperatures,
the tape-recorded data were played back a t a c o n s t a n t S U - s y s t e m s e n s i t i v i t y
( t r i g g e r i n g l e v e l ) f o r a given temperature of test, a n d f o r d i f f e r e n t
temperatures of tes t , an adjustment w a s made i n t h e p l a y b a c k t r i g g e r i n g l e v e l .
In Phase 1 of t h e i n v e s t i g a t i o n ( t r a n s v e r s e l y welded test
specimens), a Hewlet t -Packard e lectronic-counter and s t r ip-chart-pr intout
s y s t e m was used; whereas , in Phase 2 ( l o n g i t u d i n a l l y welded specimens) a
Dunegan t o t a l i z e r w a s used. In Phase 1, t h e g a i n was cons tan t , and the
t r i g g e r l e v e l w a s adjusted to the background noise . The ga in f o r t h e s y s t e m
shown i n F i g u r e 15, then, w a s f i x e d a t 100 db. I n t h e Dunegan sys t em, on
t h e o t h e r h a n d , t h e t r i g g e r l e v e l w a s cons t an t a t 0.707 v o l t R I G (1 v o l t
pk-to-pk) and the gain w a s ad jus t ed so tha t the background no ise w a s increased
to t he t r i gge r l eve l . I n bo th phases , t he bas i c - sys t em ga in was 100 db; with
t h e Dunegan s y s t e m , t h e s e t - p o i n t a d j u s t m e n t r e s u l t e d i n a g a i n v a r i a t i o n o f
100 db p l u s o r minus 10 db. The Dunegan system w a s s e l e c t e d f o r t h e phase-2
inves t iga t ion because o f the convenience and eff ic iency of real-time record-
i ng on an X-Y p l o t t e r .
25

The method used during this prosram f o r deve loping the
t o t a l number of s t ress -wave emiss ions (cumula t ive count ) in rea l i ty p roduces
a value weighted by SWE amplitude, specimen and sensor geometries. This
method w a s used because of the complexi ty of a data-reduction system which
produces one aud only one count for each burst- type stress wave, as compared
t o t h e s i m p l i c i t y of c o u n t i n g e a c h s i g n a l e x c u r s i o n a b o v e t h e n o i s e l e v e l
as a n i n d i v i d u a l stress wave. Large-amplitude burst-type stress waves wi th
typ ica l sensor (and/or spec imen) resonant decay provide many c o u n t s r a t h e r
t h a n j u s t a s ing le coun t . I n o the r words , i n genera l , the l a rger -ampl i tude
burs t - type stress wave wi th i t s longer ring-down time provides a l a r g e r
number of SWE coun t s t han does a smaller-amplitude burst-type stress wave.
Pr imar i ly because of t h i s f a c t , t h e c u m u l a t i v e - t o t a l c o u n t o b t a i n e d i n this
prQgram is we igh ted by t he r e l a t ive ampliCude of the stress waves and is
p o s s i b l y more n e a r l y a measure of t h e r e l e a s e d e n e r g y t h a n a measure of t he
number of bursfi-type stress-wave emissions.
F igures 16 and 17 and the fo l lowing tabula t ion i l l u s t r a t e
t h e e f f e c t of SWAT-system t r i g g e r - l e v e l s e t t i n g on t h e p l o t of cumulat ive
c o u n t v e r s u s l o a d . N o t e t h a t i n t h e c a s e o f 7075-T73 pa ren t metal t e s t e d
a t -320"F, the cumulat ive count increased markedly as t h e t r i g g e r i n g l e v e l
w a s set increas ingly c lose to the background-noise l eve l .
Specimen Test Tr igge r Level, Cumulative J o . Temperature, OF vo,lts. Count
7 3-3 -323 0.35 25,000
0.2-5 52,500
0.18 145,000
L ikewise , i n t he ca se of 2014-T6 TIG welded with 4043 f i l l e r w i r e ,
26

Specimen T e s t Tr igger Level, No. Temperature, OF v o l t s
PT43-10 -423 0.26 0.07
-20 -423 0.26 0.07
-30 -423 0.26 0.07
Cumulative Count
550,000 1,115,000
420,000 710,000
435,000 820,000
the cumula t ive count increased markedly wi th decreas ing t r lgger ing vo l tage .
This is t h e r e s u l t of t h e i n c r e a s e d SWAT-system s e n s i t i v i t y p r o v i d e d by t h e
lower t r i gge r ing level and t h e p r o g r e s s i v e l y smaller ampli tude of stress-
wave emiss lons t ha t are de tec t ed as t h e s y s t e m s e n s i t i v i t y i s increased .
D. BYDROTEST PROCEDURE AND INSTRUMENTATION FOR SUBSCALE PRESSURE VESSELS
1. Details of Hydrotest Procedure
The nominal hydrotest procedure which w a s employed i n t e s t i n g
both a t room temperature and cryogenic temperature is shown below; v a r i a t i o n s
i n t h i s p r o c e d u r e , i f employed, are i n d i c a t e d i n d i s c u s s i o n s of 'the r e s u l t s
obtained with each vessel.
1st Cycle - p r e s s u r i z e d t o 50% of FTY without a part-througll-
c r ack (PTC), held a t maximum p r e s s u r e f o r
30 seconds and then depressurized.
2nd Cycle - pres su r i zed t o 75% of FTY without a PTC, he ld
a t maximum p r e s s u r e f o r 30 seconds and then
depressur ized .
I
3rd Cycle - p r e s s u r i z e d t o 90% of FTY wi thout a PTC, he ld a t
maximum p r e s s u r e f o r 30 seconds and then depressurized.

If the chamber did not f a i l du r ing t he above p re s su r i za t ions ,
a - P X f l a w w a s incroduced and the t h r e e s t e p s were r e p e a t e d i n t h e i n d i c a t e d
o rde r . I f f a i l u r e d i d n o t o c c u r d u r i n g t h e s i x t h p r e s s u r i z a t i o n , t h e chamber
p r e s s u r e w a s i n c r e a s e d u n t i l f a i l u r e o c c u r r e d . The PTC t y p e s e m i - e l l i p t i c a l
d e f e c t w a s in t roduced i n the c e n t e r of t h e l o n g i t u d i n a l weld using a 1-1/2-in.
diameter x 0.020 i n . t h i c k g r i n d i n g wheel. The l o n g i t u d i n a l a x i s o f t h e f l a w
was o r i e n t e d p a r a l l e l t o t h e vessel longi tudina l ax is . Vary ing PTC l e n g t h s
and depths were employed depending on t h e v e s s e l b e i n g t e s t e d ; t h e a c t u a l
depth ana l ength is i n d i c a t e d i n d i s c u s s i o n or each vessel t e s t e d .
The room-temperature tests were conducted using uninhibi ted
water as t h e f i l l e r and gaseous n i t rogen as t i le pressurizing media . T h e
p re s su r i zed gas w a s obtained through a cumulator from severa l banks of
gaseous n i t rogen . F igure 18 shows t h e 2014-T6 aluminum p r e s s u r e v e s s e l p r i o r
t o t e s t i n g 2nd i s t y p i c a l of t h e tes t set-up employed f o r b o t h room and -320°F
t e s t i n g . A nominal p ressur iza t ion ra te of 100 ps i /min w a s employed f o r t h e
room temperarure tes ts a l t h o u g h t h i s w a s a l s o v a r i e d as ind ica t ed i n subsequen t
d i scuss ions . A s i n g l e s t r a i n g a g e (Type SR-4) w a s mounted i n t h e p a r e n t metal
area a d j a c e n t t o the longi tudina l weld a t the cen te r o f each vessel t e s t e d a t
room temperature and w a s employed i n c o n j u n c t i o n w i t h p r e s s u r e g a g e s t o m o n i t o r
and con t ro l bo th t he p re s su re level and p re s su r i za t ion ra te .
The zryogenic tests a t -320°F were conducted using l iquid
n i t r o g e n a s t h e t es t media. The chambers were i n i t i a l l y f i l l e d w i t h f i n e
sawdust i n o rde r t o r educe t he vo lume of l i q u i d n i t r o g e n r e q u i r e d f o r chamber
f i l l and thus reduce the energy release occur r ing upon chamber f a i l u r e .
P r e s s u r i z a t i o n w a s accomplished using a cumulator of several banks of
gaseous n i t rogen . The vessels were mounted i n t h e ve r t i ca l pos i t i on ; rubbe r
p a d s c o a t e d w i t h s i l i c o n e were u s e d t o p r e v e n t d i r e c t c o n t a c t w i t h t h e metal
suppor t s t ruc tu re and t he reby e l imina te poss ib l e sou rces o f ex t r aneous
emiss ions due to re la t ive mot ion be tween the vessel and r e t a in ing f i x tu re .

I
A nomina l p re s su r i za t ion rate of 50 psig/min w a s employed f o r t h e tests
a t -320°F. S t r a i n gages were s o t mounted on the chambers for t he c ryogen ic
tests; t h e p r e s s u r e level and p r e s s u r i z a t i o n ra te w a s con t ro l l ed by monitor ing
gages a t the p ressur iza t ion sys tem cumula tor . The o v e r a l l test procedure for
t h e -320°F tests w a s t o f i l l the chamber w i t h d r y powder, t h e n w i t h t h e l i q u i d
n i t rogen , and p re s su r i ze immedia t e ly (w i th in f i ve minu te s ) a f t e r t he vessel
w a s f i l l e d w i t h l i q u i d n i t r o g e n . S u c c e s s i v e r e f i l l s w i t h l i q u i d n i t r o g e n were
r e q u i r e d a f t e r e a c h p r e s s u r i z a t i o n c y c l e . W i t h t h i s p r o c e d u r e , a v e s s e l
t empera ture of -320°F and minimum " b o i l o f f " w a s a t t a i n e d .
2. Acoust ic Emission Instrumentat ion System for Pressure Vessel Tes t inn
The ASPC-SWAT Mobile Laboratory shown I n F igure 1 9 was used
t o m o n i t o r t h e p r e s s u r e vessel hydro te s t . F igu re 20 shows a schematic diagram
of t h e s i x t e e n (16) channel Acoustic-Emission-monitoring sys t em conta ined wi th in
the van . When a d e f e c t p r o p a g a t e s i n t h e m o n i t o r e d s t r u c t u r e , t h e a s s o c i a t e d
energy release i s d e t e c t e d by the t r ansduce r mounted on t h e vessel. The
de tec ted energy pu lse i s c o n v e r t e d t o a n e l e c t r i c a l s i g n a l which is preampl i f ied ,
a m p l i f i e d , f i l t e r e d t o remove extraneous background noise and then transmitted
t o t h e SWAT s y s t e m f o r t r i a n g u l a t i o n and d i s p l a y of the de tec ted impulse .
F igure 2 1 shows t y p i c a l b u r s t t y p e stress wave d a t a a t two d i f f e r e n t sweep
r a t e s and i nd ica t e s t he t ype o f da t a t o wh ich t he SWAT system i s tuned. " .
For the tests r e p o r t e d h e r e i n , t h e t r i g g e r l e v e l of t h e SWAT
system was set t o v a r y i n g s e n s i t i v i t y l e v e l s d e p e n d i n g on the background noise
encountered. These s ignals were band-pass f i l t e r e d (30 KHz - 60 KHz) w i th a
g a i n of 60 db.
The SWAT system computer is programmed t o o p e r a t e o n t h e
de t ec t ed acous t i c emis s ion da t a . A main and a tes t s u b r o u t i n e t r i a n g u l a t i o n
program is employed.
29

The t r iangulat ion program (main orogram) for a test v e h i c l e
is w r i t t e n so t h a t l o c a t i o n or the acous t ic -emiss ion sources can be
au tomat i ca l ly fu rn i shed as da ta ou tput . Through th i s sys tem, var ious da ta
hand l ing t echn iques can be au tomat i ca l ly accompl i shed and d i sp l ayed i n real-
time s o t h a t d e c i s i o n s o r a c t i o n s may be taken. The computer, functioning
as p rocess con t ro l , a l so can be programmed t o make d e c i s i o n s a n d r e a c t t o
a n y p r e - e s t a b l i s h e d s i t u a t i o n s u c h as appl ica t ions involv ing cont inuous
su rve i l l ance o f c r i t i c a l components.
The main progran provides real-time t r i a n g u l a t i o n t o t h e
acous t ic -emiss ion source . This p rogram loca tes the ind iv idua l sources on
a v i d e o d i s p l a y as an X-Y coord ina te on a background represent ing the t es t
a r t i c l e in f l a t p a t t e r n . The main program a l s o s e r v i c e s t h e time clock and
counters which show t o t a l c o u n t s f o r e a c h s e n s o r when i t i s t h e f i r s t s e n s o r
ac t iva ted . These counts are t r a n s m i t t e d t o a n d t a b s l a t e d by a t e l e t y p e a t
prbgrammable c lock i n t e rva l s de t e rmined by t h e o p e r a t o r .
The subrou t ine Lest program provides the necessary
i n s t r u c t i o n s t o p o s t t h e f i r s t f o u r s e n s o r numbers t h a t are a c t i v a t e d , t h e
co r re spond ing t h ree de l t a - t ime d i f f e rences i n mic roseconds and t h e test time
in hundredths o f hours . This in format ion i s pos t ed by t he t e l e type i n t en ths
of microseconds and i s used dur ing the t es t c a l i b r a t i o n and pos t - t e s t se t up
procedure in conjunct ion with the acoust ic-emission s imulator . This program
a lso can be used for moni tor ing small, s i m p l e t e s t a r t i c l e s vilere only a
tabular format i s des i r ed . A t y p i c a l t e l e t p e r e c o r d f o r t h e s u b r o u t i n e
program i s shown below:
" ies t 1st Channel " 2nd Channel - T1 3rd Channel " T2 - T3 4th Channel 'Time
5 3 23 6 3 2; 4 1 4 0.33
30

The numbers l i s ted under the channel headings are the channel numbers
i d e n t i f i e d i n t h e o r d e r of acoustic-emission arrival. The numbers presented
under T T and T h e a d i n g s r e p r e s e n t a r r i v a l time i n microseconds between
t h e 1st and 2nd channels , 1st and 3rd channels and 1st and 4th channels,
respect ively. Readout t i m e p e r p u l s e i s 7-1/2 sec.
1’ 2 3
Data d i s p l a y is accomplished by visual and graphical means
i n r ea l time dur ing t he test; d i s p l a y time p e r p u l s e is i n microseconds. The
v i d e o d i s p l a y is on a te lev is ion moni tor which a l so shows t h e s e n s o r l o c a t i o n s
on an over lay p lan v iew of the test a r t i c l e . The sources o f de t ec t ed stress
waves are posted on the screen of the monitor so t h a t t h e i r l o c a t i o n c a n b e
d e t e r m i n e d i n r e l a t i o n t o c r i t i c a l s t r u c t u r e areas such as we lds . Pa r t i cu la r
a t t e n t i o n is paid t o areas indicat ing mult ipl-e emissions f rom a s i n g l e s o u r c e
s i n c e t h i s c a n b e i n d i c a t i v e of subc r i t i ca l f l aw g rowth . Video t ape r eco rds
of t h e m o n i t o r d i s p l a y a l s o are made f o r s u b s e q u e n t d a t a a n a l y s i s i f r e q u i r e d .
Analog records w e r e made of t h e d e t e c t e d stress wave emissions
fo r each of s ix channels used to moni tor the p ressure vesse ls dur ing hydro tes t .
These records were made us ing a four teen channel Sangamo 3500 tape recorder
o p e r a t i n g i n a d i r e c t r e c o r d mode. A seventh channel w a s used f o r t a p e
synchronous control .
I n a d d i t i o n , a Dunegan Research Corporation. Totalizer system
w a s used t o p l o t t h e c u m u l a t i v e stress wave emission count vs p r e s s u r e f o r
each hydro tes t cyc le . The output from one channel, corresponding to one
of t h e s e n s o r s mounted a t t h e c e n t e r o f t h e c y l i n d r i c a l s e c t i o n , w a s monitored
us ing t he t o t a l i ze r sys t em.
3. SWAT Sensor Location and Attachment
The room temperature tests were monitored using Endevco
Model 2213 acce lerometers , whi le Endevco Model 2242 accelerometers were
used for the tests a t -320OF. The l o c a t i o n of each of the sensors on
31
I II
t h e p r e s s u r e vessels are shown s c h e m a t i c a l l y i n F i g u r e 22. Figure 18 shows
a vessel p r i o r t o h y d r o t e s t , w h i l e F i g u r e 23 shows a s e n s o r a t t a c h e d t o t h e
vessel; t h e s t r a in g a g e a t t a c h e d t o t h e vessels f o r room t e m p e r a t u r e t e s t i n g
is a l s o shown. F igu re 22 a l s o r e p r e s e n t s t h e v i d e o d i s p l a y f o r t h e SWAT system
s i n c e t h e computer w a s g iven coord ina tes which would p lace the sensors as
shown o n t h e d i s p l a y .
Fo r t he tests performed during this program, the sensor
p a t t e r n was a r r a n g e d a r o u n d t h e c y l i n d r i c a l s e c t i o n l o n g i t u d i n a l w e l d . S ince
t h e p r e s s u r e vessels were t e s t e d i n t h e as-welded condition, the weld area
was s i g n i f i c a n t l y l o w e r i n s t r e n g t h t h a n t h e b a s e metal; a PTC type no tch was
a l s o i n s e r t e d i n t h e l o n g i t u d i n a l w e l d i n t h e e v e n t f a i l u r e d i d n o t o c c u r d u r i n g
t h e i n i t i a l p r e s s u r i z i n g c y c l e s .
I n a d d i t i o n t o t h e s e n s o r s , o n e p u l s e r ( t e s t transducer) was
loca ted on t h e vessel. Th i s un i t p rov ided a means of i n t r o d u c i n g a n a r t i f i c i a l
stress \rave i n t o t h e test a r t i c l e to check th . e SWAT sys tem opera t ion bo th
du r ing s e t -up and wh i l e t he ves se l w a s under load. The location of t h e
p u l s e r is shown i n F i g u r e 22, whi le F igu re 24 shows a closeup of the p u l s e r
a t t a c h e d t o t h e vessel. The p u l s e r l o c a t i o n w a s va r i ed du r ing t he test
program.
The sensor and pulse attachment method i s sllown schemat i ca l ly
i n F i g u r e 25. The p u l s e r w a s a t t a c h e d t h r o u g h a n i s o l a t i o n s t u d whicll was
a t t a c h e d t o t h e vessel us ing adhes ive (denta l cement ) . For the room tempera-
t u r e tests, t h e s e n s o r s were mechanica l ly a t tached to ind iv idua l mount ing
blocks which were h e l d i n p l a c e by wrap-around, expandable sllock cords as
shown i n F i g u r e 23. A l i g h t f i l m of Dow Corning S i l icone w a s applied between
t h e chamber and aluminum block, and between t h e aluminum block and sensor to
provide a cont inuous f i lm contac t . For tests a t -320"F, t h e s e n s o r s were
a t t a c h e d t o t h e vessel using anodized aluminum studs (flange dimensions of
1 /2" hex , d ia , th ickness 0.125", a n o v e r a l l l e n g t h of 0.245" ) . The s t u d s
were i n d i v i d u a l l y bonded t o t h e p r e s s u r e v e s s e l u s h g a 7343 bas in r e s in and
the sensors mechanica l ly a t tached to the mount ing s tud .
32

I V . TEST RESULTS
A. FRACTURE TOUGHNESS
1. P a r e n t Metal
The f r ac tu re t oughness va lues as obta ined f rom the par t -
through-crack (PTC) t e n s i o n tests are summarized i n Table V I I I . Note t h a t a
s l i g h t i n c r e a s e i n t o u g h n e s s was i n d i c a t e d a t cryogenic temperature. Note
a l s o t h a t t h e s e c o n d b a t c h of 2014-T6 was somewhat t o u g h e r t h a n t h e f i r s t
ba t ch supp l i ed by NASA-MSFC f o r t h e c o n t r a c t .
It w a s n o t e d t h a t t h e f a t i g u e p r e c r a c k was i n t e r r u p t e d by
de l imina t ion - type c r ack ing i n some o f t he 7075-T6 and 2219-T87 specimens.
The following data from specimens with and without delimination-type cracking
show t h a t t h e d e l a m i n a t i o n - t y p e f l a w s r e s u l t e d i n a higher apparent plane-
s t r a in f r ac tu re t oughness t han t he f l aw- f ree material.
Test I n t e r n a l KIc Toughness
Material Temp. Flaws Irwin Paris
7075-T6 75 D e l a m . 33.9-39.5 Av(3) 37.5
75 Clear 31.6
2219-T87 75 D e l a m . 33.7-33.8 Av(2) 33.8
75 Clear 19.4
-320 Delam. 42.3
-320 Clear
2. Welded P l a t e
32.6-36.0 flV(2) 34.3
30.0-38.8 Av(3)34.8
29.9
32.2-34.7 Av(2)33.4
19.0
43.1
30.4-34.7 Av(?) 32.6
The f r ac tu re t oughness va lues as obtained from the PTC-
t e n s i o n tests of welded p la te are summarized i n Table I X . Note t h a t i n t h e
t ransversely welded specimens where the notch w a s whol ly conta ined in the
33

.. ..... .-
TABLE V I I I
SUMMARY OF PARENT-METAL APPARENT FRACTURE TOUGHNESS PART-THROUGH-CRACK (PTC) TENSION TESTS
P l a n e - S t r a i n T o u g h n e s s (a)
Temp. Thick. (ks i - in . '1') A l l ~ y (OF) (in. 1 First B a t c h S e c o n d Batch
2014-T6 75 0.17 26.5-28.2 Av(2)27.3
-320
0.31 28.9-30.0 Av(3) 29.6
(i.47 26.9-35.1 Av(3)31.9
0.17 28.1-30.8 Av(3)29.3
0.31 28.5-3.7.9 Av(3)31.2
0.47 29.8
-423 0.31 34.0-36.0 Av(2)3.5.0
221Q-T87 75 0.30 33.7-33.9 Av(2) 33.8
-320 0.30 32.6-42.3 Av(3)37.0
7075-T73 75 0.30 31.6-39.5 Av(4)36.C "
-320 0.30 39.1
34.4-34.5 Av(2)34.4
38.2-38.3 Av(2)38.2 _"
3 3 .n
37.3-38.4 Av(2)37.8
" " " " " " " " _ ( a ) F i r s L and Second Batch r e f e r t o d i f f e r e n t t.est series.
34

TABLE IX
SUMMARY OF WELD APPARENT FRACTURE TCWGHNESS PART-THROUGH-CRACK (PTC) TENSION TESTS
Plane-Strain Toughness (ksi-in.112)
Transverse Weld Lonpitudinal Weld Temp. Thick.
Alloy (OF) (in. 1
2014-T6 75 0.18 4043 wire TIG Welded
0.30
12.0-18.2 Av(3)14.2
16.1-18 .O Av(3)17.1
0.49 15.7-20.0 Av(2)17.8
-320 0.2c 13.5-19.6 Av(2) 16.5
0.31 12.5-20.6 Av(3)17.3
0.50 13.2-23.8 Av(3)20.0
-423 0.31 1c..6-20. n Av(3)18.5
2014-T6 75 4043 Wire MIG Welded
-320
0.31
0.31
12.1-17.0 Av(3)15.2
15.7-20.8 Av(3)17.7
2014-T6 75 2319 Wire TIG Welded
-320
G.31
0.31
17.7-21.1 Av(3)lg.g 3n.3
18.8-23.1 Av(3)18.5 37.8
2319-T87 75 2319 Wire TIG Welded
-320
0.34
0.34
32 -4-32.7 Av(2) 32.5
38.3-39.4 Av(2)M.R "
3 5

deposi ted weld metal, t h e f r a c t u r e t o u g h n e s s v a l u e s were low and n o t s i g n i f i -
c a n t l y d i f f e r e n t i r r e s p e c t i v e o f p a r e n t meta.1, f i l l e r wire o r welding process.
In t he l ong i tud ina l ly we lded PTC t e n s i o n tests, the part-through-crack w a s
cen te red on t he we ld j o in t and ex tended i n to t he hea t - a f f ec t ed base metal on
e i t h e r s i d e of t h e j o i n t . N o t e t h a t t h e a p p a r e n t f r a c t u r e t o u g h n e s s as
determined i n t h e l o n g i t u d i n a l l y w e l d e d p l a t e w a s approximately the same as
t h a t of t h e p a r e n t metal.
B. ACOUSTIC EMISSION
1. Stress-Wave Emission as a P recu r so r o f F a i l u r e
Most of the materials t e s t i n g done previously a t Aerojet
u s ing SWAT as a crack monitor ing system has been a t room o r e l e v a t e d tempera-
t u r e . One oDservation common t b a l l t h e ear l ier s t u d i e s , r e g a r d l e s s of t h e
material i n v e s t i g a t e d , is tha t the s t ress -wave-emiss ion s igna ls have char -
a c t e r i s t i c s w h i c h serve t o i d e n t i f y p l a n e - s t r a i n i n s t a b i l i t y and presage
p l a n e - s t r e s s i n s t a b i l i t y . The character is t ics which have been found to
s e r v e as a p r e c u r s o r of f a i l u r e are (1) a marked i n c r e a s e of the amplitude of
t h e s i g n a l s as o b s e r v e d i n real t i m e on an o sc i l l o scope , (2) a marked i n c r e a s e
i n t h e s i g n a l r e p e t i t i o n rate (count p e r second) and ( 3 ) a marked i n c r e a s e i n
the s l o p e o f Lhe cumulative count-versus-load p l o t . These c h a r a c i c r i s t i c s
:der(: f'irsL i d e n t i f i e d a t A e r o j e t i n a s tudy for L l l e O f f i c e of Nav;tL
lilcsearcll ' I' Ilowever, Lhe c h a r a c t e r i s t i c s werc obsc.rved t o b c h cI(~oen(lenl.
I L ~ O I I material tougltness.
36

steel ( a u s t e n i t i z e d at 1750°F and tempered a t 60O0F) and 7075-T6 aluminum,
p l a n e - s t r a i n i n s t a b i l i t y was iden t i f i ed by an o rde r -o f -magn i tude i nc rease i n
stress-wave ampl i tude and t he f i na l f a i lu re p rocess w a s i d e n t i f i e d b y a n
i n c r e a s i n g stress-wave c o u n t , g e n e r a l l y s t a r t i n g a t approximately the plane-
s t rah pop-in. In the extreme embri t t lement of D6aC a u s t e n i t i z e d a t 1550°F,
f r ac tu re occu r red d i r ec t ly f rom the p l ane - s t r a in pop- in w i th on ly two o r
t h r e e stress waves be fo re t he f i na l uns t ab le bu r s t o f c r ack g rowth .
I n t h e ONR s tudy , t he D lane - s t r a in (KI , ) i n s t ab i l i t y w a s
i d e n t i f i e d by acous t ic emiss ion bu t the acous t ic emiss ion moni tor ing sys tem
u s e d d i d n o t h a v e s u f f i c i e n t a m p l i f i c a t i o n a n d / o r s e n s i t i v i t y t o d e t e c t a
p r e c u r s o r f o r t h e K i n s t a b i l i t y . However, i n a r e c e n t s t u d y f o r t h e
Advanced Research Projects Agency ' 28 I, an improved acoustic-emission detec- I C
t ion sys tem demonst ra ted tha t acous t ic emiss ion can a l so p rovide warn ing of
t h e p l a n e - s t r a i n (K ) i n s t a b i l i t y . T h i s s t u d y and t h e N a v y s tudy were based
on room-temperature testing. I C
F igu re 26 i l l u s t r a t e s t h e p r e c u r s o r i n a part-through-crack
(PTC) t ens ion tes t of 2014-T6 a t room temperature. The r e s u l t s a t cryogenic
t empera tu re and o the r f ac to r s a f f ec t ing t he p recu r so r are d iscussed in sub-
sequen t s ec t ions o f t h i s r epor t .
a. P r e c u r s o r i n Room Temperature Testing
I n t h i s i n v e s t i g a t i o n , t h e e f f e c t o f t r i g g e r level on
t h e p r e c u r s o r was i n v e s t i g a t e d . It w a s f o u n d t h a t t h e t r i g g e r level u s e d , i n
count ing the stress-wave emissions had a marked e f f e c t on t h e p r e c u r s o r .
For example, i n F i g u r e 27 the da ta f rom 2014-T6 specimen 8-8, t e s t e d a t 73'F,
were played back a t t r i g g e r levels of 0.059, 0.070, 0.090 and 0.12 volt.
Note t h a t a t t h e h i g h e s t t r i g g e r level , t h e p r e c u r s o r o c c u r r e d j u s t b e f o r e
f r ac tu re ; whereas , a t the l owes t t r i gge r level, t he p recu r so r appea red t o
occur a t about 25% of t he f a i lu re l oad . In F igu re 28 , i t w i l l b e s e e n t h a t
a t an 0 .15-vol t t r igger level 2219-T87 specimen 19-7 showed no precursor
37

whatsoever; whereas , a t a n 0 . 0 7 - v o l t t r i g g e r level t h e r e was an unmistakable
precursor . Because the choice of t r i g g e r level is a r b i t r a r y , s e l e c t i o n o f a
q u a n t i t a t i v e v a l u e o f l o a d c o r r e s p o n d i n g t o t h e o n s e t of c r a c k i n s t a b i l i t y
d o e s n o t a p p e a r t o be meaningful.
The e f f e c t of t r i g g e r level on t h e p r e c u r s o r is b e s t
understood by a cons idera t ion of the background "noiser r level . I f t h e back-
ground noise increases (band widens) as t h e l o a d i s i n c r e a s e d , t h e stress-
wave count could b e a f f e c t e d i f , at t h e start o f t h e test , t h e t r i g g e r i n g
vo l t age i s set j u s t above the background "noise" level. Comparisons between
the background "noise" band widths a t t h e start o f l oad ing and nea r f r ac tu re
are p resen ted i n F igu res 29 , 30, and 31. A t room temperature , the background
nci_se" band a t t h e start of loading w a s r e l a t ive ly na r row; wh i l e nea r frac-
ture , the band was r e l a t i v e l y w i d e . A t c ryogen ic t empera tu res , where p l a s t i c
deformation would be minimized, the width of the band w a s e s s e n t i a l l y t h e
same n e a r f r a c t u r e as a t t h e s tar t o f l oad ing . Th i s sugges t s t ha t t he
broadened band near f rac ture in the 75°F tests was t h e r e s u l t o f p l a s t i c -
zone formation. In Figures 29 through 31, no a t tempt w a s made to photograph
burs t - type stress waves; when they appea red i n t he pho tographs , i t was by
chance. Figure 32 schemat i ca l ly shows t h e e f f e c t of background "noise" a t
t h r e e t r i g g e r i n g levels f o r room-temperature tests. To s i m p l i f y t h e i l l u -
s t r a t i o n , no burst- type stress waves are shown u n t i l f a i l u r e . A s the load
i s i n c r e a s e d , t h e n e t s e c t i o n y i e l d i n g a n d t h e p l a s t i c z o n e a t t h e c r a c k t i p
i nc reases and , consequen t ly , t he con t inuous emis s ion i nc reases ( s ee F igu res 29
and 30, 75OF PTC t e s t s ) . A t a low-vol tage t r igger level , the background
1 1
I ' no i se" i nc reases t o t r i gge r - l eve l one a t a r e l a t i v e l y low load, producing
an anomalously low precursor. A t t r i g g e r - l e v e l t h r e e , the specimen i s
p r a c t i c a l l y a t the f a i lu re l oad be fo re t he background "no i se" has i nc reased
t o t h e t r i g g e r v o l t a g e , g i v i n g l i t t l e o r no p recu r so r (see Figure 27 f o r
a c t u a l test da ta ) .
38
b. Precursor a t Cryogenic Temperatures
Examinat ion of the cumulat ive count versus load curves
for c ryogenic- tempera ture tests i n d i c a t e d t h a t t h e p r e c u r s o r o f f a i l u r e i s
l i k e l y t o b e v e r y s h o r t a t c ryogenic t empera tures , o f ten less than 1 sec.
In Figure 17 , fo r example , t he re w a s a sha rp upward t u r n i n t h e c u r v e s j u s t
b e f o r e f a i l u r e , b u t t h e w a r n i n g t i m e was v e r y s h o r t .
F igu re 33 schemat i ca l ly shows t h e e f f e c t o f t r i g g e r
level a t cryogenic temperature (-320'F). A t cryogenic temperature there w a s
l i t t l e o r no increase in the background-noise band (see Figures 29 through 31).
However, a t c ryogenic t empera ture there were many stress waves s t a r t i n g
almost immediately on app ly ing l oad , i nc lud ing a l a r g e number of small stress
waves i n t e r s p e r s e d w i t h much l a r g e r a m p l i t u d e stress waves. The l a t t e r ,
because of the r ing-down character is t ic of t h e s i g n a l , were counted as
several stress waves r a t h e r t h a n o n e . E f f e c t i v e l y , t h e n , t h e e l e c t r o n i c
counter p roduced an in tegra t ion of the s ize and number o f stress waves. A t
a l o w - v o l t a g e t r i g g e r s e t t i n g ( l e v e l l) , t h e small stress waves, as w e l l as
t h e l a r g e , were counted, producing a r a p i d i n c r e a s e in cumulative count a t a
low load. A t t r i g g e r - l e v e l t h r e e , on the o the r hand , t he sma l l stress waves
were not counted and the count-versus- load plot tended to look more l i k e t h e
room-temperature precursor curves (see Figure 34 f o r a c t u a l test d a t a ) .
F igu re 35 was obtained from a -320°F cryogenic test of
7039-T61 aluminum us ing a WOL conf igu ra t ion (B = 1.00 in. and W = 2.00 i n . ) .
The i n s t r u m e n t a t i o n u s e d i n t h i s test f o r NERVA w a s comparable t o t h a t u s e d
i n t h e N A S A - H u n t s v i l l e s tudy . The specimen gave over 220,000 counts before
i t f a i l e d , and t h e p l o t p r o v i d e d a more o r less t y p i c a l p r e c u r s o r t o f a i l u r e .
However, i t i s a p p a r e n t t h a t t h e c o u n t e r t r i g g e r i n g level a f f e c t e d t h e n a t u r e
o f a n d t h e a b i l i t y t o d e t e c t t h e p r e c u r s o r . F i g u r e 36 is a comparison between
the cu rves p re sen ted i n F igu res 16 and 35 (comparable SWAT sys t ems) i nd ica t ing
a d i f f e r e n c e i n t h e r e s u l t s o b t a i n e d f r o m t h e PTC tests of 7075-T6 and the
39

WOL tests of 7039-T61. Whether t h i s d i f f e r e n c e ars e s s e n t i a l l y c o n s t a n t
t r i g g e r level i s a t t r i b u t a b l e t o d i f f e r e n c e s i n the a l l o y s o r i n t h e s p e c i m e n
c o n f i g u r a t i o n s i s n o t known.
S e v e r a l f a c t o r s are b e l i e v e d t o a f f e c t t h e p r e c u r s o r
i n c r y o g e n i c t e s t i n g i n c l u d i n g , i n a d d i t i o n t o t r i g g e r level , the noise pro-
duced by ice c r a c k i n g a n d t h e l o w s e n s i t i v i t y o f t h e t r a n s d u c e r u s e d i n
c ryogen ic t e s t ing . These f ac to r s are e v a l u a t e d i n s u b s e q u e n t s e c t i o n s o f
t h i s r e p o r t .
2 . Ef fec t o f Delaminat ion
The fo l lowing da t a were obtained f rom 7075-T73 parent metal
PTC-tension specimens tested a t room temperature with and without delamina-
t i o n f l a w s i n t h e f r a c t u r e s u r f a c e s .
Trigger Cumulative Crack ( i n . ) Level Count
Material Specimen .De lam. - A0 - 2c ( v o l t s ) x 103
7075-T73 7 3-6 Yes 0.084 0.382 0.32 3,310
73-7 Yes 0.105 0.382 0.32 3,330
7 3- 10 No 0.110 0.380 0.07 2 1 2
2219-T87 19-7 Yes 0.126 0.398 0.07 55
Figure 37 shows t h e 7075-T73 f r ac tu re su r f aces w i th t he de l amina t ion - type
cracking. Note that the delamination caused an order-of-magnitude higher
acous t ic emiss ion count . Delaminat ion observed in the 2219-T87 specimens,
on the o ther hand , d id no t genera te a high count .
40

3. - Prpcedukal Variables
a. Effect of Tape Playback
In the cour se o f the i n v e s t i g a t i o n , t h e r e were a number
of gccasions when tape-recorded data were p layed back for purposes o f eva lua t ing
t h e e f f e c t o f t r i g g e r level o r a d j u s t i n g t h e t r i g g e r level to compensate for
l o s s o'f t r a n s d u c e r s e n s i t i v i t y a t cryogenic temperature.
In tape playback, even using an instrumentat ion-type tape
recorder wi th h igh f requency response , there is a cons ide rab le l o s s o f da t a , as
w i l l be seen from Figure 38. Figure 38a is an X-Y p lo t o f cumula t ive stress-
wave count versus load for 2219-T87 Specimen No. 32 as r e c o r d e d i n real t i m e
dur ing the c ryogenic tes t a t lo6 f u l l scale. Figure 38b f o r t h e same test was
obta ined by t a p e playback a t lo5 f u l l scale. From a comparison of t h e two
jumps, one a t 47.5 kips and another a t 50.7 k i p s ( f a i l u r e l o a d ) , and the i nd i -
ca t ed cumula t ive t o t a l coun t i n t he two p l o t s , i t w i l l b e s e e n t h a t t h e l o s s of
stress wave da ta can be very s i g n i f i c a n t .
Stress Wave Emission Event Cumulative Count To t a l
Lo ad Real P lay Real P1 ay (k ips) T i m e Back Time Back
47.5 10,000 1,300 42,000 6,600
50.7 45,000 9 , 000 110 , 000 23 , 700
Likewise , the real-time p l o t o f RMS vo l t age ve r sus l oad when compared wi th t he
p l ayback p lo t shows t h e same los s o f p recu r so r da t a (F igu res 39a and 39b). The
r e a s o n f o r the discrepancy i s that the minimum s i g n a l t h e t a p e r e c o r d e r w i l l
record and play back i s 150 mv whereas t he no i se level f o r t h e s e tests w a s on
the o rde r o f 30 mv meaning that tape playback does not include data between
30 and 150 mv. The l imi ted f requency response o f the t ape recorder (300 K H z )
may a l s o b e a f a c t o r .
41

b. E f f e c t o f F i l t e r Level
Barnd-pass f i l t e r ing has l ong been r ecogn ized as an ess.en-
t i a l par t o f any acous t ica l -emiss ion de tec t ion sys tem. Var ia t ions in machine
o r environmental noise f rom day to day sometimes, necessi ta tes changes in the
f i l t e r i n g l e v e l ; h o w e v e r , a n a t t e m p t i s -made to minimize such changes because
o f t h e e f f e c t o f f i l t e r level on the cumulat ive count . Consider , for example,
the fo l lowing da ta for unnotched , 2219-T87 long i tud ina l ly we lded , t ens ion
specimens NO. 27 and 28 , and a l s o 2219-T87, longi tudinal ly welded, PTC-tension
specimens No. 29 and 30.
Test High-Pass Trigger Tempera ture F i l te r Level Cumulative
Specimen No. (OF) KHz (set P o i n t ) sm count
27 28
29 30
75 90 + 90 8.5 0.13 x l o6 6
75 40 + 40 5.0 2 .02 x 10
75 75
90 + 90 8.0 0.08 x lo6 6
40 + 40 5.0 1 .18 x 10
A s s e e n f r o m t h e s e d a t a , r e d u c i n g t h e f i l t e r level from 90 KHz t o 40 KHz
increased the cumulat ive count by an order of magnitude. The d i f f e r e n c e i n
set p o i n t was an a d j u s t m e n t i n s i g n a l g a i n i n t h e Dunegan system, and not a
change i n t r i g g e r l e v e l . I n t h e Dunegan s y s t e m , t h e t r i g g e r l e v e l is f i x e d
a t 0.707 vol t . When f i l t e r i n g a t 40 K k , more background noise w a s de t ec t ed
and t h e r e f o r e less gain was r e q u i r e d t o b r i n g t h e s i g n a l up t o a l e v e l j u s t
under the 0 .707-vol t t r igger level. Figure 40 s c h e m a t i c a l l y i l l u s t r a t e s t h i s
condi t ion. With the qu ie te r sys tem provided by 90 KHz f i l t e r i n g , a h i g h e r
s e t poin t (ga in) w a s r e q u i r e d t o b r i n g t h e s i g n a l up t o a l e v e l j u s t u n d e r
the 0 .707-vol t t r igger level.
4 2

4. Ka i se r . E f fec t i n Welded Aluminum
F igure 41 is a comparison of. da ta f rom long i tud ina l ly we lded ,
unnotched, tension specimens 22, 27 and 28 which i n d i c a t e s an increase i n
stress-wave activity i n the range of 5 to 10 k i p s l o a d . When the specimens
were loaded fo r a second t f m e , t h e a c t i v i t y i n th i s r ange comple t e ly d i s -
appeared. This behav io r is c o n s i s t e n t w i t h t h e Kaiser e f f e c t .
Joseph Kaiser i n Germany i n 1950 w a s t h e first n o t o n l y t o
use electronic ins t rumen ta t ion t o l i s t en t o t he subaud ib le sounds p roduced by
the deformation of metals b u t a l s o t o o b s e r v e t h a t a c o u s t i c e m i s s i o n a c t i v i t y
is i r r eve r s ib l e . In o the r words , acous t i c emis s ion i s not genera ted dur ing
the re load ing of a material u n t i l t h e stress level exceeds i t s previous high.
This: i r r e v e r s i b l e phenomenon is now known as t h e "Kaiser e f f e c t " .
One of the specimens (No. 27) shown i n F i g u r e 4 1 w a s sub-
jected t o a t h i r d l o a d c y c l e . F o r t h e t h i r d c y c l e , a Model 2213 accelerometer
w a s s p r i n g mounted on the specimen. The d a t a were f i l t e r e d a t a band width of
60 KHz t o 600 KHz with approximate ly the same gain as i n t h e p r e v i o u s c y c l e s ,
v i z . , 100 db. The f o l l o w i n g t a b u l a t i o n o f s t r e s s - w a v e - c o u n t d a t a i l l u s t r a t e s
the marked drop i n count i n each success ive cyc le a t a given load and the
m a r k e d f n c r e a s e i n c o u n t j u s t b e f o r e f a i l u r e i n t h e 3 r d c y c l e ( t h e p r e c u r s o r
o f f r a c t u r e ) .
Specimen Cycle Date - Load Count Max. Load T o t a l Count
27 1 11-3-70 36.85 134,000 (a) 36.85 134,000 (a)
2 11-3- 70 36.85 3,200 (b) 38.30 3 , 500 (b)
3 9-29-71 36.85 7 30 40.65 61O,000 (C)
(a) High count resu l t ing f rom the peak in stress-wave a c t i v i t y a t 10 k i p s
(b ) Ka i se r e f f ec t
(c) P r e c u r s o r
4 3

Figure 42 shows t h e p r e c u r s o r as seen i n t he 3 rd cyc le ; t he spec imen f r ac tu red
a t 40.65 k ips . No te t he Kaiser e f f e c t i n t h i t the stress-wave a c t i v i t y b e g a n
a t about 38 k i p s , t h e m a x i m u m l o a d o f t h e 2nd cyc le .
The fac t t ha t we lded spec imens showed inc reased stress-wave
a c t i v i t y a t about 10 ki-ps whereas unwelded (parent-metal) specimens did not,
sugges ts t i a t t h e a c t i v i t y a t low load could be the re l iev ing of res idua l
welding stresses. Figure 43 i s a comparison o f welded and unweltled, unnotched,
room-temperature tests. Note t h a t t h e p a r e n t - m e t a l specimell sl1owecL vi r ~ u a l l y
110 sLress-wave a c t i v i t y u n t i l . t h e r e w a s a toolirlg l)roblem, :IL w l l i c . 1 1 t - i n ~ c a L l l e
spec : i I I IC ' I I was I l n l o a d e d , t h e s i t u a t i o n c o r r e c t e d a 1 1 t 1 t.llell r e I ~ L I C I C , ~ .
o i . 2014 a11c1 2219 aluminum. From Figure 44 n o t e L I l a t wl1c!11 L l l c I i 1 1 car 1cvc.L W . L S
r ( * d t ~ ~ , e ~ l from 90 KHz t o 40 KHz, the ev idence o.E ,Ic.tivi t y a t 10 kips was olarkedlv
i ncreasecl, and when the specimen w a s loaded a second Lime , t:lle a c t i v i l y corn-
f l e t e l y disappeared. This behavior is consis tenl . bo t 11 with the Kaiser eF fecl
i-ind w . i i 1 1 w l l a t would be expected i f t h e f i r s t l o a d c y c l e h a d p r o d u c e d a stress
re I ief .
5. Ef fec t o f Flaw S i z e
I n g e n e r a l , f l a w s i z e a p p e a r e d t o h a v e l i t t l e o r no e f f e c t on
the SWE cumulative count.
Material Specimen T e s t Crack , in . Tr igger Cumulat ive Wire No. Temperature, "F - A0 - L e v e l , v o l t s Count 2c
-
2014-T6 PT43-13 75 0.118 0.730 0.35 86,500 4043 Wire -23 75 0.1313 0.560 0.35 50,500 T I G -33 75 0.165 1.090 0.35 68,500 2014-T6 PT43-11 75 0.09:L 0.290 0.14 22,500 4043 Wire -21 75 0.091 0.477 0.14 23,500 T I G - 31 75 0.064 1.500 0.14 30 , 500
44
The plots of cumulat ive count versus load corresponding to the tests i n t h e
above tabula t ion are p r e s e n t e d i n F i g u r e s 45 through 48.
F igu res 49 and 50 and t h e f o l l o w i n g d a t a i l l u s t r a t e a case
where i nc reas ing c r ack s i ze appea red t o be a t t ended by an i n c r e a s e i n cumula-
t ive SWE count.
Material Specimen T e s t Crack, i n . T r igge r Cumulative Wire N o . Temperature, OF - A0 - 2C Level, v o l t s Count .
2014-T6 PT19-1 75 0.098 0.300 0.32 13,500
2319 Wire -2 75 0.126 0.520 0.32 28,500 TIG Welded -3 75 0.114 1.090 0.32 32,500
However, t h e d i f f e r e n c e i n c o u n t w a s no t g rea t and may n o t b e s i g n i f i c a n t .
Comparisons of notched (PTC) and unnotched tension tests
r evea led a r e su l t t h a t a t f i r s t appeared to be anomalous. A s indicated below
some of the t ransversely welded specimens gave higher counts in the unnotched
tests than in the PTC-tension tests. In subsequent tests o f t h e l o n g i t u d i n a l l y
welded specimens, both parent metal and welded 2014-T6 specimens confirmed
that the smooth, unflawed specimens generated larger counts than PTC-tension,
tests a t both 75°F and -320'F.
T e s t High Pass ( se t po in t ) Specimen Temperature F i l t e r T r igge r Cumula t ive SWE
Material No. (OF) (KHz) Level count x 103
2014-T6 Pa ren t Metal
Unno t ched 4 75 90 + 90 8.0 5 75 90 + 90 8.0 6 75 90 -I- 90 8.0
PTC 1 2
75 180 4- 180 3.0 75 90 + 90 8.0
4000 4600 3000
22 53
45

Test
Material No. (OF) Specimen Temperature
2014-T6 Pa ren t Metal (cont . )
Unno t ched E -320 G -320 F -320
PTC 8 -320 9 - 320
2014-T6 Welded wi th 2319 Wire
High Pass (set p o i n t ) F i l t e r T r igge r Cumula t ive SWE
(KHz) Level count x 103
60 + 60 60 + 60 60 + 60
54 + 54 50 + 50
7.5 7.0 6.0
7.0 6.0
120 180 360
10 3 90
Unno t ched 22 75
PTC 21 75
Unno t ched 25 -320 36 -320
PTC 26 -320
90 + 90 8.0 1800
90 + 90 8.0 250
60 + 60 3.8 720 54 + 54 8.0 35 0
60 + 60 5.0 150
Likewise, both parent-metal and longi tudinal ly welded 2219-T87 tests showed
tha t the smooth , unf lawed spec imens genera ted e i ther l a rger counts o r about
t h e same count as PTC-tension tests a t both 75 and -320°F.
Test High Pass Level Specimen Temperature F i l t e r T r igge r Cumula t ive SWE
Material No. (OF) KHz (set p o i n t ) Count x 103
2219-T87 Parent Metal
Unnotched 1 2 1 3
PTC 18
Unno t ched J K
PTC 19 20
75 75
75
-320 -320
-320 -320
90 + 90 8.0 90 + 90 8.0
90 + 90 8.0
60 + 60 4.0 60 + 60 1.1 + 20db
60 + 60 9.2 60 + 60 3.5
1000 1500
1
70 150
100 170
46

T e s t High Pass Tr igger Specimen Temperature F i l t e r Level Cumulative SWE
Material No. (OF) KHz (set po in t ) Count x 103
2219-T87 Welded wi th 2319 Wire
Unno t che d- 27 28
PTC 29 30
Unno t ched 32 33
PTC 31 34
75 75
75 75
- 320 -320
-320 -320
90 + 90 40 + 40
90 + 90 40 + 40
54 + 54 60 + 60
54 + 54 54 + 54
8.0 5.0
8.0 5.0 -
6.7
7 .O 7.0
2200 1200
800 1200
3 10 550
200 15 0
The exp lana t ion fo r t he h igh coun t s ob ta ined w i th smooth
(unnotched) tension specimens as compared wi th PTC-tension tests is t h e r e s u l t
o f cont inuous emiss ion occur r ing in the smooth spec imens dur ing the f ina l
s t a g e o f t h e f a i l u r e p r o c e s s . F i g u r e 51 i l l u s t r a t e s t h i s i n unwelded 2014-T6
material. Note t h a t a t 37 k i p s , t h e smooth specimen had generated a count of
only 3 x lo3 ; t h e PTC f a i l e d at 36.9 k ips w i th a count of 53 x 10 . A t 44 k i p s , t h e smooth-specimen count had increased to 130 x 10 with an unmistakable pre-
cu r so r o f f a i lu re . L ikewise , cons ide r t he case of welded specimens No. 2 1 and
22. A t 3 3 k i p s , the smooth specimen No. 22 had generated a count of on ly
40 x lo3; PTC specimen No. 2 1 f a i l e d a t 32.8 kip's with a count of 250 x 10 .
3
3
3
A t f a i lu re (36 .9 k ips ) t he smooth-specimen count had increased to 1800 x 10 . 3
A comparison of longitudinally welded PTC tes t No. 26 and
smooth specimen No. 36 a t -320°F showed t h e same t rend as t h e room temperature
tests. A t 38 k i p s , t h e smooth specimen had generated a count of 33 x 1 0 ; t h e
PTC spec imen fa i led a t 37.9 k i p s w i t h a count of 150 x 10 . A t f a i l u r e
(42.3 kips) the smooth specimen count increased to 350 x 10 .
3
3
3
I
47
6. R e l a t i o n s h i p Between Acoustic-Emission Count a n d S t r e s s - I n t e n s i t y F a c t o r
Dunegan and Hamis (31) p rev ious ly showed a r e l a t i o n s h i p
be tween s t ress - in tens i ty fac tor and acous t ic -emiss ion cumula t ive count in
r i s ing - load - to - f a i lu re tests o f 7075-T6 aluminum. In F igure 52, n o t e t h a t
da t a ob ta ined f rom fou r i n i t i a l c r ack l eng ths g rouped i n to a s ing le cu rve
f i t t i ng t he t heo re t i ca l fou r th -power cu rve . Unfo r tuna te ly t he p lo t s o f such
da ta d id no t a lways conform to a f o u r t h power curve; in another s tudy, Dunegan
and Harris repor ted the exponent to vary between the 6th and 8th power. Later,
c o n s t a n t - l o a d , s t r e s s - c o r r o s i o n s t u d i e s a t Aero je t (14) ind ica ted a d i r ec t p ro -
po r t iona l i t y be tween s t r e s s - in t ens i ty f ac to r and cumula t ive stress-wave c o u r t
i n single-edge-notch tension specimens (Figure 53). It was hypothes ized tha t
the d i f fe rence be tween the LRL and Aero je t test r e su l t s cou ld be t he r e su l t o f
a d i f f e r e n c e i n t h e m o n i t o r i n g sys tem t r i g g e r l e v e l . A t LRL the c.ounter t r i g g e r
l e v e l was set to include the cont inuous emission produced by p l a s t i c deforma-
t i on ; whereas , i n mos t Aero je t s tud ie s , t h e t r i g g e r level was set above the
cont inuous emiss ion , focus ing on the burs t - type s t ress -wave emiss ion assoc ia ted
with incremental crack growth. However, d i f fe rences f rom test t o tes t , even
wi th a supposedly cons tan t da ta -acqz is i t ion sys tem, have been encountered and
as ye t no t exp la ined .
The importance of the re la t ionship between stress i n t e n s i t y
f ac to r and acous t i c emis s ion l ies i n t h e p o s s i b i l l t y o f e s t i m a t i n g f l a w s i z e s
and f a i lu re l oad based on in - se rv ice , real-time, nondes t ruc t ive i n spec t ion o f
a f l a w e d s t r u c t u r e u t i l i z i n g a c o u s t i c e m i s s i o n . However, b e f o r e t h i s can be
r e a l i z e d , much has t o be l ea rned abou t t he va r i ab le s a f f ec t ing t he coun t -
versus-K re la t ionship .
A l i m i t e d number of tests w a s made dur ing th i s p rogram us ing
a single-edge-notch (SEN) tension specimen to f a c i l i t a t e the c a l c u t a t i o n
o f s t r e s s - i n t e n s i t y f a c t o r as a funct ion of i nc reas ing c r ack l eng th as measured
by crack-opening displacement.
48

With t h e SEN-tension specimen configuracion, the 7075-T73
a l loy gene ra t ed a much h i g h e r stress-wave c o u n t t h a n e i t h e r o f t h e o t h e r two
a l l b y s t e s t e d . F i g u r e 54 is a p lo t o f cumula t ive stress-wave count versus
a p p l i e d stress i n t e n s i t y as calculated from the measured load and crack-
opening displacement for dupl icate specimens. No exp lana t ion w a s found f o r
the discrepancy between the curves . Table X p re sen t s t he da t a f rom the dup l i -
cate 7075-T73 tests .
The data from the SEN-tension tests of t h e 2014-T651 and
2219-T87 a l l o y s are shown i n T a b l e s X I and X I I . F igure 55 is a p l o t o f cumu-
la t ive stress-wave count versus appl ied stress i n t e n s i t y f o r t h e same mate-
rials. The d a t a from duplicate specimens of 2014-T651 a l l o y d i d n o t f a l l o n
a common curve a t low load , bu t as the load and c rack length (COD) approached
t h e c r i t i c a l s t r e s s - i n t e n s i t y f a c t o r , t n e data a p p e a r e d t o f a l l on a common
curve. From F i g u r e 5 5 , n o t e t h a t t h e 2219-T!37 a l l o y as compared wi th the
2014-T651 a l loy genera ted a h i g h e r stress-wave c o u n t i n i t i a l l y and at f r ac -
tu re . . lhe c r i t i c a l stress i n t e n s i t y was approximately 48 ksi-in. 'I2 i n t h e
20l4-T651 a l l o y w i t h a t o t a l stress-wave c o u n t t o f a i l u r e o f 22,000, and
68 ksi-in.1/2 i n t h e 7075-T73 a l l o y w i t h a t o t a l c o u n t t o f a i l u r e of 110,000
and 79 ksi-in.1'2 i n t h e 2219-T87 a l l o y w i t h a t o t a l c o u n t t o f a i l u r e o f
45,000. Thus, based on t h e s e d a t a t h e r e d i d n o t a p p e a r t o b e c o r r e l a t i o n
between toughness and cumulat ive count indicat ing other var iables such as
material type and condi t ion are i m p o r t a n t f a c t o r s i n t h i s r e l a t i o n s h i p .
F igu re 56 i l l u s t r a t e s t h e e x c e l l e n t c o r r e l a t i o n t h a t c a n b e
found between crack-opening-displacement (COD) measurements and acoustic-
emission count rate. Note t h a t a t approximately the load a t which there w a s
bo th pop- in and dev ia t ion f rom l i nea r i ty i n t he COD-load X-Y p l o t , t h e r e was
a marked i n c r e a s e i n t h e rate o f stress-wave emission. The s t r e s s - i n t e n s i t y
co r re spond ing t o t he l oad a t t h i s p o i n t o f i n s t a b i l i t y w a s 25.7 ks i - in . . 112
49

TABLE X
SUMMARY OF STRESS-WAVE-EMISSION STRAIN-GAGE FRACTURE DATA 7075-T73 ALUMINUM ALLOY - 0.30-IN. THICK
Single-Edge-Notch Tensile
Crack
No. ( in . )
73-14 1 .14 1 . 1 2
1 . 1 2
1.11
1.10
1.11
1 . 1 2
1.15
Specimen Length
1 .18
1 . 2 1
1 . 2 7
1.30
1.04
1.05
1.06
1.06
1.06
1.06
1.06
1.07
1 .12
1.15
1.18
1 .23
1.30
73-15
Applied Appl ied S t r e s s I n t e s i t y
Load ( lbs ) (ks i - in . 132)
2 , 000
3,000
4,000
5 , 000
6,000
7 , 000
a , ooo ( a )
9 , 000
10,000
11,000
12,000
12 ,460 (Fa i l )
2,000
3,000
4,000
5,000
6 , 000
7,000
8,000
9 , 000
10 , 000
11,000
12,000
1 3 , 000
(b 1
13,680 (Fai l )
8.4 12.3
16 .3
20.2
24.2
28.3
32.8
38.5
44.2
50.3
59.9
64.9
7.6
11.5
15.4
19.4
23.1
26.9
30.9
35.1
42.0
47.5
54;4
62.5
72.1
Axial S t r a i n
<,t" - in . )
2 a0
425
560
695
840
990
1145
1310
1470
1650
1850
1960
2 30
3 70
505
635
775
915
1050
1190
1360
1510
16 75
1845
2000
Cumulative Stress Wave
Emis s ion Count
5,170
7,975
11,009
13,078
14,094
14,958
18,985
27,087
38,430
51,725
7 ? , 501
112,750
6,353
11,258
18,510
29,793
37 , 8.38
44,666
49,672
55,932
69,354
81,000
93,000
114,000
134,000
"""""""""~"
(a ) con pon-in occurred a t 8 k i m o r 32.8 ks i - in .
(b) COD uoD-in occurred a t 9 .3 kiDs o r 37 ksi-in.
1 / 2
1 / 2

4-19
Crack
No. ( in.) Specimen Length
4-18 1.01 1.01
1.02
1.14
1 . 2 1
1 .08
1.07
1.07
1.07
1.07
1.07
1.08
1.13
1.19
1.32
TABLE X I
SUMMARY OF STRESS WAVE EMISSION-STRAIN GAGE-FRACTURE DATA 2014-T651 ALUMINUM ALLOY - 0.30-in. THICK
Single-Edge- Notch T e n s i l e
Applied Axial A p p l i e d S t r a i n
Load (lbs) (ksi-in. ( p -in.)
2,500 8.5
5,000 16.9
7,500 25.7
10,000 40.3
10,600 (Fail) 46.4
1,000
2,000
3,000
4,000
5,000
6,000 (a)
7,000
8,000
9,000
9 ,870 (Fa i l )
3.7
7.4
11.0
14.6
1 8 . 4
2 2 . 2
26.1
31.7
38.6
50.2
400
840
1320
19 20
2120
15
140
275
410
540
6 70
80 5
965
1130
1360
Cumulative S t res s Wave
Emission Count
2, Roo 2,561
7,570
17,055
22,509
1 ,071
1,150
1 ,361
1,436
1,546
1,702
3,035,
7,398
12,787
28,762
L
"""""""""
(a) COD pop-in occurred a t 6.9 kiDs o r 25.7 ksi- in . ( see F igure 56) . 1 / 2

TABLE X I 1
SUMMARY OF STRESS WAVE EMISSION-STRAIN GAGE-FRACTURE DATA 2219-T87 ALUMINUM ALLOY - 0.30-IN. THICK
Single-Edge-Notch Tensile
Crack
No. (in. 1 Specimen Length
19-15 1.11 1.10
1.09
1.10 1.10
1.10
1.12
1.15 1.19
1.24
1.48
Applied Axial Applied Stress Intensity Strain Load ( l b s ) (ks i-in. 1/21 (,p -in. )
2,000
3,000
4,000
5,000 6,000
7,000 8,000
9,000 (a)
10 , 000
11,000
11,900 (Fail)
3.2 12.2
16 .o 20.3 24.4
28.6
33.4
38.9
45.6
53.5
79.1
235
375
515
665
815
960 1105
1260
1420
1605 1880
Cumulative Stress Wave Emission Count
8,429 10 , 300 13,145
14,166
14 , 600 15,047 15,720
16 , 759 17,245 17 , 822 45 , 000
(a) COD deviation from linearity occurred at 9.5 kips or 41.5 ks i - in . 112
52

I -
The va lue of KIc f o r 2014-T6 as determined by PTC-tension tests was
28.9 - 30.0
Av(3) 29.6 ksi- in . 112
A comparison between the apparent %c va lue as determined
from COD pop-in o r d e v i a t i o n from l i n e a r i t y i n t h e SEN-tension tests and the
KIc values determined from PTC-tension tests is p r e s e n t e d i n t h e f o l l o w i n g ’
room-temperature data summary:
Alloy
2014-T6
2219-T87
70 75-T6
Plane-Strain Fracture Toughness SEN-Tension PTC-Tension
-”
25.7 28.9 - 30.0
Av(3) ”” 29.6
31.0 - 33.9 33.7 - 33.9
Av(2) 32.5 Av(2) 33.8
32.8 - 37.0 31.6 - 39.5
Av(2) 34.9 Av(4) 36.0
Thus, t he two tests p rov ided e s sen t i a l ly t he same K va lues . IC
53

7. Effec t o f Test Temperature
The fo l lowing da t a i nd ica t ed a marked e f f e c t of test temperature
on cumulat ive count i n t h e 21)14-T6 a l l o y .
Material Specinen Test Crack, in. Trigger Cumulative Wire No. Temperature, OF A0 2C Level, v o l t s Count - -
2014-T6 4-4 -320 0.125 0.290 0.25 200,000 Unwelded 4-5 -423 0.110 0.255 0.25 750,000
When an approximate cor rec t ion was made f o r t h e l o s s of a c c e l e r o m e t e r s e n s i t i v i t y
a t -423"F, an even grea te r d i f fe rence in cumula t ive count be tween -320 and
-423'F was ind ica t ed .
Material Specimen Test Crack, in. Tr igger Cumulative Wire No. Temperature, OF - A0 - 2C Level, v o l t s Count
2014-T6 PT19-1 75 0.098 0.300 0.32 13,500 2319 Wire -4 -320 0.095 0.300 0.32 85,000
-4 -320 0.095 0.300 0.18 (a> 35s, 000
2014-T6 PT43-15 75 0.193 0.430 9.79 325 4043 Wire -4 5 -320 0.185 0.450 0.18 ( a> 77,500
( a ) t r i g g e r l e v e l c o r r e c t e d t o c o m p e n s a t e f o r t h e l o s s o f s e n s i t i v i t y a t -320°F.
The curves and crack photographs for the above data are p resen ted i n F igu res
5 7 through 60.
The h igh count recorded in the c ryogenic tests was suspected
to b e t h e r e s u l t o f ice f o r m a t i o n i n t h e c r y o s t a t a n d o n t h e t o o l i n g . To
ve r i fy t h i s obse rva t ion , spec imen I w a s s u b j e c t e d t o a succession of loadings.
F igure 61 is t h e p l o t of cumulat ive count (TSWE) versus load as produced on an
X-Y recorder dur ing loading; on t h i s f irst c y c l e of loading a t -320°F t h e l o a d
was dumped a t 32.5 k i p s a f t e r r e c o r d i n g 500,000 coun t s . Af t e r t he 1st c y c l e ,
t h e LN was removed f rom the c ryos t a t . When t h e t o o l i n g had warmed
to above 32"F, the specimen w a s replaced and LN added p r e p a r a t o r y t o tllc 2
2
54
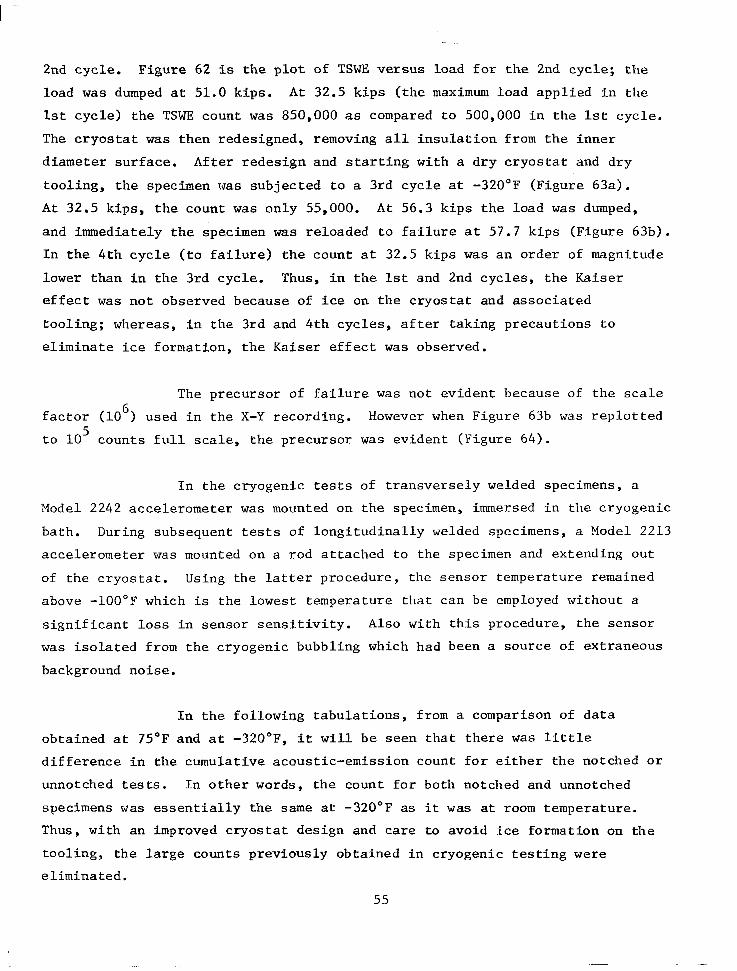
2nd cyc le . F igure 62 is t h e p l o t o f TSWE v e r s u s l o a d f o r the 2nd c y c l e ; t h e
load w a s dumped a t 51.0 kips. A t 32.5 k i p s ( t h e maximum l o a d a p p l i e d i n t h e
1st c y c l e ) t h e TSWE count w a s 850,000 as compared t o 500,000 i n t h e 1st cyc le .
The c r y o s t a t w a s then redesigned, removing a l l i n s u l a t i o n f r o m t h e i n n e r
d iameter sur face . Af te r redes ign and s ta r t ing wi th a d ry c ryos t a t and d ry
too l ing , the spec imen was s u b j e c t e d t o a 3rd cyc le a t -320°F (Figure 63a) .
A t 32.5 kips , the count w a s on ly 55,000. A t 56.3 k i p s t h e l o a d w a s dumped,
and immediately the specimen was r e l o a d e d t o f a i l u r e a t 57.7 kips (Figure 63b) .
In t h e 4 t h c y c l e ( t o f a i l u r e ) t h e c o u n t a t 32.5 k i p s w a s an o rder of magnitude
lower t han i n t he 3 rd cyc le . Thus, i n t h e 1st and 2nd c y c l e s , t h e Kaiser
e f f e c t w a s not observed because of ice on the c ryos ta t and assoc ia ted
too l ing ; whereas , i n t he 3 rd and 4 th cyc le s , a f t e r t ak ing p recau t ions t o
e l i m i n a t e ice fo rma t ion , t he Kaiser e f f e c t w a s observed.
The p r e c u r s o r o f f a i l u r e w a s not evident because of t h e s c a l e
fac tor (10 ) used i n t h e X-Y recording. However when Figure 63b w a s r e p l o t t e d
t o 1 0 c o u n t s f u l l s c a l e , t h e p r e c u r s o r was evident (Figure 64) .
6
5
I n t h e c r y o g e n i c tests o f t r ansve r se ly welded specimens, a
Model 2242 acce lerometer w a s mounted on the specimen, immersed i n t h e c r y o g e n i c
bath. During subsequent tests o f l ong i tud ina l ly welded specimens, a ?lode1 2213
accelerometer was mounted on a rod a t tached to the specimen and extending out
of t he c ryos t a t . Us ing t he l a t t e r procedure, the sensor temperature remained
above -100°F which is the lowest t empera tu re that can be employed without a
s i g n i f i c a n t l o s s i n s e n s o r s e n s i t i v i t y . A l s o w i t h t h i s p r o c e d u r e , t h e s e n s o r
w a s isolated f rom the cryogenic bubbl ing which had been a source of extraneous
background noise.
I n t h e f o l l o w i n g t a b u l a t i o n s , from a comparison of data
obtained a t 75°F and a t -320"F, i t w i l l b e s e e n t h a t t h e r e was l i t t l e
d i f f e r e n c e i n t h e c u m u l a t i v e a c o u s t i c - e m i s s i o n c o u n t f o r e i t h e r t h e n o t c h e d o r
unnotched tests. In other words, the count for both notched and unnotched
specimens w a s e s s e n t i a l l y t h e same a t -320°F as i t w a s at room temperature .
Thus, with an improved cryostat design and care to avoid ice formation on the
too l ing , t he l a rge coun t s p rev ious ly ob ta ined i n c ryogen ic t e s t ing were
e l imina ted .
55

Material
Unnotched 2014-T6
PTC-Tension 2014-T6
Unno t c hed
(2319 Wire) 2014-T6
PTC-Tension 2014-T6 Welded (2319 Wire)
Unnotched 2219-T87
Unnotched
Specimen No.
C
E G F
2
8 9
22
25 36
21
26
1 3
H** J K L*k"
27 2219-T87 Welded (2319 Wire) 32
PTC-Tension 29 2219-T87 Welded (2319 Wire) 31
34
Test Temperature
(OF)
75
-320 -320 -320
75
-320 -320
75
-320 -320
7 5,
-326)'
75
-320 -320 -320 -3 20
7 5
-320
75
-320 -320
High Pass F i l t e r
KHz
60 + 100
60 + 60 60 + 60 60 + 60
90 + 90
54 + 54 50 + 50
90 + 90
60 -k 60 54 + 54
90 + 90
60 + 60
90 + 30
60 + 60 60 + 6G 60 + GO 60 + 60
90 + 90 54 + 54
90 + 90
54 + 54 54 + 54
(Se t Po in t ) Trigger Level
2.1*
7.5 7.0 6.0
8.0
7.0 6.0
8.0
3.8 8.0
8 - 0
5.0
8.0
6.0 4.0 1.1 6.0
8.0
-
8.0
6.0 7.0
Cumulative SWE Count
0.15 x 10
0.19 x 10
0.36 x lo6
0.065 x 10
6
6
0.18 x 10⁶
6
0.085 x 10 6
0.090 x 10⁶
1.8 x 10
0.72 x 10
6
6
0.35 x 10⁶
0.28 x 10
0.15 x 10
G
6
0.14 x 10 6
0.29 x LO 4 0.07 x IO6 0.15 x PO6' 0.80 x 10⁶
0.13 x 10
0.11 x 10
6
6
0.08 x 10 6
0.20 x 10 6
0.15 x lo6
*Specimen C y l i k e t h e o t h e r s p e c i m e n s i n t h i s t a b u l a t i o n , w a s t e s t e d w i t h 100 db of gain. However, t he da t a fo r spec imen C were f i l t e r e d a t a band width of 60 KHz t o 600 KHz a n d t h e t o t a l i z e r w a s t r i g g e r e d a t a set p o i n t of 2.1 (20 t o 40 db range).
**Specimens F, H and L were t e s t e d b e f o r e r e d e s i g n of t h e c r y o s t a t ; t h e s e specimens had tile highest count of the cryogenica l ly t es ted , paren t -meta l , unn~~tc'hed specir.wns.

I -
a. Effect o f T ransduce r Sens i t i v i ty i n Cryogenic Testinq
I n a d d i t i o n t o the problem of i c i n g i n the tool ing and cryo-
stat, t h e r e was a l s o a problem with low s e n s i t i v i t y i n t h e t r a n s d u c e r u s e d
fo r c ryogen ic t e s t ing . Both of these problems w e r e suspec ted t o have con t r i -
bu ted t o t he l ack o f p recu r so r i n a number of the c ryogenic tests.
Consider the d a t a i n the fo l lowing t abu la t ion where t he earlier
t e s t i n g was done using a Model 2242 acce lerometer spr ing mounted on t h e t es t ,
specimen, immersed i n t h e c r y o g e n i c b a t h ; and t h e later t e s t i n g w a s done with
a Model 2213 accelerometer mounted on a rod , ou ts ide the c ryogenic ba th .
Material Specimen Wire No.
2014-T6 PT43-41 2043 Wire -43
45
2014-T6 8 Unwelded
2014-T6 26 2319 Wire
Specimen Test Tr igger Thickness, Temperature, Crack, in. Level, Cumulative
in . OF - A 0 2~ v o l t s Count x 103 - 0.210 -320 0.055 0.244 0.3(a) 47 0.314 -320 0.122 0.406 0.3(a) 43 0.496 -320 0.185 0.450 0.3(a) 23
0.319 -320 0.127 0.479 (b) 100
0.319 -320 0.151 0.514 5(b) (c) 155
(a) t ransversely welded specimens tested i n 19G9. (b) set po in t fo r Dunegan t o t a l i z e r , t e s t e d i n 1971. ( c ) l ong i tud ina l ly welded specimen
The ampl i f ica t ion (ga in) used bo th in 1969 and in 1971 w a s approximately 100 db.
The sens i t i v i ty o f t he t r ansduce r s , however, w a s a p p r e c i a b l y d i f f e r e n t ; v i z . ,
10 pk mV/pk g v o l t a g e s e n s i t i v i t y f o r t h e 2242 and 44 pk mV/pk g f o r t h e 2213
accelerometer. The s e n s i t i v i t y o f t h e 2242 accelerometer is o n l y s l i g h t l y
a f f ec t ed by temperature down t o and including -320OF. The 2213 mounted on
the end of a rod w a s opera t ing a t about +40°F and , t he re fo re , a l so w a s unaf fec ted
by the temperature of the bath.
57

The p l o t s of acoust ic-emission count versus load €or t h e 1969
tests us ing t he 2242 accelerometer are shown i n F i g u r e 65; t h e f l a w s are shown
i n F igure 6 6 . N o t e t h a t t h e r e w a s l i t t l e o r no precursor of f a i l u r e . The
acoust ic-emission produced by crack growth in these tests w a s probably obscured
by ice as w e l l as t h e low s e n s i t i v i t y of t h e 2242 accelerometer.
The p l o t s of acoust ic-emission count versus load for the
tests using the 2213 accelerometer mounted on a rod , ou t s ide t he c ryogen ic
b a t h are shown i n F i g u r e 67. N o t e t h a t t h e r e w a s no longer a high count a t
low load, but a typical, gradual , s tepped increase i n coun t with i n c r e a s i n g
load , However, t h e r e was still no d e f i n i t e p r e c u r s o r o f f a i l u r e . The unwelded
specimen showed a marked increase i n count a t f a i l u r e b u t it o c c u r r e d i n o n l y
two b u r s t s r i g h t a t f a i l u r e .
a. Response of 2242 and 2213 Accelerometers
Specimen No. 27 w a s 2219-T87, longi tudina l ly welded wi th
2319 wire, without a d e l i b e r a t e f l a w . The specimen had two p r i o r l o a d c y c l e s
a t room temperature, one to 36.85 kips and another to 38.30 kips. In t h e
t h i r d l o a d i n g a t room temperature , a 2213 accelerometer w a s sp r fng mounted on
the test specimen. The d a t a were f i l t e r e d a t a band width of 60 YJtz t o 600 Kilz
w i t h 100 db of gain. The Dunegan t o t a l i z e r w a s t r i g g e r e d at a set point of
2.0 (20 to 40 db range). Because of the p r i o r loading t o 38.3 k i p s , one would
not expec t a s i g n i f i c a n t c o u n t b e f o r e 38 kips (Kaiser E f f e c t ) . There w a s i n
f a c t a count of about 700 up t o 38 k ips . Fa i lu re occu r red a t 40.65 k ips .
Between 33 and 40 k i p s , t h e r e was an unmis t akab le p recu r so r , w i th an i nc rease
in coun t of 61,000 i n t h i s i n t e r v a l of load (see Figure 41) .
Specimen C w a s 2014-T6 pa ren t metal without a d e l i b e r a t e
f l aw , t e s t ed a t 70°F. Two t r ansduce r s were mounted on t h e test specimen; one
w a s a Model 2242 acce lerometer and the o ther was a Model 2213 accelerometer .
The d a t a were f i l t e r e d a t a band width of 60 KHz t o 600 l3iz with 100 db of gain.
58

The Dunegan t o t a l i z e r w a s t r i g g e r e d a t a set point of 2 .1 (20-40 db r ange ) fo r
t h e 2213 accelerometer and 6.5 (0-20 db rHnge) f o r t h e 2242 accelerometer. With
these se t t i ngs , t he background no i se a s soc ia t ed w i th t he 2242 acce lerometer w a s
j u s t above the t r i g g e r level and t h e background no ise assoc ia ted wi th the 2213
was j u s t be low the t r i gge r level.
The acoust ic-emission data for Specimen C a t i n t e r m e d i a t e
load (25 t o 35 kips) are shown i n F i g u r e 68a. A t 10 f u l l scale r ange , t he
2242 showed a g r a d u a l i n c r e a s e i n count as a r e s u l t of i ts set point; whereas,
t h e 2213 showed no count a t a l l . When t h e r a n g e w a s changed t o 1 0 , t h e 2242
showed even more c l e a r l y t h e s t e a d y i n c r e a s e i n count as t h e r e s u l t o f back-
g round no i se , bu t no i nc remen ta l i nc reases un t i l abou t 30 k i p s when t h e r e w a s
a jump of 2600 counts recorded by the 2242 accelerometer and 3200 counts by the
2213 accelerometer . This vas followed by several b u r s t s of emission a t about
32 k i p s ; i n t h e s e b u r s t s t h e Model 2242 count increased by 8700 and the Plodel
2213 count increased by about 26,000. Thus, i n t he i n t e rmed . i a t e l oad r ange ,
t h e 2242 a c c e l e r o m e t e r f a i l e d t o r e c o r d some of t h e small b u r s t s of a c t i v i t y ,
and when i t d id record , the count w a s smaller than t ha t r eco rded by the 2213
acce lerometer .
5
4
Figure 68b f o r Specimen C shows t h a t t h e Model 2213
acce lerometer s tar ted to de t ec t con t inuous emis s ion f rom p l a s t i c de fo rma t ion
in t h e t e s t specimen a t about 42 k ips . From t h i s l o a d u n t i l t h e s p e c i m e n
was unloaded a t 44 k i p s , t h e Model 2213 r eco rded an i nc rease i n coun t o f
123,000; whereas , the Model 2242 recorded an increase of only 6 ,500. These
d a t a show t h a t a t l o a d s n e a r f r a c t u r e w h e r e t h e p r e c u r s o r would be expected,
t h e 2213 acce lerometer gave l a rger counts for ind iv idua l burs t s and la rger
cumula t ive count than the 2242 accelerometer. Thus, i t a p p e a r s t h a t i n
c r y o g e n i c t e s t i n g w i t h Model 2242 acce lerometers , as conducted i n t h e f i r s t
p h a s e o f t h i s s t u d y , t h e l o w s e n s i t i v i t y o f t h e Model 2242 acce lerometer
c o u l d e x p l a i n t h e l a c k o f p r e c u r s o r i n many of t h e tests. However, t h e l a c k
o f p r e c u r s o r i n t h e s e c o n d - p h a s e t e s t i n g r e m a i n s t o b e e x p l a i n e d .
59

I n the next sec t ion where the e f f e c t s of a wave guide
will be d i scussed , i t w i l l b e shown i n PTC-tension specimen No. 3 tha t even
with s i g n a l a t t e n u a t i o n i n t h e wave guide, the 2213 accelerometer recorded
l a r g e r jumps than t h e spring-mounted 2242 accelerometer .
b. A t t e n u a t i o n o f S i g n a l i n t h e Wave Guide
Specimen No. 28 w a s 2219-T87, l o n g i t u d i n a l l y welded
wi th 2319 wire, without a d e l i b e r a t e f l a w . The specimen had two p r io r l oad -
i n g s a t room tempera ture , one to 32.5 kips and the second to 40.0 k i p s . I n
t h e t h i r d l o a d i n g , two Model 2213 acce lerometers were used, one mounted on t h e
end of a wave gu ide and t he o the r sp r ing mounted on t h e test specimen. The
wave gu ide cons i s t ed of a 1/2-in.-dia round of aluminum, stud mounted on t h e
shank of t h e t e s t specimen, with a bend t o b r i n g t h e end of t h e r o d up ou t o f
the cryogenic bath. With this set-up the end of the rod where the sensor was
mounted was about +40°F. The l eng th of t h e wave gu ide was 20 inches.
The third loading of specimen No. 28 w a s done a t room
temperature. The d a t a were f i l t e r e d a t a band width of 60 KHz t o 600 KHz
with 100 db of ga in . The Dunegan t o t a l i z e r w a s t r i g g e r e d a t a set point of
1.0 (20 to 40 db range) for the 2213 acce le romete r sp r ing mounted o n t h e test
specimen and a t a s e t p o i n t o f 2.0 (20 t o 40 db r ange ) fo r t he 2213 accelerometer
mounted o n t h e wave guide
Acoustic-emission data a t approximate ly 10 k ips are
shown i n F i g u r e 69a. A t 10 ful l -scale range, the spr ing-mounted 2213 acce le ro -
meter gave an average count in 19 burs t s o f 10 coun t s pe r bu r s t as t aby la t ed
i n T a b l e X I I I , whereas, the wave-guide xounted 2213 accelerometer gave an
average count in 1 9 b u r s t s of 4.5 counts per burs t .
3
60

TABLE X I 1 1
BURST (I.)
a
b
C
d
e
m
n
0
P
q r
S
- INCREASE I N COUNZ
2213 ACCELEROMETER
SPRING MOUNTED
9 . 5
7.0 9.5
. 3
2.0
.9
1.2
2.2
6.5 12.2
15.3 11.5
39.5
2.8
17.5
49.5
WAVE GUIDE
7.0 1.0
9.2
8.6 1.3
- 5
- .7
2.2
7.0
8.5
7.5 18.0
.6
1.5 12 .o
("See F i g u r e 69a.
6 1
I

k t 1 5 k i p s , t h e r a n g e w a s changed t o l o4 f u l l scale.
A t th is range, the wave-guide mounted accelerometer did not show a n y a c t i v i t y
u n t i l somewhat over 40 kips, and the spring-mount accelerometer showed on ly
one s ign i f i can t bu r s t (200 coun t s ) p r io r t o 40 k ips (Ka i se r E f fec t ) .
A t s l i g h t l y o v e r 40 kips , the spr ing-mounted accelerometer
recorded several small b u r s t s a n d t h e start of cont inuous emission (Figure 63b) .
The wave-guide mounted accelerometer did not record continuous emission and
d i d n o t show t h e o n s e t of f r a c t u r e u n t i l j u s t b e f o r e f a i l u r e (41.25 kips). Thus,
t h e r e a p p e a r s t o h a v e b e e n s i g n a l a t t e n u a t i o n i n t h e wave guide.
Specimen 3 w a s 2014-T6, longi tudinal ly welded with 2319
wire; the specimen contained a part-through-crack. Two t r ansduce r s were used
i n t h e test, one a Model 2242 acce lerometer spr ing mounted on t h e test specimen
a@ t h e o t h e r a Model 2213 accelerometer mounted on t h e wave guide. The d a t a
were f i l t e r e d a t a band width of 60 KHz t o 600 KHz with 100 db of gain. The
Dunegan t o t a l i i e r w a s t r i g g e r e d a t a set p o i n t of 2.6 (20 t o 40 db r a n g e ) f o r
t h e Model 2213 acce lerometer on the wave guide and a t a se t p o i n t of 6.5
( 0 t o 20 db r ange ) fo r t he Model 2242 accelerometer spring mounted on t h e test
spec imen. Wi th these se t t ings bo th t ransducers were j u s t i n s i d e t h e n o i s e
(continuous emission) band. Figure 70 shows the s t r ip -char t record ing of
l o a d v e r s u s c u m u l a t i v e c o u n t f o r t h e ' f i r s t c y c l e o f l o a d i n g . N o t e t n a t e v e n
w i t h t h e a t t e n u a t i o n i n t h e wave g u i d e , t h e 2213 accelerometer recorded larger
jumps than the 2242 acce lerometer .
On t h e s e c o n d l o a d c y c l e t o f a i l u r e ( a t 33.45 k i p s ) t h e
low s e n s i t i v i t y of t h e spring-mounted 2242 accelerometer w a s a p p a r e n t ; i n
F igure 71, n o t e t h e marked precursor f rom the 2213 accelerometer with a count
of 330,000 as compared with only 42,000 from the 2242 acce lerometer .
62

Note t h a t 2219-T37 specimen No. 28 with the 2213
acce lerometer mounted on a wave guide (F igure 6 3 ) gave l i t t l e p recu r so r ,
whereas, 2014-TG specimen No. 3 a l s o w i t h t h e 2213 accelerometer mounted on
a wave guide (Figure 71) gave an unmistakable precursor. No exp lana t ion was
found for this di f ference; however , the comparison does involve two d i f f e r e n t
a l l o y s .
6 3

C. SUBSCALE PRESSURE VESSEL RESULTS
1. Room Temperature Test of 2014-T6 Aluminum Pres su re Vessel
The fo l lowing t abu la t ion i nd ica t e s t he hydro te s t ' i ng s equence
used for the 2014 vessel t e s t e d a t room temperature .
Hold at P r e s s u r e P r e s s u r e Rate M a x . Load
Cycle (Ps i ) (psi /min .) ( s e d Pre-Flaw
1 0-460 150 30 No
2 0-690 150 30 No
3 0-880 15 0 Fa i l ed on r i s i n g No load a t 886 p s i q
The f a i l e d chamber is shown in F igu re 72 , wh i l e F igu re 73 shows c l o s e up
views o f t h e chamber f r a c t u r e .
A s i n d i c a t e d by t h e a b o v e d a t a , t h e v e s s e l b u r s t a t SO0 ps ig
d u r i n g r i s i n g l o a d a f t e r p r e v i o u s p r e s s u r i z a t i o n s t o 460 and 690 ps ig . The
f r a c t u r e p a t h was en t i r e ly w i th in t he cy l inde r l ong i tud ina l we ld . Based on
the nominal chamber w a l l t h i c k n e s s of 0 .312-in. , the stress l eve l (P r / t where
P i s t h e p r e s s u r e , r i s t h e chamber r a d i u s avd t i s t h e wal l th ickness) a t
f a i lu re app rox ima ted 24 k s i wh ich is s l i g h t l y b e l o w t h e 0 . 2 % o f f s e t y i e l d
s t r e n g t h of 29 ks i p rev ious ly de t e rmined fo r t h i s base -me ta l f i l l e r -wi re
(2014-T6 - 2319) combination.
Figure 74 shows t h e p r e s s u r e v s s t r a i n d a t a o b t a i n e d u s i n g a
s t ra in gage a t tached t o t h e p a r e n t metal i n t h e c e n t e r s e c t i o n of t h e vessel;
no p l a s t i c d e f o r m a t i o n w a s p r o d u c e d i n t h i s area during any of t h e p r e s s u r e
cyc le s .
6 4

Figure 75 is a p l o t of the cumula t ive stress wave emission vs
p res su re fo r t he t h ree hydro te s t cyc le s . The d a t a were obtained by monitoring
t h e SWE detected by Sensor No. 3 l oca t ed at t h e c e n t e r of t h e c y l i n d r i c a l
sect ion. Note in Figure 75 t h a t the Kaiser E f f e c t was observed as ind ica t ed
by t h e fact t h a t s i g n i f i c a n t SWE were p o t d e t e c t e d d u r i n g t h e s e c o n d o r t h i r d
p r e s s u r i z a t i o n c y c l e u n t i l t h e maximum p r i o r p r e s s u r e (460 p s i and 690 p s i ,
respect ively) was exceeded. Although no SWE were de tec t ed a t ho ld du r ing t he
first pressure cyc le (460 p s i ) , SFIE were observed during the first f e w seconds
of hold (690 psi) in ; the second cycle . During the t h i r d c y c l e , significant
b u r s t s of SWE were detected above 690 p s i and cont inued un t i l vessel f a i l u r e
occurred at 880 p s i , From t h e d a t a i n Figure 75, it is o b v i o u s t h a t s u f f i c i e n t
warning was obtained from t h e s e SWE d a t a t o p e r m i t d e p r e s s u r i z a t i o n and prevent
fa i lure of t h e vessel,
Figures 76 through 78 are p l o t s showing the l o c a t i o n s of t h e
SWE detected during each pressurizing cycle; each p l o t is a reproduct ion of
the SWE d a t a as displayed on the SWAT system monitor in rea l - t ime dur ing the
test. I n g e n e r a l , more randomly loca ted SWE are observed during the first
cycle and from d i f f e r e n t areas t h a n t h e SWE observed during the second and t h i r d
cycles . However, each of the plots show mult iple emissions f rom two g e n e r a l
areas of the vessel longi tudinal weld toward the center of t h e c y l i n d r i c a l
sec t ion . This is r e f l e c t e d by t h e i n c r e a s e d s i z e and darkening of the emission
sources as shown on the monitor screen and in t h e s e p l o t s . As i nd ica t ed in
Figure 78, t h e o r i g i n of f a i lu re , co r re sponded t o one of these mu l t ip l e emis s ion
sources on the longi tudinal weld.
Figure 79 schematical ly shows t h e l o c a t i o n of defec ts observed
on X-rays of t h e l o n g i t u d i n a l w e l d p r i o r t o t e s t i n g . Two areas of tungsten
and/or non-metall ic inclusions were observed in t h e X-rays and are l o c a t e d i n
t h e same areas f rom which the mult iple emissions were detected by the SWAT
sys tern.
65

Figures 80 and 81 show the f r ac tu re f ace and de fec t s obse rved
o n t h e f r a c t u r e s u r f a c e , r e s p e c t i v e l y ; b o t h p o r o s i t y and n o n m e t a l l i c i n c l u s i o n s
o r l a c k of f u s i o n are shown. The weld l o c a t i o n s o f t h e d e f e c t s are schemat i ca l ly
shown i n F i g u r e 78 and gene ra l ly co r re spond t o t he we ld l oca t ions o f SWE d e t e c t e d
during vessel p r e s s u r i z a t i o n .
In add i t ion t o f r ac tog raph ic examina t ion of t h e f r a c t u r e
s u r f a c e s , u l t r a s o n i c and dye pene t ran t inspec t ion techniques were used i n an
a t t e m p t t o i d e n t i f y p o s s i b l e d e f e c t s a s s o c i a t e d w i t h t h e random emission sources
shown i n F i g u r e s 76 through 78; n o d e f e c t s were observed at any of these loca-
t i o n s .
From the above d i scuss ion , it is appa ren t t ha t t he cumula t ive
p l o t of t h e SWE provided a clear p recu r so r of impending f a i l u r e and through
real t i m e t r i a n g u l a t i o n of t he de t ec t ed emis s ions , i t w a s p o s s i b l e t o l o c a t e
the sou rce of t he emis s ions and subsequen t f a i lu re o r ig in . Such da ta cou ld
.have been employed t o t e r m i n a t e l o a d i n g , l o c a t e t h e p o t e n t i a l f a i l u r e o r i g i n
a n d r e p a i r t h e vessel.
2. Room Temperature Test of 2219-T87 Aluminum P r e s s u r e Vessel
T h e f o l l o w i n g t a b u l a t i o n i n d i c a t e s t h e s i g n i f i c a n t tes t d a t a
for t h e 2219 p r e s s u r e v e s s e l t e s t e d a t room temperature.
66

Cycle
1
2
3
4 5
6
7 8
9 10 11
P r e s s u r e P r e s s u r e Level Rate
(psi.) (psi/min)
0 - 300 75
0 - 400 75
0 - 400 200
0 - 400 75
0 - 500 75
0 - 680 100
0 - 860 100
0 - 600 200 600 - 1250 50
0 - 1400 100
0 - 1500 100
0 - 1530 * ( F a i l u r e ) 100
Pre-Flaw
No
No
NO
Yes
Yes
Yes
Yes
Yes
Yes (Double) * Yes (Double) * Yes (Double) *
* A second PTC flaw (0.30-in. deep x 0.60-in. long) was added i n t h e l o n g i - t u d i n a l weld be tween the e ighth and n in th p ressur iz ing cyc les .
Figure 82 shows t h e f a i l e d chamber wh i l e F igu re 83 shows a
close-up view of t he chamber f r a c t u r e .
A s i n d i c a t e d by t h e a b o v e t a b u l a t i o n , t h e vessel bu r s t du r ing
t h e e l e v e n t h p r e s s u r i z i n g c y c l e a t 1530 p s i g a f t e r p r i o r p r e s s u r i z a t i o n s t o
v a r i o u s levels as h igh as 1500 psig. Based on a nominal wall t h i c k n e s s of
0.35-in. ( includes weld re inforcement) , the stress level ( P r / t ) a t f a i l u r e was
approximated 37 ksi. F a i l u r e o r i g i n a t e d a t a part-through-crack type f law
which w a s ground approximately 0.60-in. long and 0.10-in. deep i n t h e
longi tudina l weld of t h e chamber a f t e r t h e t h i r d p r e s s u r i z i n g c y c l e . B a s e d
on t h e s e r e s u l t s , t h e a p p a r e n t K I C is 23 ksi- in .1/2 (calculated using equat ion
Figure 84 shows t h e f r a c t u r e f a c e w h i c h was contained
e n t i r e l y w i t h i n t h e l o n g i t u d i n a l w e l d . No weld defects such as p o r o s i t y or
67

lack o f fu s ion o r s econda ry f a i lu re o rZg ins w e r e observed on the f r a c t u r e
s u r f a c e . The PTC defec t f rom which f a i l u r e o r i g i n a t e d is shown in F igure 84
as is a second PTC de fec t i n t roduced fo l lowing t he e igh th p re s su r i z ing cyc le .
Figure 85 shows t h e p r e s s u r e vs s t r a i n p l o t f o r t h e f i n a l
two p r e s s u r i z i n g c y c l e s a n d i n d i c a t e s elastic behavior in t h e p a r e n t metal
c y l i n d r i c a l s e c t i o n w h e r e t h e strain gage w a s l o c a t e d ( r e f e r F i g u r e 22).
F igu re 86 shows p lo ts o f cumula t ive SWE vs p r e s s u r e f o r t h e
h y d r o t e s t i n g o f t h e 2219-T87 vessel. The d a t a were obtained by monitoring
channel No. 4 in t h e c e n t e r of t h e chamber (refer F igure 22) . I n a d d i t i o n
t o c o u n t s d u e t o SWE, most of t h e p l o t s show the coun t increases from t h e
pu l se r s igna l s gene ra t ed t h roughou t t he test t o check the SWAT system
ope ra t ion .
Figure 86a is a p lo t o f cumula t ive SWE v e r s u s p r e s s u r e f o r
t h e first three cycles (unflawed condi t ion) . The Kaiser effect is apparent
from t h e d a t a f o r t h e s e c o n d l o a d c y c l e ; t h e d a t a f o r t h e t h i r d c y c l e ( l o a d e d
t o t h e same maximum p r e s s u r e as ob ta ined du r ing the second cycle) shows that
t h e Kaiser E f f e c t is not dependent on loading rate w i t h i n t h e r a n g e s s t u d i e d
in that n o s i g n i f i c a n t SWE were d e t e c t e d when l o a d i n g t o t h e same p r e s s u r e
level a t 200 psi/min vs p r i o r l o a d i n g s a t a p r e s s u r i z a t i o n rate of 75 psi/min.
Figures 86b and 86c are p lo t s o f t he cumula t ive SWE count vs
p r e s s u r e f o r c y c l e s f o u r t h r o u g h n i n e . P r i o r t o t h e f o u r t h l o a d i n g c y c l e , o n e
PTC ( l e n g t h 2 c of 0.6-in. and depth of 0.10-in.) was in t roduced i n t he l ong i -
t ud ina l we ld (shown i n Figure 84) . Again, t h e Kaiser effect was e v i d e n t i n
t h a t a p r e s s u r e g r e a t e r t h a n 400 p s i as r equ i r ed be fo re SWE were de tec t ed
and each succeeding loading required a. h i g h e r p r e s s u r e b e f o r e i n c r e a s e d SWE
a c t i v i t y w a s observed. No SWE were observed during any of the hold per iods
e x c e p t f o r t h e f i f t h c y c l e when l i m i t e d SWE a c t i v i t y was observed during the
f i r s t f ive seconds of hold.
68
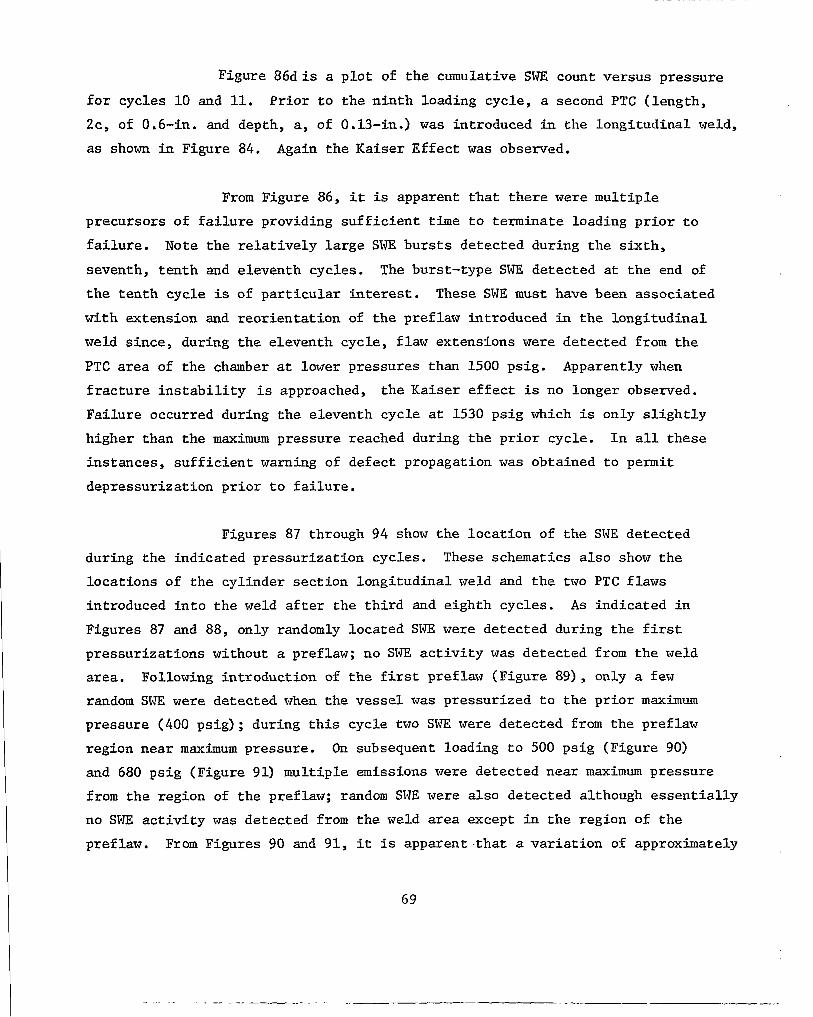
F i g u r e 8 6 d i s a p l o t of the cumula t ive SWE count versus p ressure
f o r c y c l e s 10 and 11. P r i o r t o t h e n i n t h l o a d i n g c y c l e , a second PTC ( l e n g t h ,
2c, of 0.6-in. and depth, a, of 0.13-in.) was introduced in the l ong i tud ina l we ld ,
as shown i n F i g u r e 84. Again t h e Kaiser Effect was observed,
From Figure 86, it is apparent that t h e r e were m u l t i p l e
p r e c u r s o r s o f f a i l u r e p r o v i d i n g s u f f i c i e n t time t o t e r m i n a t e l o a d i n g p r i o r t o
f a i l u r e . N o t e t h e relatively l a r g e S'WE b u r s t s d e t e c t e d d u r i n g t h e s i x t h ,
seventh, tenth and e leventh cycles . The burst- type SWE de tec t ed a t t h e end of
t h e t e n t h c y c l e i s o f p a r t i c u l a r interest. These SWE must have been associated
wi th ex tens ion and r e o r i e n t a t i o n of the p ref law in t roduced in t h e l o n g i t u d i n a l
weld since, d u r i n g t h e e l e v e n t h c y c l e , f l a w e x t e n s i o n s were de tec ted f rom the
PTC area of t h e chamber a t lower pressures than 1500 psig. Apparently when
f r a c t u r e i n s t a b i l i t y i s approached, the Kaiser e f f e c t is no longer observed.
Fa i lu re occu r red du r ing t he e l even th cyc le a t 1530 psig which is o n l y s l i g h t l y
h ighe r t han t he maximum p r e s s u r e r e a c h e d d u r i n g t h e p r i o r c y c l e . I n a l l t h e s e
i n s t a n c e s , s u f f i c i e n t w a r n i n g of defec t p ropagat ion w a s ob ta ined t o pe rmi t
d e p r e s s u r i z a t i o n p r i o r t o f a i l u r e .
F igures 87 through 94 show t h e l o c a t i o n o f t h e STJE de tec t ed
dur ing the ind ica ted p ressur iza t ion cyc les . These schemat ics a l so show t h e
loca t ions o f t he cy l inde r s ec t ion l ong i tud ina l we ld and t h e two PTC flaws
i n t r o d u c e d i n t o t h e w e l d a f t e r t h e t h i r d a n d e i g h t h c y c l e s . A s i n d i c a t e d i n
F igures 87 and 88, only randomly located SWE were de tec t ed du r ing t he first
p res su r i za t ions w i thou t a pref law; no SIJE a c t i v i t y was detected f rom the weld
area. Fol lowing introduct ion of t h e first pref law (F igure 89) , on ly a few
random SWE were de tec t ed when t h e vessel was p r e s s u r i z e d t o t h e p r i o r m a x i m u m
p res su re (400 ps ig) ; d u r i n g t h i s c y c l e two STJE were detected f rom the pref law
reg ion near maximum pressure . On subsequent loading to 500 ps ig (F igu re 90)
and 680 p s i g ( F i g u r e 91) mul t ip le emiss ions were de tec t ed nea r m a x i m u m p res su re
from t h e r e g i o n of the p ref law; random SWE were a l s o d e t e c t e d a l t h o u g h e s s e n t i a l l y
no SWE a c t i v i t y was detected from the weld area e x c e p t i n t h e r e g i o n of t h e
pref law. From Figures 90 and 91, it is a p p a r e n t . t h a t a v a r i a t i o n of approximately
69

2 - i n , e x i s t s i n t h e S\?E s o u r c e t r i a n g u l a t i o n s i n c e t h e SWE group ing fo r t he
p r e f l a w i n b o t h i n s t a n c e s i s approximately 2- t o 3-in. from t h e a c t u a l p r e f l a w
l o c a t i o n .
Figure 92 shows t h a t a l a r g e number of randomly loca ted S\\rT:
were d e t e c t e d d u r i n g t h e s e v e n t h p r e s s u r i z i n g c y c l e ( t o 850 p s i g ) . The d a t a
in F igure 92 a l s o shows a grouping of SWE from t h e r e g i o n of the p ref law.
Comparison wi th the cumula t ive SWE count i n F i g u r e 86b shows t h a t t h e s e SWE were de tec ted a lmost exc lus ive ly above the maximum pressure (680 psig) of t h e
s ix th cyc le . Fu r the r , f rom F igu re 92 , it is a p p a r e n t t h a t a l a r g e number of
random SWE sources were obtained during the seventh cycle which were p r i m a r i l y
small ampli tude emissions s ince no large jumps were observed in the cor re-
sponding cumulative SWE p l o t .
Figures 93 and 94 show t h a t i n comparison t o previous cyc les ,
r e l a t i v e l y few and only randomly located SWE were d e t e c t e d d u r i n g t h e last
p r e s s u r e c y c l e s . Data are n o t shown f o r the n i n t h c y c l e t o 1400 p s i g s i n c e
no SWE sources were displayed on t h e SWAT sys tem moni tor dur ing th i s cyc le .
No SIE were d e t e c t e d from the weld o r PTC pre f l aw r eg ions du r ing p re s su r i za t ion
t o 1250 p s i ( e i g h t h c y c l e ) . F i g u r e 9 4 shows t h e SWE l o c a t i o n s f o r b o t h t h e
t e n t h (1500 p s i ) and e l e v e n t h ( f a i l u r e a t 1530 p s i ) p re s su r i za t ions ; wh i l e
only a f e w $WE sources are shown, t h e s e r e p r e s e n t l a r g e SWE as i n d i c a t e d by
t h e SWE cumulat ive count plots in Figure 86d. The las t SWE d e t e c t e d n e a r f a i l u r e
o r ig ina t ed f rom the r eg ion of t h e PTC pref law a l though offset approximately
4-in. from t h e t r u e l o c a t i o n of t h e f l a w .
Figure 95 schematical ly shows the l ong i tud ina l we ld de fec t s
i n d i c a t e d by X-ray examination of t h e c y l i n d e r l o n g i t u d i n a l w e l d p r i o r t o
t e s t ing . Excep t fo r s even l oca t ions of s ing le po ros i ty , t he we ld was clear.
T h i s would v e r i f y t h e l a c k of SWE a c t s v i t y from t h e weld a rea dur ing tes t ing .
U l t r a s o n i c and dye penetrant inspect ion was performed of non-weld areas of
t h e vessel cyl inder sect ion af ter hydroburst f rom which random SWE were
de tec t ed du r ing t e s t ing . No d e f e c t s were indicated by these examinat ions.
70

3. gryo-genic T-emperature (-320OF) Test of 2014-T6 Aluminum P r e s s u r e Vessel
The s i g n i f i c a n t d a t a f o r e a c h p r e s s u r i z a t i o n of t h e 2014-T6
vessel t e s t e d a t -320'F i s shown below.
P r e s s u r e P r e s s u r e Rate Ho I d Cycle Level (psig/min.) ( sed
1 0 - 550 100 30
2 0 - 975 100 F a i l e d on Rising Load @ 975 p s i g
Pre-Flaw
No
Yes
Figure 96 shows t h e chamber p i e c e s w i t h i n t h e - test c e l l immediately following
f a i l u r e w h i l e F i g u r e 97 shows t h e chamber pieces reassembled. As i n d i c a t e d i n
Figures 96 and 97, the chamber fragmented into approximately 20 pieces on
f a i lu re . F igu re 98 s chemat i ca l ly shows t h e f r a c t u r e s u r f a c e s i n t h e l o n g i t u -
d i n a l w e l d r e g i o n w i t h f a i l u r e o r i g i n a t i n g ( P o i n t A) f rom the cyl inder longi-
t u d i n a l weld near the PTC de fec t i n t roduced i n to t he cy l inde r l ong i tud ina l
w e l d f o l l o w i n g t h e f i r s t p r e s s u r i z a t i o n . It is a l s o p o s s i b l e t h a t a secondary
f a i l u r e o r i g i n i s l o c a t e d a t P o i n t B on the longi tudina l weld a l though the
SWE d a t a i n d i c a t e s f a i l u r e o r i g i n a t e d i n t h e r e g i o n of P o i n t A.
Based on a f a i l u r e p r e s s u r e of 975 p s i g , t h e g r o s s stress
( P r / t ) a t f rac ture approximated 29 ks i . Wi th a PTC l eng th of 0.5-in. and
depth of B.1-in, , the apparent K I C a s s o c i a t e d w i t h t h i s d e f e c t w a s 16 ks i - in .
ca lcu la ted us ing equat ion (1). The measured value of K I C based on t r a n s v e r s e l y
welded PTC t ens ion tests w a s 18.5 ksi- in .
1 /2
112
Figure 99 is a p l o t of cumulative SWE ( d e t e c t e d by senso r
No. 3 l o c a t e d i n t h e c e n t e r o f t h e c y l i n d e r s e c t i o n ) v s p r e s s u r e f o r b o t h l o a d
cyc le s . The unusually high SWE c o u n t d u r i n g t h e i n i t i a l p o r t i o n o f t h e f i r s t
p r e s s u r e c y c l e is due to t he bubb l ing ac t ion p roduced when t h e r e l a t i v e l y warm
71

g a s e o u s n i t r o g e n u s e d f o r p r e s s u r i z a t i o n made c o n t a c t w i t h t h e l i q u i d n i t r o g e n
i n t h e vessel. The i n i t i a l SWAT s y s t e m t r i g g e r level was set on t h e b a s i s of
s ta t ic c o n d i t i o n s p r i o r t o p r e s s u r i z a t i o n . When t h e GNz was in t roduced i n to
t h e vessel, the bubbl ing ac t ion caused the background no ise level t o g r e a t l y
exceed the SWAT sys t em t r i gge r level. The system w a s immediately readjusted
t o a h i g h e r t r i g g e r level; however, when the bubbl ing ac t ion s topped , the
t r i g g e r l e v e l was too h igh t o de t ec t t he con t inuous emis s ion wh ich p robab ly
occurred on f u r t h e r p r e s s u r i z a t i o n d u r i n g t h e f i r s t c y c l e .
In orde r t o c i r cumven t t h i s no i se p rob lem, t he SWXf system
t r i g g e r level was set a t 150 ps ig dur ing the second loading cyc le . A s shown
i n F i g u r e 99, d i s c r e t e i n c r e m e n t a l i n c r e a s e s i n t h e SWE cumulative count sub-
s equen t ly were observed throughout the loading cycle . There w a s a l s o a s l i g h t
i nc rease i n t he s lope o f t he cumula t ive SWE vs pressure plot which has been
associated with defect formation and growth, and the onse t o f f a i lu re . Bo th
o b s e r v a t i o n s ( d i s c r e t e jumps and slope increase) could have been employed t o
t e r m i n a t e p r e s s u r i z a t i o n p r i o r t o f r a c t u r e .
F igu res 100 and 101 show t h e l o c a t i o n s o f SWE de tec ted dur ing
each cyc le . These p lo ts represent the p lan v iew of t h e tes t a r t i c l e and t h e
SWAT video display observed on the sys tem moni tor in real time dur ing the tes t .
The p l o t s a l s o show t h e l o c a t i o n of t h e p r e f l a w i n t r o d u c e d a f t e r t h e f i r s t
cyc le and the f rac ture b ranching (Poin ts A and B , r e f e r a l s o t o F i g u r e 98)
which occurred f rom the main f racture path a long the cyl inder longi tudinal
weld. The SWE are genera l ly randomly loca ted wi th in the cy l inder zone ,
except for the reg ion a round Poin t A on t h e l o n g i t u d i n a l weld from which
mul t ip le emiss ions were d e t e c t e d . SWE were a l s o d e t e c t e d from t h i s area
immedia t e ly be fo re f a i lu re i nd ica t ing t he p r imary f a i lu re o r ig in was a t
P o i n t A . No SWE were detected f rom the remaining area of t h e l o n g i t u d i n a l
weld including the region at P o i n t B which possibly corresponded t o a secondary
f a i l u r e o r i g i n .
72

I-
Figure 79 schemat ica l ly shows t he l oca t ion o f weld d e f e c t s
observed in t h e X-rays of t h e l o n g i t u d i n a l w e l d . Only scattered poros i ty w a s
' obse rved excep t fo r two areas o f m u l t i p l e , a l l i g n e d p o r o s i t y . Areas r e q u i r i n g
r e p a i r a f t e r t h e initial l o n g i t u d i n a l weld w a s made a l s o are shown and i n d i c a t e
t h e e x t e n s i v e reDair we ld ing r equ i r ed t o p roduce r e l a t ive ly accep tab le we lds i n
t h i s material. The l o c a t i o n s o f t h e f r a c t u r e b r a n c h i n g from t h e main f r a c t u r e
pa th and the poss ib l e p r imary (A) and secondary (B) f r a c t u r e o r i g i n s are a l s o
shown i n F igure 7 9 . Figures 102 through 104 show magnified views of t h e
f r a c t u r e s u r f a c e a t A and B. The reg ion of m u l t i p l e p o r o s i t y n e a r P o i n t A is
read i ly appa ren t i n -F igure 103 and is though t t o be a source of m u l t i p l e SWE
d e t e c t e d f r o m t h i s area d u r i n g b o t h p r e s s u r i z a t i o n c y c l e s .
U l t r a son ic and dye penetrant examination of t h e chamber did
n o t i d e n t i f y any d e f e c t s a t t h e l o c a t i o n s of t h e random emissions shown i n
Figures 100 and 101.
4 . Cryogenic Temperature (-320°F) Test of the 2219-T87 P res su re Vessel
The fo l lowing t abu la t ion shows t h e s i g n i f i c a n t d a t a f o r e a c h
c y c l e f o r t h e 2219-T87 test @ -320OF.
Pressure Level Pressure Rate Hold Cycle (PSif3) (psig/min .) (set) Pre-Flaw
1 0 - 550 100
2 0 - 1000 100
3 0 - 1000 100
4 0 - 1000 100
30
30
180
12 0
No
Yes
Yes
Yes
5 0 - 945 100 P a i l e d on Rising Yes Load @ 945 p s i g
Because of p o t e n t i a l damage t o t h e test c e l l , t h e maximum pres su re w i thou t
f a i l u r e was l i m i t e d t o 1000 ps ig ; if f a i l u r e d i d n o t o c c u r when t h e chamber
w a s p r e s s u r i z e d t o t h i s l e v e l , t h e PTC de fec t w a s success ive ly en la rged be fo re
subsequent p ressur iza t ions .
73
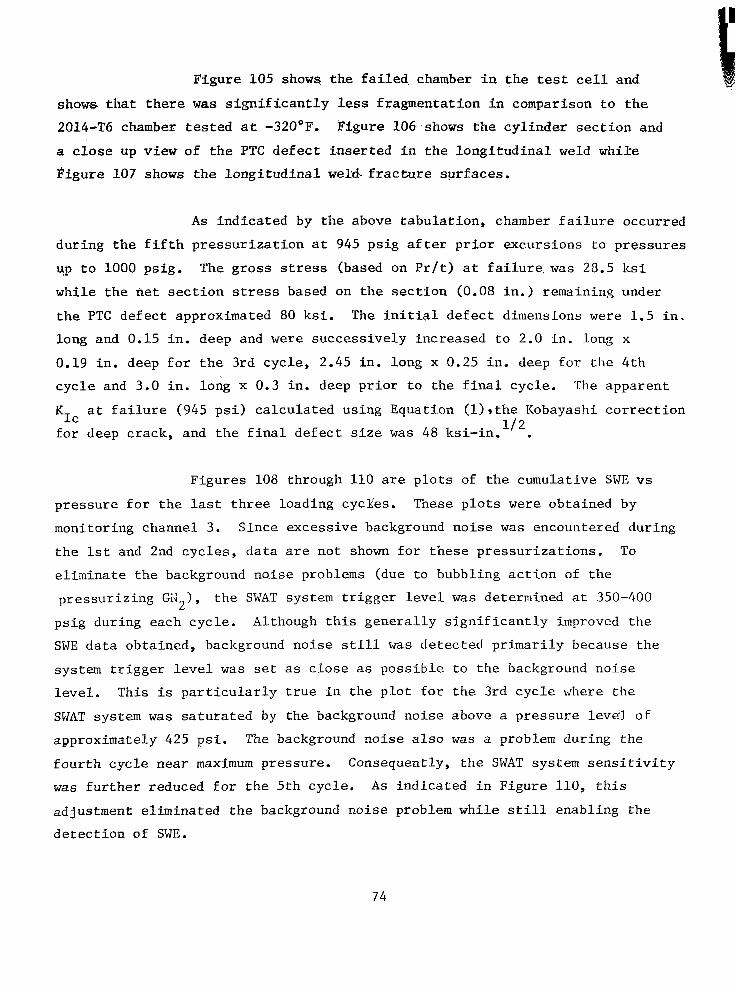
Figure 105 shows the f a i l e d . chamber i n t h e test ce l l and
shows t h a t t h e r e was s i g n i f i c a n t l y less f ragmenta t ion i n comparison to the
2014-T6 chamber t e s t e d a t -320OF. Figure 106 shows t h e c y l i n d e r s e c t i o n a n d
a c l o s e up view o f t h e PTC d e f e c t i - n s e r t e d i n t h e l o n g i t u d i n a l weld whi le
Pigure 107 shows t h e l o n g i t u d i n a l weld- f r ac tu . r e su r f aces .
A s i nd ica t ed by the above t abu la t ion , chamber f a i l u r e o c c u r r e d
dur ing the f i f t h p r e s s u r i z a t i o n a t 945 p s i g a f t e r p r i o r e x c u r s i o n s t o p r e s s u r e s
up t o 1000 psig. The gross stress (based on P r / t ) a t f a i l u r e , w a s 28.5 k s i
w h i l e t h e het s e c t i o n stress based on t h e s e c t i o n (0.08 in.) remaining under
t h e PTC defect approximated 80 k s i . The i n i t i a l d e f e c t d i m e n s i o n s were 1 . 5 i n .
long and 0.15 in. deep and were s u c c e s s i v e l y i n c r e a s e d t o 2.0 in . long x
0.19 in . deep fo r t he 3 rd cyc le , 2.45 in . long x 0 .25 in . deep for the 4 th
cycle and 3.0 in. long x 0 . 3 i n . d e e p p r i o r t o t h e f i n a l c y c l e . The apparent
K I c a t f a i l u r e (945 ps i ) ca lcu la ted us ing Equat ion ( l ) , the Kobayashi cor rec t ion
f o r d e e p c r a c k , a n d t h e f i n a l d e f e c t s i z e was 48 ksi- in . . 1 / 2
F igures 108 through 110 are p l o t s of the cumula t ive SWE vs
p r e s s u r e f o r t h e l a s t th ree l oad ing cyc le s . These p lo t s were obtained by
monitoring channel 3. Since excessive background noise was encountered during
t h e 1st and 2nd c y c l e s , d a t a are no t shown f o r t h e s e p r e s s u r i z a t i o n s . To
e l iminate the background no. ise problems (due to bubbl ing act ion of t h e
p re s su r i z ing GiJ >, t h e SWAT sys t em t r i gge r l eve l was determined a t 350-400
ps ig du r ing each cyc le . A l though t h i s gene ra l ly s ign i f i can t ly improved t h e
SWE data obtained, background noise s t i l l was de tec t ed p r imar i ly because t he
s y s t e m t r i g g e r l e v e l w a s set as c l o s e as poss ib le to the background no ise
leve l . This i s p a r t i c u l a r l y t r u e i n t h e p l o t f o r t h e 3 r d c y c l e w h e r e t h e
SWAT system was s a t u r a t e d by the background noise above a p r e s s u r e l e v e l of
approximately 425 p s i . The background noise a lso was a problem during the
f o u r t h c y c l e n e a r maximum pressure. Consequent ly , the SWAT s y s t e m s e n s i t i v i t y
w a s f u r t h e r r e d u c e d f o r t h e 5 t h c y c l e . A s i n d i c a t e d i n F i g u r e 1 1 0 , t h i s
adjustment el iminated the background noise problem while s t i l l enab l ing t he
de tec t ion of SWE.
2
74

From Figure 110, i t is a p p a r e n t t h a t t h e r e w a s no w e l l
d e f i n e d p r e c u r s o r o f f a i l u r e d u r i n g t h e f i f t h c y c l e a l t h o u g h t h e r e were
d i s c r e e t s t e p s i n t h e SWE cumula t ive count ind ica t ing the occurrence of defect
formation or propagat ion which would p e r m i t d e p r e s s u r i z a t i o n p r i o r t o f a i l u r e .
F igu res 111 through 113 are p l o t s showing t h e l o c a t i o n s of
SWE d i sp layed on t h e SWAT system monitor during the 3rd, 4 th and 5th cycles .
The l oca t ions o f t he l ong i tud ina l we ld and PTC f l aw in t roduced i n to t he weld
following the second cyc le are a l s o shown. P l o t s f o r t h e 1st and 2nd c y c l e s
are n o t shown because o f the excess ive background no ise due to the n i t rogen
bubbling. A s i n d i c a t e d i n t h e s e f i g u r e s , l a r g e r o r m u l t i p l e e m i s s i o n s ( h e a v y
b l a c k d o t s ) were d e t e c t e d i n t h e l o c a t i o n of t h e l o n g i t u d i n a l weld and t h e
pref law dur ing the 3 rd , 4 th and 5 th cyc les . Dur ing the 5 th cyc le , emiss ion
sources were d e t e c t e d f rom a long the longi tudina l weld , and mul t ip le emiss ions
were de tec t ed from t h e r e g i o n of t h e PTC f law inc luding th ree emiss ions
immedia t e ly p r io r t o f a i lu re . From t h e s e p l o t s , i t is appa ren t t ha t an
e r r o r of approximate ly 3 - in . ex is ted be tween the ac tua l p ref law loca t ion and
t h e l o c a t i o n i n d i c a t e d by t h e SWAT system. However, t h e s e d a t a , i n combination
with the corresponding cumulat ive SWE p l o t s ( F i g u r e l o g ) , would have permitted
d e p r e s s u r i z a t i o n p r i o r t o f a i l u r e a n d l o c a t i o n of t h e d e f e c t f o r repair.
F igu re 95 schemat i ca l ly shows t h e r e s u l t s of X-ray examination
of t h e l o n g i t u d i n a l w e l d p r i o r t o t e s t i n g o f t h e v e s s e l . From t h i s f i g u r e ,
i t is apparent tha t the weld w a s e s s e n t i a l l y f r e e of d e t e c t a b l e d e f e c t s ; o n l y
two s ing le po res (bo th less than 0.030-in. d i a . ) w e r e l oca t ed by t h i s exam-
ina t ion . Fo l lowing t e s t ing , u l t r a son ic and dye pene t r an t examina t ion w a s
a l so per formed of t h e c y l i n d e r area ad jacen t t o t he l ong i tud ina l we ld i nc luded
in t h e area monitored by the SWAT system. No d e f e c t s were de tec t ed by t h e s e
post- tes t ing examinat ions.
75

5. Discussion of P r e s s u r e Vessel T e s t R e s u l t s
The tests performed a t room temperature demonstrated that
acous t ic emiss ion moni tor ing can b e employed t o d e t e c t a n d l o c a t e d e f e c t s on
- the aluminum a l l o y s t e s t e d a n d p r o v i d e s t h e means of te rmina t ing loading of
a p r e s s u r e . v e s s e 1 p r i o r t o f a i l u r e . Both increasing cumulat ive SIJE count and
i n c r e a s i n g SWE ampli tude (as observed on t h e o s c i l l o s c o p e i n real time) were
v e r i f i e d t o b e p r e c u r s o r s of f a i l u r e . The e x i s t e n c e o f t h e Kaiser e f f e c t d u r i n g
s t r u c t u r a l l o a d i n g was a l s o v e r i f i e d t h r o u g h t h e room temperature tests i n
t h a t s i g n i f i c a n t SWE a c t i v i t y w a s n o t o b s e r v e d u n t i l p r i o r p r e s s u r e l e v e l s
were exceeded. Within the test cond i t ions eva lua ted , t he Kaiser effect was
independent o f p ressur iza t ion rate and was n o t a f f e c t e d by t h e i n t r o d u c t i o n
of a s e m i - e l l i p t i c a l p r e f l a w ( n o t p r e c r a c k e d ) i n t h e v e s s e l l o n g i t u d i n a l
weld. P r a c t i c a l . a p p l i c a t i o n of t h e Kaiser e f f e c t lies i n its use to de te rmine
p r i o r maximum pres su re ( s t r e s s ) l eve l s and t o de t e rmine whe the r o r no t ove r
p r e s s u r i z a t i o n o c c u r r e d d u r i n g p r i o r s e r v i c e c y c l e s .
Based on t h e SWE d a t a , f a i l u r e of t h e 2014 v e s s e l o r i g i n a t e d
from a group of tungsten inclusions which were shown i n t h e X-rays of t h e
cyl inder longi tudinal weld and which were v i s i b l e i n t h e f r a c t u r e f a c e . The
presence of t h e s e d e f e c t s w a s de t ec t ed t h rough mul t ip l e SWE from the same
afea dur ing each pressur iz ing cyc le . SWE de tec t ed immedia t e ly be fo re f a i lu re
i d e n t i f i e d t h i s l o c a t i o n as t h e f a i l u r e o r i g i n . F a i l u r e of t h e 2219 v e s s e l
t e s t e d a t room temperature or iginated f rom a part-through-crack (PTC) d e f e c t
i n t r o d u c e d i n t h e l o n g i t u d i n a l w e l d . T h i s f a i l u r e o r i g i n w a s a l s o i d e n t i f i e d
by SWE d u r i n g t h e f i n a l c y c l e s ; however, i n comparison to the room temperature
2014 test, t h e number of e m i s s i o n s d e t e c t e d n e a r f a i l u r e w a s small.
The l a c k of l a r g e numbers of SWE immedia t e ly be fo re f a i lu re
of t h e 2219 vessel probably was t h e r e s u l t o f a l a r g e number of p r i o r c y c l e s
t o p r e s s u r e s n e a r the f a i l u r e p r e s s u r e ; s u c h a procedure would t e n d t o b l u n t
the p ref law and thus min imize subcr i t i -a1 ex tens ion of the defec t before
fai’lure. This hypotheses is fu r the r suppor t ed by t h e f a c t that the no tch
76

I -
was i nhe ren t ly b lun t (0 .01 in. m i n r a d i u s ) in comparison t o t h e n a t u r a l
d e f e c t s in t h e 2014 aluminum vessel and that t h e f a i l u r e stress based on t h e
n e t sectipn beneath the PTC d e f e c t was s i g n i f i c a n t l y h i g h e r t h a n t h e u n i a x i a l
t r ansve r se we ld u l t ima te s t r eng th of this filler wire-base metal composition.
However, the p resence o f t he p re f l aw ( and t he s econd p re f l aw in t roduced a f t e r
t h e 8 t h c y c l e ) w a s i d e n t i f i e d and located by mul t ip l e emis s ions de t ec t ed du r ing
t h e lower p r e s s u r e c y c l e s and probably resulted from plast ic zone formation
a t the notch, Thus, these da ta , in conjunct ion wi th the cumula t ive SWE counts
could have been used t o t e r m i n a t e l o a d i n g a n d l o c a t e and subsequent ly repair
t h e d e f e c t s . T h i s c a p a b i l i t y w a s ac tua l ly demonst ra ted dur ing the 6 th , 7 th
and 1 0 t h c y c l e s when l a r g e jumps i n the cumula t ive SWE count were used as a
b a s i s t o d e p r e s s u r i z e t h e v e s s e l w i t h o u t f a i l u r e ; p r e s s u r i z a t i o n d u r i n g t h e
10th cyc le was successful ly accomplished without fa i lure f rom a pressure on ly
30 psi l ower t han t he f a i lu re p re s su re .
The tests performed a t -320°F also demons t r a t ed t he capab i l i t y
5s d e t e c t and l o c a t e SWE s o u r c e s i n real time. However, problems were encountered
due to:
X. excessive background noise f rom the "bubbl ing act ion" of
t h e g a s e o u s / l i q u i d n i t r o g e n and
2. low s e n s i t i v i t y of t h e t r a n s d u c e r a t cryogenic temperatures
By a d j u s t i n g t h e s y s t e m s e n s i t i v i t y a f t e r t h e p r e s s u r i z i n g
media-temperature of t h e t e s t - v e h i c l e had s t a b i l i z e d , i t w a s p o s s i b l e t o
minimize the e f f e c t s of ni t rogen bubbl ing.
A l though t he sys t em sens i t i v i ty of the t r ansduce r u sed i n
t h e c r y o g e n i c t e s t i n g was l o w in compar ison to that u s e d i n t h e room tempera ture
tests, t h e SWE d a t a w e r e still u s e f u l t o d e t e c t and l o c a t e t h e f a i l u r e o r i g i n
i n e a c h v e s s e l . The cumulat ive SWE c o u n t f o r b o t h v e s s e l s i n d i c a t e d s l i g h t
77

increases i n s l o p e a n d d i s c r e t e s t e p s i n t h e c u r v e , b o t h o f w h i c h are i n d i c a t i v e
of defec t format ion or p ropagat ion and provide a b a s i s f o r d e p r e s s u r i z a t i o n
p r i o r t o f a i l u r e . The real-time l o c a t i o n of the SWE sources i nd ica t ed that
f a i l u r e o f t he 2219 vesse l occu r red a t t h e p r e f l a w i n t h e l o n g i t u d i n a l w e l d .
The f a i l u r e o r i g i n of t h e 2014 v e s s e l w a s c o r r e l a t e d w i t h t h e o r i g i n
shown by a n a l y s i s of fhe f r ac tu re su r f aces and t he p re sence o f co r re spond ing
de fec t s ( a l igned po ros i ty ) shown by examination of p r e f a i l u r e X-rays of t h e
longi tudina l weld . However, i n v i e w o f t h e r e l a t i v e l y low cryogenic tempera-
t u r e s e n s i t i v i t y o f t h e s e n s o r s commonly used wi th acous t ic moni tor ing sys tems,
i t is cons ide red des i r ab le , when m o n i t o r i n g s t r u c t u r e s a t cryogenic tempera-
t u r e s , t o p r o v i d e f o r i n s u l a t i o n o r h e a t i n g of t he s enso r t he reby i n su r ing
tha t t he s enso r t empera tu re does no t d rop below approximately -110°F.
A l t e rna t ive ly , s tud ie s shou ld be unde r t aken t o deve lop a sensor wi th h igh
s e n s i t i v i t y a t cryogenic (down t o -425°F) temperatures.
I n t h e 2219-T87 cryogenic tes t t h e e r r o r i n defect-SWE source
l o c a t i o n was approximately 1 t o 4 inches ; a similar e r r o r (1 to 3 - in . ) i n
s o u r c e l o c a t i o n was o b s e r v e d i n t h e 2219 room temperature tes t . T h i s e r r o r
can be improved by detailed analysis and determination of SWE propagat ion rates
i n t h e s e materials. I lowe,a , dur ing each vesse l test mul t ip le emiss ions were
observed f rom the defec t area, wh ich i nd ica t ed po ten t i a l f a i lu re , and t he
ind ica t ed sou rce w a s within the zone which would have t o b e u l t i m a t e l y i n s p e c t e d
us ing o ther NDT methods t o e s t a b l i s h t h e t r u e n a t u r e a n d l o c a t i o n of t h e d e f e c t .
A comparison of the performance of t h e 2219 and the 2014
p r e s s u r e v e s s e l s i n d i c a t e s t h a t t h e 2219 a l l o y was much s u p e r i o r t o t h e 2014
a l l o y b o t h a t room temperature and -320°F. A t bo th t empera tures , the 2219
chambers burst a t hoop stresses approx ima t ing t he un iax ia l u l t ima te s t r eng th
lev& whereas the 2014 a l l o y a t cryogenic t e m p e r a t u r e s b u r s t a t a stress l e v e l
s i g n i f i c a n t l y l o w e r t h a n t h k u l t i m a t e s t r e n g t h . T h i s same r e l a t i v e a d v a n t a g e
i n 2219 v s 2014 was encountered during chamber fabr ica t ion where ex tens ive
weld r e p a i r w a s r e q u i r e d t o remove weid po ros i ty and c r ack ing i n t he 2014
material. From an acous t i c emis s ion mon i to r ing s t andpo in t and t h e a b i l i t y t o
d e t e c t and loca te f l aw p ropaga t ion , t he re appea red t o be no difference between
t h e two a l l o y s .
78

I-
v. CONCLUSIONS
1. S t r e s s Wave Emiss ion mon i to r ing can be u sed t o de t ec t and l oca t e sub -
cri t ical crack growth i n 2219, 2014 and 7075 aluminum a l l o y s t r u c t u r e s b o t h
a t room and cryogenic (-320 and -423OF) temperatures.
2. A t room temperature , the stress wave emiss ion p recu r so r o f f a i lu re is
a marked i n c r e a s e i n (1) signal ampl i tude , (2 ) s igna l r epe t i t i on rate and
(3) t he s lope o f t he cumula t ive coun t p lo t t ed vs load. These precursors are
observed during uniaxial t e n s i l e t e s t i n g a n d d u r i n g t h e h y d r o b u r s t of sub-
scale p r e s s u r e vessels; mult iple emissions f rom a s i n g l e l o c a t i o n a l s o serve
as a p r e c u r s o r o f f a i l u r e d u r i n g t h e vessel h y d r o t e s t s .
3. A t cryogenic temperatures (-320OF and -423OF), a pronounced increase in
s igna l ampl i tude and r epe t i t i on rate immedia t e ly be fo re f a i lu re is not observed.
However, mult iple emissions f rom a s i n g l e l o c a t i o n serve t o l o c a t e d e f e c t s and
i n d i c a t e i n c i p i e n t f a i l u r e .
4 . The problems encountered dur ing c ryogenic t es t ing resu l ted f rom low
s e n s i t i v i t y o f t h e t r a n s d u c e r when immersed i n t h e c r y o g e n i c b a t h a t -320OF
o r -423OF, and no i se r e su l t i ng f rom ice formation. Band p a s s f i l t e r i n g and
the use of wave gu ides t o mount the t ransducer ou t o f the c ryogenic ba th
(sensor temperature approximately -110'F) p rov ide so lu t ions t o t hese
problems .
5. When m o n i t o r i n g s t r u c t u r e s a t c r y o g e n i c t e m p e r a t u r e s , i n s u l a t i o n o r
hea t ing o f t he s enso r shou ld be p rov ided t o i n su re t he s enso r t empera tu re
does not drop below -11O0F. A l t e r n a t i v e l y , a s e n s o r w i t h h i g h s e n s i t i v i t y a t
cryogenic temperatures (down t o -423OE') should be developed.
6. The e r r o r i n l o c a t i n g t h e s 0 u r c . e of mul t ip l e emis s ions is w e l l w i t h i n
t h e zone which would be inspec ted us ing convent iona l NDI methods i n o r d e r t o
e s t a b l i s h t h e s i z e a n d o r i e n t a t i o n o f t h e f l a w g e n e r a t i n g t h e a c o u s t i c e m i s s i o n .
79

7 . The fabrication characterist ics and hydroburst performance of the
2219 a l loy is much superior to the 2014 aluminum a l l o y . However, from an
acouszic-emission-monitoring standpoint, i.e., the ability to detect and
locate flaw propagation, there appears to be no difference between the two
a l l o y s , f i l ler metals (2319 and 4043) or we ld processes (TIG and MIG)
invest igated.
80

I' .REFERENCES
1. J. Kaiser, "Untersuchungen uber dasAuftreten Gerauschen B e i m Sugversuch," Ph.D. Thesis, Techn. Hochsch., Munchen, (1950), and Arkiv Fur das Eisen- hut tenwesen, 24, 43-4.5, (1953).
LESSELS & ASSOCIATES
2. B. H. Schofie1d;R. A. Bareis, and A. A. Kyrala, "Acoustic Emission Under Appl ied S t ress" , WADC Technical Report 58-194, (Apri l 1958) .
3. B. H. Schofield, "Acoustic Emission from Metals, Its Detec t ion , Charac te r - istics, and Source," Proceedings of the Symposium on Physics and Non- des t ruc t ive Tes t ing , Southwes t Research Ins t i tu te , San Antonio , Texas , (October 1963).
4.
5 .
6.
7.
8.
9.
10.
11.
12.
B. H. Schofield, "Acoustic Emission Under Applied Stress", ASD-TR-53-509, P a r t I , ( A n r i l 1963) , Pa r t 11, (May 1964)
AEROJET PUBLICATIONS
A. T. Green, C. S . Lockman, and R. K. S t ee l e , "Acous t i c Ver i f i ca t ion o f S t r u c t u r a l I n t e g r i t y of P o l a r i s Chambers," Modern P l a s t i c s , 41, 137-139, ( Ju ly 1964) .
A. T. Green, C. E. Hartbower, and C. S. Lockman, "Feas ib i l i t y S tudy of Acoust ic Depressurizat ion System," Report NAS 7-310, Aero je t -Genera l Corpora t ion , (February 1965) .
C. E. Hartbower, W. W. Gerberich, and P. P. Crimmins, "Monitoring Sub- Cr i t ica l Crack Growth by an Acoustic Technique," Weld Imperfect ions Symposium, Lockheed Research , Pa lo Al to , Cal i forn ia , (September 1966) . P u b l i s h e d i n WELD IMPERFECTIONS, Addison-Wesley, Menlo P a r k , C a l i f .
C. S . Lockman, A . T. Green, and R. K. Steele , "Acoust ic Monitor ins Durine Proof Test ing," Weld Imperfect ions Symposium, Lockheed Research , Pa lo Al to , Cal i fornia , (September 1966) . LOC c i t .
C. E. Hartbower, W . W. Gerberich and P. P. Crimmins, "Character izat ion of Fatigue-Crack Growth by Stress-Wave Emission", NAS 1-4902, (June 1966). Avaflable f rom NASA, P.O. Box 5700, Bethesda, Md. 20014.
A. T. Green, C . S. Lockman, S. J. Brown, and R. K. S t e e l e , " F e a s i b i l i t y Study of Acoust ic Depressurizat ion System," NASA CR-55472, (March 1966).
A. T. Green, Stress-Wave Detection, Saturn S-11, NASA CR-61.161, (December 1.966).
W. W. Gerberich and C. E. Hartbower, "Some Observat ions on Stress-Wave Emission as a Measure of 'Crack Growth," I n t e r n a t i o n a l J o u r n a l of F r a c t u r e Mechanics, 3, 3 , (September 1967).
81

REFERENCES (Cont 'd)
13.
14.
15.
16.
17.
18.
19.
20.
21.
22.
W. W. Gerberich and C. E. Hartbower, "Monitoring Crack Growth of Hydropn Embri t t lement . and Stress Corrosion Cracking by Acoust ic Emission, "Confer- ence on Fundamental Aspects of S t ress Corros ion Cracking , Ohio S ta te Universi ty , (September 1967) .
C. E. Hartbower, W. W. Gerberich, and P. P. Crimmins, "Mechanisms of Slow Crack Growth i n Hiph-Strength Steels," Am-TR-67-26, Vol. 1, Aerojet-General Corp., (February 1967). Also "Monitoring Subcrit ical Crack Growth by Detectiorr of Elast ic Stress-Waves," American Welding Society Meeting, Houston, Texas, (October 1967). THE WELDING JOURNAL, Vol. 47(1), p . 1-s, Jan 1968. Received the Spraragen Award as b e s t r e sea rch pape r pub l i shed i n t he WELDING JOURVAL i n t h e y e a r 1 9 6 8 .
A. T. Green, "Testing of 10-inch Glass Hemispheres Using Stress-Wave Analysis Technique," N00014-67-C-0333, Naval Ship Research and Development Center, (September 1967).
A. T. Green and C. E. Hartbower, "Stress-Wave Analysis Technique for De tec t ion o f Inc ip i en t Fa i lu re , " Aero je t -Genera l Corp . , P re sen ted a t ORNZ, Confe rence on Inc ip i en t Fa i lu re D iagnos i s fo r Assu r ing Sa fe ty and Ava i l ab i l i t y o f Nuc lea r Power P l a n t s , G a t l i n b u r g , Tennessee , (October 1967). Publ ished i n t h e PROCEEDINGS of t h e AEC Conference.
W. G. Reuter , A. T. Green, C. E . Bartbower and P. P. Crimmins, "Monitoring of Crack Growth i n Ti-6A1-4V Al loy by the S t ress Wave AnalysisTechnique", Report on NASA Houston Contract NAS 9-7759, Dec. 1968.
C. E . Hartbower, W . W. Gerberich, and P. P. Crimmins, "Spontaneous Strain Aging as a Mechanism of Slow Crack G r o ~ t h , ' ~ P r e s e n t e d a t the American Welding Society Annual Conference, Chicago, I l l inois, (April 1968). The WELDING JOURNAL, Vol. 47(10), Oct. 1968.
C. E . Hartbower, I?. W. Gerberich, and H. L iebowi tz , " Inves t iga t ion of Crack-Growth Stress-Wave Re la t ionsh ips , I 1 Engineering Fracture l lechanics , Vol. I(2), p. 291, August 1968. AlsoC. E . Hartbower, W. W. Ge rbe r i ch , W. G. Reuter , and P . P. Crimmins, "Stress-I.!ave C h a r a c t e r i s t i c s of F r a c t u r e I n s t a b i l i t y i n C o n s t r u c t i o n a l A l l o y s , " AD-674-881, Aerojet-General Corp., (July 1968) . Copy of ONR F i n a l i n NCEL L ib ra ry .
G. S . Baker , "Acous t ic Emiss ion and Pref rac ture Processes in High-St rength S. teels ," AFML-TR-67-266, Aerojet-General Corporation, Wright-Patterson AFB, (March 1968).
C. E. Hartbower and P. P. Crimmins "Fracture of S t r u c t u r a l Metals as Related t o Pressure-Vessel Integri ty and In-Service Monitor ing", presented a t t h e ICRPGIAIAA 3rd Solid Propulsion Conference (AIAA Paper 68-5011, A t l an t i c C i ty , June 1968 .
W. W . Gerberich and W. C,. Reuter , "Theore t ica l Model of D u c t i l e F r a c t u r e I n s t a b i l i t y Based on Stress-Wave Emission," ONR Contract Report N00014-66- 0340, Aero je t -Genera l Corp . , Sacramento , Cal i forn ia (February 1969) .
82

II-
REFERENCES (Cont'd)
23.
24.
25.
26.
27.
28.
29.
30.
31.
32.
33.
34.
35.
c. E. Hartbower, W. G. Reuter and P. P. Crimmins, "Mechanisms of Slow Crack Growth i n High-Strength Steels and Titanium", Final Technical Report AFML-TR-67-26, Vol. 11, June 1969 on Con t rac t AF 33(615)-2788 f o r t h e p e r i o d A p r i l 1 9 6 7 - Apri l 1969, 199pages .
A . T. Green, D e v c l ~ ~ w n t I.-._ ~ . o f R Xondes t ruc t ive Tes t i .n r Technique to
General Corp., Sacramento, California, (August 1969). " Determine"F1aw C r i t i c a l i t y , ARPA Contrac t F33615-68-C-170.5, Acto je t -
C. E. H a r t b o w e r , A p p l i c c i - o n o f SWAT t o t h e N o n d e s t r u c t i v e I n s p e c t i o n of Welds, Technical Note , Aerojet-General Corp. , Sacramento, Cal i fornia , (September 1969). The WELDING JOURNAL, Vol. 35(2), Feb. 1970.
. . . . _" . " "___
C. E. Hartbower, F. J. Climent , C. Morais, and P. P. Crimmins, Stress-Wave- Analys is Tesh2,i_que Study of Thick-Wal.led Type A302-R Stee l P r e s s u r e Vessels, NASA NAS9-7759, Aero je t -Genera l Corp . , ( Ju ly 1969) .
.-
A. T. Green, "Detection of I n c i p i e n t F a i l u r e s i n P r e s s u r e Vessels by Stress-Wave Emission," Nuclear Safety, 10 , 4-18, (January-February 1969).
A. T. Green and C . E . Hartbower, "Development of a Nondes t ruc t ive Tes t ing Technique to Determine Flaw Cri t ical i ty" , Inter im Technical Report on ARPA Con t rac t F33615-68-C-1705 (ARPA O r d e r No. 1244, Code 8D10), May 1970.
" . UNIVKRSITY - 0 F CALIFORNIA
H. L . Dunegan, D. 0. Harris, and C. A . Tatro, "Acoust ic Emission Research S t a t m R e p c r t , December 1963-August 1964", UCID-4868 Rev. 1, Lawrence Radia t ion Labora tory , (November 1964).
H. L. Dunegan and C . A. Ta t ro , "Pass ive P res su re T ransduce r U t i l i z ing Acoust ic Emission," Review of S c i e n t i f i c I n s t r u m e n t s , 3 8 , 8 , (August 1967).
H . L. Dunegan, D . 0. Harr i s , and C . A . Ta t ro , "Frac ture Analys is by Use of Acous t ic Emiss ion ," Engizeer ing ~~ Frac ture Mechanics , 1, 105-122, (June 1968).
H. Dunegan and D. Harris, "Acoustic Emission-A New Nondes t ruc t ive Tes t ing Too l , " U l t r a son ic s , 7 , 160-166, (July 1969).
MICHIGAN STATE UNIVERSITY "
C. A. T a t r o , " S o n i c T e c h n i q u e s i n t h e D e t e c t i o n of C r y s t a l i n M e t a l s " , Progress Repor t , Div is ion of Engineer ing Research , Michigan S ta te Univers i ty , East Lansing, Michigan, (January 1959) .
C. A. Tatro and R. G. L ip ta i , "Acous t ic Emiss ion f rom Crys ta l l ine Sub- s tances ' ' , Proceedings of t h e ~ . Symposium ~ ~ - on Physics and Nondkstruct ive - Test ing , Southwes t Res .earch Ins t i tu te , San Antonio, Texas, 145-174, (October 1962).
R. G . L i p t a i , "An I n v e s t i g a t i o n cf the Acous t ic Emiss ion Phenomenon," Ph.D. T h e s i s , Michigan S ta te Univers i ty , Eas t Lans ing , Michigan , (1963) .
83
L

REFERENCES (Cont'd)
36.
37.
38.
39.
40.
4 1 .
4 2 .
4 3 .
4 4 .
4 5 .
R. B. Engle , "Acous t ic Emiss ion and Rela ted Disp lacements in L i th ium F luor ide S ing le Crystals," Ph.D. Thes is , Michigan S ta te Univers i ty , East Lansing , Michigan (1966).
UNIVERSITY OF MICHIGAN
L. D. M i t c h e l l , "An I n v e s t i g a t i o n o f t h e C o r r e l a t i o n of t he Acous t i c Emission Phenomenon w i t h t h e S c a t t e r i n F a t i g u e Data," Ph.D. Thes i s , University of Michigan, Ann Arbor, Michigan (1965).
J. N . Kerawalla, "An Invest igat ion of the Acoust ic Emission f rom Commercial Ferrous Materials Subjec ted to Cycl ic Tens i le Loading" , Ph.D. Thesis , Universi ty of Michigan, Ann Arbor, Michigan (1965).
A . B . L . Argarwall , "An Inves t iga t ion o f t he Behav io r o f t he Acous t i c Emission from Metals and a Proposed Mechanism f o r i ts Generat ion," Ph.D. Thes i s , The University of Michigan, Ann Arbor, Michigan (1968).
J. R . F rede r i ck , 'lUse of Acous t i c i n Nondes t ruc t ive Tes t ing , " Semi- Annual Report 01971-2-T, March-August 1969, Un ive r s i ty of Michigan, Ann Arbor, Michigan (November 1969) .
N . G . Sankar, "Unload Emission Behavior of Material and Its Re la t ion to t he Bausch inge r E f fec t , " Ph.D. Thesis , Universi ty of Michigan, Ann Arbor, Michigan (1969).
OTHER COLLEGES
D . M. Egle , "A Comprehensive Analysis of an Acoust ic Emission Detect ion System", Ph.D. Thesis, Tulane University, New Orleans, Louisiana (1965).
R . H . Chambers, "New Techniques in Nondes t ruc t ive Tes t ing by Acous t i ca l and Exo-electron Emission," AD-691-230, Arizona Universi ty , Tuscon, Arizona (July 1969) .
C . K. Day, "An I n v e s t i g a t i o n o f t h e P l a s t i c B u r s t s o f M i c r o s t r a i n i n Zinc As Sources for Acous t ic Emiss ion ," M.S. Thesis , Washington State University, Pullman, Washington (1969).
J. C . Spanner, "A S e l e c t i v e Review on the U t i l i za t ion o f Acous t i c Emission Techniques for Materials Resea rch and S t ruc tu ra l In t eg r i ty Analysis", M.S. Thesis, Washirtgton S ta te Universi ty , Pul lman, Washing ton (19 70) .
84
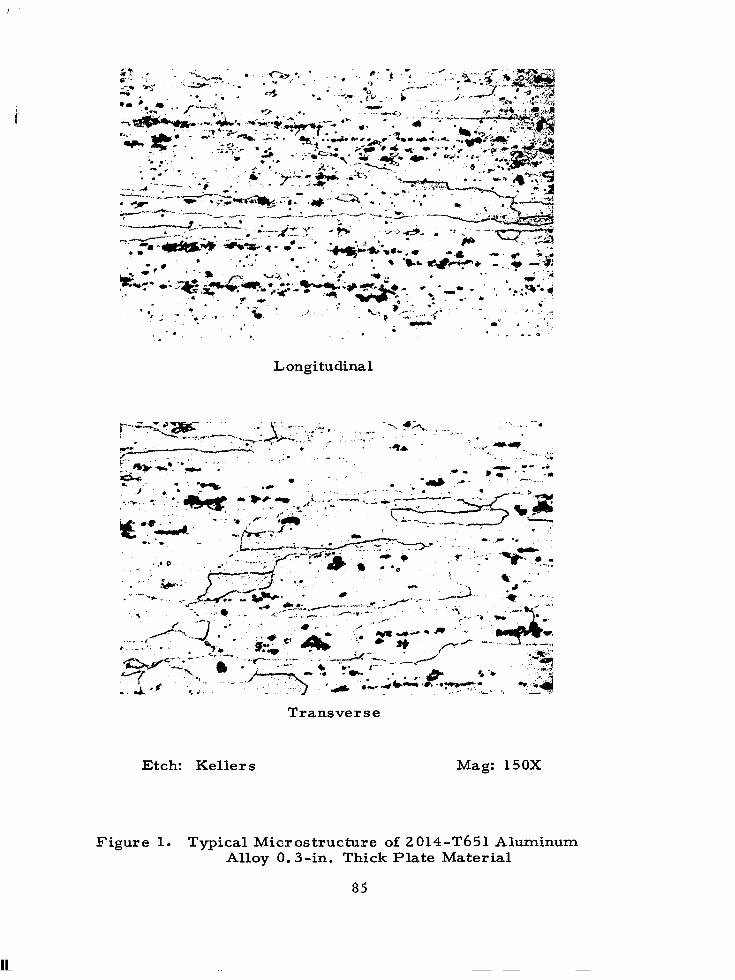
i
Transverse
Etch: Keller s Mag: 150X
Figure 1. Typical Microstructure of 2014-T651 Aluminum Alloy 0.3-in. Thick Plate Material
85

* . ' 0 ..rr , . - ..
Longitudinal
Transverse
E;tch: Kellers Mag: 150X
Figure 2 . Typical Microstructure of 7075-T73 Aluminum Alloy 0.3-in. Thick Plate
86

Longitudinal
Transverse
Etch: Kellers Mag: 15OX
Figure 3. Typical Microstructure of 2219-T87 Aluminum Alloy 0.3-in”Thick Plate Material.
87

0.18-in. Thick
0.30-in. Thick
0.50-in. Thick
Etch: Kellers Mag: 8X.
F i g u r e 4 . T y p i c a l M a c r o s t r u c t u r e of T I G Welds (4043 F i l l e r W i r e ) i n 2014-T651 A l u m i n u m A l l o y P l a t e
88

Figure 5. Typical Macrostructure of MIG Weld (4043 Filler Wire) in 0.3-in. Thick 2014-T651 Aluminum Alloy Plate
89
"

Etch: Kellers Mag: 8X
Figure 6 . Typical Macrostructure of TIG Weld (2319 Filler Wire) in 0.3-in. Thick, 2014-T651 Al.uminum Alloy Plate
90

HEMISPHERICAL HEADS Id 48 IN. 4 (MADE FROM 0.70 IN. \ THICK PLATE) r (AS RECEIVED)
0.32 IN. NOMINAL THICKNESS
3/4 IN. (BOTH
AN PT ENDS)
FITTING \ \
- u n n - 17.5 IN. DIA (NOMINAL)
- A' l E L D JOINT (DETAIL B)
SURFACE FLAY (IF REQUIRED -SEE TEST PLAN)
&$-! x DETAIL B-6
////Y//Y///////\ I
0.060
Figure 7 . Subscale Pressure Vessel Design

2 Places
Weld ' Part-Through-Crack (When Required)
I L, k
Test Temperature
5 .oo 3 .oo 1.25 4.00 16.00 Room and -320°F
E D C B d I
-423 'F 3 - 5 0 1.50 1.00 2.50 11.00 .
Figure 8. Part-Through-Crack Tension Specimen and Knife-Edge Attachments to Accommodate the Crack-Opening- Displacement Gage
92

0.312 --.
0.375 - \D Grind Top of
Weld Both Sides (See
Note)
6.0
1 NOTE: Grip Area Only. Gage area
to be ground flush with ' 3.0 D I A parent metal. F1
I 4.0
Figure 9 . Longitudinally Welded Unflawed and Part-Through-Crack Tension Specimen. (Room and -320°F Tests)
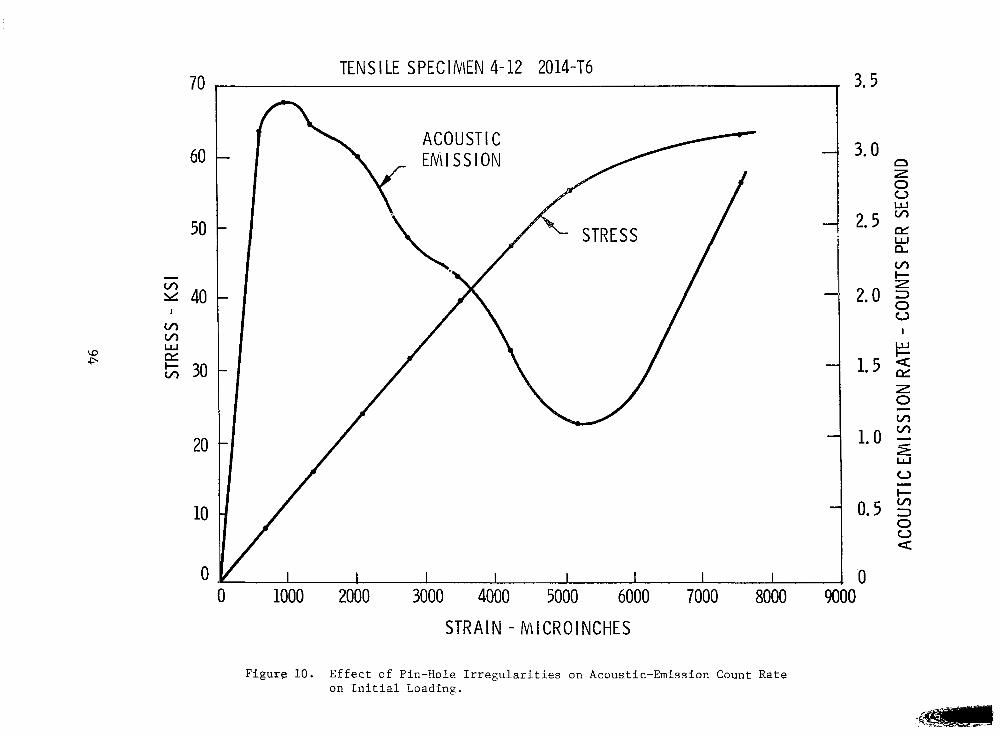
70
60
50
- v, = 40
I
v, v,
20
10
0
TEN S I LE SPEC I MEN 4- 12 2014-T6
I /
3.5
3.0 n z 0 0 W m 2.5 ~
W a v, I- z
2.0 0
I
W I-
1.5 2 z 0 v, v,
- 1.0 - s
W 0 i- rn 0 0
- 0.5 x
a
0 0 1000 2000 3000 4000 5000 6000 7000 8000 9000
S T R A I N - N \ I C R O I N C H E S
Figure 10. Effect of Pin-Hole Irregularities on Acoustic-Emission Count Rate on Initial Loading.

Compressive Load
15 .O
I I
0.62 Radius

n
0 I-
0.5
0.4
0.3
0.2
I k W n
0.1
0
0.7 1 .o 1 . 5 2.0 - FLAW SHAPE PARAMETER Q
Figure 1 2 . Flaw Shape Parameter, Q, f o r Surface and Embedded Flaws

h
s. c .- I
50 - ~ -. - - . - . . . . - . , . ,
0 AO/B 2 0.510
5c - . 1.21 7~ a(FG) /Q 2 ' 2 /'
40 - P
30 -
/ 20 -
10 - / K
/ K
K l c = [l + 0.12(1-
O/ I I I I 0 10 20 30 40 50
PARIS AND SIH STRESS-INTENSITY FACTOR ( ksi-in.&)
Figure 13. Comparison of the Irwin and Paris and Sih Approximations for Calculating Stress-Intensity Factors for Surface Cracks
97

0 7 5 ° F 0 -320" F
201 4 - T6 UNWELDED
U - Y 0 W = 1.990 - 3.004
3 0 1 B = 0.168 - 0.471
00 - - 0 m 0 a/2C -- 0.106. - 0.431 4 0 0 .
0 01% = 0.291 - 0.552
0.20 0.30 0.40 0.50 0.60 CRACK DEPTH TO THICKNESS RATIO
0.1 0 0.20 0.30 0.40 0.50 CRACK DEPTH TO LENGTH RATIO
- 0.314
0 0.05 0.1 0 0.1 5 0.20 NORMALIZED CRACK DEPTH a/Q
Figure 14. Effect of Crack Depth and F l a w Shape on the KIc Value
98

"
~~ 7 - I
50 E; f Lo ad llewlett Cel l Amplifier Filter
- LL
Counter Diie:x::;k;'og - llewlett K-Y Recar84 r Packard Xosley
?onver t er
- 581A 4B
Electronic D i ltal-Analog
Hewlett 0 ' Recorder Conditioner Amplifier Packard - Packard Vari n
5214 L 5 80 G 29 i
Endevco Endevco - 4621A
Signal Conditioner Amplifier
Endevco - Endevco - 440 1 2641A
I - i 1 Rcrerrch Inc. Tert Hachlne Model 480-39
@ Stnror Endevco 2213 0 Crack Opening Displecaaent Gage - Ael
0 Stra in Gage
I ; X-Y Var Ian Recsrl
F 80
I
r 1
Tektronix t.todel 535
Microphone
Figure 15. Schematic of Instrumentation Used f o r Tensile Specimens

15
I4(
'130
12(
11(
la
90
r 8 b
z =I 80
VI n z <
70 z 60
50
40
30
20
IO
0 '
Figure 16. Effect of Counter Triggering Level on the Plot of SWE-Count vs Load. 7075-T73 Parent &tal Tested at -320'F
100

1200
1100
lo00
900
800
r F3
8
0’
700
V L 0
3 600
I- =
500
400
300
200
100
0
PT 43-1 0 0.07. VOLT mnc - 0.359
PT 43-30
f 0.07 VOLT AODC - 0.1 23
PT 43-20
PT 43-20
LOAD _rc
Figure 17 . Effect of Triggering Level on the Plot of SUE-Count vs Load. 2014-T6 TIG-welded with 4043 Filler Wire and Tested at -423OF with Three Flaw Sizes
101

F i g u r e 18. P r e s s u r e Vessel Test Set-up
102

a . Truck b. Forward Work Area, TV D i s p l a y and Video Tape Recorder.
c. Rear Work Area and I n s t r u m e n t Racks.
d. Computer, Data D i s p l a y a n d F i l t e r s .
F i g u r e 1 9 . SWAT Mobi l e Tea t Labora to ry
103
.. .. - - . .... .

r 1
SENSORS + AMPLIFIERS ( 16 CHANNELS) ( 16 CHANNELS) (1 6 CHANNELS) b FILTERS
J
SELECTED CHANNEL I
X-Y PLOTTER RAMP GENERATOR COMPUTER
I
REMOTE VI DE0 DATA DISPLAY
TELETYPE
READER PUNCH & -
-
Figure 20. Schematic D i a g r a m - R e a l T i m e A c o u s t i c E m i s s i o n A n a l y s i s and T r i a n g u l a t i o n S y s t e m

OS C I LLOGRAM AT 27.3 in. /set.
OSC I LLOGRAM AT 2.5 in. kec .
NOTE: T h e s e p h o t o s i l l u s t r a t e t y p i c a l s e n s o r r e s o n a n t ring down decay a f t e r r e c e i p t of b u r s t t y p e stress wave.
Figure 31. Burs t Type Stress Wave Emissions

1 11 IN.
HEAD - .+ I
11 IN.
f
1 112 IN. NOMINAL SENSOR 1 112 IN. NOMINAL
Y
- f STRAIN GAGE
(ROOM TEMPERATIlSE TESTS ONLY)
NOTE: 1. CROSSHATCHING INDICATES AREA MONITORED BY SWAT SYSTEM.
2. BECAUSE OF EXCESSIVE SENSOR DAMAGE DURING THE FIRST -320OF TEST, ONLY SENSORS 1 - 4 WERE USED FORTHE 2219 VESSEL TESTED AT -32OOF. ALSO FOR THIS TEST SENSORS 1 AND 3 WERE OFFSET FROM THE WELD BY 8 INCHES AND SENSORS 2 AND 4 OFFSET FROM THE WELD BY 14 INCHES.
HEAD
Figure 22. Location of Stress Wave Emission Monitor ing Sensors , Strain Gage and Area Surrounding the Vessel Longi tudinal Weld Which was Monitored During Hydrotest.

i
Figure 23. Sensor Attached t o t h e P r e s s u r e Vessel
107
I

F i g u r e 2 4 . P u l s e r A t t a c h e d t o t h e P r e s s u r e Vessel

TRANSDUCER
END VIEW OF
P
PRESSURE VESSEL WALL L- FILM OF DOW
CORNING SILICONE
(a) SENSOR ATTACHMENT - ROOM TEMPERATURE
TRANSDUCER OR PULSER
ISOLATION STUD
DENTAL CEMENT FOR PULSER ATTACHMENT FORROOM
BONDING AGENT TEMPERATURE TESTS. FOR TESTS AT -3XoF
(b) SENSOR ATTACHMENT - 320OF PULSER ATTACHMENT - ROOM TEMPERATURE AND-3Z0F
Figure 25. Schematic Representation of Sensor and Pulser Mounting Techniques Used for Vessel Hydrotest.
109

0.02, 0.01 0 5 10 15 M 25 30 35 ""I 40 _.".
LOAD, kips
FA I LURE 36, 9 kip
5 10 15 20 25 LOAD, kips
30 35 40
Figure 26. Precursor of Plane Strain Fracture of 2014-T6 PTC-Tension Specimen No. 2 Tested at Room Temperature.
110

10
91
BC
70
30
20
SPECIMEN 8-8
10 -
1 LOAD -
Figure 27 . Ef fec t o f Tr igger Level on SWE P r e c u r s o r in 2014-T6 Tes ted a t 75'F.

60 - SPECIMEN 19-7
CRACK 2c - A 0 -
50 - 0.126 0.390
LOAD 35.4 KIPS
7 5 O F
40 -
30 -
20 -
10 - , d 0.1 5 v
~
J b K
0
LOAD - Figure 28. Effect of Trigger Level on SWE Precursor i n 2219-T87
Tested a t 75'F

NEAR START OF LOADING NEAR FAILURE
P
w P
SPECIMEN 4-2
75" F
SPECIMEN 8-4
-320" F
F i g u r e 29. Background "Noise1' Levels a t t h e Star t and End of PTC Tens ion Tests a t 75 and -320°F. 2014-T6 P a r e n t Metal w i t h S u r f a c e Flaws.

NEAR START OF LOADING NEAX FA1 LU RE
PT 43-23 75°F
PT43-43 -320OF
. ""
.I ,
23' ' F
F i g u r e 30. Background "Noisel' Levels a t t h e S t a r t a n d End of PTC Tension - Tests a t 75, -320 and 423°F. 2014-T6 TIG Welded w i t h 4043 Wire.
114

NEAR START OF LOADING NEAR FAILURE
!figure 31. Background "Noise" Levels a t t h e S t a r t a n d End of Tension Tests a t 75, -320 and -423'F. With no Del ibera te F laws . 2014-T6 T I G Welded with 4043 Wire
115

LOAD - Figure 32. Schematic of the Effect of Trigger-Level Setting
on the Precursor (Room-Temperature Test)
116

Figure 33. Schematic of the Effect of Trigger-Level Setting on the Precursor a t Cryogenic Temperature.
117
t

10
9’
81
7(
61
5(
IC
30
20
IO
t
18~,OOO 0.18 VOLT
84,000 0.21 VOLT
0.24 VOLT 58.000
14,000 0.48 VOLT
LOAD -
Figure 34 . Effect of Trigger Level on Precursor at -320°F. 7075-T73 Unwelded
118

$
10
9
8
7
6 v, I- Z
0 3
U L
O 5 v, n z 4.
0 =J v,
E 41
3
2
lOOOX, 110 KHz, lOOX
LOAD - Figure 35. SWE Precursor i n a 7039-T61WOL Tension Specimen.
Note the Effect of Trigger Level
119

01 I LOAD-
Figure 3 6 , Comparison of PTC and WOL Tension Tests at -32O0F

73 - 6 3,310,000 COUNT AT 0.32 VQLT.
SEVERE TRANSVERSE CRACKING
73-7 3,300,000 COUNT AT 0.32 VOLT.
SEVERE TRANSVERSE CRACKING
73-1 0 212,500 COUNT A T 0.07 VOLT.
NO TRANSVERSE CRACKING
Figure 37. Effect of Delamination-Type Flaws on SITE Count f o r Tests a t 75OF. 7075-T73 Parent Metal Tested a t -320OF.
121

I
200
100
0
30
20
10
0
1 REAL-TIME X - Y PLOT 1 I
! - 30 a I
I I I I I I I I I
0 5 10 IS 20 25 30 35 40 45 5) 55 I b
LOAD, kips
0 5 10 15 20 25 30 35 40 45 50 55 LOAD, k i p s . .
Figure 38. Effect o f Tape Playback OD Cumulative Count in 2219-T87 Specimen Ne, 32 Taefed at: -329*8.

0.12 b
REAL-T IME
0.09 I X - Y P L O T 39a
0.06 - 0.03 a. -
I I I I I I I I I I 4
5 10 15 20 25 30 35 40 45 50 55 P
w 0
h) 4 0 W I-
0 -I
>
0
LOAD, k ips
2 0.12 K
T A P E P L A Y B A C K
0.09 - 39 - 0.06 vrr - 0.03
- - 0 ' I I I I I I I I I 1 i
0 5 10 15 20 25 30 35 40 45 50 55
LOAD, kips
Figure 39. Effect of Tape Playback on the RMS-Voltage P r e c u r s o r (Same test as Figure 3 8 ) .

GAIN (SET PT 5) 40KH2
0.707 VOLT RMS
0.707 VOLT RMS
90KH2 GAIN (SET PT 8) 0.707 VOLT RMS
0.707 VOLT RMS
Figure 40 . Dunegan System (Constant Trigger Level - 1 Volt)
124

0.21
0.18
0.15
Lu c) 2 0.12 -I 0 > y 0.09 E
0.06
0.03
0
SPECIMEN NO. 22 2014 WELDED F ILTER 90 KHz
0 5 10 15 20 25 30 35 40 LOAD, kips
SPECIMEN NO. 27 DUMP 2219 WELDED LOAD
FILTER 90 KHz kips
0.21
0.18 . 36.05
0.15 W 0 a INITIAL LOADING 5 0.12 0 > Z 0.09 v)
D:
0.06 RERUN
0.03
0 0 5 10 15 20 25 30 35 40
0.21
0.18
W 0 <
0.15
5 0.12 0 > 2 0.09 D:
0.06
0.03
0
LOAD, kips
SPECIMEN NO. 28 2219 WELDED
FILTER 40 KHz
DUMP LOAD
40.0 kips
INITIAL LOADING
32.5 kips
RERUN ” - 1
5 10 15 20 25 30 35 40
LOAD, kips
Figure 141. Kaiser Effect in Longitudinally Welded, Unnotched, Tension Specimen
125
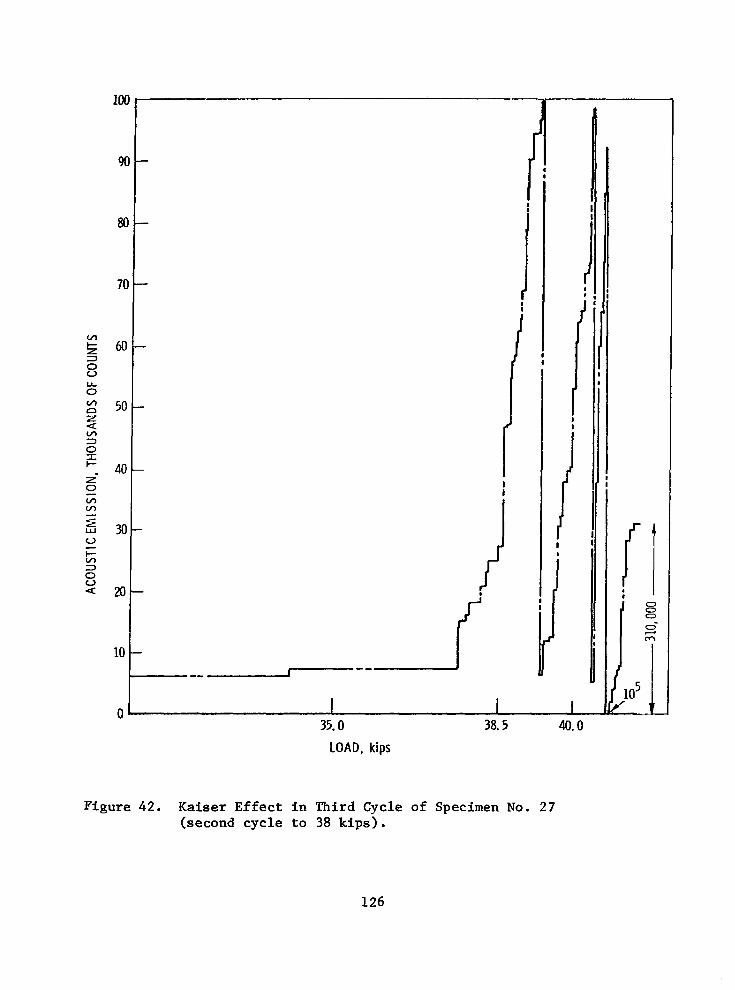
{
i i I
I I I I
35.0 38.5 40.0 LOAD, kips
Figure 42. Kaiser Effect i n Third Cycle of Specimen No. 27 (second cycle to 38 k ips ) .
126
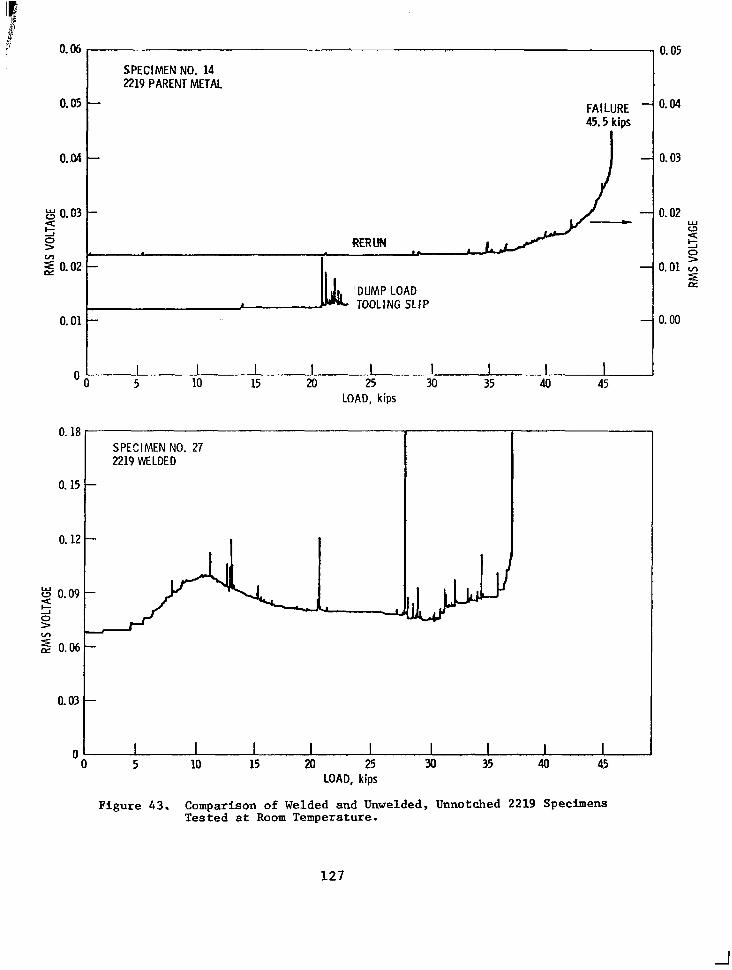
0.06 , - 0.05 SPECIMEN NO. 14 2219 PARENT METAL
0.05 - FAILURE - 45.5 kips
' e o 4
0.04 - - 0.03
g 0.03 !i
- - 0.02 U
0
W a
> RER UP4 2 0 >
E 0.02. - 0.01 v)
a 5
TOOLING SLIP 0.01 0.00 - -
O O I I I I I I I I I 5 10 15 M 25 30 35 40 45
LOAD, kips
0. 18 SPECIMEN NO. 27 2219 WELDED
0*15 t 0.
Y 0. 3 0 > -1
tA
5 0.
0-03 t 0 1 I I I I I I I I I
0 5 10 15 20 25 30 35 40 45 LOAD, kips
Figure 4 3 . Comparison of Welded and Unwelded, Unnotched 2219 Specimens Tested at Room Temperature.
127

415. FAILURE 32. b kips SPECIMEN No. 21
0.12 - 2014 WELDED
FILTER 90 KHz
3 Q W - 3 B ul
0.06-
0.03 -
I I I I I I I 5 10 15 20 25 30 35
LOAD, klps
SPECIMEN NO. 29 FAILURE 2219 WELDED 35.60 kips
0.04 - FILTER 90 KHz
0.03 - 1-1 !i P $ s t ui 0.02
o*ol, O O 5 10 15 20 25 30 35
LOAD, klps
0.18 SPECIMEN NO. 30 DUMP 2219 WELDED 35.3 kips
0.15 1 FILTER 40 KHz
A INITIAL LOADING
RERUN = -
I 1 I I I I I 5 10 15 20 25 30 35
LOAD , kips
Figure 44. Kaiser Effect in Longitudinally Welded PTC-Tension Specimens.
128

100
90
80
70
60
50
40
2 z =I
30 LL 0 v, n Z 4 V I g 20 I- r
10
0
0.35 VOLTS
PT 43-1 3
LOAD - Figure 45. Cumulative SWE Count vs Load for Three Flaw Sizes.
2014-T6 TIG Welded with 4043 Wire, Specimen8 0.30-in. Thick, Tested at 7S°F
129

PT 43-1 3 86,500 COUNT
PT 43-23 50,500 COUNT
PT 43-33 68,500 COUNT
F i g u r e 46 . Flaws in t h e Tension Specimens of F i g u r e 45
130

0.135 'IOLTS
AOnC - 0.064/1.500 PT 43-31
LOAD
Figure 47. Cumulative SWE Count vs Load f o r Three Flaws. 2014-T6 TIG Welded with 4043 Wire, Specimens 0.18-in. Thick, Tested a t 75'F

Figure 48. Flaws in t he Tens ion Spec imens of F igure
132
PT 43-1 1 22,500 COUNT
PT 43-21 23,500 COUNT
PT 43-31 30,500 COUNT
47
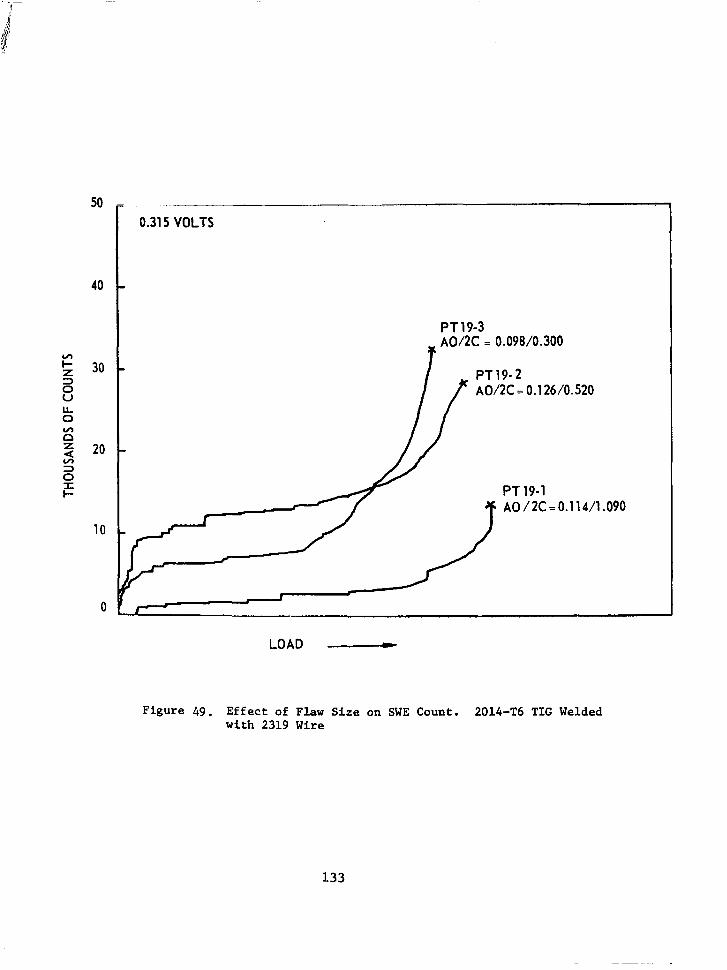
50
40
30
20
10
0
PT 19-3 A0/2C = 0.098/0.300
A0/2C = 0.1 26/0.520
PT 19-1 AO/2C=0.114/1.090
LOAD - Figure 4 9 . Effect of Flaw Size on SWE Count. 2014-T6 TIG Welded
with 2319 Wire
133

PT 19-1 13,500 COUNT
PT 19-2 28,500 COUNT
PT 19-3 32,500 COUNT
Figure 50. Flaws in the Tens ion Spec imens of F igure 49
134

M
P c
x M L n
N
I
I)
135

"
8 Y) t
3 C
0 0
2
0 0 10 20 30 40 50
Stress intensity factor, K -ksi-in. 1/2
Figure 52. Summation of Acoustic Emission as a Function of Stress-Intensity Factor - 7075-T6 Aluminum in Air (hnegan)
136

r- 0 0 * V ) m
0 N 0 0 0 c
137

14
120
100
80
60
40
0 SPECIMEN 73-14
0 SPECIMEN 73-15
FAILURE 0
/
APPLIED STRESS INTENSITY, ksi-in. *I2
Figure 54. Relationship Between Cumulative Acoustic-Emission Count and Stress I n t e n s i t y F a c t o r i n SEN-Tension Tests of 7075-T6
138

LOAD, kips
Figure 55. Relationship Between Cumulative Count and K i n SEN-Tension Testa of 2014-T6 and 2219-T87.
139

SINGLE EDGE NOTCH TENSION SPEC I MEN 4- 19
75' F FA I LURE 9.87 kips
50.2 ksi-in
6. 9 kips 25.7 ksi-in ' I 2 \
\ i LOAD, kips
F€gure 56. Correlation Between Crack-Opening-Displacement Measurement and Acoustic Emission in a SEN-Tension Test of 2014-T651 (see Table XI) .
140

0 LOAD -
PT19-4 0.315 V
85.000 COUNT
-32OOF
PT19-4
Figure 57. Effect of Temperature on SWE Count. 2014-T6 TIG Welded with 2319 Wire; Nearly Identical Flaws.
141

PT 19-1 75" F 1 3,500 COUNT
PT 19-4 -320" F 358,000 COUNT
Figure 58. Flaws i n the Tension Specimens of Figure 57
142

80 - ~ . - ~ ~ ~
70 -
60 -
vr 50 - I- z u 0 LL
40 - I 4 3 0 vr
;2 F
z 0 3
V
0
PT43-15 75°F 0.7875 V
LL 0.300- IA n Z 4 3 0 IA - 0.200-
0.100-
. , ,. ~. . .. .. ... . . . . . . . - . .
PT 43-45
0.500 -
0.400 -
LOAD -
I
Figure 59. E f f e c t of Temperature on SWE Count. 2014-T6 TIG Welded w i t h 4043 Wire; Nearly Identical F l a w s
143

PT 43-1 5 75" F 325 COUNT
PT 43-45 -320" F 77,500 COUNT

60
50
40
30
20
10
0
1st RUN -320OF
DUMP LOAD 32.5 KIPS
OF
-
1st RUN DUMP LOAD 32.5 KIPS -320OF
60K - 60K x1000 - x100 ACCEL. 221X (OUT OF LN2) LN2)
7.5 12.5 17.5 22.5 27.5 LOAD, kips
Figure 61. First Load Cycle for 2219 Specimen I a t -320°F (32.5 Kips maximum load, 500,000 counts).
145

2nd RUN
5 7.5 10 15 20 25 30 LOAD, kips
35 45 50
DUMP AT 5 1 kips
Figure 62. Second Load Cycle fo r 2119 Specimen I at -320'F at 32.5 kips, 850,000 counts .
146

3rd RUN -320OF
63A
100 - v DUMP AT 56.3 kips +
0 ' I I I I I I I I I I 2.5 7.5 12.5 22.5 27.5 32.5 37 42.5 47.5 52.5 56.3
LOAD, kips
I
4th RUN -32ooF FA1 LURE
638
57.5 kips - 0 I I I, I
I
7.5 12.5 17.5 22.5 27.5 32.5 37.5 42.5 4i. 5 52.5 LOAD, kips
Figure 63. Third and Fourth Load Cycle for 2219 Specimen I a t -320'F (in the Cycles, the count at 32.5 k i p s was 55,000 and 5,000, respectively
.3rd and 4th .

. . 50 i . z I
SPECIMEN I 4th RUN REPLOT
. . . .
s 3 l o t
i i' > ??
. . . . . . . . . . . . . . . . . . . . . . . . . . . . . . . . . . . ~ . . -. "....." ^ . I ........ - __^*.._ .
% .t ,i
. . .
..,._ ,..- < . " . . . . . .
. .
' .I. .
. . . . . . ,. . " . .
,., ,
..
- a J I . . I 1
0 I 1 I I I I 7.5 17.5 27.5 37: 5 47.5
LOAD, kips 57.5
. .
# !
Figure 6 4 . Effect of X-Y Plot Scale Factor on the Precursor of Failure for 2219 Specimen ?&:,at -320'F. . ., I . . . . . . . . .. - . . . . . . . . . . . . . . . . . . . . . . . . . ......... .r.- I.- ......._..-..-. d". . . .

Figure 65. Effect of Specimen Thickness on SWE Count. 2014-T6 TIG Welded with 4043 Wire; Tes ted a t -320'F
. ,: ., ; . ; { ' . ' i. : : , , / , , , ; : : . L . ,:: r f . ; ; ' . > , '"I I.,,.., I . , . , . . .. . , . . . I . , , ' :' , i _ , r : ; i
, 149

Figure 6 6 . F l a w s i n the Tension Specimens of F
150
... . .. . ,
PT 43-41 47,500 COUNT
PT 43-43 43,000 COUNT
PT 43-45 23 , 000 COUNT
i gu re 6 5

FAILURE a. 4 (;ips
SPECIMEN NO. 6, UNWELMD 2014
0" 1 I I I I I 5 10 I5 20 25 30 35 40
LOAD, kips
"I SPECIMEN NO. 26. WELDED 2014 FAILURE 31.95 kips
LOAD, kips
Figure 67. .Cumulative Count at -320'F With Sensor Mounted on a Wave Guide.
151

:'"' , . , . . , , . . .
LOAD, klp
Figure 68, Compariron of Two Traducers Mounted on 2014-T6 Unnotched Tension Specimen No. C.

11 .
. . .
. . , . . .
Figure' 69. Comparison of the Output from Spring-Mounted and 'Wave-GuFde-Moun&d 3 *. . 2213 Accelerometers on 2219-T87 Specimen No. 28.
. , -. . .. . . , i . J . , : . < ' .. . . . . ._
v- 35 31.5
LOAD,.kipr

I 4
17.5 LOAD, kips
Figure 70. Comparison of ltro Transducers Mounted on 2014-T6 Specimen No. 3 for the First Cycle to 20.2 kips.
154

2213 f i
LOAD, kips
155

F i g u r e 72 . 2014-T6 Aluminum Vessel Hydroburs t a t Room Tempera ture

!
(I
Figure 73. Close-up Views of t h e F a i l u r e O r i g i n of t h e 2014-T6 Aluminum Vessel Hydroburst a t Room Temperature

Gj
J a
tx
E a
1100
1000
900
800
700
600
500
400
300
200
100
0
BURST 88'0 PSI BURST 88'0 PSI
200 400 600 800 1000 STRAIN, (:MICRO-INCHES, p )
1200 1400 1600
Figure 74. S t r a i n Gage Data (Hoop Orien ta t ion ) fo r F ina l P re s su re Cyc le o f the 2014-T6 Aluminum Vessel Tested a t Room Temperature. Note E l a s t i c Behavior of the Pa ren t Metal Cylinder Section Where t h e Gage was Mounted.

10
8
6
4
2
0
a-
c
- - -
UNLOAD AFTER 30 SECOND HOLD AT 460 PSI -
I I I I 1 0 150 300 450 600 750 800 1050 1'
PRESSURE, PSI
10 UNLOAD AFTER 30 SECOND HOLD
AT 690 PSI
PRESSURE, PSI
PRESSURE, PSI
10 - UNLOAD AFTER 30 SECOND HOLD
AT 690 PSI 8 -
6 -
4 -
2 -
O b I I I I I I 0 150 300 450 600 750 900 1050 1
10
8
6
4
2
FAILURE AT
B 880 PSI
21
0 0 150 300 450 600 750 900 1050 12,
PRESSURE, PSI
30
Figure 75. Cumulative Stress Wave Emission vs Pressure for the 2014-T6 Aluminum Vessel Hydroburst at Room Temperature (3 pages)
159

HEAD
e
. .
e
e .
3 e
. a
e.
4 a G3
e *
. . _ I
. 6 63
/ - NOTE: Numbers in ( ) indichte fracture surface defects shown:in
FiRure 80.
Figure 76 . Location of SWE Sources Detected When Pressurizing 2014-T6 Aluminum Vessel to 460 psi at Room Temperature.
HEAD
.... .
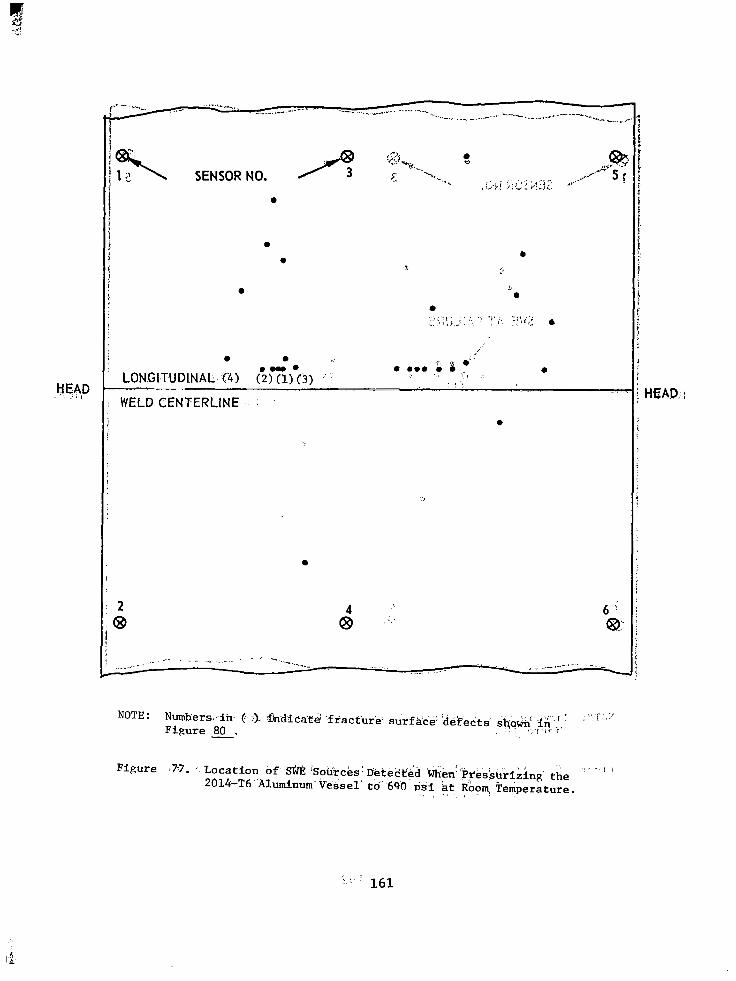
a
a
a
a a
b
.. . " " ...
WELD CENTERLINE 1
a
a
2 @
4 @ . ::
Figure :7-?. - Location of- S& 'Soiirces' D e t e c t e d wi;en''Piessuri&ing. the ! , , I I
2014-Th ' Aluminum' Vessel' to.' 690 ds' i at. R o o m , Temperature. I . .

HEAD
. @ 5
. . SWE AT FAILURE
.
. 0 . 0 .
( 4 ) (2) (1) (3) 0. . LONGITUDINAL
~ ~~
WELD CENTERL.lNE
. . 2
63 4 @
6 63
HEAD
Fieure 78. Location of SWE Sources Detected When Pressurizing the 2014-T6 Aluminum Vessel to Failure at 880 p s i at Room Temperature.
162
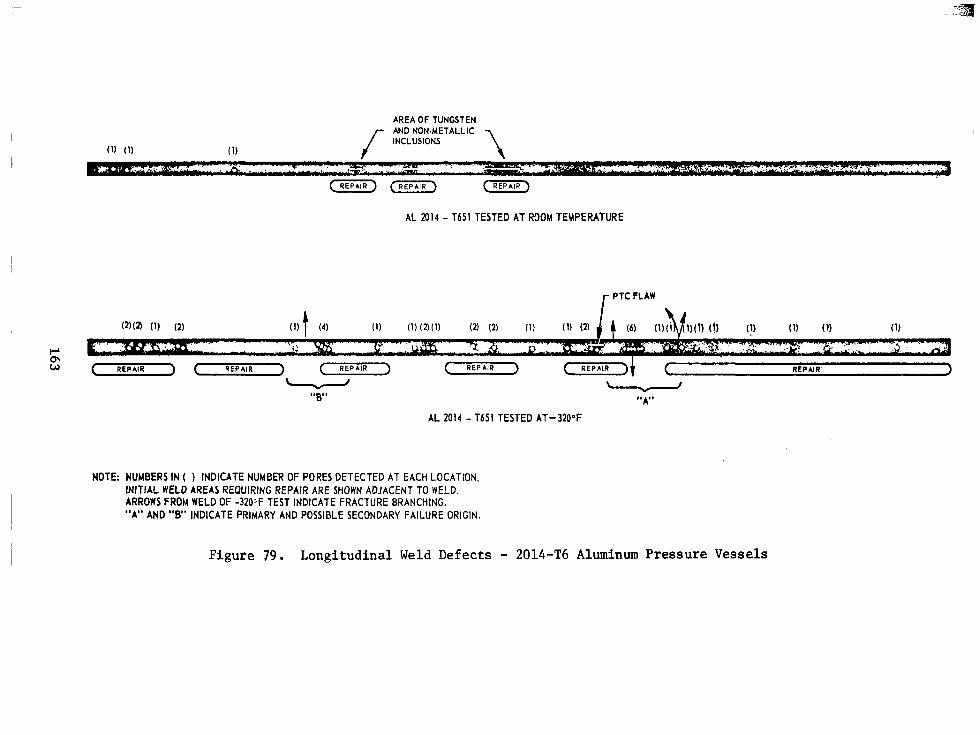
AREA OF TUNGSTEN AND NON-METALLIC
<-) (-)
AL 2314 - T651 TESTED AT ROOM TEMPERATURE
1 - "B" "X'
AL 2014 - T651 TESTED AT-320"F
NOTE: NUMBERS IN ( ) INDICATE NUMBER OF PORES DETECTED AT EACH LOCATION. INITIAL WELD AREAS REQUIRING REPAIR ARE SHOWN ADJACENT TO WELD. ARROWS FROM WELD OF -320'F TEST INDICATE FRACTURE BRANCHING. "A" AND "B" INDICATE PRIMARY AND POSSIBLE SECONDARY FAILURE ORIGIN.
Figure 79. Longitudinal Weld Defects - 2014-T6 Aluminum Pressure Vessels

1 2 I 3 4 I I I I
FAILURE O R I G I N AT ROOT OF REPAIR WELD
', - . , . , . , I
FAILURE ORIGIN , . .
. . 2 A r .. ,
I '" . ' . .'
,
. . . . . . . . . . . . . . . . . _ _ . - . . .. ~ ... - - - . . . . . . . . . . . " ......... " _.-, l__"O__._ . "_.. 3 , ^ .: : . , ........... .... .... , , .
." . # :
P 0 c.
I \ Non Fusion
2 4
Figure 80. Longi tudina l Weld F rac tu re Faces -2014-T6 Aluminum Vessel Hydroburst a t Room Temperature. Note Repair Weld Area from which Failure Occurred and Other Weld Defec t s Ind ica t ed by Arrows. ( S t r i a t i o n s o n S u r f a c e are Due t o Weld Head O s c i l l a t i o n ) .

I . ,
, ":
165

Figure 82. 2219-T87 Aluminum Vessel Hydroburst a t Room Temperature.

Figure 83. Close-up View of 2219-T87 Aluminum Vessel Fracture After Hydroburst at Room Temperature.
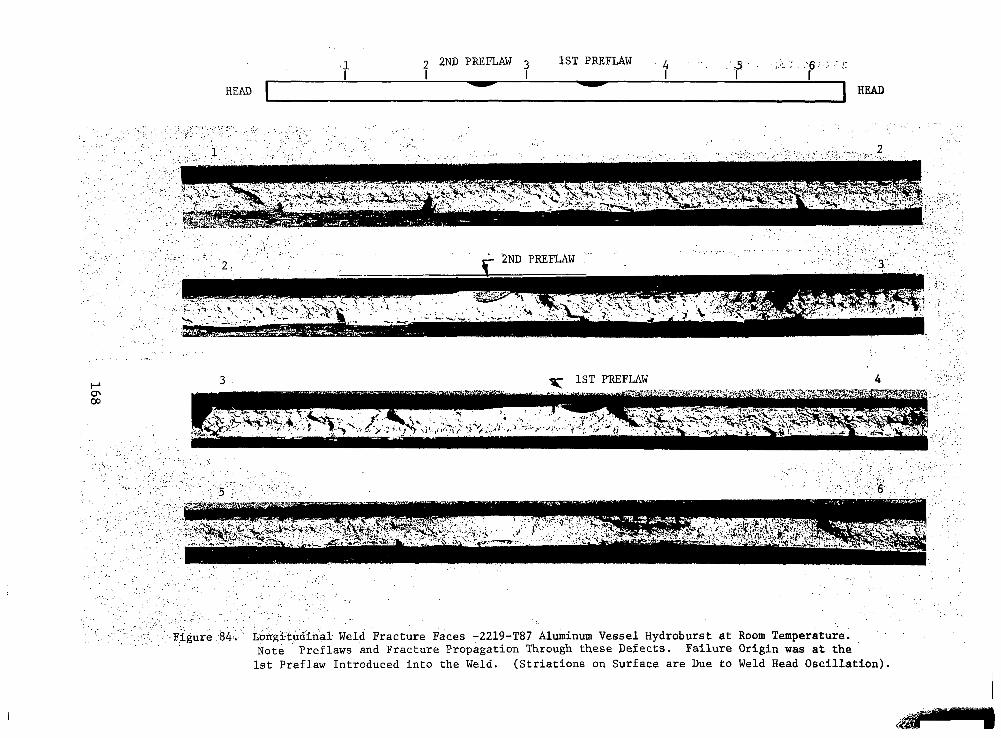
I . , . . . , . - . . ,.. . . I - . , . , , . ,
I -
. . . . . .
, . , . . , .. , . I
. . . . ,
. . - . . . . . .. . . .
.~ . : I .. .: . , . - - . . : . _ ,: . .
r _ . . . -. , . , % . I . .
. I , : . .: -"-F,igure :84..'. Lo&$.tu'dinal Weld F rac tu re Faces -2219-T87 Aluminum Vessel Hydroburst a t Room Temperature. Note Pref laws and Fracture Propagat ion Through these D e f e c t s . F a i l u r e O r i g i n was a t the 1st P r e f l a w I n t r o d u c e d i n t o t h e Weld. ( S t r i a t i o n s o n S u r f a c e are Due t o Weld Head O s c i l l a t i o n ) .

. , ,- ; -, ; ;,-.: , . ; :
Figure 85. S. t ra in .,Gage Data (Hoop O r i e n t a t i o n ) f o r Final Pr ,ess .ure , . Cy-cleg.i of the -,.- ',' &. . .. ... ! . 2 . . '
.. ,_.,... . j . . . . _ _ _ .B eh-avior ...o .f t he Parent. .Metal . .Cylinder Secti an__^ ~re-~.tthe Gage -, aas _ ~ ~ C l n .~ed.~.,__,.... .-............,: > , ; 1 - < , ,j:;,,L > * b L L ; l
.....-- _ _ _-. . ._...
2219-T87 'Aluiiinum Vessel Tested at Room Temperature.-.. .,'NQ.te: E&at&.ic !-<. :, : ,
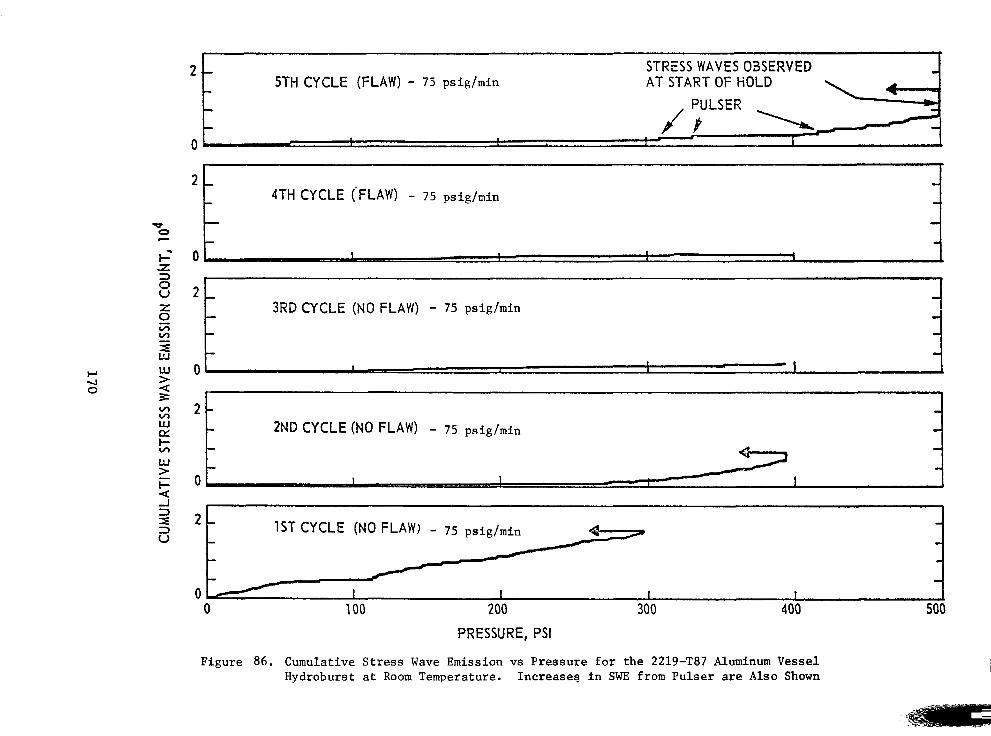
2 .- STRESS WAVES 03SERVED - 5TH CYCLE (FLAW) - 75 psig/min AT START OF HOLD
- -
0. t I
2L F r 1
0 I I
L-
*t-
2 - 1ST CYCLE (NO FLAW) - 75 psig/min - - - - - - -
0 1 I I I I 0 I00 200 300 400 500
PRESSURE, PSI
Figure 86. Cumulative Stress Wave Emission vs Pressure for the 2219-T87 Aluminum Vessel Hydroburst at Room Temperature. Increase9 in SWE from Pulser are Also Shown

w 0 c
i ;z 3 0 U
UNLOAD 2219-T87 A1 Vrorel (Flaw) Tested at Room Temprraturr 7th Cycle of 11
LARGE SWE (i -
I y’ I I I I I .I
PULSER
6 2219-T87 A 1 Varorl (Flaw) Tertrd a t Room Temperature 6th Cycle of 11
4 - UNLOAD - LARGE
SW E 2 , 7 .I
0 i I I I I I I 0 125 250 375 500 625 750 a75 1000 1125 1250
PRESSURE, PSI
Figure 86. Continued (Page 2 of 4)

-
2219-T87 A1 Vessel. $2, plaws.). . , Tested a t Room Tenipe.ra'ture . ' '
9th Cycle-of 11 . .
~~ ~ ~ ~ ~~~
.
.> 'w
:.r
. . 4 . . . . . . . :,. , : .- . . . . . . . . . . . . . . . . . . . . . . . . . . . . . . . . . . . . . . . . . . . . . . . . . . . . . . . . . . . ....... . . . . . . . . . . . . . . . . . . . . . t ~ ", . . , I .- -_,_., __.,_ _,,_. .̂" ._....."._._ *,- i i
1
6 . - - , '. ,
. . - I , . : . .
2219-T87 A1 Vessel (1' Flaw) UNLOAD
8th Cycle of 11 . . . . . . . . . . . . . . . . . . . . . . . . . ...... . . . . . . . . . . ." . . Teated. a t Room--Temperature.. -. ". ._ ...1" _;..
a ' - I . . . . . . . . . . . . . . . i
-. .
. . . . . . . . ... .. , . . . . . . . . . ../.. . . . . . . . . . . . . . . . . . . . . . . . . . ... .. . . . . . . . . . . .... , ,. - . P U L S E R " ..m.-&)...~ -.... 1 . . , :.. > .
I . . . .
. .i
2 " I . . . . . .PU,LSER p ~
PULSER .C_I
. . , - I .
r. , I
0 I I I ' 1 t I Y -
0 125 250 375 500 625 8 57 1 coo 1125 1250
. . . . . . . . . I., - I . . . . . . . . . . . . . . . . . ............. U.. .I~ .,..-. , . ~ ......_I...._-.

6
4
b
2 2 b= z 0 D U
0 0
2219-T87 A 1 V 1 8 d (2 Flaw#) Tested at Room Temprcrture 11th Cycle of 11
d
FAILURE AT '
4 1530 PSI
'9 PULSER
UNLOAD AT 1500 PSI 2219-T87 A1 Vessel ( 2 Flaws) Tested at Room Temperature 10th Cycle -. of 11
\ e.
.. .~
1
LARGE SW E
,
4 . .
1
Figure 86. Continued (Page 4 of 4)

/
. 8 5
SENSOR NO. A . . .
e
YULSER 8 . . 0 . . . e . .
e 0 0
LONGITUDIN4L . HEAD- WELD CENTERLINE .
e
- HEAD . . . . e . . e . . .
e .
F i w t e 87. Location of SWE Sources Detected When Pressurizing (1st Cycle) the 2219-TF17 Aluminum Vessel to 300 D s i a t Room Temnerature.
174
!

HZAD
@ / PULSER
e
0
e
e
e 0
e
e
e. e e e e
2 @
e .
0
e
e
e e e e
e e
4 69
WELD CENTERLINE
0
e e
e
6 @
HEAD
I
Figure 88. Location of SWE Sources Detected When Pressurizing (2nd Cycle) the 2219-TR7 Aluminum Vessel to 400 vsi at Room Temperature.
175

H EAC
e
0
e 1 >.
I : , .
e
LONGITUDINAL
e 1 ST PREFLAW e
e - WELD CENTERLINE
, ,
- 9 .. . . ' FLAW LOLTION o - ERROR- l-!N.
. . .
e
e
2 63
4 c3
6 @
Figure 89. Location of SWE Sources Detected When Pressurizing (4th Cycle) the 2219-T87 Aluminum Vessel to -400 psi at Room Temperature.
HEAD

i
i 1 . ' 0
e
e
GBy PULSER 0
e
. . -
e
. , . e
1 ST PREFLAW . . .
. : . . , :. , , I , . , ,,'; 'if, : . ' i . ... . , ,, ( . I . , i , ";: . . . ,
Figure 90.. ,Location' of SWE 'Sohciis Detected When.Pressur€zfnp. .(5th Cycle) .. . , ..
the 2219-T87 Aluminum 'Vessel ' t o . 500 psi at koom Temperature. Weld Preflaw Location also Shown.

HEAD
"B.\ SENSOR NO.
e
e e
e
e
1 ST e
e
0
PREFLAW LONGITUDINAL 7
WtLD C t N T t K U N t e 0
FLAW e
LOCATION ERROR 1 - 3 IN.
@ 2 4
63
e e e
0
b
HEAD
Figure 91. Location of SWE Sources Detected When Pressurizing (6th Cycle) the 2219-TP7 Aluminum Vessel to 680 nsi at Room Temperature. Weld Preflaw Location also Shown.
178

HEAD
e . e 1 ST 0
PREFLAW . e . 1 e" f LONGITUDINAL - " - 0 0 -
1
WELD CENTERLINE ..e.. . e... e e e. e.. e e .
e . e e e
e e
e.
2 @
e . e. .e
e 4
@
e e
0 6 63
HEAD
Figure 92. Location of SWE Sources Detected When Pressurizing (7th Cycle) the 2219-TA7 Aluminum Vessel to 860 p s i at Room Temperature. Weld Preflaw Location also Shown.
179

HEAD
:\ SENSOR NO. 69 5
1 ST PREFLAW LONGITUDINAL
~~
WELD CENTERLINE
2 s
4 @
6 63
HEAD
Figure 9 3 Location of SWE Sources Detected When Pressurizing (8th Cycle) the 2219-T87 Aluminum Vessel to 1250 osi at Room Temverature. Weld Preflaw Location also Shown.
180

HEAD
8 I \ /
@ 3 SENSOR NO. 5
e
1 ST 2ND PREFLAW PREFLAW
LONGITUDINAL ""
- - 1 ST 2ND
PREFLAW PREFLAW LONGITUDINAL
"" - -
WELD CENTER LINE 0 0
SWE at Failure
rn
0
HEAD
Figure 94. Location of SWE Sources Detected When PressurizinR (10th and 11th Cvcles) The 2219-T87 Aluminum Vessel to 1500 and 1530 psi (failure) at Room Temperature. Weld Preflaw Locations also Shown.
181

2ND PTC FLAW
AL 2219-~a7 TESTED AT ROOM TEMPERATURE
AL 2219 - T87 TESTED AT-320Q
NOTE: NUMBERS IN ( ) INDICATE NUMBER OF PORES DETECTED AT EACH LOCATION. INITIAL WELD AREAS REQUIRING REPAIR ARE SHOWN ADJACENT TO WELD.
Figure 9 5 . Longitudinal Weld Defects - 2219-T87 Aluminum Pressure Vessels

F i g u r e 96. 2014-T6 Aluminum Vessel a f t e r B u r s t a t -320'F

Figure 97. 2014-T6 Aluminum Vesse l Af te r Burs t a t -320°F and Reassembly on Floor of Test Cell
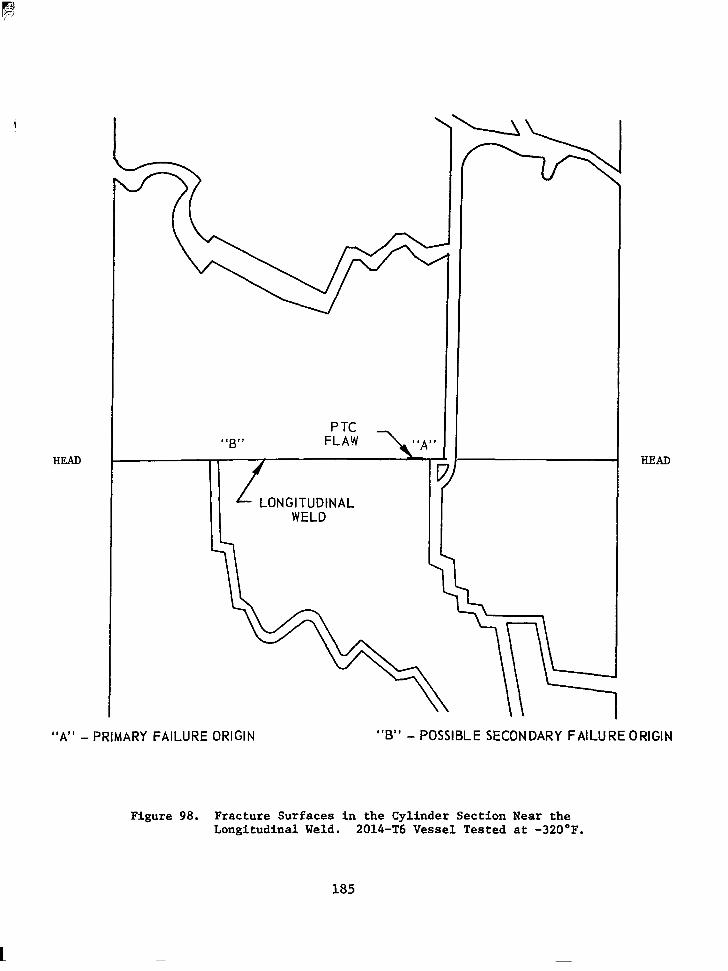
n
HEAD
PTC - HEAD
“A” - PRIMARY FAILURE ORIGIN “B” - POSSIBLE SECONDARY FAILURE ORIGIN
Figure 98. Fracture Surfaces in the Cylinder Section Near the Longitudinal Weld. 2014-T6 Vessel Tested at -320°F.
185

10
8
6
4
2
0 0 150
UNLOAD AT "7 530 PSI
I I I I
UNLOAD AT
300 450 600 750
PRESSURE, PSI
186

2014 AI VESSEL
CYCLE 2 OF 2 TESTED AT -320°F
- FAILURE AT 975 PSI -
c I I
0 150 300 450 600 750 900 1050
PilESSURE, PSI
Figure 9 9 . Continued (Page 2 of 2)
18 7

H EAC HEAD
Figure 100. Location of SWE Sources Detected When Pressurizing (1st Cvcle) the 2014-T6 Aluminum Vessel t o 550 p s i a t -320OF. "A" and 1 1 ~ ~ ~
indicate primary and secondary (possible) fai lure origins.
188

HEAD
1 \ 69
SENSOR NO. 5 . 0
e
0
.e* e
PREFLAW &
e
0
LONGlTUDlNAL WELD CENTERLINE
" * 'A" e
e 0 . .
e
"B" 0
Figure 101. Location of SITE Sources Detected When Pressurizing the 2014-T6 Aluminum Vessel- to Failure (2nd Cycle) .at -320'F. Weld Preflaw Locatio; also shown. "A" and "B" indicate primary and secondary (possible) f ailure origins.
HEAD

2 3 4 5 6 \-LL 7 - FAILURE ORIGIN SECONDARY (POSSIBLE)
(A) B
1 2
i
Figure 102. Longitudinal Weld Fracture Faces -2014-16 Aluminum Vessel Hydroburst a t -320'F. Note Preflaw (arrow) and that the kacture Did Not Propagate Through This Defect. (Striations on Surface are Due to Welding Head Oscillation)

J "- PTC Flaw
Figure 103. Areas of Longitudinal Weld Non-Fusion, Inc lus ions and Poros i ty on the Frac ture Sur face of t h e 2014-T6 Aluminum Vessel Burst a t -320°F. Figure 102 shows the loca t ion area "A" o f t h e s e d e f e c t s i n t h e l o n g i t u d i n a l weld. Note - t h e end of t h e PTC flaw i n (3) and t h a t t he f r ac tu re su r f ace d id no t p ropaga te t h rough t h i s defec t (Ffagnification amroximatelv 4x1
191

Figure 104. Areas (other than primary fracture Area A) of longitudinal weld non-fusion, inclusions and porosity on the fracture surface of the 2014-T6 aluminum vessel t e s ted a t -320°F. Figure 102 shows the location ("33") of these defects in the longitudinal weld. (Magnification approximately 4X)
192

j Figure 105. Fractured 2219-T87 Aluminum Chamber i n Test Cell A f t e r Tes t ing a t -320'F.
i

Figure 106. Fracture Cylinder Section and Close-up V i e w of the Longitudinal Weld PTC Flaw for the 2219-T87 Aluminum Vessel Hydroburst a t -320'F.

1 PREFLAW 2 3 4 5
I I I I I
2 3
3 4
4 5
Figure 107. Longitudinal Weld Fracture Faces -2219-T87 Aluminum Vessel Hydroburst a t -320'F. Note Preflaw - Failure Originated from this Defect. (Striations on Surfaces are due to Weld Head Oscillation).

10
II
-
UNLOAD
~
MULTIPLE RESETS
4 c
I I
PRESSURE, PSI
Figure 108. Cumulative Stress Wave Emission vs Pressure fo r the 2219-T87 Vessel Tested a t -329°F. Cycle No. 3 of a Five cycle t e a t series (Page 1 of 3')

10
0
UNLOAD
125 250 375 500
PRESSURE, PSI
625 750 875 1000
Figure 108.Continued (Page 2 of 3)

1 Z19mT=87 AI VESSEL
FA I LU RE AT 945 PSI
125 250 375 500 62s 750 875 1000 -. ” - .. .

HEAL
SENSOR NO.
LONGITUDINAL a WELD CENTERLINE a @
8 3
0
63 2
PREFLAW
Figure 109. Location of SWE Sources Detected When PressurizinR (3rd Cycle) the 2219-TP7 Aluminum Vessel to 1000 Dsi at -320'F. Weld Preflaw Location also Shown.
HEAD
199

H E A C
\ SENSOR NO. 60 3
LONGITUDINAL WELD CENTERLINE
m a 0 e
PREFLAW
e
e 0
69 2 4
(8
HEAD
Figure 110. Location of SWE Sources Detected When Pressurizing (4th Cycle) the 2219-Ti37 Aluminum Vessel to 1000 psi at -320'F. Weld Preflaw Location also Shown.
200

H EAC
SENSOR NO.
LONGITUD WELD CEN
@ 3
1INAL lTERLlNE
0
PREFLAW
e m e
e FAILURE
HEAD
Figure 111. Location of SWE Sources Detected When Pressurizing (5th Cycle) the 2219-T87 Aluminum Vessel to Failure (945 psi) at -320'F. Weld Preflaw Location from Which Failure Initiated is also Shown.
201

Appendix A
BIBLIOGRAPHY
Hartbower, C.E. and Reuter, W.G., "Stress Corrosion Cracking in 6A1-4V Titanium in Water and Methyl Alcohol", presented by Hartbower a t t h e In t e rna t iona l Symposium on Stress Corros ion Mechanisms i n T i t a n i u m A l l ~ y s , Georgia I n s t i t u t e o f Technology, Atlanta , Georgia , Jan. 27-29 , 1971.
Hartbower, C.E., Morais, C.F., Reuter , W.G. and Crimmins, P.P., 11 Detec t ion of Weld Cracking on HY-80, HY-100 and HY-130 S tee l s by S t r e s s Wave Emission", f i na l r epor t on Navy Contract N00024-70-C-5215, P ro jec t Se r . No. SF51541009, Task 12445, March 1971.
Hartbower, C.E., "Acoustic-Emission Measurements i n t h e Ocean Engineering Program", f o r t h e Naval Civi l Engineer ing Laboratory, Port Hueneme, C a l i f . 93043, 15 May 1971.
Hartbower, C . E . , Morais, C.F., Reuter, W.G., and Crimmins, P . P . , I t Development of a Nondestructive TestTng Technique t o Determine Flaw C r i t i c a l i t y " , f i n a l Technical Report on Contract F33615-68-C-1705, ARPA Order NO. 1 2 4 4 , Program Code 8D10 , August 1971.
Hartbower, C.E. , Reuter, W.G., Morais, C.F. and Crimmins, P.P. , "Use Of
Acoustic Emission for the Detection of Weld and Stress-Corrosion Cracking", prepared for an ASTM Symposium on Acoustic Emission, Bal Harbour , Flor ida (Miami) Dec 7-8, 1971 and p u b l i c a t i o n i n a n ASTM STP (Proceedings of Symposium).
Mow, Chao-Chow; Pao, Yih-Hsing, "The D i f f r a c t i o n o f E l a s t i c Waves and Dynamic Stress Concentrations", Rand Corp., Santa Monica, Calif . , Report No. R-482-PR on Contract F44620-67-C-0045, AD-724 893, April 1971.
Martin, S.E. , "Steady S ta te Stress Wave Propagat ion in Fiber-Reinforced Elas t ic Mater ia l s" , Texas University, Austin EnEineering Mechanics Research Lab., Contract DAAD05-69-C-0241, NSF-GK-4712, AD-723 390, Feb. 1971, 43P
Waite, E.V., Parry, D.L. , "Field Evaluation of Heavy-Walled P res su re Vessels Using Acoustic Emission Analysis", (Idaho Nuclear Corp. , Idaho Fa l l s ) Y Mater* Eval., 29, No. 6 , 117-24, June 1971.
19 70
Bailey, Eugene C. , "Industry Sponsored programs", (Comnonwealth Edison CO., m icago) , Nucl. Met., Met. S O C . AIME, 16, 39-47, 1970, (NMAIA). From Symposium on the Technology of Pressure-Retaining Steel Components, Vail V i l l a g e , Cola-
Barkhoudarian, s. , Sco t t , C.C. , "Preliminary Study of F e a s i b i l i t y o f A c o u s t i c Detection of Small Sodium-Water Reac t ions i n LMFBR Steam Generators", (Atomic Power Development Associates , Inc. , Det ro i t , Mich .) , Contract AT(11"1)-865 Y
7913, May 1970.
A- 1

I I I Append i x A
19 70
(Continued)
F4 Bell, James F., "Finite Amplitude Wave Propagat ion i n Solids", Johns Hopkins Universi ty , Bal t imore, Md., Depart . of Mechanics, Final Report 1 Jan 64 - 31 Jan 69, Contract DA-31-124-ARO(D)-154, DA-ORD-31-124-G8, P ro j . DA-2-0-061102- B-33-G, AD-704 , 367, Mar. 1970 , 37P.
\:
B i l l , R.C., F reder ick , J., "Use of Acoust ic Emission in Nondestruct ive Test ing," , Michigan Univ., Ann Arbor, .Dept. of Mechanical Enginebring, Semi Annual Report No. 4, 1 Mar. - 31 Aug. 1970, Report No. 01971-4-P, Contract F33615-68-C-1703, ARPA Order 1244, Project ORA-01971, AD-879 708, Dec. 1970, 66P.
Dunegan, H.L., Harris, D.O. , and Tetelman, A.S., Materials Evalua t ion Journa l , MAEVA Vol. 28, NO. 10, Oct. 1970, pp. 221-227.
Frederick, J . R . , "Use of Acoust ic Emission in Nondestruct ive Test ing", Michigan Univ., Ann Arbor, Dept. of Mechanical Engineering, Semi Annual Report No. 3 , 1 S e p t 69 - 28 Feb 70, Report No. 01971-3-P, Contract F33615-68-C-1703, W A Order-1244, P r o j e c t ORA-01971, AD-872 256 , June 1970, 32P.
Green, A.T. and Hartbower, C.E. , " D e t e c t i o n o f I n c i p i e n t F a i l u r e i n P r e s s u r e Vessels by Stress Wave Emission", paper presented by Hartbower a t the In t e rna t iona l Sympsoium on Nondestructive Testing of Nuclear-Power-Reactor Components:, Rotterdam, The Nether lands, Feb 26-27, 1970.
Green, A.T. , Hartbower, C.E. and C r i m i n s , P.P. , "Subcrit ical Crack Growth i n Beryllium a t -320"F", presented by Green a t t h e ASTM Annual Meeting in Toronto , Canada, June 1970.
Harris, D.O. and Dunegan, H.L., V e r i f i c a t i o n o f S t r u c t u r a l I n t e g r i t y o f Pressure Vessels by Acoustic Emission and Periodic Proof Testing", Report UCRL-72783, Lawrence Radiation Laboratory, Livermore, 1970.
I 1
Hartbower, C . E . , "Technical Note: Application of SWAT to t he Nondes t ruc t ive Inspect ion of Welds", The WELDING JOURNAL, Vol 35(2) , p. 54-s , Feb 1970 - Hartbower, C.E. and Reuter , W.G., "Stress Corrosion Cracking in 6A1-4V Titanium i n Water and Methyl Alcohol", presented by Reuter a t t he 7 th Annual Western Metal and Tool Conference and Exposition, March 9-13, 1970, LOS Angeles.
A-2

Appendix A
19 70
(Continued)
Hartbower, C.E., Reuter and Crimmins, P.P., "Stress-Wave C h a r a c t e r i s t i c s o f 1 Frac tu re In s t ab i l i t y i n Cons t ruc t iona l A l loys" , p re sen ted by Har tbower a t t h e
Joint Meet ing of Commissions I X & X of t h e I n t e r n a t i o n a l I n s t i t u t e o f Welding, Lausanne, Switzerland, July 1970.
Hutton, P.H., Acoust ic Emission-What It Is and Its App l i ca t ion t o Eva lua te Structural Soundness of Sol ids , BNWL-SA-2983, Bat te l le-Northwest , Richland, Washington, February 19 70.
I s b e l l , Willi- M., Christman, Douglas R. , "Whock Propagat ion and Fracture i n 6061-T6 Aluminum From Wave P r o f i l e Measurements", General Motors Technical Center, Warren, Mich., Materials and S t ruc tu res Lab., Inter im Technical Report , Report No. MSL-69-60, Contract DASA01-68-C-0114, P r o j e c t DASA-NWER-AA-106, AD-705 536, 42P, April 1970.
Isono, E i j i , "History of the Acoustic Emission Method - A New Too l fo r NDT", t ranslated from Hihakai Kensa, No. 11, 579-985, 32P, 1970.
Jones, John P . , "Stress Wave Dispersion Rod - Reinforced Composites", Aerospace Corp., E l Segundo, C a l i f . , Lab Opera t ions , Descr ip t ive Note : Repor t for Jan-Jul 69, Report No. TR-0066(6240-30)-3, Contract F04701-69-C-0066, AD-702 801, 37P, Jan. 1970.
Keck, Henry E . , Armenakas, Anthony E . , "Wave Propaga t ion i n T ransve r se ly Isotropic , Layered Cyl inders" , Polytechnic Inst . of Brooklyn, N.Y., Dept. of Aerospace Engineering and Applied Mechanics, Report No. PIBAL,-70-9, Contract F44620-69-C-0072, P r o j e c t AF-9782, Task 978201, 38P, Mar. 1970.
L i p t a t , R .G . , Harris, D . O . , Engle, R . B . , Ta t ro , C .A. , l lAcoustic Emission Techniques i n Materials Research", California Univ., Livermore, Lawrence Radiation Lab., from Symposium on Advanced Experimental Techniques i n t h e Mechanics of Materials , San Antonio , Tex. , 97p, 9 July 1970.
L i p t a i , R . G . , Harris, D.O. , Engle, R . B . , and Tatro, C.A., 'lAcoustic Emission Techniques i n Materials Resea rch ' ' , t o be pub l i shed i n In t e rna t iona l Jou rna l of Nondestruct ive Test ing and i n Proceedings of the Symposium on Advanced Experimental Techniques i n t h e Mechanics of Materials, San Antonio, Tex., Sept. 1970.
L i p t a i , R.G. , Harris, D.O. , Engle, R.B. , and Ta t ro , C.A., "Acoustic Emission Techniques i n Materials Research," Rept. UCRL-72582, Lawrence Radiation Laboratory, Livermore, 19 70.
L i p t a i , R.G. , "Acoustic Emission from Composite Materials", Rept. UCRL-72657, Lawrence Radiation Laboratory, Livermore, 19,70.
Nie lsen , A. , Latham, F.G., Kirby, N. , "Acoustic Emission from Steel Pressure Vessels", United Kingdom Atomic Energy Authority, Risley, England, Reactor Group (832 9530), 13P, April 1970.
A-3

Appendix A 19 70
(Continued)
Parry, D . L . , Robinson, D.L., "Incipient Failure Detection by Acoustic .Emission - A Development and Status Report", Report IN-1398, Idaho Nuclear Corp., Idaho Falls, 111P, July 1970.
Pottinger, Marion G., "The Anisotropic Equivalent of the Love Longitudinal Wave Propagation Approximation", Final Report, Aerospace Research Labs, Wright- Patterson AFB, Ohio, Report No. ARL-70-0064, Project AF-7065, Task 706500, AD-710 596, 28P, April 1970.
Reinhart, Eugene R., Wylie, Robert D., "Nondestructive Testing Techniques Applied to In-Service Inspection", Southwest Research Inst., San Antonio, from Symposium on the Technology of Pressure-Retaining Steel Components, Vail Village, Colo., Nucl. Met., Met. SOC. AIME, 16, 199-217, 1970.
Reitz, Edward S., Armenakas, Anthony E., "Propagation of Harmonic Waves in Orthotropic Circular Cylindrical Shells, Part I, Theoretical Investigation", Polytechnic Inst. of Brooklyn, N.Y., Dept. of Aerospace Engineering and Applied Mechanics, Report No. PIBAL-70-18, Contract NONR-839(40), Project NR-064-427, AD-706 749 , 31P, Mar. 1970.
Romrell, D.M. and Bunnell, R.A., ''Acoustic Emission Monitors Crack Growth in Ceramics, BNWL-SA-3064, Battelle-Northwest, Richland, Wash., March 1970.
Spanner, J.C., "A selective Review on the Utilization of Acoustic Emission Techniques for Materials Research and Structural Integrity Analysis (A LiteratureSurvey)", MS thesis, Washington State University, Department of Metallurgy, 1970.
Tinder, Richard F., "Flow Mechanisms and Acoustical Emission During Initial Yielding in Crystals", Final Report, Washington State Univ., Pullman, Contract AF-AFOSR-1449-68, Project AF-9763, Task 976301, AD-705 686, 3P, April 1970.
Waite, E.V., "Acoust-s- A Digital Program for Acoustic Triangulation of Spherical Vessels", Idaho Nuclear Corp., Idaho Falls, 22P, March 1970.
1969
Adams, K.H. , Bass, B.R., Borhaug, J.E., Goodman, C.H., Thompson, R.A., "Experi- mental Investigation of Delayed Acoustic Emission in Beryllium", Tulane Univ., New Orleans, La., Dept. of Mechanical Engineering, Mar. 1969.
(BNWL-1266), "Nuclear Safety Quarterly Report, August-October 1969 for Nuclear Safety Branch of USAEC Division of Reactor Development and Technology", Battelle- Northwest, Richland, Wash., Pacific Northwest Lab., Contract AT(45-1)-1830, 117p, December 1969. Also, Nuclear Safety Quarterly Reports for November, December 1968, and January 1969, AEC Research and Development Report, Battelle-Northwest, March 1969.
A-4

Chambers, R.H.,*'Ney Techniques i n Nondes t ruc t ive Tes t ing by Acoustical and Exo-electron Emission", AD-691-230, Arizona University, Tuscon, Arizona, J u l y 1969.
Day, C.K., "An I n v e s t i g a t i o n of Acoustic Emission from Defect Formation i n S t a i n l e s s S t e e l Weld Coupons", BMJL-902, Battelle-Northwest, Richland, Washington, January 1969.
Dunegan, H.L., Harris, D.O., Tetelman, A.S., "Detection of Fatigue Crack Growth by Acoustic Emission Techniques", Univ. of California; Livermore, Proceedings of the Seventh Symposium on Nondestruct ive Evaluat ion of Components and Materials i n Aerospace, Weapons Systems, and Nuclear Applications, San Antonio, Texas, pp. 20-31, A p r i l 23-25, 1969, North Hollywood, Calif. Western Periodicals Company , 1969.
Dunegan, H. and Harris, D . , "Acoustic Emission - A New Nondestruct ive Test ing Tool" , Ul t rasonics , 7 , 160-166, Ju ly 1969.
Dunegan, H.L. and Tetelman, A.S., Non-Destructive Characterization of Hydrogen- Embrittlement Cracking by Acoustic Emission Techniques", UCRL-71654, Lawrence Radiation Laboratory, November 1969.
I I
Engle, Robert B . , Dunegan, Harold L . , "Acoustic Emission: Stress Wave Detec t ion as a Tool for Nondestruct ive Test ing and Material Evaluation", Univ. of C a l i f o r n i a , Livermore, Int . J . Non-Destruct. Test.; 1: 109-25 June 1969.
F i t c h , C . E . , Jr . , "Acoust ic Emission Signal Analysis in Flat Plates", BNWL-1008, Battelle-Northwest, Richland, Washington, April 1969.
Freder ick , J . R . , "Use of Acoust ic Emission in Nondestruct ive Test ing!" , Semi-Annual Report O1971-1Py July 1968-February 1969, University of Michigan, Ann Arbor, Michigan, May 1969.
Gerberich, W.W. and Reuter, W.G. , ?t"heoretical Model of Duc t i l e F rac tu re I n s t a b i l i t y Based on Stress-Wave Emission", ONR Contract Report N00014-66-CO340, Aerojet-General Corp., Sacramento, California, February 1969.
Green, A.T., "Detection of I n c i p i e n t F a i l u r e s i n P r e s s u r e Vessels by S t r e s s - Wave Emission", Nuclear Safety, 10, 4-18, January-February 1969.
Green, A.T., "Stress-Wave Emission Generated During the Hydrostatic Compression Test ing of Glass Spheres", Final Report on Contract N00014-67-C0333, April 1969.
A-5

Appendix A
1969
(Continued)
Green, A.T., "Development of a Nondestruc.t ive Testing Technique to Determine Flaw C r i t i c a l i t y , ARPA Cont rac t F33615-68-C-1705, Aerojet-General Corp., Sacramento, California, August 1969.
Green, A . T . , "St ress Wave Emission and Fracture of Pres t ressed Concre te Reac tor Vessel Materials", r e p o r t f o r Oak Ridge National Laboratory, Subcontract No. 3118, Contract No. W-7405-eng-26, June 1969.
Hardy, H.R. , Jr., "Applications of Acoustic Emissions in Rock Mechanics", p resented a t the Acoustic Emission Working Group Meet ing, Phi ladelphia , Pennsylvania, October 1969.
Harris, D.O. , Dunegan, H.L. and Tetelman, A.S., "Detection of Fatigue Crack Growth by Acoustic Emission Techniques," UCRL-71457, Lawrence Radiation Laboratory , March 1969.
Harris, D . O . , Dunegan, H.L. and Tetelman, A.S . , "Detect ion of Fat igue Lifet ime by Combined F rac tu re Mechanics and Acoustic Emission Techniques, UCRL-71760, Lawrence Radiation Lab. (Oct. 1969) and A i r Force Conference on Fatigue and F rac tu re of A i r c r a f t S t r u c t u r e s and Material, Miami Beach, F h . , 15-18 Dec. 1969-
Hartbower, C . E . , Reuter , W.G. and Crimnins, P.P., I 1 Tens i l e P rope r t i e s and F rac tu re Toughness of 6A1-4V Titanium", AFML-TR-68-163, Val. 11, Aerojet- General Corp., Sacramento, California, March 1969.
Hartbower, C.E. , Reuter , W.G. and Crimnins, P.P., "Mechanisms of slow Crack Growth i n High-Strength Steels and Titanium", Final Technical Report AFML-TR-67-26, Vol. 11, June 1969 on Contract AF 33(615)-2788 fo r t he pe r iod April 1967-April 1969, 199 pages.
Hartbower, C . E . , "Application of SWAT t o the Nondestruct ive INspect ion of Welds", Technical Note, Aerojet-General Corp., Sacramento, California, The WELDING JOURNAL, Vol. 35(2), Feb. 1970, September 1969.
Hartbower, C.E. , Green, A.T. and Crimmins, P.P., "Correlation of Stress Wave Emission Characteristics w i t h F r a c t u r e i n Aluminum Al loys" , Quar te r ly Progress Report on Contract NAS 8-21405 t o NASA Huntsv i l le , da ted Ju ly 1969.
Hartbower, C .E . , Green, A.T. and Crimmins, P.P., "Correlation of Stress Wave Emiss ion Charac t e r i s t i c s w i th F rac tu re i n Aluminum Al loys" , Quar te r ly Progress Report on Contract NAS 8-21405 t o NASA Huntsville, dated December-1969.
Hartbower, C.E. , Climent, F.J. , Morais, C. and Crimmins, p a p . , "Stress-Wave Analysis Technique Study on Thick Walled, Type A302B S t e e l P r e s s u r e Vessels", Final Report on Contract NAS 9-7759 (Mod. 1) , July 1969.
Hutton, P .H. , "Use of Acoust ic Emission to Study Fai lure Mechanisms i n Metal", presented a t t h e Metals Engineer ing Pressure Vessels and PiPinR Conference, Washington, D . C . , April 1969.
A-6

Appendix A
1969
(Continued)
Hutton, P.H., "Detecting Acoustic Emission in the Presence of Hydraulic Noise", Battelle-Northwest, Richland, Wash., Non-Destruct. Test., 2- 111-15, May 1969.
Hutton, P.H. and Pedersen, H.N., Crack Detection in Pressure Piping by Acoustic Emission", Nuclear Safety Quarterly Progress Report, May-July 1969, BNWL-1187, pp. 3.1-3.18, Battelle-Northwest, Richland, Washington, (September 1969).
1 1
Jolly, W.D., "The Use of Acoustic Emission as a Weld Ouality Monitor", BNWL-SA-2727, Battelle-Northwest, Richland, Washington, presented at the 24th Annual Petroleum Mechanical Engineering Conference, Tulsa, Oklahoma, September 1969.
Jolly, W.D., "The Application of Acoustic Emission to In-Process Weld Inspection", BNWL-SA-2212, Battelle-Northwest, Richland, Wash., March 1969.
Jolly, W.,D., 'lAcoustic Emission Exposes Cracks Durir.? Welding Process", The Welding Journal, 35(1), 21-29, January 1969.
Liptai, R.G., Dunegan, H . L . and Tatro, C.A., International Journal of Non- destructive Testing, IJNTA, Vol. 1, No. 3, pp. 213-221, Aug 1969.
Moyer, M.W., "Acoustic Emission for Nondestructive Testing and Certification", Y-12 Plant Report Y-DA-2855, Union Carbide Corp., Oak Ridge, Tennessee, Feb. 20 , 1969. 10 p. (from Acoustic Emission krorking Group Conference, New Orleans, La.).
A- 7

Appendix A 1969
(Continued)
Nielsen, A. ,"Acoust ic Emission Invest igat ions During Pressure Vessel Tes t ing a t Reactor Materials Laboratory, Culcheth (United Kingdom Atomic Energy Authority), (Danish Central Welding Inst . , Copenhagen), pp 01-10 of P r a c t i c a l Fracture Mechanics for S t r u c t u r a l S t e e l . Dobson, M . O . (Ed.). London-Chapman and Hall, Ltd.,1969. From Symposium on Fracture Toughness Concepts f o r Weldable S t ruc tura l S tee l , Ris ley , England .
Pol lock , A . A . , "Stress-Wave Emission i n NDT", Non-Destruct. Test., 2- 178-82, Aug . 1969.
Sankar, N . G . , "Unload Emission Behavior of Material and Its R e l a t i o n t o t h e Bauschinger Effect", Ph.D. Thesis , Universi ty of Michigan, Ann Arbor, Michigan, 19 69.
S t e e l e , R.K. , Morais, C.F., Briar, H.P. and S t a n f i e l d , J . , "Design of a System t o Detect and Loca te t he Inc ip i en t Development of Flaws i n Materials", Milestone Report No. 2, March 1969; Final Report on Contract N00600-C-0308, May 1969.
T i e t z e , A. (comp.), "Progress Report on Research Projects Sponsored by the Fede ra l Min i s t ry o f Sc i en t i f i c Resea rch and Appl icable to the Reac tor Safe ty Aspect", (Technischer Euberwachungs-Verein e. V . , Cologne (West Germany). I n s t i t u t f u e r R e a k t o r s i c h e r b e i t ) . T r a n s l a t e d f o r Oak Ridge National Lab., Tenn. , from y e p o r t IRS-F--2'. 51p, 1969.
1968
Anderson, T . T . , Grate, T .A . , "Acous t ic Boi l ing Detec t ion in Reac tor Vessels", Reactor Engineer ing Divis ion, Argonne National Laboratory 15th Nuclear Science Symposium, Montreal, Canada, October 1968.
Argarwall , A.B.L. , "An Inves t iga t ion of the Behavior of the Acoustic Emission from Metals and a Proposed Mechanism f o r i ts Generation", Ph.D. Thes is , The Univers i ty of Michigan, Ann Arbor, Michigan, 1968.
Baker, G.S., "Acoustic Emission and Prefracture Processes in High-Strength S tee l s " , AFML-TR-67-266, Aerojet-General Corporation, Wright-Patterson AFB, March 1968.
Chuch, Y.P., Hardy, H.R . , Jr. , and Stefanko, R . , An I n v e s t i g a t i o n of t h e Frequency Spectra of Microseismic Act ivi ty in Rock under Tension", Proceedings of the Tenth Rock Mechanics Symposium, Austin, Texas, May 1968.
I1
Day, C.K. , "An I n v e s t i g a t i o n of Acoust.ic Emission from Defect Formation i n S t a i n l e s s Steel Weld Coupons", BNWL-902, Battelle-Northwest, Richland, Washington, November 1968.
Dunegan, H . L . , Harris, D.O. and Ta t ro , C.A. , "Fracture Analysis by Use of Acoustic Emission", Engineering Fracture Mechanics, 1, 105-122, June 1968.
A- 8

Appendix A 1968
(Continued)
Dunegan, H.L., Browq, A.E., and KnauSS, P.L., "P iezoe lec t r ic Transducers for Acoustic Emission Measurements", UCRL-50553 , Lawrence Radiat ion Laboratory , December 1968.
Dunegan, H, Harris, D., "Acoustic Emission '- A New Nondestructive Testing Tool", (univ. of California, Livermore). pp 203-38 of Proceed-ings - 1968 Symposium on, t he NDT of Welds and Materials Joining. Evanston, Ill., The Ameriican Socie ty for Nondestructive Testing, Inc. , 1968, and the 3 r d Annual Symposium on Non- destruct ive Test ing of Welds and Materials Joining, Los Angeles, Calif.
Engle, R.B. and Dunegan, H.L., "Acoustic Emission: Stress Wave Detec t ion as a Tool for Nondestructive Testing and Material Evaluation", UCRL-71267, Lawrence Radiation Laboratory, Deptember 1968. Proceedings of the Eighth Symposium on Physics and Nondestruct ive Test ing, Schi l ler Park, Ill., 1968.
Hartbower, C.E. , Gerberich, 1J.V. , and Crimmins, P.P. , "Spontanecws S t r a i n Aging as a Mechanism of Slow Crack Growth," presented a t t h e American Welding Society Annual Conference, Chicago, I l l i n o i s , A p r i l 1968. The WELDING JOURNAL, Vol. 47(10), Oct. 1968.
Hartbower, C.E. , Gerberich, W.W., Reuter , W.G. and Crimmins, P.P. , "Stress- Wave Characteristics o f F rac tu re In s t ab i l i t y i n Cons t ruc t iona l A l loys" , F ina l Report on Contract N00014-66-C-0340, J u l y 1968. AD-674-881.
Hartbower, C.E. and Crimmins, P.P., "Fracture of S t r u c t u r a l Metals as Rela ted to Pressure-Vesse l In tegr i ty and In-Service Monitoring", presented a t t h e ICWG/AIAA 3rd Solid Propulsion Conference (AIAA Paper 68-501), A t l a n t i c C i t y , June 1968.
Hutton, P. H., "Acoustic Emission i n Metals as a NDT Tool", Materials Evaluat ion, 26, 125-128, Ju ly 1968.
Hutton, P.H., "Nuclear Reactor System Noise Analysis, Dresden I Reactor , Commonwealth Edison Company", BNIJL-867, Battelle-Northwest , Richland, Washington, October 1968.
Jo l ly , W.D. , "An In-Situ Weld Defect Detector Acoustic Emission1', BNIJL-817, Battelle-Northwest, Richland, Washington, September 1968.
L i p t a i , R.G., Dunegan, H.L. and Tatro, C.A., I 'Acoustic Emissions Generated During Phase Transformations i n Metals and Alloys", UCRL-50525, Lawrence Radiation Laboratory, September 1968.
Michaels, T.E., "Acoustic Emission of Zircaloy-2 During Tensile and Fatigue Loading", BNWL-727, Battelle-Northwest: , Richland, Washington, August 1968, 30p.
Pollock, A.A. , "Stress-Wave Emission - A New Tool for Indus t ry" , Ul t rasonics , 6 , 88-92, Apr i l 1968.
Reuter, W.G., Green, A.T., Hartbower, C.E., and Crimmins, P.P., '!Monitoring of Crack Growth i n Ti-6A1-4V Al loy by the S t ress Nave Analysis Technique", Final Report on Contract NAS 9-7759, Dec. 1968.
A-9

. ". . . . "
Appendix A
1968
(Continued)
S e a w i c k , R.T., "Acouskic Einissian from Single Crystals of .LiF and KCl" , J o u r n a l of 'Applied 'Physics, 39, 1728-1740, February 1968.
Waite, E.V. and Myore, K. V., "ACOUST--A D i g i t a l Program f o r A c o u s t i c T r i angu la t ion of Nuclear Vessels", IDO-17280 , 'Phi l l ips Petroleum Company, Idaho Fal ls , Idaho, November 1968, 19p.
Worlton, D.C., "Review o f S e l e c t e d . N o n d e s t r u c t i v e T e s t h g A c t i v i t i e s a t Battelle Northwest Laboratory", (Battelle-Northwest, Richland, Wash.), pp 353-60 of MaTerials Technology: An Interamerican Approach. New York; American Society of Mechanical Enginee (1968). From IntercAmerican Conference on Materials Technology, San 7 Antonio, Tex.
196 7
Baker, G.S. and Green, A.T., "Stress-Wave and Fracture of High-Strength Metal", USAF AFML Symposium on Corre la t ion of Mgterial Charac te r i s t i c s w i th Systems Performance, Orlando, Florida, May 1967.
Baker, G.S., "Acoustic Emission .and Pre-Fracture Processes in High-Strength S tee l s " , F ina l Repor t on Con t rac t USAF AF 33(615)-5027, July 1967.
Beal, J . B . , "Ultrasonic Emission Detector Evaluat ion of Strength of Bonded Materials", Nondestructive Testing Trends and Techniques, NASA SP-5082, 1967.
Dunegan, H.L., and Tatro, C.A., "Pass ive Pressure Transducer Ut i l iz ing Acous t ic Emission", UCRL-14981, Lawrence Radiation Laboratory, Livermore, California, 1967, and Review of Scient i ' f ic Instruments , Vol . 38, No. 8, August 1967.
Dunegan, H.L., Harris, D.O. , Ta t ro , C.A., "Fracture Analysis by Use of Acoustic Emission", National Symposium on Fracture Mechanics, Lehigh University, June 1967. Publ ished in Engineer ing Fracture Mechanics , Vol . 1, p. 105, June 1968.
F i she r , R.M. and Lal ly , J . S . , "Microplasticity Detected by an Acoustic Technique", Canadian Journal of Physics, Vol. 45, No. 2 , Pa r t 3 , Feb. 1967, pp. 1147-1159.
Gerberich, W.W., Baker, G.S., "On t h e Toughness of Two-Phase 6A1-4V Titanium Microstructures,"ASTM Titanium Symposium, Los Angeles , Cal i f . , Apri l 1967.
Gerberich, W.W., Baker, G.S., Reuter , W . G . , Crimmins, P.P., Hartbower, C.E.,
N600(61533)-65927, Aug. 1967.
11 Materials Investigation--Titanium", Kava1 Ship Research and Development Center,
Gerberich, W.W., Hartbower, C.E., "Mor.itoring Crack Growth of Hydrogen Embri t t le- ment and Stress Corrosion CraEking by Acoustic Emission", Conference on Funda- mental Aspects of Stres .s Corrosion Crxking, Ohio State Universi ty , Sept . 1967.
A-10

Appendix A 1967
(Continued)
Gerberich, W . W . , Hartbower, C .E. , "Stress-Wave Emission as a C r i t e r i o n f o r Discontinuous Crack Extension", ASM Metal Science Forum on Criteria f o r Brittle Crack Extension, Cleveland, Ohio, O c t . 1967.
Green, A.T., "Testing of 10-in. Glass Hemispheres Using Stress-'Wave Analysis Technique", Naval Ship,Research and Development Center,. N00014-67-C-0333, Sept . B67.
Green, A.T. and Hartbower, C.E., "Stress-Wave Analysis Technique for Detect ion of Incipient Fai lure" , Aerojet-General dorp. , Presented a t ORNL Conference on Inc ip i en t Fa i lu re D iagnos i s for AssuGing Safe ty and Avai lab i l i ty o f Nuclear Power Plants, Gatlinburg, Tennessee, October 1967. Published i n t h e PROCEEDINGS of t h e AEC Conference.
Hartbower, C.E., Gerberich, W.W., Liebowitz. , H., " Inves t iga t ing of Crack-Growth Stress-Wave Relationships," National Symposium on Fracture Mechanics, Lehigh, ,1967, Journal of Applied Fracture Mechanics, Vol. 1, No. 2,.p. 291, Aug 1968.
Hartbower, C.E. , Gerberich, W . W . , Reuter , W.G., Crimmins, P.P., "Stress-Wave C h a r a c t e r i s t i c s o f F r a c t u r e I n s t a b i l i t y i n C o n s t r u c t i o n a l A l l o y s " , ONR Contract N00014-66-C0340, July 1967.
Hartbower, C.E., Gerberich, W.W., Crimmins, P.P., "Monitoring Subcritical Crack Growth by Detect ion of Elastic Stress-Waves, American Welding Society, Houston, Texas, Oct. 1967, published i n The Welding Journal, Vol. 47, No. 1, Jan. 1968. ( received the SPRARAGEN AWARD as the bes t resear ' ch paper publ i shed i n The WILDING JOURNAL i n t h e y e a r 1 9 6 8 . ) .
Hoppman, W.H., "S ta t ics and Dynamics of Deformation of Physical Models of Crys ' ta l l ine Materials Which Exhib i t Couple S t ress Ef fec ts" , AD-822-861, Rensse l ae r Po ly techn ic In s t i t u t e , T roy , New York, September 1967.
Hutton, P.H., 11 Crack Detec t ion in Pressure P ip ing by Acous t ic Emiss ion" , Nuclear Safety Quarterly Progress Report January-March 1967,.NVIJL-433, Battelle-Northwest, Richland, Washington, June 1967.
Hutton, P.H., "Crack Detec t ion in Pressure P ip ing by Acous t ic Emiss ion" , Nuclear Safety Quarter ly Progress Report Aprl l -June 1967, BNIJL-537, Battelle-Northwest, Richland, Washington, September 1967.
Hutton, P.H., l lAcoust ic Emission in Fetals as a NDT Tool", Battelle, Northwest, BNWL-SA-1262. 27 th Nat iona l Conference o f the Soc ie ty for Nondes t ruc t ive Testing, Cleveland, Ohio, Oct. 1967.
0
A-11

Appendix A
1967
(Continued)
Michaels, T.E. and Fraser , M.C., "Acoustic Emission Behavior of Zircaloy-2 Pressure Tubing Under Applied Stress", BNWL-545, Battelle-Northwest, Richland, Washington, September 1967.
Par ry , DIL., "Nondestruct ive Flaw Detect ion in Nuclear Power I n s t a l l a t i o n s " , USAEC repor t , Conference Proceedings , Inc ip ien t Fa i lure Diagnos is for Assur ing Safe ty and Avai lab i l i ty o f Nuclear Power Plants , Gat l inburg, Tenn. , Nov. 1967. Also TRANS. American Nuclear Society, Vol. LO, No. 1, 1967.
Par ry , D.L. , "Nondestructive Flaw Detect ion by Use of Acoustic Emission", IDO-17230, Phi l l ips Pe t ro leum Company, Idaho Fa l l s , Idaho , May 1967.
Pol lock, A.A., "S t ress Wave Emission During Stress Corrosion Cracking of Titanium Alloys", D 1-82-0658, Boeing Airp lane Company, October 1967.
Schof ie ld , B.H., "Kaiser Ef fec t : No i se f rom P la s t i ca l ly Deformed Metals; Tin C r y " , Encyclopaedic Dictionary of Physics, Supplementary Volume 1 , Pergamon Press 1967.
Worlton, D.C., e t a l . , "Nuclear Safety Quarterly Report Jan, Feb, Mar, 1967 for Nuclear Safety Branch of USAFC Division of Reactor Development and Technology," Battelle-Northwest BNWL-433, July 1967.
Worlton, D.C., e t a l . ,"Nuclear Safety quarter ly Report Apri l , May, June, 1967 for Nuclear Safety Branch of USAEC Divis ion of Reactor Development and Technology", Battelle-Northwes t BNWL-537.
1966
Antsferov, M.S., Ed., "Seismo-Acoustic Methods i n Mining", S.E. Hall, Trans. Consultant 's Bureau, New York, 1966.
Bol les , Mil ton Moris , "Invest igat ion and Design of a F lu id Coupled Acoustic Transducer System for the Detect ion of Acoustic Emission, Tulane University, Ph.D. Disser ta t ion , 1966.
Downing, T .J . , The Acoust ic Analysis of Materials i n Dynamic Applicat ions" , Memorandum Report N67-6-1, Frankford Arsenal , Phi ladelphia , Pennsylvania , September 1966.
I1
A-12

Appendix A 1966
(Continued)
G?.EerzP LT,, L a a n , . C.S.cF E m l q SJ", Steele, R.K.,, "Feasibi l i ty Study o f k a u s t 5 c r D e p q s s u r i z a d o n ; System;" NASA CR-55472, March 1966.
A-I3

Appendix A 1966
(Continued)
Srawley, J .E. , " Invest igat ion of Hydrotest Fai lure of Thiokol Chemical Corp. , 260-in.-Dia. Motor Case", NASA "$I-X-1194, Jan. 1966.
Watson, 'R.W. , Becker, K.R., and Gibson, F.C. , "St ress Waves i n Bounded Media", Pit tsburgh Explosives Research Center Quarterly Report December 1965-February 1966, AD-480-403, Bureau of Mines, April 1966.
19 65
Baker, G.S. and Bainbridge, D.W., " In f luence o f S t r a in Rate on Acoustic Emission from ilardened D6aC During Increment Crack Growth", I n t e r n a l Memorandum, Aerojet- General Corp. , November 1965.
Baker, G.S. and Bainbridge, D.W., "Sources of Pre-Fracture Acoustic Emission", I n t e r n a l Membrandtixn, Aerojet-General Corp., October 1965.
Brown, W.F., and Srawley, J . E . , "Fracture Toughness Testing and Its APPlica- t i ons" , F rac tu re Toughness Testing Methods, ASTM Specia l Technica l Publ ica t ion No. 381, Phi ladelphia , Pennsylvania , American Society for Test ing and Materials, pp. 133-244, 1965.
Butenko, A.N. and Gumenyuk, V.S., !'Acoustic Device f o r U l t r % o n i c Wire Inspec t ion" , Indus t r ia l Labora tory ; , 31, 1757-1758, November 1965.
Egle, D.M., "A Comprehensive Analysis ofLan Acoustic Emission Detection System", Ph.D. Thesis , Tulane Universi ty , New Orleans, Louisiana, 1965.
Goodman, R.E. and Blake, W. , "Rock Noise ' in Landsl ides and Slope Fai lures" , Univers i ty .of Cal i forn ia Press , Berke ley , Cal i f . ,1965.
Green, A.T., Hartbower, C.E., and.Lockman, C.S., "Feas ib i l i ty S tudy of Acous t ic Depressurization System:, Report NAS 7-310, Aerojet-General Corporat ion, February 1965.
Kerawalla, J .N. , "An Investigation of the Acoustic Emission from Commercial Ferrous Materials Subjected to Cycl ic Tensi le Loading", Ph.D. Thes is , University of Michigan, Ann Arbor, Michigan, 1965. University microfilm
.66-6632.
R u t t r u f f , H. and Wolfrum, J., "Acoust ical Detect ion of Elec t romagnet ica l ly Produced Shock Waves", Nachr Akad Wlss Cott ingen, Math-Phys. K1. N.3 . ( i n German), 1965.
A-14
Appendix A
' 19 65
(Continued)
McCauky, M.L., "Engineering Geology", Association of Engineering Geologists, AEGBA, Vol . 2, 1965, p. 1.
Mitchell, L.D., "An Invest igat ion of the Correlation of the Acoustic Emission Phenomenon with the Scat te r in Fatigue Data" , Ph.D. Thesis, University of Michiga& Ann Arbor, Mich igan (iJniv. EHcrofflms 66-6657), 1965.
Moss, G.L., "Fracture of Fe With Stress Waves", Report BRL-1289, B a l l i s t i c Research Labs, Aberdeen Proving Ground, Maryland, Ju ly 1965.
Schofield, B.H., "Investigation of Applicability of Acoustic Emission", Technical Report, ML TR-65-106, Lessels and Associates, May 1965.
Srawley, 3.E. and Brown, W.F., "Fracture Toughness Testing Methods", ASTM STP-381, American Saciety for Testing and Materia&, 133-244, 1965.
Steele , R.R., Green, A.T. and Lockman, C.S., "Structural-Seismology Techniques for Prevention of Failure of Rocket Chambers", ICPRG, Aerojet-General Coni., 19 65.
Susuki, K., Sasaki, Z., Siohara, Z., and Kirota, T., i n Proceedings of the In te rna t iona l Conference on Strata Control and Rock Mechanics, Columbia University., New York, l965, p. 1.
Swann, P.R. and Embury, J.D., "Hcrostructaral Aspects of Stress Corrosion Failure", Hfgh Strength Materials, John Wiley and Sons, New York, 1965.
Weds, V., Krause, G. , Chave, C. , Jr . , and Marchetto , G. , "Crack I n i t i a t i o n i n Metallic Materids", Progress Report on Contract NOw-65-0355-d, 1965.
19 64
Braddock, P.H., "New Method f o r NDT U s e s Ultrasonic Waves from Loads", Metalworking News, Fairchi ld News Service, October 1964.
Brown, W.F., Jr., and Jones, M.H., "Acoustic Detection of Crack I n i t i a t i o n
Dunegan, H.L., Harris, D . O . , and Tatro, C.A., "Acoustic Emission Research Status Report, December 1963-August 1964", UCID-4868 Rev. 1, Lawrence Radiation Laboratory, November 1964.
Steele, R.K., Green, A.T., Lockman, C.S., "Acoustic Verification of Struc tura l In tegr i ty of Polar is Chambers", Soc-Lety of Plast ic Engineers, Atlantic City, N .Y . , Jan. 1964. Published i n Modern P la s t i c s , Vol. 41, pp. 137-139, July 1964.

Appendix A
1964
(Continued)
Kro l l , R.J . , "Stress-Wave Propagation i n A x i a l l y Symmetric Test Specimens", Experimental Mechanics, Vol. 4 , No. 5, 129-134, May 1964.
Schof ie ld , B.H., "Acoustic Emission Under Applied Stress", ASD-TDR-63-509 , P a r t 11, May 1964.
Schof ie ld , B.H., "Acoustic Emission under Cyclic Stress", Final Report TR 796/P81, Lessels and Associates , July 1964.
1963
Borchers, H. and Tensi, H.M., "Piezoelektische Impulsmessungen bei der Phasenanderung von unlegierten Proben der binaren Legierungen Blei-Sinn, Blei-Antimon und Kadmium-Zink," Z. Metallkunde, 17. 784, 1963.
Green, A.T., Lockman, C.S., and Haines, H.K., l lAcoustic Analysis of Filament- Wound P o l a r i s Chambers", Report 0672-01FY Aerojet-General Corp., Sacramento, California, September 1963.
Jones , M.H. and Brown, W.F., Jr., "An Acoust ic Method for Determining the Onset of Crack Propagation in Sharply Notched Specimens", paper presented a t t h e ASTM Annual Meeting, June 1963.
L i p t a i , R.G., An Inves t iga t ion of the Acous t ic Emiss ion Phenomenon", Ph.D. Thesis, Michigan S ta t e Un ive r s i ty , East Lansing, Michigan, 1963.
I1
L i p t a i , R.G. and Tatro, C.A. , Proceedings of the Fourth Annual Symposium on Nondestruct ive Test ing of Aircraft and Missile Components, Southwest R e s e a r c h I n s t i t u t e , San Antonio, Texas, 1963, pp 287-341.
Schof ie ld , B.H., 'lAcoustic Emission from Metals, Its Detect ion, Character- istics, and Source", Proceedings of the Symposium on Physics and Nondestructive Test ing, Southwest Research Inst i tute , San Antonio, Texas, October 1963.
Schof ie ld , B.H., "Acoustic Emission Under Applied Stress" , ASD-TDR-63-509, P a r t I, 1963.
1962
Borchers, H.. and Teusi , H.M., "Piezoelektrische Impulsmessungen Wahrend d e r Mechanischem Beansprunchung von A l , MgD, und A199", Z,. Metallkunde, 1962.
R.J. Kroll, "Stress Waves i n T e s t Specimens due to Simulated Acoustic Emission", Ph.D. T e h s i s , Michigan S t a t e U n i v e r s i t y , East Lansing, Michigan, 1962.
Tatro, C.A. and Lip ta i , R.G., "Acoustic Emission from Crystall ine Substances", Procekdings of t h e Symposium on Physics and Nondestructive Testing, Southwest Research I n s t i t u t e , S a n Antonio, TtxKas, 145-158, October 1962.
A-16
Appendix A
Borchers, H. and Tensi, H.M., "Eine verbesser te p iezoe lek t r i sche Methode zur Untersuchung von Vorgangen i n Metallen bei mechanischer Beanspruchung und b e i Phasenanderung", 2. Metallkunde, 51, 212, 1961.
Christensen, R.H., "Cracking and F r a c t u r e i n Metals and Structures" ,
Schofield, B.H., "Acoustic Emission Under Applied Stress", Report ARL-150 , Lessels and Associates, December 1961.
19 60
Borchers, H. and Tensi, H.M., "Eine Verbesser te Piezoelektr ische Methode", Z. lietallkunde, Vol. 51, No. 4, 212-218, 1960.
1959
Tatro , C.A., "Sonic Techniques i n t h e D e t e c t i o n o f C r y s t a l S l i p i n Metals", Progress Report , Division of Engineer ing Research, Michigan State Universi ty , East Lansing, Michigan, January 1959.
1958
Borchers, H. and Kaiser, J., "Akustische Effekte bei Phasenuberganen i m System Blei-Zinn", Z . Metallkunde, 49, 95-100, 1958.
Lean, J . B . , P la teau , J. , Bachet, C. and Crussuard, C., "Sur l a deformation d'ondes Sonores, au Cours d 'essais de traction, dans des Eprouvettas Metal l iques" , Comptes Rendus des Seances de 1'Academie des Sciences, 246, 19 %
May 1958.
Schofield, B.H., Bareis, R.A., Kyrala, A.A., "Acoustic Emission Under Applied S t ress" , WADC Technical Report 58-194, ASTIA Doc. No. AD155674, A p r i l 1958.
Borchers, H. and Tensi, H.M., "Eine Verbesserte P$zmelektrische Ilethode", 2. Metallkunde, 23, 1957.
Kaiser, J., "Uber das Auftreten von Gerauschen beium Schmelzen und Erstarren von Metallen", Forschg- 1%. Wes., 1'01. 2 3 , No. 1-2, p. 38, 1957.

Kaiser, J., "Untersuchungen uber das Auftreten Gerauschen B e i m Sugversuch", Ph.D. Thesis, Techn. Hochsch., Munchen, 1950, and Arkiv Fur das Eisen- huttenwesen, Vol. 24, No. 1-2, Jan. /Feb. 1953, pp. 43-45.
194 8
Mason, W.P., McSkimin, H.J. and Shockley, W., l 'Ultrasonic Observation of %inning i n Tin", Physical Review, Vol. 73, No. 10, pp. 1213-1214, May 1948.
1942
Obert, L. and Duvall, W., "Use of Subaudible Noises fo r t h e P r e d i i t i o n of Rock Burs t s , Par t 11", RI-3654, US Bureau of Mines, 1942.
1928 - Jo f fe ' , A. , The Physics o f Crys ta l s , McGraw-Hil l , New York, 1928.
A-18 1072 - 17