Embed Size (px)
Citation preview
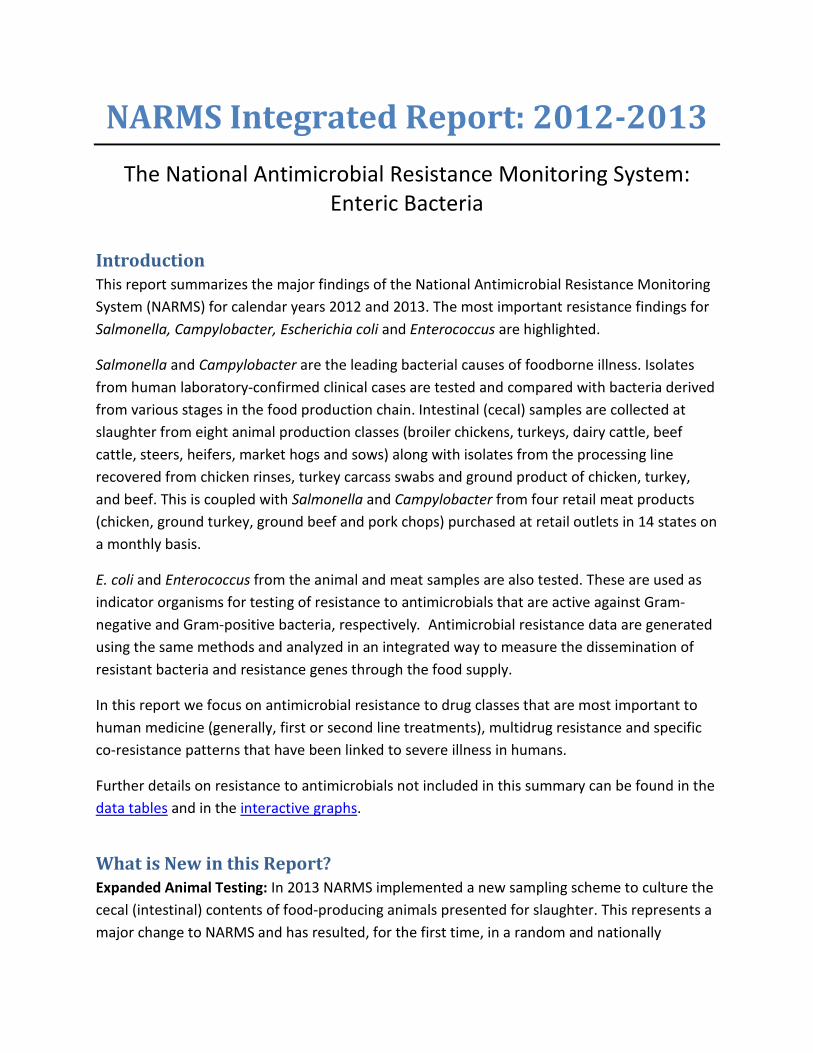
NARMS Integrated Report: 2012-2013 The National Antimicrobial Resistance Monitoring System:
Enteric Bacteria
Introduction This report summarizes the major findings of the National Antimicrobial Resistance Monitoring System (NARMS) for calendar years 2012 and 2013. The most important resistance findings for Salmonella, Campylobacter, Escherichia coli and Enterococcus are highlighted.
Salmonella and Campylobacter are the leading bacterial causes of foodborne illness. Isolates from human laboratory-confirmed clinical cases are tested and compared with bacteria derived from various stages in the food production chain. Intestinal (cecal) samples are collected at slaughter from eight animal production classes (broiler chickens, turkeys, dairy cattle, beef cattle, steers, heifers, market hogs and sows) along with isolates from the processing line recovered from chicken rinses, turkey carcass swabs and ground product of chicken, turkey, and beef. This is coupled with Salmonella and Campylobacter from four retail meat products (chicken, ground turkey, ground beef and pork chops) purchased at retail outlets in 14 states on a monthly basis.
E. coli and Enterococcus from the animal and meat samples are also tested. These are used as indicator organisms for testing of resistance to antimicrobials that are active against Gram-negative and Gram-positive bacteria, respectively. Antimicrobial resistance data are generated using the same methods and analyzed in an integrated way to measure the dissemination of resistant bacteria and resistance genes through the food supply.
In this report we focus on antimicrobial resistance to drug classes that are most important to human medicine (generally, first or second line treatments), multidrug resistance and specific co-resistance patterns that have been linked to severe illness in humans.
Further details on resistance to antimicrobials not included in this summary can be found in the data tables and in the interactive graphs.
What is New in this Report? Expanded Animal Testing: In 2013 NARMS implemented a new sampling scheme to culture the cecal (intestinal) contents of food-producing animals presented for slaughter. This represents a major change to NARMS and has resulted, for the first time, in a random and nationally
2 NARMS 2012-2013
representative sampling of all four major food animal species and antimicrobial susceptibility data on all four bacteria targeted in NARMS. Since NARMS began, the animal component tested antimicrobial susceptibility in Salmonella isolates that were collected as part of the United States Department of Agriculture (USDA) Pathogen Reduction Hazard Analysis and Critical Control Point program (PR/HACCP), which monitors the ability of processing plants to control microbiological hazards. Cecal specimens reflect the microbial status of individual animals that have not been exposed to in-plant processing, making them better indicators of the microbial status of animals on farm (WHO, 2013). In addition, the new in-plant sampling makes it possible to distinguish market hogs and sows among swine samples and dairy and beef among cattle samples. In this summary we distinguish cecal samples and PR/HACCP samples to indicate the point at which they were collected. Additional details on sample sources and sampling methodology can be found here. Table 1. Isolate sources
Human Chickens Turkeys Cattle Swine Clinical illness Retail Chicken Retail Ground Turkey Retail Ground Beef Retail Pork Chops
PR/HACCP PR/HACCP PR/HACCP PR/HACCP†
Cecal Cecal Cecal Beef Cecal Market Hogs Cecal Dairy Cecal Sows
†Swine PR/HACCP carcass sampling was discontinued in July 2011. Interpreting Campylobacter Results: Unlike the other bacteria tested in NARMS, there are no formal clinical breakpoints established for Campylobacter. In this report, NARMS used a different approach to interpret antimicrobial susceptibility data for Campylobacter based on epidemiological cut-off values (ECOFFs). ECOFFs are used to distinguish isolates with any acquired resistance trait (non-wild type) from those without any acquired traits (wild type). In this report, non-wild-type Campylobacter isolates are termed resistant. It is important to emphasize that because ECOFFs are based only on features of the bacterium (e.g., their MIC), they are distinct from clinical breakpoints. Clinical breakpoints define resistance using pharmacological parameters and data from clinical trial outcomes. This change facilitates detection of emerging resistance and is a step toward globally harmonized methods for Campylobacter surveillance. Please see the Guidance for Readers for a description of what ECOFFs are and how they differ from clinical breakpoints. Cefepime breakpoints: In 2014, the Clinical and Laboratory Standards Institute (CLSI) revised the breakpoints for cefepime, an antimicrobial that is used to screen for extended-spectrum beta-lactamase (ESBL) production (CLSI M100-S24 document, 2014). The cefepime resistance breakpoint was lowered from ≥32 µg/mL to ≥ 16 µg/mL. Also included in the cefepime revision
3 NARMS 2012-2013
was the introduction of the susceptible-dose dependent (SDD)1 category, which was created to address issues with different dosing regimens. The new breakpoints and SDD category have been applied in this report.
Pathogenic Bacteria
Non-Typhoidal Salmonella Non-typhoidal Salmonella (i.e., serotypes other than Typhi, Paratyphi A, Paratyphi B, and Paratyphi C) usually cause diarrhea, fever and abdominal cramps. Some infections spread to the blood and can be life-threatening. Non-typhoidal Salmonella causes approximately 1.2 million illnesses, 23,000 hospitalizations, and 450 deaths each year in the United States (Scallan et al., 2011). Direct medical costs are estimated to be $3.6 billion annually (Economic Research Service, 2014).
Physicians rely on antimicrobials such as ceftriaxone and ciprofloxacin for treating patients with severe Salmonella infection. Therefore, preventing resistance to these classes of antimicrobials is important. It is estimated that approximately 100,000 drug-resistant non-typhoidal Salmonella infections and 40 deaths occur annually in the US (CDC, 2013).
Prevalence of Non-Typhoidal Salmonella In 2012, a total of 3,897 non-typhoidal Salmonella isolates were tested, 2,233 from humans, 345 from retail meats, and 1,319 from PR/HACCP samples.
For retail meat testing in 2012, Salmonella was isolated from 18% of chicken, 7% of ground turkey, 1% of ground beef, and 0.9% of pork chops (Figure 1).
1 Additional information on the definition and use of susceptible-dose dependent (SDD) category can be found at the following location http://community.clsi.org/micro/wp-content/uploads/sites/15/2013/07/Cefepime-BP-Change-for-Enterobacteriaceae_-Intro-of-SDD-For-Labs.pdf
4 NARMS 2012-2013
0%
10%
20%
30%
40%
50%
60%
70%
80%
90%
100%
Chickens Turkeys Beef Cattle Dairy Cattle MarketHogs
Sows
Perc
ent P
ositi
ve
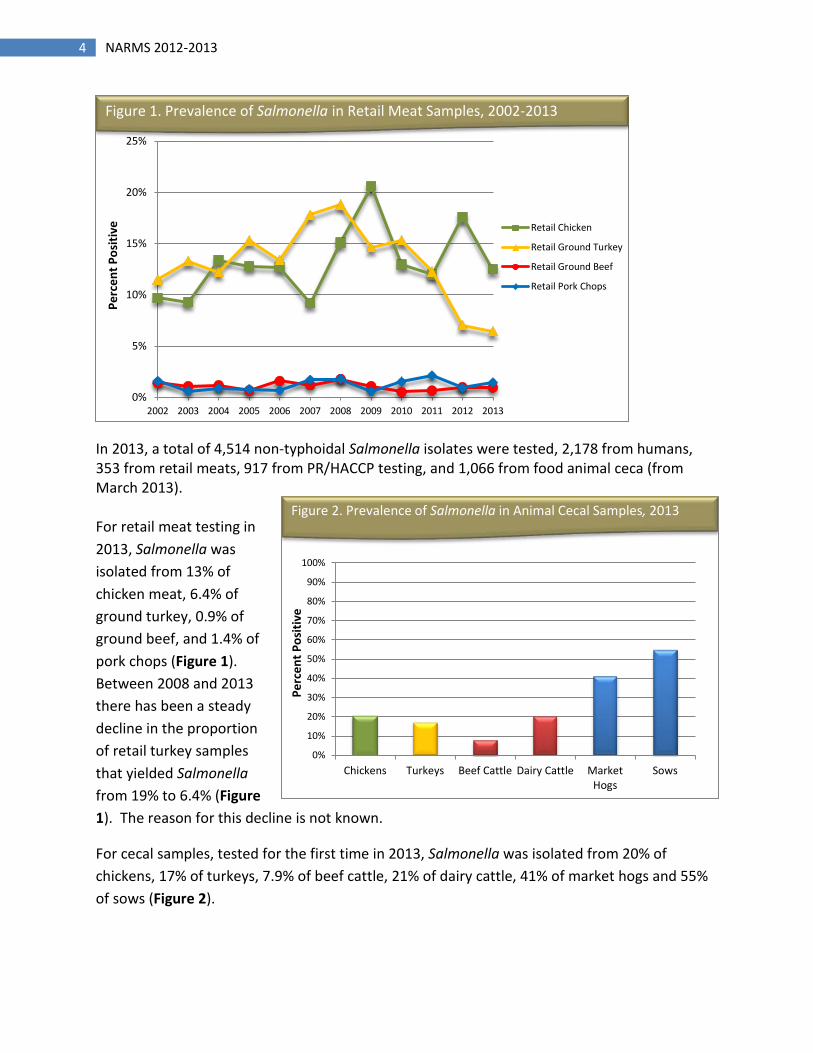
Figure 2. Prevalence of Salmonella in Animal Cecal Samples, 2013
In 2013, a total of 4,514 non-typhoidal Salmonella isolates were tested, 2,178 from humans, 353 from retail meats, 917 from PR/HACCP testing, and 1,066 from food animal ceca (from March 2013).
For retail meat testing in 2013, Salmonella was isolated from 13% of chicken meat, 6.4% of ground turkey, 0.9% of ground beef, and 1.4% of pork chops (Figure 1). Between 2008 and 2013 there has been a steady decline in the proportion of retail turkey samples that yielded Salmonella from 19% to 6.4% (Figure 1). The reason for this decline is not known.
For cecal samples, tested for the first time in 2013, Salmonella was isolated from 20% of chickens, 17% of turkeys, 7.9% of beef cattle, 21% of dairy cattle, 41% of market hogs and 55% of sows (Figure 2).
0%
5%
10%
15%
20%
25%
2002 2003 2004 2005 2006 2007 2008 2009 2010 2011 2012 2013
Perc
ent P
ositi
ve
Retail Chicken
Retail Ground Turkey
Retail Ground Beef
Retail Pork Chops
Figure 1. Prevalence of Salmonella in Retail Meat Samples, 2002-2013
5 NARMS 2012-2013
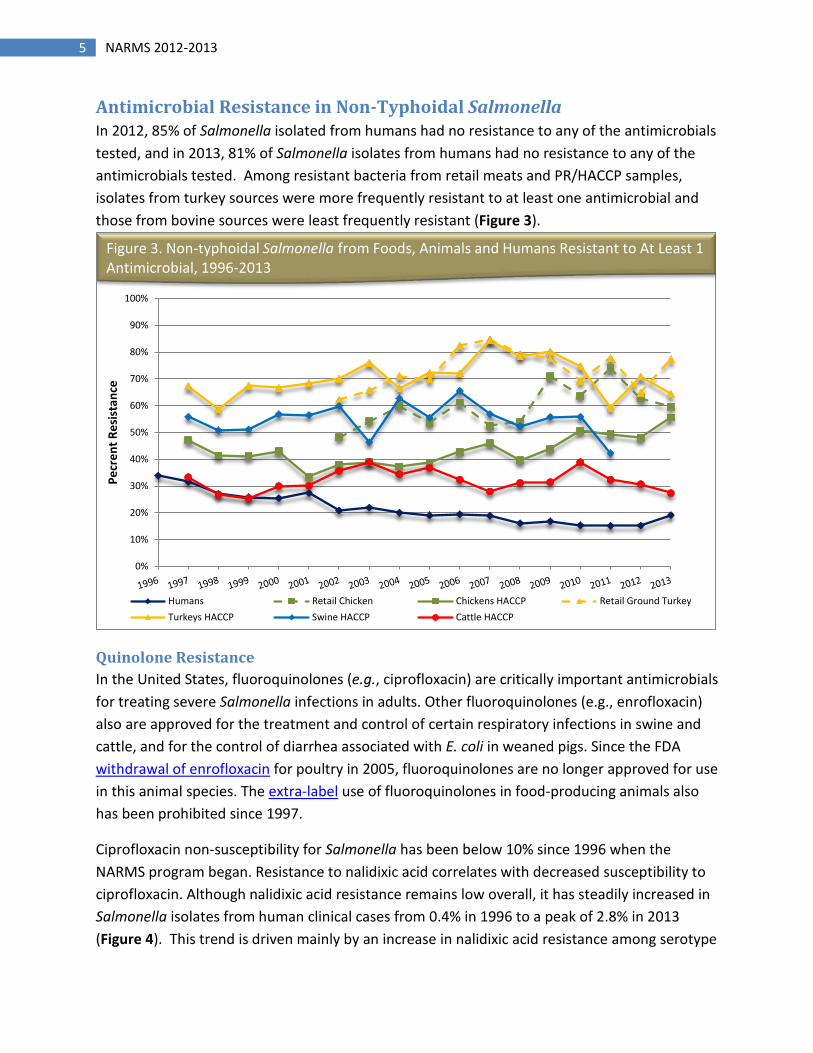
Antimicrobial Resistance in Non-Typhoidal Salmonella In 2012, 85% of Salmonella isolated from humans had no resistance to any of the antimicrobials tested, and in 2013, 81% of Salmonella isolates from humans had no resistance to any of the antimicrobials tested. Among resistant bacteria from retail meats and PR/HACCP samples, isolates from turkey sources were more frequently resistant to at least one antimicrobial and those from bovine sources were least frequently resistant (Figure 3).
Quinolone Resistance In the United States, fluoroquinolones (e.g., ciprofloxacin) are critically important antimicrobials for treating severe Salmonella infections in adults. Other fluoroquinolones (e.g., enrofloxacin) also are approved for the treatment and control of certain respiratory infections in swine and cattle, and for the control of diarrhea associated with E. coli in weaned pigs. Since the FDA withdrawal of enrofloxacin for poultry in 2005, fluoroquinolones are no longer approved for use in this animal species. The extra-label use of fluoroquinolones in food-producing animals also has been prohibited since 1997.
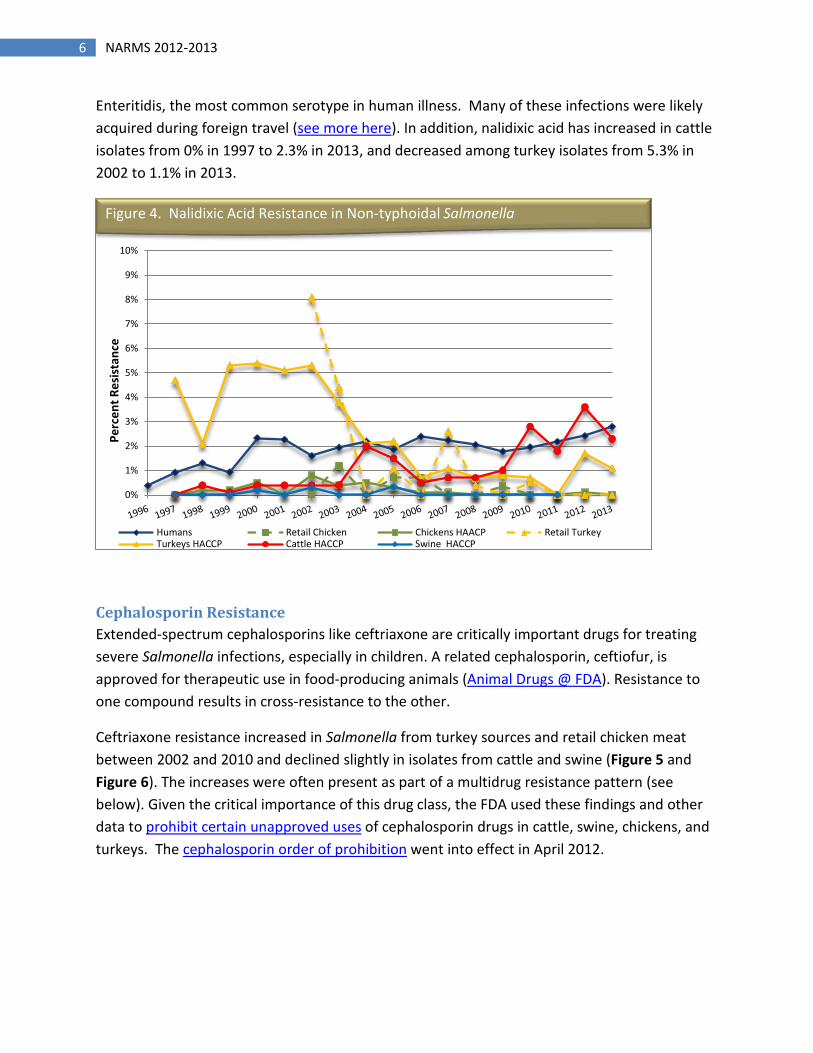
Ciprofloxacin non-susceptibility for Salmonella has been below 10% since 1996 when the NARMS program began. Resistance to nalidixic acid correlates with decreased susceptibility to ciprofloxacin. Although nalidixic acid resistance remains low overall, it has steadily increased in Salmonella isolates from human clinical cases from 0.4% in 1996 to a peak of 2.8% in 2013 (Figure 4). This trend is driven mainly by an increase in nalidixic acid resistance among serotype
0%
10%
20%
30%
40%
50%
60%
70%
80%
90%
100%
Pecr
ent R
esis
tanc
e
Humans Retail Chicken Chickens HACCP Retail Ground TurkeyTurkeys HACCP Swine HACCP Cattle HACCP
Figure 3. Non-typhoidal Salmonella from Foods, Animals and Humans Resistant to At Least 1 Antimicrobial, 1996-2013
6 NARMS 2012-2013
Enteritidis, the most common serotype in human illness. Many of these infections were likely acquired during foreign travel (see more here). In addition, nalidixic acid has increased in cattle isolates from 0% in 1997 to 2.3% in 2013, and decreased among turkey isolates from 5.3% in 2002 to 1.1% in 2013.
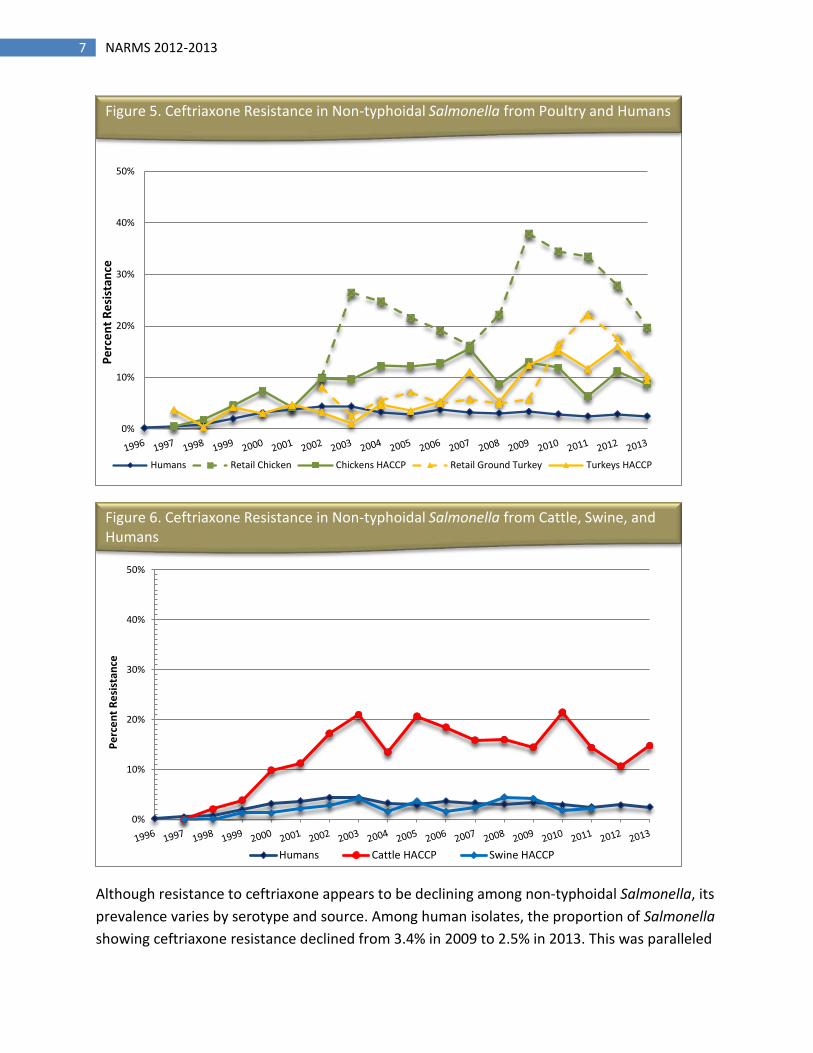
Cephalosporin Resistance Extended-spectrum cephalosporins like ceftriaxone are critically important drugs for treating severe Salmonella infections, especially in children. A related cephalosporin, ceftiofur, is approved for therapeutic use in food-producing animals (Animal Drugs @ FDA). Resistance to one compound results in cross-resistance to the other.
Ceftriaxone resistance increased in Salmonella from turkey sources and retail chicken meat between 2002 and 2010 and declined slightly in isolates from cattle and swine (Figure 5 and Figure 6). The increases were often present as part of a multidrug resistance pattern (see below). Given the critical importance of this drug class, the FDA used these findings and other data to prohibit certain unapproved uses of cephalosporin drugs in cattle, swine, chickens, and turkeys. The cephalosporin order of prohibition went into effect in April 2012.
0%
1%
2%
3%
4%
5%
6%
7%
8%
9%
10%
Perc
ent R
esis
tanc
e
Humans Retail Chicken Chickens HAACP Retail TurkeyTurkeys HACCP Cattle HACCP Swine HACCP
Figure 4. Nalidixic Acid Resistance in Non-typhoidal Salmonella
7 NARMS 2012-2013
Although resistance to ceftriaxone appears to be declining among non-typhoidal Salmonella, its prevalence varies by serotype and source. Among human isolates, the proportion of Salmonella showing ceftriaxone resistance declined from 3.4% in 2009 to 2.5% in 2013. This was paralleled
0%
10%
20%
30%
40%
50%
Perc
ent R
esis
tanc
e Chart Title
Humans Retail Chicken Chickens HACCP Retail Ground Turkey Turkeys HACCP
Percent of Salmonella Typhimurium Resistant to Ceftriaxone Figure 5. Ceftriaxone Resistance in Non-typhoidal Salmonella from Poultry and Humans
0%
10%
20%
30%
40%
50%
Perc
ent R
esis
tanc
e
Humans Cattle HACCP Swine HACCP
Percent of Salmonella Typhimurium Resistant to Ceftriaxone Percent of Nontyphoidal Salmonella Resistant to Ceftriaxone- CATTLE and SWINE Percent of Salmonella Typhimurium Resistant to Ceftriaxone Figure 6. Ceftriaxone Resistance in Non-typhoidal Salmonella from Cattle, Swine, and Humans
8 NARMS 2012-2013
by a decline in resistance from 38% to 20% in retail chicken isolates during the same time frame (Figure 5). Among retail ground turkey isolates, resistance showed a continued decline to 9.4% after peaking at 22% in 2011 (Figure 5).
The proportion of human Salmonella serotype Heidelberg resistant to ceftriaxone was 15% in 2013, down from a peak of 24% in 2010. In Heidelberg isolates from retail chicken, resistance was 0% in 2013, after peaking to 32% in 2009. Among retail ground turkey isolates, ceftriaxone resistance declined to 29% on 2013 after reaching a peak of 39% in 2011.
Among human isolates of serotype Typhimurium, ceftriaxone resistance is < 7% since testing began in 1996. In retail chicken isolates, however, resistance has ranged between 33% and 64% since testing began in 2002; in 2013, 50% of the isolates were resistant.
High ceftriaxone resistance among serotypes associated with cattle sources (Figure 6), is mainly due to serotype Newport, and has declined slightly since 2002. In contrast, ceftriaxone resistance has appeared in an increasing proportion of strains of serotype Dublin from cattle sources (see TEXT BOX 1). While Dublin is not a common cause of human infection, it is more likely to result in bacteremia than other serotypes. It is also a challenge in veterinary medicine as a common cause of neonatal calf diarrhea.
More information on ceftriaxone resistance in other serotypes is presented in the complete data tables associated with this report.
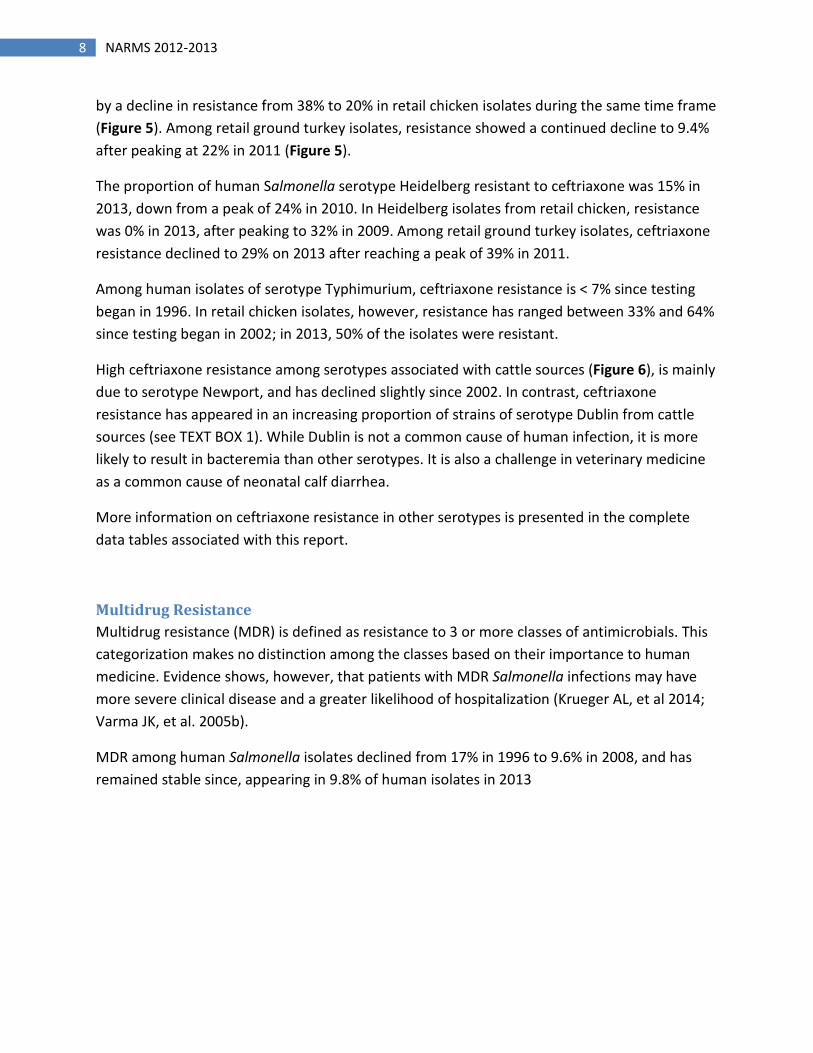
Multidrug Resistance Multidrug resistance (MDR) is defined as resistance to 3 or more classes of antimicrobials. This categorization makes no distinction among the classes based on their importance to human medicine. Evidence shows, however, that patients with MDR Salmonella infections may have more severe clinical disease and a greater likelihood of hospitalization (Krueger AL, et al 2014; Varma JK, et al. 2005b).
MDR among human Salmonella isolates declined from 17% in 1996 to 9.6% in 2008, and has remained stable since, appearing in 9.8% of human isolates in 2013
9 NARMS 2012-2013
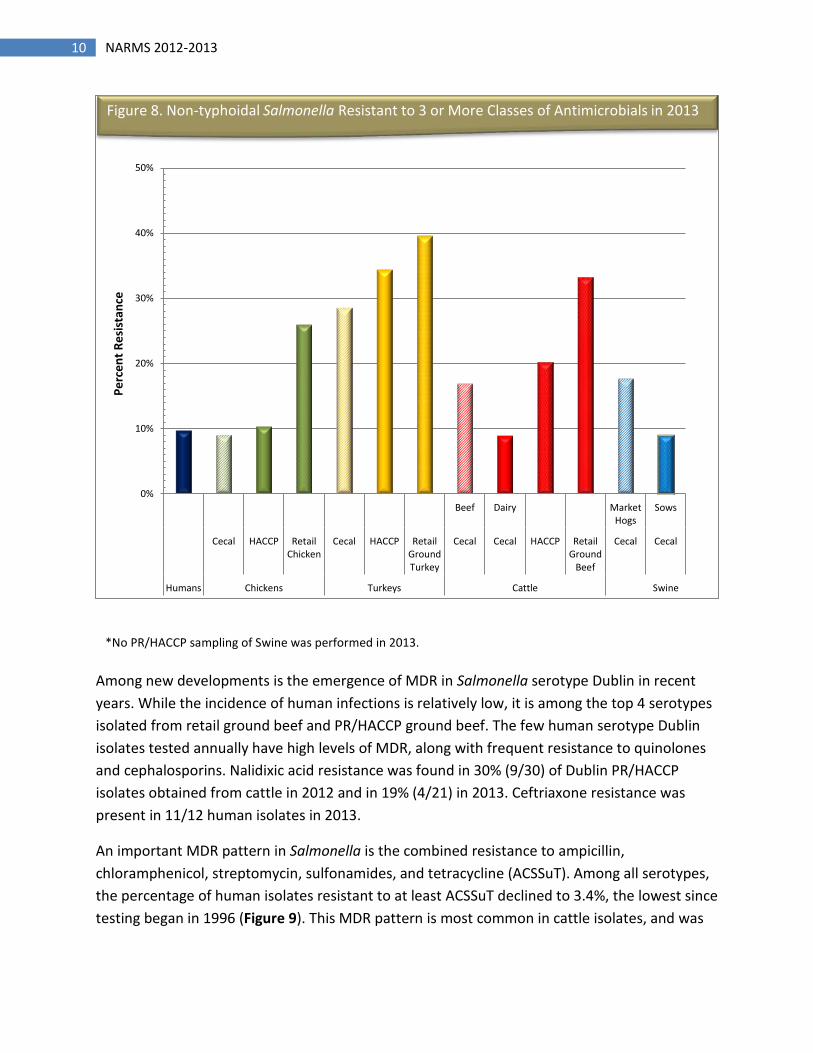
In 2013 PR/HACCP isolates, MDR was more common in turkey (34%) and ground beef (20%) isolates than chicken (10%) isolates (Figure 7). MDR was high among all retail foods, ranging from 26% to 40%. Interestingly, PR/HACCP and retail meat isolates are significantly more likely to exhibit MDR than are animal or human isolates (Figure 8). The reasons for this are not known. Since this is the first year of cecal testing, it remains to be seen whether the tendency for the proportion of Salmonella isolates with resistance to increase from earlier to later stages of processing will be a consistent finding over time. For chicken isolates, a higher proportion of MDR and ceftriaxone-resistance in retail versus PR/HACCP isolates has been apparent since food testing began in 2002.
0%
10%
20%
30%
40%
50%
60%
Perc
ent R
esis
tanc
e
Humans Retail Chicken Chickens HACCP Retail Ground TurkeyTurkeys HACCP Cattle HACCP Swine HACCP
Figure 7. Non-typhoidal Salmonella Resistant to 3 or More Classes of Antimicrobials
10 NARMS 2012-2013
*No PR/HACCP sampling of Swine was performed in 2013.
Among new developments is the emergence of MDR in Salmonella serotype Dublin in recent years. While the incidence of human infections is relatively low, it is among the top 4 serotypes isolated from retail ground beef and PR/HACCP ground beef. The few human serotype Dublin isolates tested annually have high levels of MDR, along with frequent resistance to quinolones and cephalosporins. Nalidixic acid resistance was found in 30% (9/30) of Dublin PR/HACCP isolates obtained from cattle in 2012 and in 19% (4/21) in 2013. Ceftriaxone resistance was present in 11/12 human isolates in 2013.
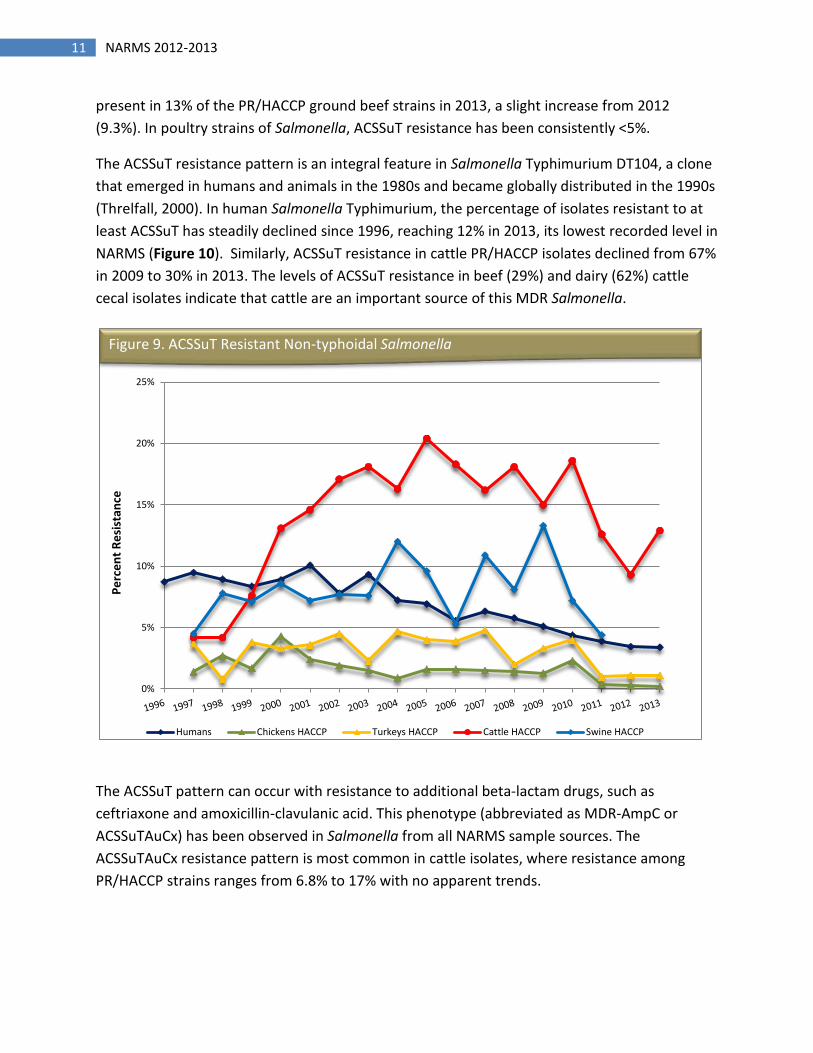
An important MDR pattern in Salmonella is the combined resistance to ampicillin, chloramphenicol, streptomycin, sulfonamides, and tetracycline (ACSSuT). Among all serotypes, the percentage of human isolates resistant to at least ACSSuT declined to 3.4%, the lowest since testing began in 1996 (Figure 9). This MDR pattern is most common in cattle isolates, and was
0%
10%
20%
30%
40%
50%
Beef Dairy MarketHogs
Sows
Cecal HACCP RetailChicken
Cecal HACCP RetailGroundTurkey
Cecal Cecal HACCP RetailGround
Beef
Cecal Cecal
Humans Chickens Turkeys Cattle Swine
Perc
ent R
esis
tanc
e Figure 8. Non-typhoidal Salmonella Resistant to 3 or More Classes of Antimicrobials in 2013
11 NARMS 2012-2013
0%
5%
10%
15%
20%
25%
Perc
ent R
esis
tanc
e
Humans Chickens HACCP Turkeys HACCP Cattle HACCP Swine HACCP
Figure 9. ACSSuT Resistant Non-typhoidal Salmonella
present in 13% of the PR/HACCP ground beef strains in 2013, a slight increase from 2012 (9.3%). In poultry strains of Salmonella, ACSSuT resistance has been consistently <5%.
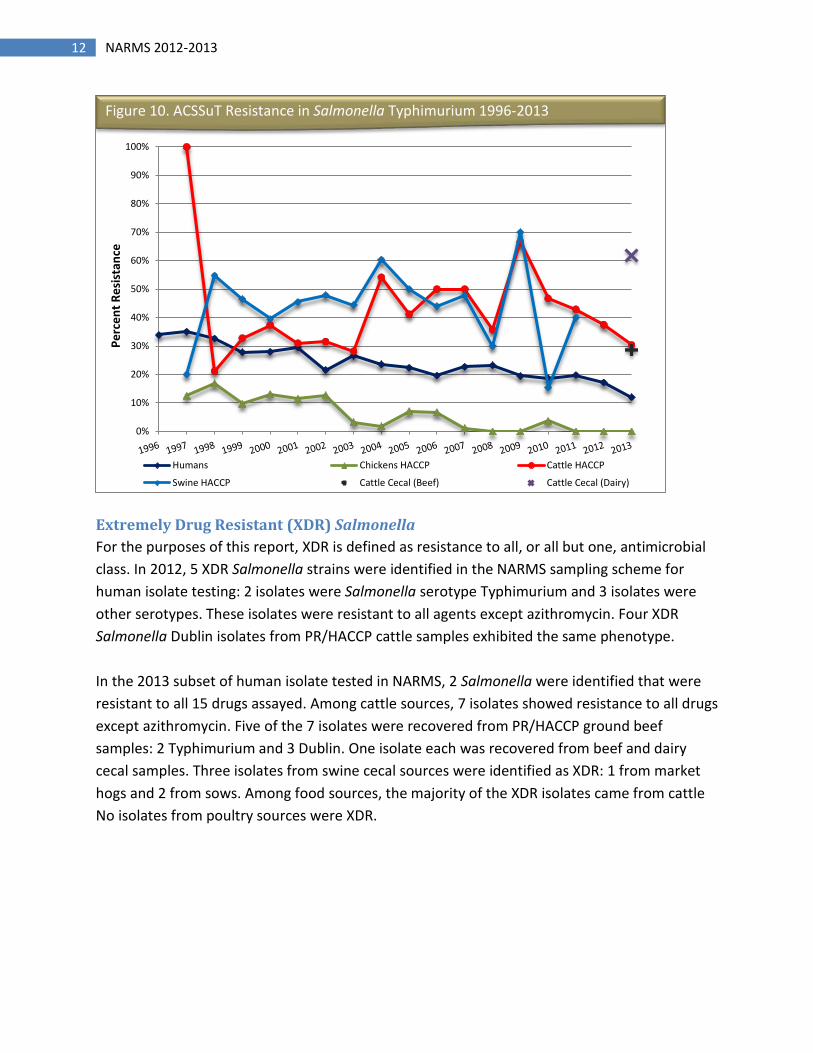
The ACSSuT resistance pattern is an integral feature in Salmonella Typhimurium DT104, a clone that emerged in humans and animals in the 1980s and became globally distributed in the 1990s (Threlfall, 2000). In human Salmonella Typhimurium, the percentage of isolates resistant to at least ACSSuT has steadily declined since 1996, reaching 12% in 2013, its lowest recorded level in NARMS (Figure 10). Similarly, ACSSuT resistance in cattle PR/HACCP isolates declined from 67% in 2009 to 30% in 2013. The levels of ACSSuT resistance in beef (29%) and dairy (62%) cattle cecal isolates indicate that cattle are an important source of this MDR Salmonella.
The ACSSuT pattern can occur with resistance to additional beta-lactam drugs, such as ceftriaxone and amoxicillin-clavulanic acid. This phenotype (abbreviated as MDR-AmpC or ACSSuTAuCx) has been observed in Salmonella from all NARMS sample sources. The ACSSuTAuCx resistance pattern is most common in cattle isolates, where resistance among PR/HACCP strains ranges from 6.8% to 17% with no apparent trends.
12 NARMS 2012-2013
Extremely Drug Resistant (XDR) Salmonella For the purposes of this report, XDR is defined as resistance to all, or all but one, antimicrobial class. In 2012, 5 XDR Salmonella strains were identified in the NARMS sampling scheme for human isolate testing: 2 isolates were Salmonella serotype Typhimurium and 3 isolates were other serotypes. These isolates were resistant to all agents except azithromycin. Four XDR Salmonella Dublin isolates from PR/HACCP cattle samples exhibited the same phenotype. In the 2013 subset of human isolate tested in NARMS, 2 Salmonella were identified that were resistant to all 15 drugs assayed. Among cattle sources, 7 isolates showed resistance to all drugs except azithromycin. Five of the 7 isolates were recovered from PR/HACCP ground beef samples: 2 Typhimurium and 3 Dublin. One isolate each was recovered from beef and dairy cecal samples. Three isolates from swine cecal sources were identified as XDR: 1 from market hogs and 2 from sows. Among food sources, the majority of the XDR isolates came from cattle No isolates from poultry sources were XDR.
0%
10%
20%
30%
40%
50%
60%
70%
80%
90%
100%
Perc
ent R
esis
tanc
e
Humans Chickens HACCP Cattle HACCP
Swine HACCP Cattle Cecal (Beef) Cattle Cecal (Dairy)
Figure 10. ACSSuT Resistance in Salmonella Typhimurium 1996-2013
13 NARMS 2012-2013
TEXT BOX 1
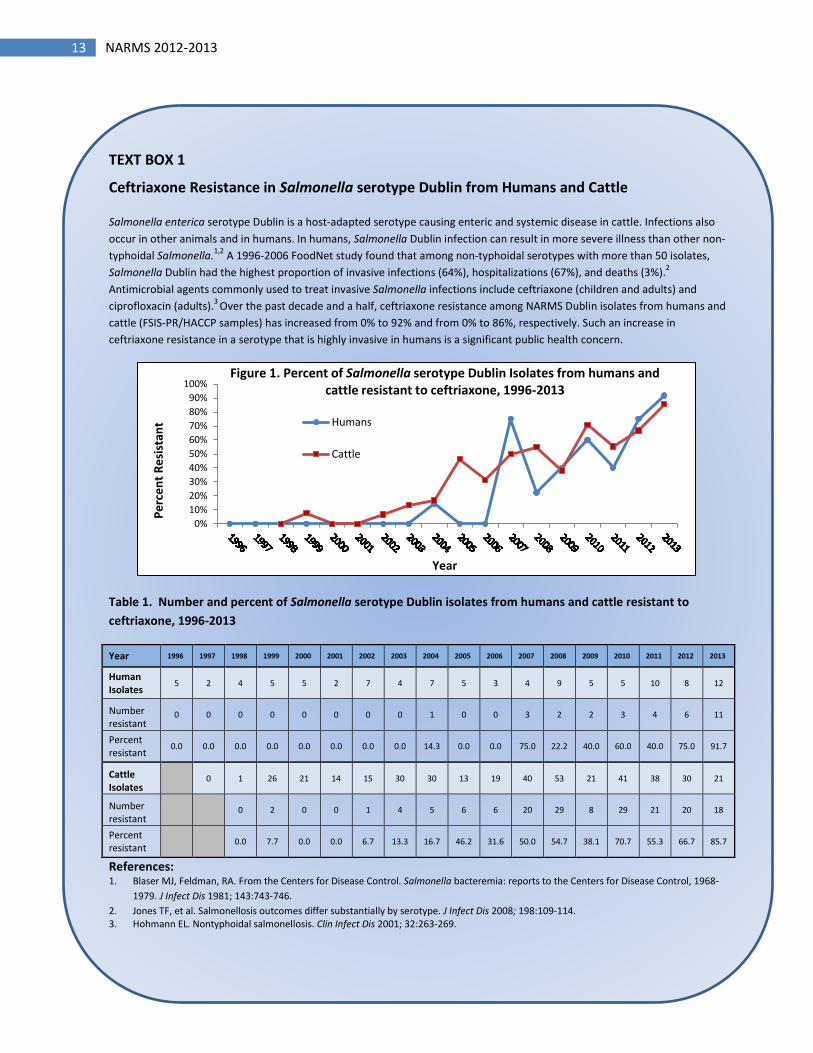
Ceftriaxone Resistance in Salmonella serotype Dublin from Humans and Cattle Salmonella enterica serotype Dublin is a host-adapted serotype causing enteric and systemic disease in cattle. Infections also occur in other animals and in humans. In humans, Salmonella Dublin infection can result in more severe illness than other non-typhoidal Salmonella.1,2 A 1996-2006 FoodNet study found that among non-typhoidal serotypes with more than 50 isolates, Salmonella Dublin had the highest proportion of invasive infections (64%), hospitalizations (67%), and deaths (3%).2 Antimicrobial agents commonly used to treat invasive Salmonella infections include ceftriaxone (children and adults) and ciprofloxacin (adults).3 Over the past decade and a half, ceftriaxone resistance among NARMS Dublin isolates from humans and cattle (FSIS-PR/HACCP samples) has increased from 0% to 92% and from 0% to 86%, respectively. Such an increase in ceftriaxone resistance in a serotype that is highly invasive in humans is a significant public health concern.
Table 1. Number and percent of Salmonella serotype Dublin isolates from humans and cattle resistant to ceftriaxone, 1996-2013
Year 1996 1997 1998 1999 2000 2001 2002 2003 2004 2005 2006 2007 2008 2009 2010 2011 2012 2013
Human Isolates
5 2 4 5 5 2 7 4 7 5 3 4 9 5 5 10 8 12
Number resistant
0 0 0 0 0 0 0 0 1 0 0 3 2 2 3 4 6 11
Percent resistant
0.0 0.0 0.0 0.0 0.0 0.0 0.0 0.0 14.3 0.0 0.0 75.0 22.2 40.0 60.0 40.0 75.0 91.7
Cattle Isolates 0 1 26 21 14 15 30 30 13 19 40 53 21 41 38 30 21
Number resistant 0 2 0 0 1 4 5 6 6 20 29 8 29 21 20 18
Percent resistant 0.0 7.7 0.0 0.0 6.7 13.3 16.7 46.2 31.6 50.0 54.7 38.1 70.7 55.3 66.7 85.7
References: 1. Blaser MJ, Feldman, RA. From the Centers for Disease Control. Salmonella bacteremia: reports to the Centers for Disease Control, 1968-
1979. J Infect Dis 1981; 143:743-746. 2. Jones TF, et al. Salmonellosis outcomes differ substantially by serotype. J Infect Dis 2008; 198:109-114. 3. Hohmann EL. Nontyphoidal salmonellosis. Clin Infect Dis 2001; 32:263-269.
0%10%20%30%40%50%60%70%80%90%
100%
Perc
ent R
esis
tant
Year
Figure 1. Percent of Salmonella serotype Dublin Isolates from humans and cattle resistant to ceftriaxone, 1996-2013
Humans
Cattle
14 NARMS 2012-2013
TEXT BOX 2
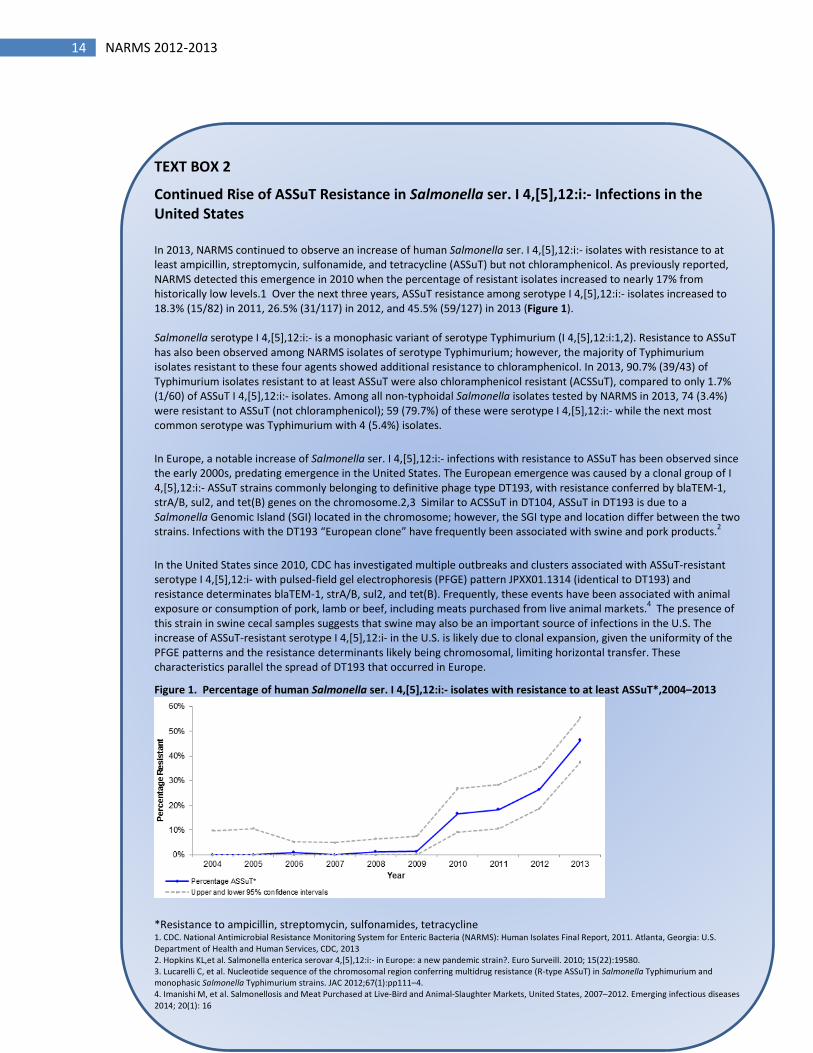
Continued Rise of ASSuT Resistance in Salmonella ser. I 4,[5],12:i:- Infections in the United States
In 2013, NARMS continued to observe an increase of human Salmonella ser. I 4,[5],12:i:- isolates with resistance to at least ampicillin, streptomycin, sulfonamide, and tetracycline (ASSuT) but not chloramphenicol. As previously reported, NARMS detected this emergence in 2010 when the percentage of resistant isolates increased to nearly 17% from historically low levels.1 Over the next three years, ASSuT resistance among serotype I 4,[5],12:i:- isolates increased to 18.3% (15/82) in 2011, 26.5% (31/117) in 2012, and 45.5% (59/127) in 2013 (Figure 1). Salmonella serotype I 4,[5],12:i:- is a monophasic variant of serotype Typhimurium (I 4,[5],12:i:1,2). Resistance to ASSuT has also been observed among NARMS isolates of serotype Typhimurium; however, the majority of Typhimurium isolates resistant to these four agents showed additional resistance to chloramphenicol. In 2013, 90.7% (39/43) of Typhimurium isolates resistant to at least ASSuT were also chloramphenicol resistant (ACSSuT), compared to only 1.7% (1/60) of ASSuT I 4,[5],12:i:- isolates. Among all non-typhoidal Salmonella isolates tested by NARMS in 2013, 74 (3.4%) were resistant to ASSuT (not chloramphenicol); 59 (79.7%) of these were serotype I 4,[5],12:i:- while the next most common serotype was Typhimurium with 4 (5.4%) isolates.
In Europe, a notable increase of Salmonella ser. I 4,[5],12:i:- infections with resistance to ASSuT has been observed since the early 2000s, predating emergence in the United States. The European emergence was caused by a clonal group of I 4,[5],12:i:- ASSuT strains commonly belonging to definitive phage type DT193, with resistance conferred by blaTEM-1, strA/B, sul2, and tet(B) genes on the chromosome.2,3 Similar to ACSSuT in DT104, ASSuT in DT193 is due to a Salmonella Genomic Island (SGI) located in the chromosome; however, the SGI type and location differ between the two strains. Infections with the DT193 “European clone” have frequently been associated with swine and pork products.2
In the United States since 2010, CDC has investigated multiple outbreaks and clusters associated with ASSuT-resistant serotype I 4,[5],12:i- with pulsed-field gel electrophoresis (PFGE) pattern JPXX01.1314 (identical to DT193) and resistance determinates blaTEM-1, strA/B, sul2, and tet(B). Frequently, these events have been associated with animal exposure or consumption of pork, lamb or beef, including meats purchased from live animal markets.4 The presence of this strain in swine cecal samples suggests that swine may also be an important source of infections in the U.S. The increase of ASSuT-resistant serotype I 4,[5],12:i- in the U.S. is likely due to clonal expansion, given the uniformity of the PFGE patterns and the resistance determinants likely being chromosomal, limiting horizontal transfer. These characteristics parallel the spread of DT193 that occurred in Europe.
Figure 1. Percentage of human Salmonella ser. I 4,[5],12:i:- isolates with resistance to at least ASSuT*,2004–2013
*Resistance to ampicillin, streptomycin, sulfonamides, tetracycline 1. CDC. National Antimicrobial Resistance Monitoring System for Enteric Bacteria (NARMS): Human Isolates Final Report, 2011. Atlanta, Georgia: U.S. Department of Health and Human Services, CDC, 2013 2. Hopkins KL,et al. Salmonella enterica serovar 4,[5],12:i:- in Europe: a new pandemic strain?. Euro Surveill. 2010; 15(22):19580. 3. Lucarelli C, et al. Nucleotide sequence of the chromosomal region conferring multidrug resistance (R-type ASSuT) in Salmonella Typhimurium and monophasic Salmonella Typhimurium strains. JAC 2012;67(1):pp111–4. 4. Imanishi M, et al. Salmonellosis and Meat Purchased at Live-Bird and Animal-Slaughter Markets, United States, 2007–2012. Emerging infectious diseases 2014; 20(1): 16
15 NARMS 2012-2013
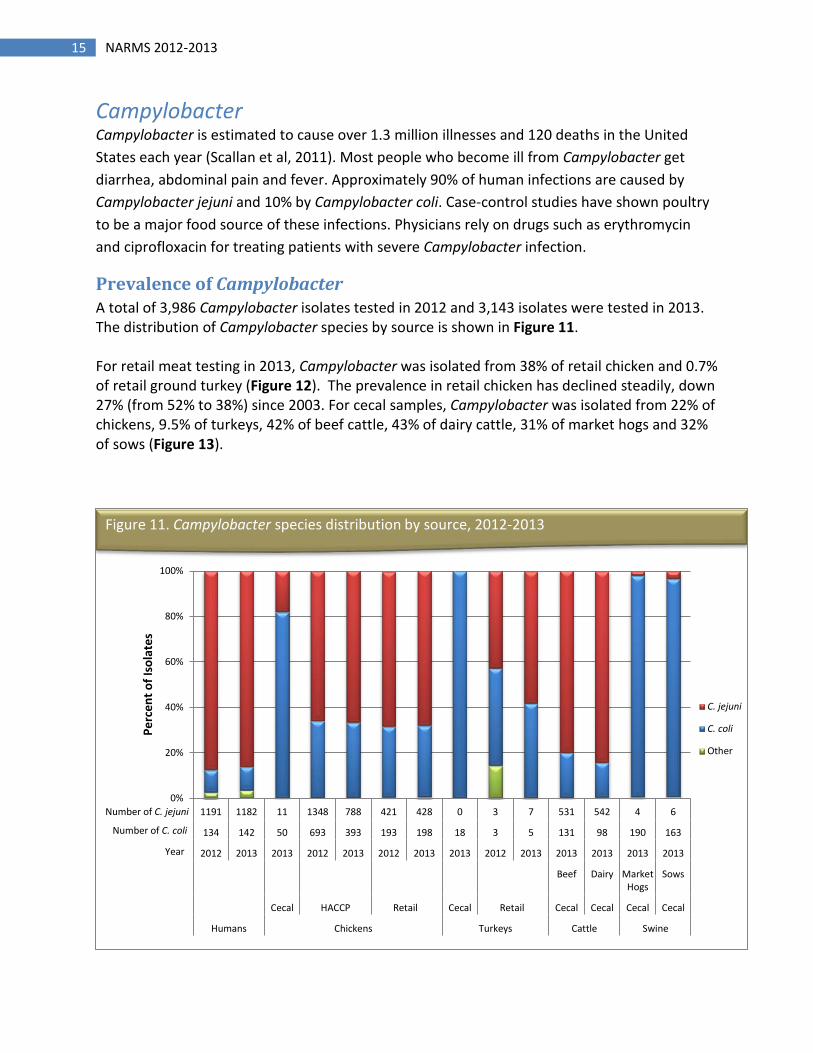
Campylobacter Campylobacter is estimated to cause over 1.3 million illnesses and 120 deaths in the United States each year (Scallan et al, 2011). Most people who become ill from Campylobacter get diarrhea, abdominal pain and fever. Approximately 90% of human infections are caused by Campylobacter jejuni and 10% by Campylobacter coli. Case-control studies have shown poultry to be a major food source of these infections. Physicians rely on drugs such as erythromycin and ciprofloxacin for treating patients with severe Campylobacter infection.
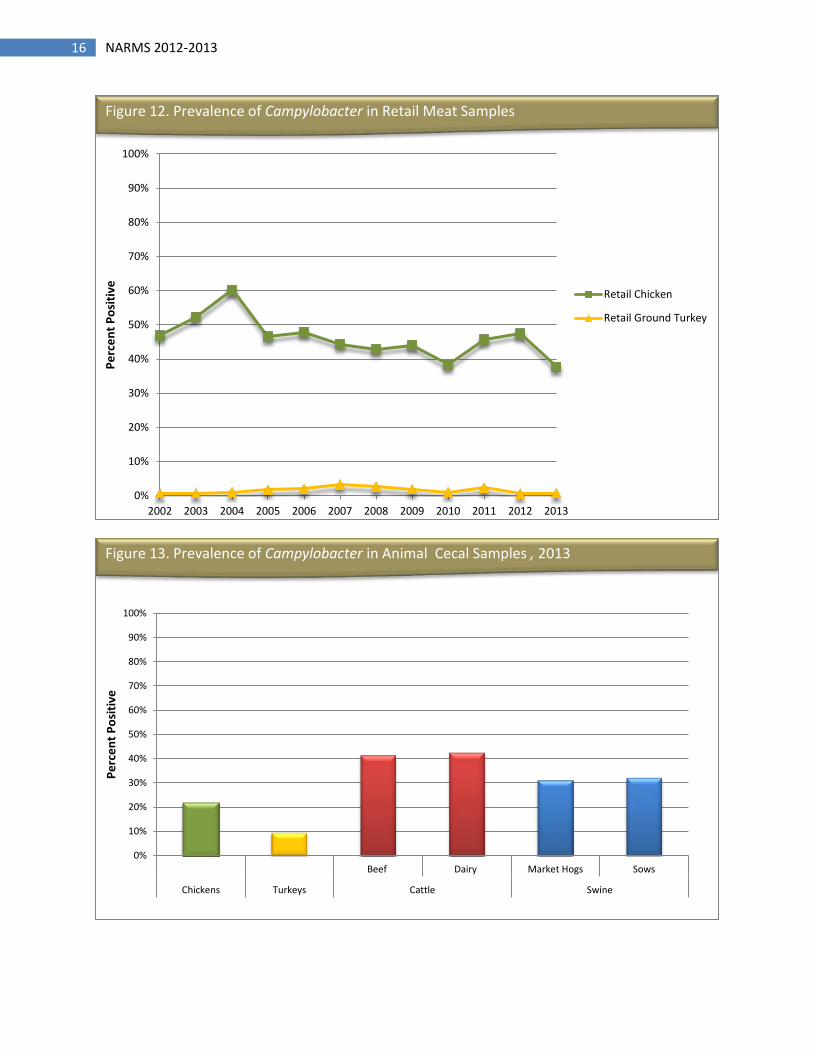
Prevalence of Campylobacter A total of 3,986 Campylobacter isolates tested in 2012 and 3,143 isolates were tested in 2013. The distribution of Campylobacter species by source is shown in Figure 11. For retail meat testing in 2013, Campylobacter was isolated from 38% of retail chicken and 0.7% of retail ground turkey (Figure 12). The prevalence in retail chicken has declined steadily, down 27% (from 52% to 38%) since 2003. For cecal samples, Campylobacter was isolated from 22% of chickens, 9.5% of turkeys, 42% of beef cattle, 43% of dairy cattle, 31% of market hogs and 32% of sows (Figure 13).
0%
20%
40%
60%
80%
100%
1191 1182 11 1348 788 421 428 0 3 7 531 542 4 6
134 142 50 693 393 193 198 18 3 5 131 98 190 163
2012 2013 2013 2012 2013 2012 2013 2013 2012 2013 2013 2013 2013 2013
Beef Dairy MarketHogs
Sows
Cecal HACCP Retail Cecal Retail Cecal Cecal Cecal Cecal
Humans Chickens Turkeys Cattle Swine
Perc
ent o
f Iso
late
s
C. jejuni
C. coli
Other
Figure 11. Campylobacter species distribution by source, 2012-2013
Number of C. jejuni
Number of C. coli
Year
16 NARMS 2012-2013
0%
10%
20%
30%
40%
50%
60%
70%
80%
90%
100%
2002 2003 2004 2005 2006 2007 2008 2009 2010 2011 2012 2013
Perc
ent P
ositi
ve
Retail Chicken
Retail Ground Turkey
Figure 12. Prevalence of Campylobacter in Retail Meat Samples
0%
10%
20%
30%
40%
50%
60%
70%
80%
90%
100%
Beef Dairy Market Hogs Sows
Chickens Turkeys Cattle Swine
Perc
ent P
ositi
ve
Figure 13. Prevalence of Campylobacter in Animal Cecal Samples , 2013
17 NARMS 2012-2013
Antimicrobial Resistance in Campylobacter
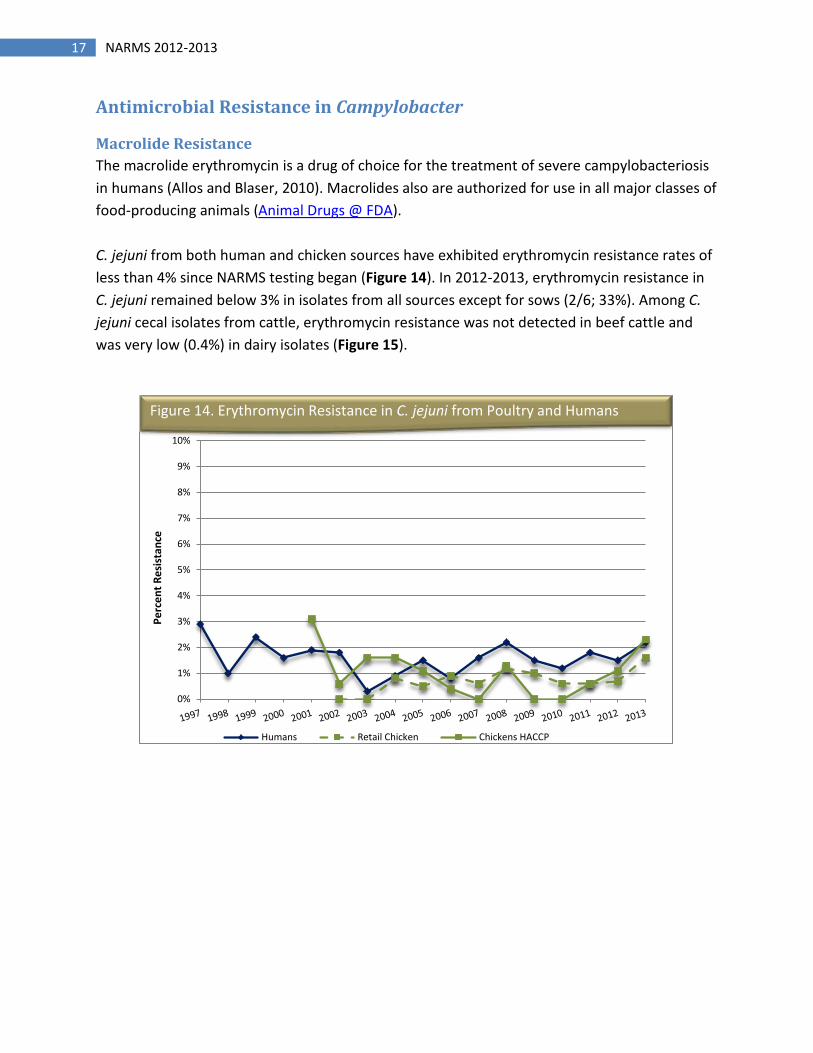
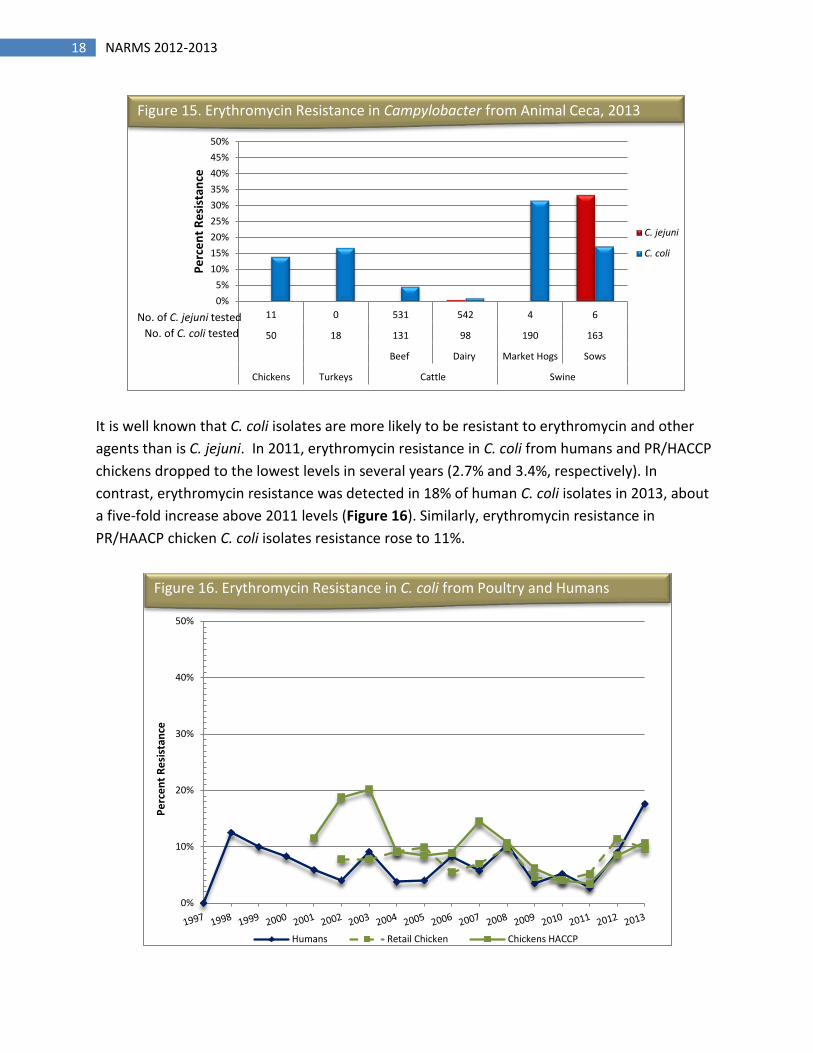
Macrolide Resistance The macrolide erythromycin is a drug of choice for the treatment of severe campylobacteriosis in humans (Allos and Blaser, 2010). Macrolides also are authorized for use in all major classes of food-producing animals (Animal Drugs @ FDA). C. jejuni from both human and chicken sources have exhibited erythromycin resistance rates of less than 4% since NARMS testing began (Figure 14). In 2012-2013, erythromycin resistance in C. jejuni remained below 3% in isolates from all sources except for sows (2/6; 33%). Among C. jejuni cecal isolates from cattle, erythromycin resistance was not detected in beef cattle and was very low (0.4%) in dairy isolates (Figure 15).
0%
1%
2%
3%
4%
5%
6%
7%
8%
9%
10%
Perc
ent R
esis
tanc
e
Humans Retail Chicken Chickens HACCP
Percent of Salmonella Typhimurium Resistant to Ceftriaxone Campylobacter jejuni Resistance to Erythromycin Percent of Salmonella Typhimurium Resistant to Ceftriaxone Figure 14. Erythromycin Resistance in C. jejuni from Poultry and Humans
18 NARMS 2012-2013
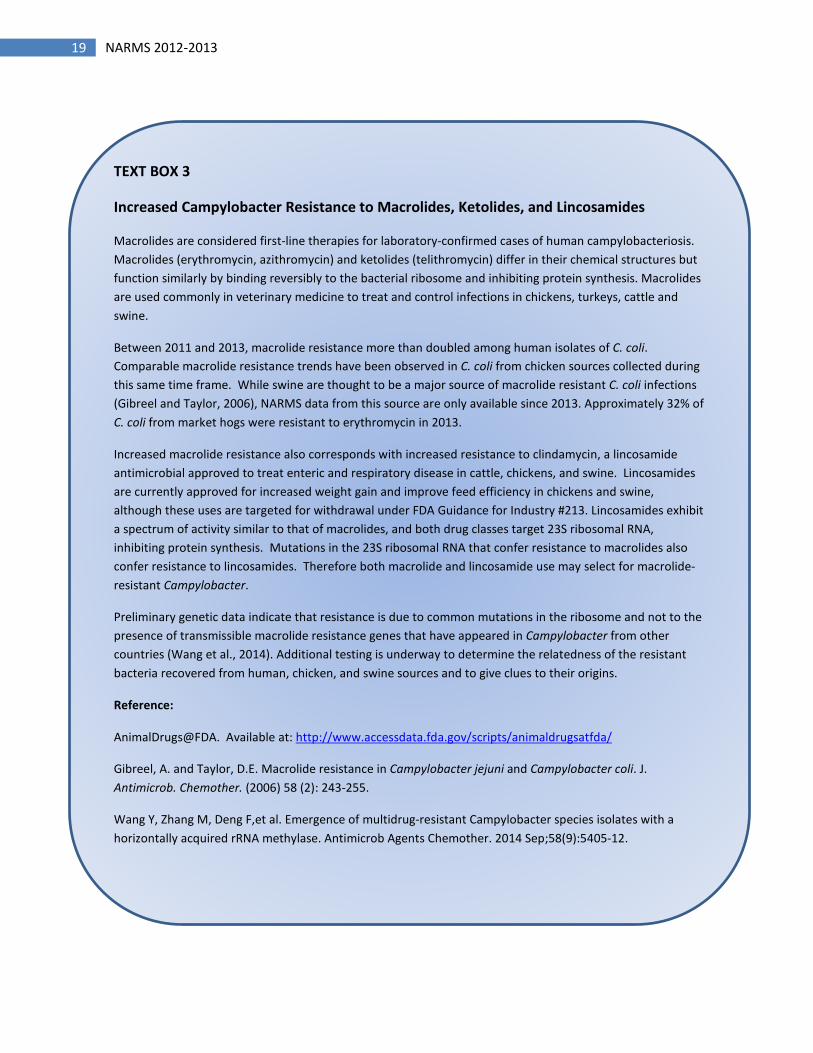
It is well known that C. coli isolates are more likely to be resistant to erythromycin and other agents than is C. jejuni. In 2011, erythromycin resistance in C. coli from humans and PR/HACCP chickens dropped to the lowest levels in several years (2.7% and 3.4%, respectively). In contrast, erythromycin resistance was detected in 18% of human C. coli isolates in 2013, about a five-fold increase above 2011 levels (Figure 16). Similarly, erythromycin resistance in PR/HAACP chicken C. coli isolates resistance rose to 11%.
0%5%
10%15%20%25%30%35%40%45%50%
11 0 531 542 4 6
50 18 131 98 190 163
Beef Dairy Market Hogs Sows
Chickens Turkeys Cattle Swine
Perc
ent R
esis
tanc
e
C. jejuni
C. coli
Figure 15. Erythromycin Resistance in Campylobacter from Animal Ceca, 2013
No. of C. jejuni tested No. of C. coli tested
0%
10%
20%
30%
40%
50%
Perc
ent R
esis
tanc
e
Humans Retail Chicken Chickens HACCP
Figure 16. Erythromycin Resistance in C. coli from Poultry and Humans
19 NARMS 2012-2013
TEXT BOX 3
Increased Campylobacter Resistance to Macrolides, Ketolides, and Lincosamides
Macrolides are considered first-line therapies for laboratory-confirmed cases of human campylobacteriosis. Macrolides (erythromycin, azithromycin) and ketolides (telithromycin) differ in their chemical structures but function similarly by binding reversibly to the bacterial ribosome and inhibiting protein synthesis. Macrolides are used commonly in veterinary medicine to treat and control infections in chickens, turkeys, cattle and swine.
Between 2011 and 2013, macrolide resistance more than doubled among human isolates of C. coli. Comparable macrolide resistance trends have been observed in C. coli from chicken sources collected during this same time frame. While swine are thought to be a major source of macrolide resistant C. coli infections (Gibreel and Taylor, 2006), NARMS data from this source are only available since 2013. Approximately 32% of C. coli from market hogs were resistant to erythromycin in 2013.
Increased macrolide resistance also corresponds with increased resistance to clindamycin, a lincosamide antimicrobial approved to treat enteric and respiratory disease in cattle, chickens, and swine. Lincosamides are currently approved for increased weight gain and improve feed efficiency in chickens and swine, although these uses are targeted for withdrawal under FDA Guidance for Industry #213. Lincosamides exhibit a spectrum of activity similar to that of macrolides, and both drug classes target 23S ribosomal RNA, inhibiting protein synthesis. Mutations in the 23S ribosomal RNA that confer resistance to macrolides also confer resistance to lincosamides. Therefore both macrolide and lincosamide use may select for macrolide-resistant Campylobacter.
Preliminary genetic data indicate that resistance is due to common mutations in the ribosome and not to the presence of transmissible macrolide resistance genes that have appeared in Campylobacter from other countries (Wang et al., 2014). Additional testing is underway to determine the relatedness of the resistant bacteria recovered from human, chicken, and swine sources and to give clues to their origins.
Reference:
AnimalDrugs@FDA. Available at: http://www.accessdata.fda.gov/scripts/animaldrugsatfda/
Gibreel, A. and Taylor, D.E. Macrolide resistance in Campylobacter jejuni and Campylobacter coli. J. Antimicrob. Chemother. (2006) 58 (2): 243-255.
Wang Y, Zhang M, Deng F,et al. Emergence of multidrug-resistant Campylobacter species isolates with a horizontally acquired rRNA methylase. Antimicrob Agents Chemother. 2014 Sep;58(9):5405-12.
20 NARMS 2012-2013
Among the 2013 cecal samples collected at slaughter, macrolide resistance was found in 17% of C. coli isolates from sows, 32% from market hogs, 14% from chickens, and 17% from turkeys (Figure 15). NARMS will continue to monitor macrolide resistance (see TEXT BOX 3). In addition, it is expected that these new sampling sources will lead to new insights on the animal origins of human Campylobacter infections, including those caused by antimicrobial resistant strains.
Fluoroquinolone Resistance The fluoroquinolones are an alternative therapy for treating campylobacteriosis in adults (Allos and Blaser, 2010). Fluoroquinolones have not been used in chickens and turkeys since 2005. Currently, there are FDA approvals for fluoroquinolones in swine and certain classes of cattle, and off-label uses are prohibited.
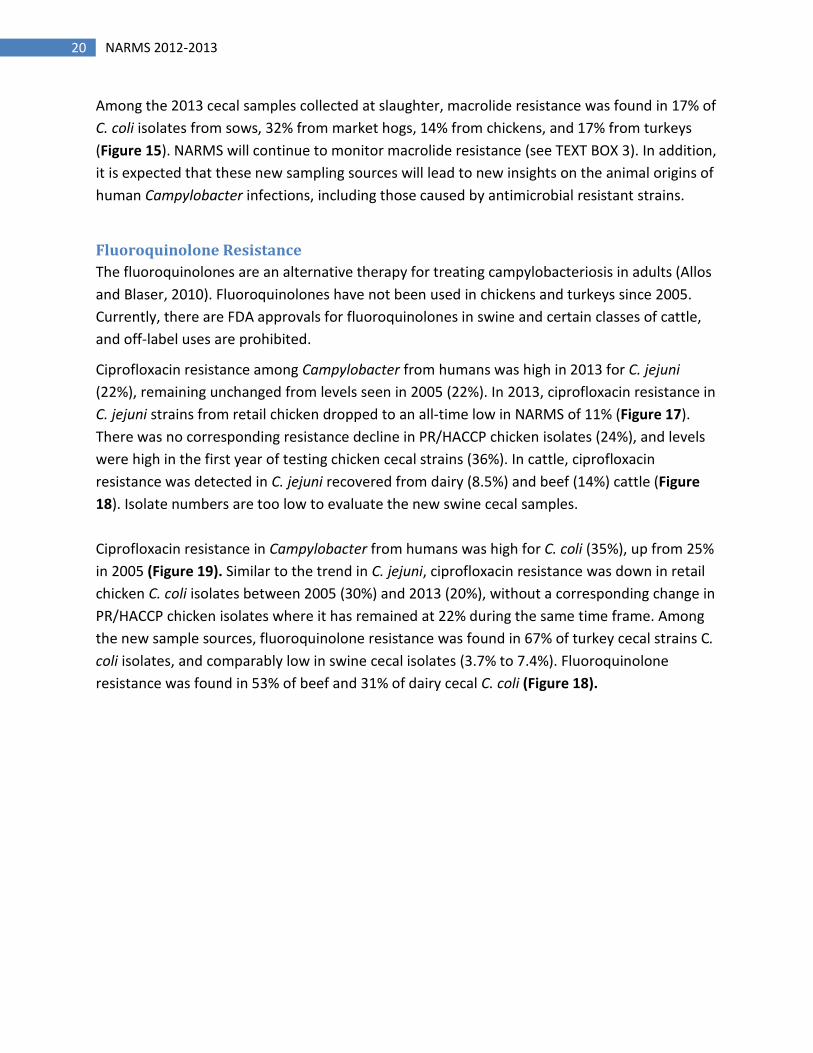
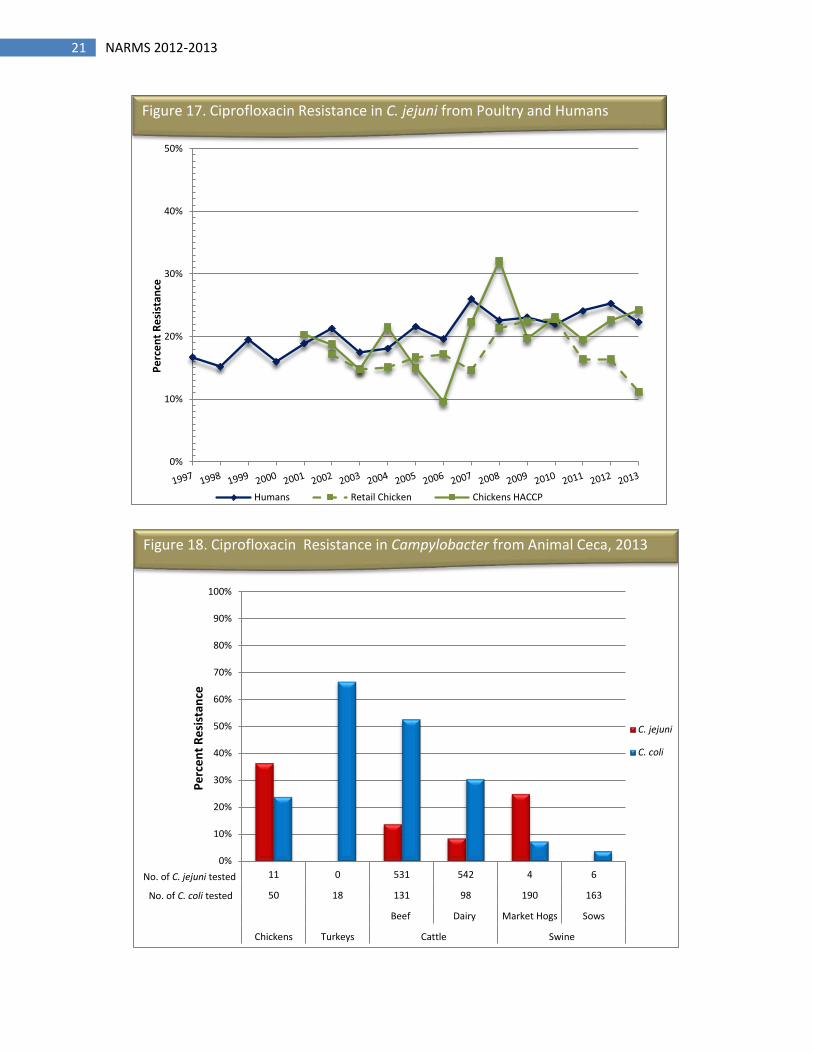
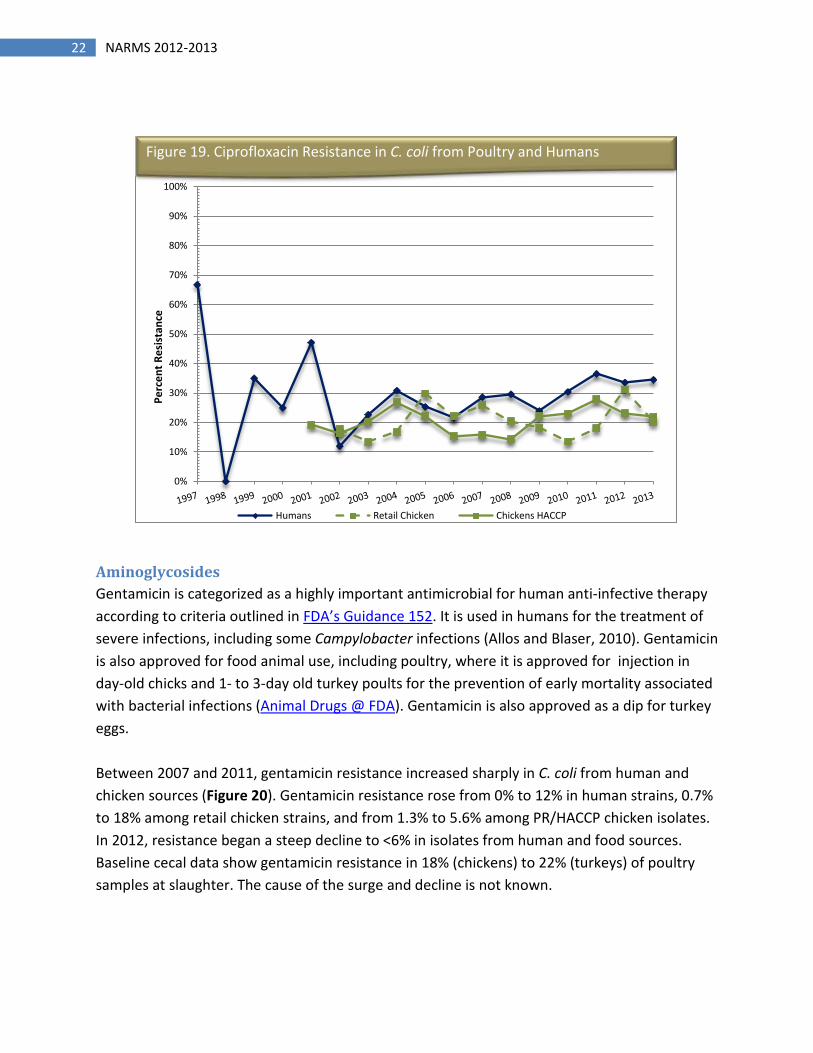
Ciprofloxacin resistance among Campylobacter from humans was high in 2013 for C. jejuni (22%), remaining unchanged from levels seen in 2005 (22%). In 2013, ciprofloxacin resistance in C. jejuni strains from retail chicken dropped to an all-time low in NARMS of 11% (Figure 17). There was no corresponding resistance decline in PR/HACCP chicken isolates (24%), and levels were high in the first year of testing chicken cecal strains (36%). In cattle, ciprofloxacin resistance was detected in C. jejuni recovered from dairy (8.5%) and beef (14%) cattle (Figure 18). Isolate numbers are too low to evaluate the new swine cecal samples. Ciprofloxacin resistance in Campylobacter from humans was high for C. coli (35%), up from 25% in 2005 (Figure 19). Similar to the trend in C. jejuni, ciprofloxacin resistance was down in retail chicken C. coli isolates between 2005 (30%) and 2013 (20%), without a corresponding change in PR/HACCP chicken isolates where it has remained at 22% during the same time frame. Among the new sample sources, fluoroquinolone resistance was found in 67% of turkey cecal strains C. coli isolates, and comparably low in swine cecal isolates (3.7% to 7.4%). Fluoroquinolone resistance was found in 53% of beef and 31% of dairy cecal C. coli (Figure 18).
21 NARMS 2012-2013
0%
10%
20%
30%
40%
50%Pe
rcen
t Res
ista
nce
Humans Retail Chicken Chickens HACCP
Figure 17. Ciprofloxacin Resistance in C. jejuni from Poultry and Humans
0%
10%
20%
30%
40%
50%
60%
70%
80%
90%
100%
11 0 531 542 4 6
50 18 131 98 190 163
Beef Dairy Market Hogs Sows
Chickens Turkeys Cattle Swine
Perc
ent R
esis
tanc
e
C. jejuni
C. coli
Figure 18. Ciprofloxacin Resistance in Campylobacter from Animal Ceca, 2013
No. of C. jejuni tested
No. of C. coli tested
22 NARMS 2012-2013
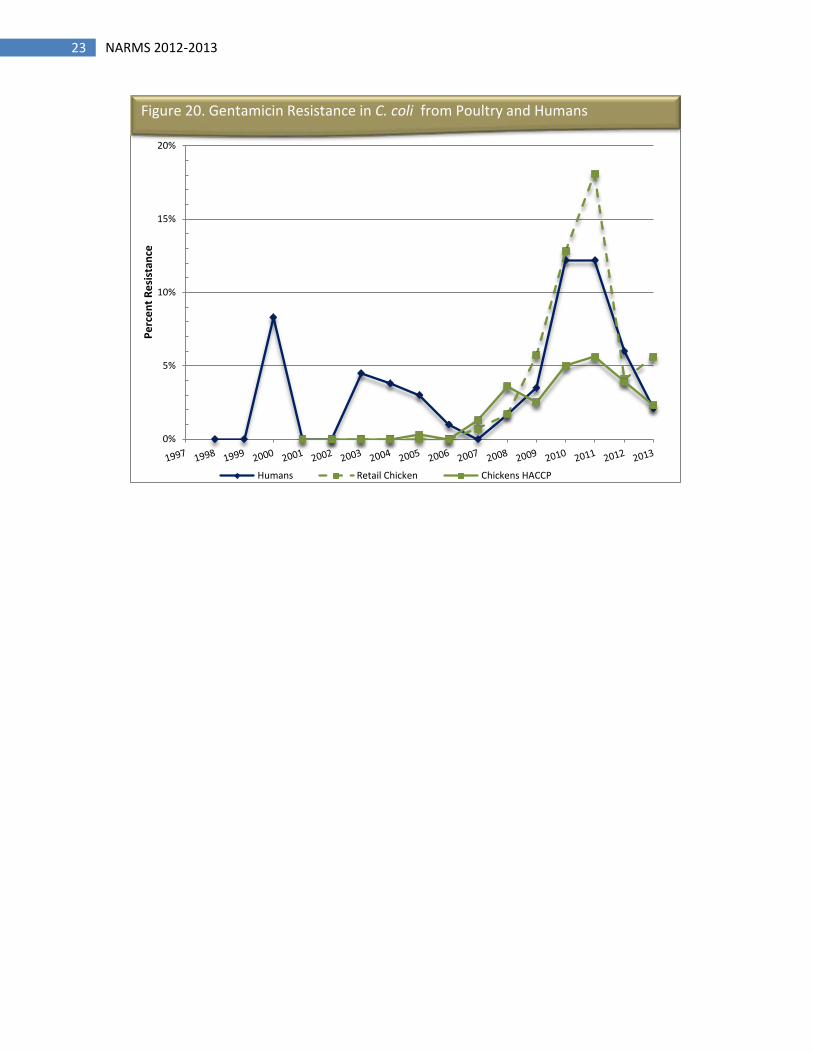
Aminoglycosides Gentamicin is categorized as a highly important antimicrobial for human anti-infective therapy according to criteria outlined in FDA’s Guidance 152. It is used in humans for the treatment of severe infections, including some Campylobacter infections (Allos and Blaser, 2010). Gentamicin is also approved for food animal use, including poultry, where it is approved for injection in day-old chicks and 1- to 3-day old turkey poults for the prevention of early mortality associated with bacterial infections (Animal Drugs @ FDA). Gentamicin is also approved as a dip for turkey eggs. Between 2007 and 2011, gentamicin resistance increased sharply in C. coli from human and chicken sources (Figure 20). Gentamicin resistance rose from 0% to 12% in human strains, 0.7% to 18% among retail chicken strains, and from 1.3% to 5.6% among PR/HACCP chicken isolates. In 2012, resistance began a steep decline to <6% in isolates from human and food sources. Baseline cecal data show gentamicin resistance in 18% (chickens) to 22% (turkeys) of poultry samples at slaughter. The cause of the surge and decline is not known.
0%
10%
20%
30%
40%
50%
60%
70%
80%
90%
100%
Perc
ent R
esis
tanc
e
Humans Retail Chicken Chickens HACCP
Percent of Salmonella Typhimurium Resistant to Ceftriaxone Figure 19. Ciprofloxacin Resistance in C. coli from Poultry and Humans
23 NARMS 2012-2013
0%
5%
10%
15%
20%Pe
rcen
t Res
ista
nce
Humans Retail Chicken Chickens HACCP
Percent of Salmonella Typhimurium Resistant to Ceftriaxone Campylobacter coli Resistance to Gentamicin Percent of Salmonella Typhimurium Resistant to Ceftriaxone Figure 20. Gentamicin Resistance in C. coli from Poultry and Humans
24 NARMS 2012-2013
Indicator Bacteria
Escherichia coli Escherichia coli are monitored as an indicator organism for emerging resistance patterns and specific resistance genes that could be transferred to other pathogenic Gram-negative bacteria (e.g., Salmonella). E. coli isolates are tested for susceptibility to the same antimicrobials used in Salmonella testing. This report includes data on generic E. coli isolated from all four retail meat commodities, PR/HACCP chicken carcasses and from food animal cecal samples. Ongoing antimicrobial resistance surveillance is not conducted for indicator organisms from healthy human populations.
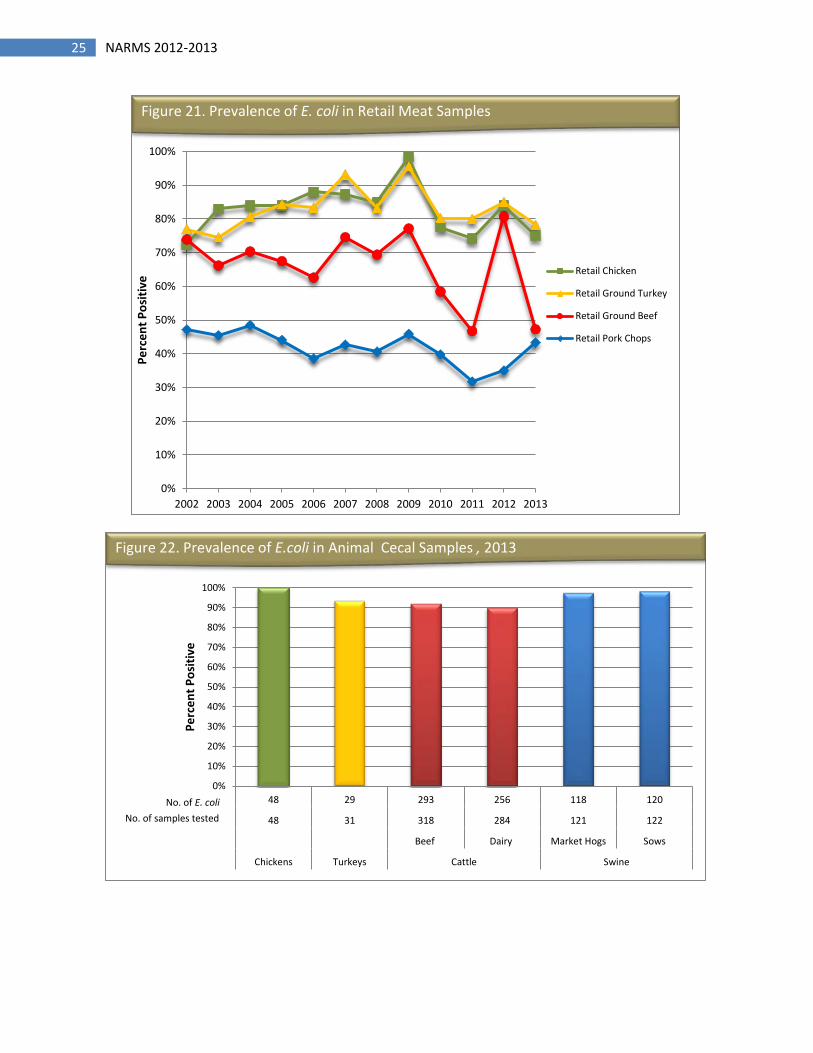
Prevalence of E. coli E. coli is an indicator of fecal contamination and is commonly present in raw retail meat products. In 2012, a total 2,199 E. coli isolates from retail meats and PR/HACCP chicken carcasses were tested. In 2013, a total 2,033 were tested. Post-slaughter chicken carcasses were not tested in 2013. The prevalence of E. coli from the tested retail meat sources ranged between approximately 40% in pork chops to around 80% ground turkey in 2013 (Figure 21).
The addition of cecal samples to NARMS in 2013 marked the first time that E. coli isolates from all found food animals sources at slaughter were tested. As a normal constituent of the animal gut, E. coli was recovered from nearly every sample as expected (Figure 22).
25 NARMS 2012-2013
0%
10%
20%
30%
40%
50%
60%
70%
80%
90%
100%
2002 2003 2004 2005 2006 2007 2008 2009 2010 2011 2012 2013
Perc
ent P
ositi
ve Retail Chicken
Retail Ground Turkey
Retail Ground Beef
Retail Pork Chops
Figure 21. Prevalence of E. coli in Retail Meat Samples
0%
10%
20%
30%
40%
50%
60%
70%
80%
90%
100%
48 29 293 256 118 120
48 31 318 284 121 122
Beef Dairy Market Hogs Sows
Chickens Turkeys Cattle Swine
Perc
ent P
ositi
ve
Figure 22. Prevalence of E.coli in Animal Cecal Samples , 2013
No. of E. coli No. of samples tested
26 NARMS 2012-2013
Antimicrobial Resistance in Escherichia coli
In 2013, E. coli showing resistance to at least one antimicrobial were most common among turkey sources (86% from ground turkey and 83% from turkey ceca) and least frequent in isolates from cattle sources (23% from ground beef, 27% from beef cattle and 17% from dairy cattle).
Quinolone Resistance As with Salmonella, ciprofloxacin resistance in E. coli from retail meats, slaughtered chickens, and cecal samples from chicken, turkeys, beef and dairy cattle, market hogs and swine was absent or low (0 % to 1.7%).
Cephalosporin Resistance Ceftriaxone resistance among E. coli from retail chickens decreased from 13% in 2011 to 4.4% in 2013. Retail turkey isolates showed a similar decrease during the same time period (from 10% to 6.7%). As noted above, this coincided with declines in ceftriaxone resistance among non-typhoidal Salmonella from retail poultry meats.
Important Multidrug Resistance Patterns In 2013, isolates from turkey sources most commonly exhibited resistance to 3 or more drug classes (59% - 62%), followed by isolates from chicken (17% - 32%), swine (14% - 22%) and cattle sources (6.3% - 8.2%). The proportion of retail and slaughter isolates exhibiting ACSSuT and ACSSuTAuCx resistance patterns was either absent or low. There are no noteworthy trends in MDR among E.coli from PR/HACCP chicken samples or any of the retail food commodities.
Extremely Drug Resistant (XDR) E. coli In 2012, there were 2 XDR retail isolates, both from turkeys. One isolate was resistant to all drug classes except phenicols. The other isolate showed resistance to all drug classes except amoxicillin/clavulanate. In 2013, there was one XDR isolate (from ground beef) that was resistant to all drug classes except quinolones.
Enterococcus Enterococcus is a natural part of both animal and human intestinal microflora and is an indicator of fecal contamination. Enterococcus can be present in high numbers in food but they are not considered a major foodborne pathogen. Resistance in Enterococcus is monitored to understand how resistance occurs in Gram-positive bacteria.
As with E. coli, the NARMS Integrated Report includes data on Enterococcus from retail meat and food animals but not from human sources. The two species most commonly recovered are
27 NARMS 2012-2013
Enterococcus faecalis and Enterococcus faecium. Results are reported by species because they differ in their ability to acquire and express resistance to various antimicrobials.
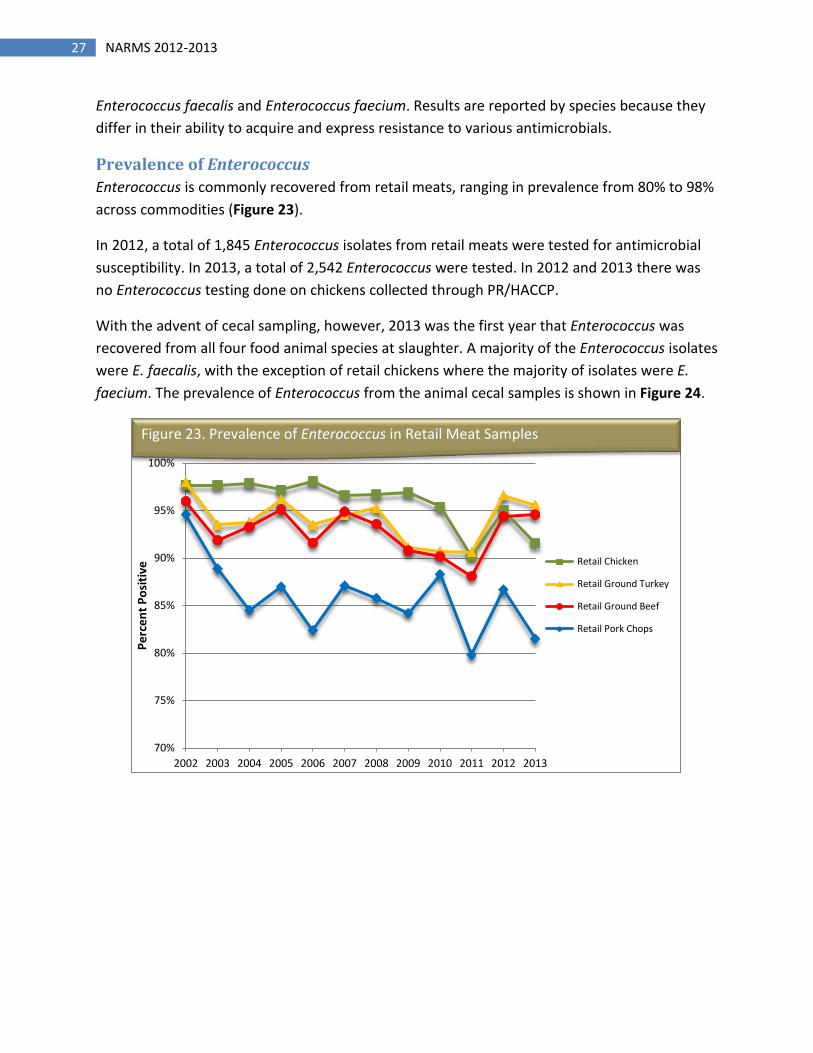
Prevalence of Enterococcus Enterococcus is commonly recovered from retail meats, ranging in prevalence from 80% to 98% across commodities (Figure 23).
In 2012, a total of 1,845 Enterococcus isolates from retail meats were tested for antimicrobial susceptibility. In 2013, a total of 2,542 Enterococcus were tested. In 2012 and 2013 there was no Enterococcus testing done on chickens collected through PR/HACCP.
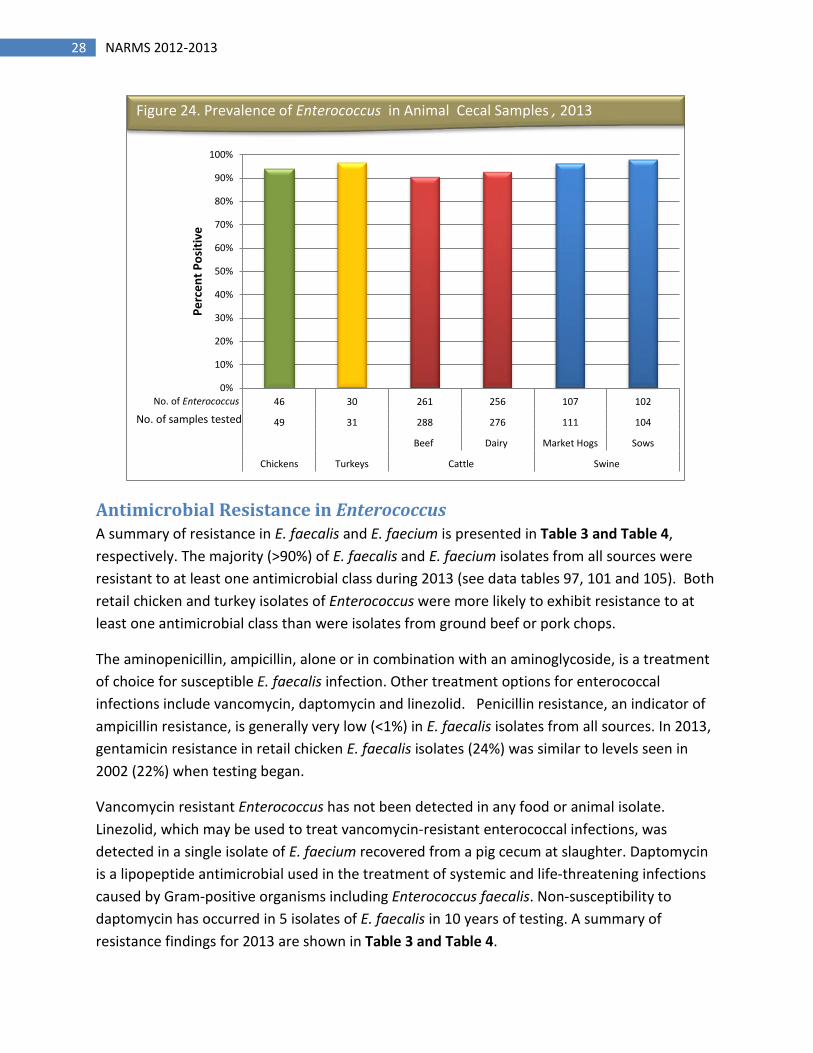
With the advent of cecal sampling, however, 2013 was the first year that Enterococcus was recovered from all four food animal species at slaughter. A majority of the Enterococcus isolates were E. faecalis, with the exception of retail chickens where the majority of isolates were E. faecium. The prevalence of Enterococcus from the animal cecal samples is shown in Figure 24.
70%
75%
80%
85%
90%
95%
100%
2002 2003 2004 2005 2006 2007 2008 2009 2010 2011 2012 2013
Perc
ent P
ositi
ve Retail Chicken
Retail Ground Turkey
Retail Ground Beef
Retail Pork Chops
Figure 23. Prevalence of Enterococcus in Retail Meat Samples
28 NARMS 2012-2013
Antimicrobial Resistance in Enterococcus A summary of resistance in E. faecalis and E. faecium is presented in Table 3 and Table 4, respectively. The majority (>90%) of E. faecalis and E. faecium isolates from all sources were resistant to at least one antimicrobial class during 2013 (see data tables 97, 101 and 105). Both retail chicken and turkey isolates of Enterococcus were more likely to exhibit resistance to at least one antimicrobial class than were isolates from ground beef or pork chops.
The aminopenicillin, ampicillin, alone or in combination with an aminoglycoside, is a treatment of choice for susceptible E. faecalis infection. Other treatment options for enterococcal infections include vancomycin, daptomycin and linezolid. Penicillin resistance, an indicator of ampicillin resistance, is generally very low (<1%) in E. faecalis isolates from all sources. In 2013, gentamicin resistance in retail chicken E. faecalis isolates (24%) was similar to levels seen in 2002 (22%) when testing began.
Vancomycin resistant Enterococcus has not been detected in any food or animal isolate. Linezolid, which may be used to treat vancomycin-resistant enterococcal infections, was detected in a single isolate of E. faecium recovered from a pig cecum at slaughter. Daptomycin is a lipopeptide antimicrobial used in the treatment of systemic and life-threatening infections caused by Gram-positive organisms including Enterococcus faecalis. Non-susceptibility to daptomycin has occurred in 5 isolates of E. faecalis in 10 years of testing. A summary of resistance findings for 2013 are shown in Table 3 and Table 4.
0%
10%
20%
30%
40%
50%
60%
70%
80%
90%
100%
46 30 261 256 107 102
49 31 288 276 111 104
Beef Dairy Market Hogs Sows
Chickens Turkeys Cattle Swine
Perc
ent P
ositi
ve
Figure 24. Prevalence of Enterococcus in Animal Cecal Samples , 2013
No. of Enterococcus
No. of samples tested
29 NARMS 2012-2013
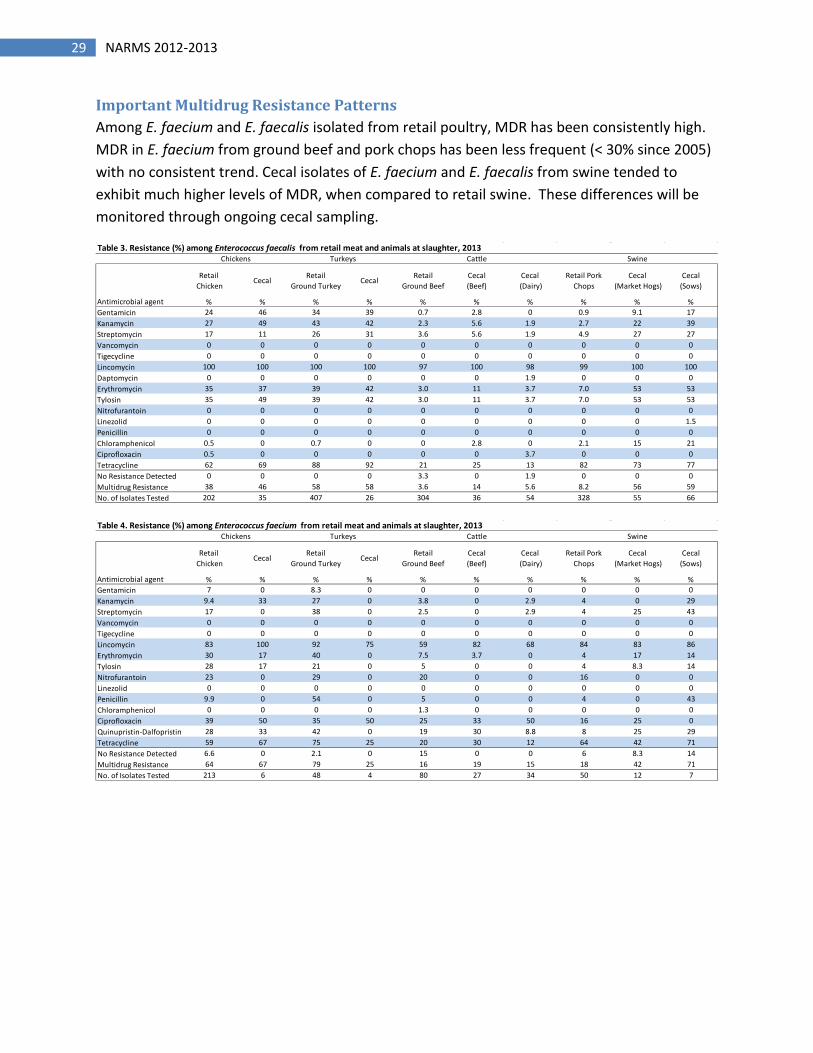
Important Multidrug Resistance Patterns Among E. faecium and E. faecalis isolated from retail poultry, MDR has been consistently high. MDR in E. faecium from ground beef and pork chops has been less frequent (< 30% since 2005) with no consistent trend. Cecal isolates of E. faecium and E. faecalis from swine tended to exhibit much higher levels of MDR, when compared to retail swine. These differences will be monitored through ongoing cecal sampling.
Table 3. Resistance (%) among Enterococcus faecalis from retail meat and animals at slaughter, 2013
Retail Chicken
Cecal Retail Ground Turkey
Cecal Retail Ground Beef
Cecal (Beef)
Cecal (Dairy)
Retail Pork Chops
Cecal (Market Hogs)
Cecal (Sows)
% % % % % % % % % %Gentamicin 24 46 34 39 0.7 2.8 0 0.9 9.1 17Kanamycin 27 49 43 42 2.3 5.6 1.9 2.7 22 39Streptomycin 17 11 26 31 3.6 5.6 1.9 4.9 27 27Vancomycin 0 0 0 0 0 0 0 0 0 0Tigecycline 0 0 0 0 0 0 0 0 0 0Lincomycin 100 100 100 100 97 100 98 99 100 100Daptomycin 0 0 0 0 0 0 1.9 0 0 0Erythromycin 35 37 39 42 3.0 11 3.7 7.0 53 53Tylosin 35 49 39 42 3.0 11 3.7 7.0 53 53Nitrofurantoin 0 0 0 0 0 0 0 0 0 0Linezolid 0 0 0 0 0 0 0 0 0 1.5Penicillin 0 0 0 0 0 0 0 0 0 0Chloramphenicol 0.5 0 0.7 0 0 2.8 0 2.1 15 21Ciprofloxacin 0.5 0 0 0 0 0 3.7 0 0 0Tetracycline 62 69 88 92 21 25 13 82 73 77No Resistance Detected 0 0 0 0 3.3 0 1.9 0 0 0Multidrug Resistance 38 46 58 58 3.6 14 5.6 8.2 56 59No. of Isolates Tested 202 35 407 26 304 36 54 328 55 66
Chickens Turkeys Cattle Swine
Antimicrobial agent
Table 4. Resistance (%) among Enterococcus faecium from retail meat and animals at slaughter, 2013
Retail Chicken
Cecal Retail Ground Turkey
Cecal Retail Ground Beef
Cecal (Beef)
Cecal (Dairy)
Retail Pork Chops
Cecal (Market Hogs)
Cecal (Sows)
% % % % % % % % % %Gentamicin 7 0 8.3 0 0 0 0 0 0 0Kanamycin 9.4 33 27 0 3.8 0 2.9 4 0 29Streptomycin 17 0 38 0 2.5 0 2.9 4 25 43Vancomycin 0 0 0 0 0 0 0 0 0 0Tigecycline 0 0 0 0 0 0 0 0 0 0Lincomycin 83 100 92 75 59 82 68 84 83 86Erythromycin 30 17 40 0 7.5 3.7 0 4 17 14Tylosin 28 17 21 0 5 0 0 4 8.3 14Nitrofurantoin 23 0 29 0 20 0 0 16 0 0Linezolid 0 0 0 0 0 0 0 0 0 0Penicillin 9.9 0 54 0 5 0 0 4 0 43Chloramphenicol 0 0 0 0 1.3 0 0 0 0 0Ciprofloxacin 39 50 35 50 25 33 50 16 25 0Quinupristin-Dalfopristin 28 33 42 0 19 30 8.8 8 25 29Tetracycline 59 67 75 25 20 30 12 64 42 71No Resistance Detected 6.6 0 2.1 0 15 0 0 6 8.3 14Multidrug Resistance 64 67 79 25 16 19 15 18 42 71No. of Isolates Tested 213 6 48 4 80 27 34 50 12 7
Chickens Turkeys Cattle Swine
Antimicrobial agent
30 NARMS 2012-2013
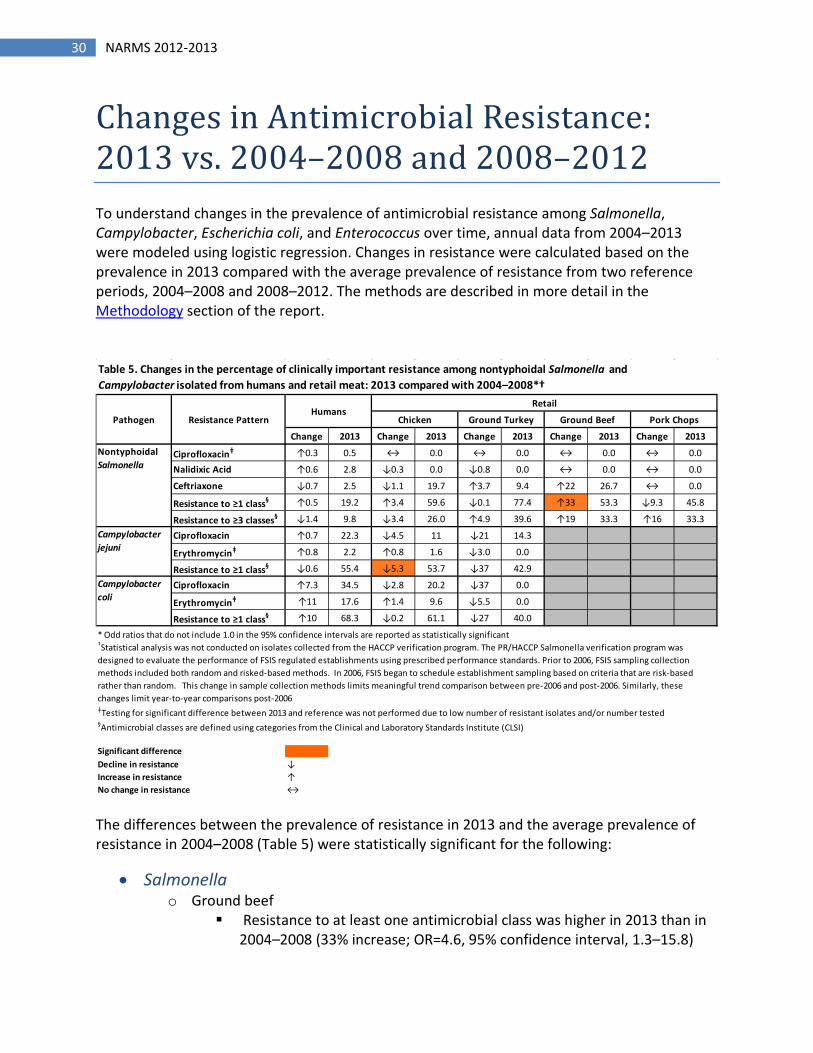
Changes in Antimicrobial Resistance: 2013 vs. 2004–2008 and 2008–2012 To understand changes in the prevalence of antimicrobial resistance among Salmonella, Campylobacter, Escherichia coli, and Enterococcus over time, annual data from 2004–2013 were modeled using logistic regression. Changes in resistance were calculated based on the prevalence in 2013 compared with the average prevalence of resistance from two reference periods, 2004–2008 and 2008–2012. The methods are described in more detail in the Methodology section of the report.
The differences between the prevalence of resistance in 2013 and the average prevalence of resistance in 2004–2008 (Table 5) were statistically significant for the following:
• Salmonella o Ground beef
Resistance to at least one antimicrobial class was higher in 2013 than in 2004–2008 (33% increase; OR=4.6, 95% confidence interval, 1.3–15.8)
Change 2013 Change 2013 Change 2013 Change 2013 Change 2013
Ciprofloxacinǂ ↑0.3 0.5 ↔ 0.0 ↔ 0.0 ↔ 0.0 ↔ 0.0
Nalidixic Acid ↑0.6 2.8 ↓0.3 0.0 ↓0.8 0.0 ↔ 0.0 ↔ 0.0
Ceftriaxone ↓0.7 2.5 ↓1.1 19.7 ↑3.7 9.4 ↑22 26.7 ↔ 0.0
Resistance to ≥1 class§ ↑0.5 19.2 ↑3.4 59.6 ↓0.1 77.4 ↑33 53.3 ↓9.3 45.8
Resistance to ≥3 classes§ ↓1.4 9.8 ↓3.4 26.0 ↑4.9 39.6 ↑19 33.3 ↑16 33.3
Ciprofloxacin ↑0.7 22.3 ↓4.5 11 ↓21 14.3
Erythromycinǂ ↑0.8 2.2 ↑0.8 1.6 ↓3.0 0.0
Resistance to ≥1 class§ ↓0.6 55.4 ↓5.3 53.7 ↓37 42.9
Ciprofloxacin ↑7.3 34.5 ↓2.8 20.2 ↓37 0.0
Erythromycinǂ ↑11 17.6 ↑1.4 9.6 ↓5.5 0.0
Resistance to ≥1 class§ ↑10 68.3 ↓0.2 61.1 ↓27 40.0
* Odd ratios that do not include 1.0 in the 95% confidence intervals are reported as statistically significant
ǂTesting for significant difference between 2013 and reference was not performed due to low number of resistant isolates and/or number tested §Antimicrobial classes are defined using categories from the Clinical and Laboratory Standards Institute (CLSI)
↓Increase in resistance ↑No change in resistance ↔
Decline in resistance
Campylobacter jejuni
Campylobacter coli
Humans
Significant difference
†Statistical analysis was not conducted on isolates collected from the HACCP verification program. The PR/HACCP Salmonella verification program was designed to evaluate the performance of FSIS regulated establishments using prescribed performance standards. Prior to 2006, FSIS sampling collection methods included both random and risked-based methods. In 2006, FSIS began to schedule establishment sampling based on criteria that are risk-based rather than random. This change in sample collection methods limits meaningful trend comparison between pre-2006 and post-2006. Similarly, these changes limit year-to-year comparisons post-2006
Table 5. Changes in the percentage of clinically important resistance among nontyphoidal Salmonella and Campylobacter isolated from humans and retail meat: 2013 compared with 2004–2008*†
Ground Turkey Ground Beef
Retail
Nontyphoidal Salmonella
Pork ChopsPathogen Resistance Pattern Chicken
31 NARMS 2012-2013
• Campylobacter o C. jejuni from retail chicken
Resistance to at least one antimicrobial class was lower in 2013 than in 2004–2008 (5.3% decline; OR=0.4, 95% confidence interval, 0.2–0.8)
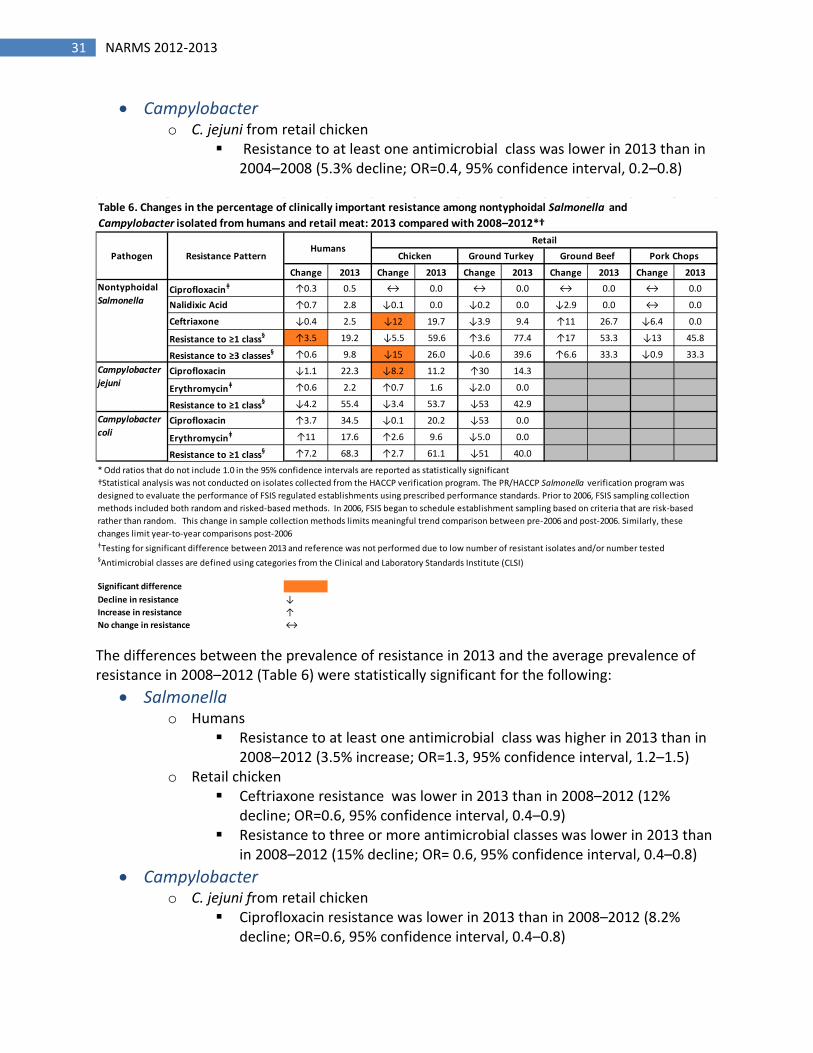
The differences between the prevalence of resistance in 2013 and the average prevalence of resistance in 2008–2012 (Table 6) were statistically significant for the following:
• Salmonella o Humans
Resistance to at least one antimicrobial class was higher in 2013 than in 2008–2012 (3.5% increase; OR=1.3, 95% confidence interval, 1.2–1.5)
o Retail chicken Ceftriaxone resistance was lower in 2013 than in 2008–2012 (12%
decline; OR=0.6, 95% confidence interval, 0.4–0.9) Resistance to three or more antimicrobial classes was lower in 2013 than
in 2008–2012 (15% decline; OR= 0.6, 95% confidence interval, 0.4–0.8) • Campylobacter
o C. jejuni from retail chicken Ciprofloxacin resistance was lower in 2013 than in 2008–2012 (8.2%
decline; OR=0.6, 95% confidence interval, 0.4–0.8)
Change 2013 Change 2013 Change 2013 Change 2013 Change 2013
Ciprofloxacinǂ ↑0.3 0.5 ↔ 0.0 ↔ 0.0 ↔ 0.0 ↔ 0.0
Nalidixic Acid ↑0.7 2.8 ↓0.1 0.0 ↓0.2 0.0 ↓2.9 0.0 ↔ 0.0
Ceftriaxone ↓0.4 2.5 ↓12 19.7 ↓3.9 9.4 ↑11 26.7 ↓6.4 0.0
Resistance to ≥1 class§ ↑3.5 19.2 ↓5.5 59.6 ↑3.6 77.4 ↑17 53.3 ↓13 45.8
Resistance to ≥3 classes§ ↑0.6 9.8 ↓15 26.0 ↓0.6 39.6 ↑6.6 33.3 ↓0.9 33.3
Ciprofloxacin ↓1.1 22.3 ↓8.2 11.2 ↑30 14.3
Erythromycinǂ ↑0.6 2.2 ↑0.7 1.6 ↓2.0 0.0
Resistance to ≥1 class§ ↓4.2 55.4 ↓3.4 53.7 ↓53 42.9
Ciprofloxacin ↑3.7 34.5 ↓0.1 20.2 ↓53 0.0
Erythromycinǂ ↑11 17.6 ↑2.6 9.6 ↓5.0 0.0
Resistance to ≥1 class§ ↑7.2 68.3 ↑2.7 61.1 ↓51 40.0
* Odd ratios that do not include 1.0 in the 95% confidence intervals are reported as statistically significant
ǂTesting for significant difference between 2013 and reference was not performed due to low number of resistant isolates and/or number tested §Antimicrobial classes are defined using categories from the Clinical and Laboratory Standards Institute (CLSI)
Decline in resistance ↓ Increase in resistance ↑No change in resistance ↔
†Statistical analysis was not conducted on isolates collected from the HACCP verification program. The PR/HACCP Salmonella verification program was designed to evaluate the performance of FSIS regulated establishments using prescribed performance standards. Prior to 2006, FSIS sampling collection methods included both random and risked-based methods. In 2006, FSIS began to schedule establishment sampling based on criteria that are risk-based rather than random. This change in sample collection methods limits meaningful trend comparison between pre-2006 and post-2006. Similarly, these changes limit year-to-year comparisons post-2006
Significant difference
Table 6. Changes in the percentage of clinically important resistance among nontyphoidal Salmonella and Campylobacter isolated from humans and retail meat: 2013 compared with 2008–2012*†
Retail Chicken Ground Turkey Ground Beef Pork ChopsPathogen Resistance Pattern
Humans
Nontyphoidal Salmonella
Campylobacter jejuni
Campylobacter coli
32 NARMS 2012-2013
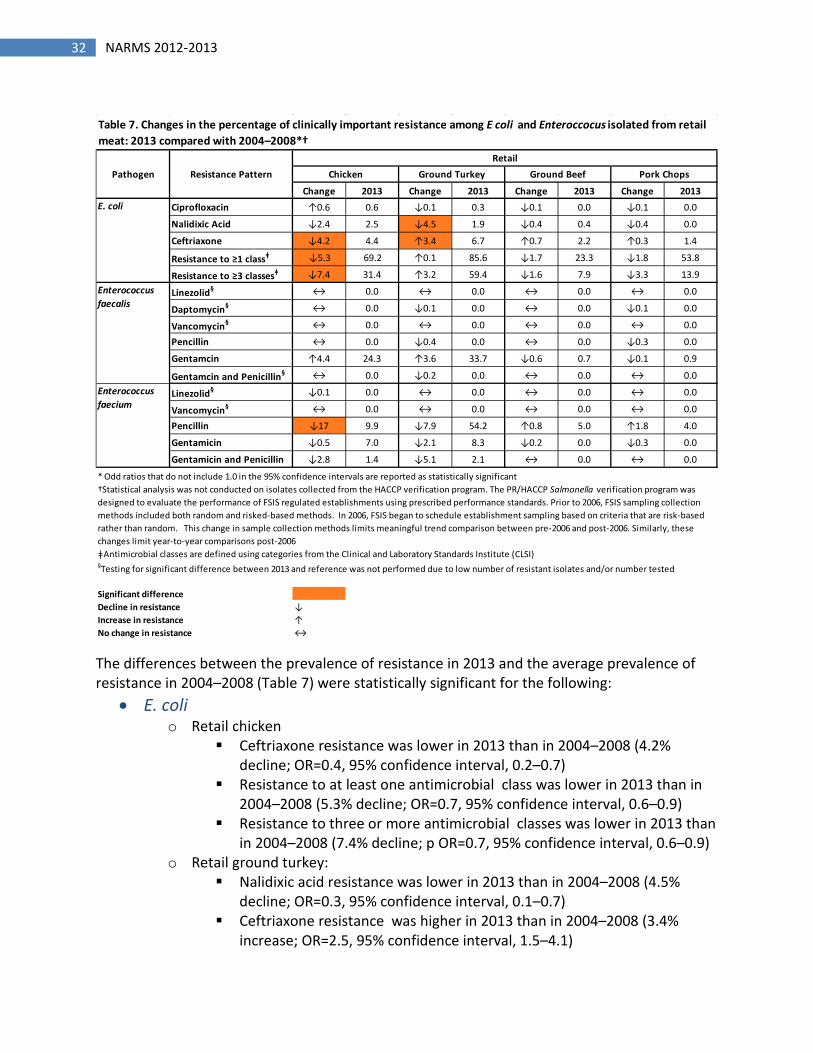
The differences between the prevalence of resistance in 2013 and the average prevalence of resistance in 2004–2008 (Table 7) were statistically significant for the following:
• E. coli o Retail chicken
Ceftriaxone resistance was lower in 2013 than in 2004–2008 (4.2% decline; OR=0.4, 95% confidence interval, 0.2–0.7)
Resistance to at least one antimicrobial class was lower in 2013 than in 2004–2008 (5.3% decline; OR=0.7, 95% confidence interval, 0.6–0.9)
Resistance to three or more antimicrobial classes was lower in 2013 than in 2004–2008 (7.4% decline; p OR=0.7, 95% confidence interval, 0.6–0.9)
o Retail ground turkey: Nalidixic acid resistance was lower in 2013 than in 2004–2008 (4.5%
decline; OR=0.3, 95% confidence interval, 0.1–0.7) Ceftriaxone resistance was higher in 2013 than in 2004–2008 (3.4%
increase; OR=2.5, 95% confidence interval, 1.5–4.1)
Change 2013 Change 2013 Change 2013 Change 2013Ciprofloxacin ↑0.6 0.6 ↓0.1 0.3 ↓0.1 0.0 ↓0.1 0.0
Nalidixic Acid ↓2.4 2.5 ↓4.5 1.9 ↓0.4 0.4 ↓0.4 0.0
Ceftriaxone ↓4.2 4.4 ↑3.4 6.7 ↑0.7 2.2 ↑0.3 1.4
Resistance to ≥1 classǂ ↓5.3 69.2 ↑0.1 85.6 ↓1.7 23.3 ↓1.8 53.8
Resistance to ≥3 classesǂ ↓7.4 31.4 ↑3.2 59.4 ↓1.6 7.9 ↓3.3 13.9
Linezolid§ ↔ 0.0 ↔ 0.0 ↔ 0.0 ↔ 0.0
Daptomycin§ ↔ 0.0 ↓0.1 0.0 ↔ 0.0 ↓0.1 0.0
Vancomycin§ ↔ 0.0 ↔ 0.0 ↔ 0.0 ↔ 0.0
Pencillin ↔ 0.0 ↓0.4 0.0 ↔ 0.0 ↓0.3 0.0
Gentamcin ↑4.4 24.3 ↑3.6 33.7 ↓0.6 0.7 ↓0.1 0.9
Gentamcin and Penicillin§ ↔ 0.0 ↓0.2 0.0 ↔ 0.0 ↔ 0.0
Linezolid§ ↓0.1 0.0 ↔ 0.0 ↔ 0.0 ↔ 0.0
Vancomycin§ ↔ 0.0 ↔ 0.0 ↔ 0.0 ↔ 0.0
Pencillin ↓17 9.9 ↓7.9 54.2 ↑0.8 5.0 ↑1.8 4.0
Gentamicin ↓0.5 7.0 ↓2.1 8.3 ↓0.2 0.0 ↓0.3 0.0
Gentamicin and Penicillin ↓2.8 1.4 ↓5.1 2.1 ↔ 0.0 ↔ 0.0
* Odd ratios that do not include 1.0 in the 95% confidence intervals are reported as statistically significant
ǂAntimicrobial classes are defined using categories from the Clinical and Laboratory Standards Institute (CLSI)§Testing for significant difference between 2013 and reference was not performed due to low number of resistant isolates and/or number tested
Decline in resistance ↓Increase in resistance ↑No change in resistance ↔
E. coli
Enterococcus faecium
Significant difference
Enterococcus faecalis
†Statistical analysis was not conducted on isolates collected from the HACCP verification program. The PR/HACCP Salmonella verification program was designed to evaluate the performance of FSIS regulated establishments using prescribed performance standards. Prior to 2006, FSIS sampling collection methods included both random and risked-based methods. In 2006, FSIS began to schedule establishment sampling based on criteria that are risk-based rather than random. This change in sample collection methods limits meaningful trend comparison between pre-2006 and post-2006. Similarly, these changes limit year-to-year comparisons post-2006
Table 7. Changes in the percentage of clinically important resistance among E coli and Enteroccocus isolated from retail meat: 2013 compared with 2004–2008*†
Pathogen Resistance PatternRetail
Chicken Ground Turkey Ground Beef Pork Chops
33 NARMS 2012-2013
• Enterococcus o E. faecium from retail chicken
Penicillin resistance was lower in 2013 than in 2004–2008 (17% decline; OR=0.3, 95% confidence interval, 0.2–0.4)
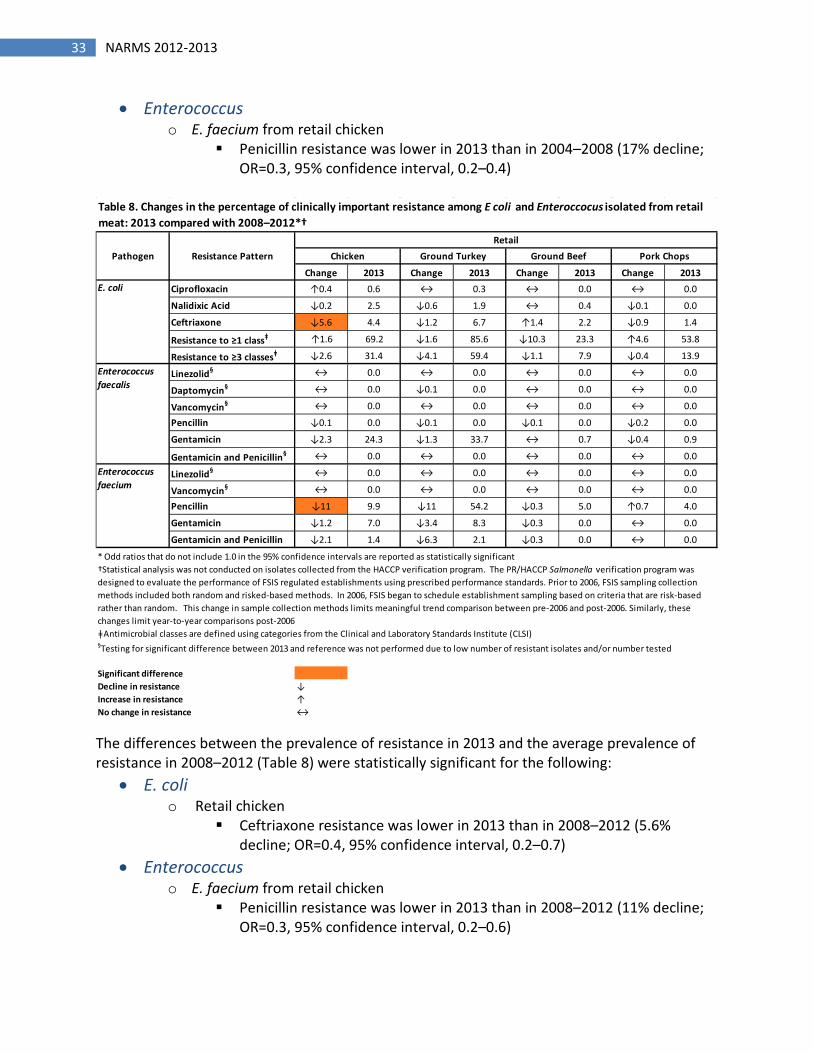
The differences between the prevalence of resistance in 2013 and the average prevalence of resistance in 2008–2012 (Table 8) were statistically significant for the following:
• E. coli o Retail chicken
Ceftriaxone resistance was lower in 2013 than in 2008–2012 (5.6% decline; OR=0.4, 95% confidence interval, 0.2–0.7)
• Enterococcus o E. faecium from retail chicken
Penicillin resistance was lower in 2013 than in 2008–2012 (11% decline; OR=0.3, 95% confidence interval, 0.2–0.6)
Change 2013 Change 2013 Change 2013 Change 2013Ciprofloxacin ↑0.4 0.6 ↔ 0.3 ↔ 0.0 ↔ 0.0
Nalidixic Acid ↓0.2 2.5 ↓0.6 1.9 ↔ 0.4 ↓0.1 0.0
Ceftriaxone ↓5.6 4.4 ↓1.2 6.7 ↑1.4 2.2 ↓0.9 1.4
Resistance to ≥1 classǂ ↑1.6 69.2 ↓1.6 85.6 ↓10.3 23.3 ↑4.6 53.8
Resistance to ≥3 classesǂ ↓2.6 31.4 ↓4.1 59.4 ↓1.1 7.9 ↓0.4 13.9
Linezolid§ ↔ 0.0 ↔ 0.0 ↔ 0.0 ↔ 0.0
Daptomycin§ ↔ 0.0 ↓0.1 0.0 ↔ 0.0 ↔ 0.0
Vancomycin§ ↔ 0.0 ↔ 0.0 ↔ 0.0 ↔ 0.0
Pencillin ↓0.1 0.0 ↓0.1 0.0 ↓0.1 0.0 ↓0.2 0.0
Gentamicin ↓2.3 24.3 ↓1.3 33.7 ↔ 0.7 ↓0.4 0.9
Gentamicin and Penicillin§ ↔ 0.0 ↔ 0.0 ↔ 0.0 ↔ 0.0
Linezolid§ ↔ 0.0 ↔ 0.0 ↔ 0.0 ↔ 0.0
Vancomycin§ ↔ 0.0 ↔ 0.0 ↔ 0.0 ↔ 0.0
Pencillin ↓11 9.9 ↓11 54.2 ↓0.3 5.0 ↑0.7 4.0
Gentamicin ↓1.2 7.0 ↓3.4 8.3 ↓0.3 0.0 ↔ 0.0
Gentamicin and Penicillin ↓2.1 1.4 ↓6.3 2.1 ↓0.3 0.0 ↔ 0.0
* Odd ratios that do not include 1.0 in the 95% confidence intervals are reported as statistically significant
ǂAntimicrobial classes are defined using categories from the Clinical and Laboratory Standards Institute (CLSI)§Testing for significant difference between 2013 and reference was not performed due to low number of resistant isolates and/or number tested
Decline in resistance ↓Increase in resistance ↑No change in resistance ↔
E. coli
Enterococcus faecalis
Enterococcus faecium
Significant difference
†Statistical analysis was not conducted on isolates collected from the HACCP verification program. The PR/HACCP Salmonella verification program was designed to evaluate the performance of FSIS regulated establishments using prescribed performance standards. Prior to 2006, FSIS sampling collection methods included both random and risked-based methods. In 2006, FSIS began to schedule establishment sampling based on criteria that are risk-based rather than random. This change in sample collection methods limits meaningful trend comparison between pre-2006 and post-2006. Similarly, these changes limit year-to-year comparisons post-2006
Table 8. Changes in the percentage of clinically important resistance among E coli and Enteroccocus isolated from retail meat: 2013 compared with 2008–2012*†
Pathogen Resistance PatternRetail
Chicken Ground Turkey Ground Beef Pork Chops
34 NARMS 2012-2013
References
Allos BM, Blaser MJ (2010). Campylobacter jejuni and related species. In: Mandell GL, Bennett JE, and Dolin R, editors. Mandell, Douglas, and Bennett’s Principles and Practice of Infectious Diseases, 7th ed. Philadelphia, PA: Churchill Livingstone, p. 2793–2802.
AnimalDrugs@FDA. Available at: http://www.accessdata.fda.gov/scripts/animaldrugsatfda/
CDC. (2013). National Salmonella Surveillance 2012 Annual Report. The Centers for Disease Control and Prevention. Available at: http://www.cdc.gov/ncezid/dfwed/pdfs/salmonella-annual-report-2012-508c.pdf
CLSI. (2014). Performance Standards for Antimicrobial Susceptibility Testing; Twenty-fourth Informational Supplement. CLSI document M100-S24. CLSI, Wayne, PA.
Economic Research Service (ERS), U.S. Department of Agriculture (USDA). Cost Estimates of Foodborne Illnesses. http://ers.usda.gov/data-products/cost-estimates-of-foodborne-illnesses.aspx.(2014).
Krueger AL, et al. Clinical outcomes of nalidixic acid, ceftriaxone, and multidrug-resistant nontyphoidal Salmonella infections compared with pansusceptible infections in FoodNet sites, 2006-2008. Foodborne Pathog Dis. 2014 May;11(5):335-41.
Scallan E. et al (2011). Foodborne illness acquired in the United States—major pathogens. Emerging Infectious Diseases, 17(1):7-15.
Threlfall EJ. Epidemic Salmonella Typhimurium DT 104--a truly international multiresistant clone. J Antimicrob Chemother. 2000 Jul;46(1):7-10.
Varma JK, et al. (2005b). Antimicrobial-resistant nontyphoidal Salmonella is associated with excess bloodstream infections and hospitalizations. Journal of Infectious Diseases, 191:554-61.
WHO. Integrated surveillance of antimicrobial resistance. Guidance from a WHO advisory group. Geneva, World Health Organization, 2013. Available at: http://apps.who.int/iris/bitstream/10665/91778/1/9789241506311_eng.pdf?ua=1