Embed Size (px)
Citation preview
17030 NAPLAN School Summary Report 2009 - 2014Last Refreshed: 30/01/2015
Refreshed by: sheila.delahay
NAPLAN Results 2009 - 2014
Durack Primary School
Note: In 2011, students were required to complete apersuasive writing task. This is a change from previousyears (2010 and prior) when students were required towrite a narrative or story. Due to this change in genre,post 2010 Writing results should not be compared to
previous years.
Students in Years 3, 5, 7 and 9 across Australia sit common tests in numeracy, reading, writing and language conventions (spelling,grammar and punctuation). The results from this assessment provide an important measure of how all Australian students are performing inliteracy and numeracy against national achievement bands.
Universe: NAPLAN school summary results
Page 1/1
17030 NAPLAN School Summary Report 2009 - 2014Last Refreshed: 30/01/2015
Refreshed by: sheila.delahay
Year Level 3
2009 2010 2011 2012 2013 2014
Grammar
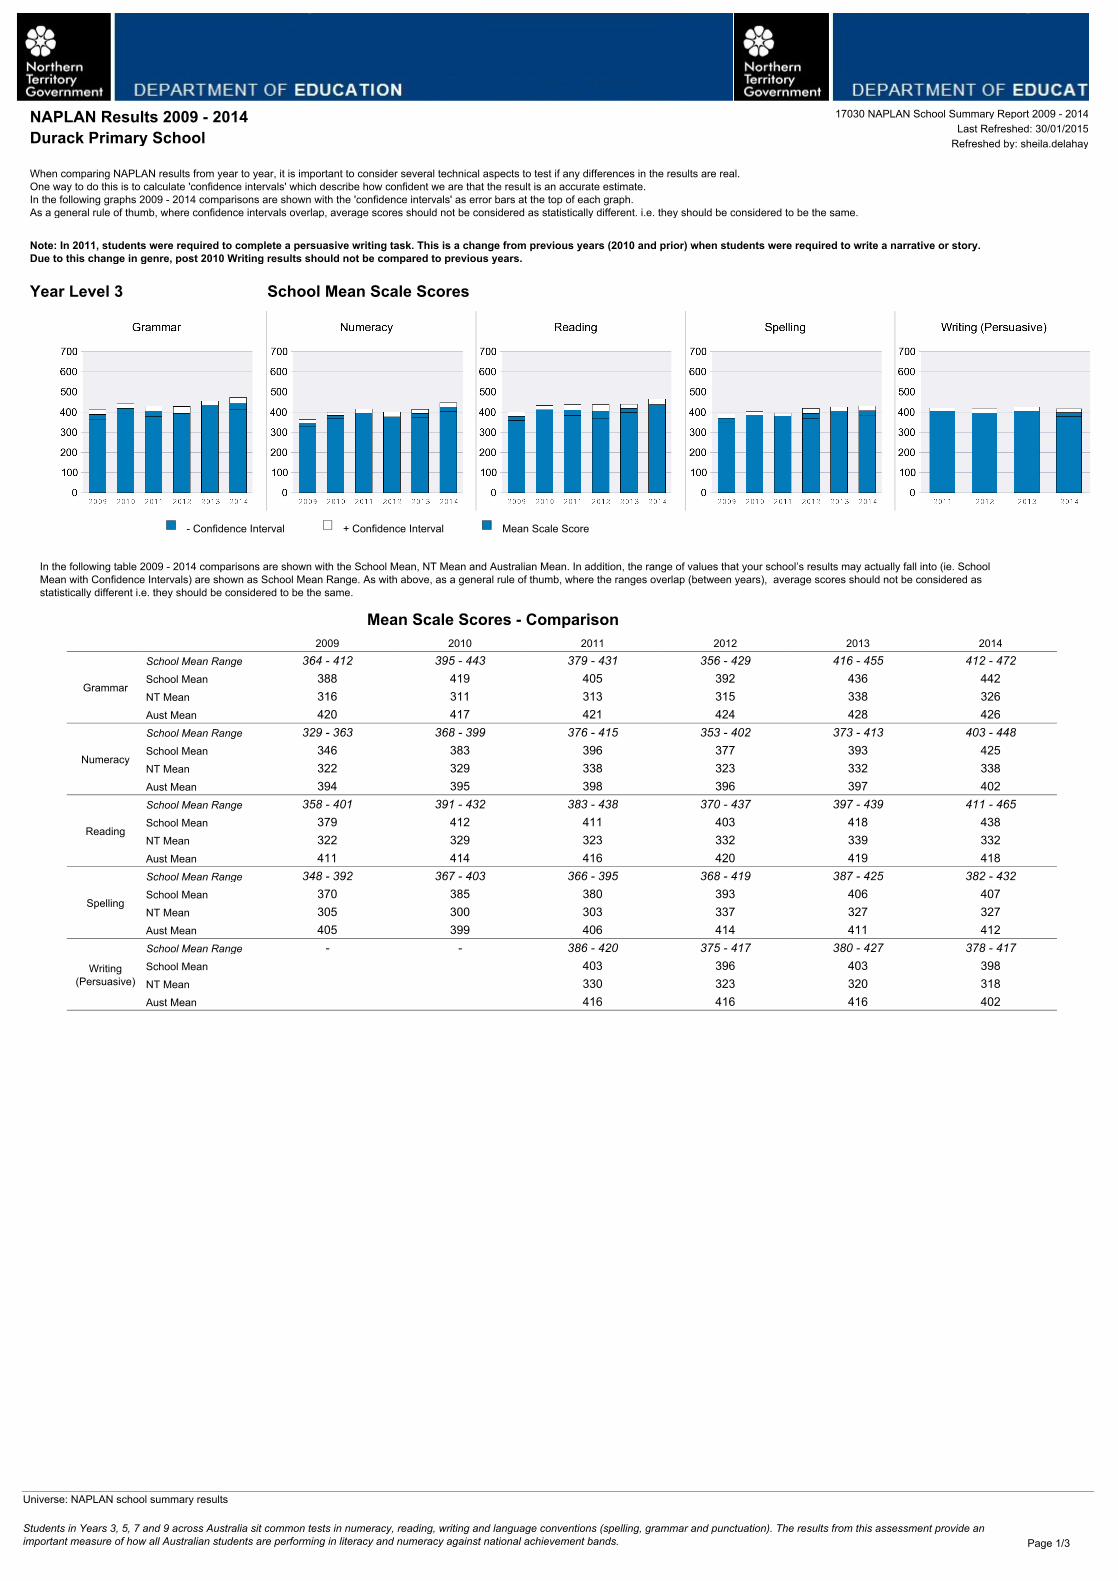
School Mean Range 364 - 412 395 - 443 379 - 431 356 - 429 416 - 455 412 - 472School Mean 388 419 405 392 436 442NT Mean 316 311 313 315 338 326Aust Mean 420 417 421 424 428 426
Numeracy
School Mean Range 329 - 363 368 - 399 376 - 415 353 - 402 373 - 413 403 - 448School Mean 346 383 396 377 393 425NT Mean 322 329 338 323 332 338Aust Mean 394 395 398 396 397 402
Reading
School Mean Range 358 - 401 391 - 432 383 - 438 370 - 437 397 - 439 411 - 465School Mean 379 412 411 403 418 438NT Mean 322 329 323 332 339 332Aust Mean 411 414 416 420 419 418
Spelling
School Mean Range 348 - 392 367 - 403 366 - 395 368 - 419 387 - 425 382 - 432School Mean 370 385 380 393 406 407NT Mean 305 300 303 337 327 327Aust Mean 405 399 406 414 411 412
Writing(Persuasive)
School Mean Range - - 386 - 420 375 - 417 380 - 427 378 - 417School Mean 403 396 403 398NT Mean 330 323 320 318Aust Mean 416 416 416 402
- Confidence Interval + Confidence Interval Mean Scale Score
School Mean Scale Scores
Mean Scale Scores - Comparison
In the following table 2009 - 2014 comparisons are shown with the School Mean, NT Mean and Australian Mean. In addition, the range of values that your school’s results may actually fall into (ie. SchoolMean with Confidence Intervals) are shown as School Mean Range. As with above, as a general rule of thumb, where the ranges overlap (between years), average scores should not be considered asstatistically different i.e. they should be considered to be the same.
When comparing NAPLAN results from year to year, it is important to consider several technical aspects to test if any differences in the results are real. One way to do this is to calculate 'confidence intervals' which describe how confident we are that the result is an accurate estimate. In the following graphs 2009 - 2014 comparisons are shown with the 'confidence intervals' as error bars at the top of each graph. As a general rule of thumb, where confidence intervals overlap, average scores should not be considered as statistically different. i.e. they should be considered to be the same.
NAPLAN Results 2009 - 2014Durack Primary School
Note: In 2011, students were required to complete a persuasive writing task. This is a change from previous years (2010 and prior) when students were required to write a narrative or story.Due to this change in genre, post 2010 Writing results should not be compared to previous years.
Students in Years 3, 5, 7 and 9 across Australia sit common tests in numeracy, reading, writing and language conventions (spelling, grammar and punctuation). The results from this assessment provide animportant measure of how all Australian students are performing in literacy and numeracy against national achievement bands.
Universe: NAPLAN school summary results
Page 1/3
17030 NAPLAN School Summary Report 2009 - 2014Last Refreshed: 30/01/2015
Refreshed by: sheila.delahay
Year Level 5
2009 2010 2011 2012 2013 2014
Grammar
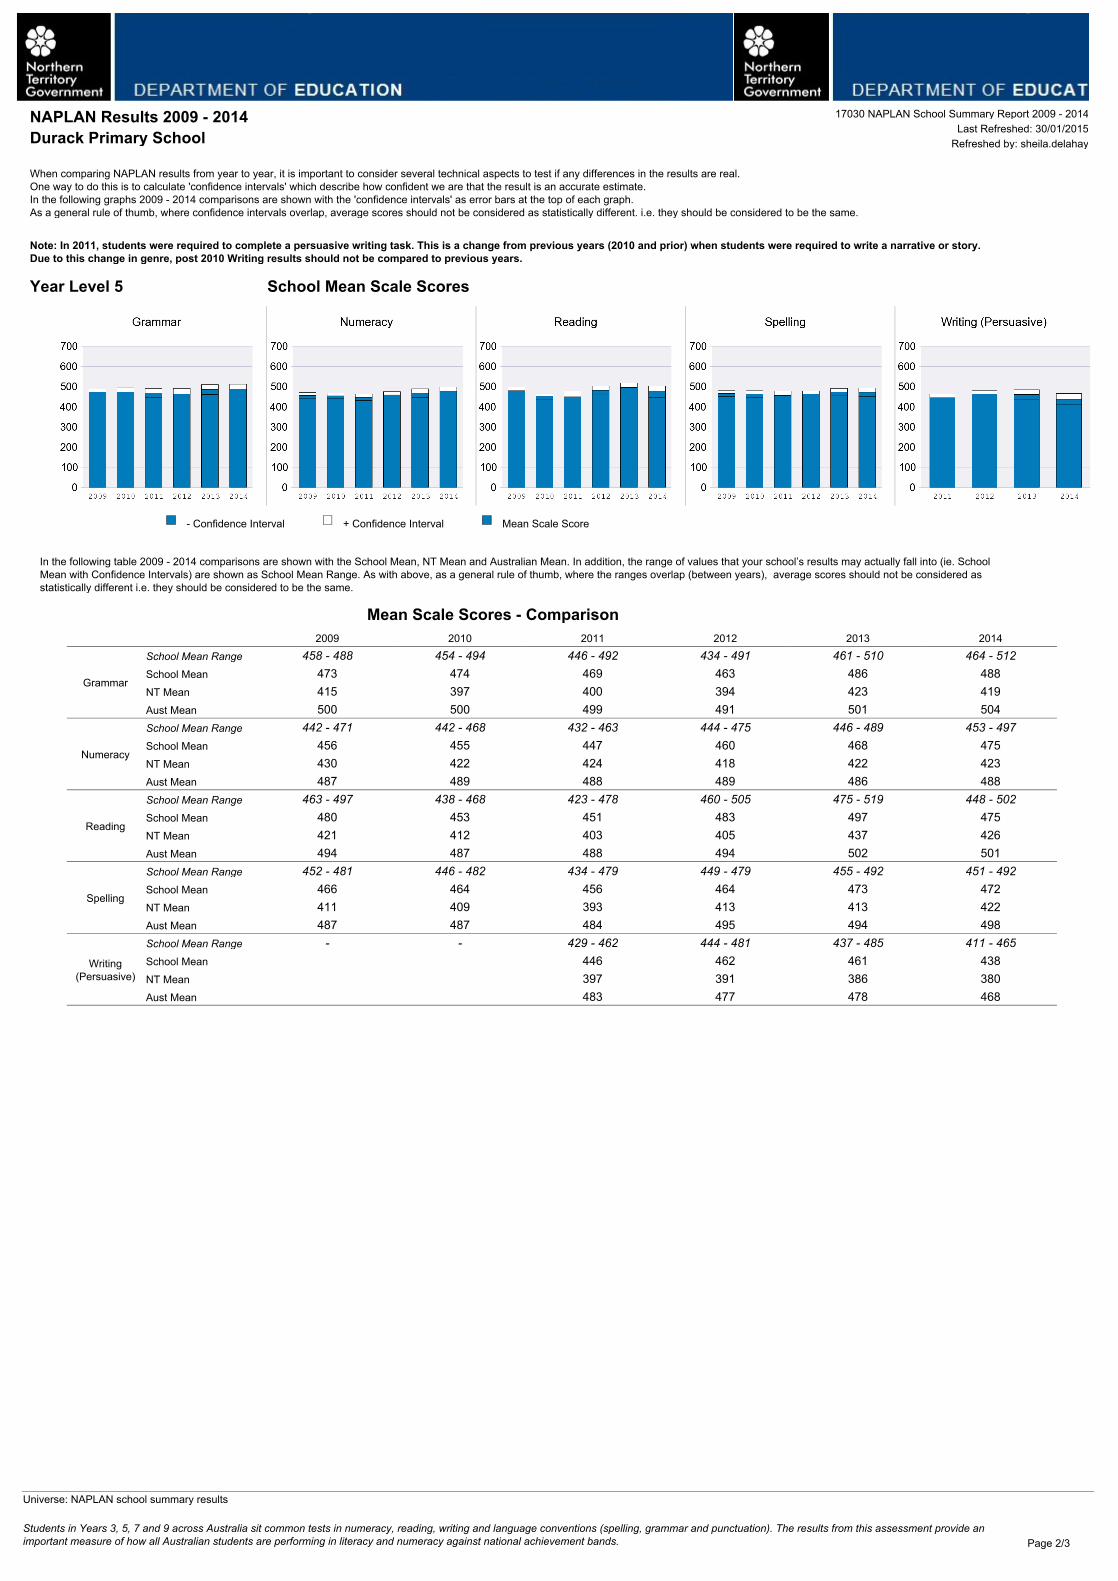
School Mean Range 458 - 488 454 - 494 446 - 492 434 - 491 461 - 510 464 - 512School Mean 473 474 469 463 486 488NT Mean 415 397 400 394 423 419Aust Mean 500 500 499 491 501 504
Numeracy
School Mean Range 442 - 471 442 - 468 432 - 463 444 - 475 446 - 489 453 - 497School Mean 456 455 447 460 468 475NT Mean 430 422 424 418 422 423Aust Mean 487 489 488 489 486 488
Reading
School Mean Range 463 - 497 438 - 468 423 - 478 460 - 505 475 - 519 448 - 502School Mean 480 453 451 483 497 475NT Mean 421 412 403 405 437 426Aust Mean 494 487 488 494 502 501
Spelling
School Mean Range 452 - 481 446 - 482 434 - 479 449 - 479 455 - 492 451 - 492School Mean 466 464 456 464 473 472NT Mean 411 409 393 413 413 422Aust Mean 487 487 484 495 494 498
Writing(Persuasive)
School Mean Range - - 429 - 462 444 - 481 437 - 485 411 - 465School Mean 446 462 461 438NT Mean 397 391 386 380Aust Mean 483 477 478 468
- Confidence Interval + Confidence Interval Mean Scale Score
School Mean Scale Scores
Mean Scale Scores - Comparison
In the following table 2009 - 2014 comparisons are shown with the School Mean, NT Mean and Australian Mean. In addition, the range of values that your school’s results may actually fall into (ie. SchoolMean with Confidence Intervals) are shown as School Mean Range. As with above, as a general rule of thumb, where the ranges overlap (between years), average scores should not be considered asstatistically different i.e. they should be considered to be the same.
When comparing NAPLAN results from year to year, it is important to consider several technical aspects to test if any differences in the results are real. One way to do this is to calculate 'confidence intervals' which describe how confident we are that the result is an accurate estimate. In the following graphs 2009 - 2014 comparisons are shown with the 'confidence intervals' as error bars at the top of each graph. As a general rule of thumb, where confidence intervals overlap, average scores should not be considered as statistically different. i.e. they should be considered to be the same.
NAPLAN Results 2009 - 2014Durack Primary School
Note: In 2011, students were required to complete a persuasive writing task. This is a change from previous years (2010 and prior) when students were required to write a narrative or story.Due to this change in genre, post 2010 Writing results should not be compared to previous years.
Students in Years 3, 5, 7 and 9 across Australia sit common tests in numeracy, reading, writing and language conventions (spelling, grammar and punctuation). The results from this assessment provide animportant measure of how all Australian students are performing in literacy and numeracy against national achievement bands.
Universe: NAPLAN school summary results
Page 2/3
17030 NAPLAN School Summary Report 2009 - 2014Last Refreshed: 30/01/2015
Refreshed by: sheila.delahay
Year Level 7
2009 2010 2011 2012 2013 2014
Grammar
School Mean Range - - - - - - School Mean
NT Mean 465 460 457 476 442 465Aust Mean 540 535 532 546 535 543
Numeracy
School Mean Range - - - - - - School Mean
NT Mean 485 487 481 475 477 484Aust Mean 544 548 545 538 542 546
Reading
School Mean Range - - - - - - School Mean
NT Mean 483 488 480 474 469 479Aust Mean 541 546 540 542 541 546
Spelling
School Mean Range - - - - - - School Mean
NT Mean 466 469 462 464 467 462Aust Mean 540 545 538 543 549 545
Writing(Persuasive)
School Mean Range - - - - - - School Mean
NT Mean 446 435 418 416Aust Mean 529 518 517 512
- Confidence Interval + Confidence Interval Mean Scale Score
School Mean Scale Scores
Mean Scale Scores - Comparison
In the following table 2009 - 2009 comparisons are shown with the School Mean, NT Mean and Australian Mean. In addition, the range of values that your school’s results may actually fall into (ie. SchoolMean with Confidence Intervals) are shown as School Mean Range. As with above, as a general rule of thumb, where the ranges overlap (between years), average scores should not be considered asstatistically different i.e. they should be considered to be the same.
When comparing NAPLAN results from year to year, it is important to consider several technical aspects to test if any differences in the results are real. One way to do this is to calculate 'confidence intervals' which describe how confident we are that the result is an accurate estimate. In the following graphs 2009 - 2014 comparisons are shown with the 'confidence intervals' as error bars at the top of each graph. As a general rule of thumb, where confidence intervals overlap, average scores should not be considered as statistically different. i.e. they should be considered to be the same.
NAPLAN Results 2009 - 2014Durack Primary School
Note: In 2011, students were required to complete a persuasive writing task. This is a change from previous years (2010 and prior) when students were required to write a narrative or story.Due to this change in genre, post 2010 Writing results should not be compared to previous years.
Students in Years 3, 5, 7 and 9 across Australia sit common tests in numeracy, reading, writing and language conventions (spelling, grammar and punctuation). The results from this assessment provide animportant measure of how all Australian students are performing in literacy and numeracy against national achievement bands.
Universe: NAPLAN school summary results
Page 3/3
17030 NAPLAN School Summary Report 2009 - 2014Last Refreshed: 30/01/2015
Refreshed by: sheila.delahay
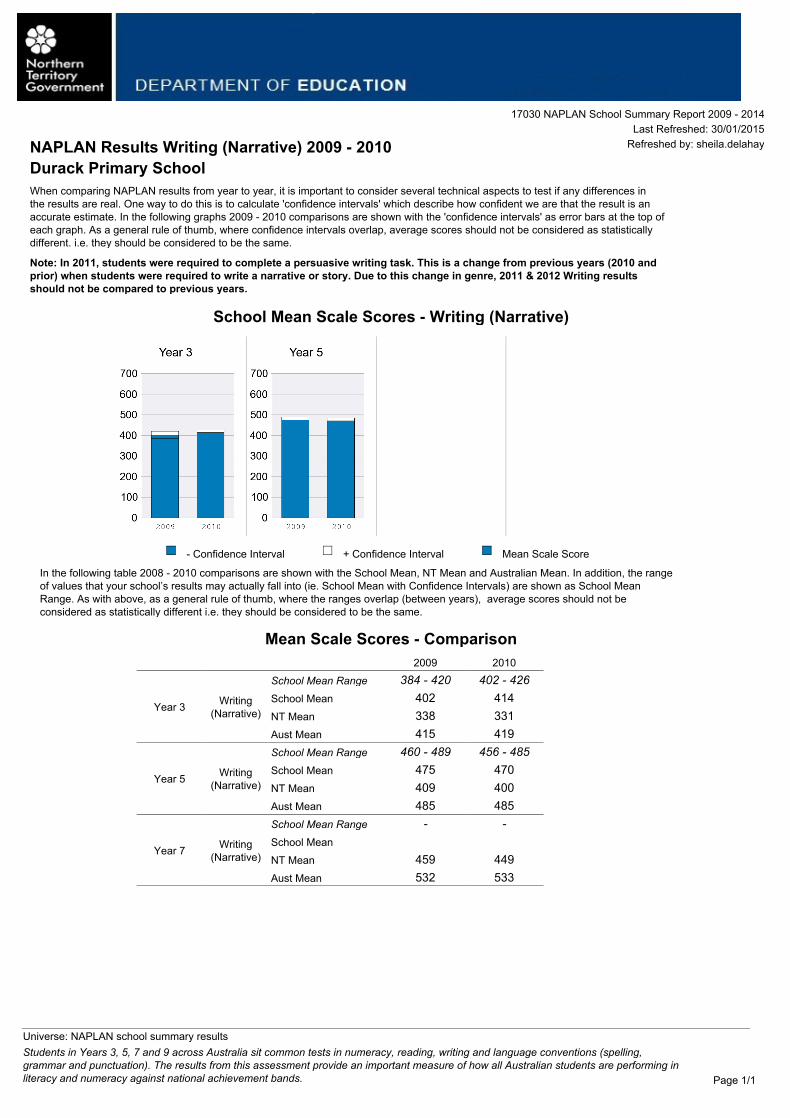
When comparing NAPLAN results from year to year, it is important to consider several technical aspects to test if any differences in the results are real. One way to do this is to calculate 'confidence intervals' which describe how confident we are that the result is an accurate estimate. In the following graphs 2009 - 2010 comparisons are shown with the 'confidence intervals' as error bars at the top ofeach graph. As a general rule of thumb, where confidence intervals overlap, average scores should not be considered as statisticallydifferent. i.e. they should be considered to be the same.
NAPLAN Results Writing (Narrative) 2009 - 2010Durack Primary School
2009 2010
Year 3 Writing(Narrative)
School Mean Range 384 - 420 402 - 426School Mean 402 414NT Mean 338 331Aust Mean 415 419
Year 5 Writing(Narrative)
School Mean Range 460 - 489 456 - 485School Mean 475 470NT Mean 409 400Aust Mean 485 485
Year 7 Writing(Narrative)
School Mean Range - - School Mean
NT Mean 459 449Aust Mean 532 533
- Confidence Interval + Confidence Interval Mean Scale Score
In the following table 2008 - 2010 comparisons are shown with the School Mean, NT Mean and Australian Mean. In addition, the rangeof values that your school’s results may actually fall into (ie. School Mean with Confidence Intervals) are shown as School MeanRange. As with above, as a general rule of thumb, where the ranges overlap (between years), average scores should not beconsidered as statistically different i.e. they should be considered to be the same.
Mean Scale Scores - Comparison
Note: In 2011, students were required to complete a persuasive writing task. This is a change from previous years (2010 andprior) when students were required to write a narrative or story. Due to this change in genre, 2011 & 2012 Writing resultsshould not be compared to previous years.
School Mean Scale Scores - Writing (Narrative)
Students in Years 3, 5, 7 and 9 across Australia sit common tests in numeracy, reading, writing and language conventions (spelling,grammar and punctuation). The results from this assessment provide an important measure of how all Australian students are performing inliteracy and numeracy against national achievement bands.
Universe: NAPLAN school summary results
Page 1/1

Year 3
Below NMS At NMS Above NMS Total No ofStudents
No of Students % of Students No of Students % of Students No of Students % of Students
Grammar
2009 8 14% 11 19% 39 67% 582010 4 8% 4 8% 45 85% 532011 3 7% 2 5% 38 88% 432012 6 16% 6 16% 25 68% 372013 1 2% 1 2% 41 95% 432014 2 5% 2 5% 37 90% 41
Numeracy
2009 9 16% 11 19% 37 65% 572010 10 19% 42 81% 522011 1 2% 4 9% 38 88% 432012 1 3% 6 17% 29 81% 362013 1 2% 5 12% 37 86% 432014 3 7% 38 93% 41
Reading
2009 4 7% 14 25% 39 68% 572010 3 6% 5 10% 44 85% 522011 2 5% 3 7% 38 88% 432012 5 14% 3 8% 29 78% 372013 1 2% 3 7% 39 91% 432014 2 5% 1 2% 38 93% 41
Spelling
2009 8 14% 8 14% 42 72% 582010 1 2% 9 17% 43 81% 532011 1 2% 4 9% 38 88% 432012 2 5% 6 16% 29 78% 372013 2 5% 1 2% 40 93% 432014 1 2% 6 15% 34 83% 41
Writing (Persuasive)
2009 n/a n/a n/a n/a2010 n/a n/a n/a n/a2011 1 2% 1 2% 41 95% 432012 1 3% 5 14% 30 83% 362013 1 2% 4 9% 38 88% 432014 1 2% 3 7% 37 90% 41
Percentage of Students Achieving NMS (%)
Note: % Achieved includes students who were either At or Above NMS divided by the number of students participating in the test(including exempt students). The % Not Achieved NMS includes students who were Below NMS or Exempt from testing divided by thenumber of students participating in the test (including exempt students).
% Achieved NMS % Not Achieved NMS
17030 NAPLAN School Summary Report 2009 - 2014Last Refreshed: 30/01/2015
Refreshed by: sheila.delahay
NAPLAN Results 2009 - 2014Durack Primary SchoolNote: In 2011, students were required to complete a persuasive writing task. This is a change from previous years (2010 and prior) whenstudents were required to write a narrative or story. Due to this change in genre, post 2010 Writing results should not be compared to previousyears.
Students in Years 3, 5, 7 and 9 across Australia sit common tests in numeracy, reading, writing and language conventions (spelling, grammar and punctuation). The results from this assessment provide animportant measure of how all Australian students are performing in literacy and numeracy against national achievement bands.
Universe: NAPLAN school summary results
Page 1/3
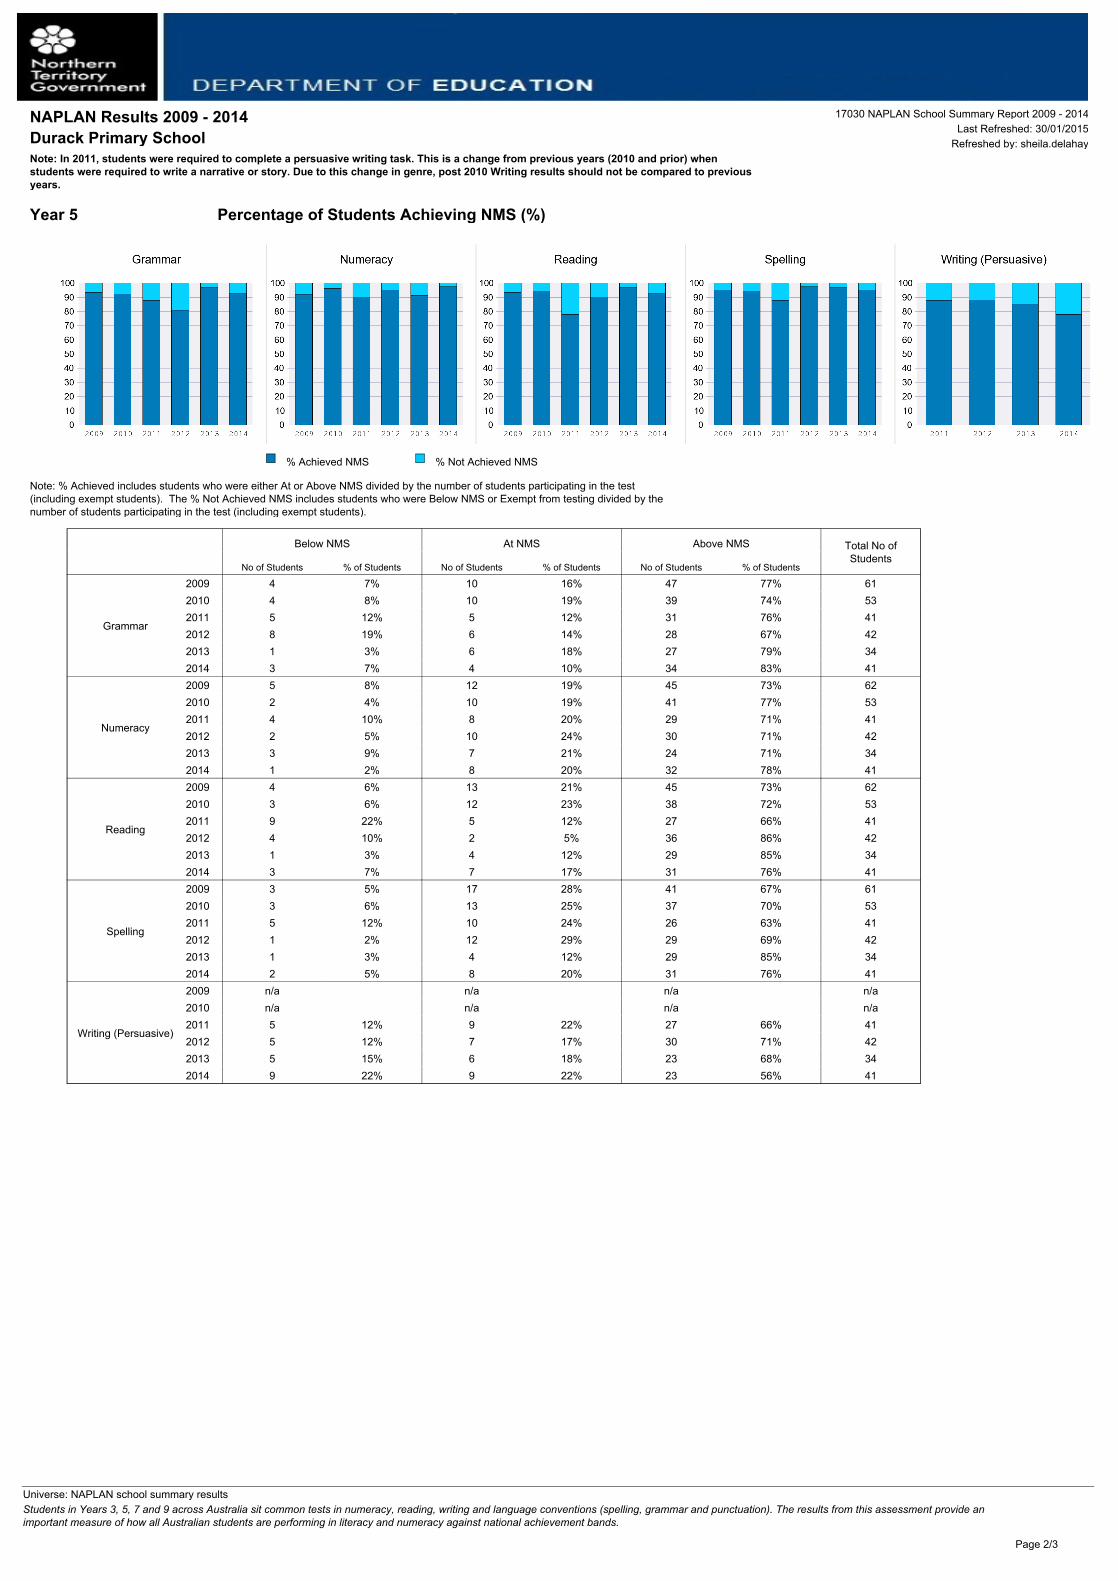
Year 5
Below NMS At NMS Above NMS Total No ofStudents
No of Students % of Students No of Students % of Students No of Students % of Students
Grammar
2009 4 7% 10 16% 47 77% 612010 4 8% 10 19% 39 74% 532011 5 12% 5 12% 31 76% 412012 8 19% 6 14% 28 67% 422013 1 3% 6 18% 27 79% 342014 3 7% 4 10% 34 83% 41
Numeracy
2009 5 8% 12 19% 45 73% 622010 2 4% 10 19% 41 77% 532011 4 10% 8 20% 29 71% 412012 2 5% 10 24% 30 71% 422013 3 9% 7 21% 24 71% 342014 1 2% 8 20% 32 78% 41
Reading
2009 4 6% 13 21% 45 73% 622010 3 6% 12 23% 38 72% 532011 9 22% 5 12% 27 66% 412012 4 10% 2 5% 36 86% 422013 1 3% 4 12% 29 85% 342014 3 7% 7 17% 31 76% 41
Spelling
2009 3 5% 17 28% 41 67% 612010 3 6% 13 25% 37 70% 532011 5 12% 10 24% 26 63% 412012 1 2% 12 29% 29 69% 422013 1 3% 4 12% 29 85% 342014 2 5% 8 20% 31 76% 41
Writing (Persuasive)
2009 n/a n/a n/a n/a2010 n/a n/a n/a n/a2011 5 12% 9 22% 27 66% 412012 5 12% 7 17% 30 71% 422013 5 15% 6 18% 23 68% 342014 9 22% 9 22% 23 56% 41
Percentage of Students Achieving NMS (%)
Note: % Achieved includes students who were either At or Above NMS divided by the number of students participating in the test(including exempt students). The % Not Achieved NMS includes students who were Below NMS or Exempt from testing divided by thenumber of students participating in the test (including exempt students).
% Achieved NMS % Not Achieved NMS
17030 NAPLAN School Summary Report 2009 - 2014Last Refreshed: 30/01/2015
Refreshed by: sheila.delahay
NAPLAN Results 2009 - 2014Durack Primary SchoolNote: In 2011, students were required to complete a persuasive writing task. This is a change from previous years (2010 and prior) whenstudents were required to write a narrative or story. Due to this change in genre, post 2010 Writing results should not be compared to previousyears.
Students in Years 3, 5, 7 and 9 across Australia sit common tests in numeracy, reading, writing and language conventions (spelling, grammar and punctuation). The results from this assessment provide animportant measure of how all Australian students are performing in literacy and numeracy against national achievement bands.
Universe: NAPLAN school summary results
Page 2/3
Year 7
Total No ofStudents
No of Students % of Students
Grammar
200920102011201220132014
Numeracy
200920102011201220132014
Reading
200920102011201220132014
Spelling
200920102011201220132014
Writing (Persuasive)
200920102011201220132014
Percentage of Students Achieving NMS (%)
Note: % Achieved includes students who were either At or Above NMS divided by the number of students participating in the test(including exempt students). The % Not Achieved NMS includes students who were Below NMS or Exempt from testing divided by thenumber of students participating in the test (including exempt students).
% Achieved NMS % Not Achieved NMS
17030 NAPLAN School Summary Report 2009 - 2014Last Refreshed: 30/01/2015
Refreshed by: sheila.delahay
NAPLAN Results 2009 - 2014Durack Primary SchoolNote: In 2011, students were required to complete a persuasive writing task. This is a change from previous years (2010 and prior) whenstudents were required to write a narrative or story. Due to this change in genre, post 2010 Writing results should not be compared to previousyears.
Students in Years 3, 5, 7 and 9 across Australia sit common tests in numeracy, reading, writing and language conventions (spelling, grammar and punctuation). The results from this assessment provide animportant measure of how all Australian students are performing in literacy and numeracy against national achievement bands.
Universe: NAPLAN school summary results
Page 3/3
17030 NAPLAN School Summary Report 2009 - 2014Last Refreshed: 30/01/2015
Refreshed by: sheila.delahay
Below NMS At NMS Above NMS Total Noof
StudentsNo of
Students% of
StudentsNo of
Students% of
StudentsNo of
Students% of
Students
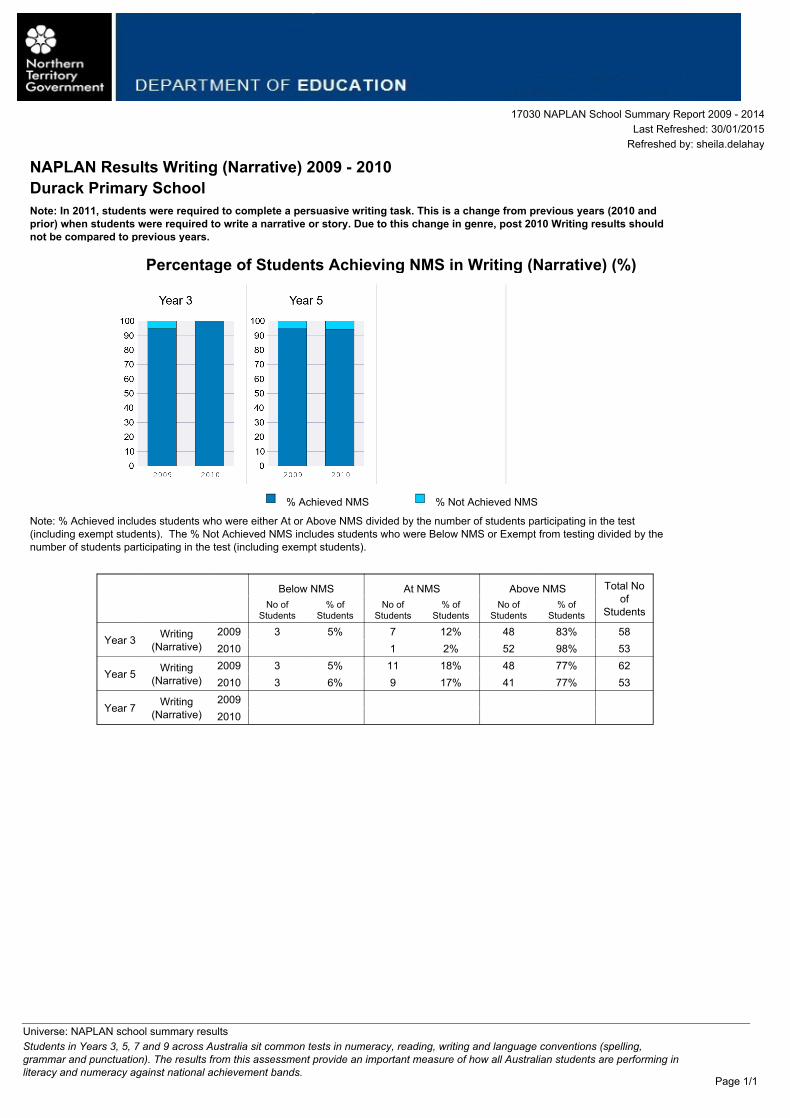
Year 3 Writing(Narrative)
2009 3 5% 7 12% 48 83% 582010 1 2% 52 98% 53
Year 5 Writing(Narrative)
2009 3 5% 11 18% 48 77% 622010 3 6% 9 17% 41 77% 53
Year 7 Writing(Narrative)
20092010
NAPLAN Results Writing (Narrative) 2009 - 2010Durack Primary SchoolNote: In 2011, students were required to complete a persuasive writing task. This is a change from previous years (2010 andprior) when students were required to write a narrative or story. Due to this change in genre, post 2010 Writing results shouldnot be compared to previous years.
Percentage of Students Achieving NMS in Writing (Narrative) (%)
Note: % Achieved includes students who were either At or Above NMS divided by the number of students participating in the test(including exempt students). The % Not Achieved NMS includes students who were Below NMS or Exempt from testing divided by thenumber of students participating in the test (including exempt students).
% Achieved NMS % Not Achieved NMS
Students in Years 3, 5, 7 and 9 across Australia sit common tests in numeracy, reading, writing and language conventions (spelling,grammar and punctuation). The results from this assessment provide an important measure of how all Australian students are performing inliteracy and numeracy against national achievement bands.
Universe: NAPLAN school summary results
Page 1/1
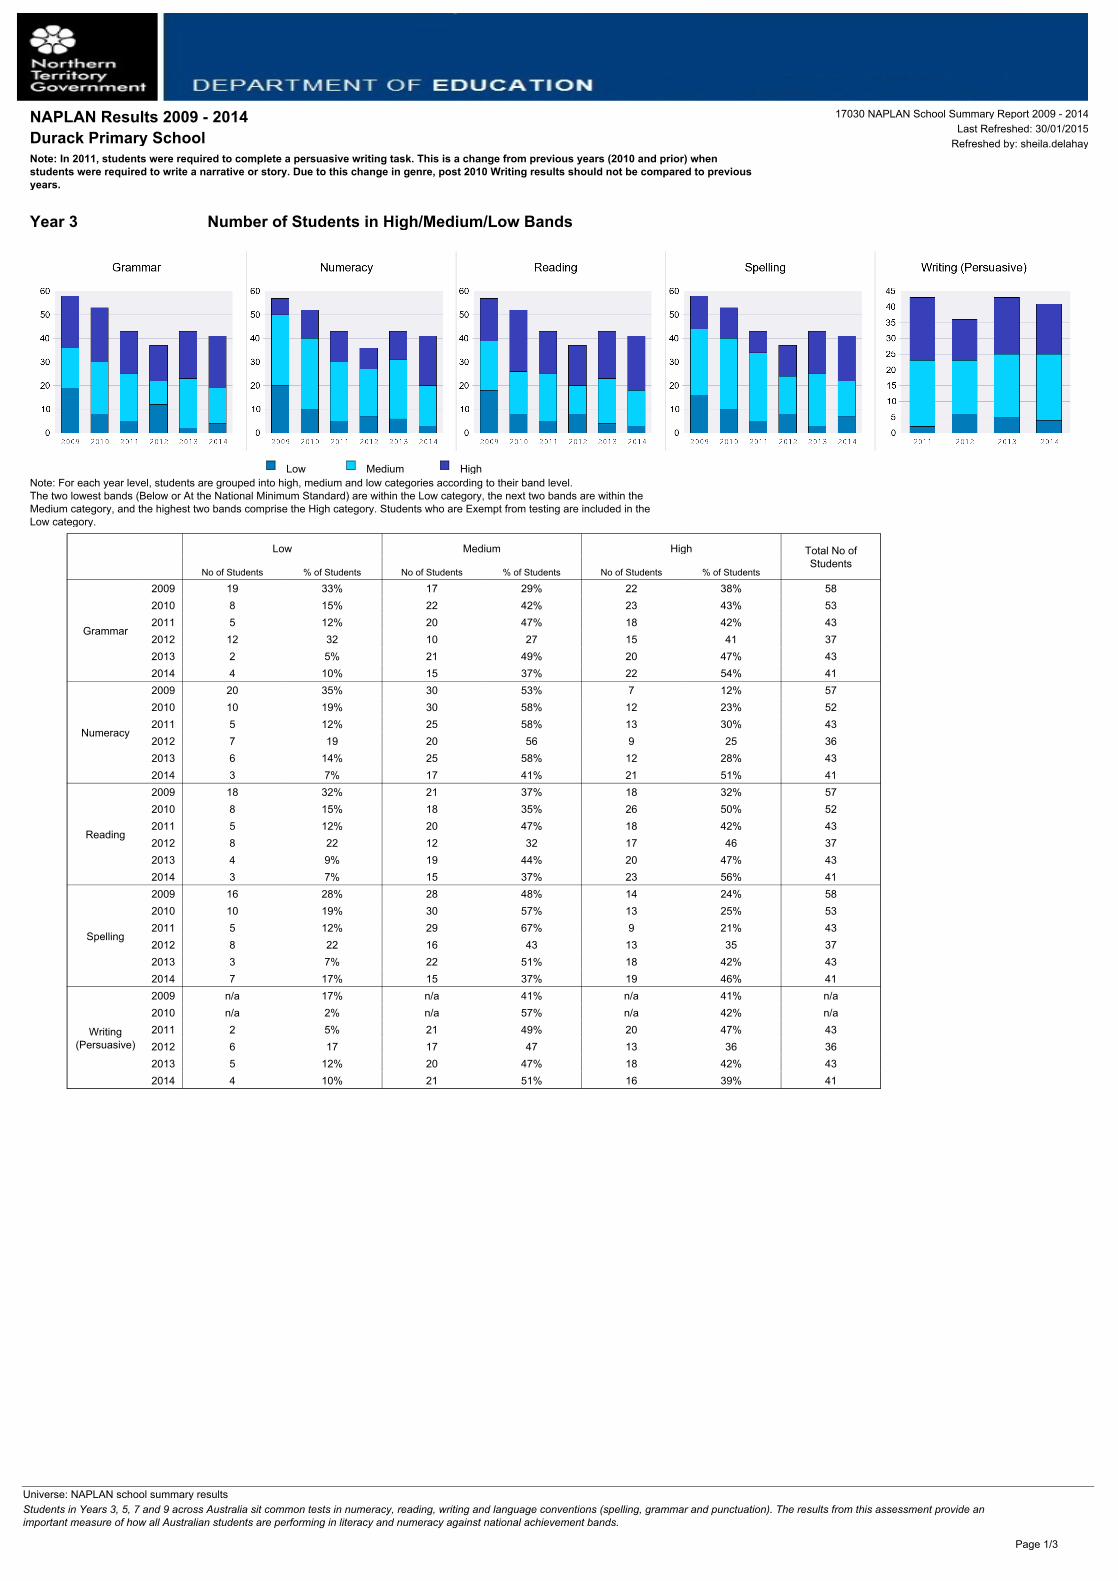
Year 3
Low Medium High Total No ofStudents
No of Students % of Students No of Students % of Students No of Students % of Students
Grammar
2009 19 33% 17 29% 22 38% 582010 8 15% 22 42% 23 43% 532011 5 12% 20 47% 18 42% 432012 12 32 10 27 15 41 372013 2 5% 21 49% 20 47% 432014 4 10% 15 37% 22 54% 41
Numeracy
2009 20 35% 30 53% 7 12% 572010 10 19% 30 58% 12 23% 522011 5 12% 25 58% 13 30% 432012 7 19 20 56 9 25 362013 6 14% 25 58% 12 28% 432014 3 7% 17 41% 21 51% 41
Reading
2009 18 32% 21 37% 18 32% 572010 8 15% 18 35% 26 50% 522011 5 12% 20 47% 18 42% 432012 8 22 12 32 17 46 372013 4 9% 19 44% 20 47% 432014 3 7% 15 37% 23 56% 41
Spelling
2009 16 28% 28 48% 14 24% 582010 10 19% 30 57% 13 25% 532011 5 12% 29 67% 9 21% 432012 8 22 16 43 13 35 372013 3 7% 22 51% 18 42% 432014 7 17% 15 37% 19 46% 41
Writing(Persuasive)
2009 n/a 17% n/a 41% n/a 41% n/a2010 n/a 2% n/a 57% n/a 42% n/a2011 2 5% 21 49% 20 47% 432012 6 17 17 47 13 36 362013 5 12% 20 47% 18 42% 432014 4 10% 21 51% 16 39% 41
Number of Students in High/Medium/Low Bands
Note: For each year level, students are grouped into high, medium and low categories according to their band level. The two lowest bands (Below or At the National Minimum Standard) are within the Low category, the next two bands are within theMedium category, and the highest two bands comprise the High category. Students who are Exempt from testing are included in theLow category.
Low Medium High
17030 NAPLAN School Summary Report 2009 - 2014Last Refreshed: 30/01/2015
Refreshed by: sheila.delahay
NAPLAN Results 2009 - 2014Durack Primary SchoolNote: In 2011, students were required to complete a persuasive writing task. This is a change from previous years (2010 and prior) whenstudents were required to write a narrative or story. Due to this change in genre, post 2010 Writing results should not be compared to previousyears.
Students in Years 3, 5, 7 and 9 across Australia sit common tests in numeracy, reading, writing and language conventions (spelling, grammar and punctuation). The results from this assessment provide animportant measure of how all Australian students are performing in literacy and numeracy against national achievement bands.
Universe: NAPLAN school summary results
Page 1/3
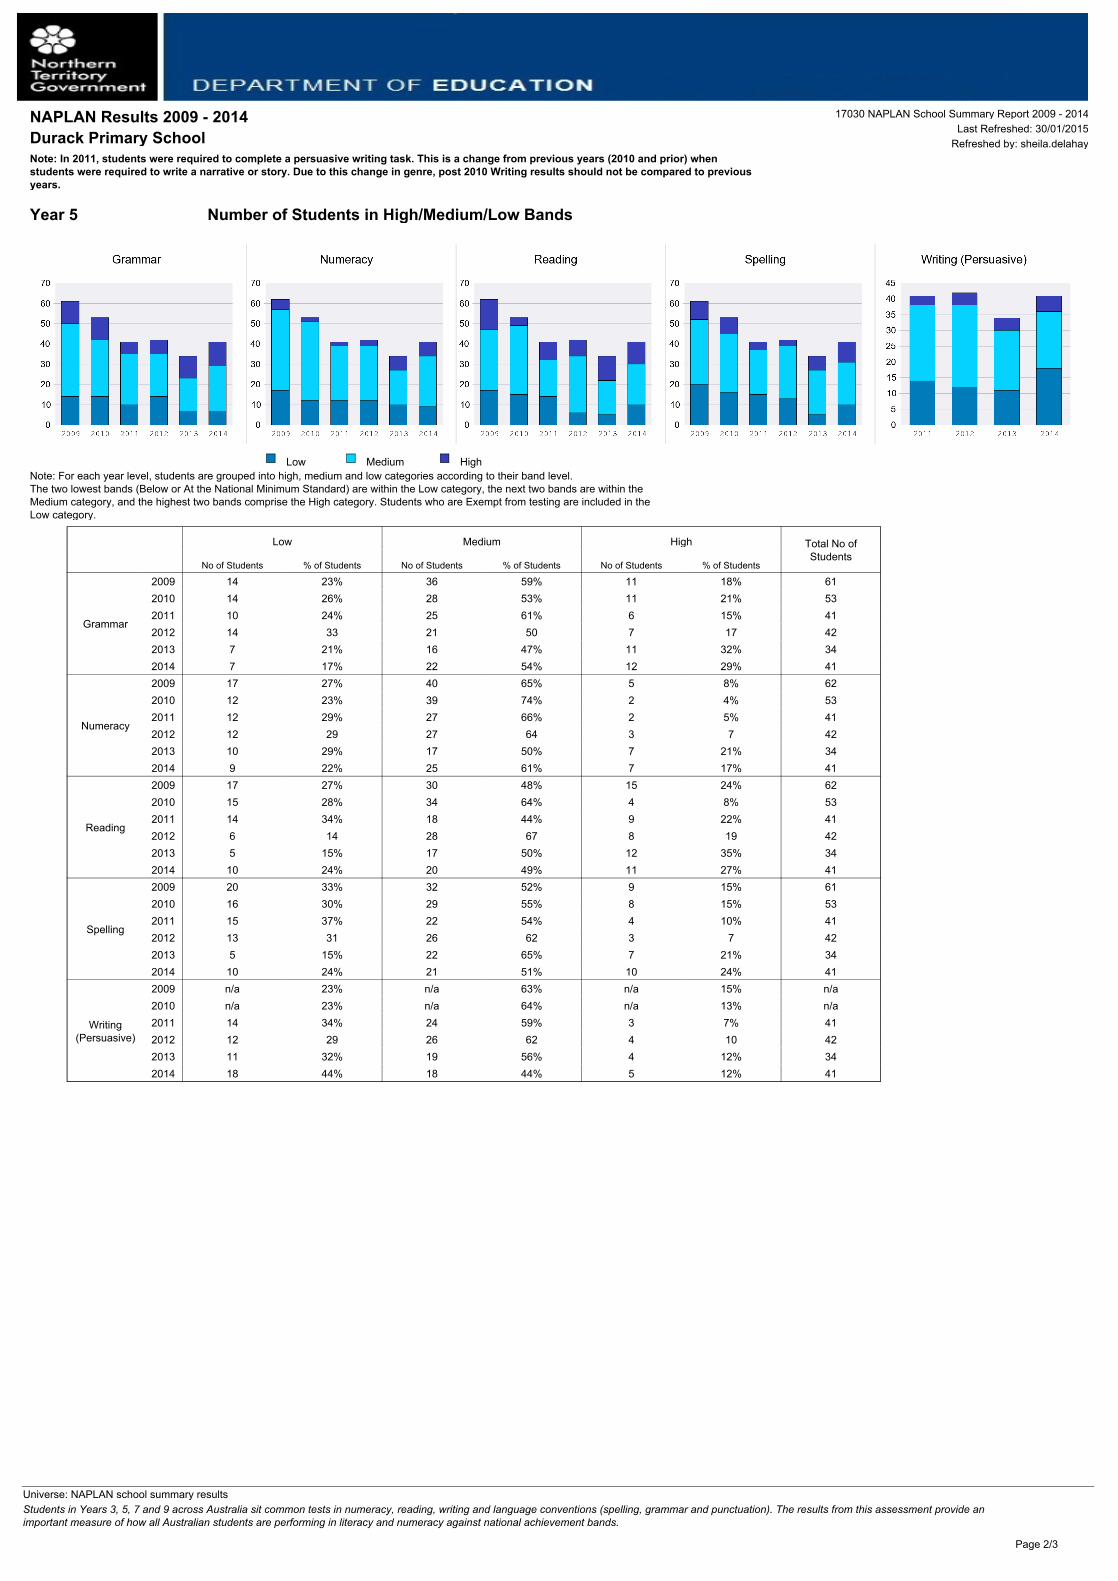
Year 5
Low Medium High Total No ofStudents
No of Students % of Students No of Students % of Students No of Students % of Students
Grammar
2009 14 23% 36 59% 11 18% 612010 14 26% 28 53% 11 21% 532011 10 24% 25 61% 6 15% 412012 14 33 21 50 7 17 422013 7 21% 16 47% 11 32% 342014 7 17% 22 54% 12 29% 41
Numeracy
2009 17 27% 40 65% 5 8% 622010 12 23% 39 74% 2 4% 532011 12 29% 27 66% 2 5% 412012 12 29 27 64 3 7 422013 10 29% 17 50% 7 21% 342014 9 22% 25 61% 7 17% 41
Reading
2009 17 27% 30 48% 15 24% 622010 15 28% 34 64% 4 8% 532011 14 34% 18 44% 9 22% 412012 6 14 28 67 8 19 422013 5 15% 17 50% 12 35% 342014 10 24% 20 49% 11 27% 41
Spelling
2009 20 33% 32 52% 9 15% 612010 16 30% 29 55% 8 15% 532011 15 37% 22 54% 4 10% 412012 13 31 26 62 3 7 422013 5 15% 22 65% 7 21% 342014 10 24% 21 51% 10 24% 41
Writing(Persuasive)
2009 n/a 23% n/a 63% n/a 15% n/a2010 n/a 23% n/a 64% n/a 13% n/a2011 14 34% 24 59% 3 7% 412012 12 29 26 62 4 10 422013 11 32% 19 56% 4 12% 342014 18 44% 18 44% 5 12% 41
Number of Students in High/Medium/Low Bands
Note: For each year level, students are grouped into high, medium and low categories according to their band level. The two lowest bands (Below or At the National Minimum Standard) are within the Low category, the next two bands are within theMedium category, and the highest two bands comprise the High category. Students who are Exempt from testing are included in theLow category.
Low Medium High
17030 NAPLAN School Summary Report 2009 - 2014Last Refreshed: 30/01/2015
Refreshed by: sheila.delahay
NAPLAN Results 2009 - 2014Durack Primary SchoolNote: In 2011, students were required to complete a persuasive writing task. This is a change from previous years (2010 and prior) whenstudents were required to write a narrative or story. Due to this change in genre, post 2010 Writing results should not be compared to previousyears.
Students in Years 3, 5, 7 and 9 across Australia sit common tests in numeracy, reading, writing and language conventions (spelling, grammar and punctuation). The results from this assessment provide animportant measure of how all Australian students are performing in literacy and numeracy against national achievement bands.
Universe: NAPLAN school summary results
Page 2/3
Year 7
Total No ofStudents
No of Students % of Students
Grammar
200920102011201220132014
Numeracy
200920102011201220132014
Reading
200920102011201220132014
Spelling
200920102011201220132014
Writing(Persuasive)
200920102011201220132014
Number of Students in High/Medium/Low Bands
Note: For each year level, students are grouped into high, medium and low categories according to their band level. The two lowest bands (Below or At the National Minimum Standard) are within the Low category, the next two bands are within theMedium category, and the highest two bands comprise the High category. Students who are Exempt from testing are included in theLow category.
Low Medium High
17030 NAPLAN School Summary Report 2009 - 2014Last Refreshed: 30/01/2015
Refreshed by: sheila.delahay
NAPLAN Results 2009 - 2014Durack Primary SchoolNote: In 2011, students were required to complete a persuasive writing task. This is a change from previous years (2010 and prior) whenstudents were required to write a narrative or story. Due to this change in genre, post 2010 Writing results should not be compared to previousyears.
Students in Years 3, 5, 7 and 9 across Australia sit common tests in numeracy, reading, writing and language conventions (spelling, grammar and punctuation). The results from this assessment provide animportant measure of how all Australian students are performing in literacy and numeracy against national achievement bands.
Universe: NAPLAN school summary results
Page 3/3
17030 NAPLAN School Summary Report 2009 - 2014Last Refreshed: 30/01/2015
Refreshed by: sheila.delahay
Low Medium High Total Noof
StudentsNo of
Students% of
StudentsNo of
Students% of
StudentsNo of
Students% of
Students
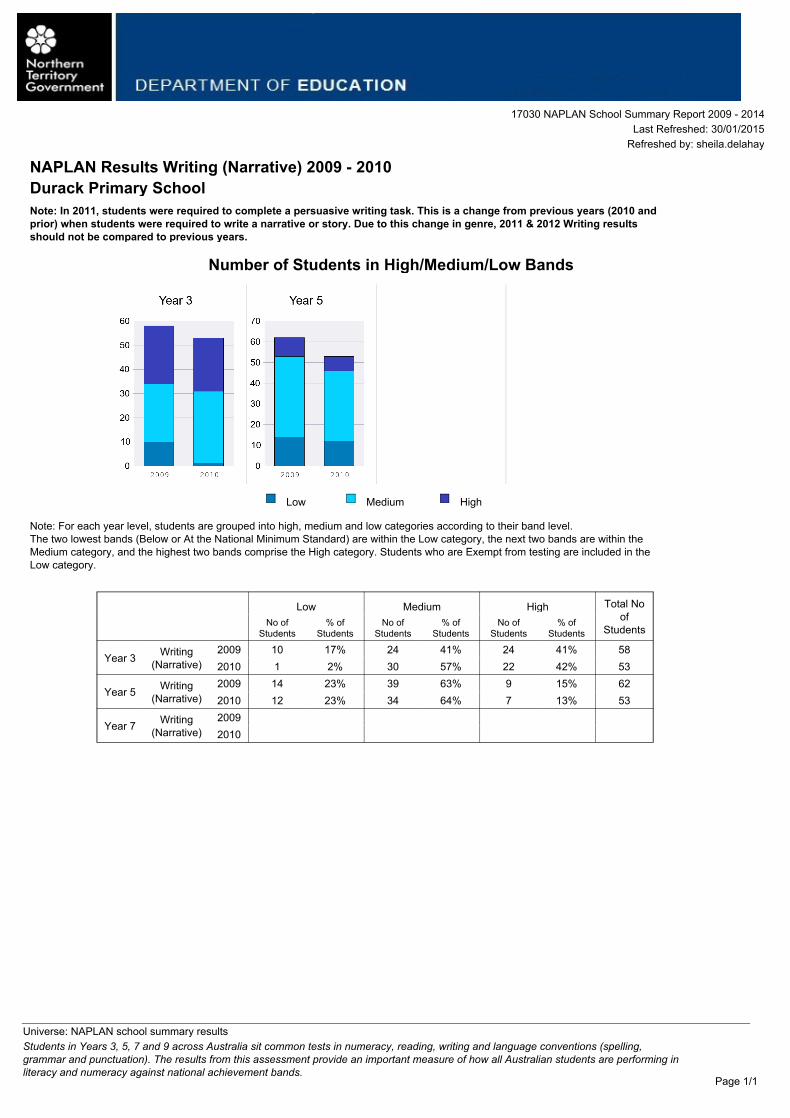
Year 3 Writing(Narrative)
2009 10 17% 24 41% 24 41% 582010 1 2% 30 57% 22 42% 53
Year 5 Writing(Narrative)
2009 14 23% 39 63% 9 15% 622010 12 23% 34 64% 7 13% 53
Year 7 Writing(Narrative)
20092010
NAPLAN Results Writing (Narrative) 2009 - 2010Durack Primary SchoolNote: In 2011, students were required to complete a persuasive writing task. This is a change from previous years (2010 andprior) when students were required to write a narrative or story. Due to this change in genre, 2011 & 2012 Writing resultsshould not be compared to previous years.
Number of Students in High/Medium/Low Bands
Note: For each year level, students are grouped into high, medium and low categories according to their band level. The two lowest bands (Below or At the National Minimum Standard) are within the Low category, the next two bands are within theMedium category, and the highest two bands comprise the High category. Students who are Exempt from testing are included in theLow category.
Low Medium High
Students in Years 3, 5, 7 and 9 across Australia sit common tests in numeracy, reading, writing and language conventions (spelling,grammar and punctuation). The results from this assessment provide an important measure of how all Australian students are performing inliteracy and numeracy against national achievement bands.
Universe: NAPLAN school summary results
Page 1/1
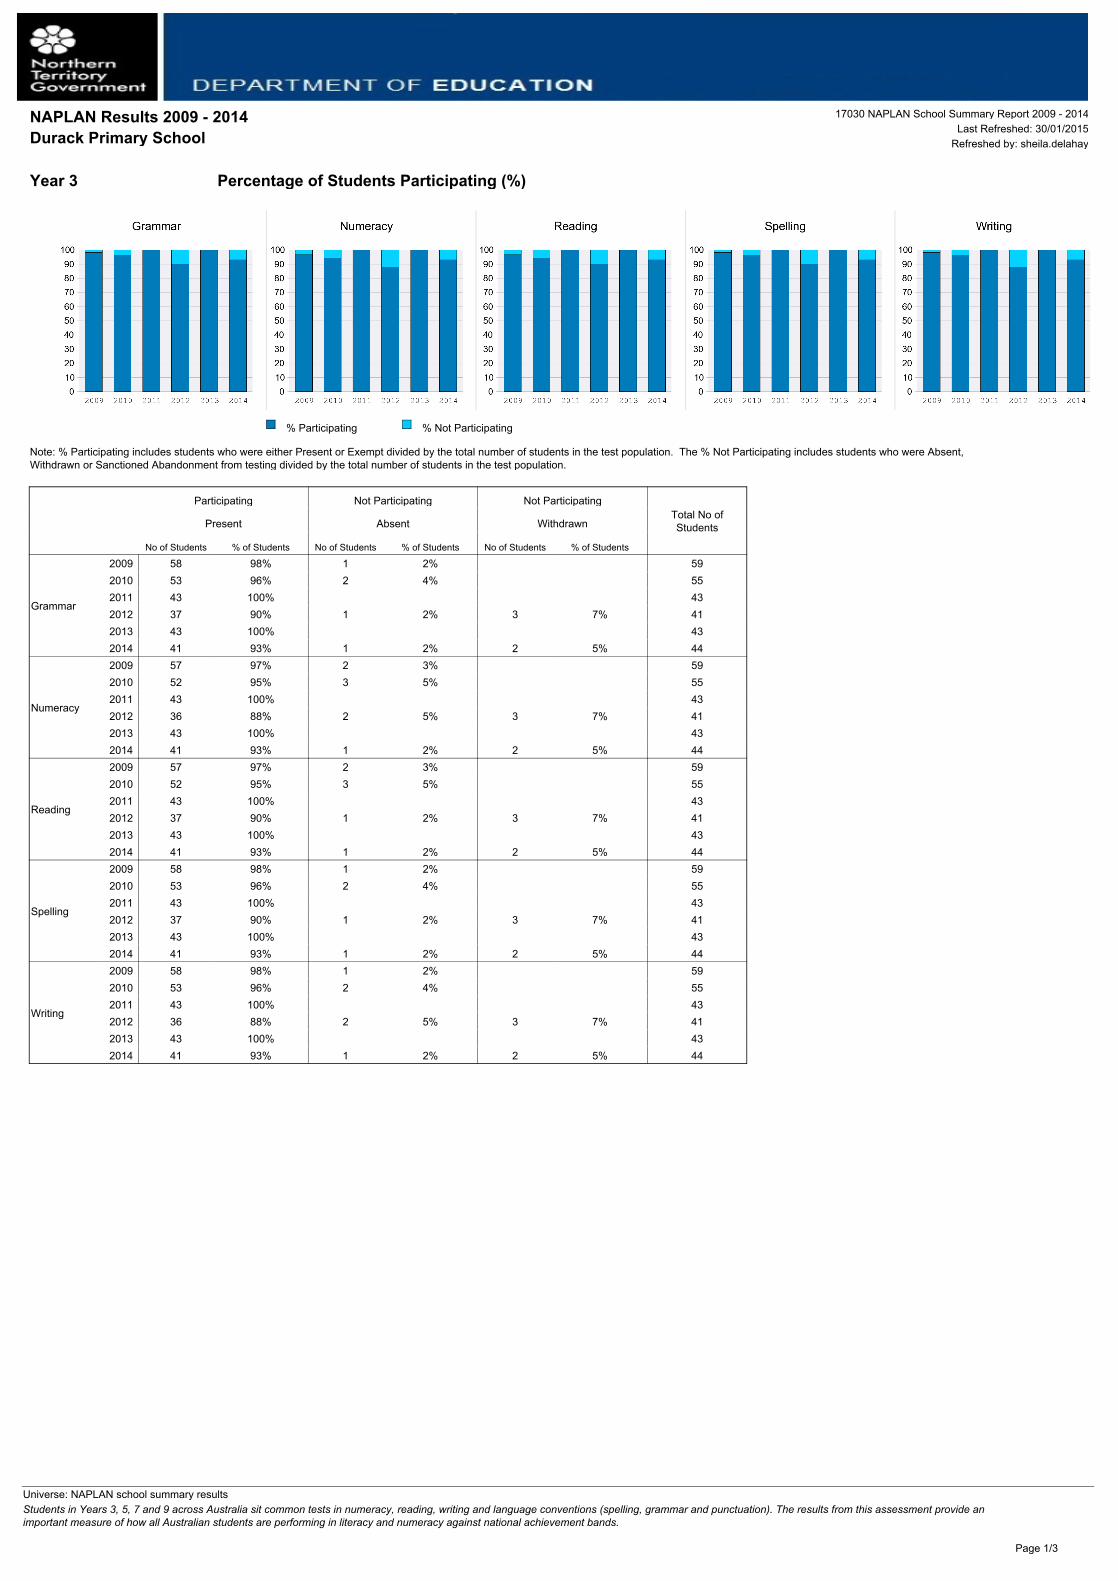
Year 3
Participating Not Participating Not ParticipatingTotal No ofStudentsPresent Absent Withdrawn
No of Students % of Students No of Students % of Students No of Students % of Students
Grammar
2009 58 98% 1 2% 592010 53 96% 2 4% 552011 43 100% 432012 37 90% 1 2% 3 7% 412013 43 100% 432014 41 93% 1 2% 2 5% 44
Numeracy
2009 57 97% 2 3% 592010 52 95% 3 5% 552011 43 100% 432012 36 88% 2 5% 3 7% 412013 43 100% 432014 41 93% 1 2% 2 5% 44
Reading
2009 57 97% 2 3% 592010 52 95% 3 5% 552011 43 100% 432012 37 90% 1 2% 3 7% 412013 43 100% 432014 41 93% 1 2% 2 5% 44
Spelling
2009 58 98% 1 2% 592010 53 96% 2 4% 552011 43 100% 432012 37 90% 1 2% 3 7% 412013 43 100% 432014 41 93% 1 2% 2 5% 44
Writing
2009 58 98% 1 2% 592010 53 96% 2 4% 552011 43 100% 432012 36 88% 2 5% 3 7% 412013 43 100% 432014 41 93% 1 2% 2 5% 44
Percentage of Students Participating (%)
Note: % Participating includes students who were either Present or Exempt divided by the total number of students in the test population. The % Not Participating includes students who were Absent,Withdrawn or Sanctioned Abandonment from testing divided by the total number of students in the test population.
% Participating % Not Participating
17030 NAPLAN School Summary Report 2009 - 2014Last Refreshed: 30/01/2015
Refreshed by: sheila.delahay
NAPLAN Results 2009 - 2014Durack Primary School
Students in Years 3, 5, 7 and 9 across Australia sit common tests in numeracy, reading, writing and language conventions (spelling, grammar and punctuation). The results from this assessment provide animportant measure of how all Australian students are performing in literacy and numeracy against national achievement bands.
Universe: NAPLAN school summary results
Page 1/3

Year 5
Participating Participating Not ParticipatingTotal No ofStudentsPresent Exempt Absent
No of Students % of Students No of Students % of Students No of Students % of Students
Grammar
2009 61 95% 3 5% 642010 53 100% 532011 40 98% 1 2% 412012 42 98% 1 2% 432013 34 94% 2 6% 362014 41 100% 41
Numeracy
2009 62 97% 2 3% 642010 53 100% 532011 40 98% 1 2% 412012 42 98% 1 2% 432013 34 94% 2 6% 362014 41 100% 41
Reading
2009 62 97% 2 3% 642010 53 100% 532011 40 98% 1 2% 412012 42 98% 1 2% 432013 34 94% 2 6% 362014 41 100% 41
Spelling
2009 61 95% 3 5% 642010 53 100% 532011 40 98% 1 2% 412012 42 98% 1 2% 432013 34 94% 2 6% 362014 41 100% 41
Writing
2009 62 97% 2 3% 642010 53 100% 532011 40 98% 1 2% 412012 42 98% 1 2% 432013 34 94% 2 6% 362014 41 100% 41
Percentage of Students Participating (%)
Note: % Participating includes students who were either Present or Exempt divided by the total number of students in the test population. The % Not Participating includes students who were Absent,Withdrawn or Sanctioned Abandonment from testing divided by the total number of students in the test population.
% Participating % Not Participating
17030 NAPLAN School Summary Report 2009 - 2014Last Refreshed: 30/01/2015
Refreshed by: sheila.delahay
NAPLAN Results 2009 - 2014Durack Primary School
Students in Years 3, 5, 7 and 9 across Australia sit common tests in numeracy, reading, writing and language conventions (spelling, grammar and punctuation). The results from this assessment provide animportant measure of how all Australian students are performing in literacy and numeracy against national achievement bands.
Universe: NAPLAN school summary results
Page 2/3
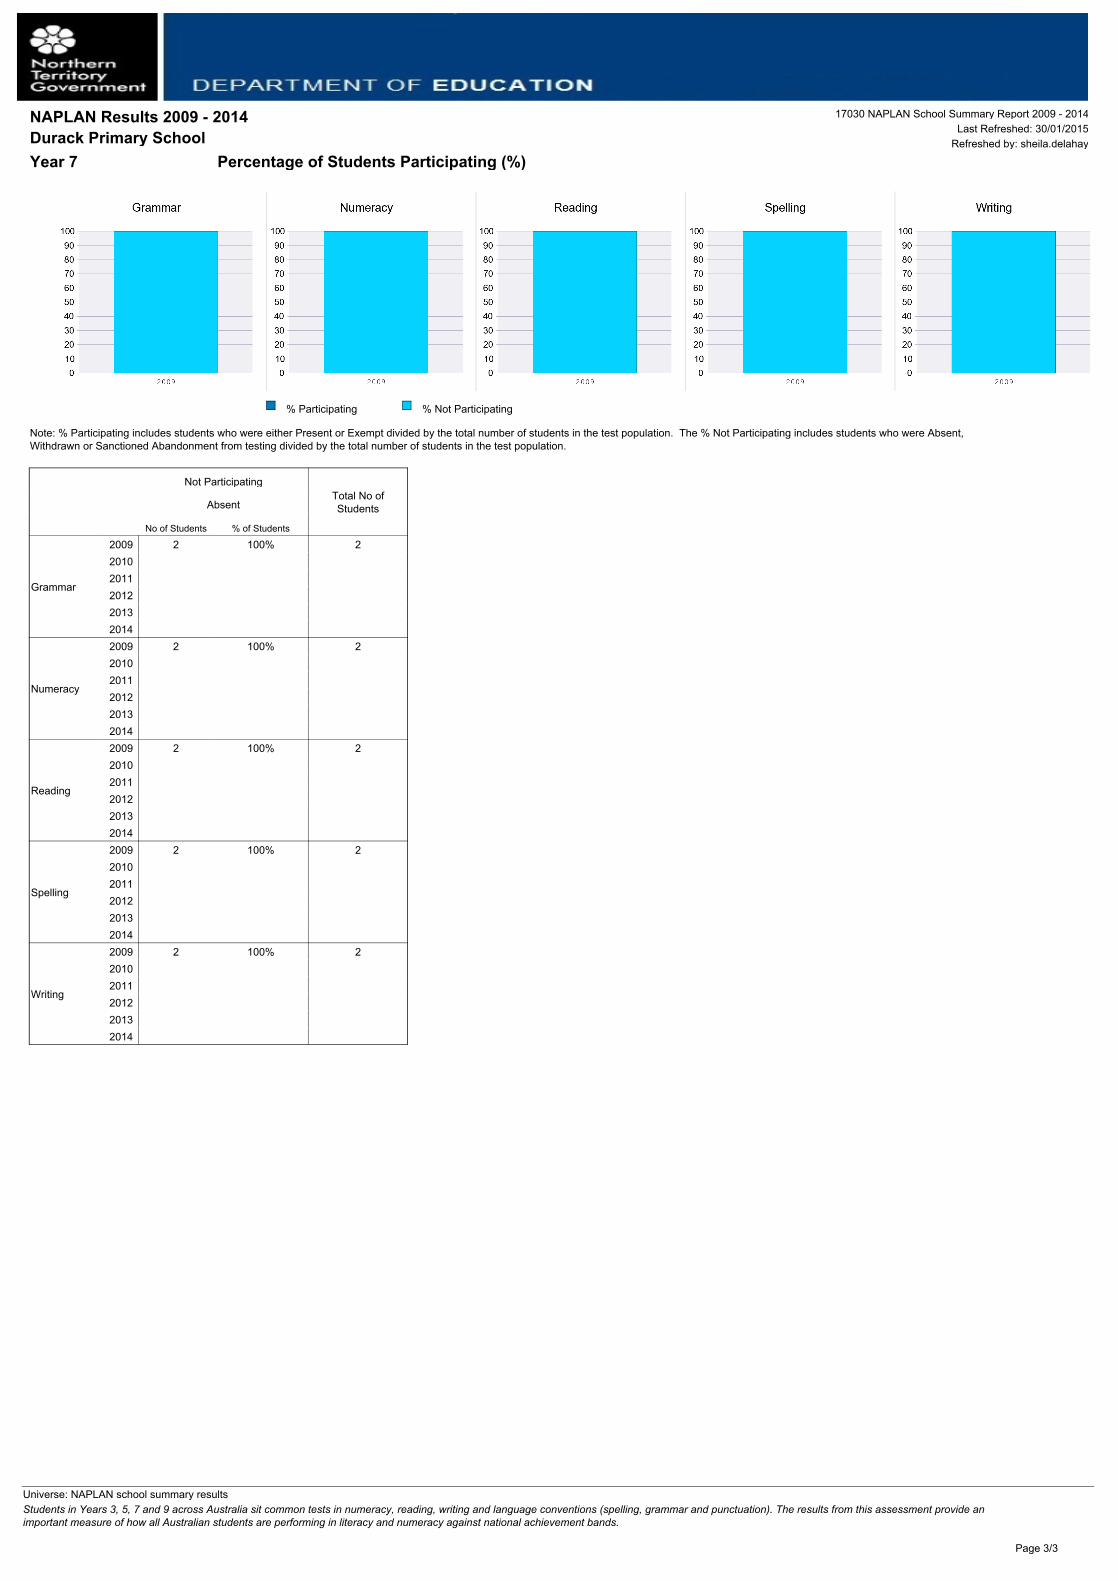
Year 7
Not ParticipatingTotal No ofStudentsAbsent
No of Students % of Students
Grammar
2009 2 100% 220102011201220132014
Numeracy
2009 2 100% 220102011201220132014
Reading
2009 2 100% 220102011201220132014
Spelling
2009 2 100% 220102011201220132014
Writing
2009 2 100% 220102011201220132014
Percentage of Students Participating (%)
Note: % Participating includes students who were either Present or Exempt divided by the total number of students in the test population. The % Not Participating includes students who were Absent,Withdrawn or Sanctioned Abandonment from testing divided by the total number of students in the test population.
% Participating % Not Participating
17030 NAPLAN School Summary Report 2009 - 2014Last Refreshed: 30/01/2015
Refreshed by: sheila.delahay
NAPLAN Results 2009 - 2014Durack Primary School
Students in Years 3, 5, 7 and 9 across Australia sit common tests in numeracy, reading, writing and language conventions (spelling, grammar and punctuation). The results from this assessment provide animportant measure of how all Australian students are performing in literacy and numeracy against national achievement bands.
Universe: NAPLAN school summary results
Page 3/3