Embed Size (px)
Citation preview
S1
Supporting Information for
Naphthoxaphospholes as examples of fluorescent phospha-acenes
Feng Li Laughlin,a Arnold L. Rheingold,
b Nihal Deligonul,
a Brynna Laughlin,
c Lee J. Higham,
d and
John D. Protasiewicz*a
Syntheses and NMR Properties
Compounds 1 and 2 were prepared using slight modifications of reported procedures (Dhawan, B.; Redmore, D. J. Org. Chem. 1984, 49, 4018, Dhawan, B.; Redmore, D. J. Org. Chem. 1991, 56, 833.).
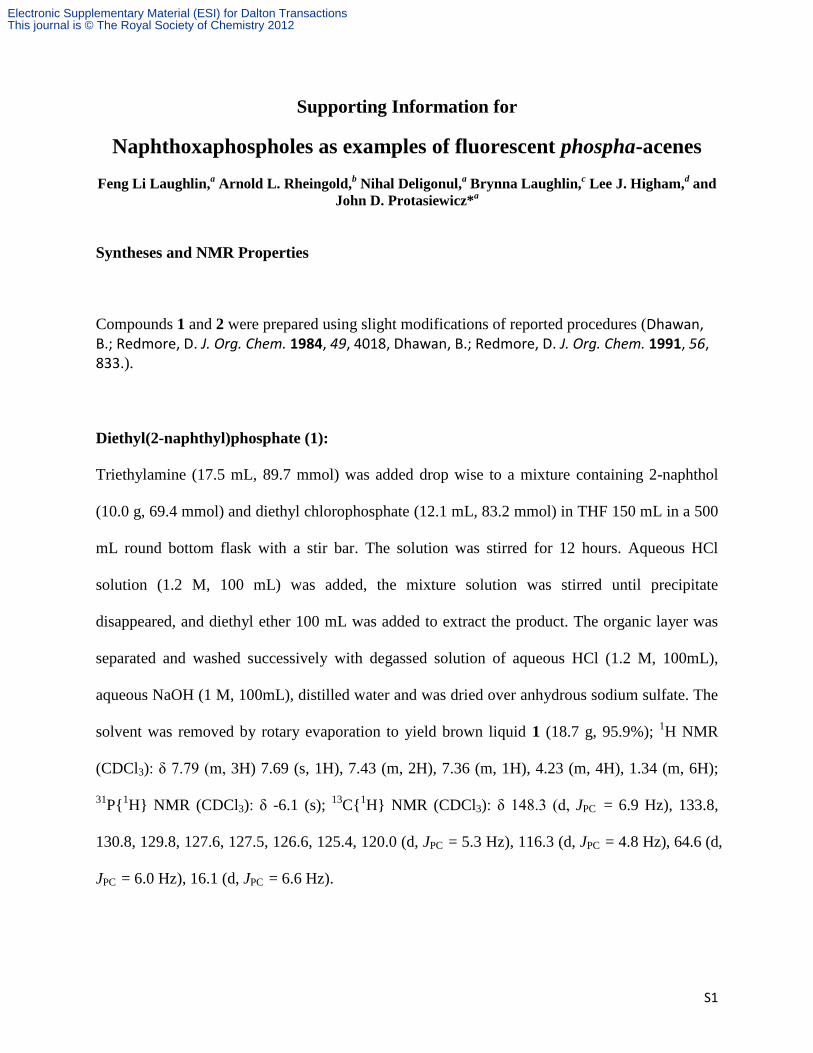
Diethyl(2-naphthyl)phosphate (1):
Triethylamine (17.5 mL, 89.7 mmol) was added drop wise to a mixture containing 2-naphthol
(10.0 g, 69.4 mmol) and diethyl chlorophosphate (12.1 mL, 83.2 mmol) in THF 150 mL in a 500
mL round bottom flask with a stir bar. The solution was stirred for 12 hours. Aqueous HCl
solution (1.2 M, 100 mL) was added, the mixture solution was stirred until precipitate
disappeared, and diethyl ether 100 mL was added to extract the product. The organic layer was
separated and washed successively with degassed solution of aqueous HCl (1.2 M, 100mL),
aqueous NaOH (1 M, 100mL), distilled water and was dried over anhydrous sodium sulfate. The
solvent was removed by rotary evaporation to yield brown liquid 1 (18.7 g, 95.9%); 1H NMR
(CDCl3): δ 7.79 (m, 3H) 7.69 (s, 1H), 7.43 (m, 2H), 7.36 (m, 1H), 4.23 (m, 4H), 1.34 (m, 6H);
31P{
1H} NMR (CDCl3): δ -6.1 (s);
13C{
1H} NMR (CDCl3): δ 148.3 (d, JPC = 6.9 Hz), 133.8,
130.8, 129.8, 127.6, 127.5, 126.6, 125.4, 120.0 (d, JPC = 5.3 Hz), 116.3 (d, JPC = 4.8 Hz), 64.6 (d,
JPC = 6.0 Hz), 16.1 (d, JPC = 6.6 Hz).
Electronic Supplementary Material (ESI) for Dalton TransactionsThis journal is © The Royal Society of Chemistry 2012
S2
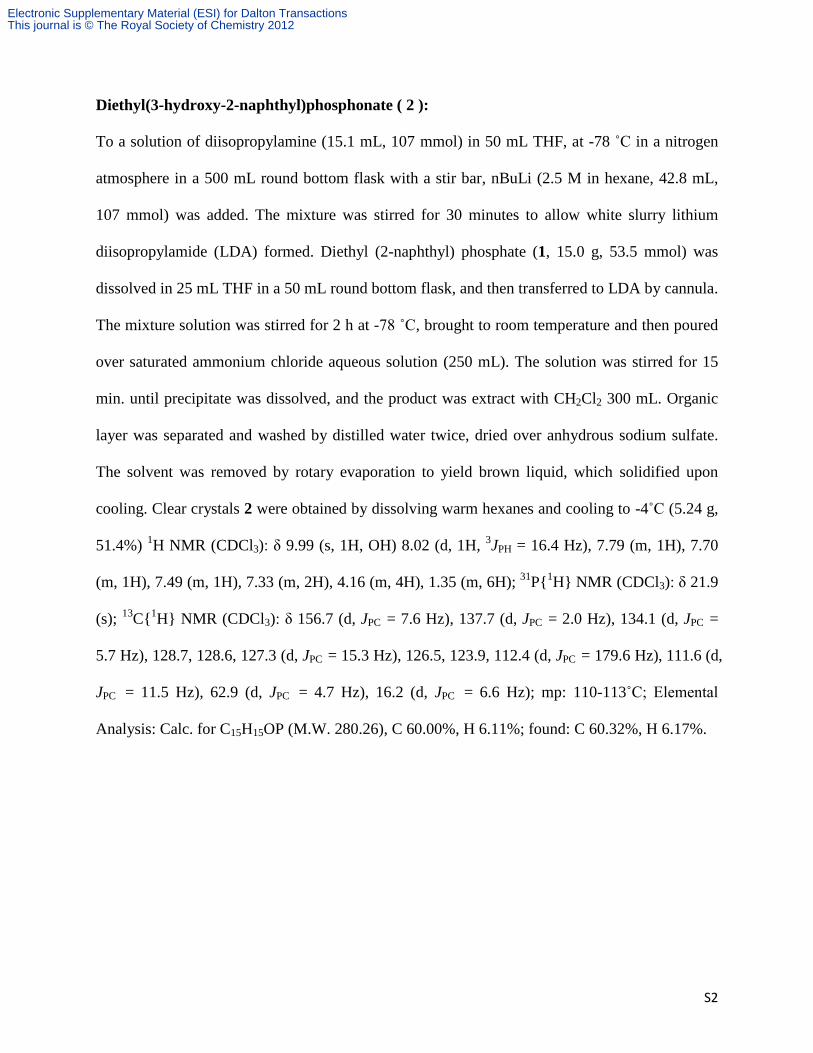
Diethyl(3-hydroxy-2-naphthyl)phosphonate ( 2 ):
To a solution of diisopropylamine (15.1 mL, 107 mmol) in 50 mL THF, at -78 ˚С in a nitrogen
atmosphere in a 500 mL round bottom flask with a stir bar, nBuLi (2.5 M in hexane, 42.8 mL,
107 mmol) was added. The mixture was stirred for 30 minutes to allow white slurry lithium
diisopropylamide (LDA) formed. Diethyl (2-naphthyl) phosphate (1, 15.0 g, 53.5 mmol) was
dissolved in 25 mL THF in a 50 mL round bottom flask, and then transferred to LDA by cannula.
The mixture solution was stirred for 2 h at -78 ˚С, brought to room temperature and then poured
over saturated ammonium chloride aqueous solution (250 mL). The solution was stirred for 15
min. until precipitate was dissolved, and the product was extract with CH2Cl2 300 mL. Organic
layer was separated and washed by distilled water twice, dried over anhydrous sodium sulfate.
The solvent was removed by rotary evaporation to yield brown liquid, which solidified upon
cooling. Clear crystals 2 were obtained by dissolving warm hexanes and cooling to -4˚С (5.24 g,
51.4%) 1H NMR (CDCl3): δ 9.99 (s, 1H, OH) 8.02 (d, 1H,
3JPH = 16.4 Hz), 7.79 (m, 1H), 7.70
(m, 1H), 7.49 (m, 1H), 7.33 (m, 2H), 4.16 (m, 4H), 1.35 (m, 6H); 31
P{1H} NMR (CDCl3): δ 21.9
(s); 13
C{1H} NMR (CDCl3): δ 156.7 (d, JPC = 7.6 Hz), 137.7 (d, JPC = 2.0 Hz), 134.1 (d, JPC =
5.7 Hz), 128.7, 128.6, 127.3 (d, JPC = 15.3 Hz), 126.5, 123.9, 112.4 (d, JPC = 179.6 Hz), 111.6 (d,
JPC = 11.5 Hz), 62.9 (d, JPC = 4.7 Hz), 16.2 (d, JPC = 6.6 Hz); mp: 110-113˚С; Elemental
Analysis: Calc. for C15H15OP (M.W. 280.26), C 60.00%, H 6.11%; found: C 60.32%, H 6.17%.
Electronic Supplementary Material (ESI) for Dalton TransactionsThis journal is © The Royal Society of Chemistry 2012
S3
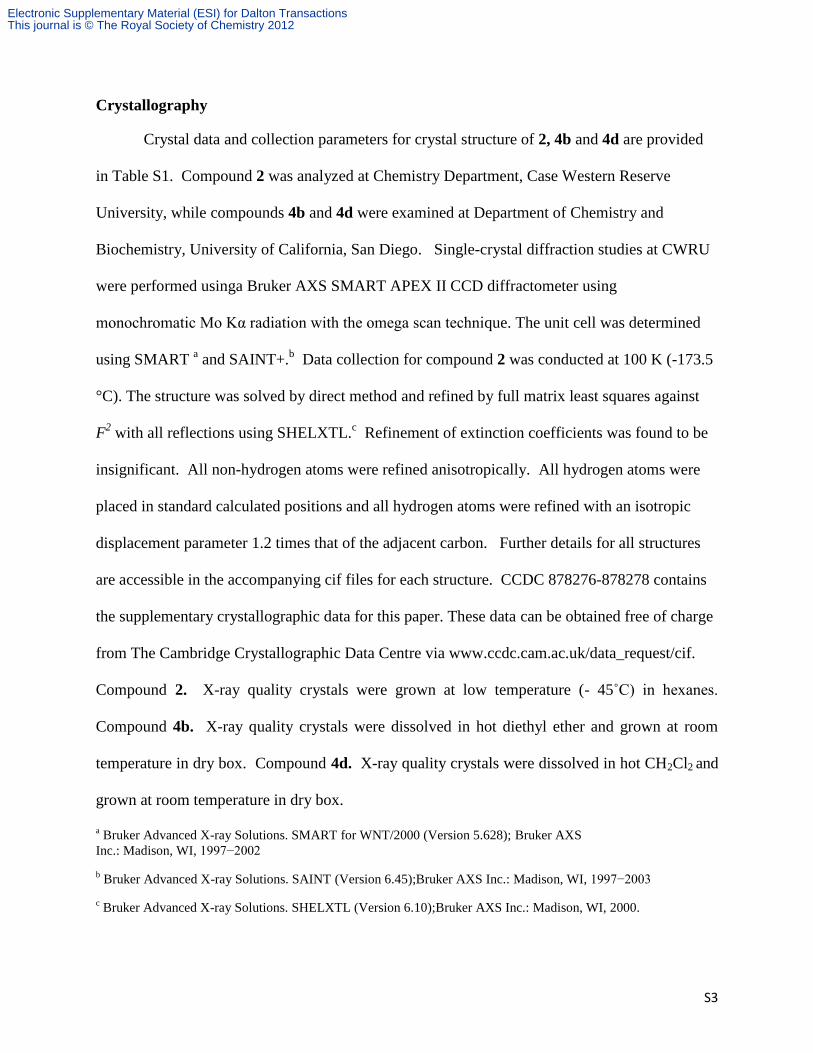
Crystallography
Crystal data and collection parameters for crystal structure of 2, 4b and 4d are provided
in Table S1. Compound 2 was analyzed at Chemistry Department, Case Western Reserve
University, while compounds 4b and 4d were examined at Department of Chemistry and
Biochemistry, University of California, San Diego. Single-crystal diffraction studies at CWRU
were performed usinga Bruker AXS SMART APEX II CCD diffractometer using
monochromatic Mo Kα radiation with the omega scan technique. The unit cell was determined
using SMART a and SAINT+.
b Data collection for compound 2 was conducted at 100 K (-173.5
°C). The structure was solved by direct method and refined by full matrix least squares against
F2 with all reflections using SHELXTL.
c Refinement of extinction coefficients was found to be
insignificant. All non-hydrogen atoms were refined anisotropically. All hydrogen atoms were
placed in standard calculated positions and all hydrogen atoms were refined with an isotropic
displacement parameter 1.2 times that of the adjacent carbon. Further details for all structures
are accessible in the accompanying cif files for each structure. CCDC 878276-878278 contains
the supplementary crystallographic data for this paper. These data can be obtained free of charge
from The Cambridge Crystallographic Data Centre via www.ccdc.cam.ac.uk/data_request/cif.
Compound 2. X-ray quality crystals were grown at low temperature (- 45˚С) in hexanes.
Compound 4b. X-ray quality crystals were dissolved in hot diethyl ether and grown at room
temperature in dry box. Compound 4d. X-ray quality crystals were dissolved in hot CH2Cl2 and
grown at room temperature in dry box.
a Bruker Advanced X-ray Solutions. SMART for WNT/2000 (Version 5.628); Bruker AXS
Inc.: Madison, WI, 1997−2002
b Bruker Advanced X-ray Solutions. SAINT (Version 6.45);Bruker AXS Inc.: Madison, WI, 1997−2003
c Bruker Advanced X-ray Solutions. SHELXTL (Version 6.10);Bruker AXS Inc.: Madison, WI, 2000.
Electronic Supplementary Material (ESI) for Dalton TransactionsThis journal is © The Royal Society of Chemistry 2012
S4
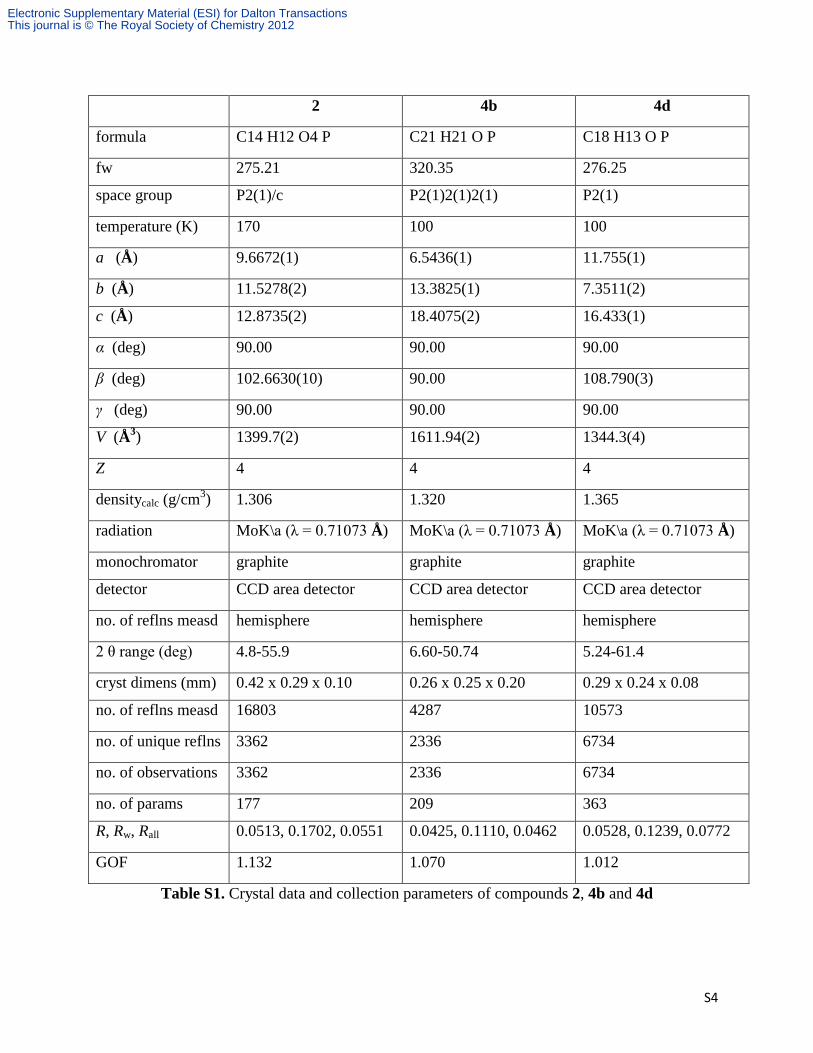
2 4b 4d
formula C14 H12 O4 P C21 H21 O P C18 H13 O P
fw 275.21 320.35 276.25
space group P2(1)/c P2(1)2(1)2(1) P2(1)
temperature (K) 170 100 100
a (Å) 9.6672(1) 6.5436(1) 11.755(1)
b (Å) 11.5278(2) 13.3825(1) 7.3511(2)
c (Å) 12.8735(2) 18.4075(2) 16.433(1)
α (deg) 90.00 90.00 90.00
β (deg) 102.6630(10) 90.00 108.790(3)
γ (deg) 90.00 90.00 90.00
V (Å3) 1399.7(2) 1611.94(2) 1344.3(4)
Z 4 4 4
densitycalc (g/cm3) 1.306 1.320 1.365
radiation MoK\a (λ = 0.71073 Å) MoK\a (λ = 0.71073 Å) MoK\a (λ = 0.71073 Å)
monochromator graphite graphite graphite
detector CCD area detector CCD area detector CCD area detector
no. of reflns measd hemisphere hemisphere hemisphere
2 θ range (deg) 4.8-55.9 6.60-50.74 5.24-61.4
cryst dimens (mm) 0.42 x 0.29 x 0.10 0.26 x 0.25 x 0.20 0.29 x 0.24 x 0.08
no. of reflns measd 16803 4287 10573
no. of unique reflns 3362 2336 6734
no. of observations 3362 2336 6734
no. of params 177 209 363
R, Rw, Rall 0.0513, 0.1702, 0.0551 0.0425, 0.1110, 0.0462 0.0528, 0.1239, 0.0772
GOF 1.132 1.070 1.012
Table S1. Crystal data and collection parameters of compounds 2, 4b and 4d
Electronic Supplementary Material (ESI) for Dalton TransactionsThis journal is © The Royal Society of Chemistry 2012
S5
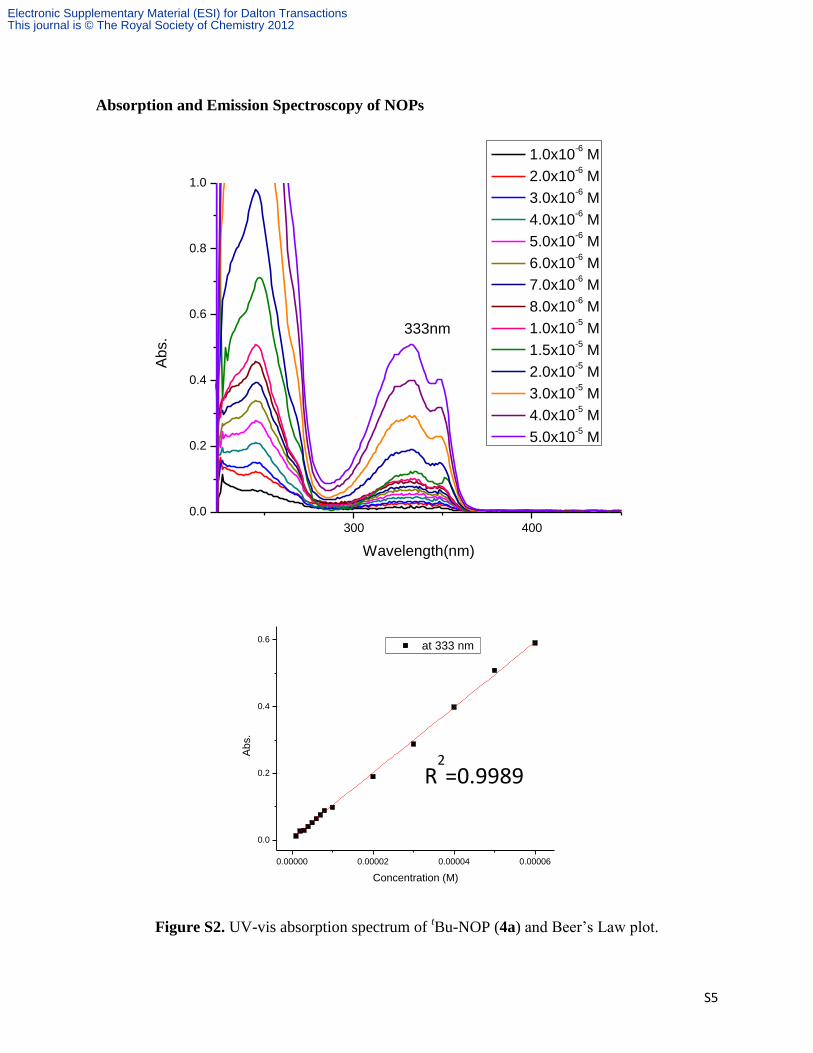
Absorption and Emission Spectroscopy of NOPs
300 400
0.0
0.2
0.4
0.6
0.8
1.0
Ab
s.
Wavelength(nm)
1.0x10⁻⁶ M
2.0x10⁻⁶ M
3.0x10⁻⁶ M
4.0x10⁻⁶ M
5.0x10⁻⁶ M
6.0x10⁻⁶ M
7.0x10⁻⁶ M
8.0x10⁻⁶ M
1.0x10⁻⁵ M
1.5x10⁻⁵ M
2.0x10⁻⁵ M
3.0x10⁻⁵ M
4.0x10⁻⁵ M
5.0x10⁻⁵ M
333nm
Figure S2. UV-vis absorption spectrum of tBu-NOP (4a) and Beer’s Law plot.
0.00000 0.00002 0.00004 0.00006
0.0
0.2
0.4
0.6
Ab
s.
Concentration (M)
at 333 nm
R2=0.9989
Electronic Supplementary Material (ESI) for Dalton TransactionsThis journal is © The Royal Society of Chemistry 2012
S6
300 400
0.0
0.2
0.4
0.6
0.8
1.0 1.0x10
-6 M
2.0x10⁻⁶ M
3.0x10⁻⁶ M
4.0x10⁻⁶ M
5.0x10⁻⁶ M
6.0x10⁻⁶ M
7.0x10⁻⁶ M
8.0x10⁻⁶ M
1.0x10⁻⁵ M
1.5x10⁻⁵ M
2.0x10⁻⁵ M
Ab
s.
Wavelength(nm)
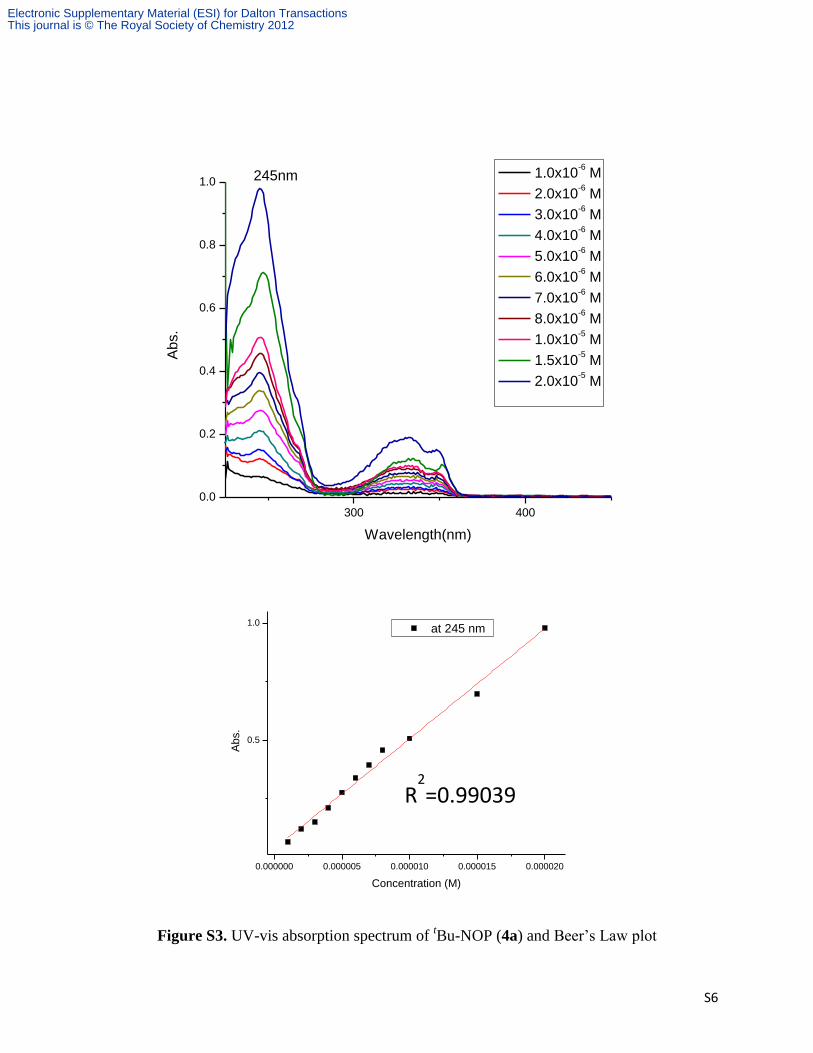
245nm
Figure S3. UV-vis absorption spectrum of tBu-NOP (4a) and Beer’s Law plot
0.000000 0.000005 0.000010 0.000015 0.000020
0.5
1.0
Ab
s.
Concentration (M)
at 245 nm
R2=0.99039
Electronic Supplementary Material (ESI) for Dalton TransactionsThis journal is © The Royal Society of Chemistry 2012
S7
0.000002 0.000004 0.000006 0.000008
0.1
0.2
0.3
0.4
Ab
s.
Concentration (M)
at 246 nm
0.000002 0.000004 0.000006 0.000008
0.02
0.04
0.06
0.08
Ab
s.
Concentration (M)
at 333 nm
0.000002 0.000004 0.000006 0.000008
0.02
0.04
0.06
Ab
s.
Concentration (M)
at 348 nm
300 400
0.0
0.1
0.2
0.3
0.4
0.5
1.0 x10⁻⁶ M
2.0 x10⁻⁶ M
3.0 x10⁻⁶ M
4.0 x10⁻⁶ M
5.0 x10⁻⁶ M
6.0 x10⁻⁶ M
7.0 x10⁻⁶ M
8.0 x10⁻⁶ M
Ab
s.
Wavelength(nm)
246nm
333nm
348nm
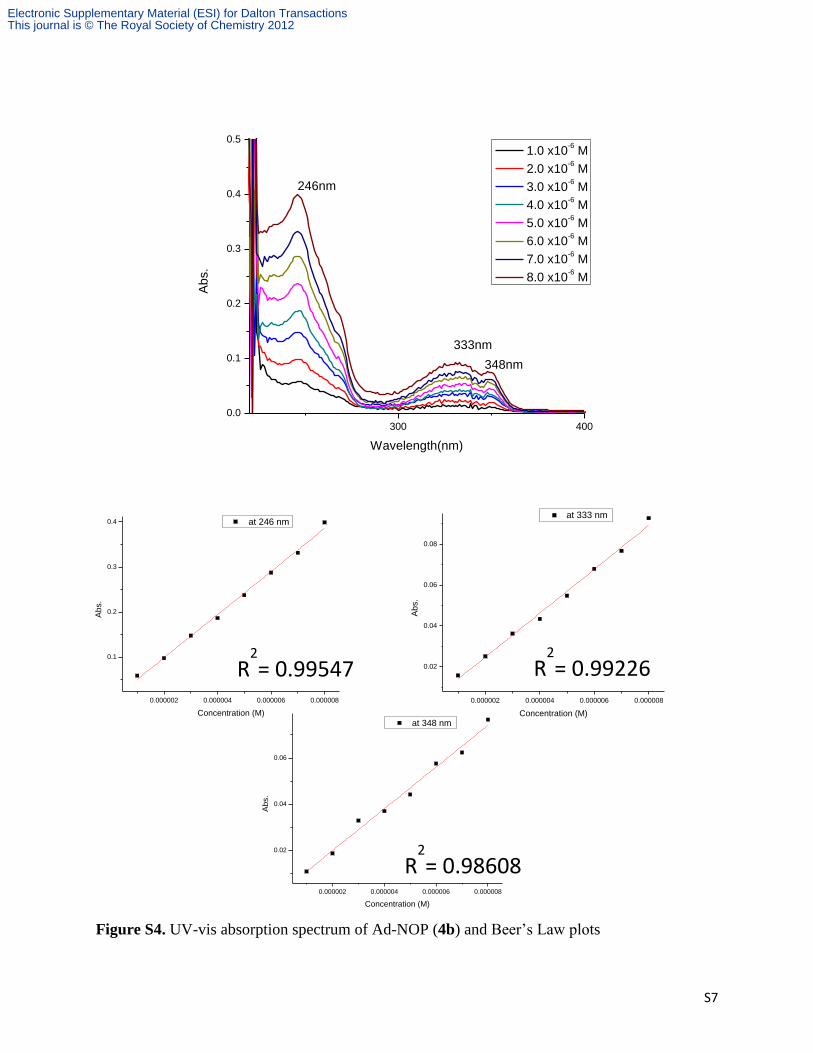
Figure S4. UV-vis absorption spectrum of Ad-NOP (4b) and Beer’s Law plots
R2= 0.99547 R
2= 0.99226
R2= 0.98608
Electronic Supplementary Material (ESI) for Dalton TransactionsThis journal is © The Royal Society of Chemistry 2012
S8
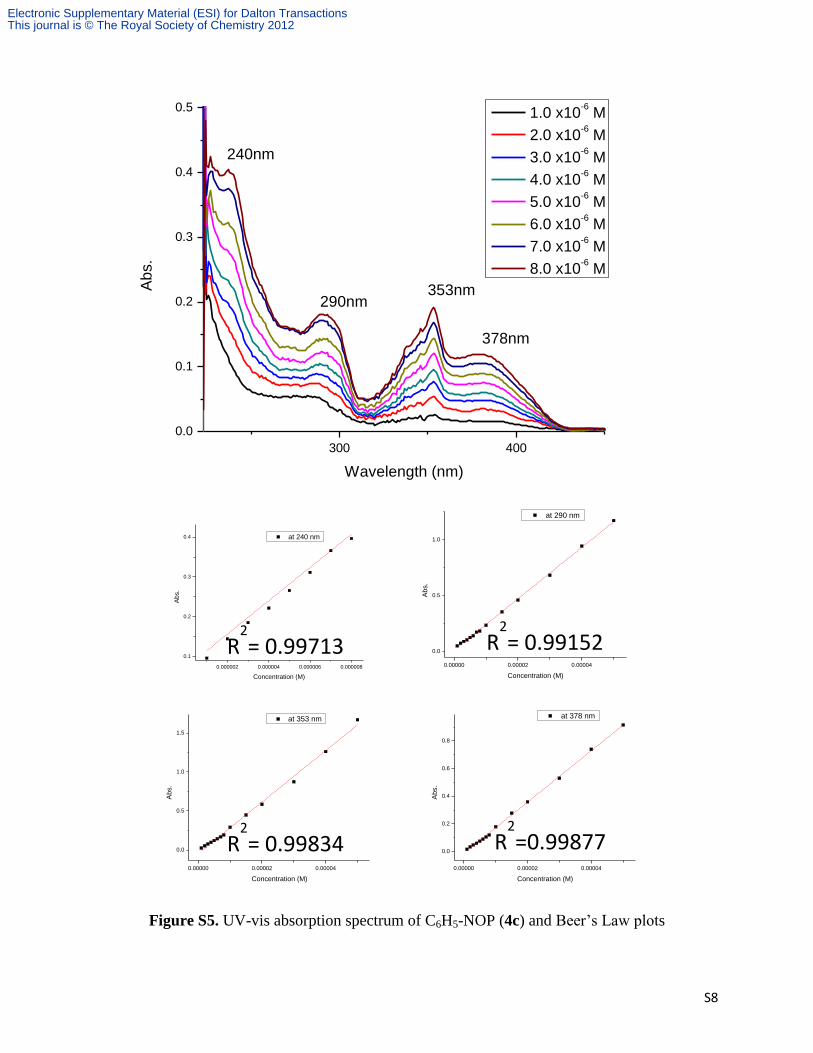
Figure S5. UV-vis absorption spectrum of C6H5-NOP (4c) and Beer’s Law plots
0.000002 0.000004 0.000006 0.000008
0.1
0.2
0.3
0.4
Ab
s.
Concentration (M)
at 240 nm
0.00000 0.00002 0.00004
0.0
0.5
1.0
Ab
s.
Concentration (M)
at 290 nm
0.00000 0.00002 0.00004
0.0
0.5
1.0
1.5
Ab
s.
Concentration (M)
at 353 nm
0.00000 0.00002 0.00004
0.0
0.2
0.4
0.6
0.8
Ab
s.
Concentration (M)
at 378 nm
300 400
0.0
0.1
0.2
0.3
0.4
0.5 1.0 x10⁻⁶ M
2.0 x10⁻⁶ M
3.0 x10⁻⁶ M
4.0 x10⁻⁶ M
5.0 x10⁻⁶ M
6.0 x10⁻⁶ M
7.0 x10⁻⁶ M
8.0 x10⁻⁶ M
Ab
s.
Wavelength (nm)
353nm290nm
240nm
378nm
R2= 0.99713 R
2= 0.99152
R2= 0.99834 R
2=0.99877
Electronic Supplementary Material (ESI) for Dalton TransactionsThis journal is © The Royal Society of Chemistry 2012
S9
0.000002 0.000004 0.000006 0.000008
0.05
0.10
0.15
0.20
Ab
s.
Concentration (M)
at 294 nm
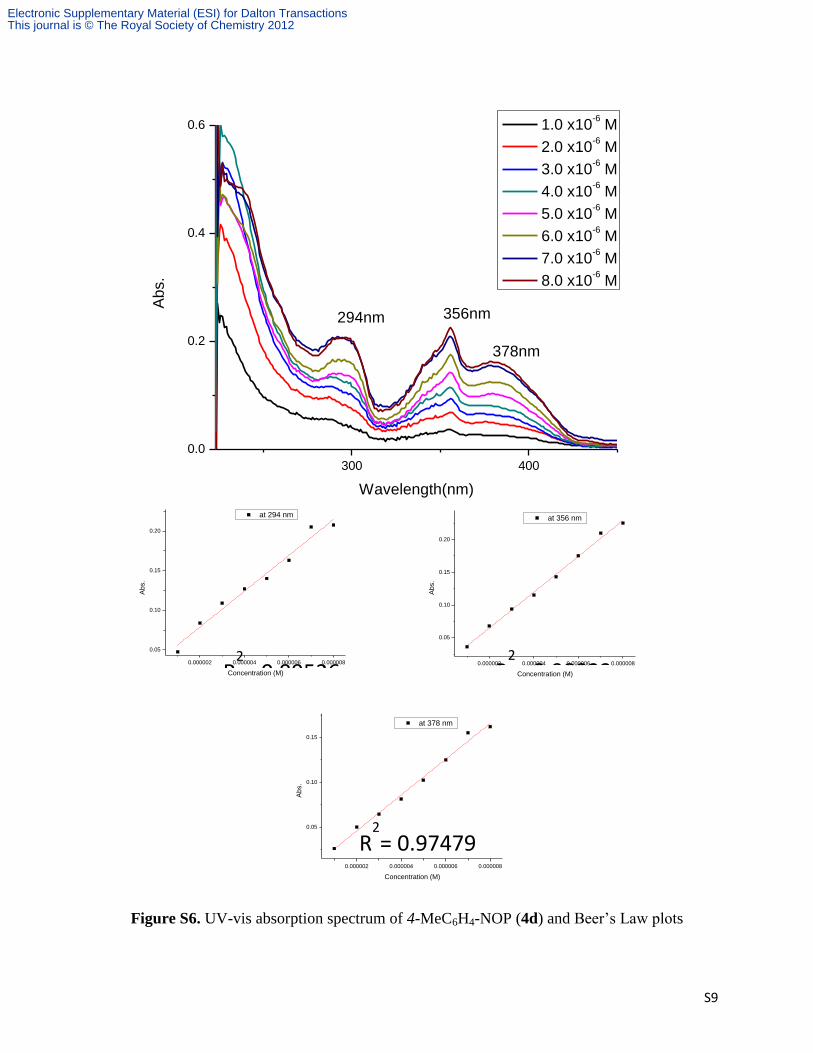
Figure S6. UV-vis absorption spectrum of 4-MeC6H4-NOP (4d) and Beer’s Law plots
0.000002 0.000004 0.000006 0.000008
0.05
0.10
0.15
0.20
Ab
s.
Concentration (M)
at 356 nm
0.000002 0.000004 0.000006 0.000008
0.05
0.10
0.15
Ab
s.
Concentration (M)
at 378 nm
300 400
0.0
0.2
0.4
0.6 1.0 x10⁻⁶ M
2.0 x10⁻⁶ M
3.0 x10⁻⁶ M
4.0 x10⁻⁶ M
5.0 x10⁻⁶ M
6.0 x10⁻⁶ M
7.0 x10⁻⁶ M
8.0 x10⁻⁶ M
Ab
s.
Wavelength(nm)
356nm294nm
378nm
R2= 0.97479
R2= 0.99526
R2= 0.98923
Electronic Supplementary Material (ESI) for Dalton TransactionsThis journal is © The Royal Society of Chemistry 2012
S10
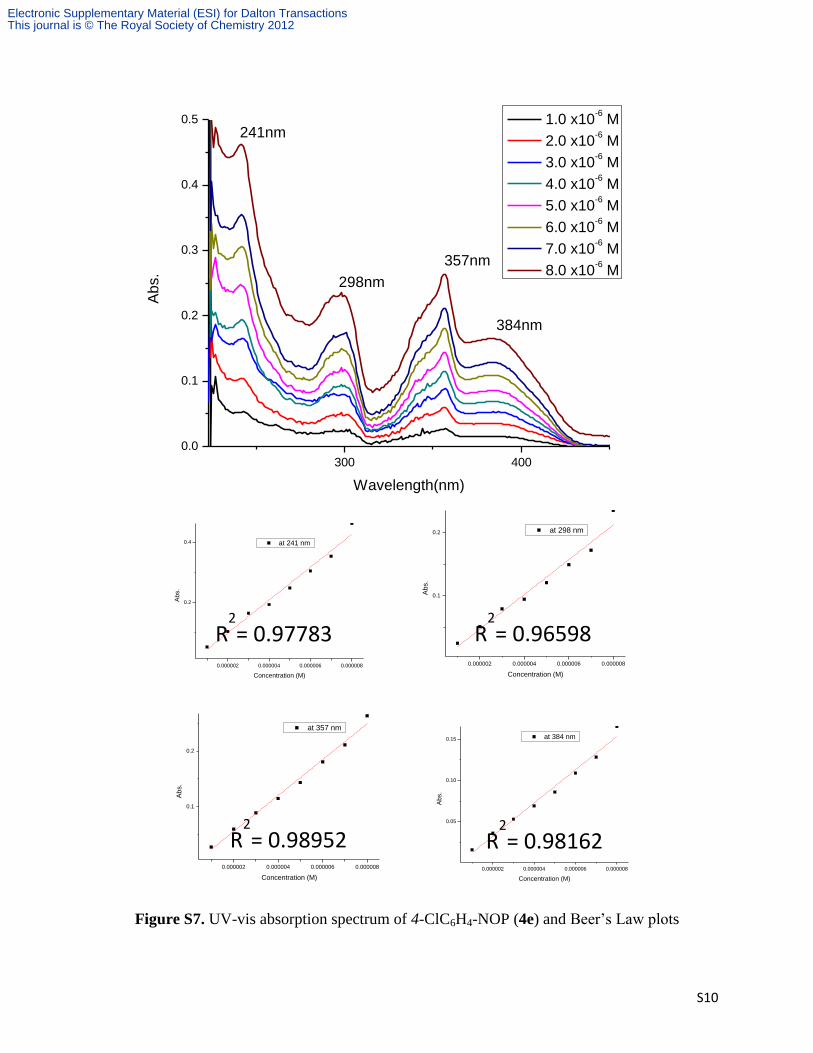
Figure S7. UV-vis absorption spectrum of 4-ClC6H4-NOP (4e) and Beer’s Law plots
0.000002 0.000004 0.000006 0.000008
0.2
0.4
Ab
s.
Concentration (M)
at 241 nm
0.000002 0.000004 0.000006 0.000008
0.1
0.2
Ab
s.
Concentration (M)
at 298 nm
0.000002 0.000004 0.000006 0.000008
0.1
0.2
Ab
s.
Concentration (M)
at 357 nm
0.000002 0.000004 0.000006 0.000008
0.05
0.10
0.15
Ab
s.
Concentration (M)
at 384 nm
300 400
0.0
0.1
0.2
0.3
0.4
0.5 1.0 x10⁻⁶ M
2.0 x10⁻⁶ M
3.0 x10⁻⁶ M
4.0 x10⁻⁶ M
5.0 x10⁻⁶ M
6.0 x10⁻⁶ M
7.0 x10⁻⁶ M
8.0 x10⁻⁶ M
Ab
s.
Wavelength(nm)
241nm
298nm
357nm
384nm
R2= 0.97783 R
2= 0.96598
R2= 0.98952 R
2= 0.98162
Electronic Supplementary Material (ESI) for Dalton TransactionsThis journal is © The Royal Society of Chemistry 2012
S11
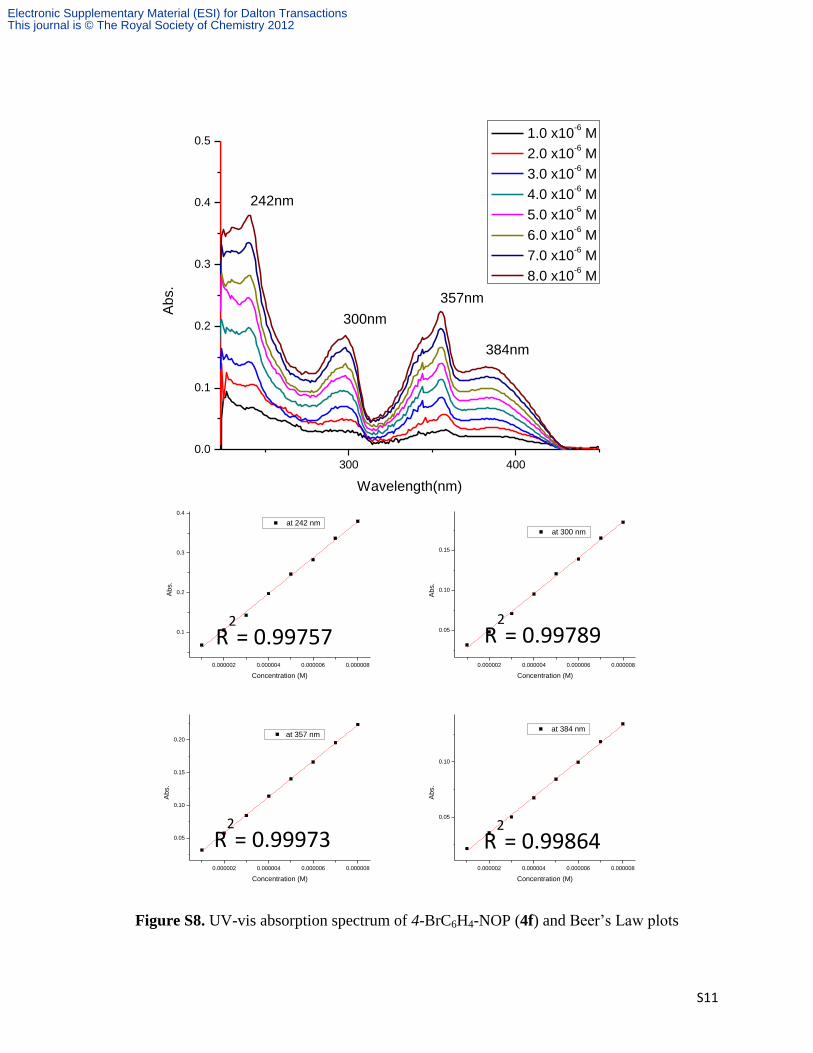
Figure S8. UV-vis absorption spectrum of 4-BrC6H4-NOP (4f) and Beer’s Law plots
0.000002 0.000004 0.000006 0.000008
0.1
0.2
0.3
0.4
Ab
s.
Concentration (M)
at 242 nm
0.000002 0.000004 0.000006 0.000008
0.05
0.10
0.15
Ab
s.
Concentration (M)
at 300 nm
0.000002 0.000004 0.000006 0.000008
0.05
0.10
0.15
0.20
Ab
s.
Concentration (M)
at 357 nm
0.000002 0.000004 0.000006 0.000008
0.05
0.10
Ab
s.
Concentration (M)
at 384 nm
300 400
0.0
0.1
0.2
0.3
0.4
0.5 1.0 x10
-6 M
2.0 x10⁻⁶ M
3.0 x10⁻⁶ M
4.0 x10⁻⁶ M
5.0 x10⁻⁶ M
6.0 x10⁻⁶ M
7.0 x10⁻⁶ M
8.0 x10⁻⁶ M
Ab
s.
Wavelength(nm)
242nm
300nm
357nm
384nm
R2= 0.99757 R
2= 0.99789
R2= 0.99973 R
2= 0.99864
Electronic Supplementary Material (ESI) for Dalton TransactionsThis journal is © The Royal Society of Chemistry 2012
S12
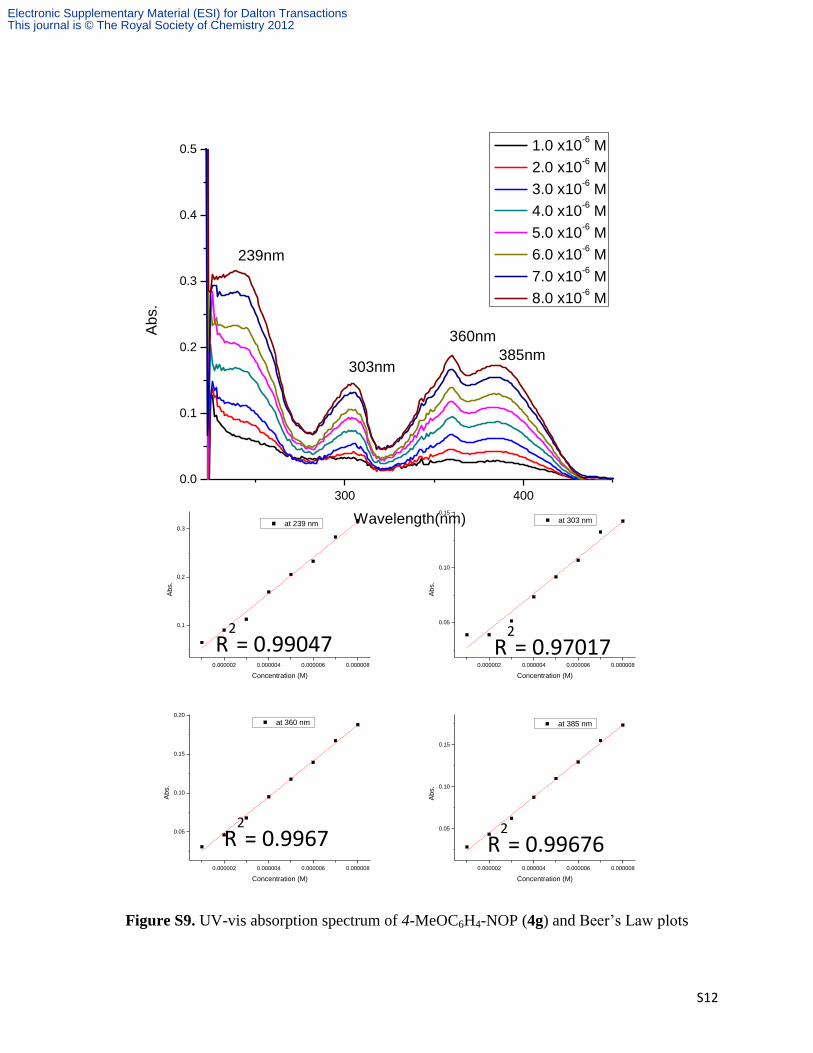
Figure S9. UV-vis absorption spectrum of 4-MeOC6H4-NOP (4g) and Beer’s Law plots
0.000002 0.000004 0.000006 0.000008
0.1
0.2
0.3
Ab
s.
Concentration (M)
at 239 nm
0.000002 0.000004 0.000006 0.000008
0.05
0.10
0.15
Ab
s.
Concentration (M)
at 303 nm
0.000002 0.000004 0.000006 0.000008
0.05
0.10
0.15
0.20
Ab
s.
Concentration (M)
at 360 nm
0.000002 0.000004 0.000006 0.000008
0.05
0.10
0.15
Ab
s.
Concentration (M)
at 385 nm
300 400
0.0
0.1
0.2
0.3
0.4
0.5A
bs.
Wavelength(nm)
1.0 x10⁻⁶ M
2.0 x10⁻⁶ M
3.0 x10⁻⁶ M
4.0 x10⁻⁶ M
5.0 x10⁻⁶ M
6.0 x10⁻⁶ M
7.0 x10⁻⁶ M
8.0 x10⁻⁶ M
239nm
303nm
360nm
385nm
R2= 0.99047 R
2= 0.97017
R2= 0.9967 R
2= 0.99676
Electronic Supplementary Material (ESI) for Dalton TransactionsThis journal is © The Royal Society of Chemistry 2012
S13
300 400
0.0
0.1
Ab
s.
Wavelength(nm)
tBu-NOP
Ad-NOP
C6H
5-NOP
4-MeC6H
4-NOP
4-ClC6H
4-NOP
4-BrC6H
4-NOP
4-MeOC6H
4-NOP
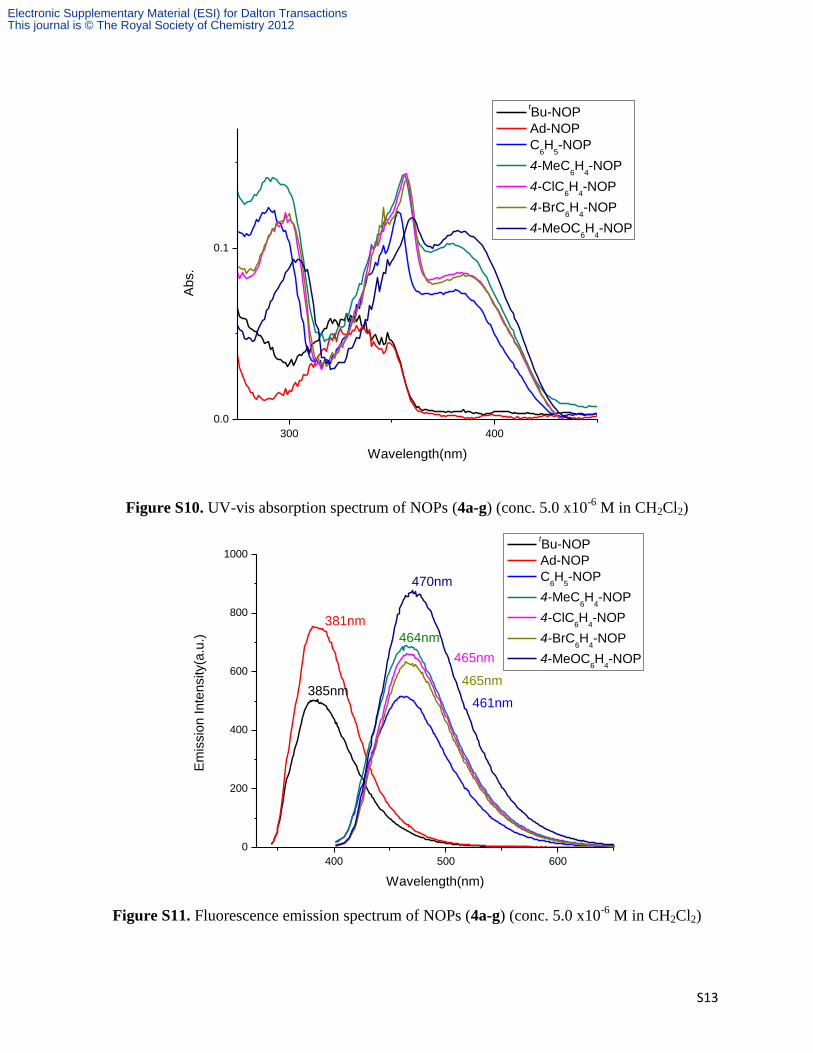
Figure S10. UV-vis absorption spectrum of NOPs (4a-g) (conc. 5.0 x10⁻⁶
M in CH2Cl2)
400 500 600
0
200
400
600
800
1000
tBu-NOP
Ad-NOP
C6H
5-NOP
4-MeC6H
4-NOP
4-ClC6H
4-NOP
4-BrC6H
4-NOP
4-MeOC6H
4-NOP
Em
issio
n In
ten
sity(a
.u.)
Wavelength(nm)
385nm
381nm
461nm
464nm
465nm
465nm
470nm
Figure S11. Fluorescence emission spectrum of NOPs (4a-g) (conc. 5.0 x10⁻⁶
M in CH2Cl2)
Electronic Supplementary Material (ESI) for Dalton TransactionsThis journal is © The Royal Society of Chemistry 2012
S14
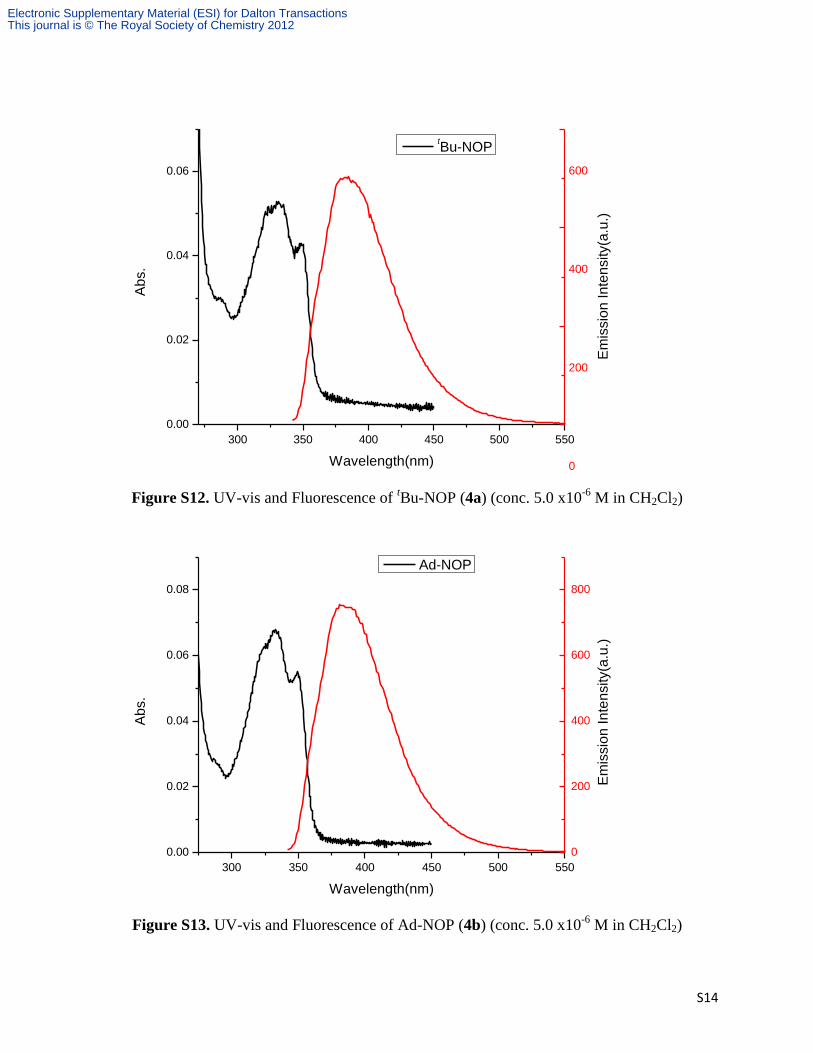
Figure S12. UV-vis and Fluorescence of tBu-NOP (4a) (conc. 5.0 x10
-6 M in CH2Cl2)
Figure S13. UV-vis and Fluorescence of Ad-NOP (4b) (conc. 5.0 x10⁻⁶
M in CH2Cl2)
300 350 400 450 500 550
0.00
0.02
0.04
0.06
0.08
Ab
s.
Wavelength(nm)
Ad-NOP
0
200
400
600
800
Em
issio
n In
ten
sity(a
.u.)
300 350 400 450 500 550
0.00
0.02
0.04
0.06
Ab
s.
Wavelength(nm)
tBu-NOP
0
200
400
600
Em
issio
n In
ten
sity(a
.u.)
Electronic Supplementary Material (ESI) for Dalton TransactionsThis journal is © The Royal Society of Chemistry 2012
S15
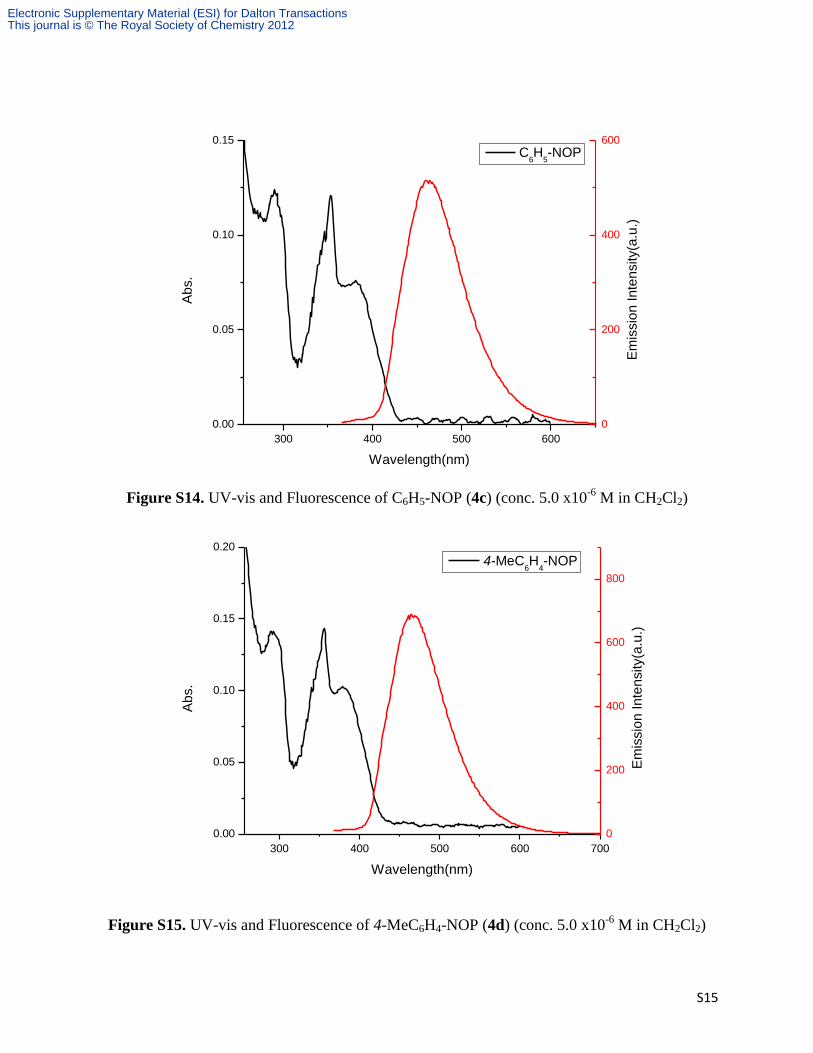
Figure S14. UV-vis and Fluorescence of C6H5-NOP (4c) (conc. 5.0 x10⁻⁶
M in CH2Cl2)
Figure S15. UV-vis and Fluorescence of 4-MeC6H4-NOP (4d) (conc. 5.0 x10⁻⁶
M in CH2Cl2)
300 400 500 600
0.00
0.05
0.10
0.15
Ab
s.
Wavelength(nm)
C6H
5-NOP
0
200
400
600
Em
issio
n In
ten
sity(a
.u.)
300 400 500 600 700
0.00
0.05
0.10
0.15
0.20
Ab
s.
Wavelength(nm)
4-MeC6H
4-NOP
0
200
400
600
800
Em
issio
n In
ten
sity(a
.u.)
Electronic Supplementary Material (ESI) for Dalton TransactionsThis journal is © The Royal Society of Chemistry 2012
S16
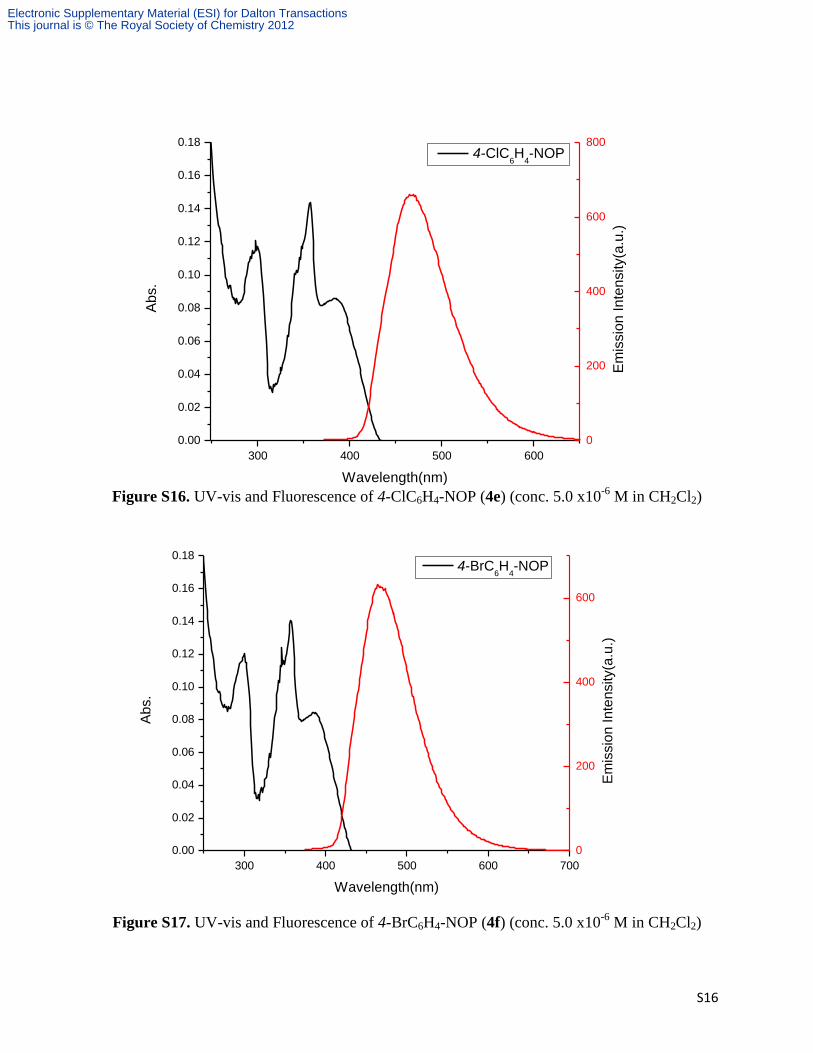
Figure S16. UV-vis and Fluorescence of 4-ClC6H4-NOP (4e) (conc. 5.0 x10⁻⁶
M in CH2Cl2)
Figure S17. UV-vis and Fluorescence of 4-BrC6H4-NOP (4f) (conc. 5.0 x10⁻⁶
M in CH2Cl2)
300 400 500 600
0.00
0.02
0.04
0.06
0.08
0.10
0.12
0.14
0.16
0.18A
bs.
Wavelength(nm)
4-ClC6H
4-NOP
0
200
400
600
800
Em
issio
n In
ten
sity(a
.u.)
300 400 500 600 700
0.00
0.02
0.04
0.06
0.08
0.10
0.12
0.14
0.16
0.18
Ab
s.
Wavelength(nm)
4-BrC6H
4-NOP
0
200
400
600 E
mis
sio
n In
ten
sity(a
.u.)
Electronic Supplementary Material (ESI) for Dalton TransactionsThis journal is © The Royal Society of Chemistry 2012
S17
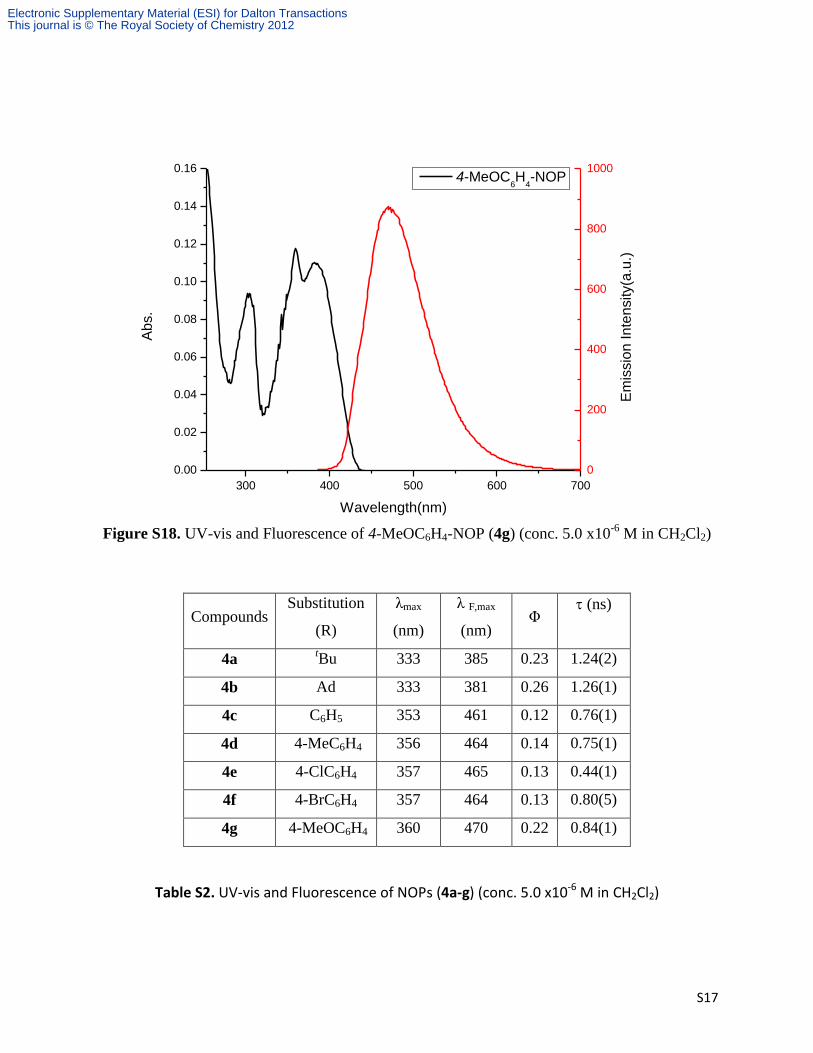
Figure S18. UV-vis and Fluorescence of 4-MeOC6H4-NOP (4g) (conc. 5.0 x10⁻⁶
M in CH2Cl2)
Compounds Substitution
(R)
λmax
(nm)
λ F,max
(nm) Φ
(ns)
4a tBu 333 385 0.23 1.24(2)
4b Ad 333 381 0.26 1.26(1)
4c C6H5 353 461 0.12 0.76(1)
4d 4-MeC6H4 356 464 0.14 0.75(1)
4e 4-ClC6H4 357 465 0.13 0.44(1)
4f 4-BrC6H4 357 464 0.13 0.80(5)
4g 4-MeOC6H4 360 470 0.22 0.84(1)
Table S2. UV-vis and Fluorescence of NOPs (4a-g) (conc. 5.0 x10⁻⁶ M in CH2Cl2)
300 400 500 600 700
0.00
0.02
0.04
0.06
0.08
0.10
0.12
0.14
0.16
Ab
s.
Wavelength(nm)
4-MeOC6H
4-NOP
0
200
400
600
800
1000
Em
issio
n In
ten
sity(a
.u.)
Electronic Supplementary Material (ESI) for Dalton TransactionsThis journal is © The Royal Society of Chemistry 2012
S18
Electrochemical Studies of NOPs
Cyclic voltammetry experiments were performed in a nitrogen- filled MBraun drybox outfitted
with a CH Instrument workstation (CHI630C) at room temperature. Tetrabutylammonium
tetrafluoroborate, [nBu4N][BF4], was recrystallized five times using ethyl acetate and ether, dried
thoroughly under vacuum, and stored in the drybox. Ferrocene was purified by sublimation
under vacuum and stored in the drybox. All glassware was oven-dried overnight before use. A
glassy carbon working electrode was polished with 0.05m alumina and thoroughly cleaned and
dried before use. A silver wire was utilized as a quasi-reference electrode, and a platinum wire
was the counter electrode. All scans were performed at a scan rated of 0.1 V/s unless otherwise
stated. All spectra were referenced to SCE using ferrocene as an internal standard.
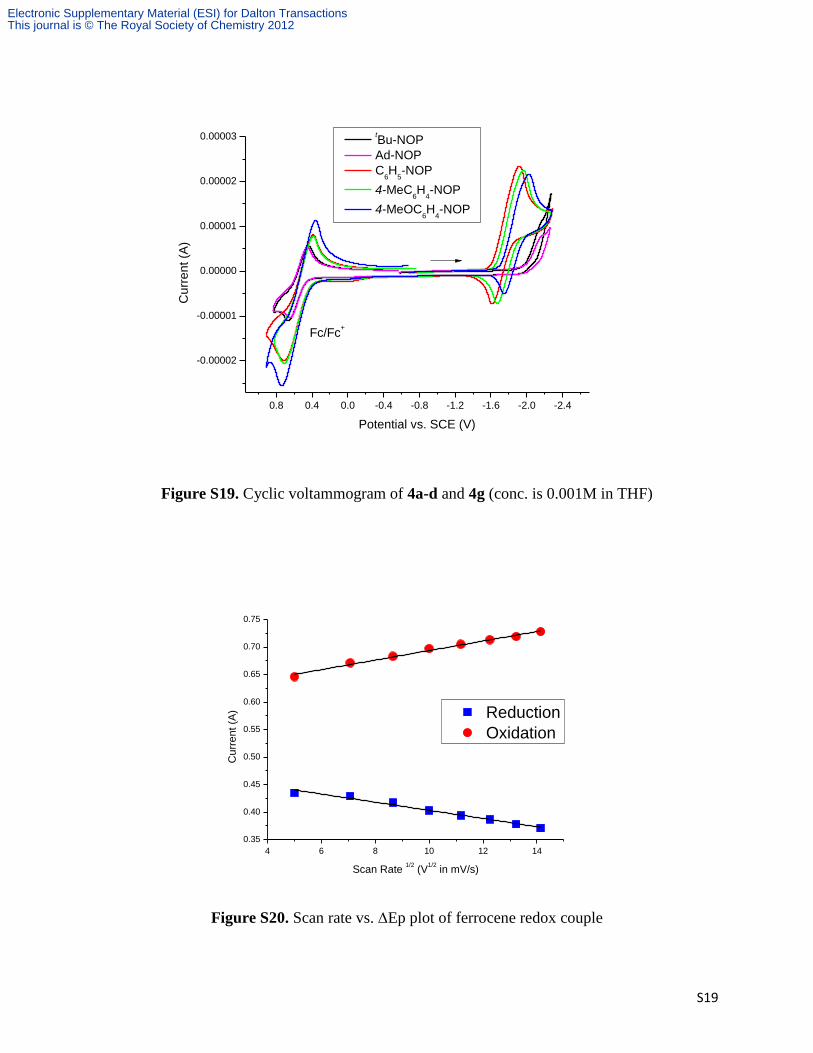
Solutions with a concentration of 0.001M NOPs in THF were used for reduction analyses. A
three-electrode system, with glassy carbon as the working electrode, silver wire as the quasi-
reference electrode, and platinum wire as the counter electrode, was utilized. All scans were
performed with 0.1 M tetrabutylammonium tetrafluoroborate, [nBu4N] [BF4], in THF as the
supporting electrolyte, with a scan rate of 0.1 V/s. Ferrocene was utilized as an internal reference
because of the use of a quasi-reference electrode during analyses. Ferrocene (final concentration
0.001 M) was added after the initial scans of compounds. The reduction potentials were thus
referenced to the ferrocene/ferrocenium redox couple versus saturated calomel electrode (E1/2 =
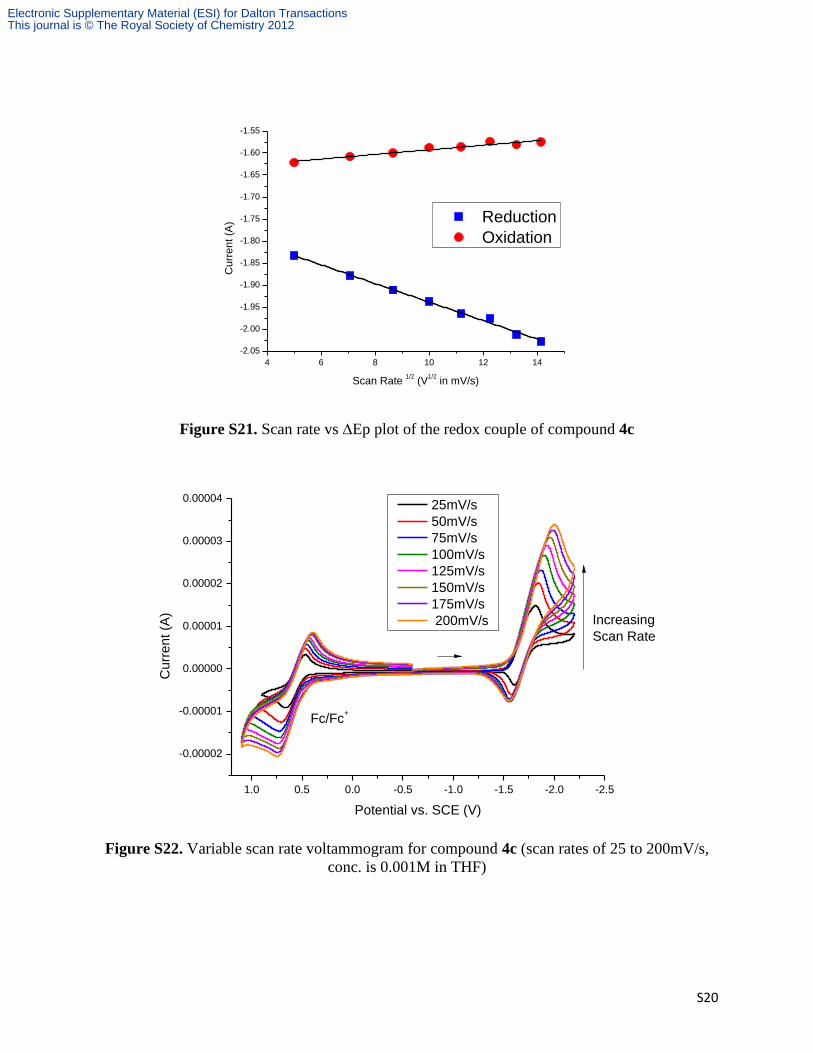
0.55 V vs SCE). Reversibility was ascertained by scanning compounds 4c at various scan rates
(25-200 mV) and generating linear plots of scan rates versus Ep for both ferrocene and
compound 4c (see Supporting Information), confirming adherence to the Nernst equation.
Electronic Supplementary Material (ESI) for Dalton TransactionsThis journal is © The Royal Society of Chemistry 2012
S19
0.8 0.4 0.0 -0.4 -0.8 -1.2 -1.6 -2.0 -2.4
-0.00002
-0.00001
0.00000
0.00001
0.00002
0.00003
Cu
rre
nt (A
)
Potential vs. SCE (V)
tBu-NOP
Ad-NOP
C6H
5-NOP
4-MeC6H
4-NOP
4-MeOC6H
4-NOP
Fc/Fc+
Figure S19. Cyclic voltammogram of 4a-d and 4g (conc. is 0.001M in THF)
4 6 8 10 12 14
0.35
0.40
0.45
0.50
0.55
0.60
0.65
0.70
0.75
Reduction
Oxidation
Cu
rre
nt (A
)
Scan Rate 1/2
(V1/2
in mV/s)
Figure S20. Scan rate vs. Ep plot of ferrocene redox couple
Electronic Supplementary Material (ESI) for Dalton TransactionsThis journal is © The Royal Society of Chemistry 2012
S20
4 6 8 10 12 14
-2.05
-2.00
-1.95
-1.90
-1.85
-1.80
-1.75
-1.70
-1.65
-1.60
-1.55
Reduction
OxidationC
urr
en
t (A
)
Scan Rate 1/2
(V1/2
in mV/s)
Figure S21. Scan rate vs Ep plot of the redox couple of compound 4c
1.0 0.5 0.0 -0.5 -1.0 -1.5 -2.0 -2.5
-0.00002
-0.00001
0.00000
0.00001
0.00002
0.00003
0.00004
Cu
rre
nt (A
)
Potential vs. SCE (V)
25mV/s
50mV/s
75mV/s
100mV/s
125mV/s
150mV/s
175mV/s
200mV/s Increasing
Scan Rate
Fc/Fc+
Figure S22. Variable scan rate voltammogram for compound 4c (scan rates of 25 to 200mV/s,
conc. is 0.001M in THF)
Electronic Supplementary Material (ESI) for Dalton TransactionsThis journal is © The Royal Society of Chemistry 2012
S21
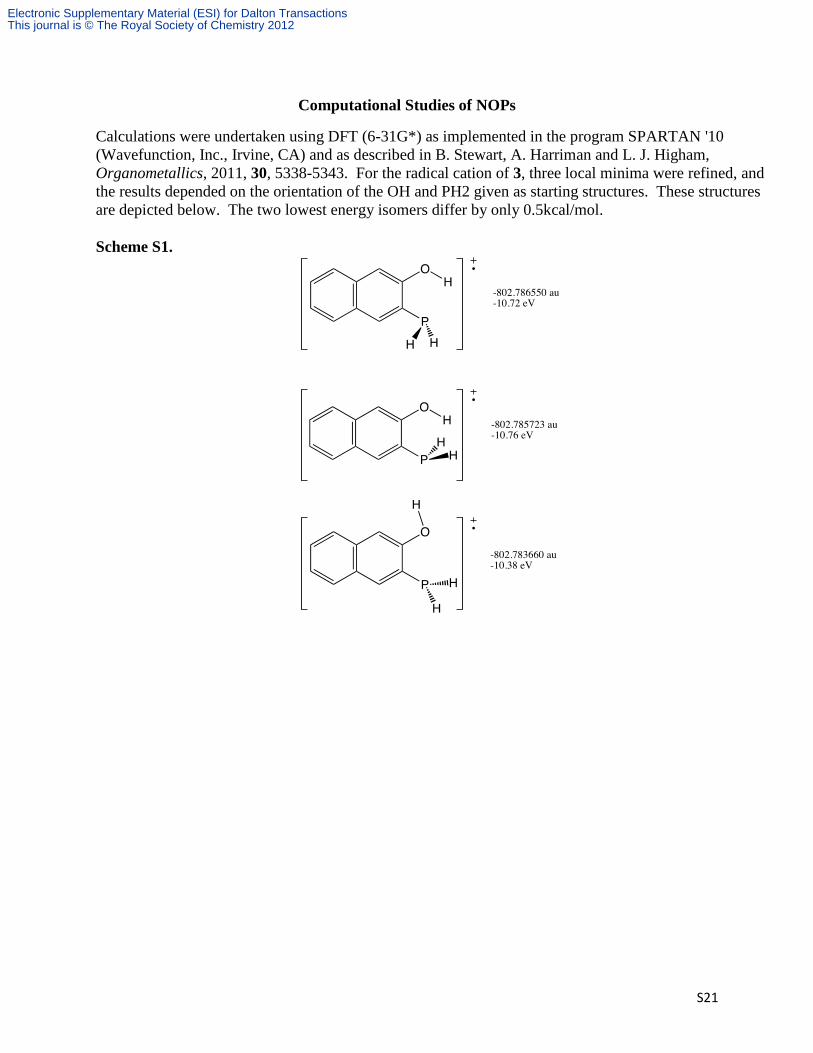
Computational Studies of NOPs
Calculations were undertaken using DFT (6-31G*) as implemented in the program SPARTAN '10
(Wavefunction, Inc., Irvine, CA) and as described in B. Stewart, A. Harriman and L. J. Higham,
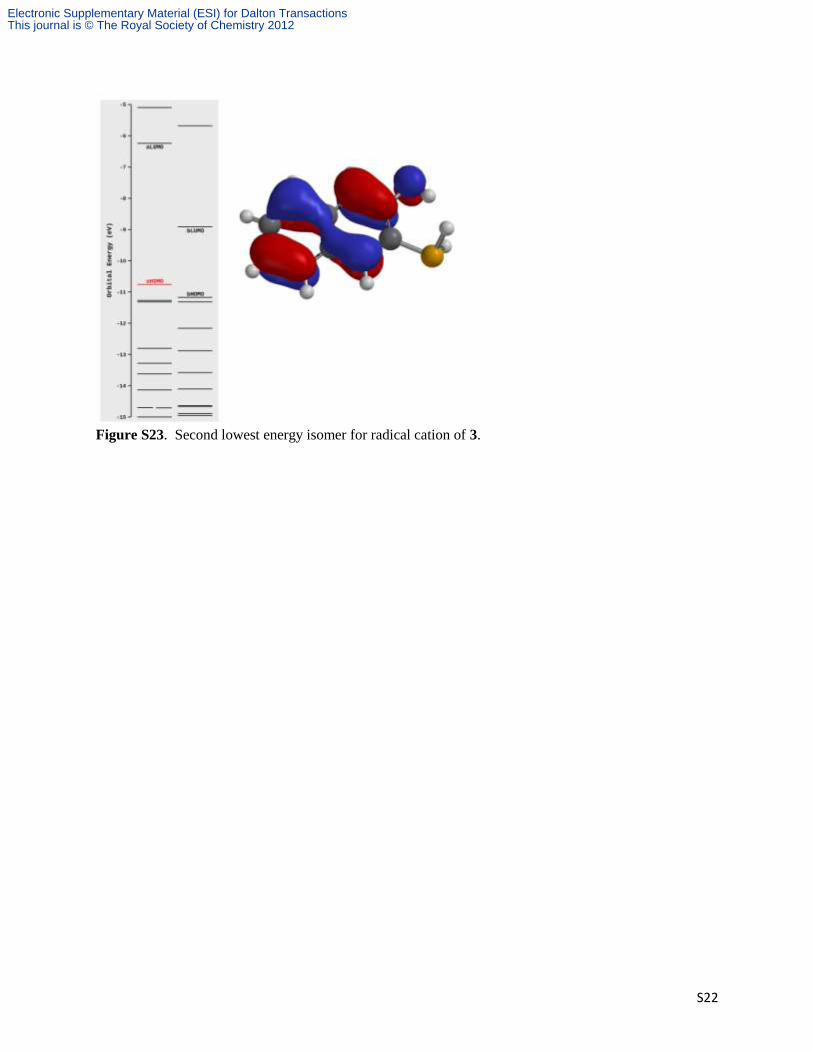
Organometallics, 2011, 30, 5338-5343. For the radical cation of 3, three local minima were refined, and
the results depended on the orientation of the OH and PH2 given as starting structures. These structures
are depicted below. The two lowest energy isomers differ by only 0.5kcal/mol.
Scheme S1.
Electronic Supplementary Material (ESI) for Dalton TransactionsThis journal is © The Royal Society of Chemistry 2012
S22
Figure S23. Second lowest energy isomer for radical cation of 3.
Electronic Supplementary Material (ESI) for Dalton TransactionsThis journal is © The Royal Society of Chemistry 2012
S23
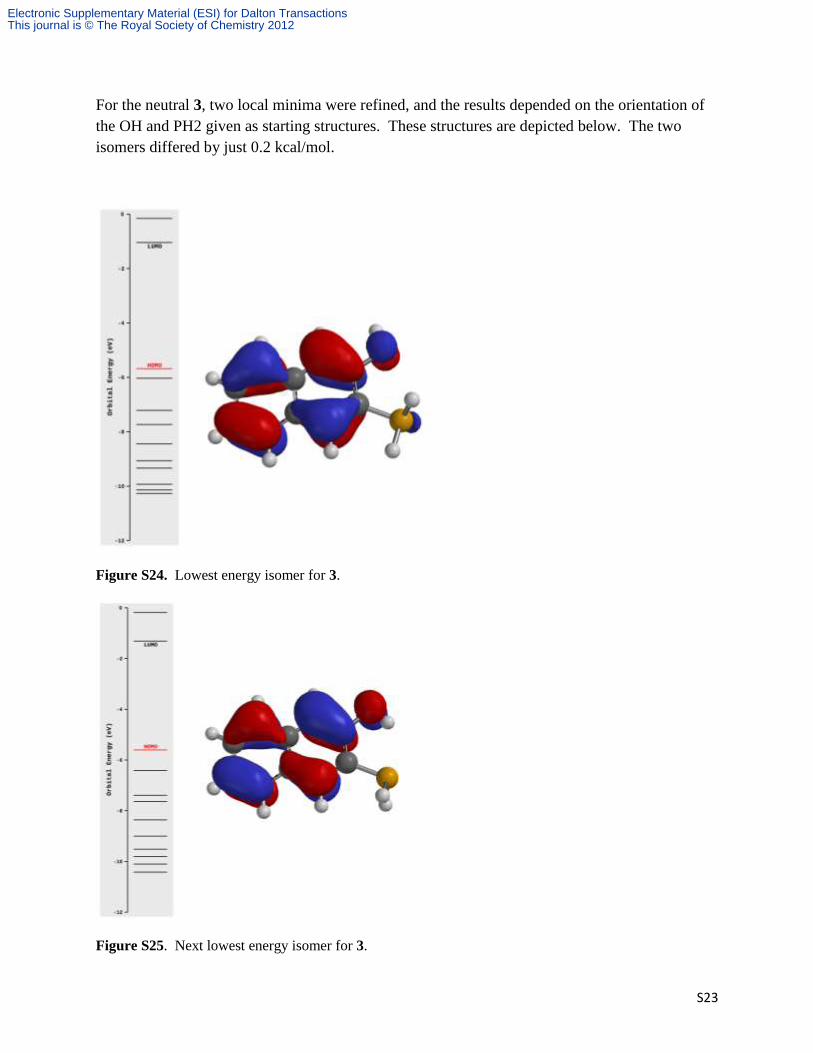
For the neutral 3, two local minima were refined, and the results depended on the orientation of
the OH and PH2 given as starting structures. These structures are depicted below. The two
isomers differed by just 0.2 kcal/mol.
Figure S24. Lowest energy isomer for 3.
Figure S25. Next lowest energy isomer for 3.
Electronic Supplementary Material (ESI) for Dalton TransactionsThis journal is © The Royal Society of Chemistry 2012