Embed Size (px)
Citation preview

Value For Money in public sector corporate services
A joint project by the UK Public Sector Audit Agencies

N I A ONorthern Ireland Audit Office

Joint foreword by audit agency heads
A key strategic role of our agencies is to support value for money in government. We are therefore delighted to publish these indicator sets which are the results of this joint project. The use of good quality information for making decisions, managing performance and demonstrating good value for money for the taxpayer is a vital part of the work of public sector organisations. As auditors of public sector organisations, encouraging such use is an important shared aim. The purpose of this project has been to help organisations right across the public sector to understand, compare and demonstrate the value for money performance of their corporate services – without adding to the information burden placed by regulatory bodies on public sector organisations.
We are grateful for the work by KPMG and the contributions made by many organisations, including central government departments, local service providers across England, Scotland, Northern Ireland and Wales, and by their representative associations. These have ensured that the indicator set will be genuinely valuable for managing and understanding the performance and value for money of their Human Resources, Finance, Information and Communications
Technology, Procurement and Estates functions. Indeed, a significant number of organisations that have been involved in the project are already using the indicators.
Our organisations work closely together on many issues, although much of this cooperation is not immediately visible. It is therefore a particular pleasure to be able to publish together the results of a project that we have successfully pursued as a joint venture, which we believe will enable public sector organisations to get better value for money from their corporate services.
Publishing the indicators is very much a first step. While they are entirely voluntary we will encourage the bodies that we audit to make appropriate use of them. We will also encourage the establishment of benchmarking services and further develop the indicator sets, increasing their value to the organisations using them.
We hope that you will find the indicators useful for assessing how far you have developed the performance of your corporate services, compared against best practice and the performance of others.
vfm in public sector corporate services 1
Sir John Bourn, Comptroller and Auditor General
Jeremy Colman, Auditor General for Wales
John Dowdall, Comptroller and Auditor General for Northern Ireland
Robert Black, Auditor General for Scotland
Steve Bundred, Chief Executive, Audit Commission

� vfm in public sector corporate services
Key point summary
l The UK’s public sector audit agencies have worked together to develop indicator sets for measuring the value for money performance of five core functions: finance, human resources, information and communication technology, estates management and procurement.
l The indicators have been designed for use by senior managers across the public sector to help them monitor and improve the value for money performance in their organisations’ corporate services. These have been identified by the Government as a priority area for securing efficiency improvements and releasing resources for use in delivering front-line services.
l The wider focus on value for money rather than efficiency alone reflects the audit agencies’ concern to see public sector organisations improve the effectiveness and professionalism of corporate services functions, as well as their efficiency. This will also aid decisions on shared services initiatives.
l Use of the indicator sets is to be voluntary, with individual organisations deciding whether or not they would add value to their own performance management systems, benchmarking activities and improvement plans. This reflects a shared commitment by the audit agencies to improve the quality of performance information used by public sector bodies, while avoiding any additions to their information burden.
l The scope of the indicator sets is not comprehensive but focuses instead on those aspects that are believed to be key for value for money performance in the five corporate services functions. The indicators have been extensively road-tested: some 100 organisations across England, Scotland and Wales have been involved in their development, including over 30 pilot sites drawn from central government, local government, the NHS, fire and police sectors. We will continue to develop the indicator sets to increase their value to the organisations using them.
l The indicators have been designed to ensure that all those who choose to gather the data will be able not only to assess their own value for money performance but also compare their results against other public sector organisations elsewhere in the UK. We believe that this will be of substantial benefit to many chief executives and senior management teams.
l One third party provider already has plans to launch a benchmarking service using the indicators. More information on this will be available shortly. Definitions for the indicators are also freely available on the Public Audit Forum website (www.public-audit-forum.gov.uk) for any organisation that wishes individually to use them.

vfm in public sector corporate services 3
Section 1: Origins of the project
1.1 The Audit Commission, Audit Scotland1, National Audit Office, Northern Ireland Audit Office and Wales Audit Office – the UK’s public sector audit agencies – share the task of assessing the value for money secured in the use of taxpayers’ money to provide public services, and the aim of encouraging improvement as a result.
1.� Since �004, when the government-commissioned review of public sector efficiency led by Sir Peter Gershon was published, there has been a spotlight on the efficiency of corporate services within public sector organisations. Similar exercises have taken place in Scotland (the Efficient Government initiative), in Wales (where securing efficiency gains is part of the Making the Connections agenda) and in Northern Ireland (where targets have been set for improvements in public sector efficiency). Corporate services are set to continue to be a focus of attention in the public sector; HM Treasury, for example, has said that in the forthcoming Comprehensive Spending Review, central government departments will be required to find savings of 5 per cent each year from their administration budgets.
1.3 The UK public sector audit agencies share the Government’s view that there is potential for significant efficiency savings in the provision of corporate services across the public sector in England, Scotland, Northern Ireland and Wales, enabling more resources to be channelled into front line services. Furthermore, we believe that corporate services make a critical contribution to the wider value for money performance of public sector organisations.
1.4 Organisations across the UK public sector are now seeking to make significant efficiency improvements in their corporate and support functions, for example:
l English local authorities planned to secure efficiency gains of £138 million in corporate services and a further £75 million in procurement in �006-07
l In Scotland, current projects anticipate efficiencies in corporate services. Better procurement across the Scottish public sector is expected to generate recurring savings of £153 million in �006/07 and £�13 million in �007/08.
l The Welsh Assembly Government has set out in Making the Connections: Delivering Better Services for Wales a target across the whole public sector of achieving ‘£1�0 million of value for money improvements through better procurement by �008, with the possibility of more by �010’; and a target of achieving ‘up to £1�0million of value for money gains by improving and sharing support functions across the whole public sector by �010’.
l The Northern Ireland Civil Service has embarked on a major reform programme which will introduce shared services across a wide range of functions such as human resources, accounting, office accommodation, IT and advertising, and the public sector has a target to deliver value for money procurement gains of £�50 million in the 3 years to 31 March �008.
1 In Scotland, the Accounts Commission is responsible for the audit of local authorities and the Auditor General is responsible for the audit of most other public bodies. Audit Scotland’s role is to provide the Accounts Commission and the Auditor General with the services they need to carry out their duties.

4 vfm in public sector corporate services
1.5 This project arose out of discussions between the audit agencies about a shared concern that better measurement systems are needed for monitoring and demonstrating the efficiency and effectiveness of corporate services in the public sector. Public service providers are expected to demonstrate to their communities that they are delivering better value for money addressing not only efficiency but also effectiveness in delivery. However, there is no consistent approach to performance measurement of corporate services across the public sector and the use of benchmarking information is patchy. The audit agencies saw the development of these indicator sets as an opportunity to provide a source of high level information both for the organisations themselves and the audit agencies who would be able to analyse data at an aggregated level to identify trends in corporate service performance and so inform their choice of work programmes and overall direction. Overcoming the lack of robust methods to compare performance, measure improvement and communicate the benefits of investment is a major challenge facing public sector organisations. Robust and consistent benchmark information is an important management tool in assessing, for example, the benefits of a shared services programme.
1.6 The purpose of this joint project has been to develop a series of measures for benchmarking the value for money performance of public service providers in the key corporate services functions of procurement, finance, human resources, estates management, and information and communications technology. The audit agencies commissioned KPMG to work with them on delivering the project.
vfm in public sector corporate services 5
Principles underpinning the development of the indicators
�.1 The audit agencies agreed five principles at the start of the project to direct the development of the indicators:
l use of the indicators should be voluntary, with organisations deciding whether and how these can help drive their own value for money improvement programmes;
l there should be a small number of high level indicators capturing those aspects of performance that are vital for the effective management of the service by senior managers;
l managers should also have the ability to drill down deeper;
l there should be a focus on better outcomes for corporate service users and commissioners; and
l to aid innovation and effectiveness, the indicators should reflect best practice.
�.� As a result of an initial research and consultation phase, in which discussions were held with stakeholders from across the public sector, the audit agencies also agreed that:
l the indicators should be kept simple and easy to measure
l the indicators should not aim to cover all aspects of performance but instead be chosen for their capacity to motivate changes in behaviour and support improvement
l the indicator set should aim to complement any existing performance management frameworks and benchmarking initiatives, and where possible facilitate future benchmarking with the private sector.
A framework for developing the indicators
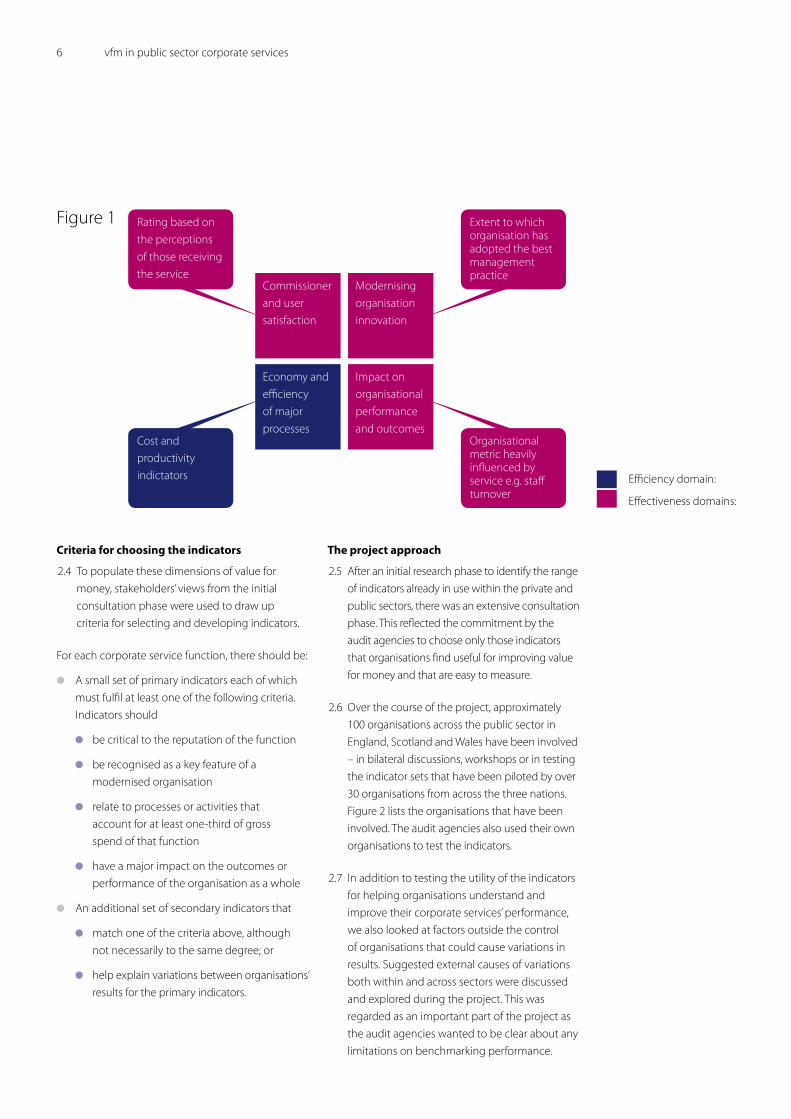
�.3 From the inception of the project, the audit agencies were clear that they wanted to develop an indicator set that captured key aspects of effectiveness as well as efficiency. This has been a major challenge for the project given current limitations in research and evidence on measuring the effectiveness of corporate services. In order to do so, an amended scorecard model was developed which, in addition to an efficiency dimension, defined three separate facets of effectiveness that could potentially be measured:
l impact, in terms of how the output from each of the corporate services functions contributes to or influences corporate performance as a whole;
l satisfaction of users and senior managers, looking at how each of the corporate services functions are regarded by staff who use these services and also by the senior management who commission them; and
l modernisation, to consider the extent to which an organisation has adopted management practices regarded as being innovative and forward looking. This is illustrated in Figure 1 overleaf.
Section �: Developing the indicators
6 vfm in public sector corporate services
Criteria for choosing the indicators
�.4 To populate these dimensions of value for money, stakeholders’ views from the initial consultation phase were used to draw up criteria for selecting and developing indicators.
For each corporate service function, there should be:
l A small set of primary indicators each of which must fulfil at least one of the following criteria. Indicators should
l be critical to the reputation of the function
l be recognised as a key feature of a modernised organisation
l relate to processes or activities that account for at least one-third of gross spend of that function
l have a major impact on the outcomes or performance of the organisation as a whole
l An additional set of secondary indicators that
l match one of the criteria above, although not necessarily to the same degree; or
l help explain variations between organisations’ results for the primary indicators.
The project approach
�.5 After an initial research phase to identify the range of indicators already in use within the private and public sectors, there was an extensive consultation phase. This reflected the commitment by the audit agencies to choose only those indicators that organisations find useful for improving value for money and that are easy to measure.
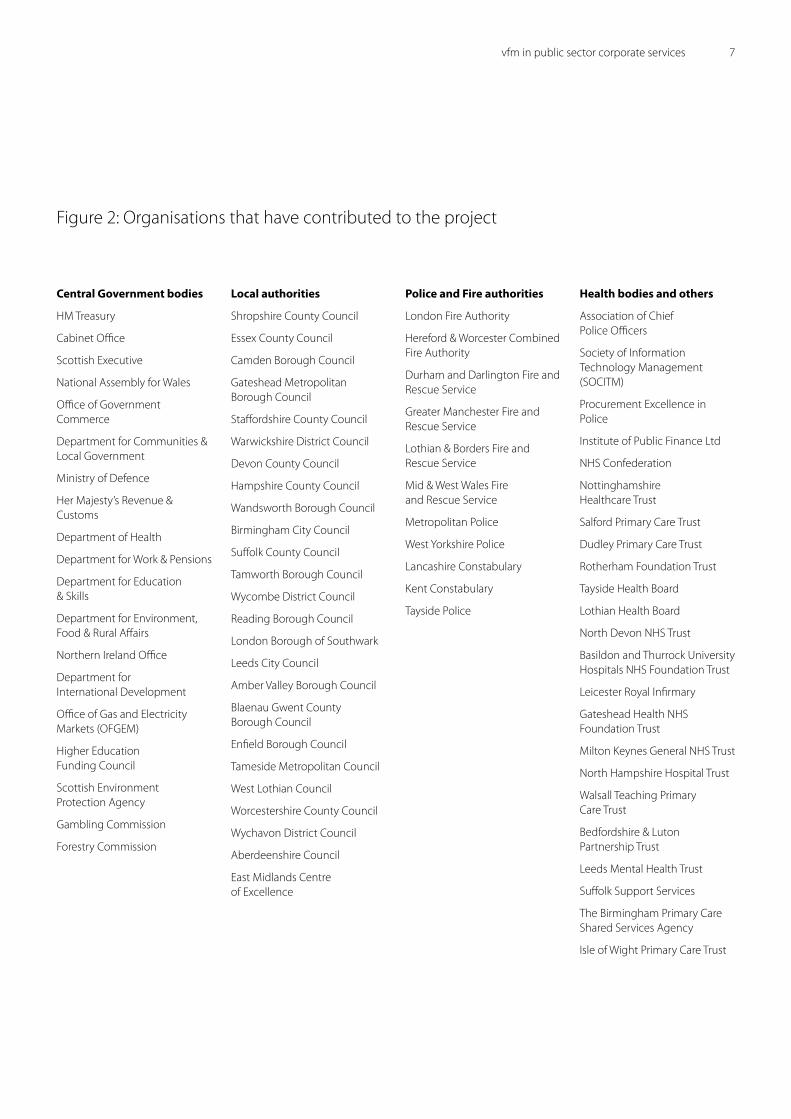
�.6 Over the course of the project, approximately 100 organisations across the public sector in England, Scotland and Wales have been involved – in bilateral discussions, workshops or in testing the indicator sets that have been piloted by over 30 organisations from across the three nations. Figure � lists the organisations that have been involved. The audit agencies also used their own organisations to test the indicators.
�.7 In addition to testing the utility of the indicators for helping organisations understand and improve their corporate services’ performance, we also looked at factors outside the control of organisations that could cause variations in results. Suggested external causes of variations both within and across sectors were discussed and explored during the project. This was regarded as an important part of the project as the audit agencies wanted to be clear about any limitations on benchmarking performance.
Rating based on the perceptions of those receiving the service
Cost and productivity indictators
Extent to which organisation has adopted the best management practice
Organisational metric heavily influenced by service e.g. staff turnover
Commissioner and user satisfaction
Modernising organisation innovation
Economy and efficiency of major processes
Impact on organisational performance and outcomes
Efficiency domain:
Effectiveness domains:
Figure 1
vfm in public sector corporate services 7
Central Government bodies
HM Treasury
Cabinet Office
Scottish Executive
National Assembly for Wales
Office of Government Commerce
Department for Communities & Local Government
Ministry of Defence
Her Majesty’s Revenue & Customs
Department of Health
Department for Work & Pensions
Department for Education & Skills
Department for Environment, Food & Rural Affairs
Northern Ireland Office
Department for International Development
Office of Gas and Electricity Markets (OFGEM)
Higher Education Funding Council
Scottish Environment Protection Agency
Gambling Commission
Forestry Commission
Local authorities
Shropshire County Council
Essex County Council
Camden Borough Council
Gateshead Metropolitan Borough Council
Staffordshire County Council
Warwickshire District Council
Devon County Council
Hampshire County Council
Wandsworth Borough Council
Birmingham City Council
Suffolk County Council
Tamworth Borough Council
Wycombe District Council
Reading Borough Council
London Borough of Southwark
Leeds City Council
Amber Valley Borough Council
Blaenau Gwent County Borough Council
Enfield Borough Council
Tameside Metropolitan Council
West Lothian Council
Worcestershire County Council
Wychavon District Council
Aberdeenshire Council
East Midlands Centre of Excellence
Police and Fire authorities
London Fire Authority
Hereford & Worcester Combined Fire Authority
Durham and Darlington Fire and Rescue Service
Greater Manchester Fire and Rescue Service
Lothian & Borders Fire and Rescue Service
Mid & West Wales Fire and Rescue Service
Metropolitan Police
West Yorkshire Police
Lancashire Constabulary
Kent Constabulary
Tayside Police
Health bodies and others
Association of Chief Police Officers
Society of Information Technology Management (SOCITM)
Procurement Excellence in Police
Institute of Public Finance Ltd
NHS Confederation
Nottinghamshire Healthcare Trust
Salford Primary Care Trust
Dudley Primary Care Trust
Rotherham Foundation Trust
Tayside Health Board
Lothian Health Board
North Devon NHS Trust
Basildon and Thurrock University Hospitals NHS Foundation Trust
Leicester Royal Infirmary
Gateshead Health NHS Foundation Trust
Milton Keynes General NHS Trust
North Hampshire Hospital Trust
Walsall Teaching Primary Care Trust
Bedfordshire & Luton Partnership Trust
Leeds Mental Health Trust
Suffolk Support Services
The Birmingham Primary Care Shared Services Agency
Isle of Wight Primary Care Trust
Figure �: Organisations that have contributed to the project

8 vfm in public sector corporate services
Section 3: Project results
The indicator sets developed
3.1 Using the framework and criteria developed during the initial phases of the project, indicator sets have been drawn up for each of the functional areas. The primary indicators are aimed more at senior management whilst the secondary indicators are those which operational managers may want to monitor. The combined set of indicators does not aim to cover all spend and all activities; instead the objective has been to devise indicators that reflect the key features which drive VFM.
3.� The indicators have been designed to be assessed and interpreted as a set. Interpreting each indicator in isolation greatly reduces the potential value that the set can offer in understanding the organisation’s performance. It is often necessary to interpret the result from one indicator together with other related indicators, in particular to consider how the organisation has achieved both efficiency and effectiveness.
3.3 The primary indicators for each function include a basic cost indicator, a commissioner and user satisfaction index and a management practices index. The management practices index has been developed to enable organisations to assess whether their corporate services are well-run and modernised. This innovative approach based on best practice across the private sector as well as within the public sector, has been well received by organisations who have found it a valuable way of capturing the softer, difficult to measure, elements of effectiveness. It also provides useful, summary guidance on the direction of travel for improving these functions.
3.4 The Annex to this report contains a table for each indicator set which lists all of the indicators. It includes details of the rationale for each indicator and guidance on the behaviours they are intended to drive. The introductory comments to each table emphasise that the indicator sets are intended to measure both effectiveness and efficiency and offer examples of how organisations can interpret multiple indicators to obtain a more comprehensive and balanced view of their overall performance. The introductions also describe the linkages to other related performance measurement initiatives and indicators.
3.5 Detailed definitions of the indicators (and of the terms used within them) are available on the Public Audit Forum website at www.public-audit-forum.gov.uk
Responses to the indicators
3.6 There has been uniformly positive feedback from the test sites that the indicators are useful management tools. This evaluation has confirmed that the distinction between primary and secondary indicators is helpful, with the strategic focus of a sub-set of key measures particularly welcomed. The test sites suggested that the number of indicators was about right, although some reduction would be welcome. However, in discussion with test sites about how we might achieve this, a consensus emerged that there were no obvious candidates for deletion and we should not reduce the number as their use was going to be voluntary – organisations individually should decide instead on which were most valuable for their performance management.

vfm in public sector corporate services �
3.7 The testing phases considered the scope for comparisons across the public sector. Most of the pilot sites were more interested initially in benchmarking their performance within sector, but they recognised that there could be value in the future in comparing performance within areas and down delivery chains. There was one exception to this conclusion – the estates management function. The variations in the nature and size of estates across the sectors were very significant and found to have a consequent impact on the data results. As a result, we concluded that any comparisons would need to be within sector.
3.8 Some pilot sites have reported that they believe that they will benefit more widely from the indicator sets , for example by using the information produced to inform decisions about whether and how to adopt shared services models or by using the indicator sets to drive improvements in professionalism in preparation for an application for foundation trust status.
Contextual factors
3.� In addition to identifying limitations for benchmarking the performance of the estates management function, nearly �0 possible contextual factors that might be responsible for differences in performance within and across sectors were suggested during the consultation phases. These were tested and only two were found to be completely outside the control of organisations:
l legislation and regulation, for example, the treatment of VAT
l wages and the local employment market
3.10 As a result, the indicators have not been adjusted to take account of external contextual factors but these will need to be considered when interpreting comparative data. There are a number of additional factors that are within the control of organisations but can only be changed in the medium to long term, for example, location, external infrastructure and partnership models of delivery.
10 vfm in public sector corporate services
Section 4: Next steps
4.1 This section sets out the audit agencies’ view of how these indicator sets relate to our respective audit and inspection programmes.
Encouraging the use of the indicators
4.� Since the inception of the project, the audit agencies have been clear that the use of the indicators should be voluntary, with public sector organisations proactively choosing to use them as part of their value for money improvement programmes. The agencies therefore plan to:
l publish the indicators to make them freely available to all organisations
l encourage third party organisations to incorporate the indicators in tools for benchmarking corporate services’ performance and sharing best practice. The audit agencies may seek to encourage third parties to do this by endorsing the products developed in exchange for assurances on prices charged and quality. We would not seek access to an individual organisation’s data directly from the third party provider.
4.3 The audit agencies currently have no plans to develop benchmarking databases in-house. This reflects a desire to ensure that use of the indicators is not assumed to be mandatory by the bodies that the agencies audit and inspect. One potential third party provider, the Chartered Institute of Public Finance and Accountancy (working together with KPMG), has already approached the agencies and is launching a benchmarking service shortly after the publication of this report.
4.4 All of the audit agencies have confirmed that, while use of the indicator sets will be on a voluntary basis, they strongly encourage their client organisations to make appropriate use of them in order to drive improvements in the efficiency and effectiveness of their corporate service functions. The agencies believe that these indicators (which have been subject to extensive piloting) should be valuable to most public sector organisations. Specific comments on how the indicators link to each of the audit agencies’ individual work programmes are below.
Audit Commission
4.5 The Audit Commission is keen to see local service providers use benchmarking information to help understand, demonstrate and improve their value for money performance. These indicators have significant potential to help organisations improve the efficiency and effectiveness of their corporate services functions. The importance of benchmarking performance is reflected in the key lines of enquiry that we use in our resources assessment programmes, including Comprehensive Performance Assessment in local government and Auditors’ Local Evaluation in the NHS. We have no plans to mandate the use of these indicators in the future. Instead, we will continue to encourage local service providers proactively to use benchmarking information to improve their value for money performance.
vfm in public sector corporate services 11
Audit Scotland
4.6 Corporate services are central to the efficient and effective running of public services. Performance management and reporting tends to be underdeveloped in these areas and these indicators provide a useful tool for supporting improvement. Use of the indicators is voluntary, but we encourage organisations to use the indicators to demonstrate value for money and best value, to identify opportunities for improvement, and to inform decisions about service delivery. Audits of best value will recognise the use of the indicator set. We also see benefits in support of our performance improvement role with, for example, national level output being used to help inform future work programmes.
National Audit Office
4.7 The NAO encourages central government bodies to collect data against the indicators, where they are not already doing something similar themselves, and to seek data on their comparative position. Use of the indicator sets in this way would be entirely voluntary. At the same time, where the NAO is conducting a value for money study on aspects of corporate services, we might want to draw on the indicators, where equivalent information does not already exist. In this case any access to the data would be through the NAO’s usual processes and liaison arrangements with audited bodies.
Northern Ireland Audit Office
4.8 The NIAO welcomes the development of these indicators. They offer public sector organisations opportunities to undertake voluntary benchmarking with their counterparts elsewhere. This can facilitate them to identify good practice and demonstrate efficient and effective delivery of corporate services.
Wales Audit Office
4.� The WAO encourages the use of these indicators as a means to comprehensively and consistently demonstrate improvement in corporate services and support the annual risk assessment process in local government. Use of the indicators within Wales will be on a voluntary basis and their use will be complementary to the existing Performance Measurement Framework. The ability to compare performance and learn from good practice both across the whole public sector and beyond national boundaries will be an additional benefit from their use.
Further development of the indicators
4.10 The audit agencies plan to further develop the indicator sets over time. For example some pilot sites have suggested that further sets could be drawn up to cover other corporate services such as legal services, communications and marketing. The agencies also intend to update the indicators themselves to reflect emerging good practice (for example by updating the management practices indicators).
1� vfm in public sector corporate services
Annex: Details of the indicator sets
(a) Human Resources (HR) value for money indicators
Key principles
The indicators fall into two broad categories, efficiency and effectiveness. Effectiveness is divided further into three sub-categories; impact, satisfaction and modernisation. Definitions of these terms can be found at paragraph �.3. The indicators for the HR function map onto this categorisation as follows:
It is important that organisations interpret the results from the indicators as a set, taking into account the information they offer on their performance in respect of both efficiency and effectiveness. For example, results for an efficiency measure such as primary indicator 1 (cost of the HR function) need to be interpreted alongside the results for effectiveness measures such as primary indicators 4 (leavers in the last year as a percentage of the average total staff ), 5 (average working days lost through sickness) and 7 (the number of good management practices adopted).
The table of indicators highlights some other linkages between specific measures. In addition, organisations will be able to identify further relationships between individual indicators that are specific to them, resulting from their particular circumstances.
The indicators do not attempt to cover all aspects of the wider impact of the HR function on the business. For example the extent to which HR enables change in the organisation; the effectiveness of HR in helping to build organisational capability; the degree of alignment of business and people strategies; and the degree of influence of HR on the top team. Assessment of these areas will be largely qualitative but equally important. While it is not possible to design performance indicators to cover these aspects that would fit within our indicator set, any wider overall assessments that are made of how the HR function is performing should take them into account.
Relationship between this indicator set and existing HR performance indicators
Primary indicator 5 in the set (measuring sickness absence) is aligned to the Best Value Performance Indicators used to measure local authorities. Benchmark data is available for this indicator in relation to the local government sector.
The Cabinet Office has mapped our indicator set onto its maturity matrix for HR functions in central government and considers that the indicators can provide useful data which can then be supplemented with more qualitative data about HR effectiveness. In particular, for central government, using the Cabinet Office maturity matrix will ensure that the wider impact of the HR function on the business is taken into account. In this way the two approaches to assessing different aspects of performance can complement each other.
Primary indicators
Secondary indicators
Efficiency 1,� �,5
Effectiveness: impact 3,4,5 1,3,4,6,7,8,�,10,11,1�,13
Effectiveness: satisfaction 6
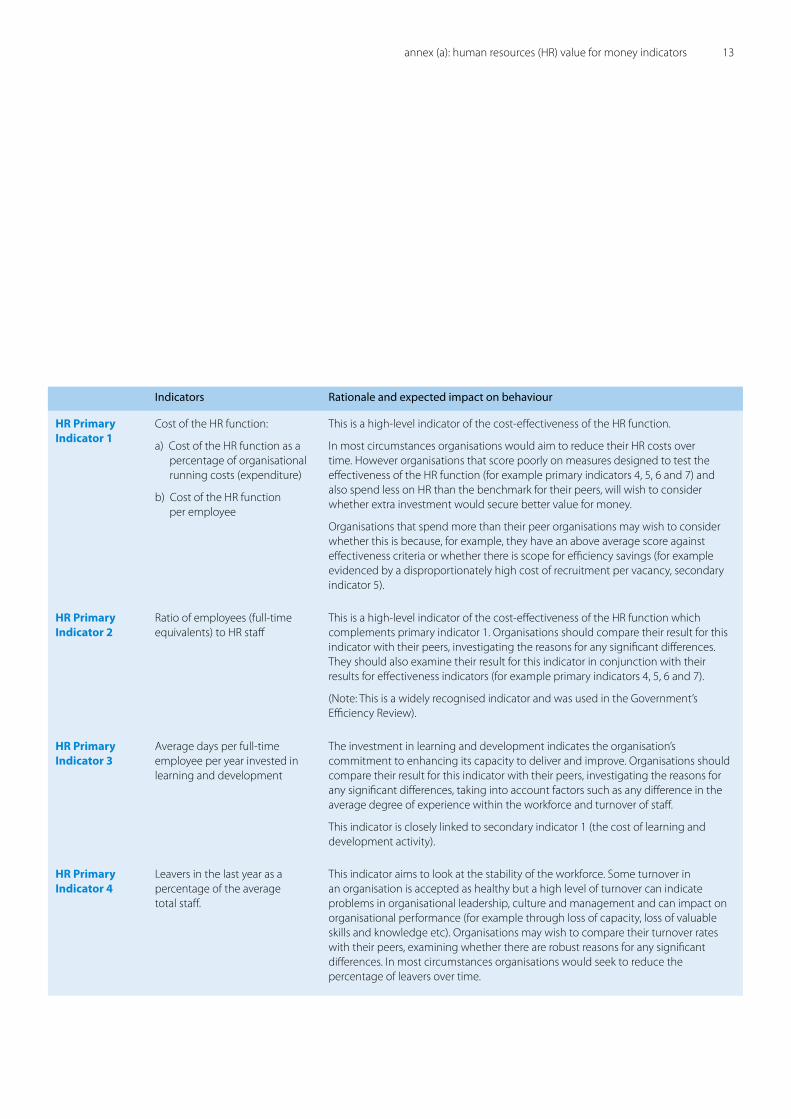
Indicators Rationale and expected impact on behaviour
HR Primary Indicator 1
Cost of the HR function:
a) Cost of the HR function as a percentage of organisational running costs (expenditure)
b) Cost of the HR function per employee
This is a high-level indicator of the cost-effectiveness of the HR function.
In most circumstances organisations would aim to reduce their HR costs over time. However organisations that score poorly on measures designed to test the effectiveness of the HR function (for example primary indicators 4, 5, 6 and 7) and also spend less on HR than the benchmark for their peers, will wish to consider whether extra investment would secure better value for money.
Organisations that spend more than their peer organisations may wish to consider whether this is because, for example, they have an above average score against effectiveness criteria or whether there is scope for efficiency savings (for example evidenced by a disproportionately high cost of recruitment per vacancy, secondary indicator 5).
HR Primary Indicator 2
Ratio of employees (full-time equivalents) to HR staff
This is a high-level indicator of the cost-effectiveness of the HR function which complements primary indicator 1. Organisations should compare their result for this indicator with their peers, investigating the reasons for any significant differences. They should also examine their result for this indicator in conjunction with their results for effectiveness indicators (for example primary indicators 4, 5, 6 and 7).
(Note: This is a widely recognised indicator and was used in the Government’s Efficiency Review).
HR Primary Indicator 3
Average days per full-time employee per year invested in learning and development
The investment in learning and development indicates the organisation’s commitment to enhancing its capacity to deliver and improve. Organisations should compare their result for this indicator with their peers, investigating the reasons for any significant differences, taking into account factors such as any difference in the average degree of experience within the workforce and turnover of staff.
This indicator is closely linked to secondary indicator 1 (the cost of learning and development activity).
HR Primary Indicator 4
Leavers in the last year as a percentage of the average total staff.
This indicator aims to look at the stability of the workforce. Some turnover in an organisation is accepted as healthy but a high level of turnover can indicate problems in organisational leadership, culture and management and can impact on organisational performance (for example through loss of capacity, loss of valuable skills and knowledge etc). Organisations may wish to compare their turnover rates with their peers, examining whether there are robust reasons for any significant differences. In most circumstances organisations would seek to reduce the percentage of leavers over time.
annex (a): human resources (HR) value for money indicators 13
14 vfm in public sector corporate services
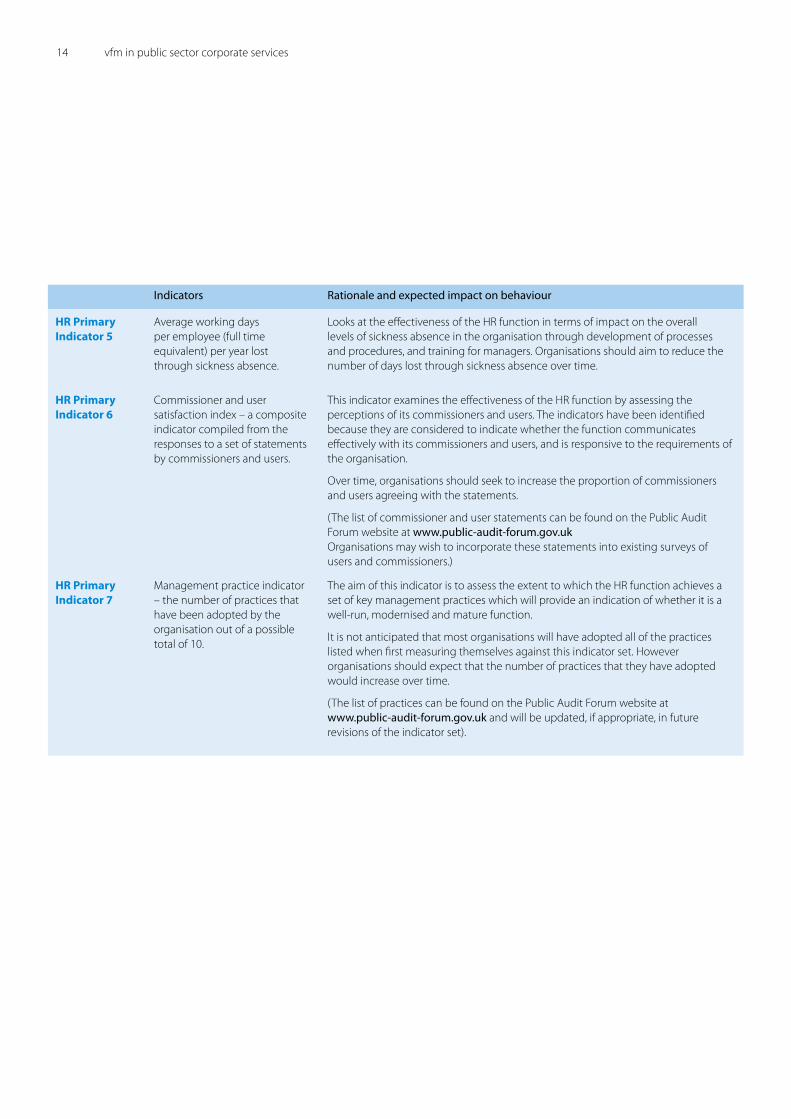
Indicators Rationale and expected impact on behaviour
HR Primary Indicator 5
Average working days per employee (full time equivalent) per year lost through sickness absence.
Looks at the effectiveness of the HR function in terms of impact on the overall levels of sickness absence in the organisation through development of processes and procedures, and training for managers. Organisations should aim to reduce the number of days lost through sickness absence over time.
HR Primary Indicator 6
Commissioner and user satisfaction index – a composite indicator compiled from the responses to a set of statements by commissioners and users.
This indicator examines the effectiveness of the HR function by assessing the perceptions of its commissioners and users. The indicators have been identified because they are considered to indicate whether the function communicates effectively with its commissioners and users, and is responsive to the requirements of the organisation.
Over time, organisations should seek to increase the proportion of commissioners and users agreeing with the statements.
(The list of commissioner and user statements can be found on the Public Audit Forum website at www.public-audit-forum.gov.uk Organisations may wish to incorporate these statements into existing surveys of users and commissioners.)
HR Primary Indicator 7
Management practice indicator – the number of practices that have been adopted by the organisation out of a possible total of 10.
The aim of this indicator is to assess the extent to which the HR function achieves a set of key management practices which will provide an indication of whether it is a well-run, modernised and mature function.
It is not anticipated that most organisations will have adopted all of the practices listed when first measuring themselves against this indicator set. However organisations should expect that the number of practices that they have adopted would increase over time.
(The list of practices can be found on the Public Audit Forum website at www.public-audit-forum.gov.uk and will be updated, if appropriate, in future revisions of the indicator set).
Indicators Rationale and expected impact on behaviour
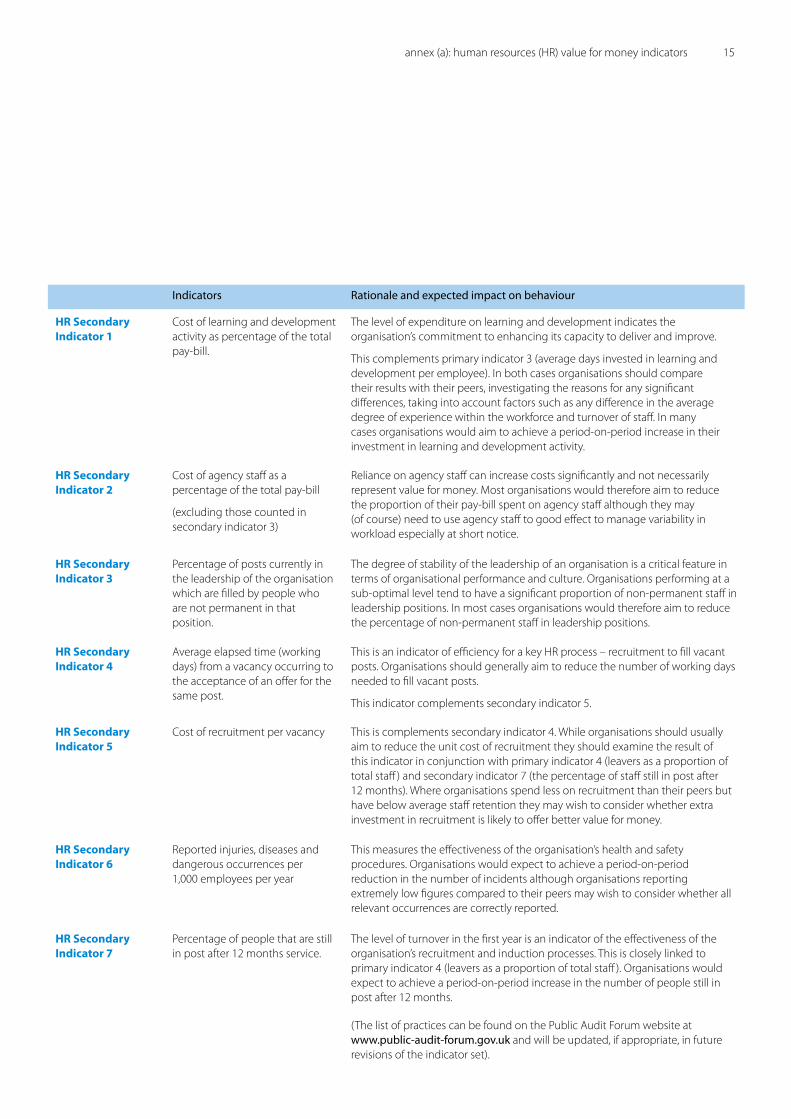
HR Secondary Indicator 1
Cost of learning and development activity as percentage of the total pay-bill.
The level of expenditure on learning and development indicates the organisation’s commitment to enhancing its capacity to deliver and improve.
This complements primary indicator 3 (average days invested in learning and development per employee). In both cases organisations should compare their results with their peers, investigating the reasons for any significant differences, taking into account factors such as any difference in the average degree of experience within the workforce and turnover of staff. In many cases organisations would aim to achieve a period-on-period increase in their investment in learning and development activity.
HR Secondary Indicator 2
Cost of agency staff as a percentage of the total pay-bill
(excluding those counted in secondary indicator 3)
Reliance on agency staff can increase costs significantly and not necessarily represent value for money. Most organisations would therefore aim to reduce the proportion of their pay-bill spent on agency staff although they may (of course) need to use agency staff to good effect to manage variability in workload especially at short notice.
HR Secondary Indicator 3
Percentage of posts currently in the leadership of the organisation which are filled by people who are not permanent in that position.
The degree of stability of the leadership of an organisation is a critical feature in terms of organisational performance and culture. Organisations performing at a sub-optimal level tend to have a significant proportion of non-permanent staff in leadership positions. In most cases organisations would therefore aim to reduce the percentage of non-permanent staff in leadership positions.
HR Secondary Indicator 4
Average elapsed time (working days) from a vacancy occurring to the acceptance of an offer for the same post.
This is an indicator of efficiency for a key HR process – recruitment to fill vacant posts. Organisations should generally aim to reduce the number of working days needed to fill vacant posts.
This indicator complements secondary indicator 5.
HR Secondary Indicator 5
Cost of recruitment per vacancy This is complements secondary indicator 4. While organisations should usually aim to reduce the unit cost of recruitment they should examine the result of this indicator in conjunction with primary indicator 4 (leavers as a proportion of total staff ) and secondary indicator 7 (the percentage of staff still in post after 1� months). Where organisations spend less on recruitment than their peers but have below average staff retention they may wish to consider whether extra investment in recruitment is likely to offer better value for money.
HR Secondary Indicator 6
Reported injuries, diseases and dangerous occurrences per 1,000 employees per year
This measures the effectiveness of the organisation’s health and safety procedures. Organisations would expect to achieve a period-on-period reduction in the number of incidents although organisations reporting extremely low figures compared to their peers may wish to consider whether all relevant occurrences are correctly reported.
HR Secondary Indicator 7
Percentage of people that are still in post after 1� months service.
The level of turnover in the first year is an indicator of the effectiveness of the organisation’s recruitment and induction processes. This is closely linked to primary indicator 4 (leavers as a proportion of total staff ). Organisations would expect to achieve a period-on-period increase in the number of people still in post after 1� months.
(The list of practices can be found on the Public Audit Forum website at www.public-audit-forum.gov.uk and will be updated, if appropriate, in future revisions of the indicator set).
annex (a): human resources (HR) value for money indicators 15
16 vfm in public sector corporate services
Indicators Rationale and expected impact on behaviour
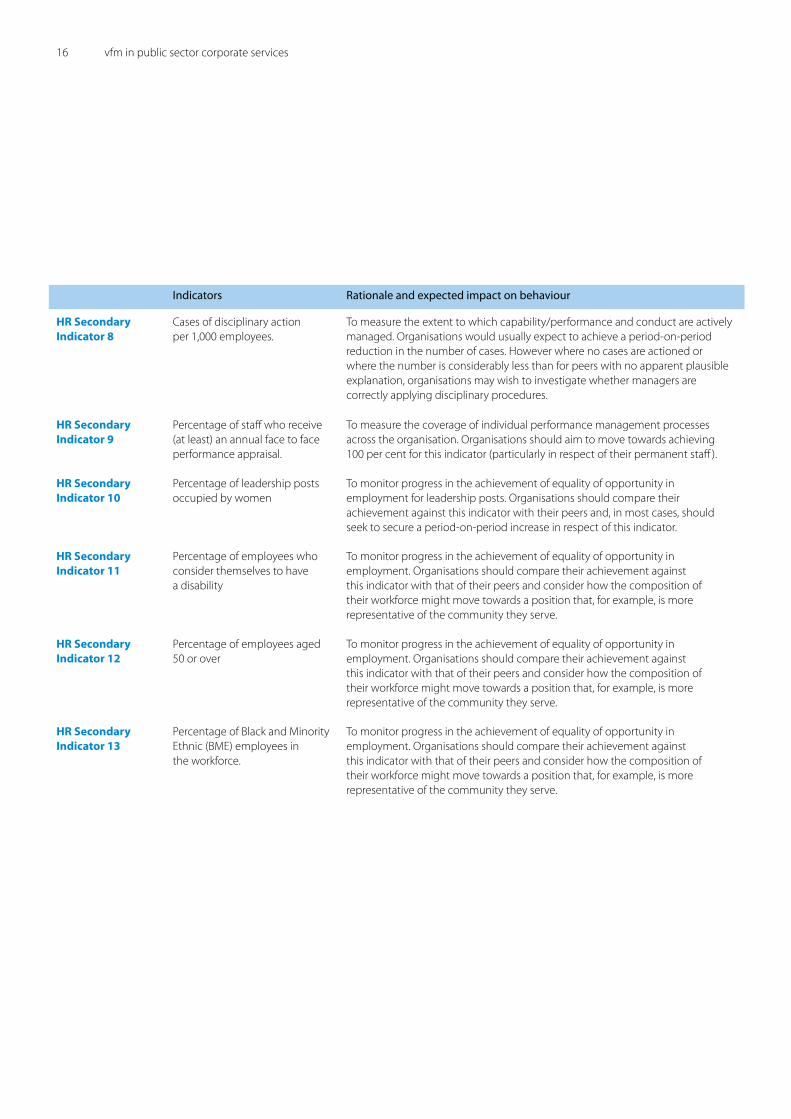
HR Secondary Indicator 8
Cases of disciplinary action per 1,000 employees.
To measure the extent to which capability/performance and conduct are actively managed. Organisations would usually expect to achieve a period-on-period reduction in the number of cases. However where no cases are actioned or where the number is considerably less than for peers with no apparent plausible explanation, organisations may wish to investigate whether managers are correctly applying disciplinary procedures.
HR Secondary Indicator 9
Percentage of staff who receive (at least) an annual face to face performance appraisal.
To measure the coverage of individual performance management processes across the organisation. Organisations should aim to move towards achieving 100 per cent for this indicator (particularly in respect of their permanent staff ).
HR Secondary Indicator 10
Percentage of leadership posts occupied by women
To monitor progress in the achievement of equality of opportunity in employment for leadership posts. Organisations should compare their achievement against this indicator with their peers and, in most cases, should seek to secure a period-on-period increase in respect of this indicator.
HR Secondary Indicator 11
Percentage of employees who consider themselves to have a disability
To monitor progress in the achievement of equality of opportunity in employment. Organisations should compare their achievement against this indicator with that of their peers and consider how the composition of their workforce might move towards a position that, for example, is more representative of the community they serve.
HR Secondary Indicator 12
Percentage of employees aged 50 or over
To monitor progress in the achievement of equality of opportunity in employment. Organisations should compare their achievement against this indicator with that of their peers and consider how the composition of their workforce might move towards a position that, for example, is more representative of the community they serve.
HR Secondary Indicator 13
Percentage of Black and Minority Ethnic (BME) employees in the workforce.
To monitor progress in the achievement of equality of opportunity in employment. Organisations should compare their achievement against this indicator with that of their peers and consider how the composition of their workforce might move towards a position that, for example, is more representative of the community they serve.
Key principles
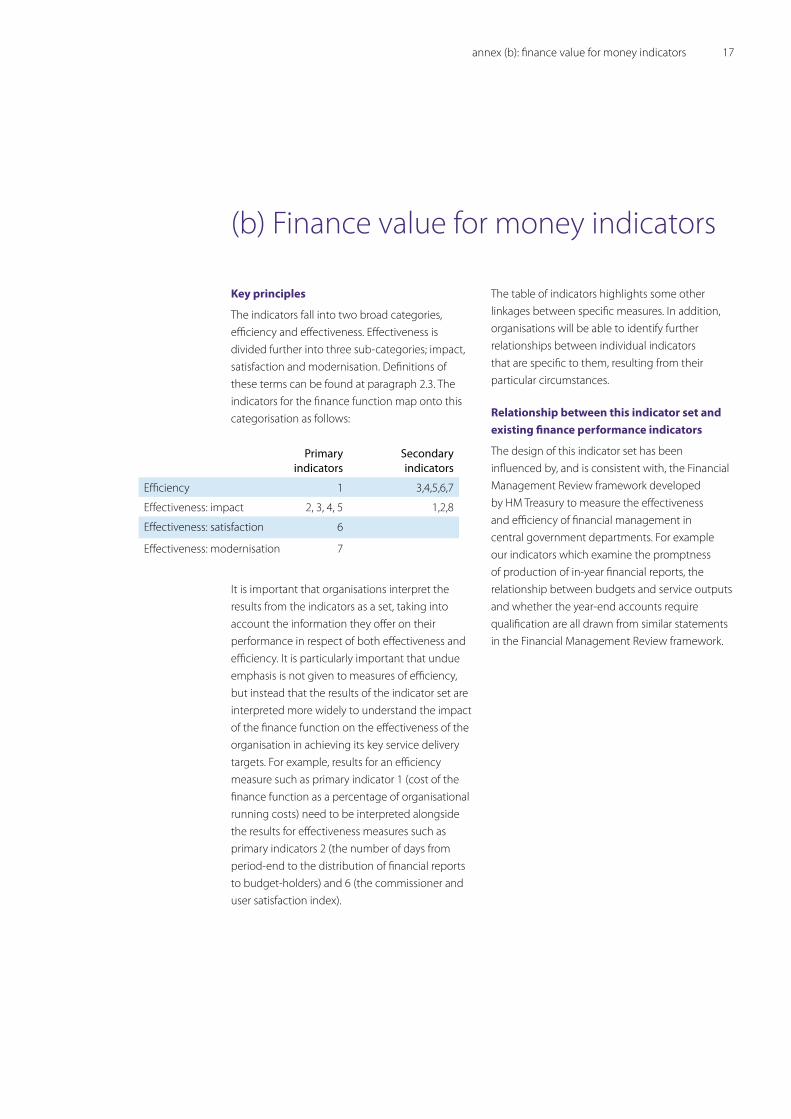
The indicators fall into two broad categories, efficiency and effectiveness. Effectiveness is divided further into three sub-categories; impact, satisfaction and modernisation. Definitions of these terms can be found at paragraph �.3. The indicators for the finance function map onto this categorisation as follows:
It is important that organisations interpret the results from the indicators as a set, taking into account the information they offer on their performance in respect of both effectiveness and efficiency. It is particularly important that undue emphasis is not given to measures of efficiency, but instead that the results of the indicator set are interpreted more widely to understand the impact of the finance function on the effectiveness of the organisation in achieving its key service delivery targets. For example, results for an efficiency measure such as primary indicator 1 (cost of the finance function as a percentage of organisational running costs) need to be interpreted alongside the results for effectiveness measures such as primary indicators � (the number of days from period-end to the distribution of financial reports to budget-holders) and 6 (the commissioner and user satisfaction index).
The table of indicators highlights some other linkages between specific measures. In addition, organisations will be able to identify further relationships between individual indicators that are specific to them, resulting from their particular circumstances.
Relationship between this indicator set and existing finance performance indicators
The design of this indicator set has been influenced by, and is consistent with, the Financial Management Review framework developed by HM Treasury to measure the effectiveness and efficiency of financial management in central government departments. For example our indicators which examine the promptness of production of in-year financial reports, the relationship between budgets and service outputs and whether the year-end accounts require qualification are all drawn from similar statements in the Financial Management Review framework.
Primary indicators
Secondary indicators
Efficiency 1 3,4,5,6,7
Effectiveness: impact �, 3, 4, 5 1,�,8
Effectiveness: satisfaction 6
Effectiveness: modernisation 7
(b) Finance value for money indicators
annex (b): finance value for money indicators 17
18 vfm in public sector corporate services
Indicators Rationale and expected impact on behaviour
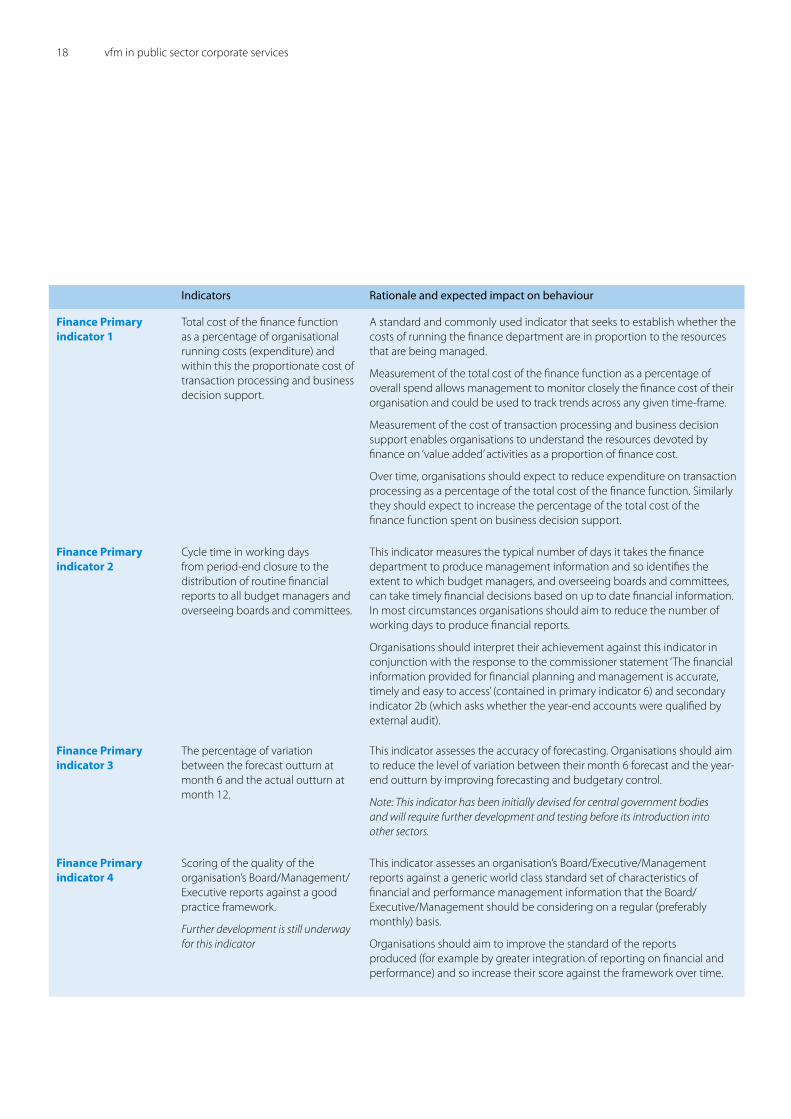
Finance Primary indicator 1
Total cost of the finance function as a percentage of organisational running costs (expenditure) and within this the proportionate cost of transaction processing and business decision support.
A standard and commonly used indicator that seeks to establish whether the costs of running the finance department are in proportion to the resources that are being managed.
Measurement of the total cost of the finance function as a percentage of overall spend allows management to monitor closely the finance cost of their organisation and could be used to track trends across any given time-frame.
Measurement of the cost of transaction processing and business decision support enables organisations to understand the resources devoted by finance on ‘value added’ activities as a proportion of finance cost.
Over time, organisations should expect to reduce expenditure on transaction processing as a percentage of the total cost of the finance function. Similarly they should expect to increase the percentage of the total cost of the finance function spent on business decision support.
Finance Primary indicator 2
Cycle time in working days from period-end closure to the distribution of routine financial reports to all budget managers and overseeing boards and committees.
This indicator measures the typical number of days it takes the finance department to produce management information and so identifies the extent to which budget managers, and overseeing boards and committees, can take timely financial decisions based on up to date financial information. In most circumstances organisations should aim to reduce the number of working days to produce financial reports.
Organisations should interpret their achievement against this indicator in conjunction with the response to the commissioner statement ‘The financial information provided for financial planning and management is accurate, timely and easy to access’ (contained in primary indicator 6) and secondary indicator �b (which asks whether the year-end accounts were qualified by external audit).
Finance Primary indicator 3
The percentage of variation between the forecast outturn at month 6 and the actual outturn at month 1�.
This indicator assesses the accuracy of forecasting. Organisations should aim to reduce the level of variation between their month 6 forecast and the year-end outturn by improving forecasting and budgetary control.
Note: This indicator has been initially devised for central government bodies and will require further development and testing before its introduction into other sectors.
Finance Primary indicator 4
Scoring of the quality of the organisation’s Board/Management/Executive reports against a good practice framework.
Further development is still underway for this indicator
This indicator assesses an organisation’s Board/Executive/Management reports against a generic world class standard set of characteristics of financial and performance management information that the Board/Executive/Management should be considering on a regular (preferably monthly) basis.
Organisations should aim to improve the standard of the reports produced (for example by greater integration of reporting on financial and performance) and so increase their score against the framework over time.
Indicators Rationale and expected impact on behaviour
Finance Primary indicator 5
Percentage of public sector organisation spend for which there are fully costed outputs which are measured by key performance metrics and for which a named individual is accountable.
High performing organisations are likely to ensure that the totality of their spend is allocated against outputs, supported by key metrics which measure performance with clear lines of accountability.
Over time, organisations should aim to increase the percentage of their spend that meets the criteria of this indicator.
Note: This indicator has been initially devised for central government bodies and will require further development and testing before its introduction into other sectors.
Finance Primary indicator 6
Commissioner and user satisfaction index – a composite indicator compiled from the responses to a set of statements by commissioners and users
This indicator examines the effectiveness of the finance function by assessing the perceptions of its commissioners and users. The indicators have been identified because they are considered to indicate whether the function communicates effectively with its commissioners and users, and is responsive to the requirements of the organisation.
Over time, organisations should seek to increase the proportion of commissioners and users agreeing with the statements.
(The list of commissioner and user statements can be found on the Public Audit Forum website at www.public-audit-forum.gov.uk Organisations may wish to incorporate these statements into existing surveys of users and commissioners.).
Finance Primary indicator 7
For central government organisations
Management practice indicator – CIPFA Financial Management Model
Further development is still underway for this indicator
CIPFA is currently revising its Financial Management framework, due to be issued in July �007. This framework offers a robust overall assessment of the organisation’s financial management capacity and capability, highlighting both strengths and areas for improvement.
Well run organisations would expect to increase their score against the Model over time.
For all other organisations
Management practice indicator – the number of practices that have been adopted by the organisation out of a possible total of 10.
The aim of this indicator is to assess the extent to which the finance function achieves a set of key management practices which will provide an indication of whether it is a well-run, modernised and mature function.
It is not anticipated that most organisations will have adopted all of the practices listed when first measuring themselves against this indicator set. However organisations should expect that the number of practices that they have adopted would increase over time.
(The list of practices can be found on the Public Audit Forum website at www.public-audit-forum.gov.uk and will be updated, if appropriate, in future) revisions of the indicator set).
annex (b): finance value for money indicators 1�
�0 vfm in public sector corporate services
Indicators Rationale and expected impact on behaviour
Finance Secondary indicator 1
Professionally qualified finance staff (FTEs) as a percentage of total finance staff (FTEs) undertaking reporting, controls and decision support processes (i.e. excludes those staff involved in transactional processes)
This indicator assesses the capacity and competency of the finance department by examining the proportion of staff with a professional accountancy qualification.
In most cases organisations would aim for a period-on-period increase in this percentage. Organisations should interpret their achievement against this indicator alongside primary indicator 6 (the commissioner and user satisfaction index) and secondary indicator � (the length of time necessary to produce year-end accounts and whether those accounts required qualification).
Finance Secondary indicator 2
a) Cycle time in working days from year-end closure to submission of audited accounts.
b) Was the latest set of annual accounts qualified by external audit?
This indicator examines the effectiveness of the finance function by assessing their ability to produce a timely and accurate set of final audited accounts.
In most circumstances organisations should aim to both reduce the number of days taken to prepare their year-end accounts and ensure that they do not require external qualification.
Finance Secondary indicator 3
Cost of the Customer Invoicing function per customer invoice processed
A standard and commonly used indicator that examines the efficiency of the invoicing function by identifying the cost of raising each customer invoice. Organisations should interpret achievement against this indicator alongside secondary indicators 5 (credit notes as a percentage of invoices raised) and 6 (cost of Accounts Payable per invoice processed).
In most cases organisations should aim for a period-on-period reduction in the average cost of invoice processing.
This indicator could additionally suggest the minimum value for which an invoice should be raised.
Finance Secondary indicator 4
Debtor days A standard and commonly used indicator that identifies the average number of days for the organisation to receive payment for its invoices. Organisations should aim to achieve a period-on-period reduction in average debtor days.
Finance Secondary indicator 5
Credit notes as a percentage of total customer invoices raised
This indicator examines the accuracy of invoices raised by reviewing the number of credit notes required to make adjustments to invoices previously raised.
Organisations should aim to achieve a period-on-period reduction in the percentage achieved for this indicator. Organisations should interpret achievement against this indicator alongside secondary indicators 3 (cost per invoice raised) and 6 (cost of Accounts Payable per invoice processed).
(Note: The indicator is being used as a proxy for accuracy although it is recognised that organisations may use other mechanisms to make adjustments).
Indicators Rationale and expected impact on behaviour
Finance Secondary indicator 6
Cost of Accounts Payable per accounts payable invoice processed
A standard and commonly used indicator identifies the cost of processing each supplier invoice. Organisations should aim to achieve a period-on-period reduction in the cost achieved for this indicator. Organisations should interpret achievement against this indicator alongside secondary indicators 3 (cost per invoice raised) and 5 (credit notes as a percentage of invoices raised).
Finance Secondary indicator 7
Proportion of all payments made by electronic means
This indicator identifies the proportion of all payments made electronically, particularly with respect to BACs and RfT1, since these methods usually offer the most effective savings of time and cost compared with manual payment systems. In most cases organisations would seek to achieve a period-on-period increase in the proportion of payments made electronically.
Finance Secondary indicator 8
Proportion of outstanding debt that is more than �0 days old from date of invoice
This indicator examines the ability of the finance department to recover outstanding debts from customers. We have adopted the commonly used �0-day credit period as the basis for the indicator. Organisations should aim to achieve a period-on-period reduction in the proportion achieved for this indicator. This indicator should be used in tandem with Secondary Indicator 4.
Additional indicators for use outside central government
Finance Secondary indicator 9
Cost of finance in relation to business decision support as a percentage of the total cost of decision support plus reporting and controls (i.e. excludes transaction processing)
This indicator measures the resources devoted by finance on ‘value added’ activities as a proportion of finance cost. The indicator excludes transactional activities which can significantly distort the picture.
In most cases organisations should aim for a period-on-period increase in the proportion of finance function resources assigned to business decision support. However the optimal figure will always be a long way short of 100 per cent as work around reporting and controls will remain important.
Finance Secondary indicator 10
Creditor days A standard and commonly used indicator that identifies the average number of days it takes for the organisation to pay for its purchases. Performance should be within the appropriate prompt payment requirements.
Finance Secondary indicator 11
Payroll admin cost per employee paid
A standard and commonly used indicator that seeks to establish the cost of paying one single employee as an indicator of the cost effectiveness of the Payroll function.
In most cases organisations should aim for a period-on-period reduction in the average cost.
(Note: This function may be a responsibility of HR in some organisations. In these instances the indicator should accordingly be completed by HR)
annex (b): finance value for money indicators �1
�� vfm in public sector corporate services
Key principles
The indicators fall into two broad categories, efficiency and effectiveness. Effectiveness is divided further into three sub-categories; impact, satisfaction and modernisation. Definitions of these terms can be found at paragraph �.3. The indicators for the ICT function map onto this categorisation as follows:
It is important that organisations interpret the results from the indicators as a set, taking into account the information they offer on their performance in respect of both efficiency and effectiveness. For example, results for an efficiency measure such as primary indicator 1 (the cost of the ICT function as a percentage of organisational running costs) need to be interpreted alongside the results for effectiveness measures such as primary indicators 4 (the percentage of incidents resolved within agreed service levels), 7 (the commissioner and user satisfaction index) and 8 (the management practice indicator).
The table of indicators highlights some other linkages between specific measures. Organisations will be able to identify further relationships between individual indicators that are specific to them, resulting from their particular circumstances.
Relationship between this indicator set and existing ICT performance indicators
The best known benchmarking initiative for the ICT function in the public sector is provided by the Society of Information Technology Management (SOCITM) which is widely used in the local government sector. SOCITM has developed benchmarks for these indicators.
Half of our indicators are the same or similar to those used by SOCITM (primary indicators �, 4, 5 and 7, and secondary indicators 1, �, 3 and 6). In addition we have taken into account detailed feedback from SOCITM in devising the indicator set.
Primary indicators 3, 4, 5 and 7 and secondary indicator 4 are closely aligned to those included in a recent pilot benchmarking initiative of the central government ICT function undertaken by PA and Gartner who used private sector benchmarks in their approach.
Primary indicators
Secondary indicators
Efficiency 1,3 1,�,6
Effectiveness: impact �,4,5 3,4,5
Effectiveness: satisfaction 7
Effectiveness: modernisation 6,8
(c) Information and Communication Technology (ICT) value for money indicators
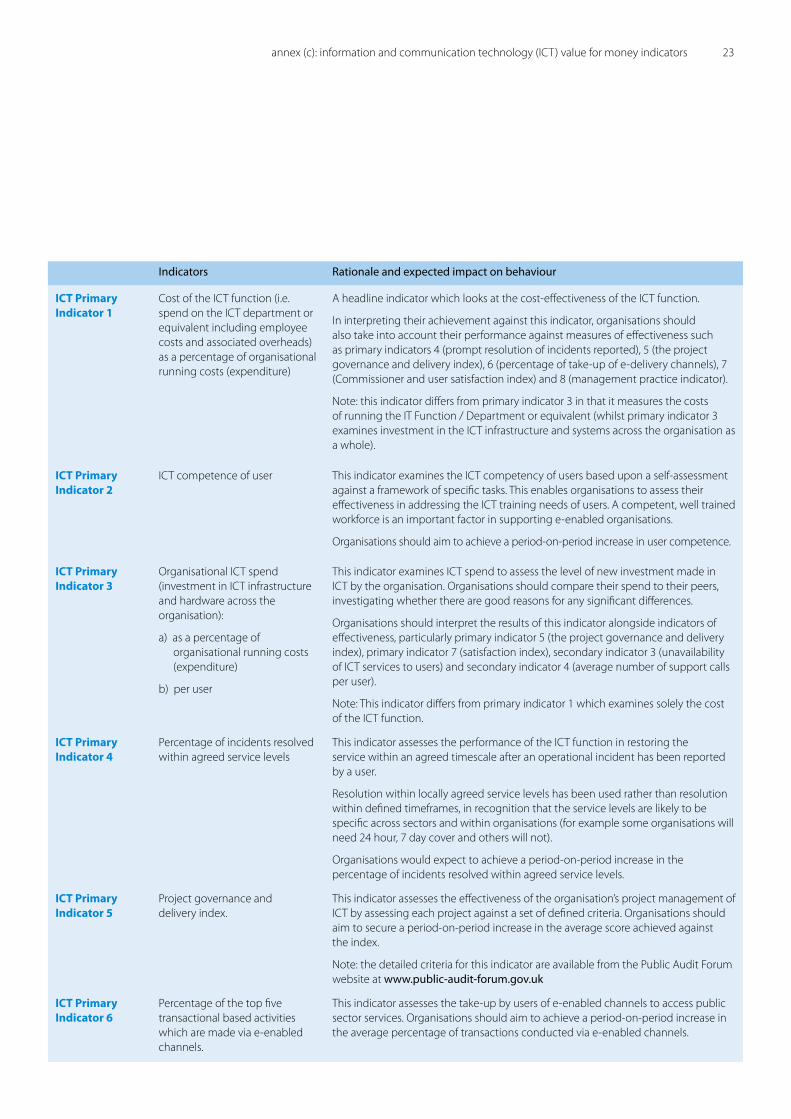
Indicators Rationale and expected impact on behaviour
ICT Primary Indicator 1
Cost of the ICT function (i.e. spend on the ICT department or equivalent including employee costs and associated overheads) as a percentage of organisational running costs (expenditure)
A headline indicator which looks at the cost-effectiveness of the ICT function.
In interpreting their achievement against this indicator, organisations should also take into account their performance against measures of effectiveness such as primary indicators 4 (prompt resolution of incidents reported), 5 (the project governance and delivery index), 6 (percentage of take-up of e-delivery channels), 7 (Commissioner and user satisfaction index) and 8 (management practice indicator).
Note: this indicator differs from primary indicator 3 in that it measures the costs of running the IT Function / Department or equivalent (whilst primary indicator 3 examines investment in the ICT infrastructure and systems across the organisation as a whole).
ICT Primary Indicator 2
ICT competence of user This indicator examines the ICT competency of users based upon a self-assessment against a framework of specific tasks. This enables organisations to assess their effectiveness in addressing the ICT training needs of users. A competent, well trained workforce is an important factor in supporting e-enabled organisations.
Organisations should aim to achieve a period-on-period increase in user competence.
ICT Primary Indicator 3
Organisational ICT spend (investment in ICT infrastructure and hardware across the organisation):
a) as a percentage of organisational running costs (expenditure)
b) per user
This indicator examines ICT spend to assess the level of new investment made in ICT by the organisation. Organisations should compare their spend to their peers, investigating whether there are good reasons for any significant differences.
Organisations should interpret the results of this indicator alongside indicators of effectiveness, particularly primary indicator 5 (the project governance and delivery index), primary indicator 7 (satisfaction index), secondary indicator 3 (unavailability of ICT services to users) and secondary indicator 4 (average number of support calls per user).
Note: This indicator differs from primary indicator 1 which examines solely the cost of the ICT function.
ICT Primary Indicator 4
Percentage of incidents resolved within agreed service levels
This indicator assesses the performance of the ICT function in restoring the service within an agreed timescale after an operational incident has been reported by a user.
Resolution within locally agreed service levels has been used rather than resolution within defined timeframes, in recognition that the service levels are likely to be specific across sectors and within organisations (for example some organisations will need �4 hour, 7 day cover and others will not).
Organisations would expect to achieve a period-on-period increase in the percentage of incidents resolved within agreed service levels.
ICT Primary Indicator 5
Project governance and delivery index.
This indicator assesses the effectiveness of the organisation’s project management of ICT by assessing each project against a set of defined criteria. Organisations should aim to secure a period-on-period increase in the average score achieved against the index.
Note: the detailed criteria for this indicator are available from the Public Audit Forum website at www.public-audit-forum.gov.uk
ICT Primary Indicator 6
Percentage of the top five transactional based activities which are made via e-enabled channels.
This indicator assesses the take-up by users of e-enabled channels to access public sector services. Organisations should aim to achieve a period-on-period increase in the average percentage of transactions conducted via e-enabled channels.
annex (c): information and communication technology (ICT) value for money indicators �3
�4 vfm in public sector corporate services
Indicators Rationale and expected impact on behaviour
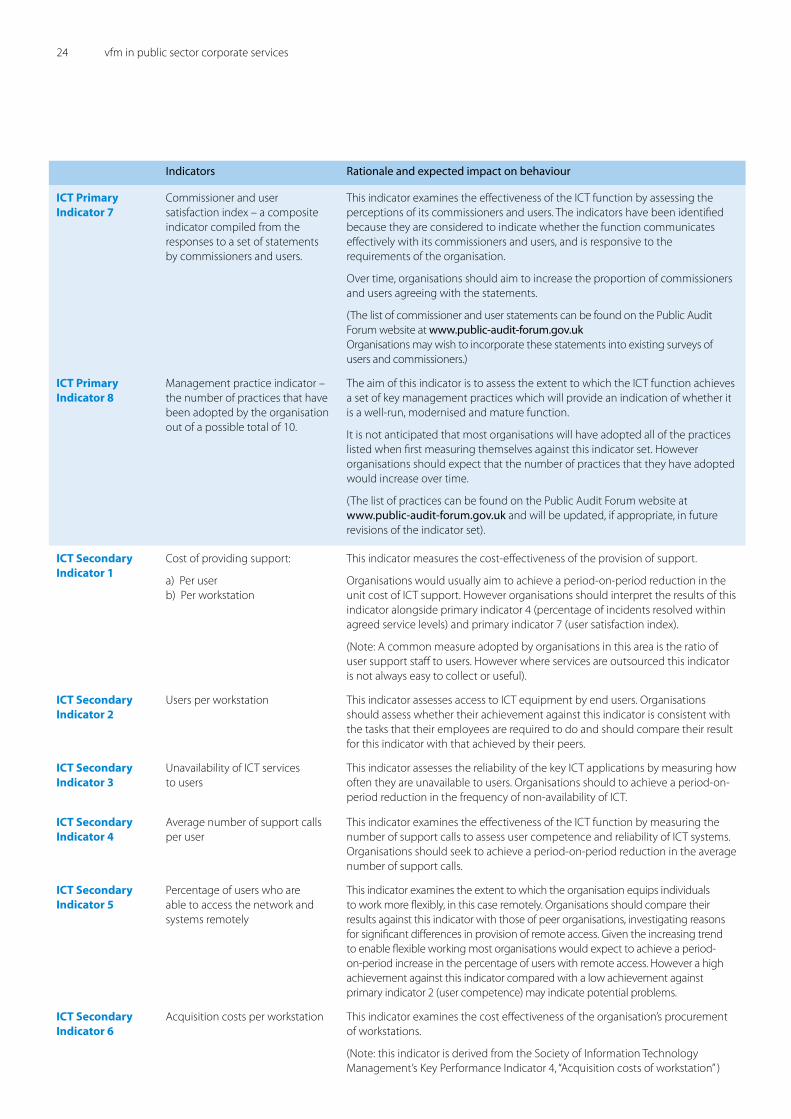
ICT Primary Indicator 7
Commissioner and user satisfaction index – a composite indicator compiled from the responses to a set of statements by commissioners and users.
This indicator examines the effectiveness of the ICT function by assessing the perceptions of its commissioners and users. The indicators have been identified because they are considered to indicate whether the function communicates effectively with its commissioners and users, and is responsive to the requirements of the organisation.
Over time, organisations should aim to increase the proportion of commissioners and users agreeing with the statements.
(The list of commissioner and user statements can be found on the Public Audit Forum website at www.public-audit-forum.gov.uk Organisations may wish to incorporate these statements into existing surveys of users and commissioners.)
ICT Primary Indicator 8
Management practice indicator – the number of practices that have been adopted by the organisation out of a possible total of 10.
The aim of this indicator is to assess the extent to which the ICT function achieves a set of key management practices which will provide an indication of whether it is a well-run, modernised and mature function.
It is not anticipated that most organisations will have adopted all of the practices listed when first measuring themselves against this indicator set. However organisations should expect that the number of practices that they have adopted would increase over time.
(The list of practices can be found on the Public Audit Forum website at www.public-audit-forum.gov.uk and will be updated, if appropriate, in future revisions of the indicator set).
ICT Secondary Indicator 1
Cost of providing support:
a) Per user b) Per workstation
This indicator measures the cost-effectiveness of the provision of support.
Organisations would usually aim to achieve a period-on-period reduction in the unit cost of ICT support. However organisations should interpret the results of this indicator alongside primary indicator 4 (percentage of incidents resolved within agreed service levels) and primary indicator 7 (user satisfaction index).
(Note: A common measure adopted by organisations in this area is the ratio of user support staff to users. However where services are outsourced this indicator is not always easy to collect or useful).
ICT Secondary Indicator 2
Users per workstation This indicator assesses access to ICT equipment by end users. Organisations should assess whether their achievement against this indicator is consistent with the tasks that their employees are required to do and should compare their result for this indicator with that achieved by their peers.
ICT Secondary Indicator 3
Unavailability of ICT services to users
This indicator assesses the reliability of the key ICT applications by measuring how often they are unavailable to users. Organisations should to achieve a period-on-period reduction in the frequency of non-availability of ICT.
ICT Secondary Indicator 4
Average number of support calls per user
This indicator examines the effectiveness of the ICT function by measuring the number of support calls to assess user competence and reliability of ICT systems. Organisations should seek to achieve a period-on-period reduction in the average number of support calls.
ICT Secondary Indicator 5
Percentage of users who are able to access the network and systems remotely
This indicator examines the extent to which the organisation equips individuals to work more flexibly, in this case remotely. Organisations should compare their results against this indicator with those of peer organisations, investigating reasons for significant differences in provision of remote access. Given the increasing trend to enable flexible working most organisations would expect to achieve a period-on-period increase in the percentage of users with remote access. However a high achievement against this indicator compared with a low achievement against primary indicator � (user competence) may indicate potential problems.
ICT Secondary Indicator 6
Acquisition costs per workstation This indicator examines the cost effectiveness of the organisation’s procurement of workstations.
(Note: this indicator is derived from the Society of Information Technology Management’s Key Performance Indicator 4, “Acquisition costs of workstation” )
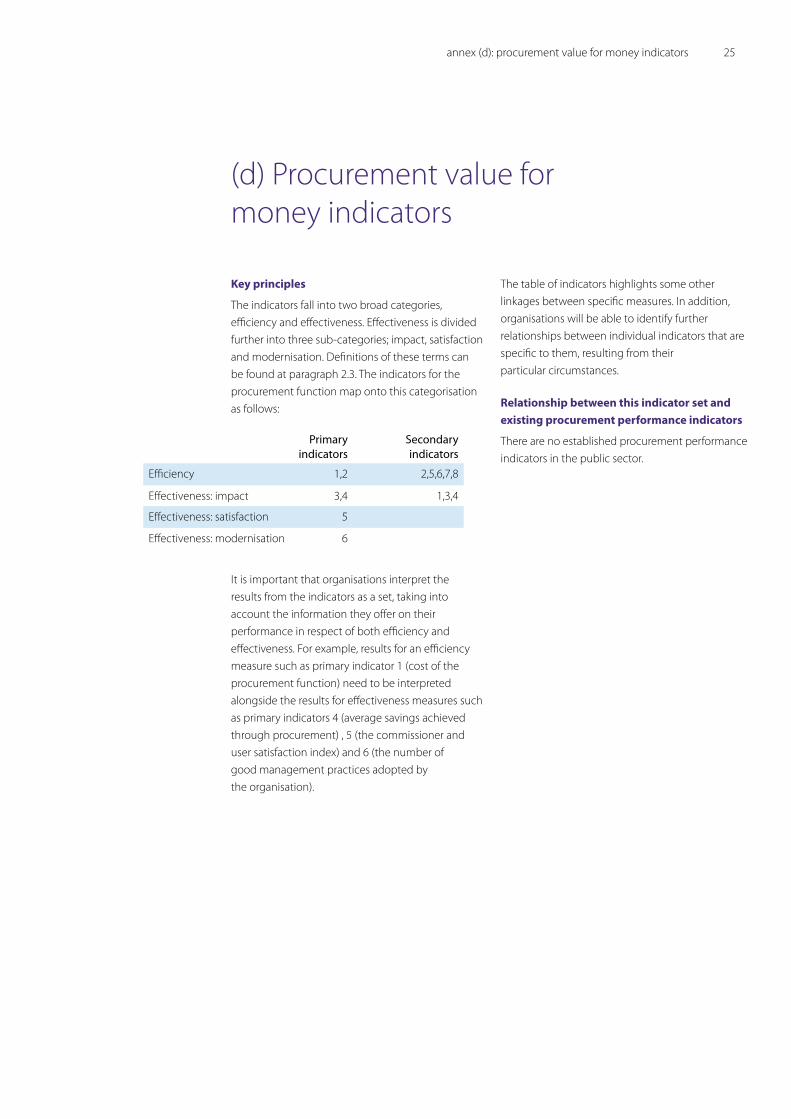
Key principles
The indicators fall into two broad categories, efficiency and effectiveness. Effectiveness is divided further into three sub-categories; impact, satisfaction and modernisation. Definitions of these terms can be found at paragraph �.3. The indicators for the procurement function map onto this categorisation as follows:
It is important that organisations interpret the results from the indicators as a set, taking into account the information they offer on their performance in respect of both efficiency and effectiveness. For example, results for an efficiency measure such as primary indicator 1 (cost of the procurement function) need to be interpreted alongside the results for effectiveness measures such as primary indicators 4 (average savings achieved through procurement) , 5 (the commissioner and user satisfaction index) and 6 (the number of good management practices adopted by the organisation).
The table of indicators highlights some other linkages between specific measures. In addition, organisations will be able to identify further relationships between individual indicators that are specific to them, resulting from their particular circumstances.
Relationship between this indicator set and existing procurement performance indicators
There are no established procurement performance indicators in the public sector.
Primary indicators
Secondary indicators
Efficiency 1,� �,5,6,7,8
Effectiveness: impact 3,4 1,3,4
Effectiveness: satisfaction 5
Effectiveness: modernisation 6
(d) Procurement value for money indicators
annex (d): procurement value for money indicators �5
�6 vfm in public sector corporate services
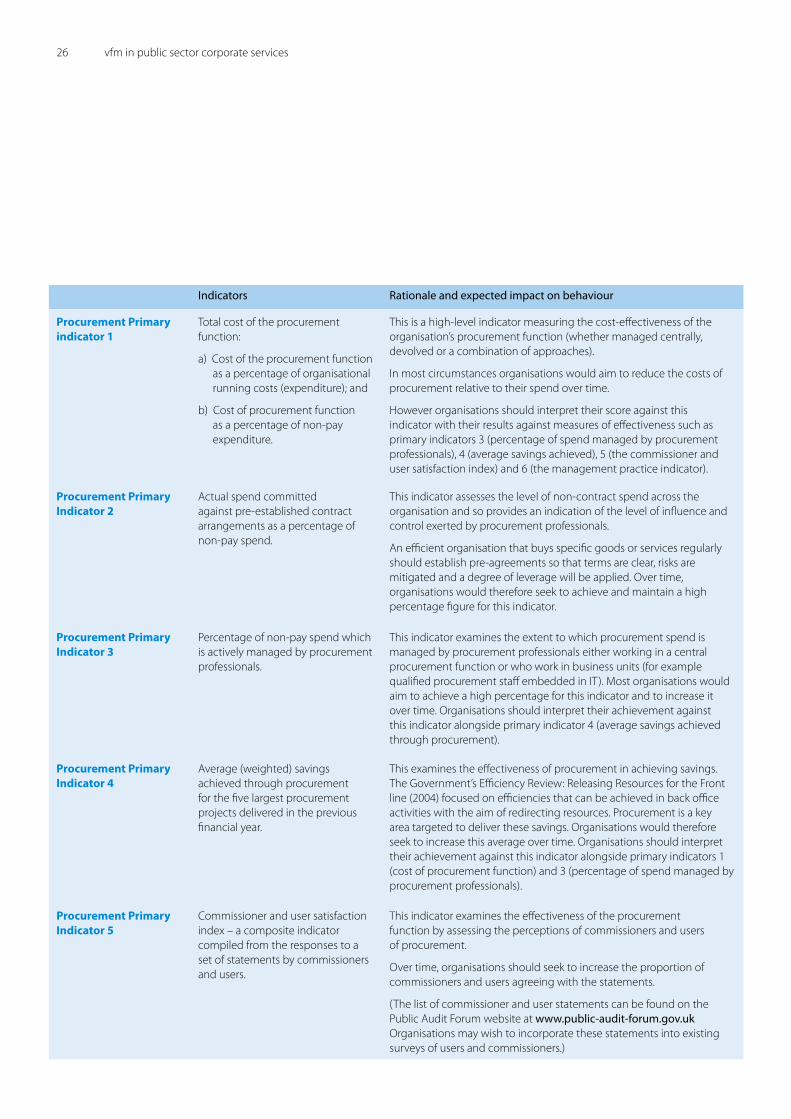
Indicators Rationale and expected impact on behaviour
Procurement Primary indicator 1
Total cost of the procurement function:
a) Cost of the procurement function as a percentage of organisational running costs (expenditure); and
b) Cost of procurement function as a percentage of non-pay expenditure.
This is a high-level indicator measuring the cost-effectiveness of the organisation’s procurement function (whether managed centrally, devolved or a combination of approaches).
In most circumstances organisations would aim to reduce the costs of procurement relative to their spend over time.
However organisations should interpret their score against this indicator with their results against measures of effectiveness such as primary indicators 3 (percentage of spend managed by procurement professionals), 4 (average savings achieved), 5 (the commissioner and user satisfaction index) and 6 (the management practice indicator).
Procurement Primary Indicator 2
Actual spend committed against pre-established contract arrangements as a percentage of non-pay spend.
This indicator assesses the level of non-contract spend across the organisation and so provides an indication of the level of influence and control exerted by procurement professionals.
An efficient organisation that buys specific goods or services regularly should establish pre-agreements so that terms are clear, risks are mitigated and a degree of leverage will be applied. Over time, organisations would therefore seek to achieve and maintain a high percentage figure for this indicator.
Procurement Primary Indicator 3
Percentage of non-pay spend which is actively managed by procurement professionals.
This indicator examines the extent to which procurement spend is managed by procurement professionals either working in a central procurement function or who work in business units (for example qualified procurement staff embedded in IT). Most organisations would aim to achieve a high percentage for this indicator and to increase it over time. Organisations should interpret their achievement against this indicator alongside primary indicator 4 (average savings achieved through procurement).
Procurement Primary Indicator 4
Average (weighted) savings achieved through procurement for the five largest procurement projects delivered in the previous financial year.
This examines the effectiveness of procurement in achieving savings.The Government’s Efficiency Review: Releasing Resources for the Front line (�004) focused on efficiencies that can be achieved in back office activities with the aim of redirecting resources. Procurement is a key area targeted to deliver these savings. Organisations would therefore seek to increase this average over time. Organisations should interpret their achievement against this indicator alongside primary indicators 1 (cost of procurement function) and 3 (percentage of spend managed by procurement professionals).
Procurement Primary Indicator 5
Commissioner and user satisfaction index – a composite indicator compiled from the responses to a set of statements by commissioners and users.
This indicator examines the effectiveness of the procurement function by assessing the perceptions of commissioners and users of procurement.
Over time, organisations should seek to increase the proportion of commissioners and users agreeing with the statements.
(The list of commissioner and user statements can be found on the Public Audit Forum website at www.public-audit-forum.gov.uk Organisations may wish to incorporate these statements into existing surveys of users and commissioners.)
Indicators Rationale and expected impact on behaviour
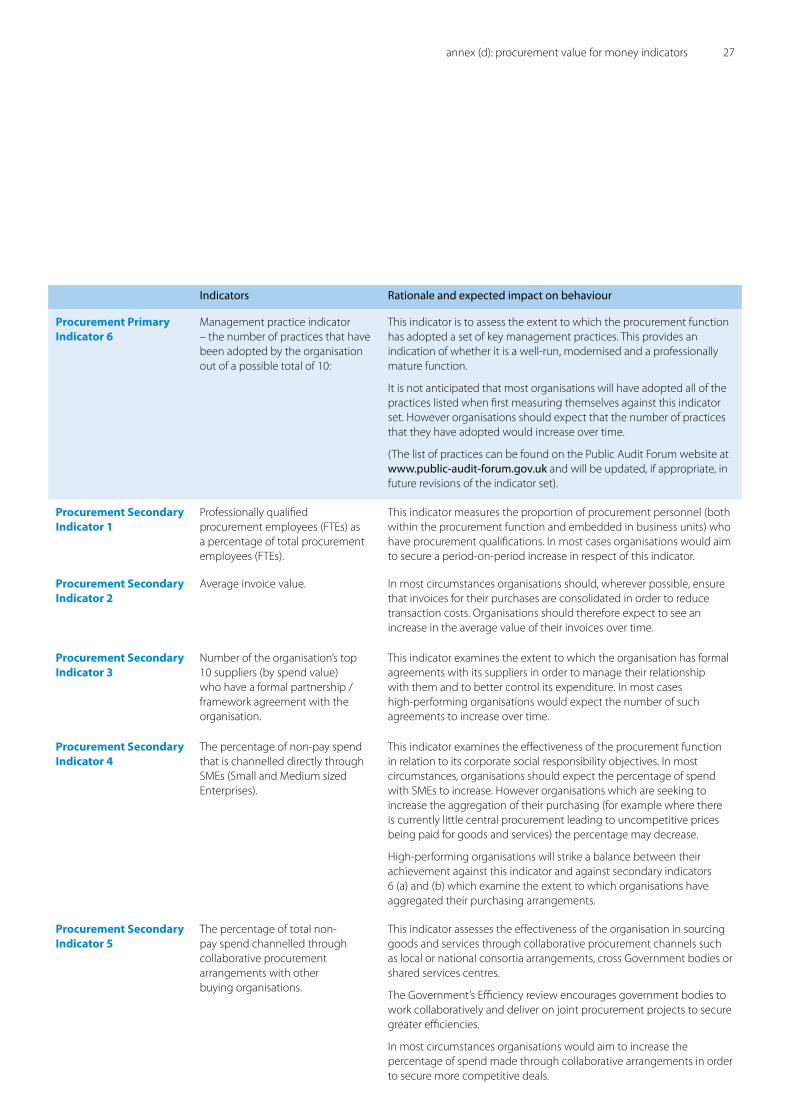
Procurement Primary Indicator 6
Management practice indicator – the number of practices that have been adopted by the organisation out of a possible total of 10:
This indicator is to assess the extent to which the procurement function has adopted a set of key management practices. This provides an indication of whether it is a well-run, modernised and a professionally mature function.
It is not anticipated that most organisations will have adopted all of the practices listed when first measuring themselves against this indicator set. However organisations should expect that the number of practices that they have adopted would increase over time.
(The list of practices can be found on the Public Audit Forum website at www.public-audit-forum.gov.uk and will be updated, if appropriate, in future revisions of the indicator set).
Procurement Secondary Indicator 1
Professionally qualified procurement employees (FTEs) as a percentage of total procurement employees (FTEs).
This indicator measures the proportion of procurement personnel (both within the procurement function and embedded in business units) who have procurement qualifications. In most cases organisations would aim to secure a period-on-period increase in respect of this indicator.
Procurement Secondary Indicator 2
Average invoice value. In most circumstances organisations should, wherever possible, ensure that invoices for their purchases are consolidated in order to reduce transaction costs. Organisations should therefore expect to see an increase in the average value of their invoices over time.
Procurement Secondary Indicator 3
Number of the organisation’s top 10 suppliers (by spend value) who have a formal partnership / framework agreement with the organisation.
This indicator examines the extent to which the organisation has formal agreements with its suppliers in order to manage their relationship with them and to better control its expenditure. In most cases high-performing organisations would expect the number of such agreements to increase over time.
Procurement Secondary Indicator 4
The percentage of non-pay spend that is channelled directly through SMEs (Small and Medium sized Enterprises).
This indicator examines the effectiveness of the procurement function in relation to its corporate social responsibility objectives. In most circumstances, organisations should expect the percentage of spend with SMEs to increase. However organisations which are seeking to increase the aggregation of their purchasing (for example where there is currently little central procurement leading to uncompetitive prices being paid for goods and services) the percentage may decrease.
High-performing organisations will strike a balance between their achievement against this indicator and against secondary indicators 6 (a) and (b) which examine the extent to which organisations have aggregated their purchasing arrangements.
Procurement Secondary Indicator 5
The percentage of total non-pay spend channelled through collaborative procurement arrangements with other buying organisations.
This indicator assesses the effectiveness of the organisation in sourcing goods and services through collaborative procurement channels such as local or national consortia arrangements, cross Government bodies or shared services centres.
The Government’s Efficiency review encourages government bodies to work collaboratively and deliver on joint procurement projects to secure greater efficiencies.
In most circumstances organisations would aim to increase the percentage of spend made through collaborative arrangements in order to secure more competitive deals.
annex (d): procurement value for money indicators �7
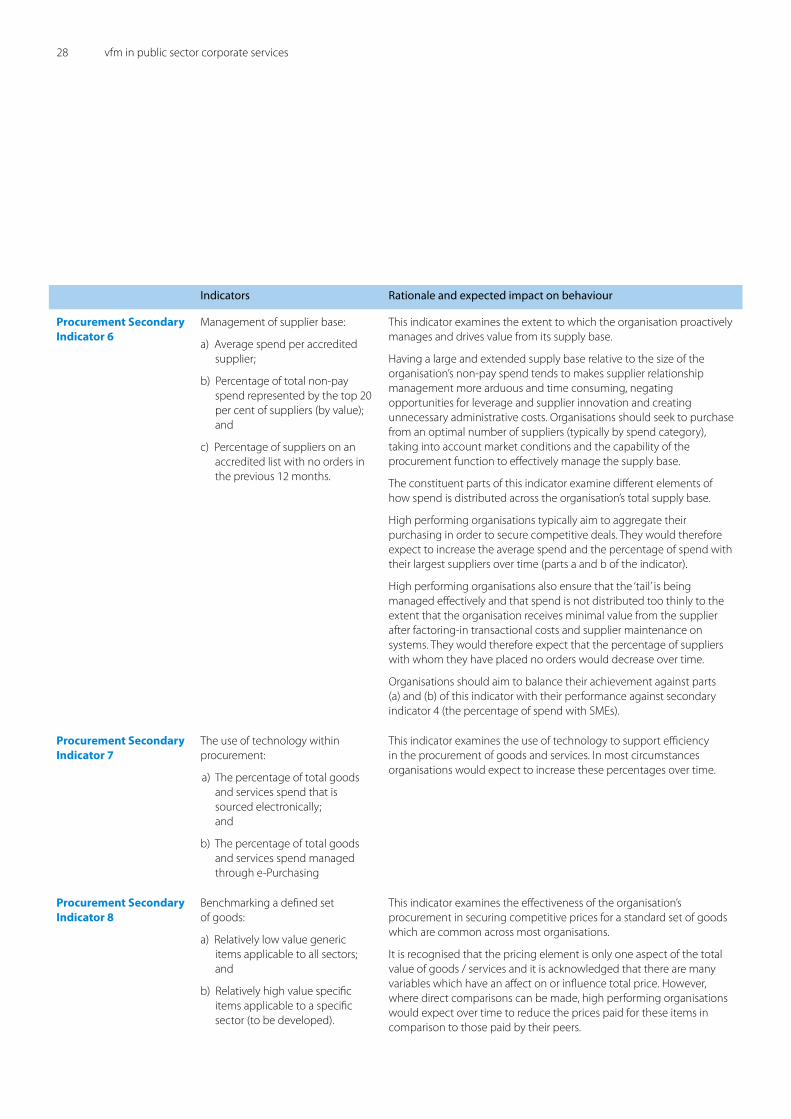
�8 vfm in public sector corporate services
Indicators Rationale and expected impact on behaviour
Procurement Secondary Indicator 6
Management of supplier base:
a) Average spend per accredited supplier;
b) Percentage of total non-pay spend represented by the top �0 per cent of suppliers (by value); and
c) Percentage of suppliers on an accredited list with no orders in the previous 1� months.
This indicator examines the extent to which the organisation proactively manages and drives value from its supply base.
Having a large and extended supply base relative to the size of the organisation’s non-pay spend tends to makes supplier relationship management more arduous and time consuming, negating opportunities for leverage and supplier innovation and creating unnecessary administrative costs. Organisations should seek to purchase from an optimal number of suppliers (typically by spend category), taking into account market conditions and the capability of the procurement function to effectively manage the supply base.
The constituent parts of this indicator examine different elements of how spend is distributed across the organisation’s total supply base.
High performing organisations typically aim to aggregate their purchasing in order to secure competitive deals. They would therefore expect to increase the average spend and the percentage of spend with their largest suppliers over time (parts a and b of the indicator).
High performing organisations also ensure that the ‘tail’ is being managed effectively and that spend is not distributed too thinly to the extent that the organisation receives minimal value from the supplier after factoring-in transactional costs and supplier maintenance on systems. They would therefore expect that the percentage of suppliers with whom they have placed no orders would decrease over time.
Organisations should aim to balance their achievement against parts (a) and (b) of this indicator with their performance against secondary indicator 4 (the percentage of spend with SMEs).
Procurement Secondary Indicator 7
The use of technology within procurement:
a) The percentage of total goods and services spend that is sourced electronically; and
b) The percentage of total goods and services spend managed through e-Purchasing
This indicator examines the use of technology to support efficiency in the procurement of goods and services. In most circumstances organisations would expect to increase these percentages over time.
Procurement Secondary Indicator 8
Benchmarking a defined set of goods:
a) Relatively low value generic items applicable to all sectors; and
b) Relatively high value specific items applicable to a specific sector (to be developed).
This indicator examines the effectiveness of the organisation’s procurement in securing competitive prices for a standard set of goods which are common across most organisations.
It is recognised that the pricing element is only one aspect of the total value of goods / services and it is acknowledged that there are many variables which have an affect on or influence total price. However, where direct comparisons can be made, high performing organisations would expect over time to reduce the prices paid for these items in comparison to those paid by their peers.
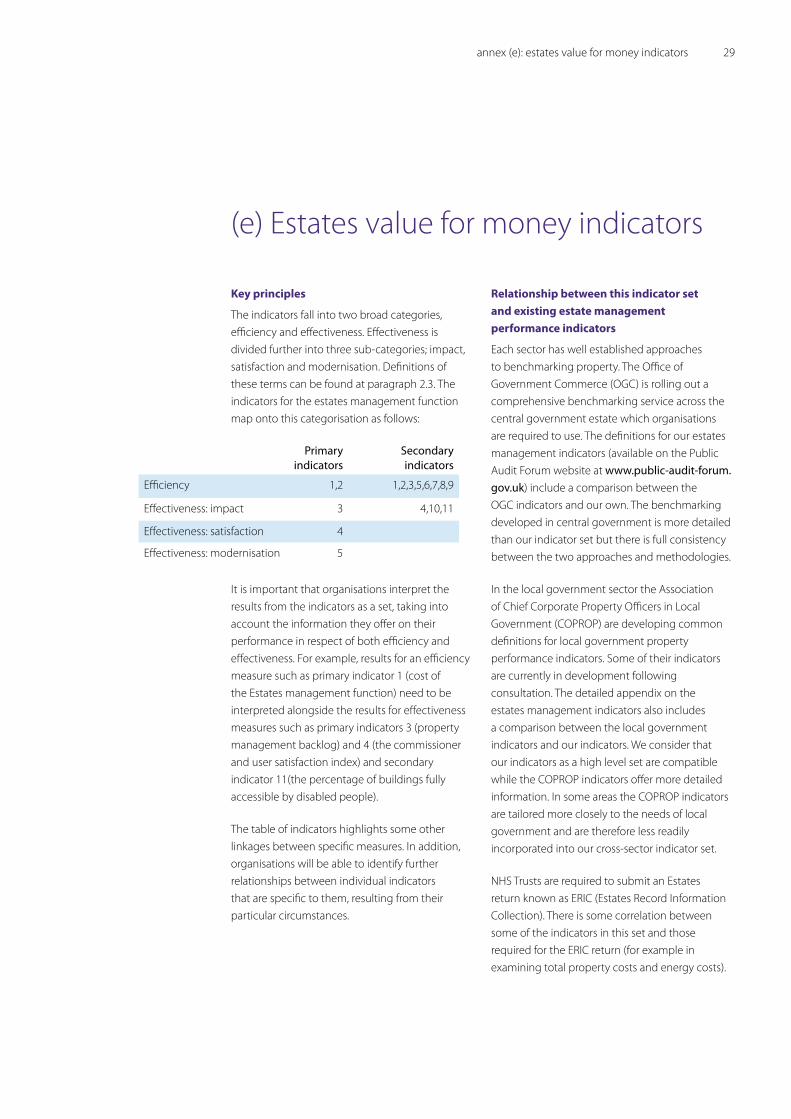
Key principles
The indicators fall into two broad categories, efficiency and effectiveness. Effectiveness is divided further into three sub-categories; impact, satisfaction and modernisation. Definitions of these terms can be found at paragraph �.3. The indicators for the estates management function map onto this categorisation as follows:
It is important that organisations interpret the results from the indicators as a set, taking into account the information they offer on their performance in respect of both efficiency and effectiveness. For example, results for an efficiency measure such as primary indicator 1 (cost of the Estates management function) need to be interpreted alongside the results for effectiveness measures such as primary indicators 3 (property management backlog) and 4 (the commissioner and user satisfaction index) and secondary indicator 11(the percentage of buildings fully accessible by disabled people).
The table of indicators highlights some other linkages between specific measures. In addition, organisations will be able to identify further relationships between individual indicators that are specific to them, resulting from their particular circumstances.
Relationship between this indicator set and existing estate management performance indicators
Each sector has well established approaches to benchmarking property. The Office of Government Commerce (OGC) is rolling out a comprehensive benchmarking service across the central government estate which organisations are required to use. The definitions for our estates management indicators (available on the Public Audit Forum website at www.public-audit-forum.gov.uk) include a comparison between the OGC indicators and our own. The benchmarking developed in central government is more detailed than our indicator set but there is full consistency between the two approaches and methodologies.
In the local government sector the Association of Chief Corporate Property Officers in Local Government (COPROP) are developing common definitions for local government property performance indicators. Some of their indicators are currently in development following consultation. The detailed appendix on the estates management indicators also includes a comparison between the local government indicators and our indicators. We consider that our indicators as a high level set are compatible while the COPROP indicators offer more detailed information. In some areas the COPROP indicators are tailored more closely to the needs of local government and are therefore less readily incorporated into our cross-sector indicator set.
NHS Trusts are required to submit an Estates return known as ERIC (Estates Record Information Collection). There is some correlation between some of the indicators in this set and those required for the ERIC return (for example in examining total property costs and energy costs).
Primary indicators
Secondary indicators
Efficiency 1,� 1,�,3,5,6,7,8,�
Effectiveness: impact 3 4,10,11
Effectiveness: satisfaction 4
Effectiveness: modernisation 5
(e) Estates value for money indicators
annex (e): estates value for money indicators ��
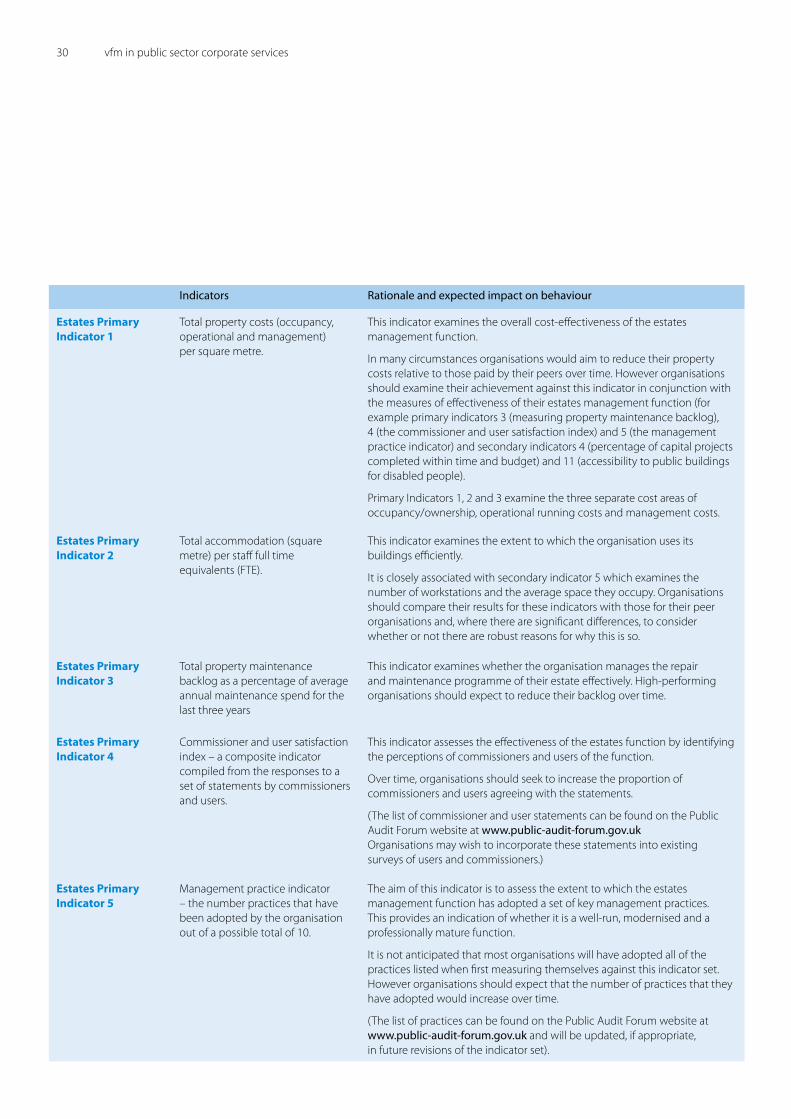
30 vfm in public sector corporate services
Indicators Rationale and expected impact on behaviour
Estates Primary Indicator 1
Total property costs (occupancy, operational and management) per square metre.
This indicator examines the overall cost-effectiveness of the estates management function.
In many circumstances organisations would aim to reduce their property costs relative to those paid by their peers over time. However organisations should examine their achievement against this indicator in conjunction with the measures of effectiveness of their estates management function (for example primary indicators 3 (measuring property maintenance backlog), 4 (the commissioner and user satisfaction index) and 5 (the management practice indicator) and secondary indicators 4 (percentage of capital projects completed within time and budget) and 11 (accessibility to public buildings for disabled people).
Primary Indicators 1, � and 3 examine the three separate cost areas of occupancy/ownership, operational running costs and management costs.
Estates Primary Indicator 2
Total accommodation (square metre) per staff full time equivalents (FTE).
This indicator examines the extent to which the organisation uses its buildings efficiently.
It is closely associated with secondary indicator 5 which examines the number of workstations and the average space they occupy. Organisations should compare their results for these indicators with those for their peer organisations and, where there are significant differences, to consider whether or not there are robust reasons for why this is so.
Estates Primary Indicator 3
Total property maintenance backlog as a percentage of average annual maintenance spend for the last three years
This indicator examines whether the organisation manages the repair and maintenance programme of their estate effectively. High-performing organisations should expect to reduce their backlog over time.
Estates Primary Indicator 4
Commissioner and user satisfaction index – a composite indicator compiled from the responses to a set of statements by commissioners and users.
This indicator assesses the effectiveness of the estates function by identifying the perceptions of commissioners and users of the function.
Over time, organisations should seek to increase the proportion of commissioners and users agreeing with the statements.
(The list of commissioner and user statements can be found on the Public Audit Forum website at www.public-audit-forum.gov.uk Organisations may wish to incorporate these statements into existing surveys of users and commissioners.)
Estates Primary Indicator 5
Management practice indicator – the number practices that have been adopted by the organisation out of a possible total of 10.
The aim of this indicator is to assess the extent to which the estates management function has adopted a set of key management practices. This provides an indication of whether it is a well-run, modernised and a professionally mature function.
It is not anticipated that most organisations will have adopted all of the practices listed when first measuring themselves against this indicator set. However organisations should expect that the number of practices that they have adopted would increase over time.
(The list of practices can be found on the Public Audit Forum website at www.public-audit-forum.gov.uk and will be updated, if appropriate, in future revisions of the indicator set).
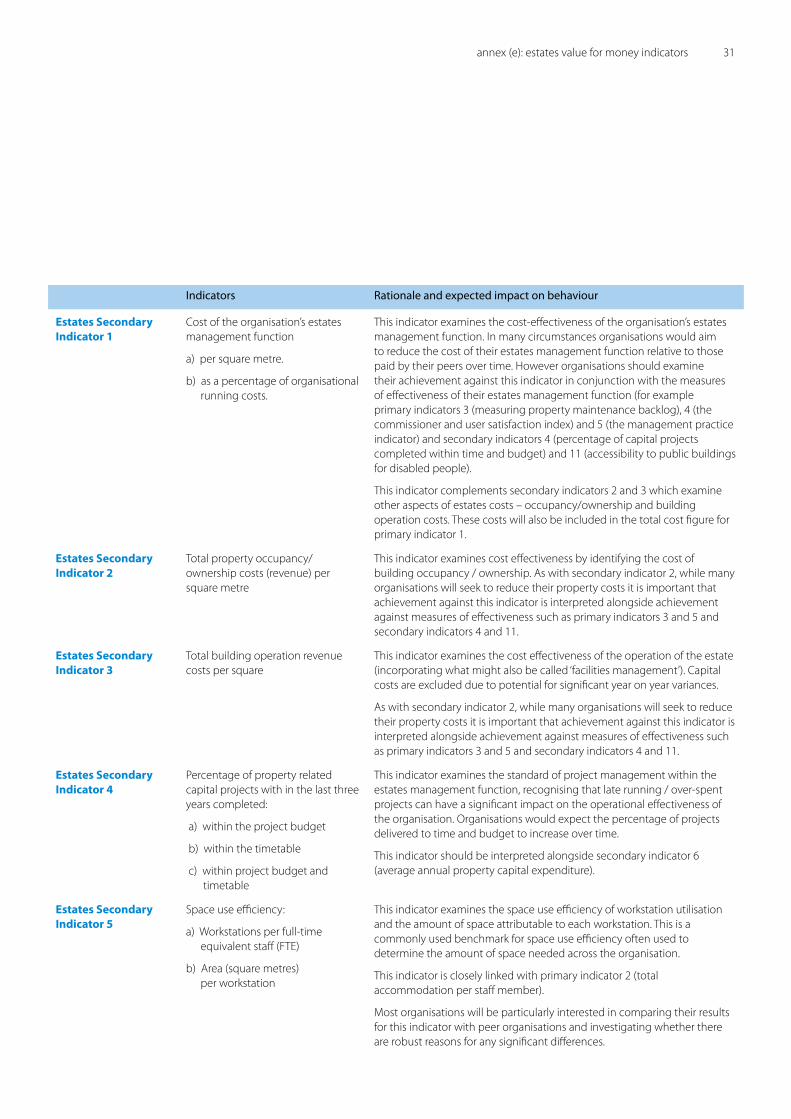
Indicators Rationale and expected impact on behaviour
Estates Secondary Indicator 1
Cost of the organisation’s estates management function
a) per square metre.
b) as a percentage of organisational running costs.
This indicator examines the cost-effectiveness of the organisation’s estates management function. In many circumstances organisations would aim to reduce the cost of their estates management function relative to those paid by their peers over time. However organisations should examine their achievement against this indicator in conjunction with the measures of effectiveness of their estates management function (for example primary indicators 3 (measuring property maintenance backlog), 4 (the commissioner and user satisfaction index) and 5 (the management practice indicator) and secondary indicators 4 (percentage of capital projects completed within time and budget) and 11 (accessibility to public buildings for disabled people).
This indicator complements secondary indicators � and 3 which examine other aspects of estates costs – occupancy/ownership and building operation costs. These costs will also be included in the total cost figure for primary indicator 1.
Estates Secondary Indicator 2
Total property occupancy/ownership costs (revenue) per square metre
This indicator examines cost effectiveness by identifying the cost of building occupancy / ownership. As with secondary indicator �, while many organisations will seek to reduce their property costs it is important that achievement against this indicator is interpreted alongside achievement against measures of effectiveness such as primary indicators 3 and 5 and secondary indicators 4 and 11.
Estates Secondary Indicator 3
Total building operation revenue costs per square
This indicator examines the cost effectiveness of the operation of the estate (incorporating what might also be called ‘facilities management’). Capital costs are excluded due to potential for significant year on year variances.
As with secondary indicator �, while many organisations will seek to reduce their property costs it is important that achievement against this indicator is interpreted alongside achievement against measures of effectiveness such as primary indicators 3 and 5 and secondary indicators 4 and 11.
Estates Secondary Indicator 4
Percentage of property related capital projects with in the last three years completed:
a) within the project budget
b) within the timetable
c) within project budget and timetable
This indicator examines the standard of project management within the estates management function, recognising that late running / over-spent projects can have a significant impact on the operational effectiveness of the organisation. Organisations would expect the percentage of projects delivered to time and budget to increase over time.
This indicator should be interpreted alongside secondary indicator 6 (average annual property capital expenditure).
Estates Secondary Indicator 5
Space use efficiency:
a) Workstations per full-time equivalent staff (FTE)
b) Area (square metres) per workstation
This indicator examines the space use efficiency of workstation utilisation and the amount of space attributable to each workstation. This is a commonly used benchmark for space use efficiency often used to determine the amount of space needed across the organisation.
This indicator is closely linked with primary indicator � (total accommodation per staff member).
Most organisations will be particularly interested in comparing their results for this indicator with peer organisations and investigating whether there are robust reasons for any significant differences.
annex (e): estates value for money indicators 31
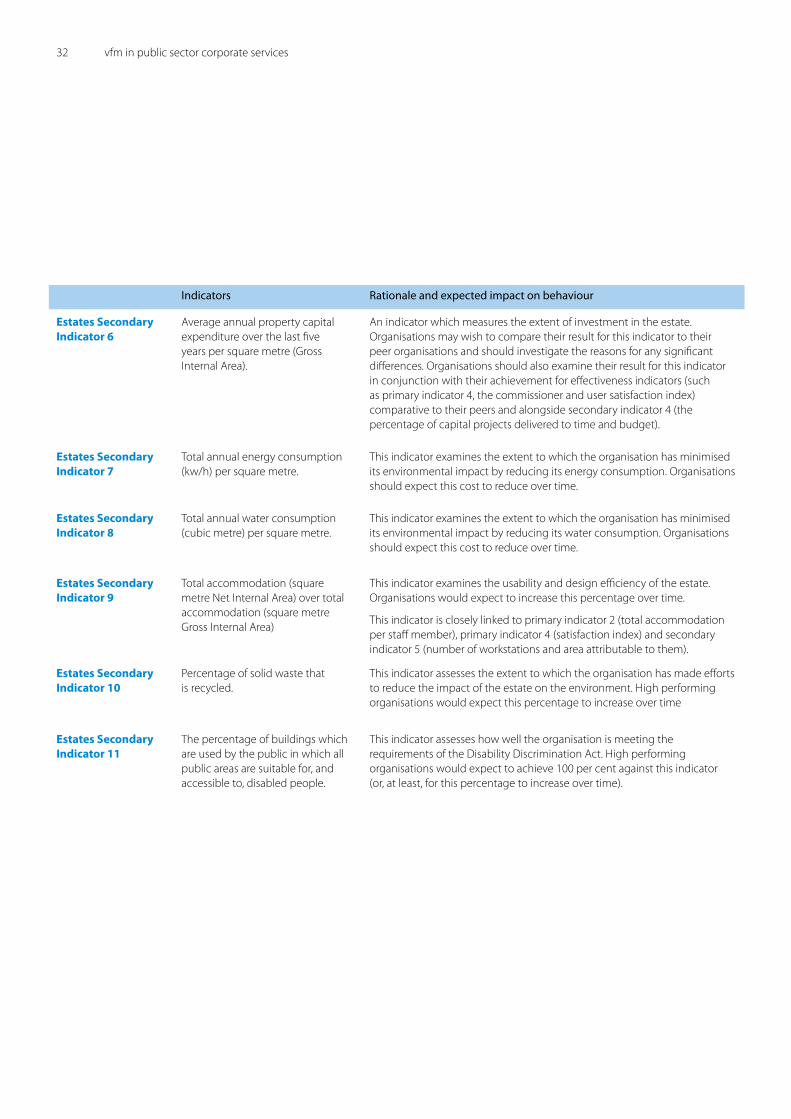
3� vfm in public sector corporate services
Indicators Rationale and expected impact on behaviour
Estates Secondary Indicator 6
Average annual property capital expenditure over the last five years per square metre (Gross Internal Area).
An indicator which measures the extent of investment in the estate. Organisations may wish to compare their result for this indicator to their peer organisations and should investigate the reasons for any significant differences. Organisations should also examine their result for this indicator in conjunction with their achievement for effectiveness indicators (such as primary indicator 4, the commissioner and user satisfaction index) comparative to their peers and alongside secondary indicator 4 (the percentage of capital projects delivered to time and budget).
Estates Secondary Indicator 7
Total annual energy consumption (kw/h) per square metre.
This indicator examines the extent to which the organisation has minimised its environmental impact by reducing its energy consumption. Organisations should expect this cost to reduce over time.
Estates Secondary Indicator 8
Total annual water consumption (cubic metre) per square metre.
This indicator examines the extent to which the organisation has minimised its environmental impact by reducing its water consumption. Organisations should expect this cost to reduce over time.
Estates Secondary Indicator 9
Total accommodation (square metre Net Internal Area) over total accommodation (square metre Gross Internal Area)
This indicator examines the usability and design efficiency of the estate. Organisations would expect to increase this percentage over time.
This indicator is closely linked to primary indicator � (total accommodation per staff member), primary indicator 4 (satisfaction index) and secondary indicator 5 (number of workstations and area attributable to them).
Estates Secondary Indicator 10
Percentage of solid waste that is recycled.
This indicator assesses the extent to which the organisation has made efforts to reduce the impact of the estate on the environment. High performing organisations would expect this percentage to increase over time
Estates Secondary Indicator 11
The percentage of buildings which are used by the public in which all public areas are suitable for, and accessible to, disabled people.
This indicator assesses how well the organisation is meeting the requirements of the Disability Discrimination Act. High performing organisations would expect to achieve 100 per cent against this indicator (or, at least, for this percentage to increase over time).


Design and Production by NAO Marketing & Communications Team
DG Ref: 7490RF | Printed by Dudfields
© National Audit Office 2007


![Republic Act No. 9160, as amended (Anti-Money Laundering Act of 2001 [AMLA]): Strong Anti-Money Laundering Regime a Deterrent to Corruption in the Public Sector](https://img.pdfslide.us/doc/110x75/5572110e497959fc0b8e3bd3/republic-act-no-9160-as-amended-anti-money-laundering-act-of-2001-amla-strong-anti-money-laundering-regime-a-deterrent-to-corruption-in-the-public-sector.jpg)