Embed Size (px)
Citation preview
ARTICLE
Nanowire arrays restore vision in blind miceJing Tang1, Nan Qin1, Yan Chong1, Yupu Diao1, Yiliguma1, Zhexuan Wang1, Tian Xue2, Min Jiang1,
Jiayi Zhang 1 & Gengfeng Zheng 1
The restoration of light response with complex spatiotemporal features in retinal degen-
erative diseases towards retinal prosthesis has proven to be a considerable challenge over the
past decades. Herein, inspired by the structure and function of photoreceptors in retinas, we
develop artificial photoreceptors based on gold nanoparticle-decorated titania nanowire
arrays, for restoration of visual responses in the blind mice with degenerated photoreceptors.
Green, blue and near UV light responses in the retinal ganglion cells (RGCs) are restored with
a spatial resolution better than 100 µm. ON responses in RGCs are blocked by glutamatergic
antagonists, suggesting functional preservation of the remaining retinal circuits. Moreover,
neurons in the primary visual cortex respond to light after subretinal implant of nanowire
arrays. Improvement in pupillary light reflex suggests the behavioral recovery of light sen-
sitivity. Our study will shed light on the development of a new generation of optoelectronic
toolkits for subretinal prosthetic devices.
DOI: 10.1038/s41467-018-03212-0 OPEN
1 Laboratory of Advanced Materials, Institutes of Brain Science, State Key Laboratory of Medical Neurobiology, Shanghai Key Laboratory of MolecularCatalysis and Innovative Materials, Department of Ophthalmology, Zhongshan Hospital, Fudan University, Shanghai 200032, China. 2 School of Life Sciencesand Hefei National Laboratory for Physical Sciences at Microscale, University of Science and Technology of China, Hefei 230026, China. Jing Tang, Nan Qinand Yan Chong contributed equally to this work. Correspondence and requests for materials should be addressed to J.Z. (email: [email protected])or to G.Z. (email: [email protected])
NATURE COMMUNICATIONS | (2018) 9:786 | DOI: 10.1038/s41467-018-03212-0 |www.nature.com/naturecommunications 1
1234
5678
90():,;
Retina is an important light-sensitive tissue that transduceslight information into neural activities through multi-layersof neuronal cells1–5. Light entering an eye passes through
the transparent retina and is mostly captured by the visualpigment-containing photoreceptors6–9. Retinal degenerative dis-eases such as retinitis pigmentosa and macular degeneration leadto irreversible damage or even loss of photoreceptors, which canresult in serious impairment of vision and eventually blind-ness10,11. The state-of-art retinal prosthesis devices require theuse of a subretinally placed photodiode array detecting near-infrared signals from a video capturing camera12,13. Recently,developing light-responsive materials as artificial photoreceptorsfor interfacing with blind retinas has emerged as a promisingalternative for retinal prosthesis, with several exciting preliminarydemonstrations using metal electrode arrays14, cadmium sulfide-carbon nanotubes15, semiconductor silicon photodiodes16 orconducting polymers17–19. However, these photoresponsivedevices require additional microelectronic processing for signalgeneration, transduction and processing, posting limitations forin vivo applications. Breaking this bottleneck requires capabilitiesfor engineering large interaction surfaces/interfaces between ret-inal cells and semiconductor micro/nanostructures. Recently,subretinal implantation of photovoltaic polymers restores lightsensitivity in blind rats19. However, spatiotemporal character-izations of retinal responses are not clear.
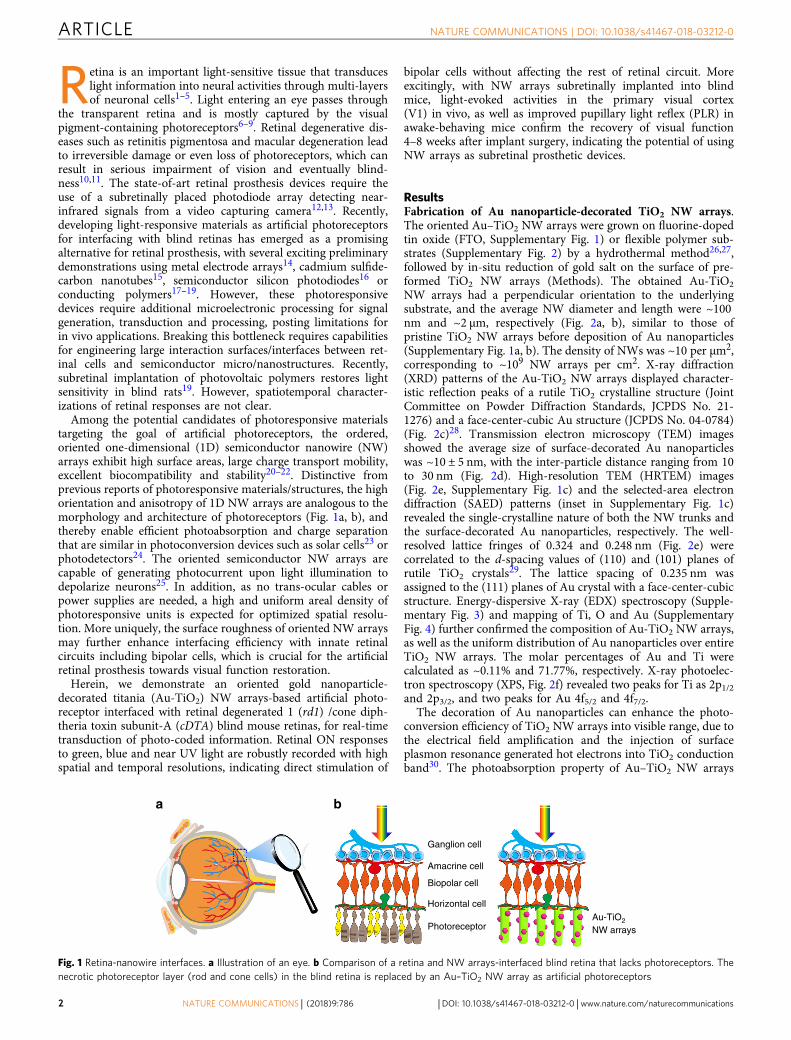
Among the potential candidates of photoresponsive materialstargeting the goal of artificial photoreceptors, the ordered,oriented one-dimensional (1D) semiconductor nanowire (NW)arrays exhibit high surface areas, large charge transport mobility,excellent biocompatibility and stability20–22. Distinctive fromprevious reports of photoresponsive materials/structures, the highorientation and anisotropy of 1D NW arrays are analogous to themorphology and architecture of photoreceptors (Fig. 1a, b), andthereby enable efficient photoabsorption and charge separationthat are similar in photoconversion devices such as solar cells23 orphotodetectors24. The oriented semiconductor NW arrays arecapable of generating photocurrent upon light illumination todepolarize neurons25. In addition, as no trans-ocular cables orpower supplies are needed, a high and uniform areal density ofphotoresponsive units is expected for optimized spatial resolu-tion. More uniquely, the surface roughness of oriented NW arraysmay further enhance interfacing efficiency with innate retinalcircuits including bipolar cells, which is crucial for the artificialretinal prosthesis towards visual function restoration.
Herein, we demonstrate an oriented gold nanoparticle-decorated titania (Au-TiO2) NW arrays-based artificial photo-receptor interfaced with retinal degenerated 1 (rd1) /cone diph-theria toxin subunit-A (cDTA) blind mouse retinas, for real-timetransduction of photo-coded information. Retinal ON responsesto green, blue and near UV light are robustly recorded with highspatial and temporal resolutions, indicating direct stimulation of
bipolar cells without affecting the rest of retinal circuit. Moreexcitingly, with NW arrays subretinally implanted into blindmice, light-evoked activities in the primary visual cortex(V1) in vivo, as well as improved pupillary light reflex (PLR) inawake-behaving mice confirm the recovery of visual function4–8 weeks after implant surgery, indicating the potential of usingNW arrays as subretinal prosthetic devices.
ResultsFabrication of Au nanoparticle-decorated TiO2 NW arrays.The oriented Au–TiO2 NW arrays were grown on fluorine-dopedtin oxide (FTO, Supplementary Fig. 1) or flexible polymer sub-strates (Supplementary Fig. 2) by a hydrothermal method26,27,followed by in-situ reduction of gold salt on the surface of pre-formed TiO2 NW arrays (Methods). The obtained Au-TiO2
NW arrays had a perpendicular orientation to the underlyingsubstrate, and the average NW diameter and length were ~100nm and ~2 μm, respectively (Fig. 2a, b), similar to those ofpristine TiO2 NW arrays before deposition of Au nanoparticles(Supplementary Fig. 1a, b). The density of NWs was ~10 per μm2,corresponding to ~109 NW arrays per cm2. X-ray diffraction(XRD) patterns of the Au-TiO2 NW arrays displayed character-istic reflection peaks of a rutile TiO2 crystalline structure (JointCommittee on Powder Diffraction Standards, JCPDS No. 21-1276) and a face-center-cubic Au structure (JCPDS No. 04-0784)(Fig. 2c)28. Transmission electron microscopy (TEM) imagesshowed the average size of surface-decorated Au nanoparticleswas ~10 ± 5 nm, with the inter-particle distance ranging from 10to 30 nm (Fig. 2d). High-resolution TEM (HRTEM) images(Fig. 2e, Supplementary Fig. 1c) and the selected-area electrondiffraction (SAED) patterns (inset in Supplementary Fig. 1c)revealed the single-crystalline nature of both the NW trunks andthe surface-decorated Au nanoparticles, respectively. The well-resolved lattice fringes of 0.324 and 0.248 nm (Fig. 2e) werecorrelated to the d-spacing values of (110) and (101) planes ofrutile TiO2 crystals29. The lattice spacing of 0.235 nm wasassigned to the (111) planes of Au crystal with a face-center-cubicstructure. Energy-dispersive X-ray (EDX) spectroscopy (Supple-mentary Fig. 3) and mapping of Ti, O and Au (SupplementaryFig. 4) further confirmed the composition of Au-TiO2 NW arrays,as well as the uniform distribution of Au nanoparticles over entireTiO2 NW arrays. The molar percentages of Au and Ti werecalculated as ~0.11% and 71.77%, respectively. X-ray photoelec-tron spectroscopy (XPS, Fig. 2f) revealed two peaks for Ti as 2p1/2and 2p3/2, and two peaks for Au 4f5/2 and 4f7/2.
The decoration of Au nanoparticles can enhance the photo-conversion efficiency of TiO2 NW arrays into visible range, due tothe electrical field amplification and the injection of surfaceplasmon resonance generated hot electrons into TiO2 conductionband30. The photoabsorption property of Au–TiO2 NW arrays
a
Ganglion cell
Biopolar cell
Amacrine cell
Horizontal cellAu-TiO2
NW arraysPhotoreceptor
b
Fig. 1 Retina-nanowire interfaces. a Illustration of an eye. b Comparison of a retina and NW arrays-interfaced blind retina that lacks photoreceptors. Thenecrotic photoreceptor layer (rod and cone cells) in the blind retina is replaced by an Au–TiO2 NW array as artificial photoreceptors
ARTICLE NATURE COMMUNICATIONS | DOI: 10.1038/s41467-018-03212-0
2 NATURE COMMUNICATIONS | (2018) 9:786 | DOI: 10.1038/s41467-018-03212-0 |www.nature.com/naturecommunications
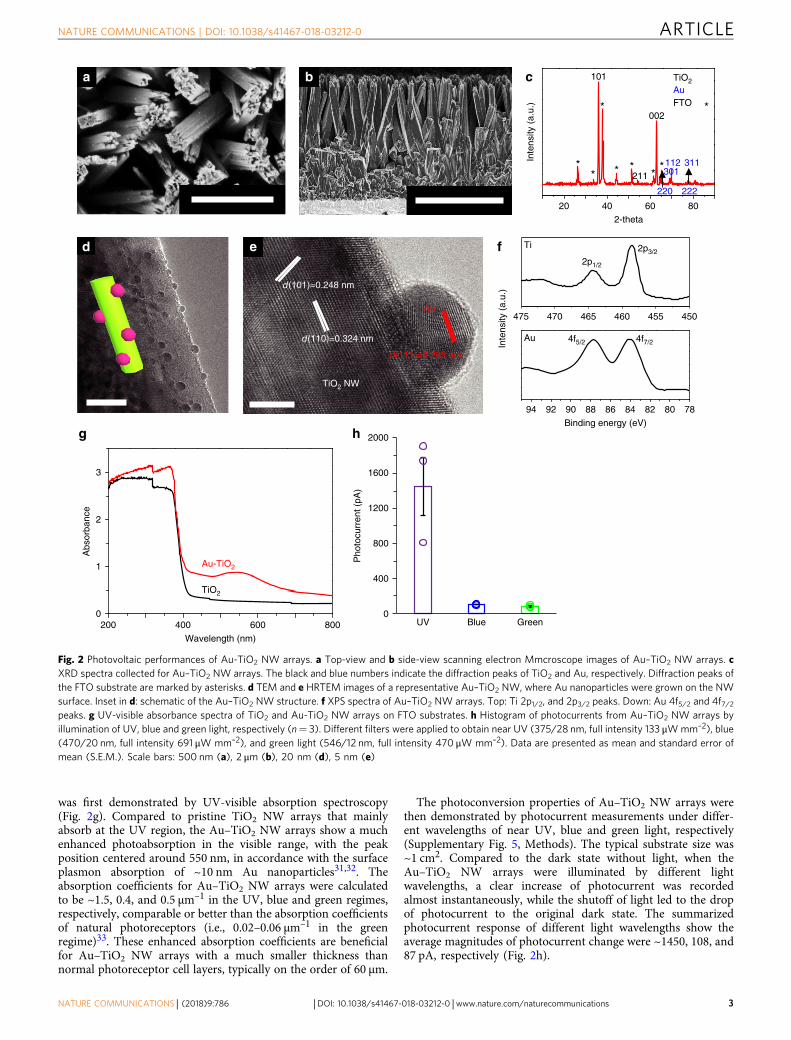
was first demonstrated by UV-visible absorption spectroscopy(Fig. 2g). Compared to pristine TiO2 NW arrays that mainlyabsorb at the UV region, the Au–TiO2 NW arrays show a muchenhanced photoabsorption in the visible range, with the peakposition centered around 550 nm, in accordance with the surfaceplasmon absorption of ~10 nm Au nanoparticles31,32. Theabsorption coefficients for Au–TiO2 NW arrays were calculatedto be ~1.5, 0.4, and 0.5 μm–1 in the UV, blue and green regimes,respectively, comparable or better than the absorption coefficientsof natural photoreceptors (i.e., 0.02–0.06 μm–1 in the greenregime)33. These enhanced absorption coefficients are beneficialfor Au–TiO2 NW arrays with a much smaller thickness thannormal photoreceptor cell layers, typically on the order of 60 μm.
The photoconversion properties of Au–TiO2 NW arrays werethen demonstrated by photocurrent measurements under differ-ent wavelengths of near UV, blue and green light, respectively(Supplementary Fig. 5, Methods). The typical substrate size was~1 cm2. Compared to the dark state without light, when theAu–TiO2 NW arrays were illuminated by different lightwavelengths, a clear increase of photocurrent was recordedalmost instantaneously, while the shutoff of light led to the dropof photocurrent to the original dark state. The summarizedphotocurrent response of different light wavelengths show theaverage magnitudes of photocurrent change were ~1450, 108, and87 pA, respectively (Fig. 2h).
d
**
*
101
* *211
222
**
002
301112
220
311
FTO *
Inte
nsity
(a.
u.)
2-theta
c
e
a b
f
Inte
nsity
(a.
u.)
Ti
2p1/2
2p3/2
Au 4f5/2 4f7/2
Binding energy (eV)
TiO2 NW
Au
TiO2
Au
h
0
1
2
3
Abs
orba
nce
Au-TiO2
TiO2
200 400 600 800
g
Wavelength (nm)
0
400
800
1200
1600
UV GreenBlue
Pho
tocu
rren
t (pA
)
2000
d (111)=0.235 nm
d (110)=0.324 nm
d (101)=0.248 nm
94 92 90 8082848688 78
470 450455460465475
20 806040
Fig. 2 Photovoltaic performances of Au-TiO2 NW arrays. a Top-view and b side-view scanning electron Mmcroscope images of Au–TiO2 NW arrays. cXRD spectra collected for Au–TiO2 NW arrays. The black and blue numbers indicate the diffraction peaks of TiO2 and Au, respectively. Diffraction peaks ofthe FTO substrate are marked by asterisks. d TEM and e HRTEM images of a representative Au–TiO2 NW, where Au nanoparticles were grown on the NWsurface. Inset in d: schematic of the Au–TiO2 NW structure. f XPS spectra of Au–TiO2 NW arrays. Top: Ti 2p1/2, and 2p3/2 peaks. Down: Au 4f5/2 and 4f7/2peaks. g UV-visible absorbance spectra of TiO2 and Au-TiO2 NW arrays on FTO substrates. h Histogram of photocurrents from Au–TiO2 NW arrays byillumination of UV, blue and green light, respectively (n= 3). Different filters were applied to obtain near UV (375/28 nm, full intensity 133 μWmm–2), blue(470/20 nm, full intensity 691 μW mm–2), and green light (546/12 nm, full intensity 470 μW mm–2). Data are presented as mean and standard error ofmean (S.E.M.). Scale bars: 500 nm (a), 2 μm (b), 20 nm (d), 5 nm (e)
NATURE COMMUNICATIONS | DOI: 10.1038/s41467-018-03212-0 ARTICLE
NATURE COMMUNICATIONS | (2018) 9:786 | DOI: 10.1038/s41467-018-03212-0 |www.nature.com/naturecommunications 3
Light responses and spatial resolution. Mice are naturally sen-sitive to both near UV and visible light. In the following elec-trophysiology studies, light responses of retinal ganglion cells(RGCs) in wild-type (C57BL/6J) and rd1/cDTA mouse retinaswith NW array interfaces were investigated. Mutations in both
Pde6b and cDTA genes in rd1/cDTA mice (also referred to asblind mice below) led to complete degeneration of rod and conephotoreceptors by P50 (Fig. 3a, Methods34). To eliminate thepossibility of some remaining photoreceptors, we conductedmore experiments to measure light responses of RGCs in rd1/
GCL
IPL
INL
OPL
ONL
Wild-typea
GCLIPL
INL
Blind
ChATDAPI
b
c
Wild
-typ
eB
lind
+ N
WB
lind
20 m
V20
mV
0.5 s
0.5 s
20 m
V 0.5 s
f
2.5 s
20 m
V
Blin
d +
NW
, dur
atio
n 0.
24 s
Light intensity (μW mm–2)
Light intensity (μW mm–2)
Light intensity (μW mm–2)
Per
cent
age
of li
ght
resp
onsi
ve c
ells
133 66.5 33.2 16.6
60
80
100
40
20
0
Wild-typeBlind+NW
e
Per
cent
age
oflig
ht p
ulse
s
0
20
40
60
80
100d
133 66.5 33.2 16.6
20 m
V 1 s
13.532 3.598 2.270 1.127 0.563 0.028 6.889
g
TiO2 NW arrays
Retina
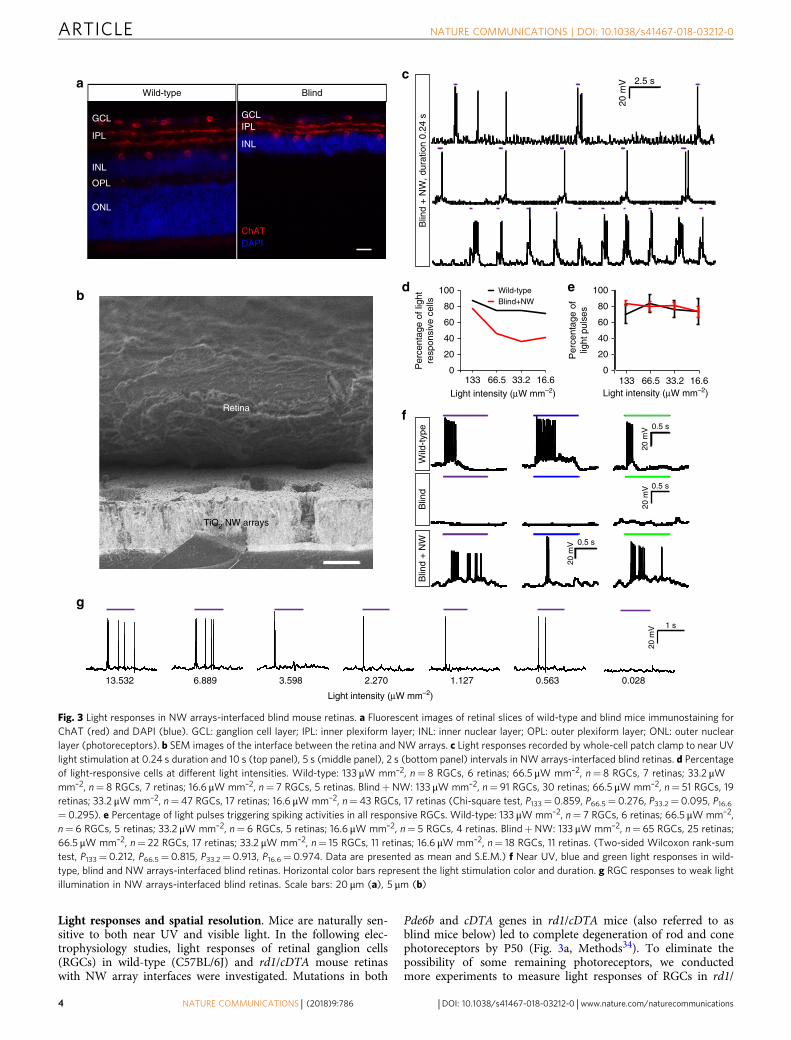
Fig. 3 Light responses in NW arrays-interfaced blind mouse retinas. a Fluorescent images of retinal slices of wild-type and blind mice immunostaining forChAT (red) and DAPI (blue). GCL: ganglion cell layer; IPL: inner plexiform layer; INL: inner nuclear layer; OPL: outer plexiform layer; ONL: outer nuclearlayer (photoreceptors). b SEM images of the interface between the retina and NW arrays. c Light responses recorded by whole-cell patch clamp to near UVlight stimulation at 0.24 s duration and 10 s (top panel), 5 s (middle panel), 2 s (bottom panel) intervals in NW arrays-interfaced blind retinas. d Percentageof light-responsive cells at different light intensities. Wild-type: 133 μW mm–2, n= 8 RGCs, 6 retinas; 66.5 μW mm–2, n= 8 RGCs, 7 retinas; 33.2 μWmm–2, n= 8 RGCs, 7 retinas; 16.6 μW mm–2, n= 7 RGCs, 5 retinas. Blind+NW: 133 μW mm–2, n= 91 RGCs, 30 retinas; 66.5 μW mm–2, n= 51 RGCs, 19retinas; 33.2 μW mm–2, n= 47 RGCs, 17 retinas; 16.6 μW mm–2, n= 43 RGCs, 17 retinas (Chi-square test, P133= 0.859, P66.5= 0.276, P33.2= 0.095, P16.6= 0.295). e Percentage of light pulses triggering spiking activities in all responsive RGCs. Wild-type: 133 μW mm–2, n= 7 RGCs, 6 retinas; 66.5 μW mm–2,n= 6 RGCs, 5 retinas; 33.2 μW mm–2, n= 6 RGCs, 5 retinas; 16.6 μW mm–2, n= 5 RGCs, 4 retinas. Blind+NW: 133 μW mm–2, n= 65 RGCs, 25 retinas;66.5 μW mm–2, n= 22 RGCs, 17 retinas; 33.2 μW mm–2, n= 15 RGCs, 11 retinas; 16.6 μW mm–2, n= 18 RGCs, 11 retinas. (Two-sided Wilcoxon rank-sumtest, P133= 0.212, P66.5= 0.815, P33.2= 0.913, P16.6= 0.974. Data are presented as mean and S.E.M.) f Near UV, blue and green light responses in wild-type, blind and NW arrays-interfaced blind retinas. Horizontal color bars represent the light stimulation color and duration. g RGC responses to weak lightillumination in NW arrays-interfaced blind retinas. Scale bars: 20 μm (a), 5 μm (b)
ARTICLE NATURE COMMUNICATIONS | DOI: 10.1038/s41467-018-03212-0
4 NATURE COMMUNICATIONS | (2018) 9:786 | DOI: 10.1038/s41467-018-03212-0 |www.nature.com/naturecommunications
cDTA blind retinas. 0/8 RGCs from 4 retinas, 0/7 RGCs from 5retinas and 0/6 RGCs from 5 retinas responded to near UV (375/28 nm), blue (470/20 nm) and green (546/12 nm) light, respec-tively, indicating that both rod and cone photoreceptors werecompletely absent in the rd1/cDTA blind retina. Au-TiO2 NWarrays were then placed underneath the blind retina, with theinner nuclear layer in contact with NW arrays, and the activitiesof RGCs were recorded using patch clamp pipettes. The retinaand NW arrays were in close contact, as shown in scanningelectron microscope (SEM) images (Fig. 3b). Contours of indi-vidual retinal cells were not visible in SEM images, as themembranes of retinal cells were embedded in the retinal tissue(Supplementary Fig. 6).
It is clear that RGCs in the blind retina robustly responded tonear UV light (with a 0.24 s duration and intervals of 10, 5 and 2s, respectively) (Fig. 3c). In addition, to evaluate the lightsensitivity of the NW arrays-interfaced blind retina, the spikeactivities of RGCs in response to light with different intensitieswere measured (Supplementary Fig. 7a). The intensity-dependentresponses to near UV light were similar or close to those in wild-type mice. The fractions of light responsive RGCs in wild-typemouse retinas were similar for different intensities (Fig. 3d, blackcurve). In the NW arrays-interfaced blind mouse retinas, thefraction of light responsive RGCs were 78%, 47%, 36% and 42% at133, 66.5, 33.2, and 16.6 μWmm–2, respectively (Fig. 3d, redcurve). In addition, RGCs in wild-type mice responded tomajority of light pulses (Fig. 3e, black curve). For the NW arrays-interfaced blind mouse retinas, we also showed that the thresholdto induce light response was ~0.5 μW mm-2 (Fig. 3g), that was 25lux, which was out of the intensity range of rods (≤0.1 lux). Thepercentages of pulses that initiated spike activities in RGCs weresimilar to those of wild-type retinas (Fig. 3e, red curve). Thenumber of spikes for different light intensities, as well as the spikewaveforms were also similar (Supplementary Fig. 7b, g). Due tothe absence of photoreceptors and therefore sign-preserving and
sign-inverting synapses between the photoreceptors and thebipolar cells, only ON responses were recorded in the NW arrays-interfaced blind mouse retinas. The latency of RGCs inNW arrays-interfaced blind retina was similar to those in wild-type retina at different UV light intensities (SupplementaryFig. 7d). The latencies for green and blue light in NW arrays-interfaced blind retina were much larger than those in wild-typeretina, most likely due to the fact that the photocurrent inducedby green and blue light was smaller than that by UV light.
The sensitivity of different light wavelengths was theninvestigated. In wild-type mice, RGCs responded to near UV,blue, and green light (with intensities of 133, 691 and 470 μWmm–2, respectively) (Fig. 3f, top panel). Without the NW arrays,retinas of blind mice did not respond to either UV, blue or greenlight (Fig. 3f, middle panel), confirming the blindness of thesemice. The representative spiking activities of RGCs in response tonear UV, blue and green light were shown in Fig. 3f, bottompanel. For each RGC, at least three light pulses were presented,with approximately 1 min interval between each pulse. Theaverage number of elicited spikes was 11 for near UV, 4 for blueand 6 for green light. Light-responsive RGCs responded to 84%near UV light pulses, 57% blue light pulses and 86% green lightpulses, respectively (Supplementary Fig. 7c). Moreover, timeevolution of RGC responses were measured (SupplementaryFig. 8), indicating that the interface between NW arrays andretinal cells was purely physical contact and did not evolve overtime.
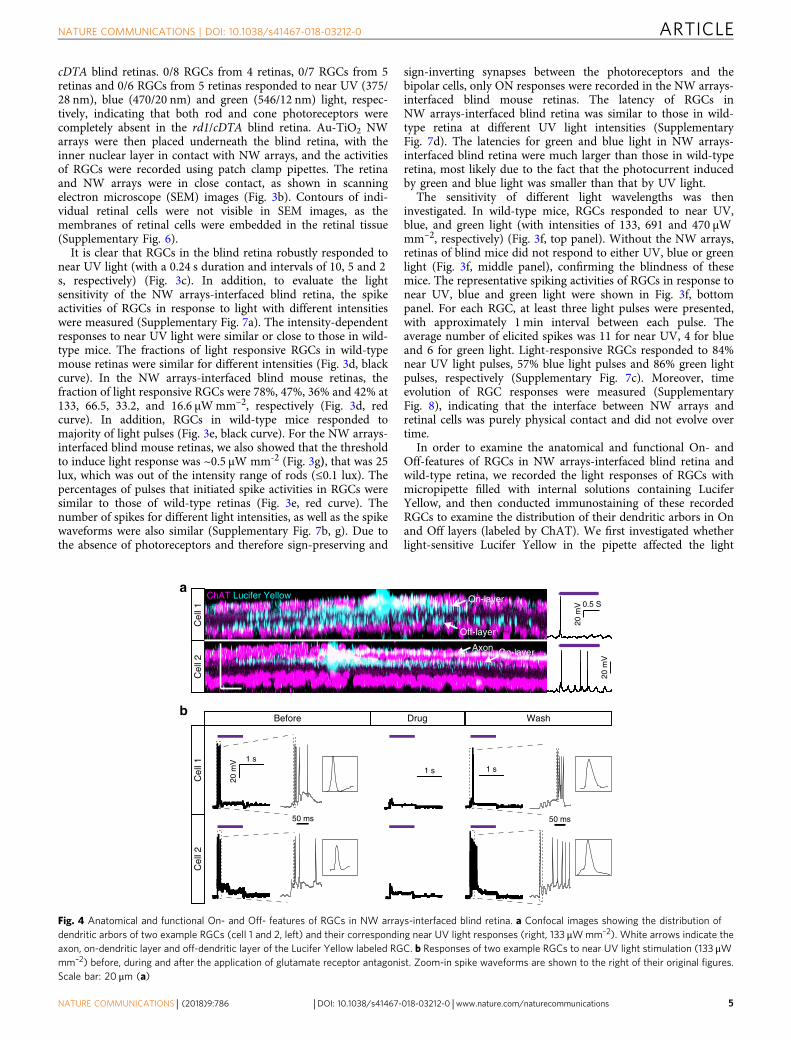
In order to examine the anatomical and functional On- andOff-features of RGCs in NW arrays-interfaced blind retina andwild-type retina, we recorded the light responses of RGCs withmicropipette filled with internal solutions containing LuciferYellow, and then conducted immunostaining of these recordedRGCs to examine the distribution of their dendritic arbors in Onand Off layers (labeled by ChAT). We first investigated whetherlight-sensitive Lucifer Yellow in the pipette affected the light
ChAT Lucifer Yellow
On-layerAxon
20 m
V
20 m
V
On-layer
Off-layer
0.5 S
Cel
l 1C
ell 2
b
Cel
l 1C
ell 2
Before
20 m
V 1 s
50 ms
1 s
50 ms
1 s
Drug Wash
a
Fig. 4 Anatomical and functional On- and Off- features of RGCs in NW arrays-interfaced blind retina. a Confocal images showing the distribution ofdendritic arbors of two example RGCs (cell 1 and 2, left) and their corresponding near UV light responses (right, 133 μWmm–2). White arrows indicate theaxon, on-dendritic layer and off-dendritic layer of the Lucifer Yellow labeled RGC. b Responses of two example RGCs to near UV light stimulation (133 μWmm–2) before, during and after the application of glutamate receptor antagonist. Zoom-in spike waveforms are shown to the right of their original figures.Scale bar: 20 μm (a)
NATURE COMMUNICATIONS | DOI: 10.1038/s41467-018-03212-0 ARTICLE
NATURE COMMUNICATIONS | (2018) 9:786 | DOI: 10.1038/s41467-018-03212-0 |www.nature.com/naturecommunications 5
responses in the RGCs35. The percentage of responsive RGCs wassimilar with or without Lucifer Yellow in the pipette (Supple-mentary Fig. 9d). In the NW arrays-interfaced blind retina,dendrites of some RGCs were located in both On and Off layers(Fig. 4a, top panel). These RGCs exhibited On responses. Someother RGCs had their dendrites distributed in On layer, andexhibited On responses as well (Fig. 4a, bottom panel). Theseresults indicated that RGCs responded to the onset of light byphotocurrent from the NW arrays, despite the fact that theyreceived input from both On-center and Off-center bipolar cells.We further examined the light responsive patterns of RGCs inboth NW arrays-interfaced blind retina and wild-type retina. Itturns out that the ~30% of the RGCs in NW arrays-interfaced
blind retina sustained On responses to light stimulation, whereasthe rest RGCs showed transient On responses (SupplementaryFig. 7e). This ratio of transient On to sustained On response wassimilar to that of wild-type RGCs.
To investigate whether the RGC light responses resulted fromdirect RGC activation or indirect activation of bipolar cells thatinduced spiking activities in RGCs, synaptic transmission frombipolar cells to RGCs was blocked using glutamate receptorantagonists (Methods). The light responses from RGCs disap-peared 4 min after the application of drugs (Fig. 4b, left andmiddle columns). After washing off the drugs, the light responseswere restored (Fig. 4b, right columns). Light responses of all theRGCs were blocked by the drugs, indicating that light responses
300–600 μm
a
0–100 μm
100–200 μm
200–300 μm
20 m
V
0.5 s
300
400
200
100
0
Rec
eptiv
e fie
ld d
iam
eter
(μm
)
b d
c1 s
20 m
V
40
20
60
0
0–10
0
100–
200
200–
300
300–
600
80
100 UVGreen
Per
cent
age
of r
espo
nsiv
e ce
lls (
%)
Spot diameter (μm)
Blue
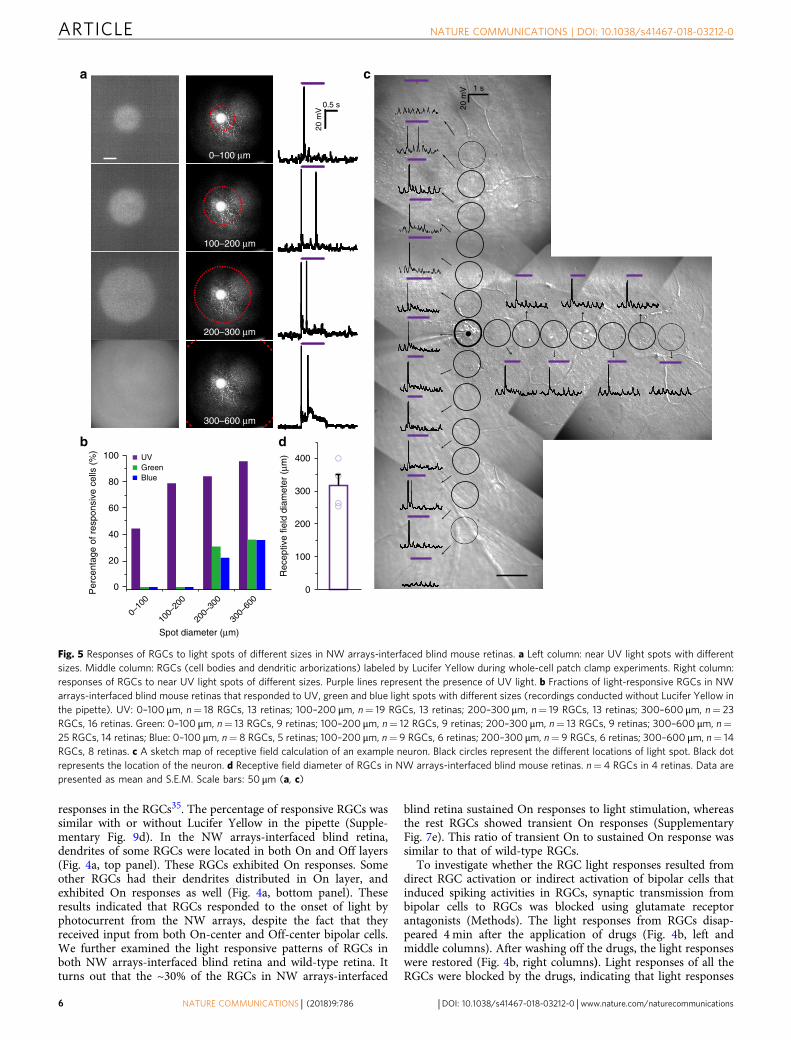
Fig. 5 Responses of RGCs to light spots of different sizes in NW arrays-interfaced blind mouse retinas. a Left column: near UV light spots with differentsizes. Middle column: RGCs (cell bodies and dendritic arborizations) labeled by Lucifer Yellow during whole-cell patch clamp experiments. Right column:responses of RGCs to near UV light spots of different sizes. Purple lines represent the presence of UV light. b Fractions of light-responsive RGCs in NWarrays-interfaced blind mouse retinas that responded to UV, green and blue light spots with different sizes (recordings conducted without Lucifer Yellow inthe pipette). UV: 0–100 μm, n= 18 RGCs, 13 retinas; 100–200 μm, n= 19 RGCs, 13 retinas; 200–300 μm, n= 19 RGCs, 13 retinas; 300–600 μm, n= 23RGCs, 16 retinas. Green: 0–100 μm, n= 13 RGCs, 9 retinas; 100–200 μm, n= 12 RGCs, 9 retinas; 200–300 μm, n= 13 RGCs, 9 retinas; 300–600 μm, n=25 RGCs, 14 retinas; Blue: 0–100 μm, n= 8 RGCs, 5 retinas; 100–200 μm, n= 9 RGCs, 6 retinas; 200–300 μm, n= 9 RGCs, 6 retinas; 300–600 μm, n= 14RGCs, 8 retinas. c A sketch map of receptive field calculation of an example neuron. Black circles represent the different locations of light spot. Black dotrepresents the location of the neuron. d Receptive field diameter of RGCs in NW arrays-interfaced blind mouse retinas. n= 4 RGCs in 4 retinas. Data arepresented as mean and S.E.M. Scale bars: 50 μm (a, c)
ARTICLE NATURE COMMUNICATIONS | DOI: 10.1038/s41467-018-03212-0
6 NATURE COMMUNICATIONS | (2018) 9:786 | DOI: 10.1038/s41467-018-03212-0 |www.nature.com/naturecommunications
in RGCs originate mostly from activation of bipolar cells insteadof RGCs (Supplementary Fig. 7h).
The spatial resolution of light response in the NW arrays-interfaced blind mouse retinas was further investigated. Thephotocurrents induced by light spots were measured withdifferent sizes and different distances from the center of the spot(Supplementary Fig. 9a, b). Near UV and green light spots withdifferent diameters were presented to the RGC (Fig. 5a). For blindmouse retinas, the minimum size of light spots to trigger RGCresponse was 45 µm. When the diameter of near UV light spotwas smaller than 100 µm, 44% of RGCs exhibited clear responses
(Fig. 5b). The percentages of RGCs that responded to near UVlight spots with diameters of 100–200 µm, 200–300 µm, and300–600 µm were 79%, 84%, and 96%, respectively. Meanwhile,for green and blue light spots with diameters of 200–300 µm, 31%and 22% of RGCs exhibited light responses, respectively; for greenand blue light spots with diameters of 300–600 µm, 36% of RGCsexhibited light responses. In Supplementary Figure 9b, thephotocurrent increased significantly when the size of the lightspots increased from 200 µm to 300–600 µm, which can lead tothe increased percentage of responsive RGCs for the light spots of300–600 µm. For wild-type mouse retinas, RGCs exhibited a
a
14
123456789
101112131415161718192021222324252627282930313233343536
4647
373839404142434445
484950
0 4 8 122 6 10
Light responsive cellsd
ΔF/F
0
ΔF/F
0
–0.1
0
0.1
0.2
0.3
0.4
0.5
0.6
2 4 6 8
Time (s)
5251
0.5
a
cb
Non-responsive cells
ΔF/F
0
14120 2 4 86 10
0.5
Time (s)
Responsivecells
Mean
f
Brn3aGCaMP6
e
INL
IPL
GCL
b
10 12
Time (s)
1
2
3
4
5
67
8
9
10 11
12
1314
15
16
17
1819 24
44
2539
3430
43
49
32
3652 40
23
22 41
38 33
42
31 26
47
27
2135
28
46
37
50
45
20
29
48
a
b
c
51
c
d e f g h
i
j
k
l m n
o
pq
r s
t
u
v bnx y
z
aa ab
ac
ad
ae
af
ag ah
ai
aj ak al
am
an ao
ap
aq
ar
as
at
au
avaw
ax ay
az
ba bb
bc
bc
bd be
bf
bg
bh
bi
bj
bk
bl
bmw
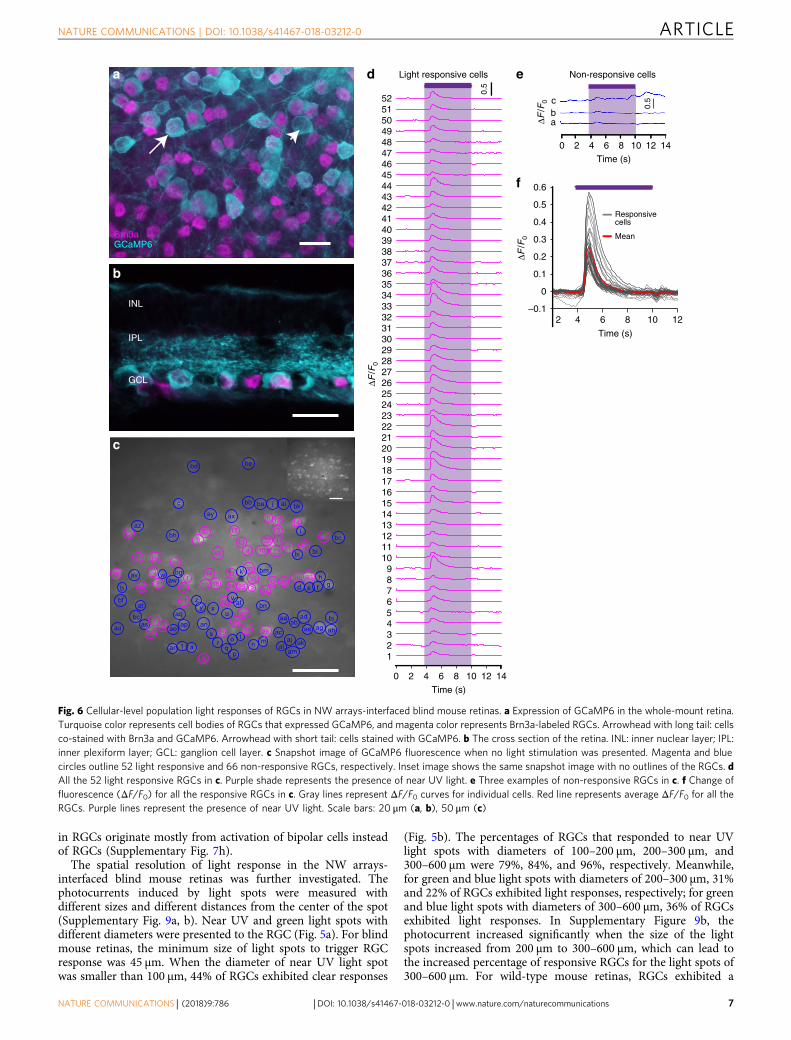
Fig. 6 Cellular-level population light responses of RGCs in NW arrays-interfaced blind mouse retinas. a Expression of GCaMP6 in the whole-mount retina.Turquoise color represents cell bodies of RGCs that expressed GCaMP6, and magenta color represents Brn3a-labeled RGCs. Arrowhead with long tail: cellsco-stained with Brn3a and GCaMP6. Arrowhead with short tail: cells stained with GCaMP6. b The cross section of the retina. INL: inner nuclear layer; IPL:inner plexiform layer; GCL: ganglion cell layer. c Snapshot image of GCaMP6 fluorescence when no light stimulation was presented. Magenta and bluecircles outline 52 light responsive and 66 non-responsive RGCs, respectively. Inset image shows the same snapshot image with no outlines of the RGCs. dAll the 52 light responsive RGCs in c. Purple shade represents the presence of near UV light. e Three examples of non-responsive RGCs in c. f Change offluorescence (ΔF/F0) for all the responsive RGCs in c. Gray lines represent ΔF/F0 curves for individual cells. Red line represents average ΔF/F0 for all theRGCs. Purple lines represent the presence of near UV light. Scale bars: 20 μm (a, b), 50 μm (c)
NATURE COMMUNICATIONS | DOI: 10.1038/s41467-018-03212-0 ARTICLE
NATURE COMMUNICATIONS | (2018) 9:786 | DOI: 10.1038/s41467-018-03212-0 |www.nature.com/naturecommunications 7
typical center-surround light response pattern for both near UVand green light (Supplementary Fig. 9c).
In order to estimate the receptive field size of the light-responsive RGCs, we presented light spots of 45 µm in size to the
RGCs (Fig. 5c). Since the light spots were manually moved, thelight responses were measured at different distances from the cellbody of the RGCs along three axes. The responses were roughlyhomogenous along the three axes. The average size of the
NW arrays
Light
Multielectrode arraye
g
f
Substrate
Bright field
Per
cent
age
of li
ght
resp
onsi
ve s
timul
us (
%)
637 318.5 159 79.6
Light intensity (μW mm–2)
Blind
Blind + NW
b c d
i
a
ChATDAPI
Brn3aDAPI
Chronic (5 months after implant surgery)
–0.5 0 0.5 1.0 1.5 2.0
Blind
–0.5 0 0.5 1.0 1.5 2.0
Wild-type
2.0
200
100
0
400
300
600
500
–100
–200
–300–0.5 0 0.5 1.0 1.5
Vol
tage
(μV
)
200
100
0
400
300
600
500
–100
–200
–300
Vol
tage
(μV
)
200
100
0
400
300
600
500
–100
–200
–300
Vol
tage
(μV
)
Blind + NW
NW arrays
h
Blind
2–0.5 0 0.5 1 1.5
Firi
ng r
ate(
Hz)
0
1
2
4
0
8
12
16
Firi
ng r
ate(
Hz)
–0.5 0 0.5 1 1.5 2
Wild-type
0
10
20
30
400
4
8
12
Blind + NW 2 days
–0.5 0 0.5 1 1.5 2
Firi
ng r
ate(
Hz)
0
2
4
5
0
10
15
20
Firi
ng r
ate(
Hz)
0–0.5 210.5 1.5
12
8
4
060
40
20
0
Blind + NW 5 months
Firi
ng r
ate(
Hz)
0246
108
0
40
80
120
0–0.5 2.010.5 1.5
Blind + NW 2 months
400
800
200
600
0
Vol
tage
(μV
)
Blind + NW
Blind
Wild-type
1000
Time (s)
Time (s)
40
60
0
20
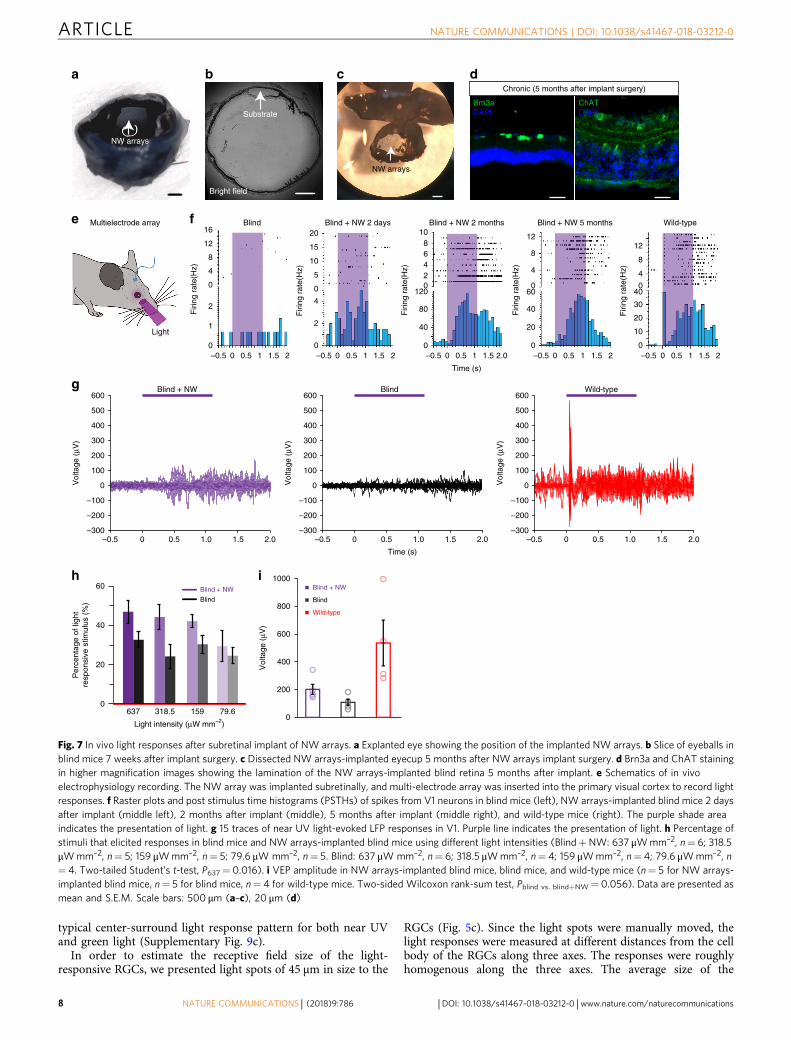
Fig. 7 In vivo light responses after subretinal implant of NW arrays. a Explanted eye showing the position of the implanted NW arrays. b Slice of eyeballs inblind mice 7 weeks after implant surgery. c Dissected NW arrays-implanted eyecup 5 months after NW arrays implant surgery. d Brn3a and ChAT stainingin higher magnification images showing the lamination of the NW arrays-implanted blind retina 5 months after implant. e Schematics of in vivoelectrophysiology recording. The NW array was implanted subretinally, and multi-electrode array was inserted into the primary visual cortex to record lightresponses. f Raster plots and post stimulus time histograms (PSTHs) of spikes from V1 neurons in blind mice (left), NW arrays-implanted blind mice 2 daysafter implant (middle left), 2 months after implant (middle), 5 months after implant (middle right), and wild-type mice (right). The purple shade areaindicates the presentation of light. g 15 traces of near UV light-evoked LFP responses in V1. Purple line indicates the presentation of light. h Percentage ofstimuli that elicited responses in blind mice and NW arrays-implanted blind mice using different light intensities (Blind+NW: 637 μWmm–2, n= 6; 318.5μWmm–2, n= 5; 159 μWmm–2, n= 5; 79.6 μW mm–2, n= 5. Blind: 637 μW mm–2, n= 6; 318.5 μWmm–2, n= 4; 159 μWmm–2, n= 4; 79.6 μWmm–2, n= 4. Two-tailed Student’s t-test, P637= 0.016). i VEP amplitude in NW arrays-implanted blind mice, blind mice, and wild-type mice (n= 5 for NW arrays-implanted blind mice, n= 5 for blind mice, n= 4 for wild-type mice. Two-sided Wilcoxon rank-sum test, Pblind vs. blind+NW= 0.056). Data are presented asmean and S.E.M. Scale bars: 500 μm (a–c), 20 μm (d)
ARTICLE NATURE COMMUNICATIONS | DOI: 10.1038/s41467-018-03212-0
8 NATURE COMMUNICATIONS | (2018) 9:786 | DOI: 10.1038/s41467-018-03212-0 |www.nature.com/naturecommunications
receptive field was 316 µm (Fig. 5d). In addition, we moved thelight spot of 45 µm across the RGC (Supplementary Fig. 9e).Localized RGC responses were recorded when the light spotswept around the vicinity of the cell body.
Population light responses. In order to demonstrate the cap-ability of the NW arrays-based artificial photoreceptors aspotential retinal prosthesis materials, the population lightresponses in the NW array-interfaced blind mouse retinas usingcalcium-sensitive protein (GCaMP6s) imaging were also illu-strated. 88% of GCaMP6s cells expressed Brn3a, a RGC marker,indicating that majority of the GCaMP6s cells were RGCs(Fig. 6a, b, Supplementary Fig. 10). Light induced responses inboth RGCs and underlying neuritis (Fig. 6c, d, SupplementaryMovie 1 in the Supporting Information). Some cells had noobvious light-evoked responses (Fig. 6e). The light responsecurves were similar for all the RGCs (Fig. 6f). 46% RGCs had lightresponses under whole-field illumination, demonstrating globalactivation of RGCs. Taken together, these results indicate that theNW arrays-interfaced blind mouse retina has good populationlight responses.
Light responses of cortical neurons in vivo. To further exhibitthe potential utilization of NW arrays in retinal prosthesis, weconducted subretinal implant surgery of NW arrays in blind mice.Figure 7a–c showed the substrate of NW arrays implanted into
the subretinal space. 5 months after the implant surgery, thelamination of the blind retina, as well as the RGCs labeled byBrn3a was unaffected by the implant (Fig. 7d). We presented nearUV light to one eye of the blind mice and recorded the light-evoked spikes and visually evoked potentials (VEPs) in the con-tralateral primary visual cortex (Fig. 7e). In the blind mice, noobvious light-evoked spikes were detected (Fig. 7f, left column).UV light elicited robust spiking responses in all implanted blindmice 2 days after implantation (Fig. 7f, middle left column) andwild-type mice (Fig. 7f, right column). In addition, we conductedrecordings in chronically implanted mice of both 2 months and5 months after the implant surgery. The light evoked spikingactivities were more prominent in chronically implanted mice(Fig. 7f, middle and middle right columns). UV light also trig-gered robust local field potentials (LFP) changes in the implantedblind mice (Fig. 7g). The fraction of stimuli that elicited LFPresponses for blind mice remained the same for different lightintensities, whereas that for the NW arrays-implanted blind miceincreased with increasing light intensity (Fig. 7h), confirming theclear light response restoration of blind mouse retinas in vivo.The VEP amplitude in NW arrays-implanted blind mice waslarger than that in blind mice, but still smaller than that in wild-type mice (Fig. 7i). We also observed light evoked spikingactivities in the superior collicus (SC) in NW arrays-implantedblind mice (Supplementary Fig. 11).
b
0.25
Light intensity (μW mm–2)
Light intensity (μW mm–2)
Per
cent
age
of p
upil
cons
tric
tion
(%)
0.13
BlindBlind + NWWild-type100
80
60
40
20
0
0.38
Per
cent
age
of p
upil
cons
tric
tion
(%)
d
0.13
BlindBlind + NWWild-type100
80
60
40
20
0
aBlind Wild-typeBlind + NW
Pre
-stim
ulus
Dur
ing
stim
ulus
Blind Blind + NW Wild-type
Pre
-stim
ulus
Dur
ing
stim
ulus
c
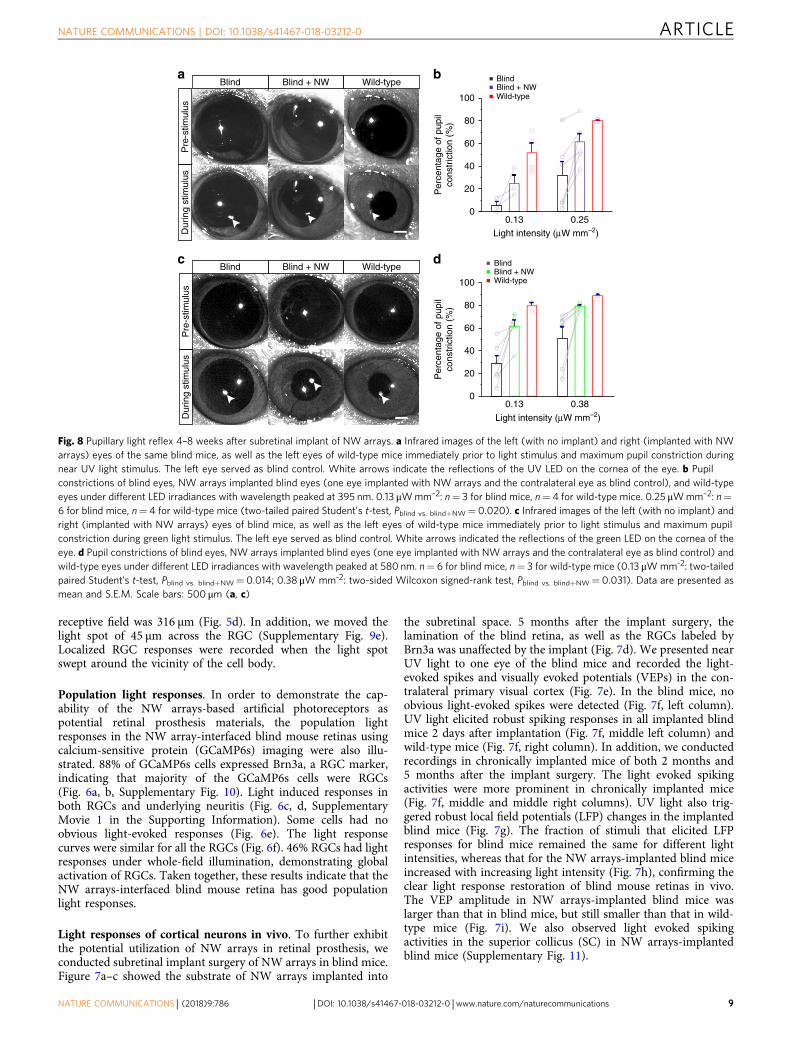
Fig. 8 Pupillary light reflex 4–8 weeks after subretinal implant of NW arrays. a Infrared images of the left (with no implant) and right (implanted with NWarrays) eyes of the same blind mice, as well as the left eyes of wild-type mice immediately prior to light stimulus and maximum pupil constriction duringnear UV light stimulus. The left eye served as blind control. White arrows indicate the reflections of the UV LED on the cornea of the eye. b Pupilconstrictions of blind eyes, NW arrays implanted blind eyes (one eye implanted with NW arrays and the contralateral eye as blind control), and wild-typeeyes under different LED irradiances with wavelength peaked at 395 nm. 0.13 μWmm–2: n= 3 for blind mice, n= 4 for wild-type mice. 0.25 μWmm–2: n=6 for blind mice, n= 4 for wild-type mice (two-tailed paired Student’s t-test, Pblind vs. blind+NW= 0.020). c Infrared images of the left (with no implant) andright (implanted with NW arrays) eyes of blind mice, as well as the left eyes of wild-type mice immediately prior to light stimulus and maximum pupilconstriction during green light stimulus. The left eye served as blind control. White arrows indicated the reflections of the green LED on the cornea of theeye. d Pupil constrictions of blind eyes, NW arrays implanted blind eyes (one eye implanted with NW arrays and the contralateral eye as blind control) andwild-type eyes under different LED irradiances with wavelength peaked at 580 nm. n= 6 for blind mice, n= 3 for wild-type mice (0.13 μWmm-2: two-tailedpaired Student’s t-test, Pblind vs. blind+NW= 0.014; 0.38 μW mm-2: two-sided Wilcoxon signed-rank test, Pblind vs. blind+NW= 0.031). Data are presented asmean and S.E.M. Scale bars: 500 μm (a, c)
NATURE COMMUNICATIONS | DOI: 10.1038/s41467-018-03212-0 ARTICLE
NATURE COMMUNICATIONS | (2018) 9:786 | DOI: 10.1038/s41467-018-03212-0 |www.nature.com/naturecommunications 9
The vision in near UV was investigated in vivo in alive rd1/cDTA mice. Although cornea, lens and other tissues in the eyeabsorb some UV light, mouse retinas can still be sensitive to UVlight36. The absorption of UV light (375/28 nm) in the cornea andlens of the mouse was estimated to be ~42%. The near UV lightresponses in V1 in anaesthetized wild-type mice were measuredin vivo (Supplementary Fig. 12a). It is clear that near UV lighttriggered both LFP and spiking activities across V1 (Supplemen-tary Fig. 12b, c), indicating that wild-type mice have vision inUV37.
Recovery of the light sensitivity in awake-behaving mice. Inblind mice, the light-induced pupil constriction was largelyimpaired due to the loss of photoreceptors in the retina (Fig. 8a).Many retinal prosthesis studies use PLR to confirm the behavioralrecovery of light sensitivity34,38–40. We implanted NW arrayssubretinally into one eye of blind mice (Supplementary Fig. 13).The PLR to near UV light in the implanted eye was improvedcompared to that in the contralateral (control) eye at both 0.13μWmm–2 and 0.25 µWmm–2 4–8 weeks after implant surgery(Fig. 8b, Supplementary Movie 2 in the Supporting Information).Likewise, the PLR to green light in the implanted eye was alsoimproved at both 0.13 μWmm–2 and 0.38 μWmm–2 (Fig. 8c, d,Supplementary Movie 3 in the Supporting Information). Some ofthe implanted eyes reached the same level of PLR as that in wild-type mice, indicating the recovery of light sensitivity in multiplecolors.
DiscussionThe rational design and fabrication of photoresponsive artificialphotoreceptors are important for developing advanced retinalprosthetic devices. Several possible mechanisms including pho-tovoltaic and photothermal stimulations have been investigated14.Although it was recently reported that the photothermal effect bydirect infrared neural stimulation is an alternative for retinaprosthesis41, it requires the use of photoabsorbers in closeproximity of the target cells42. The Au nanoparticles synthesizedin our work have diameters of ~10 nm and are strongly bound toTiO2 nanowire surfaces. Although the photo-thermal conversionefficiency of small Au nanoparticles is high43, according to the-oretical calculations, the temperature increase at the surface of Aunanoparticles in water is substantially lower for Au nanoparticleswith diameters of 10 nm than those with diameters of 50 nm44.Thus, the photothermal stimulation of RGCs from our 10-nm-diameter Au nanoparticles should be minor. Instead, the Aunanoparticles in our work enable efficient charge injection intoTiO2 nanowires upon photo-illumination. From our experimentaldata, it is clear that the RGC responses are closely correlated tothe photocurrent stimulation of the Au-TiO2 nanowire systems.In addition, the major responses from the UV regime confirm thephotovoltaic contribution of TiO2 nanowires for RGC stimula-tion. Thus, the mechanism reported in this work is mainlyattributed to photovoltaic stimulation.
It is noted that the estimated receptive field was ~300 µm using45 μm light spot. However, there was an increase in responsivepercentage of RGCs when the size of the stimulation light spotwas increased from 100 µm to 600 µm. The reason for theincrease in RGC response for larger light spot is due to theincreased photovoltaic current induced by larger light spot(Supplementary Fig. 9a, b). On the other hand, photocurrentinduced by 45 μm light spot that was 300 µm away was too smallto induce RGC responses.
Compared to other materials, the 1D oriented NW arraysmimic the morphology of rod and cone photoreceptors, and offerseveral distinctive features. First, the unique 1D anisotropic
morphology of NW arrays provides an efficient photo-to-electricconversion modality, similar to the NW arrays-based photo-voltaic devices. The nanoscale length of the NW radial dimensionallows for fast separation of photogenerated carriers45. Mean-while, the micron-scale length of the NW axial dimension canefficiently absorb incident light with excellent photoabsorptioncoefficients, with a thickness much smaller than normal photo-receptor cell layers. As shown in the pupillary light reflexexperiment, the sensitivity of blind mice implanted with NWarrays was similar to that in wild-type mice.
Second, the vertically oriented NW arrays are densely anduniformly grown over the surface, which resemble photoreceptorrods and cones in the outer retina layer. The space betweenneighboring NW arrays is on the order of hundreds of nan-ometers, and no electrodes or power supplies are needed, thusallowing for a much higher spatial density (~10 NW arrays perμm2) of active stimulation elements than most of the previouslyreported photoresponsive surface. The calcium imaging experi-ments in our work demonstrate that adjacent neurons can beactivated simultaneously by NW arrays. In addition, as shown inour work, the feature size of light response can be as small as ~50and ~300 μm for near UV and green light, respectively. Furtherincrease in the sensitivity of individual NW arrays may continueto improve the spatial resolution.
Third, the rough morphologies of the vertically oriented NWarrays are beneficial for direct interfacing with cultured neu-rons46, retinal tissues or in vivo subretinal implant into live mice,with good biocompatibility and photo/chemical stability for over8 weeks. The interface between the vertically oriented NW arraysand retinal cells/tissues leads to efficient light information pro-cessing. Our in vivo experiments have suggested the possibility ofusing NW arrays for chronic implant.
Fourth, although NW arrays used in present work have notbeen capable for color vision, further development of multiplenanowire types with different spectral responses may be apotentially feasible strategy to realize such a scenario in the nearfuture. For example, color vision can become possible if 1) type Ananowire is sensitive to red color and type B nanowire is sensitiveto green color; 2) type A nanowire induces smaller firing rate andtype B nanowire induces larger firing rate in RGC; 3) aftertraining, the visual cortex can rewire to recognize the difference inRGC activities, and hence differentiate red color from green color.
In summary, we demonstrated a vertically oriented Au–TiO2
NW arrays as artificial photoreceptors, which absorbs light andgenerates photovoltage, and consequently triggers spiking activ-ities in the interfaced neurons and restore light responses in thephotoreceptor-degenerated retina. The spatial resolution isapproaching or comparable to ~50 μm, and the size of receptivefield is comparable to that in wild-type mice. The light-responseinhibition by glutamatergic antagonists suggests the NW arrays-interfaced retinas were capable of processing visual informationthrough innate retinal circuits. Moreover, functional and beha-vioral restoration of light sensitivity has been demonstrated withsubretinal implant of the Au–TiO2 NW arrays in blind mice,suggesting the possibility for using NW arrays as prostheticdevices.
MethodsSynthesis of TiO2 and Au–TiO2 nanowire arrays. TiO2 NW arrays were verti-cally grown on fluorine-doped tin oxide (FTO)-coated glass (Wuhan Ge-Ao Ltd.,China) or polydimethylsiloxane (PDMS) substrates by a hydrothermal method, inwhich tetrabutyl titanate (TBOT) was used for the Ti precursor. In a typicalsynthesis, 0.1 g of Ti foil and 18 mL of 0.1 M HCl solution were put into a Teflon-lined stainless steel autoclave with a total volume of 25 mL. The PDMS elastomerwas then immersed into the solution after ultrasonic cleaning for 30 min in a 1:1:1(v/v/v) mixture of acetone, ethanol and deionized (DI) water. The hydrothermalsynthesis was conducted at 150 °C for 12 h in an electric oven. For the Au-TiO2
ARTICLE NATURE COMMUNICATIONS | DOI: 10.1038/s41467-018-03212-0
10 NATURE COMMUNICATIONS | (2018) 9:786 | DOI: 10.1038/s41467-018-03212-0 |www.nature.com/naturecommunications
NW arrays synthesis, after the fabrication of TiO2 NW arrays, Au nanoparticleswere deposited on TiO2 NW arrays by a solution reduction approach. Briefly, anFTO substrate with TiO2 NW arrays was soaked into 0.01 M HAuCl4 (with pHtuned to 4.5 by adding 0.2 M NaOH) for 2 h. The sample was then thoroughlywashed by DI water, dried in air and annealed in air at 300 °C for 2 h. For in vivoimplantation and measurement, after nanowire synthesis, the side of FTO substrategrown with TiO2 nanowires was pre-covered with a thin layer of poly-methylmethacrylate (PMMA) and incubated at 85 °C for 5 min. Then, the FTOsubstrates were etched in a hydrogen fluoride solution (20%) for ~9 h to reduce thethickness of FTO substrates to below 100 μm, followed by removal of PMMA inaceton.
Photoelectric measurement. The photoelectric measurement was carried outusing a CHI 660D electrochemical workstation (CH Instruments, Inc., USA) with a3-electrode system, in which the Au–TiO2 NW arrays photoanode, a coiled Pt wireand an Ag/AgCl were used as the working, counter and reference electrodes,respectively. The photoanode was illuminated under 100 mW cm–2 of simulatedsunlight, using a solar simulator equipped with a 150W xenon lamp and an AM1.5 G filter (94022A, Newport Inc., USA). A phosphate buffer saline (PBS, pH 7.4)was used as the electrolytes. Different filters were applied to obtain UV (375/28 nm,full intensity 133 μWmm–2), blue (470/20 nm, full intensity 691 μWmm–2) andgreen light (546/12 nm, full intensity 470 μWmm–2).
Animals and genotyping. All procedures were conducted in accordance with theguidelines of the Institutional Animal Care and Use Committee at Shanghai PublicHealth Clinical Center. Wild-type (C57BL/6J) mice were obtained from the SlacLaboratory Animal Co. (Shanghai, China). All animals were raised and bred at25°C, 50% relative humidity, 12 hours light and dark cycles. For sorting the clpositive and rd1 homozygote mice, two pairs of primers and a restriction enzyme(ThermoFisher, HpyF3I (DdeI)) which recognizes C^TNAG sites were used. Todifferentiate rd1−/− and rd1-/+, primers 5′-CATCCCACCTGAGCTCACA-GAAAG-3′ and 5′-GCCTACAACAGAGGAGCTTCTAGC-3′ were used. Afterdigestion, homozygote mice had 2 mutant bands: 126 bp and 155 bp. Heterozygousmice had two mutant bands and a wild-type band. Mutant bands at 126 bp andwild-type band at 301 bp. To distinguish cl (also called cone-DTA) knockout andwild-type, primers 5′-CAAGGAAATTATGACGATGATTGG-3′ and5′-GGCTTGAGCCATATACTCATACATCGC-3′ were used with mutant band atabout 450 bp. Mice used in experiments were either male or female and frommultiple litters. All the mice were more than 7 weeks old, and more specific agescould be seen in the corresponding sections of Methods. Sample size was chosen tobe larger than 5 for statistical analysis. In some cases, due to the limited number ofavailable mice, sample size was 4, and no statistical analysis was conducted. Sinceour experiments were designed to look for all-or-none response, we did not ran-domize our samples. No specific blinding was done in the in vitro and in vivoelectrophysiology recordings and Ca2+ imaging experiments since all data analysiswas conducted using automated methods. Blinding was conducted between PLRexperiment and data analysis.
Retinal tissue preparation. Mice were anesthetized with 10% chloral hydrate (0.3mL per 100 g weight). One eye was enucleated and rapidly placed in Ringer’ssolution consisting of (in mM) NaCl 124, KCl 2.5, CaCl2 2, MgCl2 2, NaH2PO4
1.25, NaHCO3 26 and glucose 22, pH 7.35 and oxygenated with 95% O2 and 5%CO2. Then the retina was dissected and placed on a filter paper (MerckMillipore,Germany) in the recording chamber.
Photo-stimulation. Light stimulation was performed on a setup consisting of aZeiss upright DIC microscope (Examiner A1, Zeiss, Germany). Near UV, blue andgreen light were generated from the mercury lamp (X-Cite 120, Lumen Dynamics,USA), filtered by fluorescence cubes (UV: 375/28 nm; Green: 546/12 nm; Blue: 470/20 nm, Zeiss Inc., Germany) and provided through the ×40 water-immersionobjective. A circular illumination spot around neurons was obtained by passinglight through a pin hole and focusing the light with a water immersion ×40objective.
Patch-clamp recording of retinal ganglion cells. Action potentials were recordedusing MultiClamp 700B patch-clamp amplifier (Molecular Devices, USA), anddigitized by Digidata 1440 (Molecular Devices, USA) under DIC microscope (Zeiss,Germany) at room temperature. A glass pipette (5–10MΩ) was pulled by P-97micropipette puller (Sutter Instruments, USA) filled with internal solution (in mM,potassium gluconate 105, KCl 5, CaCl2 0.5, MgCl2 2, EGTA 5, HEPES 10, Mg-ATP4, GTP-Na 0.5, sodium phosphocreatine 7, Lucifer Yellow 0.05%, PH 7.4). pClamp10 (Molecular Devices, USA) was used for data analysis. The investigator wasblinded to the group allocation when analyzing the light-response of RGCs but notduring the patch-clamp experiment. Dendritic arbors of RGCs were labeled byfilling the patch pipette with Lucifer Yellow and imaged after the whole-cell patchclamp experiment. The distance d from the tip of the longest arbor to the center ofthe cell body was measured. The size of the dendritic arborizations was calculatedby πd2. The concentrations for glutamate receptor antagonists were: L-AP4: 50 µM,D-AP5: 50 µM, NBQX: 20 µM.
Intravitreous injection and Ca2+ imaging in vitro. The mice were anesthetizedby 2% chloral hydrate (0.2 mL per 10 g weight). 1 μL AAV-syn-GCaMP6s viruswere injected into the retina of rd1/cDTA knockout mice at P28 using NanoJectII(Drummond scientific company, Germany). Expression of GCaMP6s in the retinastarted 2 weeks after the injection surgery. After 3-4 weeks, expression reached theoptimal level and retinas were dissected for imaging experiments. A series offluorescent images were captured and collected at 10 Hz (512 × 512 pixels) by Flash4.0 (Hamamatsu, Japan) at room temperature, and were analyzed by ImageJsoftware. ΔF/F0 was calculated as (F–F0)/F0. F0 was equal to the mean of fluores-cence signals from the first 5 frames.
Immunohistochemistry. Retina was fixed in 4% PFA for 5−7 h at 4 °C immedi-ately after dissection. For retina slice immunohistochemistry, 10% (30 min, roomtemperature), 20% (30 min, room temperature) and 30% (overnight, 4 °C) sucrosewere used to dehydrate the fixed retina. The retina was embedded in OCT com-pound (Sakura) and stored at −80 °C for more than 2 h. Fourteen-micrometerslices were cut (Leica CM 1950, Leica, Germany) and washed 3 times for 15 minwith 0.05M TBS to wash away the OCT. After immersing slices in 0.5% Triton-X-100 for 20 min, slices were incubated in a blocking solution consisting 10% Donkeyserum (Jackson Immunoresearch, USA), 1% bovine serum albumin (BSA), and0.05% Triton-X-100 in 0.05M TBS (DST) for 2 h at room temperature. Then sliceswere immediately covered by the primary antibody (ANTI-Choline Acetyl-transferase antibody47, MILLIPORE (AB144P), 1:200) solution and hybridizationfor 20–24 h at 4 °C. The slices were then washed 6 times for 10 min in TBS to getrid of the primary antibody, followed by incubated with secondary antibody(Donkey anti-Goat conjugated to Alexa Flour 594, 1:300, Jackson ImmunoR-esearch, USA) at room temperature for 2 h in dark. After removing the secondaryantibody and washing 3 times for 10 min, the slices were stained in 1:3000 DAPIsolution for 10 min and washed 3 times for 10 min. Slices were air dried andmounted. Fluorescent images were taken under epifluorescence microscope(Olympus, Japan).
The immunohistochemistry protocol for whole-mount retinas was similar tothat in the retinal slices. After patch-clamp recording, retinas were fixed in 4% PFAfor 5−7 h at 4 °C, washed by TBS, incubated in 0.5% Triton-X-100 for 30 min,blocked by 10% DST for 3 h at room temperature. The retina was then transferredinto the primary antibody (ANTI-GFP antibody48, Avēs Labs Inc. (GFP-1020),1:1000; ANTI-Brn3a antibody49, Santa Cruz Biotechnology (SC-31984), 1:500;ANTI-Lucifer Yellow antibody50 Invitrogen (A5750), 1:500) solution andincubated for 24−30 h at 4 °C. After washing in TBS, retinas were transferred to thesecondary antibody (Donkey anti-Chicken conjugated to Alexa Flour 488, 1:300,Jackson ImmunoResearch, USA; Donkey anti-Goat conjugated to Alexa Flour 594,1:300, Jackson ImmunoResearch, USA; Donkey anti-Rabbit conjugated to AlexaFlour 488, 1:300, Jackson ImmunoResearch, USA) solution for 3 h at roomtemperature in the dark. After the secondary antibody was washed off, whole-mounted retinas were air dried and mounted by Fluruomount-G (SouthernBiotech, USA). Fluorescent images were obtained by fluorescence imagingmicroscope (Eclipse Ni, Nikon Inc, Japan) and confocal multi-photon scanningmicroscope (AIR-MP, Nikon Inc, Japan) and analyzed in ImageJ software 1.48v(NIH) and NIS-Elements AR software ver. 4.30.01 (Nikon Inc).
Surgery for in vivo electrophysiology recording. Mice aged at P56 were deeplyanaesthetized with 2.5% isoflurane in oxygen for 20 min before the surgery. Thenose and mouth of the mice were placed in a respiratory mask infused with 0.5−1% isoflurane. The mice were kept on a heating pad (FHC Inc., USA), followedby subcutaneous injection of 1% lidocaine (10 mgmL–1 lidocaine in saline; MPBiomedicals, USA) under the scalp. After removal of the scalp, the front and backof the skull were glued onto two copper rods and assembled onto a rotatablemounting platform. A craniotomy window in the skull was created stereotaxicallyin V1 (3.1−4.2 mm posterior to bregma and 2.0−3.2 mm lateral, at a depth of300–500 μm), and the dura was removed carefully. The craniotomy was filled withwarm (37 °C) sterile buffered saline (150 mM NaCl, 2.5 mM KCl, 10 mM HEPES,pH 7.4) throughout the experiment. The recording platform was set up on arotatable base (Thorlabs Inc., USA). The platform was adjusted such that thecraniotomy plane was vertical to the electrodes.
Visual stimuli and in vivo electrophysiology recordings. Isoflurane anesthesiawas adjusted to 0.5% to maintain a stable respiratory rate. Visual stimuli wereconsisted of 1 s UV light with various intensities followed by 59 s non-stimulationperiod. The whole-eye UV stimulus were produced by mercury lamp at variousintensities and last for 1.06 s. For multielectrode array recordings, neuronal signalswere recorded in V1 using a 4 × 4 microelectrode array interfaced with Power 1401(Cambridge Electronic Design, UK). Platinum/Iridium (70%/30%) opto-MEA (1MΩ, 250 μm apart, Microprobes, USA) was inserted into L2/3 of primary visualcortex. Electrical signals were amplified (Microelectrode AC Amplifier 1800, A-MSystems, Inc., USA), high-pass filtered at 1 Hz and sampled at 10 kHz using Power1401. Spike activity was high pass filtered at 300 Hz. We used 5 times the numberof standard deviation (sigmas) in the mean of the peak height histogram tothreshold the spike signals. Multi-unit spikes were initially clustered using K-meansin Offline sorter (Plexon Inc., USA) and manually grouped similar clusters if
NATURE COMMUNICATIONS | DOI: 10.1038/s41467-018-03212-0 ARTICLE
NATURE COMMUNICATIONS | (2018) 9:786 | DOI: 10.1038/s41467-018-03212-0 |www.nature.com/naturecommunications 11
necessary. Firing rates were calculated in Neuroexplorer (Plexon Inc., USA) andperi-stimulus time histograms (PSTHs) were plotted in Spike2 software (Cam-bridge Electronic Design, UK).
Implant surgery. Eight to ten weeks old rd1/cDTA (blind mice) were anaes-thetized. Up and down eyelids were suture to fix the eye-ball in proper positionwhich is suitable for implantation. The mice were then fixed on the stereotaxicaparatus. A small cut was made in the sclera, 1–2 μL of 0.9% sodium chloridesolution was injected quickly and carefully by nano-ject (Drummond Instrument)to leave enough space for NW arrays implantation. After that, an expansion cutwas quickly made at about 45–60 angle to the nasal-temporal axis. The size of thecut was determined by the size of the substrate for NW arrays. The typical area ofthe implanted NW arrays is 0.5 mm2–1.5 mm2. The substrate was held by a sharptweezer and inserted into the cut under microscope. After the implantation, washthe eye-all by 0.9% sodium chloride solution and remove the suture to retract theeye-ball. Mice were put back to the home cage to recover.
Retinal tissue preparation for scanning electron microscope. Eye-balls wereextracted about 5 days after NW arrays implantation. The lens was removed andthe remaining eye-cup was fixed in 4% PFA at 4 °C overnight, dehydrated in 30%,50%, 70%, 90%, 95%, and 100% ethanol for 1 h in each solution, and air-dried atroom temperature. The retina was trimmed to reveal the edge of the tissue beforeSEM.
Pupillary light reflex. Metal plates were implanted onto the skull of mice prior tobehavioral experiments. Following 2 hours of dark adaption, unanaesthetized mice(over 50 days old) were head-fixed through metal plates under infrared illumina-tion. Light stimuli were provided by an ultra violet LED (peaked at 395 nm), as wellas green LED (peaked at around 560 nm), to one eye, while a near-infrared camera(JAI, Denmark) recorded the response from the same eye. Light intensities weremeasured at the cornea using an optical power meter (Thorlabs, USA). Each ses-sion was recorded at 62 Hz frame rate for 1 minute, starting 5 s before a 20 s lightstimulus. Pupil areas were measured using ImageJ (NIH, USA). Percentage of pupilconstrictions was calculated as 1� amin
a0
� �´ 100% (amin: minimum pupil area during
light exposure; a0: pupil area immediately prior to light exposure). One mouse wasexcluded from pupillary light reflex analysis due to frequent spontaneous pupillaryconstriction which disrupted the judge of light reflex.
Statistics. All data are represented as mean and S.E.M. The differences were testedby OriginPro software ver. 9.0.0 (Hewlett–Packard Company) and SPSS softwareversion 23.0 (IBM). All comparisons were made by unpaired two-tailed Student’s t-tests, two-sided Wilcoxon rank-sum tests and Chi-square tests, except for the PLRexperiments where paired two-tailed Student’s t-tests or two-sided Wilcoxonsigned-rank tests were used. All data met the assumptions of the test for dis-tribution with similar variance statistically compared. P values <0.05 were con-sidered significant.
Data availability. The data that support the findings of this study are availablefrom the corresponding author upon reasonable request.
Received: 18 June 2017 Accepted: 26 January 2018
References1. He, S., Dong, W., Deng, Q., Weng, S. & Sun, W. Seeing more clearly: recent
advances in understanding retinal circuitry. Science 302, 408–411 (2003).2. Xue, T. et al. Melanopsin signalling in mammalian iris and retina. Nature 479,
67–73 (2011).3. Zheng, J., Lee, S. & Zhou, Z. J. A transient network of intrinsically bursting
starburst cells underlies the generation of retinal waves. Nat. Neurosci. 9,363–371 (2006).
4. Lee, S. et al. An unconventional glutamatergic circuit in the retina formed byvGluT3 amacrine cells. Neuron 84, 708–715 (2014).
5. Guo, X. et al. A short N-terminal domain of HDAC4 preserves photoreceptorsand restores visual function in retinitis pigmentosa. Nat. Commun. 6, 8005(2015).
6. Dowling, J. E. The Retina: An Approachable Part of the Brain (HarvardUniversity Press, 1987).
7. Sweeney, N. T., Tierney, H. & Feldheim, D. A. Tbr2 is required to generate aneural circuit mediating the pupillary light reflex. J. Neurosci. 34, 5447–5453(2014).
8. Masland, R. H. The fundamental plan of the retina. Nat. Neurosci. 4, 877–886(2001).
9. Masland, R. H. The neuronal organization of the retina. Neuron 76, 266–280(2012).
10. Pearson, R. A. et al. Restoration of vision after transplantation ofphotoreceptors. Nature 485, 99–103 (2012).
11. Zhong, X. et al. Generation of three-dimensional retinal tissue with functionalphotoreceptors from human iPSCs. Nat. Commun. 5, 4047 (2014).
12. Lee, D. Y., Lorach, H., Huie, P. & Palanker, D. Implantation of modularphotovoltaic subretinal prosthesis. Ophthalmic Surg. Lasers Imaging Retin. 47,171–174 (2016).
13. Ghezzi, D. et al. A polymer optoelectronic interface restores light sensitivity inblind rat retinas. Nat. Photonics 7, 400–406 (2013).
14. Ghezzi, D. Retinal prostheses: progress toward the next generation implants.Front. Neurosci. 9, 290 (2015).
15. Bareket, L. et al. Semiconductor nanorod-carbon nanotube biomimetic filmsfor wire-free photostimulation of blind retinas. Nano Lett. 14, 6685–6692(2014).
16. Ko, H. C. et al. A hemispherical electronic eye camera based on compressiblesilicon optoelectronics. Nature 454, 748–753 (2008).
17. Gautam, V., Rand, D., Hanein, Y. & Narayan, K. S. A polymer optoelectronicinterface provides visual cues to a blind retina. Adv. Mater. 26, 1751–1756(2014).
18. Tochitsky, I. et al. Restoring visual function to blind mice with a photoswitchthat exploits electrophysiological remodeling of retinal ganglion cells. Neuron81, 800–813 (2014).
19. Maya-Vetencourt, J. F. et al. A fully organic retinal prosthesis restores visionin a rat model of degenerative blindness. Nat. Mater. 16, 681–689 (2017).
20. Kruskal, P. B., Jiang, Z., Gao, T. & Lieber, C. M. Beyond the patch clamp:nanotechnologies for intracellular recording. Neuron 86, 21–24 (2015).
21. Tian, B. et al. Macroporous nanowire nanoelectronic scaffolds for synthetictissues. Nat. Mater. 11, 986–994 (2012).
22. Zhang, A. & Lieber, C. M. Nano-Bioelectronics. Chem. Rev. 116, 215–257(2016).
23. Tang, J., Huo, Z., Brittman, S., Gao, H. & Yang, P. Solution-processed core-shell nanowires for efficient photovoltaic cells. Nat. Nanotechnol. 6, 568–572(2011).
24. Yan, R., Gargas, D. & Yang, P. Nanowire photonics. Nat. Photonics 3, 569(2009).
25. Lorach, H. et al. Photovoltaic restoration of sight with high visual acuity. Nat.Med. 21, 476–482 (2015).
26. Guo, W. et al. Rectangular bunched rutile TiO2 nanorod arrays grown oncarbon fiber for dye-sensitized solar cells. J. Am. Chem. Soc. 134, 4437–4441(2012).
27. Wang, G. et al. Significantly enhanced visible light photoelectrochemicalactivity in TiO2 nanowire arrays by nitrogen implantation. Nano Lett. 15,4692–4698 (2015).
28. Pu, Y. C. et al. Au nanostructure-decorated TiO2 nanowires exhibitingphotoactivity across entire UV-visible region for photoelectrochemical watersplitting. Nano Lett. 13, 3817–3823 (2013).
29. Hwang, Y. J., Hahn, C., Liu, B. & Yang, P. Photoelectrochemical properties ofTiO2 nanowire arrays: a study of the dependence on length and atomic layerdeposition coating. ACS Nano 6, 5060–5069 (2012).
30. Warren, S. C. & Thimsen, E. Plasmonic solar water splitting. Energy Environ.Sci. 5, 5133–5146 (2012).
31. Tan, S. J., Campolongo, M. J., Luo, D. & Cheng, W. Building plasmonicnanostructures with DNA. Nat. Nanotechnol. 6, 268–276 (2011).
32. Xia, Y. et al. Gold nanocages: from synthesis to theranostic applications. Acc.Chem. Res. 44, 914–924 (2011).
33. Warrant, E. J. & Nilsson, D. E. Absorption of white light in photoreceptors.Vision. Res. 38, 195–207 (1998).
34. Lin, B., Koizumi, A., Tanaka, N., Panda, S. & Masland, R. H. Restoration ofvisual function in retinal degeneration mice by ectopic expression ofmelanopsin. Proc. Natl Acad. Sci. USA 105, 16009–16014 (2008).
35. Miller, J. P. & Selverston, A. Rapid killing of single neurons by irradiation ofintracellularly injected dye. Science 206, 702–704 (1979).
36. Henriksson, J. T., Bergmanson, J. P. & Walsh, J. E. Ultraviolet radiationtransmittance of the mouse eye and its individual media components. Exp. EyeRes. 90, 382–387 (2010).
37. Tan, Z., Sun, W., Chen, T. W., Kim, D. & Ji, N. Neuronal representation ofultraviolet visual stimuli in mouse primary visual cortex. Sci. Rep. 5, 12597(2015).
38. Polosukhina, A. et al. Photochemical restoration of visual responses in blindmice. Neuron 75, 271–282 (2012).
39. Caporale, N. et al. LiGluR restores visual responses in rodent models ofinherited blindness. Mol. Ther. 19, 1212–1219 (2011).
40. Zhu, J., Cifuentes, H., Reynolds, J. & Lamba, D. A. Immunosuppression vialoss of IL2rγ enhances long-term functional integration of hESC-derivedphotoreceptors in the mouse retina. Cell Stem Cell 20, 374–384 (2017).
ARTICLE NATURE COMMUNICATIONS | DOI: 10.1038/s41467-018-03212-0
12 NATURE COMMUNICATIONS | (2018) 9:786 | DOI: 10.1038/s41467-018-03212-0 |www.nature.com/naturecommunications
41. Shapiro, M. G., Homma, K., Villarreal, S., Richter, C. P. & Bezanilla, F.Infrared light excites cells by changing their electrical capacitance. Nat.Commun. 3, 736 (2012).
42. Farah, N. et al. Holographically patterned activation using photo-absorberinduced neural-thermal stimulation. J. Neural Eng. 10, 056004 (2013).
43. Jiang, K., Smith, D. A. & Pinchuk, A. Size-dependent photothermalconversion efficiencies of plasmonically heated gold nanoparticles. J. Phys.Chem. C. 117, 27073–27080 (2013).
44. Govorov, A. O. & Richardson, H. H. Generating heat with metalnanoparticles. Nano Today 2, 30–38 (2007).
45. Tian, B. et al. Coaxial silicon nanowires as solar cells and nanoelectronicpower sources. Nature 449, 885–889 (2007).
46. Xie, C., Lin, Z., Hanson, L., Cui, Y. & Cui, B. Intracellular recording of actionpotentials by nanopillar electroporation. Nat. Nanotechnol. 7, 185–190 (2012).
47. Heinze, L., Harvey, R. J., Haverkamp, S. & Wassle, H. Diversity of glycinereceptors in the mouse retina: localization of the alpha4 subunit. J. Comp.Neurol. 500, 693–707 (2007).
48. Li, X., Liu, Z., Qiu, M. & Yang, Z. Sp8 plays a supplementary role to Pax6 inestablishing the pMN/p3 domain boundary in the spinal cord. Development141, 2875–2884 (2014).
49. Quina, L. A. et al. Brn3a-expressing retinal ganglion cells project specifically tothalamocortical and collicular visual pathways. J. Neurosci. 25, 11595–11604(2005).
50. Bartel, D. L., Rela, L., Hsieh, L. & Greer, C. A. Dendrodendritic synapses in themouse olfactory bulb external plexiform layer. J. Comp. Neurol. 523,1145–1161 (2015).
AcknowledgementsG.Z. thanks the following funding agencies for supporting this work: the National KeyR&D Program of China (2017YFA0206901, 2017YFA0206900), the NSF of China(21473038, 21773036), and the Key Basic Research Program of Science and TechnologyCommission of Shanghai Municipality (17JC1400100). J.Z. thanks the following fundingagencies for supporting this work: the NSF of China (31421091, 31422025, 31771195,81790640), the Young 1000 Plan and Ministry of Science and Technology of the People’sRepublic of China (2015AA020512). The authors thank Dr. Biao Kong, Dr. Hao Wu, XuHuang and Xiaodi Liu of Fudan University for technical help.
Author contributionsG.Z. and J.Z. proposed, designed, and supervised the project. G.Z. and J.Z. wrote themanuscript. J.T., N.Q., Y.C., Yili., Z.W. performed the experiments and analyzed thedata. Y.D. analyzed the data. T.X. provided mice and M.J. provided support for beha-vioral facility. All authors discussed, commented on, and revised the manuscript.
Additional informationSupplementary Information accompanies this paper at https://doi.org/10.1038/s41467-018-03212-0.
Competing interests: The authors declare no competing financial interests.
Reprints and permission information is available online at http://npg.nature.com/reprintsandpermissions/
Publisher's note: Springer Nature remains neutral with regard to jurisdictional claims inpublished maps and institutional affiliations.
Open Access This article is licensed under a Creative CommonsAttribution 4.0 International License, which permits use, sharing,
adaptation, distribution and reproduction in any medium or format, as long as you giveappropriate credit to the original author(s) and the source, provide a link to the CreativeCommons license, and indicate if changes were made. The images or other third partymaterial in this article are included in the article’s Creative Commons license, unlessindicated otherwise in a credit line to the material. If material is not included in thearticle’s Creative Commons license and your intended use is not permitted by statutoryregulation or exceeds the permitted use, you will need to obtain permission directly fromthe copyright holder. To view a copy of this license, visit http://creativecommons.org/licenses/by/4.0/.
© The Author(s) 2018
NATURE COMMUNICATIONS | DOI: 10.1038/s41467-018-03212-0 ARTICLE
NATURE COMMUNICATIONS | (2018) 9:786 | DOI: 10.1038/s41467-018-03212-0 |www.nature.com/naturecommunications 13