Embed Size (px)
Citation preview
i n t e r n a t i o n a l j o u r n a l o f h y d r o g e n en e r g y 3 5 ( 2 0 1 0 ) 1 0 8 8 3e1 0 8 8 9
Avai lab le a t www.sc iencedi rec t .com
journa l homepage : www.e lsev ier . com/ loca te /he
Nanostructured Zn-Fe2O3 thin film modified by Fe-TiO2 forphotoelectrochemical generation of hydrogen
Poonam Sharma a, Praveen Kumar a, Dinesh Deva c, Rohit Shrivastav b, Sahab Dass b,Vibha R. Satsangi a,*aDepartment of Physics & Computer Science, Faculty of Science, Dayalbagh Educational Institute, Dayalbagh, Agra-282005-IndiabDepartment of Chemistry, Faculty of Science, Dayalbagh Educational Institute, Dayalbagh, Agra-282005-IndiacDST Unit on Nanosciences, Department of Chemical Engineering, Indian Institute of Technology Kanpur, India
a r t i c l e i n f o
Article history:
Received 5 April 2010
Received in revised form
28 June 2010
Accepted 2 July 2010
Available online 11 August 2010
Keywords:
Photoelectrochemical
Nanostructured
Iron oxide
Titanium dioxide
Spray-pyrolysis
Sol-gel
* Corresponding author. Tel.: þ91 9319104320E-mail address: [email protected]
0360-3199/$ e see front matter ª 2010 Profedoi:10.1016/j.ijhydene.2010.07.016
a b s t r a c t
Nanostructured semiconductor thin films of Zn-Fe2O3 modified with underlying layer of
Fe-TiO2 have been synthesized and studied as photoelectrode in photoelectrochemical
(PEC) cell for generation of hydrogen through water splitting. The Zn-Fe2O3 thin film
photoelectrodes were designed for best performance by tailoring thickness of the Fe-TiO2
film. A maximum photocurrent density of 748 mA/cm2 at 0.95 V/SCE and solar to hydrogen
conversion efficiency of 0.47% was observed for 0.89 mm thick modified photoelectrode in
1 M NaOH as electrolyte and under 1.5 AM solar simulator. To analyse the PEC results the
films were characterized for various physical and semiconducting properties using XRD,
SEM, EDX and UVeVisible spectrophotometer. Zn-Fe2O3 thin films modified with Fe-TiO2
exhibited improved visible light absorption. A noticeable change in surface morphology of
the modified Zn-Fe2O3 film was observed as compared to the pristine Zn-Fe2O3 film. Flat-
band potential values calculated from MotteSchottky curves also supported the PEC
response.
ª 2010 Professor T. Nejat Veziroglu. Published by Elsevier Ltd. All rights reserved.
1. Introduction said requirements simultaneously. Compared to others,
Photoelectrochemical (PEC) splitting of water into hydrogen
and oxygen attracted researchers all over the world since the
generation of hydrogen using TiO2 as a photoanode by
Fujishima and Honda in 1972 [1]. The search has continued for
ideal PECwater splittingmaterial having the characteristics of
efficient sun light absorption, proper band edge energetic,
high quantum efficiency, practical durability and low cost
[2,3]. A wide range of oxide semiconductors like TiO2, a-Fe2O3,
ZnO, BaTiO3 andWO3 etc. has been thoroughly investigated in
PEC cell for the generation of hydrogen to get reasonable
efficiency at low cost [4e9]. However, no single semi-
conductingmaterial has yet been found to satisfy all the above
; fax: þ91 562 2801226.(V.R. Satsangi).
ssor T. Nejat Veziroglu. P
hematite (a-Fe2O3) is considered to be an attractive PEC
material, having desired property of narrow band gap
(approximately 2.2 eV), which in principle allows utilization of
a larger fraction of the solar spectrum, low cost, electro-
chemical stability and low toxicity [9e12]. But, the water
splitting efficiency for a-Fe2O3 is reported to be much lower
than the theoretical maximum efficiency of 12.9% [13]. This is
mainly due to the rapid electron-hole recombination in the
semiconductor resulting in short diffusion lengths of charge
carriers [14], slow surface reaction kinetics [5] and falloff in the
absorption cross-section of the material for wavelengths
approaching the band gap value. Additionally, the conduction
band edge of hematite is slightly below that of the Hþ/H2 redox
ublished by Elsevier Ltd. All rights reserved.
i n t e rn a t i o n a l j o u r n a l o f h y d r o g e n en e r g y 3 5 ( 2 0 1 0 ) 1 0 8 8 3e1 0 8 8 910884
potential; due to which an external electrical bias is needed to
generate hydrogen [15]. To overcome these problems and to
improve performance of hematite nanostructuring tech-
niques have been suggested and studied by several groups
[5,9,10,13]. However the reported value of the photocurrent
density is still much below to meet the challenge.
Recently, composite semiconductor thin films of different
band gap energies have gained considerable interest on
account of its modified optical and charge transportation
properties [16]. It is well accepted that the wide band gap
semiconductors generate a high photovoltage but exhibit low
photocurrent whereas, smaller band gap semiconductors can
utilize a larger fraction of the incident photons but generate
lower photovoltage [17]. Therefore, a device having multiple
band gap energy layers can cover broad range of solar spec-
trum. It is expected that combining best of a-Fe2O3 and TiO2 in
one photoelectrode, may provide a better and efficient PEC
system for generation of hydrogen. With this idea, this paper
presents the PEC study on nanostructured Zn doped a-Fe2O3
(Zn-Fe2O3) thin film, modified by introducing a layer of Fe
doped TiO2 (Fe-TiO2) below the hematite thin film. Zn-Fe2O3
and Fe-TiO2 thin films were chosen because of their good
optical and photoelectrochemical properties than pristine
a-Fe2O3 and TiO2 thin films [18,19]. Prepared photoelectrodes
were also characterized for their structural, electrical and
optical properties to assess the mechanism by which this
concept influences the photoelectrode performance.
Table 1 e Sample description.
S. No. Film thickness (mm) Acronym
Zn-Fe2O3 Fe-TiO2 Overallthickness
1 0.24 e 0.24 A1
2 0.24 0.32 0.56 A2
3 0.24 0.65 0.89 A3
4 0.24 0.97 1.21 A4
2. Experimental
All chemicals used in this study were analytical grade
reagents; Fe(NO3)3$9H2O (99.9%, Aldrich), Zn(NO3)2$6H2O
(99.9%, Aldrich), titanium tetra isopropoxide (TTIP, 97% Pure)
and diethanolamine were used to prepare the precursor
solution for Zn-Fe2O3 and Fe-TiO2 respectively.
2.1. Preparation of photoelectrode
2.1.1. Nanostructured TiO2 doped with ironNanostructured iron doped TiO2 thin films were prepared by
sol-gel spin coating, using titanium tetra isopropoxide,
ethanol, diethanolamine and 0.2 at.% Fe(NO3)3$9H2O (dopant).
The details of the method of preparation have been described
somewhere else [19]. In the present work Fe-TiO2 films of
thicknesses 0.32, 0.65 and 0.97 mm were deposited on con-
ducting glass substrate (SnO2:In) with one, two and three
layers, to study the effect of thickness of underlying Fe-TiO2
film on the PEC response of Zn-Fe2O3 films.
2.1.2. Nanostructured Zn-Fe2O3 modified with underlyinglayer of Fe-TiO2
The thin filmsofZn-Fe2O3wereprepared by spray depositionof
Zn-Fe2O3 thin film over the pre-deposited Fe-TiO2 thin films
using the spray-pyrolysis set-up (laboratory built & designed).
The spray precursor comprising of 0.15 M Fe(NO3)3$9H2O and
5.0 at.% Zn(NO3)2$6H2O (dopant) in de-ionized (D.I) water was
sprayed with air as carrier gas at a pressure 2 Kg/cm2 through
a pneumatic nebulizer with a nozzle diameter of 0.1 mm onto
(pre-deposited) Fe-TiO2 thin films, kept on substrate heater at
350 �C temperature,withnearlyone-third of its surface covered
with aluminiumfoil. The solutionwassprayed for a total period
of 20 s, in two successive spray of 10 s duration. The time gap of
3 min between each successive spray was left for thermal
hydrolysis of the films. In order to get uniform thin films, the
heightof thesprayingnozzle fromthesubstrateheaterandflow
rate of the spray precursor were maintained at 25 cm, and
0.54ml/min, respectively,during thedepositionprocess.Finally
all thefilmsweresubjected toannealing inair at 500 �C for 2h in
a Muffle furnace. The obtained Zn-Fe2O3 thin films were semi-
transparent reddish brown in appearance and strongly
adherent to the substrate. It is tomentionhere that thicknessof
Zn-Fe2O3 film was kept constant and thickness of underlying
Fe-TiO2 film was varied in the different samples. Average
thickness of the Zn-Fe2O3 films deposited for 20 s spray period
was 0.24 mm, as measured by alpha-step profilometer (Tencor
AlphaStep 500). Overall film thicknesswith otherdetails of four
set of samples prepared in this study have been summarized in
Table 1. All thefilmswere converted into photoelectrodesusing
copperwire, silverpasteandepoxy (Hysol, Singapore) for itsuse
as photoelectrode in PEC cell. The effective area of the photo-
electrode available for illumination was 1.0 cm2.
2.2. Characterizations
The surface morphology and elemental composition of the
samples were obtained by using a field emission scanning
electron microscope (FE-SEM), (Carl Zeiss SUPRA 40VP)
combined with Oxford energy dispersive X-ray analysis (EDX).
The crystalline phases of the thin film samples were analysed
by X-ray diffractometer (XRD), (PANalytical X’Pert PRO q e 2q
Diffractometer) with a Cu-Ka source. Crystallite sizes in the
prepared films were calculated from the XRD data using
Scherrer’s formula [20]. Optical absorption spectra were
recorded on the thin film samples using a UVeVisible spec-
trophotometer (Shimadzu, UV-2450).
2.3. Photoelectrochemical study
The PECmeasurement was performed in a three electrode cell
consisting of metal oxide semiconductor as working, satu-
rated calomel electrode (SCE) as reference, and platinum
mesh as counter electrode, all immersed in 1 M NaOH elec-
trolyte (Sigma Aldrich, 99.99% purity). The photocurrents of
the samples as a function of applied potential versus SCEwere
recorded using a potentiostat (PAR Model:Versa Stat II) and
a visible light source (150 W Xenon lamp, Bentham) with
illumination intensity of 150 mW/cm2. The resistivity for all
i n t e r n a t i o n a l j o u r n a l o f h y d r o g e n en e r g y 3 5 ( 2 0 1 0 ) 1 0 8 8 3e1 0 8 8 9 10885
the samples was calculated from the slope of currentevoltage
characteristic curves under dark condition. The performance
of the photoelectrodes were also tested under simulated light
provided by 300 W solar simulator (Newport, Model: 91160) in
AM 1.5 condition with illumination intensity of 70 mW/cm2.
The light intensity of both the light sources was measured
using broadband powermeter (Melles Griot, Model:13PEM001).
The experimental procedure also involved the measurements
of the open circuit photovoltage (Voc) for all the samples.
Capacitance (Csc) at semiconductor/electrolyte junction was
measured by LCR meter (Agilent Technology, Model: 4263 B)
for varying electrode potentials, at AC signal frequency of
1 kHz. The flatband potential (Vfb) of semiconductor photo-
electrode was obtained from the intercept of MotteSchottky
plot using the following relation:
1
C2¼
�2
q303N
��Vapp � VFB � kT
q
�(1)
Here 3o is the permittivity of the vacuum, N is the carrier
density, Vapp is the applied potential, 3 is the dielectric
constant of the semiconductor, kT/q is the temperature
dependent term. The intercept of linear plot at C�2 ¼ 0 gives
the flatband potential. Hydrogen was collected and measured
at the counter electrode with the best performing photo-
electrode by the water displacement method. Solar to
hydrogen conversion efficiency was calculated for all the
samples under 1.5 AM solar simulator irradiation.
3. Results & discussion
3.1. X-ray diffraction
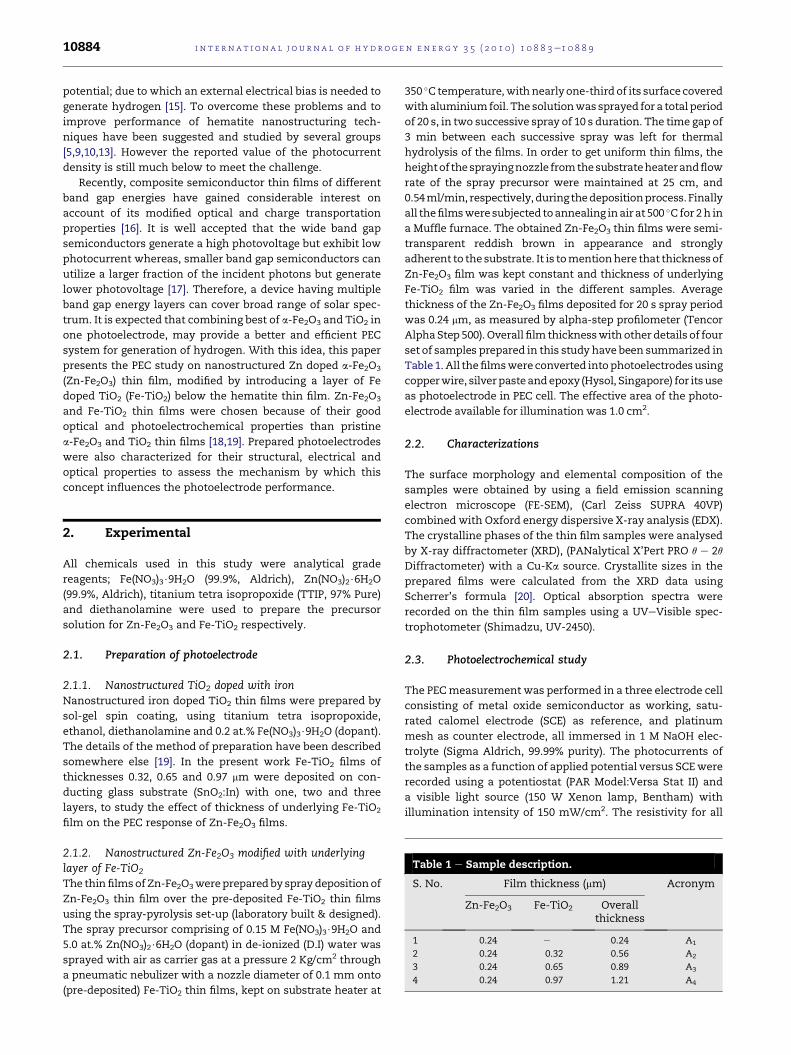
Fig. 1 represents XRD patterns of nanostructured Zn-Fe2O3,
Fe-TiO2 and modified thin films. The Peaks obtained at
2q¼ 24.02, 33.22, 42.9, 49.54, 56.0 and 57.8� are due to reflection
from the planes (012), (104), (202), (024), (211) and (018) of
hematite, respectively, indicating the existence of hematite
phase with rhombohedral structure. The peaks observed at
Fig. 1 e XRD pattern of various thin films prepared
(*corresponds to peaks of underlying SnO2:In coating of
substrate).
2q ¼ 25.3 and 48.0� are due to reflection from the planes (101)
and (200), respectively of the anatase phase of TiO2 with the
tetragonal structure. Additional weak peaks in the XRD
pattern of Zn-Fe2O3 thin film modified by Fe-TiO2 at 2q ¼ 28.6,
42.08, 59.28, 43.9 and 52.92� indicated the formation of some
mixed oxides, Ti9Fe3(Ti7Fe3)O3, FeTi2O5 and Ti4Fe2O0.4.
The formation of mixed phase could be explained by the
fact that during sintering, Fe3þ ions of Zn-Fe2O3 present at the
interface, diffused into the underlying Fe-TiO2 layer producing
a substitutional solid solution. In fact, as the radius of the two
ions Fe3þ (0.55 A) and Ti4þ (0.60 A) is approximately same [21],
the substitution of iron in the matrix of TiO2 is a favourable
process [22]. The average particle size of the a-Fe2O3 as
calculated from the XRD data using Debye Scherrer’s formula
was observed to increase from 25 nm for Zn-Fe2O3 to 37 nm for
modified Zn-Fe2O3 thin film.
3.2. UVeVisible absorption spectrum
Fig. 2 shows the UVeVisible absorption spectrum for all the
samples. An increase in the absorbance of Zn-Fe2O3 thin film
with increasing thickness of underlying Fe-TiO2 layer was
observed. It can be seen that underlying layer of Fe-TiO2
improved the visible light absorption of Zn-Fe2O3 thin films.
Marginal blue shift in the absorption edge of Zn-Fe2O3 from
593 nm to 585 nm was observed for Zn-Fe2O3 thin film modi-
fied by Fe-TiO2. This increase in the absorbance and blue shift
in absorption edge may be attributed to the formation of new
mixed phases at the interface.
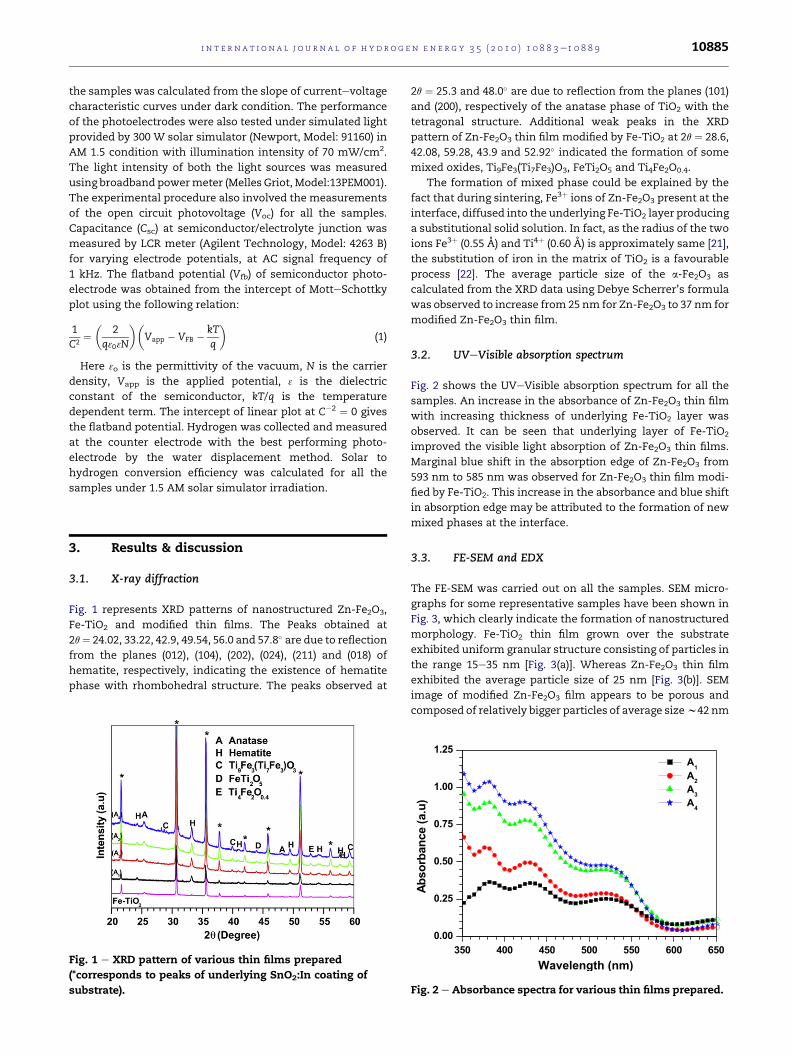
3.3. FE-SEM and EDX
The FE-SEM was carried out on all the samples. SEM micro-
graphs for some representative samples have been shown in
Fig. 3, which clearly indicate the formation of nanostructured
morphology. Fe-TiO2 thin film grown over the substrate
exhibited uniform granular structure consisting of particles in
the range 15e35 nm [Fig. 3(a)]. Whereas Zn-Fe2O3 thin film
exhibited the average particle size of 25 nm [Fig. 3(b)]. SEM
image of modified Zn-Fe2O3 film appears to be porous and
composed of relatively bigger particles of average sizew42 nm
35 0 40 0 45 0 50 0 55 0 6 0 0 65 0
0.00
0.25
0.50
0.75
1.00
1.25
)
u
.
a
(
e
c
n
a
b
r
o
s
b
A
Wavelength (nm)
A 1
A 2
A 3
A 4
Fig. 2 e Absorbance spectra for various thin films prepared.
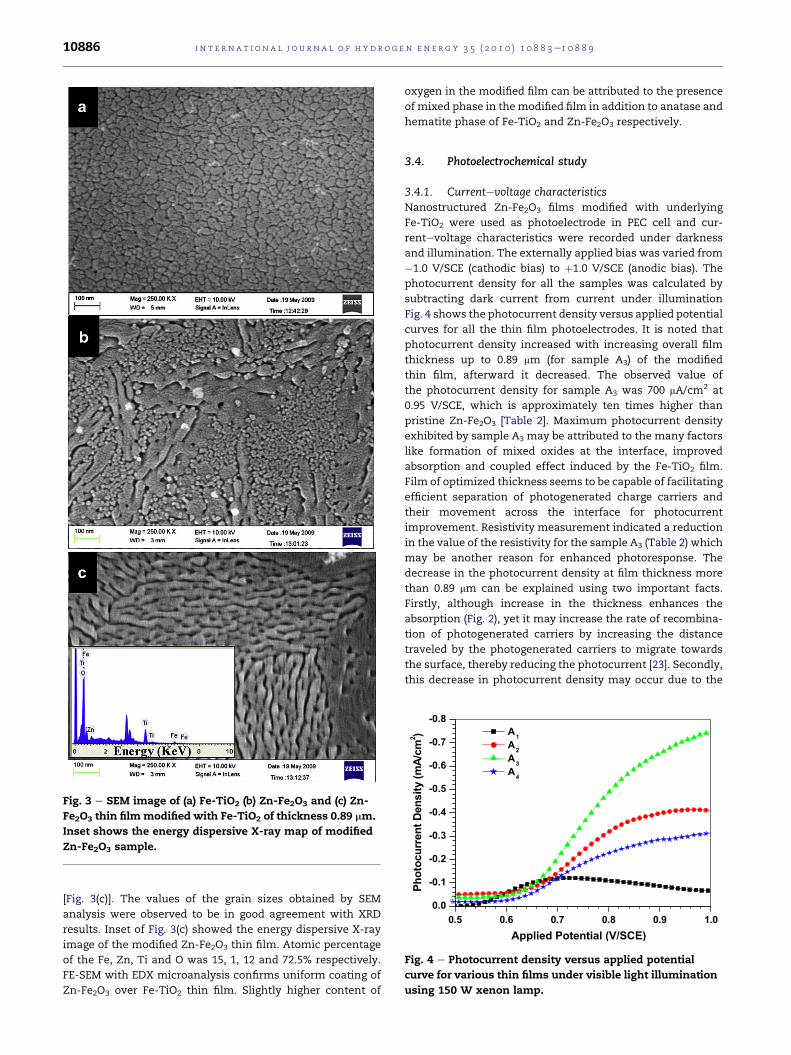
Fig. 3 e SEM image of (a) Fe-TiO2 (b) Zn-Fe2O3 and (c) Zn-
Fe2O3 thin filmmodified with Fe-TiO2 of thickness 0.89 mm.
Inset shows the energy dispersive X-ray map of modified
Zn-Fe2O3 sample.
0 . 5 0 . 6 0 . 7 0 . 8 0 . 9 1 . 0
0.0
-0.1
-0.2
-0.3
-0.4
-0.5
-0.6
-0.7
-0.8
A 1
A 2
A 3
A 4
m
c
/
A
m
(
y
t
i
s
n
e
D
t
n
e
r
r
u
c
o
t
o
h
P
2 )
Applied Potential (V/SCE)
Fig. 4 e Photocurrent density versus applied potential
curve for various thin films under visible light illumination
using 150 W xenon lamp.
i n t e rn a t i o n a l j o u r n a l o f h y d r o g e n en e r g y 3 5 ( 2 0 1 0 ) 1 0 8 8 3e1 0 8 8 910886
[Fig. 3(c)]. The values of the grain sizes obtained by SEM
analysis were observed to be in good agreement with XRD
results. Inset of Fig. 3(c) showed the energy dispersive X-ray
image of the modified Zn-Fe2O3 thin film. Atomic percentage
of the Fe, Zn, Ti and O was 15, 1, 12 and 72.5% respectively.
FE-SEM with EDX microanalysis confirms uniform coating of
Zn-Fe2O3 over Fe-TiO2 thin film. Slightly higher content of
oxygen in the modified film can be attributed to the presence
of mixed phase in themodified film in addition to anatase and
hematite phase of Fe-TiO2 and Zn-Fe2O3 respectively.
3.4. Photoelectrochemical study
3.4.1. Currentevoltage characteristicsNanostructured Zn-Fe2O3 films modified with underlying
Fe-TiO2 were used as photoelectrode in PEC cell and cur-
rentevoltage characteristics were recorded under darkness
and illumination. The externally applied bias was varied from
�1.0 V/SCE (cathodic bias) to þ1.0 V/SCE (anodic bias). The
photocurrent density for all the samples was calculated by
subtracting dark current from current under illumination
Fig. 4 shows the photocurrent density versus applied potential
curves for all the thin film photoelectrodes. It is noted that
photocurrent density increased with increasing overall film
thickness up to 0.89 mm (for sample A3) of the modified
thin film, afterward it decreased. The observed value of
the photocurrent density for sample A3 was 700 mA/cm2 at
0.95 V/SCE, which is approximately ten times higher than
pristine Zn-Fe2O3 [Table 2]. Maximum photocurrent density
exhibited by sample A3 may be attributed to the many factors
like formation of mixed oxides at the interface, improved
absorption and coupled effect induced by the Fe-TiO2 film.
Film of optimized thickness seems to be capable of facilitating
efficient separation of photogenerated charge carriers and
their movement across the interface for photocurrent
improvement. Resistivity measurement indicated a reduction
in the value of the resistivity for the sample A3 (Table 2) which
may be another reason for enhanced photoresponse. The
decrease in the photocurrent density at film thickness more
than 0.89 mm can be explained using two important facts.
Firstly, although increase in the thickness enhances the
absorption (Fig. 2), yet it may increase the rate of recombina-
tion of photogenerated carriers by increasing the distance
traveled by the photogenerated carriers to migrate towards
the surface, thereby reducing the photocurrent [23]. Secondly,
this decrease in photocurrent density may occur due to the
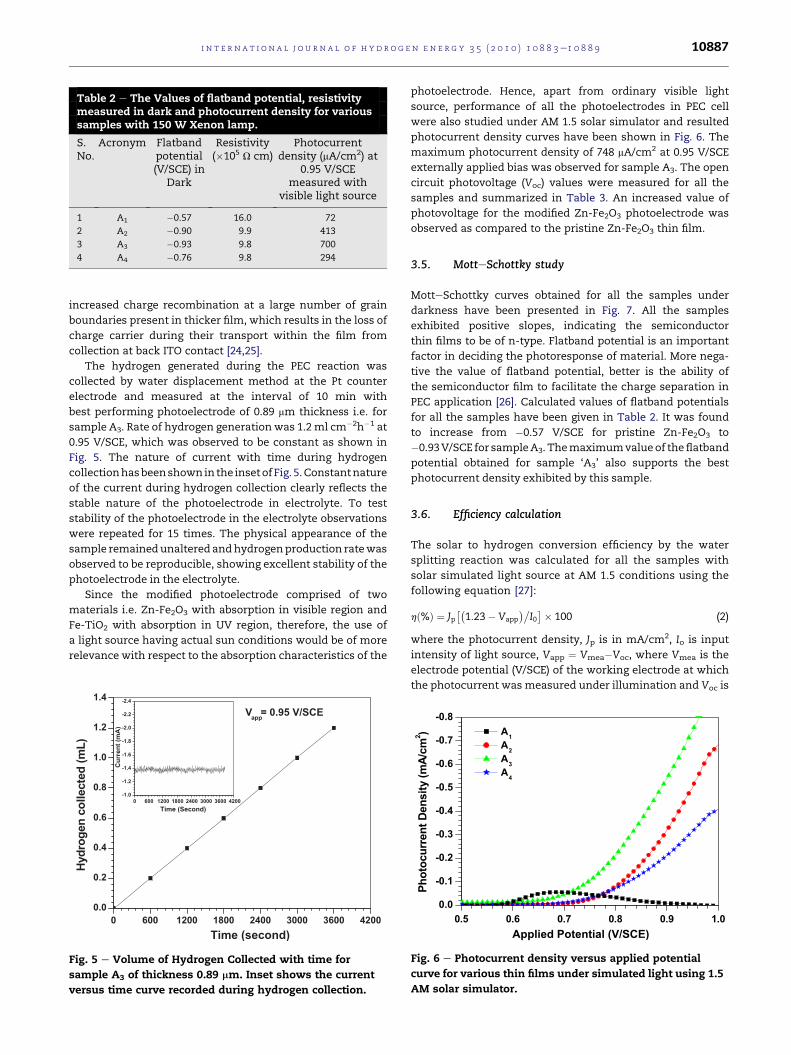
Table 2 e The Values of flatband potential, resistivitymeasured in dark and photocurrent density for varioussamples with 150 W Xenon lamp.
S.No.
Acronym Flatbandpotential(V/SCE) in
Dark
Resistivity(�105 U cm)
Photocurrentdensity (mA/cm2) at
0.95 V/SCEmeasured with
visible light source
1 A1 �0.57 16.0 72
2 A2 �0.90 9.9 413
3 A3 �0.93 9.8 700
4 A4 �0.76 9.8 294
i n t e r n a t i o n a l j o u r n a l o f h y d r o g e n en e r g y 3 5 ( 2 0 1 0 ) 1 0 8 8 3e1 0 8 8 9 10887
increased charge recombination at a large number of grain
boundaries present in thicker film, which results in the loss of
charge carrier during their transport within the film from
collection at back ITO contact [24,25].
The hydrogen generated during the PEC reaction was
collected by water displacement method at the Pt counter
electrode and measured at the interval of 10 min with
best performing photoelectrode of 0.89 mm thickness i.e. for
sample A3. Rate of hydrogen generationwas 1.2ml cm�2h�1 at
0.95 V/SCE, which was observed to be constant as shown in
Fig. 5. The nature of current with time during hydrogen
collectionhasbeenshownin the insetofFig. 5.Constantnature
of the current during hydrogen collection clearly reflects the
stable nature of the photoelectrode in electrolyte. To test
stability of the photoelectrode in the electrolyte observations
were repeated for 15 times. The physical appearance of the
sample remainedunaltered andhydrogenproduction ratewas
observed to be reproducible, showing excellent stability of the
photoelectrode in the electrolyte.
Since the modified photoelectrode comprised of two
materials i.e. Zn-Fe2O3 with absorption in visible region and
Fe-TiO2 with absorption in UV region, therefore, the use of
a light source having actual sun conditions would be of more
relevance with respect to the absorption characteristics of the
0 600 1200 1800 2400 3000 3600 4200
0 600 1200 1800 2400 3000 3600 4200
0.0
0.2
0.4
0.6
0.8
1.0
1.2
1.4
-1.0
-1.2
-1.4
-1.6
-1.8
-2.0
-2.2
-2.4
Cu
rren
t (m
A)
Time (Second)
)
L
m
(
d
e
t
c
e
l
l
o
c
n
e
g
o
r
d
y
H
Time (second)
V app
= 0.95 V/SCE
Fig. 5 e Volume of Hydrogen Collected with time for
sample A3 of thickness 0.89 mm. Inset shows the current
versus time curve recorded during hydrogen collection.
photoelectrode. Hence, apart from ordinary visible light
source, performance of all the photoelectrodes in PEC cell
were also studied under AM 1.5 solar simulator and resulted
photocurrent density curves have been shown in Fig. 6. The
maximum photocurrent density of 748 mA/cm2 at 0.95 V/SCE
externally applied bias was observed for sample A3. The open
circuit photovoltage (Voc) values were measured for all the
samples and summarized in Table 3. An increased value of
photovoltage for the modified Zn-Fe2O3 photoelectrode was
observed as compared to the pristine Zn-Fe2O3 thin film.
3.5. MotteSchottky study
MotteSchottky curves obtained for all the samples under
darkness have been presented in Fig. 7. All the samples
exhibited positive slopes, indicating the semiconductor
thin films to be of n-type. Flatband potential is an important
factor in deciding the photoresponse of material. More nega-
tive the value of flatband potential, better is the ability of
the semiconductor film to facilitate the charge separation in
PEC application [26]. Calculated values of flatband potentials
for all the samples have been given in Table 2. It was found
to increase from �0.57 V/SCE for pristine Zn-Fe2O3 to
�0.93V/SCE for sampleA3. Themaximumvalueof theflatband
potential obtained for sample ‘A3’ also supports the best
photocurrent density exhibited by this sample.
3.6. Efficiency calculation
The solar to hydrogen conversion efficiency by the water
splitting reaction was calculated for all the samples with
solar simulated light source at AM 1.5 conditions using the
following equation [27]:
hð%Þ ¼ Jp��1:23� Vapp
��I0�� 100 (2)
where the photocurrent density, Jp is in mA/cm2, Io is input
intensity of light source, Vapp ¼ Vmea�Voc, where Vmea is the
electrode potential (V/SCE) of the working electrode at which
the photocurrent was measured under illumination and Voc is
0 . 5 0 . 6 0 . 7 0 . 8 0 . 9 1 . 0
0.0
-0.1
-0.2
-0.3
-0.4
-0.5
-0.6
-0.7
-0.8
m
c
/
A
m
(
y
t
i
s
n
e
D
t
n
e
r
r
u
c
o
t
o
h
P
2 )
Applied Potential (V/SCE)
A 1
A 2
A 3
A 4
Fig. 6 e Photocurrent density versus applied potential
curve for various thin films under simulated light using 1.5
AM solar simulator.
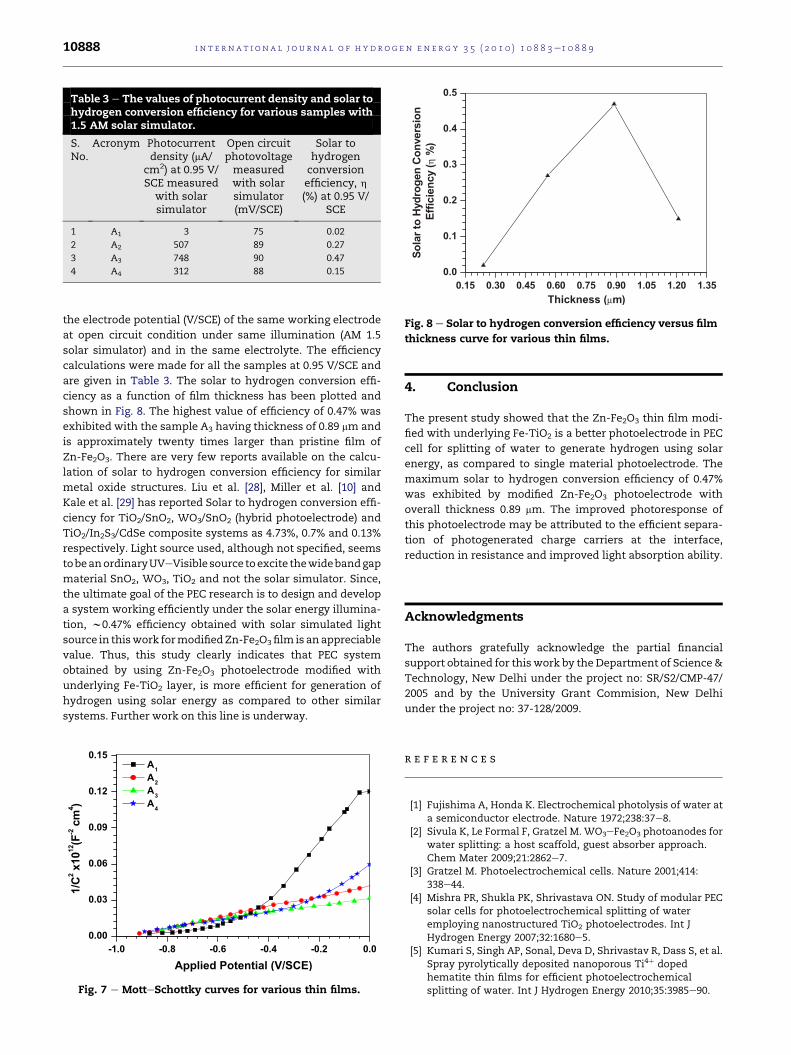
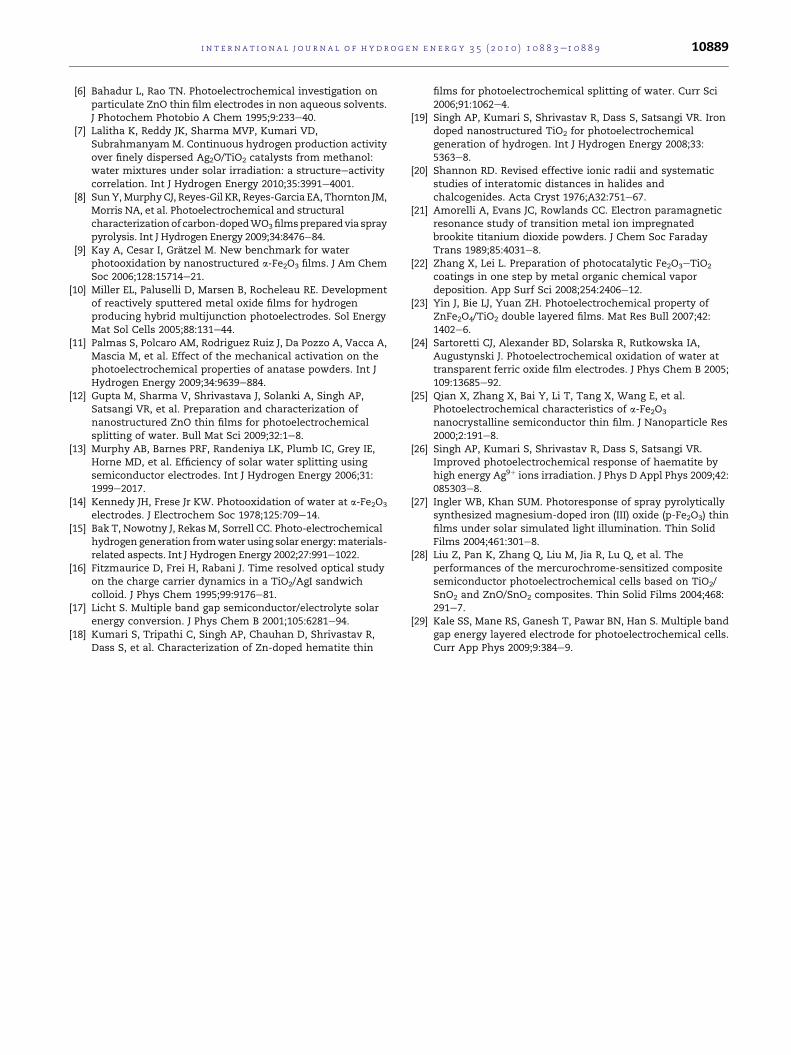
Table 3 e The values of photocurrent density and solar tohydrogen conversion efficiency for various samples with1.5 AM solar simulator.
S.No.
Acronym Photocurrentdensity (mA/
cm2) at 0.95 V/SCE measured
with solarsimulator
Open circuitphotovoltagemeasuredwith solarsimulator(mV/SCE)
Solar tohydrogenconversionefficiency, h(%) at 0.95 V/
SCE
1 A1 3 75 0.02
2 A2 507 89 0.27
3 A3 748 90 0.47
4 A4 312 88 0.15
0 . 1 5 0 . 3 0 0 . 4 5 0 . 6 0 0 . 7 5 0 . 9 0 1 . 0 5 1 . 2 0 1 . 3 5
0.0
0.1
0.2
0.3
0.4
0.5
n
o
i
s
r
e
v
n
o
C
n
e
g
o
r
d
y
H
o
t
r
a
l
o
S
(
y
c
n
e
i
c
i
f
f
E
)
%
Thickness ( m )
Fig. 8 e Solar to hydrogen conversion efficiency versus film
thickness curve for various thin films.
i n t e rn a t i o n a l j o u r n a l o f h y d r o g e n en e r g y 3 5 ( 2 0 1 0 ) 1 0 8 8 3e1 0 8 8 910888
the electrode potential (V/SCE) of the same working electrode
at open circuit condition under same illumination (AM 1.5
solar simulator) and in the same electrolyte. The efficiency
calculations were made for all the samples at 0.95 V/SCE and
are given in Table 3. The solar to hydrogen conversion effi-
ciency as a function of film thickness has been plotted and
shown in Fig. 8. The highest value of efficiency of 0.47% was
exhibited with the sample A3 having thickness of 0.89 mm and
is approximately twenty times larger than pristine film of
Zn-Fe2O3. There are very few reports available on the calcu-
lation of solar to hydrogen conversion efficiency for similar
metal oxide structures. Liu et al. [28], Miller et al. [10] and
Kale et al. [29] has reported Solar to hydrogen conversion effi-
ciency for TiO2/SnO2, WO3/SnO2 (hybrid photoelectrode) and
TiO2/In2S3/CdSe composite systems as 4.73%, 0.7% and 0.13%
respectively. Light source used, although not specified, seems
tobeanordinaryUVeVisiblesource toexcite thewidebandgap
material SnO2, WO3, TiO2 and not the solar simulator. Since,
the ultimate goal of the PEC research is to design and develop
a system working efficiently under the solar energy illumina-
tion, w0.47% efficiency obtained with solar simulated light
source in thiswork formodifiedZn-Fe2O3film is anappreciable
value. Thus, this study clearly indicates that PEC system
obtained by using Zn-Fe2O3 photoelectrode modified with
underlying Fe-TiO2 layer, is more efficient for generation of
hydrogen using solar energy as compared to other similar
systems. Further work on this line is underway.
-1.0 -0.8 -0.6 -0.4 -0.2 0.0
0.00
0.03
0.06
0.09
0.12
0.15
Applied Potential (V/SCE)
C
/
1
2
0
1
x
2
1
F
(
2
-
m
c
4 )
A 1
A 2
A 3
A 4
Fig. 7 e MotteSchottky curves for various thin films.
4. Conclusion
The present study showed that the Zn-Fe2O3 thin film modi-
fied with underlying Fe-TiO2 is a better photoelectrode in PEC
cell for splitting of water to generate hydrogen using solar
energy, as compared to single material photoelectrode. The
maximum solar to hydrogen conversion efficiency of 0.47%
was exhibited by modified Zn-Fe2O3 photoelectrode with
overall thickness 0.89 mm. The improved photoresponse of
this photoelectrode may be attributed to the efficient separa-
tion of photogenerated charge carriers at the interface,
reduction in resistance and improved light absorption ability.
Acknowledgments
The authors gratefully acknowledge the partial financial
support obtained for thiswork by the Department of Science&
Technology, New Delhi under the project no: SR/S2/CMP-47/
2005 and by the University Grant Commision, New Delhi
under the project no: 37-128/2009.
r e f e r e n c e s
[1] Fujishima A, Honda K. Electrochemical photolysis of water ata semiconductor electrode. Nature 1972;238:37e8.
[2] Sivula K, Le Formal F, Gratzel M. WO3eFe2O3 photoanodes forwater splitting: a host scaffold, guest absorber approach.Chem Mater 2009;21:2862e7.
[3] Gratzel M. Photoelectrochemical cells. Nature 2001;414:338e44.
[4] Mishra PR, Shukla PK, Shrivastava ON. Study of modular PECsolar cells for photoelectrochemical splitting of wateremploying nanostructured TiO2 photoelectrodes. Int JHydrogen Energy 2007;32:1680e5.
[5] Kumari S, Singh AP, Sonal, Deva D, Shrivastav R, Dass S, et al.Spray pyrolytically deposited nanoporous Ti4þ dopedhematite thin films for efficient photoelectrochemicalsplitting of water. Int J Hydrogen Energy 2010;35:3985e90.
i n t e r n a t i o n a l j o u r n a l o f h y d r o g e n en e r g y 3 5 ( 2 0 1 0 ) 1 0 8 8 3e1 0 8 8 9 10889
[6] Bahadur L, Rao TN. Photoelectrochemical investigation onparticulate ZnO thin film electrodes in non aqueous solvents.J Photochem Photobio A Chem 1995;9:233e40.
[7] Lalitha K, Reddy JK, Sharma MVP, Kumari VD,Subrahmanyam M. Continuous hydrogen production activityover finely dispersed Ag2O/TiO2 catalysts from methanol:water mixtures under solar irradiation: a structureeactivitycorrelation. Int J Hydrogen Energy 2010;35:3991e4001.
[8] SunY,MurphyCJ, Reyes-Gil KR, Reyes-Garcia EA, Thornton JM,Morris NA, et al. Photoelectrochemical and structuralcharacterizationof carbon-dopedWO3filmspreparedvia spraypyrolysis. Int J Hydrogen Energy 2009;34:8476e84.
[9] Kay A, Cesar I, Grӓtzel M. New benchmark for waterphotooxidation by nanostructured a-Fe2O3 films. J Am ChemSoc 2006;128:15714e21.
[10] Miller EL, Paluselli D, Marsen B, Rocheleau RE. Developmentof reactively sputtered metal oxide films for hydrogenproducing hybrid multijunction photoelectrodes. Sol EnergyMat Sol Cells 2005;88:131e44.
[11] Palmas S, Polcaro AM, Rodriguez Ruiz J, Da Pozzo A, Vacca A,Mascia M, et al. Effect of the mechanical activation on thephotoelectrochemical properties of anatase powders. Int JHydrogen Energy 2009;34:9639e884.
[12] Gupta M, Sharma V, Shrivastava J, Solanki A, Singh AP,Satsangi VR, et al. Preparation and characterization ofnanostructured ZnO thin films for photoelectrochemicalsplitting of water. Bull Mat Sci 2009;32:1e8.
[13] Murphy AB, Barnes PRF, Randeniya LK, Plumb IC, Grey IE,Horne MD, et al. Efficiency of solar water splitting usingsemiconductor electrodes. Int J Hydrogen Energy 2006;31:1999e2017.
[14] Kennedy JH, Frese Jr KW. Photooxidation of water at a-Fe2O3
electrodes. J Electrochem Soc 1978;125:709e14.[15] Bak T, Nowotny J, Rekas M, Sorrell CC. Photo-electrochemical
hydrogen generation fromwater using solar energy:materials-related aspects. Int J Hydrogen Energy 2002;27:991e1022.
[16] Fitzmaurice D, Frei H, Rabani J. Time resolved optical studyon the charge carrier dynamics in a TiO2/AgI sandwichcolloid. J Phys Chem 1995;99:9176e81.
[17] Licht S. Multiple band gap semiconductor/electrolyte solarenergy conversion. J Phys Chem B 2001;105:6281e94.
[18] Kumari S, Tripathi C, Singh AP, Chauhan D, Shrivastav R,Dass S, et al. Characterization of Zn-doped hematite thin
films for photoelectrochemical splitting of water. Curr Sci2006;91:1062e4.
[19] Singh AP, Kumari S, Shrivastav R, Dass S, Satsangi VR. Irondoped nanostructured TiO2 for photoelectrochemicalgeneration of hydrogen. Int J Hydrogen Energy 2008;33:5363e8.
[20] Shannon RD. Revised effective ionic radii and systematicstudies of interatomic distances in halides andchalcogenides. Acta Cryst 1976;A32:751e67.
[21] Amorelli A, Evans JC, Rowlands CC. Electron paramagneticresonance study of transition metal ion impregnatedbrookite titanium dioxide powders. J Chem Soc FaradayTrans 1989;85:4031e8.
[22] Zhang X, Lei L. Preparation of photocatalytic Fe2O3eTiO2
coatings in one step by metal organic chemical vapordeposition. App Surf Sci 2008;254:2406e12.
[23] Yin J, Bie LJ, Yuan ZH. Photoelectrochemical property ofZnFe2O4/TiO2 double layered films. Mat Res Bull 2007;42:1402e6.
[24] Sartoretti CJ, Alexander BD, Solarska R, Rutkowska IA,Augustynski J. Photoelectrochemical oxidation of water attransparent ferric oxide film electrodes. J Phys Chem B 2005;109:13685e92.
[25] Qian X, Zhang X, Bai Y, Li T, Tang X, Wang E, et al.Photoelectrochemical characteristics of a-Fe2O3
nanocrystalline semiconductor thin film. J Nanoparticle Res2000;2:191e8.
[26] Singh AP, Kumari S, Shrivastav R, Dass S, Satsangi VR.Improved photoelectrochemical response of haematite byhigh energy Ag9þ ions irradiation. J Phys D Appl Phys 2009;42:085303e8.
[27] Ingler WB, Khan SUM. Photoresponse of spray pyrolyticallysynthesized magnesium-doped iron (III) oxide (p-Fe2O3) thinfilms under solar simulated light illumination. Thin SolidFilms 2004;461:301e8.
[28] Liu Z, Pan K, Zhang Q, Liu M, Jia R, Lu Q, et al. Theperformances of the mercurochrome-sensitized compositesemiconductor photoelectrochemical cells based on TiO2/SnO2 and ZnO/SnO2 composites. Thin Solid Films 2004;468:291e7.
[29] Kale SS, Mane RS, Ganesh T, Pawar BN, Han S. Multiple bandgap energy layered electrode for photoelectrochemical cells.Curr App Phys 2009;9:384e9.