Embed Size (px)
Citation preview
Nanostructured Electrochemical Biosensors:
Towards Point of Care Diagnostics
by
Brian Lam
A thesis submitted in conformity with the requirements for the degree of Doctor of Philosophy
Department of Chemistry University of Toronto
© Copyright by Brian Lam 2013
ii
Nanostructured Electrochemical Biosensors: Towards Point of
Care Diagnostics
Brian Lam
Doctor of Philosophy
Department of Chemistry
University of Toronto
2013
Abstract
An important research area in medicine is molecular diagnostics of cancers and infectious
diseases, which can be diagnosed, managed and treated more effectively with genetic
information. We have developed an integrated sample to answer bacterial detection platform
combining a simple, universal bacterial lysis approach and sensitive nanomaterial
electrochemical biosensors. Lysis is rapid and effective at releasing intercellular nucleic acid
targets. The platform was directly challenged with unpurified lysates and successful at
determining the presence of clinically relevant concentrations within 30min from sample to
answer.
Another important aspect of biosensor development is the development of cheap and efficient
methods for manufacturing nanostructured microelectrodes. Previously, we have used costly
silicon wafers for fabrication. Here we explored alternate inexpensive materials for fabrication
including printed circuit boards, plastics and glass. We show that plain borosilicate glass is
effective for templated bottom-up fabrication, with comparable performance to expensive silicon
based nanostructured microelectrodes.

iii
Current state-of-the-art readout of many biomarkers is hampered by serially addressing arrays of
low cost biosensors, without the use of high cost active electronics. Here we have developed a
new concept, solution-based electrochemical circuits, which makes highly multiplexed sensing
feasible on the surface of low-cost, glass chips. This method utilizes the idea that physical
separation of liquid on an insulator can result in electrochemical isolation. Using this we can
reduce the number of outputs to 2√n, where n would be the number of serially connected sensors.
We use urinary tract infections as a model system and prove that we can accurately detect
species and antimicrobial resistance in multiplexed formats at clinically relevant concentrations.

iv
Acknowledgments
First I would like to thank Professor Shana O. Kelley for giving me the opportunity to work in
her group and giving me freedom to pursue new ideas. You have always been encouraging with
invaluable suggestions and compliments, in times where sometimes I fail to see the success of
my work. Also you have shown me what it takes to become an exemplary principle investigator.
I would like to thank Professor Edward H. Sargent for advice and challenging me to be a better
scientist and engineer. You have provided me with countless helpful suggestions and many new
and exciting ideas have arisen from our discussions.
I would like to thank my committee members Professor Gilbert Walker for the invaluable advice
and support you have provided me before and throughout my graduate studies, and Professor
Aaron Wheeler for helpful suggestions and support.
I would like to thank Dr. Jagotamoy Das for important contributions with who I collaborated
closely with on many aspects of this work. I would like to thank Dr. Zhichao Fang, Elizaveta
Vasilyeva, Dr. Leyla Solyemani, Dr. Ludovic Live, Andrew Sage, Richard D. Holmes for their
important contributions to this work.
I would like to thank all past and current members of the Kelley group including, Dr. Mark
Pereira for his suggestions and advice with bacteria, Hooman Zamani for his cheerful advice and
support. I would like to thank Justin Besant, Dr. Reza Mohamadi, Mario Moscovici, Rida
Mourtada, Sean Guo, Alexander Zaragoza, Barbara Alexander, Gabriela Kranac for help and
support in and outside the lab.
I would like to thank my mother Dorothy, sister Karen and father Lawrence for their support love
and support throughout my life and graduate career.
Finally I would like to thank Liza for carrying that centrifuge and educating me that bacteria do
not grow properly in a conical tube. Thank you for your love and support in my life and graduate
studies.

v
Table of Contents
Contents
Acknowledgments .......................................................................................................................... iv
Table of Contents ............................................................................................................................ v
List of Figures .............................................................................................................................. viii
List of Abbreviations ..................................................................................................................... xi
1 Medical Diagnostics – Past, Present and Future ........................................................................ 1
1.1 A Brief History of Medical Diagnosis ................................................................................ 1
1.2 Age of Molecular Diagnostics ............................................................................................ 3
1.3 Medical Diagnosis of Cancers and Infectious Disease ....................................................... 4
1.4 Point-of-Care Biosensor Technology ................................................................................. 5
1.5 Scope of Thesis ................................................................................................................... 6
1.6 References ........................................................................................................................... 8
2 Electrochemical Biosensor Methodology and Background ..................................................... 11
2.1 Electrochemical Biosensors .............................................................................................. 11
2.1.1 Electrochemical Techniques ................................................................................. 12
2.1.2 Glucose Biosensors ............................................................................................... 17
2.1.3 Nanostructured Microelectrode Electrochemical Biosensors ............................... 18
2.2 Platform Development Goals ............................................................................................ 23
2.3 References ......................................................................................................................... 25
3 Polymerase Chain Reaction-Free, Sample-to-Answer Bacterial Detection in 30 Minutes
with Integrated Cell Lysis ........................................................................................................ 29
3.1 Abstract ............................................................................................................................. 29
3.2 Introduction ....................................................................................................................... 30
3.3 Methods and Materials ...................................................................................................... 34

vi
3.4 Results and Discussion ..................................................................................................... 36
3.5 Conclusions ....................................................................................................................... 41
3.6 References ......................................................................................................................... 42
4 Optimized templates for bottom-up growth of high-performance integrated biomolecular
detectors ................................................................................................................................... 46
4.1 Abstract ............................................................................................................................. 46
4.2 Introduction ....................................................................................................................... 47
4.3 Materials and Methods ...................................................................................................... 48
4.4 Results and Discussion ..................................................................................................... 51
4.4.1 Baseline performance of sensors fabricated on silicon ......................................... 51
4.4.2 Testing of printed circuit board as a substrate for sensor deposition .................... 53
4.4.3 Testing of plastic as a substrate for sensor deposition .......................................... 55
4.4.4 Testing of glass as a substrate for sensor deposition ............................................ 57
4.4.5 Validation of clinically-relevant sensitivity and specificity using glass chips ..... 58
4.5 Conclusions ....................................................................................................................... 59
4.6 References ......................................................................................................................... 61
5 Solution-based circuits enable rapid and multiplexed pathogen detection .............................. 64
5.1 Abstract ............................................................................................................................. 64
5.2 Introduction ....................................................................................................................... 65
5.3 Methods and Materials ...................................................................................................... 66
5.4 Results ............................................................................................................................... 70
5.4.1 Overview of approach ........................................................................................... 70
5.4.2 Characterization of the SCC ................................................................................. 73
5.4.3 Detection of urinary tract infection pathogens ...................................................... 75
5.4.4 Multiplexed detection of urinary tract infection pathogens .................................. 78
5.5 Discussion ......................................................................................................................... 80

vii
5.6 References ......................................................................................................................... 82
6 Conclusions and Future Directions .......................................................................................... 86
6.1 Thesis Findings ................................................................................................................. 86
6.2 Future Work ...................................................................................................................... 87
7 Publications and Other Contributions ...................................................................................... 89
8 Supplementary Information ..................................................................................................... 90
8.1 Microchannel Electrical Lysis .......................................................................................... 90
8.1.5 Conclusions ......................................................................................................... 103
8.2 Description of Solution Circuit Chip .............................................................................. 104
8.2.1 Description of SCC platform .............................................................................. 104
8.2.2 Interference evaluation ........................................................................................ 107
8.3 References ....................................................................................................................... 111
`
viii
List of Figures
Figure 1.1 – First Medical X-ray. ................................................................................................... 2
Figure 1.2 – Structure of DNA ....................................................................................................... 3
Figure 2.1 – Three electrode electrochemical cell ........................................................................ 13
Figure 2.2 – Cyclic Voltammetry. ................................................................................................ 14
Figure 2.3 – Differential Pulse Voltammetry. .............................................................................. 15
Figure 2.4 – Chronoamperometry. ................................................................................................ 16
Figure 2.5 – Freestyle glucose meter and sensor strips ................................................................ 18
Figure 2.6 – Nanowire polycarbonate template fabrication. ......................................................... 19
Figure 2.7 - NME fabrication process ........................................................................................... 20
Figure 2.8 – Electrode Morphologies. .......................................................................................... 21
Figure 2.9 - Electrocatalytic nucleic acid assay. ........................................................................... 22
Figure 2.10 – NME sensitivity and specificity. ............................................................................ 23
Figure 3.1 - Bacterial detection sensors. ....................................................................................... 31
Figure 3.2 - Integrated sensing system. ........................................................................................ 33
Figure 3.3 - Characterization of electrically lysed bacterial solutions. ......................................... 37
Figure 3.4 - Direct bacterial detection in unpurified lysates ......................................................... 40
Figure 4.1- Silicon-based NME characterization. ......................................................................... 52
Figure 4.2 - PCB-based NME characterization. ........................................................................... 54
Figure 4.3 - Plastic-supported NME characterization. .................................................................. 56

ix
Figure 4.4 - Glass-supported NME characterization. ................................................................... 57
Figure 4.5 - Glass-based NME assay validation. .......................................................................... 59
Figure 5.1 - The solution circuit chip. ........................................................................................... 71
Figure 5.2 - Electrochemical validation of the SCC. .................................................................... 74
Figure 5.3 - Validation of pathogen and antibiotic-resistance probes. ......................................... 76
Figure 5.4 - Multiplexed pathogen and antibiotic-resistance testing on an SCC. ......................... 79
Figure 8.1 – PDMS microchannel electrical lysis. ....................................................................... 91
Figure 8.2 – Microchannel schematic. .......................................................................................... 92
Figure 8.3 - Experimental lysis setup. .......................................................................................... 93
Figure 8.4 - Electrical lysis of Ecoli and Ssap .............................................................................. 94
Figure 8.5 – Bacterial concentration versus electrical lysis. ......................................................... 95
Figure 8.6 – Flow rate versus electrical lysis ................................................................................ 95
Figure 8.7 – Applied voltage versus electrical lysis ..................................................................... 96
Figure 8.8 – Optical images of lysed versus unlysed bacteria ..................................................... 96
Figure 8.9 – Propidium iodide uptake versus microchannel lysis ............................................... 97
Figure 8.10 – Flow cytometry propidium iodide uptake .............................................................. 98
Figure 8.11 – RT-PCR confirmation of mRNA target release on lysed samples ......................... 99
Figure 8.12 - Experimental workflow electrochemical detection from sample to answer ........... 99
Figure 8.13 - Sensor footprint versus accumulation time ........................................................... 100
Figure 8.14 - Electrochemical detection of bacterial lysates for different size sensors. ............. 101
x
Figure 8.15 – Chronic mylegenous leukemia. ............................................................................ 102
Figure 8.16 - Microchannel lysis of K562 cells .......................................................................... 103
Figure 8.17 – Representation of 5x5 array of an SCC chip ........................................................ 104
Figure 8.18 – Cross section schematic of single NME in SCC chip .......................................... 105
Figure 8.19 – SCC chip connected in traditional electrochemical setup .................................... 105
Figure 8.20 – Physical liquid channel separation orthogonal to common WEs. ........................ 106
Figure 8.21 – Illustration of SCC method ................................................................................... 106
Figure 8.22 – SCC interference from sequential addition of Ru/Ferri ....................................... 107
Figure 8.23 – Hypothesis of interference phenomena in SCC chips………………………….. 108
Figure 8.24 - Interference theory experiment. ............................................................................ 109
Figure 8.25 – Elimination of interference. .................................................................................. 110

xi
List of Abbreviations
CA – Chronoamperometry
CE – Counter electrode
cfu – Colony forming units
CML – Chronic myelogenous leukemia
CV – Cyclic voltammetry
DNA – Deoxyribonucleic acid
DPV – Differential pulse voltammetry
FAD – Flavin group
FEP – Fluorinated ethylene polymer
GOx – Glucose oxidase
IPA – Isopropyl alcohol
MB – Methylene blue
mRNA – Messenger ribonucleic acid
NME – Nanostructured microelectrode
PCB – Printed circuit board
PCR – Polymerase chain reaction
PDMS – polydimethylsiloxane
PI – Propidium iodide
PNA – Peptide nucleic acid
RE – Reference electrode
RNA – Ribonucleic acid
rpoβ – RNA polymerase gene
RT-PCR – Reverse transcriptase polymerase chain reaction
SCC – Solution circuit chip
SEM – Scanning electron microscopy
UTI – Urinary tract infection
WE – Working electrode
β-lac - β-lactamase

1
1 Medical Diagnostics – Past, Present and Future
Medical diagnostic technology development is one of most important fields of applied science
since it directly affects the overall health of the general population. Throughout history,
clinicians and scientists have endeavored to develop more effective technologies to rapid and
accurate diagnosis of medical aliments [1].
1.1 A Brief History of Medical Diagnosis
One of the first instances of medical diagnostic device was the stethoscope, which has become
the most widely used diagnostic device by clinicians to date. Prior to its inception in 1816 by
Rene Theophile-Hyacinthe Laennec, since the age of Hippocrates in 400 BC, clinicians placed
their ears directly onto a patient’s chest to investigate cardiovascular health [2]. Laennec also
used this method until one day while listening to a patient’s chest he recalled that he could hear a
pin scraping at one end of a plank while his ear was placed at the other end. He quickly rolled up
a stack of parchment and placed it to the patient’s chest and was surprised that he could hear the
heart more clearly than if he placed his ear to their chest.
Laennec went about manufacturing the first stethoscope which was essentially a simple wooden
monaural tube and has been developed over the past two centuries into a binaural flexible device
with integrated low pass filtration among other numerous advances. The stethoscope provided
valuable information on the internal workings of the human body while still remaining totally
non-invasive. This was the first instance of non-lethal device for exploring internal anatomy and
has shaped the face of the medical profession. It is responsible for the, discovery of new
diseases, the creation of criteria for accurate and rapid diagnosis and the development of many
new treatments. Also it has become the most recognizable symbol of the medical profession [3]
where patients trust doctors more when they are wearing a stethoscope.
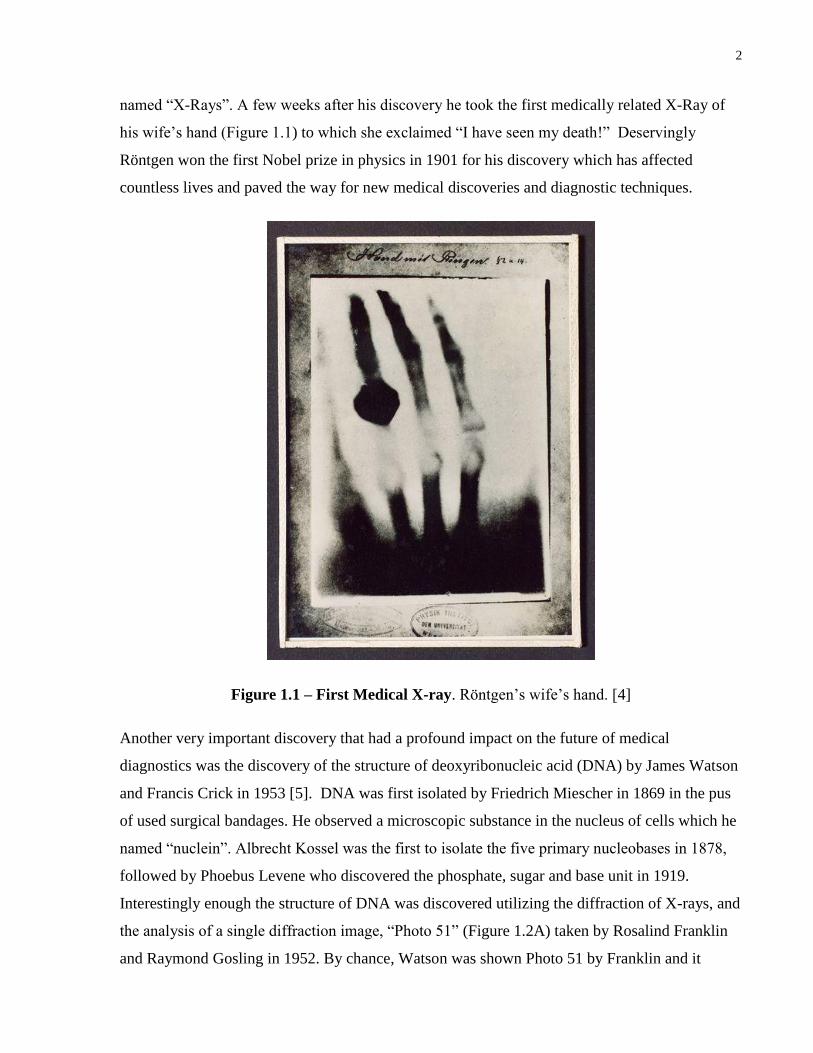
The next most important medical tool was the discovery and use of X-Rays by Wilhelm Conrad
Röntgen in 1895 [4]. Röntgen at the time was testing vacuum tubes, provided by Hertz and Tesla
amongst others, as electrical charges discharged through them. Serendipitously, although the
tube was covered by cardboard, a neighboring barium platinocyanide screen emitted a faint
florescence a few feet away. He surmised that a new type of radiation was responsible, which he
2
named ―X-Rays‖. A few weeks after his discovery he took the first medically related X-Ray of
his wife’s hand (Figure 1.1) to which she exclaimed ―I have seen my death!‖ Deservingly
Röntgen won the first Nobel prize in physics in 1901 for his discovery which has affected
countless lives and paved the way for new medical discoveries and diagnostic techniques.
Figure 1.1 – First Medical X-ray. Röntgen’s wife’s hand. [4]
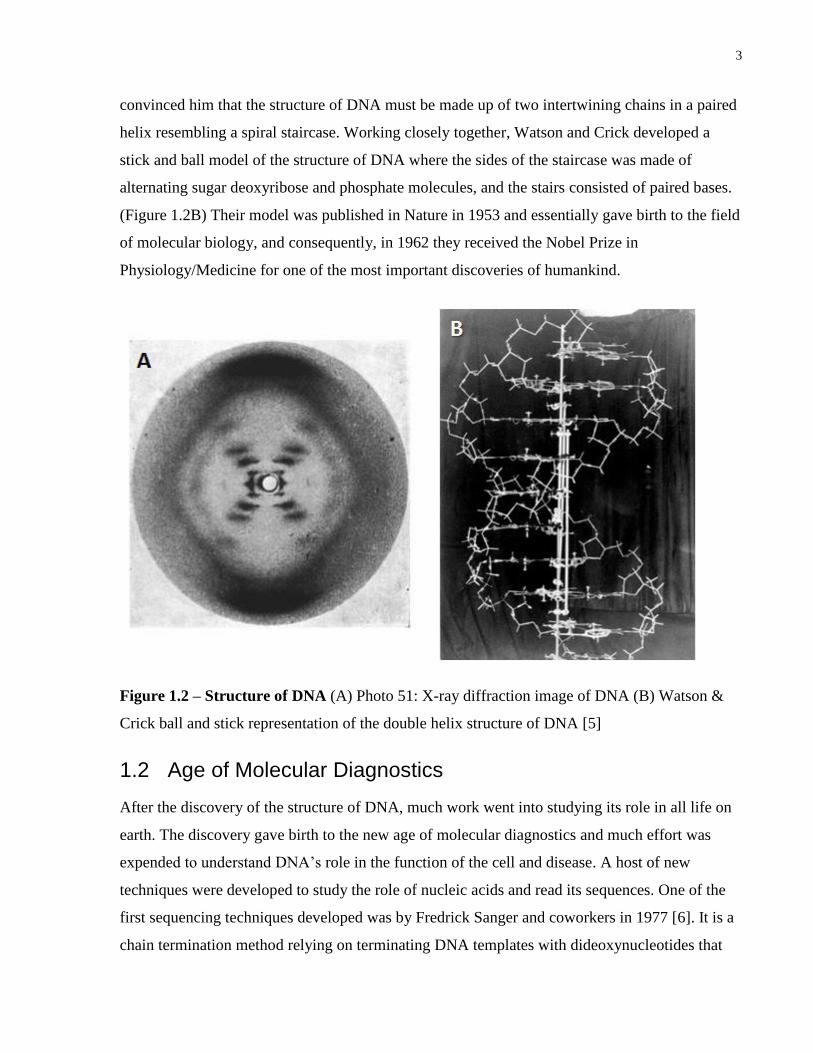
Another very important discovery that had a profound impact on the future of medical
diagnostics was the discovery of the structure of deoxyribonucleic acid (DNA) by James Watson
and Francis Crick in 1953 [5]. DNA was first isolated by Friedrich Miescher in 1869 in the pus
of used surgical bandages. He observed a microscopic substance in the nucleus of cells which he
named ―nuclein‖. Albrecht Kossel was the first to isolate the five primary nucleobases in 1878,
followed by Phoebus Levene who discovered the phosphate, sugar and base unit in 1919.
Interestingly enough the structure of DNA was discovered utilizing the diffraction of X-rays, and
the analysis of a single diffraction image, ―Photo 51‖ (Figure 1.2A) taken by Rosalind Franklin
and Raymond Gosling in 1952. By chance, Watson was shown Photo 51 by Franklin and it
3
convinced him that the structure of DNA must be made up of two intertwining chains in a paired
helix resembling a spiral staircase. Working closely together, Watson and Crick developed a
stick and ball model of the structure of DNA where the sides of the staircase was made of
alternating sugar deoxyribose and phosphate molecules, and the stairs consisted of paired bases.
(Figure 1.2B) Their model was published in Nature in 1953 and essentially gave birth to the field
of molecular biology, and consequently, in 1962 they received the Nobel Prize in
Physiology/Medicine for one of the most important discoveries of humankind.
Figure 1.2 – Structure of DNA (A) Photo 51: X-ray diffraction image of DNA (B) Watson &
Crick ball and stick representation of the double helix structure of DNA [5]
1.2 Age of Molecular Diagnostics
After the discovery of the structure of DNA, much work went into studying its role in all life on
earth. The discovery gave birth to the new age of molecular diagnostics and much effort was
expended to understand DNA’s role in the function of the cell and disease. A host of new
techniques were developed to study the role of nucleic acids and read its sequences. One of the
first sequencing techniques developed was by Fredrick Sanger and coworkers in 1977 [6]. It is a
chain termination method relying on terminating DNA templates with dideoxynucleotides that

4
are fluorescently or radioactively labeled followed by size separation with electrophoresis to read
sequences in order. Following the Sanger method, one of the most important techniques
developed was polymerase chain reaction (PCR), which was developed by Kary Mullins in 1983
[7]. PCR relies on heat cycling to denature double stranded DNA, followed by primers which
specify a region of amplification for a heat stable DNA polymerase which enzymatically
assembles DNA from the base nucleotides. Heat cycling exponentially multiples the amplified
region designated by the primers. Many current nucleic acid diagnostic methods rely on PCR to
essentially amplify trace amounts of nucleic acids present for analysis.
1.3 Medical Diagnosis of Cancers and Infectious Disease
Efficient and rapid genetic analysis of diseases is an important goal, since it can be used to
provide more accurate diagnosis and effective treatment then traditional techniques [8]. Cancer
has become prominent emerging disease over the past half century and is one of the top causes of
death in the world [9]. Cancer is a broad class of various diseases with one commonality,
unregulated growth of cells causing malignant tumors that assail other parts of the body causing
them to malfunction and eventually fail [10]. Another commonality is the fact that growth of
cells is regulated by genes, and mutations in these genes cause malignant growth.
Traditional methods for diagnosis of cancer are from symptoms and/or through screening
techniques followed by a biopsy sample analyzed by a pathologist and other medical tests such
as X-rays, CT scans, endoscopies and blood tests [11]. Cancers are generally classified by the
type of cell the tumor resembles. However, diagnosis is generally made only when the tumor is
large enough to cause symptoms or be seen with radiological techniques. Early detection of
cancers would be of great benefit to the patient, however current screening methods are not
sensitive or efficient enough for early detection of cancers [12]. Also genetic level analysis of
cancers would provide valuable information on the prognosis and effective treatments for
cancers [12], however they are not widely used. Hence there is a need for sensitive, rapid and
inexpensive molecular diagnostic methods for use in early detection and disease state monitoring
of cancer at the genetic level [13].
Infectious diseases are an important area for development of an efficient and rapid molecular
diagnostic test. During 2011-2012 approximately 32 million people died due to infectious
diseases [14] excluding HIV/AIDS related deaths, which is roughly ~0.5% of the world

5
population or approximately 1 in 200 individuals. Infectious diseases can be caused by many
organisms, including viruses, parasites and pathogenic bacteria. The most common diagnostic for
infectious disease is a traditional symptomatic approach, however many infectious diseases share
common symptoms. For infections caused by pathogenic bacteria a symptomatic approach will
not provide any information on antimicrobial resistance in the initial assessment of the patient.
This hampers effective treatment and amplifies the emerging problem of antibiotic resistance in
pathogenic bacteria due to misuse of antibiotics [15].
Another common diagnostic tool is phenotypic testing [16] which is based on microbial culture,
and utilizes a growth media to amplify and visualize the presence of an infectious disease.
However, this method is not applicable to all infectious diseases, because not all pathogens can
be cultured. Phenotypic testing can be used to determine speciation of pathogenic bacteria since
colonies grown can posses different visual characteristics, however this is not a concrete method.
Also it can be used to determine antibiotic susceptibility, where various antibiotics are inserted
into the growth media, and susceptibility is determined by local growth.
Phenotypic testing can take long periods of time, anywhere from a day to a month for certain
pathogenic bacteria, which limits the effectiveness of phenotypic testing as a diagnostic tool.
Clinicians must provide effective treatment at the point of care within a rapid time frame. With
current clinical methods they must make an educated guess, based upon a symptomatic approach
without evidence of antimicrobial resistance or susceptibility. This leads to ineffective and/or
inaccurate treatments being prescribed for infectious diseases, and the misuse of antibiotics
contributing to the increasing antibiotic resistance of infectious diseases [15]. In theory, all
infectious disease could be diagnosed by molecular diagnostic methods, however this is not the
case since current molecular diagnostic methods are time consuming, require trained technicians
and are expensive. Due to the varied nature of infectious diseases a point of care diagnostic test
that can rapidly and inexpensively determine speciation and antibiotic resistance from numerous
candidates will be a valuable asset in stemming infectious disease related deaths [17].
1.4 Point-of-Care Biosensor Technology
Biosensors are a relatively new class of medical diagnostic tool. Biosensors are essentially made
up of three main components, first is a biological sample; which can include cell cultures, human
(blood, urine, saliva and tissue), animal, food and environmental samples. Second, is the

6
transduction of a specific recognition element of target analyte within the sample of interest. The
transducer method is based on optical, mass or electrochemical measurements. Third, is a
readout method for the transduced signal which can either be optical and/or electronic [18]. Point
of care biosensors have additional required criteria, including ease of use, rapid sample to answer
timeframes and low cost.
The main advantage of point of care optical based biosensors is the direct visual interpretation of
results. However optical methods can suffer from the following drawbacks poor sensitivity, need
for optically transparent samples/materials and expensive auxiliary equipment. . Examples of
notable commercially available optically based point of care biosensors are simple lateral flow
assays such as point of care pregnancy tests [20].
The main advantages of point of care electrochemical based biosensors are high levels of
sensitivity, low cost instrumentation and ease of miniaturization. Some disadvantages of
electrochemical based biosensors are requirement of additional instrumentation for readout,
results of readout are not as easily interpreted and methods are not as well characterized or as
developed as with optical systems. The most notable commercially available electrochemical
biosensors are point of care glucose sensors [21]. Major issues for future development of point of
care biosensors which will need to address speed, ease of use, cost, and multiplexing.
1.5 Scope of Thesis
The scope of this work is to develop new and exciting methods for application to point of care
diagnostics. First, sample handling of biological samples in infectious disease and cancer is
important. We utilize electrical lysis in microfludic chambers and lyse mammalian [22] and
bacterial cells [23] and detect the presence of nucleic acids electrochemically. Our goal in
chapter 3 was to develop new simplified parallel-plate lysis chambers that can operate at lower
voltages, and directly integrate them to our nanostructured microelectrode (NME) platform. With
this new platform, we perform polymerase chain reaction (PCR) free electrochemical detection
of raw bacterial lysates in buffer and urine [24].
In chapter 4 our goal was to investigate new low cost materials which are comparable to silicon
for fabrication of NMEs. High material cost of silicon can be prohibitive to point of care
diagnostic devices. We investigated several materials as alternative inexpensive substrates for
7
growth of NMEs for use in point of care electrochemical biosensors. We evaluated printed
circuit boards (PCB), plastics and glass. With PCBs we found copper problematic as a base
metal for growth of NME structures, since it would spontaneously etch when exposed to our
traditional plating solutions. We were able to resolve these material issues, however we could not
obtain comparable sensitivity to silicon counterparts. Plastics did not have base metal issues,
however we found that plastics were too flexible to obtain reasonable lithographic resolution.
This resulted in poor sensitivity compared to silicon based NMEs. Glass proved to be rigid
enough for good lithographic resolution and had comparable sensitivity to silicon based sensors
[25].
In chapter 5 our goal was to develop a new technique for inexpensive and efficient multiplexing
that does not rely on resource heavy active electronics. A current goal for electrochemical
biosensors is the ever increasing multiplexing of multiple targets. Serial connections are the most
obvious method to increase multiplexing, however electrical output connections become ever
increasingly difficult to perform, since n sensors requires n individual output connections.
Parallel connections are more efficient reducing the minimum number of output connections to
2√n. However, traditional methods require active switching electronics on the surface of the
sensor chip which drastically increases cost and complexity of the device. We developed a new
solution based method that takes advantage of physical separation of liquid on the surface of
electrochemical biosensors to create equivalent parallel connections to active electronic methods,
which we call solution based electrochemical circuits (SCC). We show effective isolation of
sensors connected in parallel and show that they are equivalent to serially connected sensors. In
addition we accurately detected the species and antibiotic resistance of pathogenic bacteria in
multiplexed bacterial lysates [26]. `

8
1.6 References
1. Berger, B. D. A brief history of medical diagnosis and the birth of the clinical laboratory.
Medical Laboratory Observer (1999).
2. Blaufox, M. D. An ear to the chest: An illustrated history of the evolution of the stethoscope.
149p (Parthenon Pub. Group: London: 2002).
3. Rehman, S. U., Nietert, P. J., Cope, D. W. & Kilpatrick, A. O. What to wear today? Effect of
doctor’s attire on the trust and confidence of patients. The American Journal of Medicine
118, 1279–86 (2005).
4. Röntgen, W. On a new kind of rays. Science 3, 227–231 (1896).
5. Watson, J. D. & Crick, F. H. C. Molecular Structure of Nucleic Acids. Nature 171, 737–738
(1953).
6. Sanger, F., Nicklen, S. & Coulson, A. R. DNA sequencing with chain-terminating.
Proceedings of the National Acadamey of Sciences 74, 5463–5467 (1977).
7. Saiki, R. K., Scharf, S., Faloona, F., Mullis, K. B., Horn, G. T., Erlich, H. A., & Arnheim, N.
Enzymatic amplification of beta-globin genomic sequences and restriction site analysis for
diagnosis of sickle cell anemia. Science 230, 1350–1354 (1985).
8. Grody, W. W. Molecular diagnostics: Techniques and applications for the clinical
laboratory. 484p (Elsevier/Academic Press: 2010).
9. Siegel, R., Naishadham, D. & Jemal, A. Cancer Statistics , 2012. CA: A Cancer Journal for
Clinicians 62, 10–29 (2012).
10. Weinberg, R. A. The Biology of Cancer. (Garland Science: New York, 2007).
11. Nakamura, R. M. Cancer Diagnostics: Current and Future Trends. (Humana Press: Totowa,
N.J, 2004).
12.Jorde, L. B., Carey, J.C., M. J. B. Medical Genetics. (Mosby/Elsevier: Philadelphia, 2010).
9
13. Offit, K. Personalized medicine: new genomics, old lessons. Human genetics 130, 3–14
(2011).
14. World Health Organization. World Health Statistics 2013. (2013).
15. Levy, S. B. & Marshall, B. Antibacterial resistance worldwide: causes, challenges and
responses. Nature Medicine 10, S122–S129 (2004).
16. Bochner, B. R. Global phenotypic characterization of bacteria. FEMS Microbiology reviews
33, 191–205 (2009).
17. Niemz, A., Ferguson, T. M. & Boyle, D. S. Point-of-care nucleic acid testing for infectious
diseases. Trends in biotechnology 29, 240–50 (2011).
18. Jonathan M. Cooper, A. E. G. C. Biosensors : a practical approach. 251p (Oxford University
Press: New York, 2004).
19. Issadore, D. I. & Westervielt, R.M. Point-of-care diagnostics on a chip. (Springer: New
York, 2013).
20. Williams, L. Home and Point-of-Care Pregnancy Tests : A Review of the Technology.
Epidemiology 13, 14–18 (2013).
21. Newman, J. D. & Turner, A. P. F. Home blood glucose biosensors: a commercial
perspective. Biosensors & bioelectronics 20, 2435–53 (2005).
22. Vasilyeva, E., Lam, B., Fang, Z., Minden, M. D., Sargent, E. H., & Kelley, S. O. Direct
genetic analysis of ten cancer cells: tuning sensor structure and molecular probe design for
efficient mRNA capture. Angewandte Chemie (International ed. in English) 50, 4137–41
(2011).
23. Soleymani, L., Fang, Z., Lam, B., Bin, X., Vasilyeva, E., Ross, A. J., Sargent, E. H., &
Kelley, S. O. Hierarchical nanotextured microelectrodes overcome the molecular transport
barrier to achieve rapid, direct bacterial detection. ACS nano 5, 3360–6 (2011).
10
24. Lam, B., Fang, Z., Sargent, E. H. & Kelley, S. O. Polymerase Chain Reaction-Free, Sample-
to-Answer Bacterial Detection in 30 Minutes with Integrated Cell Lysis. Analytical
Chemistry 84, 21-25 (2012).
25. Lam, B., Holmes, R. D., Das, J., Poudineh, M., Sargent, E. H., & Kelley, S. O. Optimized
Templates for Bottom-Up Growth of High-Performance Integrated Biomolecular
Detectors. Lab on a Chip 13, 2569-75 (2013)
26. Lam, B., Das, J., Holmes, R. D., Live, L., Sage, A., Sargent, E. H., & Kelley, S. O. Solution-
based circuits enable rapid and multiplexed pathogen detection. Nature Communications
4, 1–8 (2013).

11
2 Electrochemical Biosensor Methodology and Background
Various types of biosensors are currently being developed and many are commercially
available. Generally there are only two readout methods employed, optical or electrical.
Biosensor developments contained herein are electrochemical based and therefore a brief
overview of electrochemical techniques [1] and electrochemical biosensors follows.
2.1 Electrochemical Biosensors
The field of electrochemistry was born in 1791 by Luigi Galvani when he established a
connection between chemical reactions and electricity with his famous frog leg experiment.
Galvani was a biologist and was one day performing an experiment on frog legs, and accidently
touched an exposed nerve with a statically charged metal scalpel. He observed electrical
discharges along with a kicking motion of the frog legs and realized there was a connection
between electricity and life [2]. Sparked by Galvani’s discoveries Alessandro Volta in 1800
invented the voltaic pile, the first electrical battery, one of the most important inventions in
electrochemistry. One of the first electrochemical sensing methods measured pH utilizing a glass
electrode which was developed in the early 1900s. The first commercial pH meter was developed
by Arnold Beckman in 1936. This was followed by the development of the first electrochemical
biosensor in 1962 by Leland Clark with the first glucose oxidase enzyme electrode [3]. The first
commercial glucose meters were available by the 1970s and have become the gold standard of
the biosensor field [4].
These developments have made electrochemical biosensors one of the most important fields in
applied science. The main advantages of electrochemical biosensors are ease of miniaturization,
low cost instrumentation, robustness, good detection limits, small sample volumes, and ability to
work in turbid optically absorbing samples. The potential low cost of electrochemical biosensors
combined with ease of miniaturization is the definitive advantage when used for point of care
biosensors. The main drawbacks are direct visual observation of detection is usually not possible
and multiplexing is less viable compared to optical methods [5].
Electrochemical based biosensors are invaluable medical diagnostic tools and are a capable
method for detection of medically related analytes [6]. Many electrochemical biosensor
12
techniques have been developed to detect nucleic acids [7-12], proteins [13-16], and small
molecules [17-19]. Studies have shown that electrochemical methods are robust and can
accurately detect biomarkers in complex unpurified heterogeneous biological samples [18].
Electrochemical biosensors have been applied to many cancer [13, 20, 21] and infectious disease
[22-24] biomarkers which have illustrated the utility of electrochemical biosensors for future
medical diagnostic applications. Electrochemical techniques are the foundation of
electrochemical biosensors [1], and a short review of common electrochemical techniques
follows.
2.1.1 Electrochemical Techniques
Electrochemical biosensors can be classified into three main types; potentiometric, impedimetric
and amperometric. Potentiometric devices measure the charge/potential collected at a given
sensor surface with respect to a reference when no current flows and provides information on ion
activity. Impedimetric devices measure impedance change; generally change of resistance or
capacitance, at the sensor surface. All devices developed in this work are amperometric which
measure current generated at the sensor surface, usually in response to an applied potential. In
general most amperometric electrochemical biosensors are three electrode systems comprised of
a working (WE), auxiliary/counter (CE) and reference electrode (RE) (Figure 2.1). The WE can
be considered the most important electrode because electrochemical reactions of interest occur
on the surface. In terms of electrochemical biosensing these reactions can be the direct
reduction/oxidation of a biological analyte of interest or indicative of a biomolecular recognition
event such as the complementary binding of DNA or antibody/antigen binding events. The WE
is fragile, since in many applications the surface is coated with a sensitive biological probe or
enzyme which can be easily fouled or stripped if handled incorrectly.
13
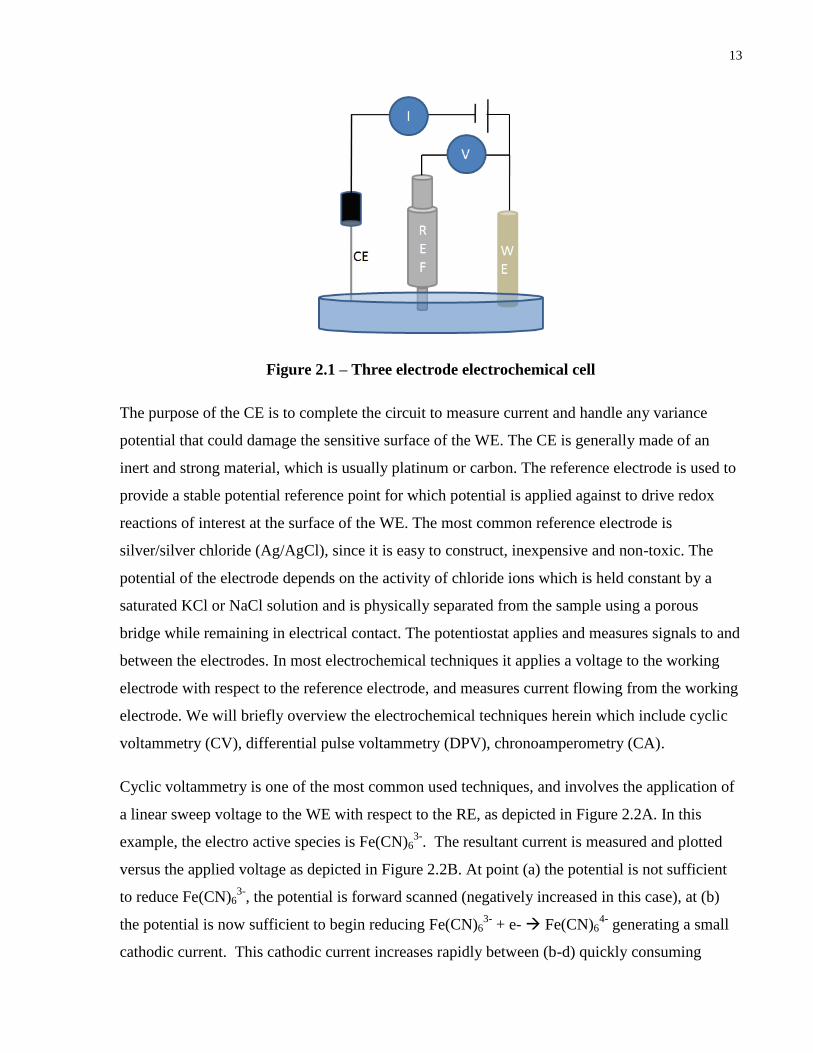
Figure 2.1 – Three electrode electrochemical cell
The purpose of the CE is to complete the circuit to measure current and handle any variance
potential that could damage the sensitive surface of the WE. The CE is generally made of an
inert and strong material, which is usually platinum or carbon. The reference electrode is used to
provide a stable potential reference point for which potential is applied against to drive redox
reactions of interest at the surface of the WE. The most common reference electrode is
silver/silver chloride (Ag/AgCl), since it is easy to construct, inexpensive and non-toxic. The
potential of the electrode depends on the activity of chloride ions which is held constant by a
saturated KCl or NaCl solution and is physically separated from the sample using a porous
bridge while remaining in electrical contact. The potentiostat applies and measures signals to and
between the electrodes. In most electrochemical techniques it applies a voltage to the working
electrode with respect to the reference electrode, and measures current flowing from the working
electrode. We will briefly overview the electrochemical techniques herein which include cyclic
voltammetry (CV), differential pulse voltammetry (DPV), chronoamperometry (CA).
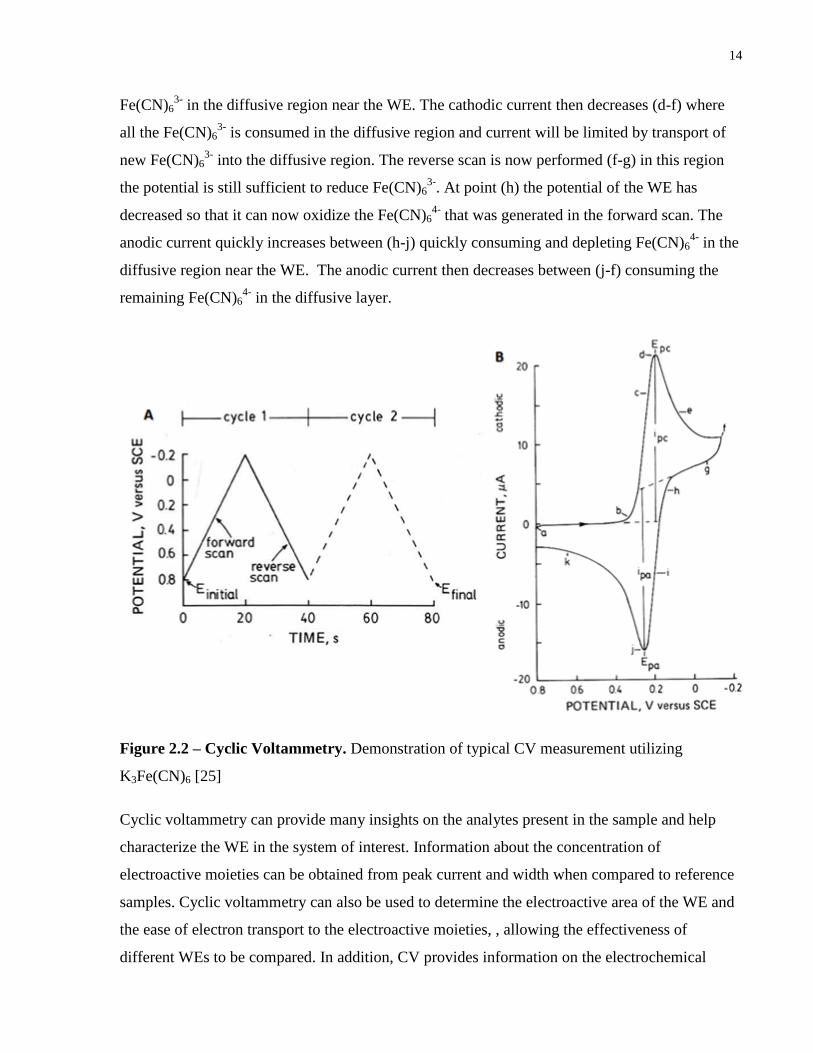
Cyclic voltammetry is one of the most common used techniques, and involves the application of
a linear sweep voltage to the WE with respect to the RE, as depicted in Figure 2.2A. In this
example, the electro active species is Fe(CN)63-
. The resultant current is measured and plotted
versus the applied voltage as depicted in Figure 2.2B. At point (a) the potential is not sufficient
to reduce Fe(CN)63-
, the potential is forward scanned (negatively increased in this case), at (b)
the potential is now sufficient to begin reducing Fe(CN)63-
+ e- Fe(CN)64-
generating a small
cathodic current. This cathodic current increases rapidly between (b-d) quickly consuming
14
Fe(CN)63-
in the diffusive region near the WE. The cathodic current then decreases (d-f) where
all the Fe(CN)63-
is consumed in the diffusive region and current will be limited by transport of
new Fe(CN)63-
into the diffusive region. The reverse scan is now performed (f-g) in this region
the potential is still sufficient to reduce Fe(CN)63-
. At point (h) the potential of the WE has
decreased so that it can now oxidize the Fe(CN)64-
that was generated in the forward scan. The
anodic current quickly increases between (h-j) quickly consuming and depleting Fe(CN)64-
in the
diffusive region near the WE. The anodic current then decreases between (j-f) consuming the
remaining Fe(CN)64-
in the diffusive layer.
Figure 2.2 – Cyclic Voltammetry. Demonstration of typical CV measurement utilizing
K3Fe(CN)6 [25]
Cyclic voltammetry can provide many insights on the analytes present in the sample and help
characterize the WE in the system of interest. Information about the concentration of
electroactive moieties can be obtained from peak current and width when compared to reference
samples. Cyclic voltammetry can also be used to determine the electroactive area of the WE and
the ease of electron transport to the electroactive moieties, , allowing the effectiveness of
different WEs to be compared. In addition, CV provides information on the electrochemical
15
reversibility of the reaction of interest, where irreversibility is easily determined through the
disappearance of the reverse scan peak.
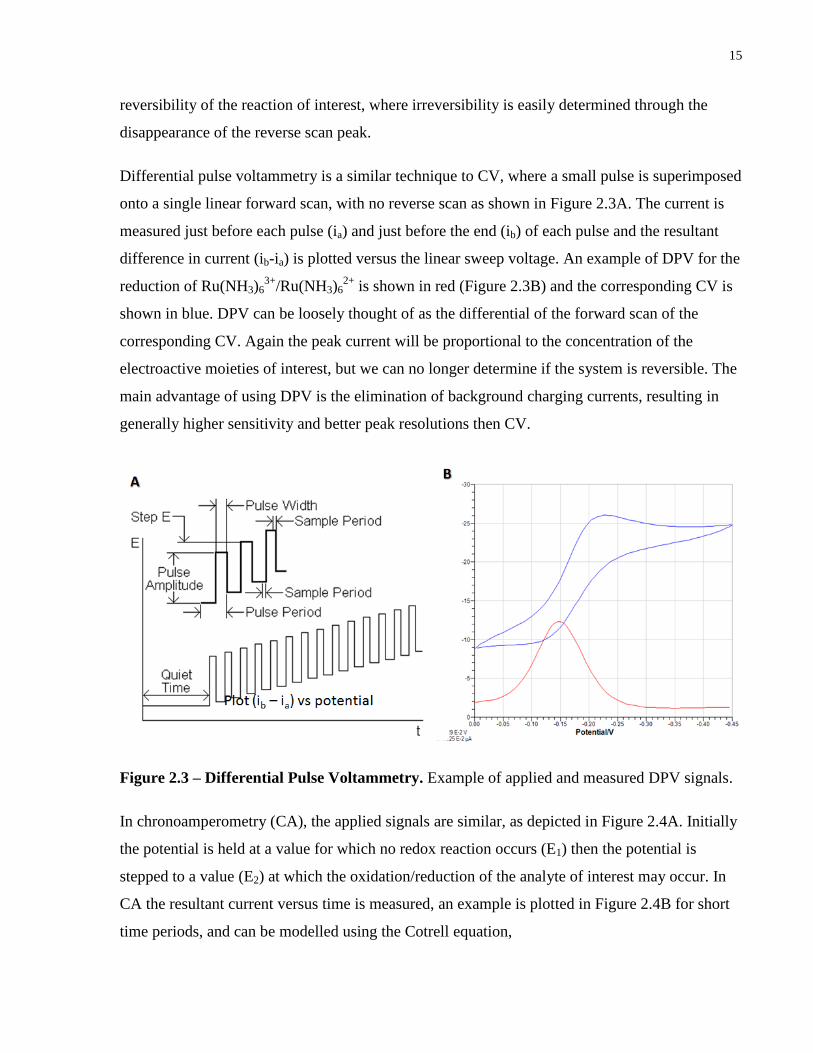
Differential pulse voltammetry is a similar technique to CV, where a small pulse is superimposed
onto a single linear forward scan, with no reverse scan as shown in Figure 2.3A. The current is
measured just before each pulse (ia) and just before the end (ib) of each pulse and the resultant
difference in current (ib-ia) is plotted versus the linear sweep voltage. An example of DPV for the
reduction of Ru(NH3)63+
/Ru(NH3)62+
is shown in red (Figure 2.3B) and the corresponding CV is
shown in blue. DPV can be loosely thought of as the differential of the forward scan of the
corresponding CV. Again the peak current will be proportional to the concentration of the
electroactive moieties of interest, but we can no longer determine if the system is reversible. The
main advantage of using DPV is the elimination of background charging currents, resulting in
generally higher sensitivity and better peak resolutions then CV.
Figure 2.3 – Differential Pulse Voltammetry. Example of applied and measured DPV signals.
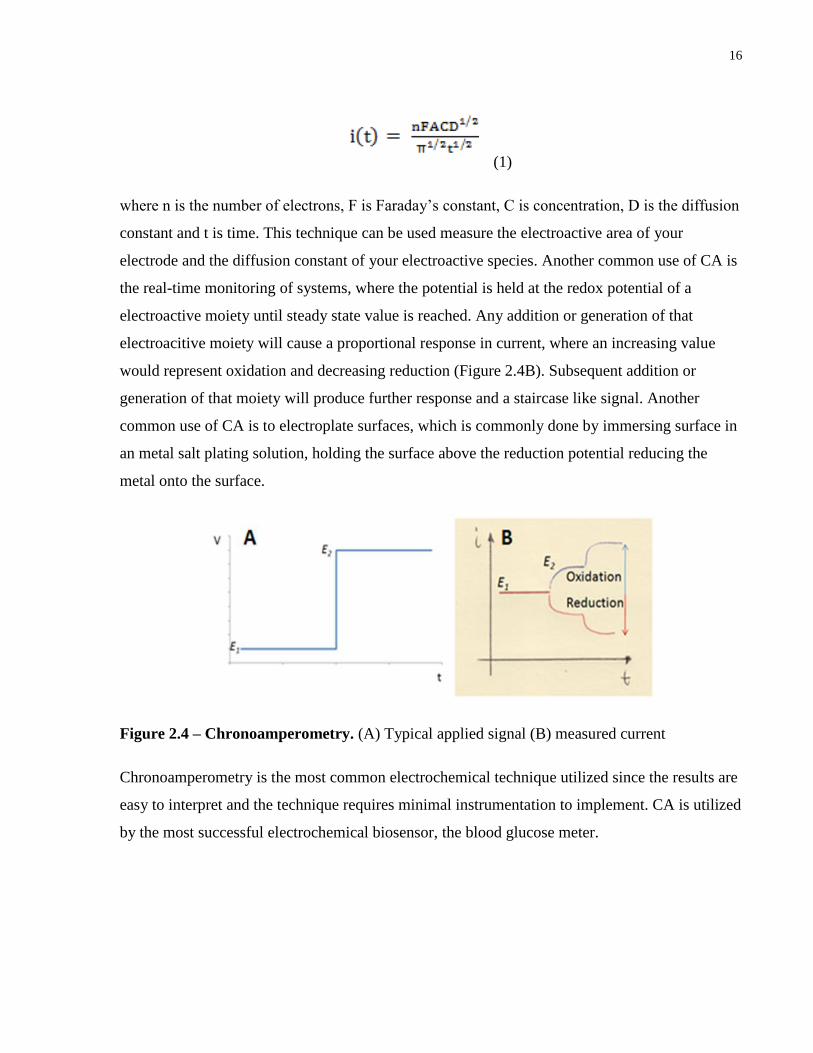
In chronoamperometry (CA), the applied signals are similar, as depicted in Figure 2.4A. Initially
the potential is held at a value for which no redox reaction occurs (E1) then the potential is
stepped to a value (E2) at which the oxidation/reduction of the analyte of interest may occur. In
CA the resultant current versus time is measured, an example is plotted in Figure 2.4B for short
time periods, and can be modelled using the Cotrell equation,
16
(1)
where n is the number of electrons, F is Faraday’s constant, C is concentration, D is the diffusion
constant and t is time. This technique can be used measure the electroactive area of your
electrode and the diffusion constant of your electroactive species. Another common use of CA is
the real-time monitoring of systems, where the potential is held at the redox potential of a
electroactive moiety until steady state value is reached. Any addition or generation of that
electroacitive moiety will cause a proportional response in current, where an increasing value
would represent oxidation and decreasing reduction (Figure 2.4B). Subsequent addition or
generation of that moiety will produce further response and a staircase like signal. Another
common use of CA is to electroplate surfaces, which is commonly done by immersing surface in
an metal salt plating solution, holding the surface above the reduction potential reducing the
metal onto the surface.
Figure 2.4 – Chronoamperometry. (A) Typical applied signal (B) measured current
Chronoamperometry is the most common electrochemical technique utilized since the results are
easy to interpret and the technique requires minimal instrumentation to implement. CA is utilized
by the most successful electrochemical biosensor, the blood glucose meter.

17
2.1.2 Glucose Biosensors
Regardless of many advances in biosensor technologies, glucose biosensors still dominate the
commercial biosensor market, accounting for approximately 85% of an estimated 5 billion dollar
market [4]. One could consider the electrochemical glucose sensor the original biosensor, and it
was first conceived by Clark and Lyons in 1962 [3]. Other technologies to measure glucose were
developed during that time such as the Ames Reflectance Meter invented by Anton Clemens in
1971 [4]. The reflectance meter was not as readily adopted due to the fact that it was large and
heavy ~1kg, expensive and required a prescription. The electrochemical glucose sensor has
dominated the market since they have offered acceptable sensitivity & reproducibility, and can
be manufactured in high volumes at low cost.
The most common enzyme utilized for electrochemical glucose detection is glucose oxidase
(GOx). This enzyme changes the redox state of glucose and produces products that can be
detected electrochemically. The mechanism is generally as follows, (1)
Glucose + O2 gluconic acid + H2O2 (1)
O2 + 4H+ + 4e
- 2H2O (2)
H2O2 O2 + 2H+ + 2e
- (3)
Glucose oxidation is performed by GOx and molecular oxygen producing gluconolactone and
hydrogen peroxide. Originally Clark & Lyons monitored the consumption of O2 over an oxygen
electrode through a dialysis membrane (2), where a negative potential was applied to a platinum
cathode. Further developments relied on the direct oxidation of hydrogen peroxide formation (3).
First generation devices relied on the use of flavin group (FAD) as an oxygen co-substrate,
which is reduced by glucose to FADH2 (4). This is followed by the subsequent oxidation by O2
cycling back to the oxidized form and hydrogen peroxide (5).
GOx(FAD) + glucose GOx(FADH2) + gluconolactone (4)
GOx(FADH2) + O2 GOx(FAD) + H2O2 (5)
18
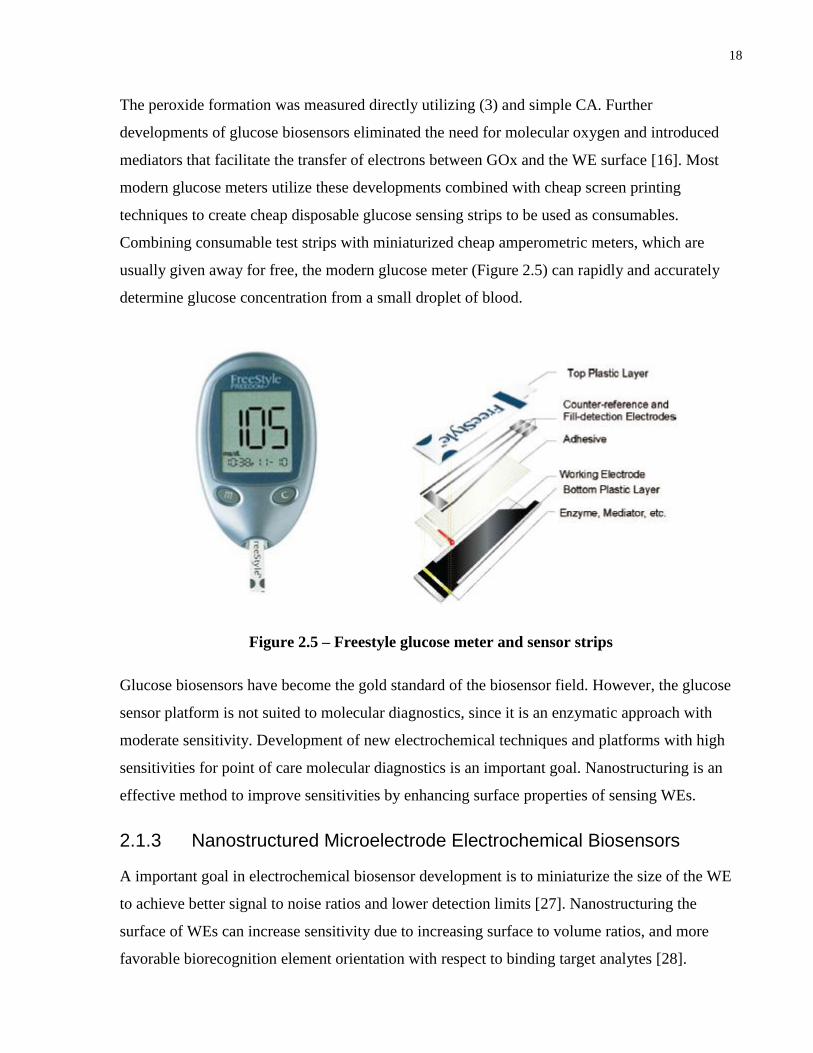
The peroxide formation was measured directly utilizing (3) and simple CA. Further
developments of glucose biosensors eliminated the need for molecular oxygen and introduced
mediators that facilitate the transfer of electrons between GOx and the WE surface [16]. Most
modern glucose meters utilize these developments combined with cheap screen printing
techniques to create cheap disposable glucose sensing strips to be used as consumables.
Combining consumable test strips with miniaturized cheap amperometric meters, which are
usually given away for free, the modern glucose meter (Figure 2.5) can rapidly and accurately
determine glucose concentration from a small droplet of blood.
Figure 2.5 – Freestyle glucose meter and sensor strips
Glucose biosensors have become the gold standard of the biosensor field. However, the glucose
sensor platform is not suited to molecular diagnostics, since it is an enzymatic approach with
moderate sensitivity. Development of new electrochemical techniques and platforms with high
sensitivities for point of care molecular diagnostics is an important goal. Nanostructuring is an
effective method to improve sensitivities by enhancing surface properties of sensing WEs.
2.1.3 Nanostructured Microelectrode Electrochemical Biosensors
A important goal in electrochemical biosensor development is to miniaturize the size of the WE
to achieve better signal to noise ratios and lower detection limits [27]. Nanostructuring the
surface of WEs can increase sensitivity due to increasing surface to volume ratios, and more
favorable biorecognition element orientation with respect to binding target analytes [28].
19
However the extent to which the WE can be miniaturized reaches a limit. If the WE is too small
such that the interactions between the surface of the WE and the desired target analytes are
minimized, at low concentrations detection cannot occur within a reasonable time frame because
of the lack of collisions/interactions with the WE surface.
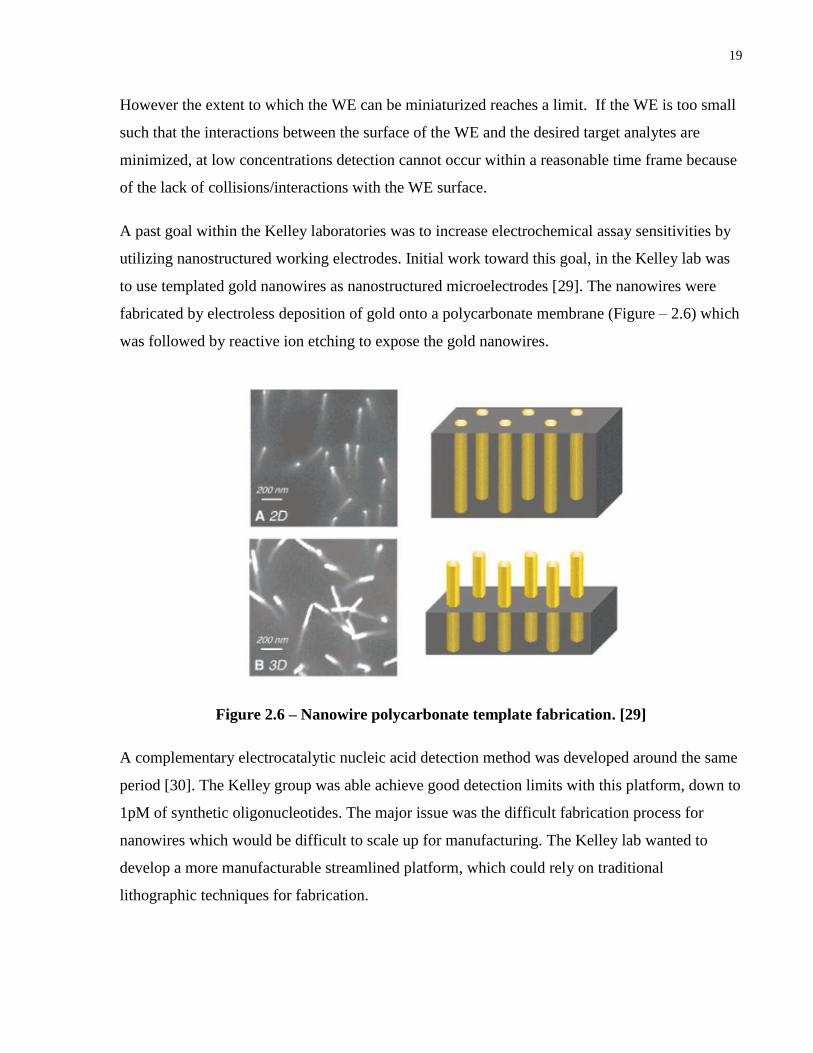
A past goal within the Kelley laboratories was to increase electrochemical assay sensitivities by
utilizing nanostructured working electrodes. Initial work toward this goal, in the Kelley lab was
to use templated gold nanowires as nanostructured microelectrodes [29]. The nanowires were
fabricated by electroless deposition of gold onto a polycarbonate membrane (Figure – 2.6) which
was followed by reactive ion etching to expose the gold nanowires.
Figure 2.6 – Nanowire polycarbonate template fabrication. [29]
A complementary electrocatalytic nucleic acid detection method was developed around the same
period [30]. The Kelley group was able achieve good detection limits with this platform, down to
1pM of synthetic oligonucleotides. The major issue was the difficult fabrication process for
nanowires which would be difficult to scale up for manufacturing. The Kelley lab wanted to
develop a more manufacturable streamlined platform, which could rely on traditional
lithographic techniques for fabrication.
20
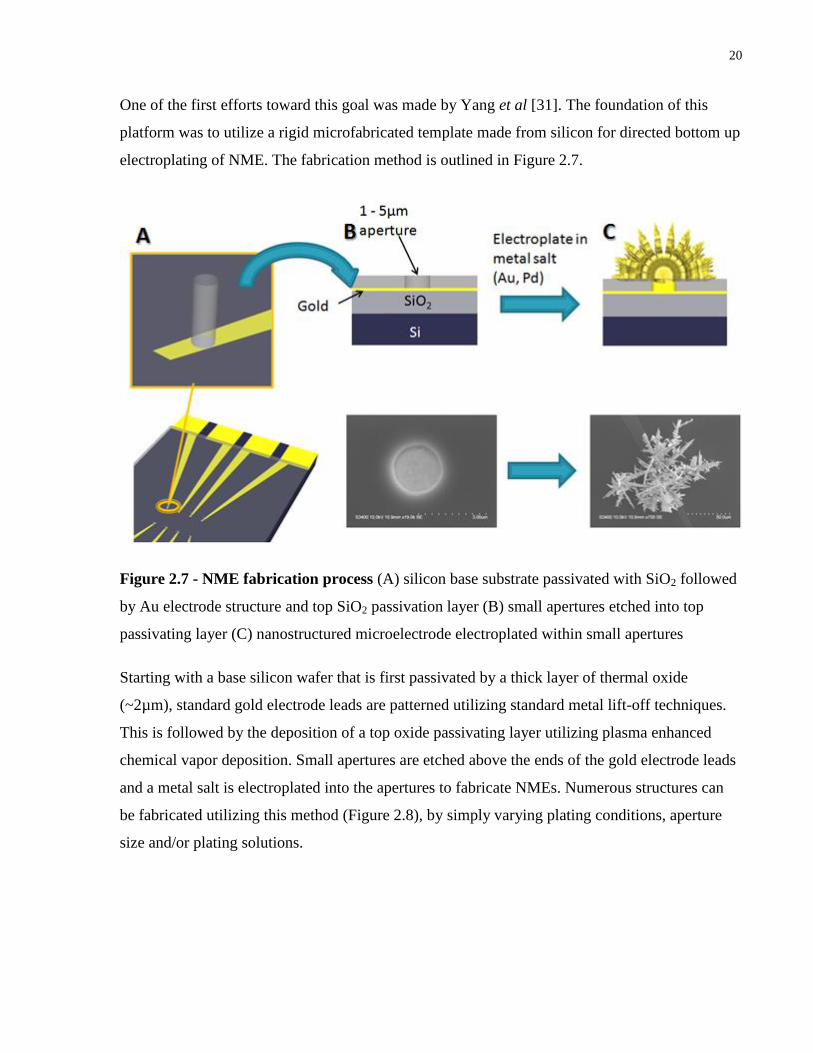
One of the first efforts toward this goal was made by Yang et al [31]. The foundation of this
platform was to utilize a rigid microfabricated template made from silicon for directed bottom up
electroplating of NME. The fabrication method is outlined in Figure 2.7.
Figure 2.7 - NME fabrication process (A) silicon base substrate passivated with SiO2 followed
by Au electrode structure and top SiO2 passivation layer (B) small apertures etched into top
passivating layer (C) nanostructured microelectrode electroplated within small apertures
Starting with a base silicon wafer that is first passivated by a thick layer of thermal oxide
(~2µm), standard gold electrode leads are patterned utilizing standard metal lift-off techniques.
This is followed by the deposition of a top oxide passivating layer utilizing plasma enhanced
chemical vapor deposition. Small apertures are etched above the ends of the gold electrode leads
and a metal salt is electroplated into the apertures to fabricate NMEs. Numerous structures can
be fabricated utilizing this method (Figure 2.8), by simply varying plating conditions, aperture
size and/or plating solutions.
21
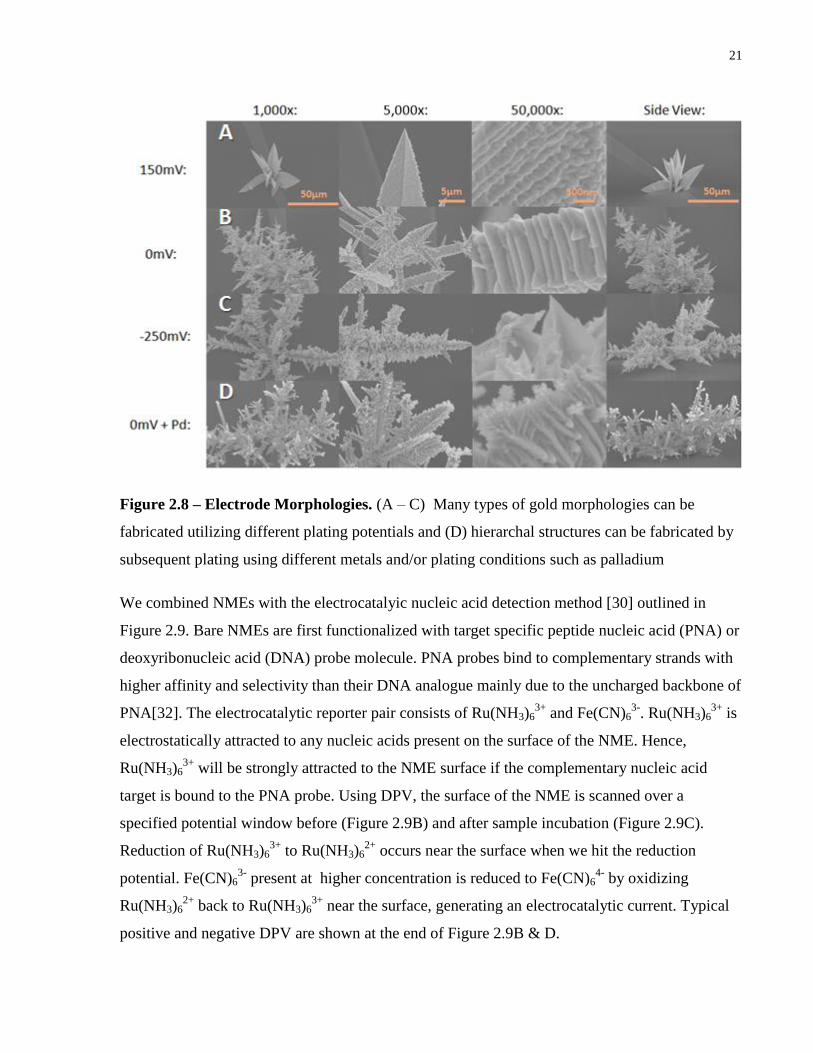
Figure 2.8 – Electrode Morphologies. (A – C) Many types of gold morphologies can be
fabricated utilizing different plating potentials and (D) hierarchal structures can be fabricated by
subsequent plating using different metals and/or plating conditions such as palladium
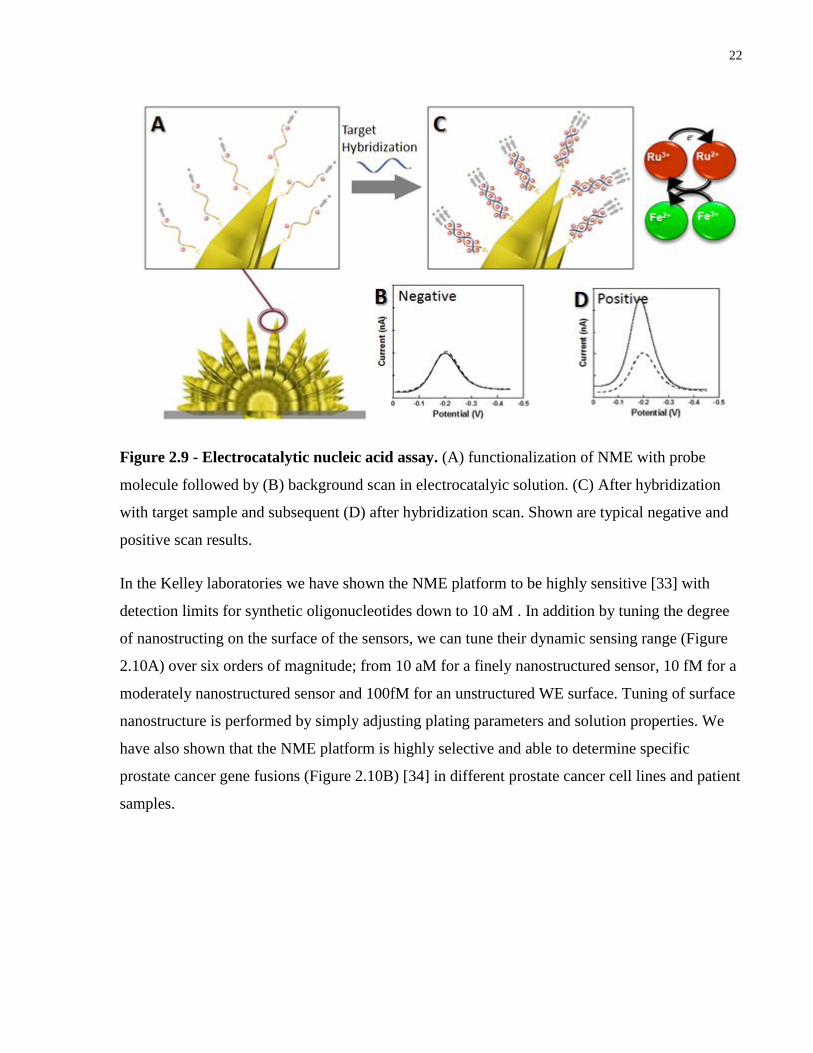
We combined NMEs with the electrocatalyic nucleic acid detection method [30] outlined in
Figure 2.9. Bare NMEs are first functionalized with target specific peptide nucleic acid (PNA) or
deoxyribonucleic acid (DNA) probe molecule. PNA probes bind to complementary strands with
higher affinity and selectivity than their DNA analogue mainly due to the uncharged backbone of
PNA[32]. The electrocatalytic reporter pair consists of Ru(NH3)63+
and Fe(CN)63-
. Ru(NH3)63+
is
electrostatically attracted to any nucleic acids present on the surface of the NME. Hence,
Ru(NH3)63+
will be strongly attracted to the NME surface if the complementary nucleic acid
target is bound to the PNA probe. Using DPV, the surface of the NME is scanned over a
specified potential window before (Figure 2.9B) and after sample incubation (Figure 2.9C).
Reduction of Ru(NH3)63+
to Ru(NH3)62+
occurs near the surface when we hit the reduction
potential. Fe(CN)63-
present at higher concentration is reduced to Fe(CN)64-
by oxidizing
Ru(NH3)62+
back to Ru(NH3)63+
near the surface, generating an electrocatalytic current. Typical
positive and negative DPV are shown at the end of Figure 2.9B & D.
22
Figure 2.9 - Electrocatalytic nucleic acid assay. (A) functionalization of NME with probe
molecule followed by (B) background scan in electrocatalyic solution. (C) After hybridization
with target sample and subsequent (D) after hybridization scan. Shown are typical negative and
positive scan results.
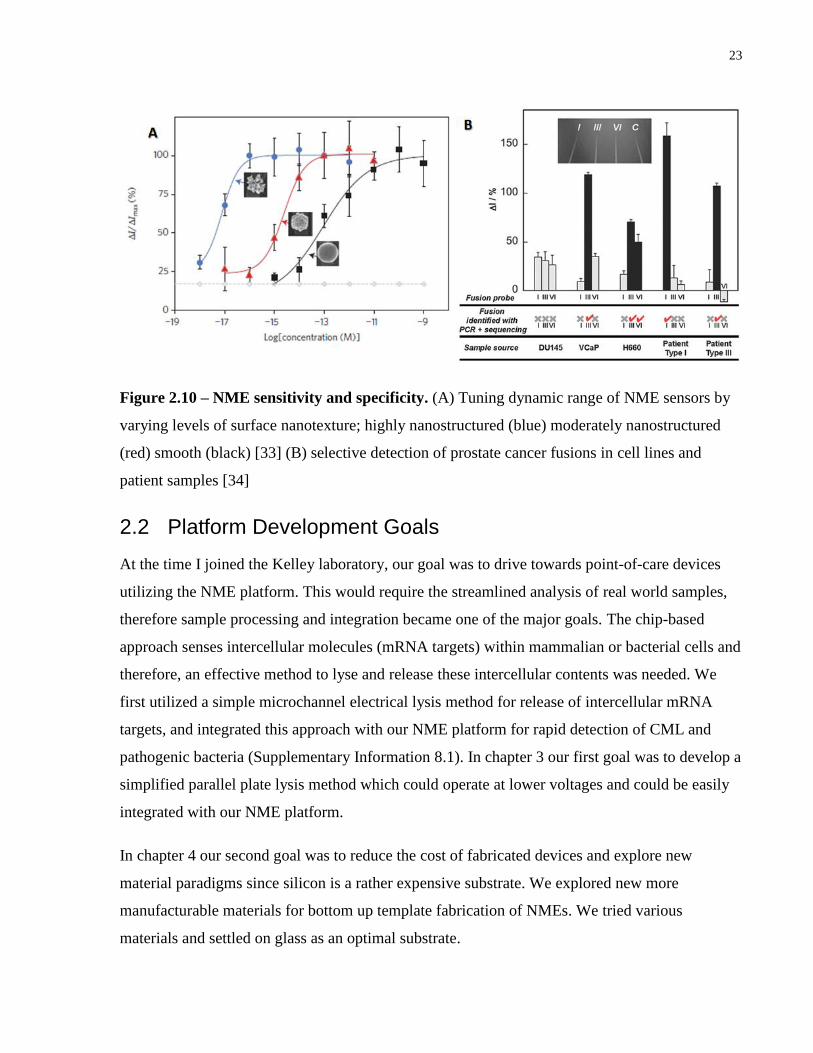
In the Kelley laboratories we have shown the NME platform to be highly sensitive [33] with
detection limits for synthetic oligonucleotides down to 10 aM . In addition by tuning the degree
of nanostructing on the surface of the sensors, we can tune their dynamic sensing range (Figure
2.10A) over six orders of magnitude; from 10 aM for a finely nanostructured sensor, 10 fM for a
moderately nanostructured sensor and 100fM for an unstructured WE surface. Tuning of surface
nanostructure is performed by simply adjusting plating parameters and solution properties. We
have also shown that the NME platform is highly selective and able to determine specific
prostate cancer gene fusions (Figure 2.10B) [34] in different prostate cancer cell lines and patient
samples.
23
Figure 2.10 – NME sensitivity and specificity. (A) Tuning dynamic range of NME sensors by
varying levels of surface nanotexture; highly nanostructured (blue) moderately nanostructured
(red) smooth (black) [33] (B) selective detection of prostate cancer fusions in cell lines and
patient samples [34]
2.2 Platform Development Goals
At the time I joined the Kelley laboratory, our goal was to drive towards point-of-care devices
utilizing the NME platform. This would require the streamlined analysis of real world samples,
therefore sample processing and integration became one of the major goals. The chip-based
approach senses intercellular molecules (mRNA targets) within mammalian or bacterial cells and
therefore, an effective method to lyse and release these intercellular contents was needed. We
first utilized a simple microchannel electrical lysis method for release of intercellular mRNA
targets, and integrated this approach with our NME platform for rapid detection of CML and
pathogenic bacteria (Supplementary Information 8.1). In chapter 3 our first goal was to develop a
simplified parallel plate lysis method which could operate at lower voltages and could be easily
integrated with our NME platform.
In chapter 4 our second goal was to reduce the cost of fabricated devices and explore new
material paradigms since silicon is a rather expensive substrate. We explored new more
manufacturable materials for bottom up template fabrication of NMEs. We tried various
materials and settled on glass as an optimal substrate.

24
In chapter 5 our third goal was to develop highly multiplexed electrochemical biosensors, which
is an important goal of diagnostics so that large panels of biomarkers can be analyzed. An issue
for increased multiplexing in electrochemical systems is if n sensors need to be addressed, n
electrical output contacts are needed, which becomes increasingly unmanageable for high levels
of multiplexing. To reduce output contacts using existing approaches requires active switching
electronics on each chip, driving up cost and complexity. We developed a passive solution based
electrochemical method to replace resource heavy active electronics.
25
2.3 References
1. Bard, A. J. Electrochemical methods: Fundamentals and applications. (Wiley: New York,
2001).
2. Ostwald, W. Electrochemistry: History and theory. (Amerind Pub. Co.: New Delhi, 1980).
3. Clark, L. C. & Lyons., C. Electrode systems for continuous monitoring in cardiovascular
surgery. Annals of the New York Academy of Sciences 102, 29–45 (1962).
4. Newman, J. D. & Turner, A. P. F. Home blood glucose biosensors: a commercial
perspective. Biosensors & bioelectronics 20, 2435–53 (2005).
5. Zhang, X., Ju, H. & Wang, J. Electrochemical sensors, biosensors, and their biomedical
applications. (Academic Press: Amsterdam, 2008).
6. Ronkainen, N. J., Halsall, H. B. & Heineman, W. R. Electrochemical biosensors.
Chemical Society Reviews 39, 1747–63 (2010).
7. Palec, E. & Bartos, M. Electrochemistry of Nucleic Acids. Chemical Reviews, 112 (6),
3427-81 (2012).
8. Palecek, E. Fifty Years of Nucleic Acid Electrochemistry. Electroanalysis 21, 239–251
(2009).
9. Wang, J. Electrochemical nucleic acid biosensors. Analytica Chimica Acta 469, 63–71
(2002).
10. Drummond, T. G., Hill, M. G. & Barton, J. K. Electrochemical DNA sensors. Nat.
Biotechnol. 21, 1192–1199 (2003).
11. Venkatesan, B. M. & Bashir, R. Nanopore sensors for nucleic acid analysis. Nature
nanotechnology 6, 615–24 (2011).
12. Wanunu, M., Dadosh, T., Ray, V., Jin, J., McReynolds, L. & Drndic, M. . Rapid electronic
detection of probe-specific microRNAs using thin nanopore sensors. Nature
nanotechnology 5, 807–14 (2010).
26
13. Zheng, G., Patolsky, F., Cui, Y., Wang, W. U. & Lieber, C. M. Multiplexed electrical
detection of cancer markers with nanowire sensor arrays. Nat. Biotechnol. 23, 1294–1301
(2005).
14. Das, J. & Kelley, S. O. Protein detection using arrayed microsensor chips: tuning sensor
footprint to achieve ultrasensitive readout of CA-125 in serum and whole blood. Anal.
Chem. 83, 1167–1172 (2011).
15. Malhotra, R., Patel, V., Vaqué, J. P., Gutkind, J. S. & Rusling, J. F. Ultrasensitive
electrochemical immunosensor for oral cancer biomarker IL-6 using carbon nanotube
forest electrodes and multilabel amplification. Analytical chemistry 82, 3118–23 (2010).
16. Tang, D., Yuan, R. & Chai, Y. Ultrasensitive electrochemical immunosensor for clinical
immunoassay using thionine-doped magnetic gold nanospheres as labels and horseradish
peroxidase as enhancer. Anal. Chem. 80, 1582–1588 (2008).
17. Zuo, X., Xiao, Y. & Plaxco, K. W. High specificity, electrochemical sandwich assays
based on single aptamer sequences and suitable for the direct detection of small-molecule
targets in blood and other complex matrices. Journal of the American Chemical Society
131, 6944–5 (2009).
18. Swensen, J. S. Continuous, real-time monitoring of cocaine in undiluted blood serum via a
microfluidic, electrochemical aptamer-based sensor. Journal of the American Chemical
Society 131, 4262–4266 (2009).
19. Liu, H., Xiang, Y., Lu, Y. & Crooks, R. M. Aptamer-based origami paper analytical
device for electrochemical detection of adenosine. Angew. Chem. Int. Ed. 51, 6925–6928
(2012).
20. Feng, L., Chen, Y., Ren, J. & Qu, X. A graphene functionalized electrochemical
aptasensor for selective label-free detection of cancer cells. Biomaterials 32, 2930–7
(2011).
27
21. Malhotra, R., Patel, V., Vaqué, J. P., Gutkind, J. S. & Rusling, J. F. Ultrasensitive
electrochemical immunosensor for oral cancer biomarker IL-6 using carbon nanotube
forest electrodes and multilabel amplification. Anal. Chem. 82, 3118–3123 (2010).
22. Mannoor, M. S., Zhang, S., Link, A. J. & McAlpine, M. C. Electrical detection of
pathogenic bacteria via immobilized antimicrobial peptides. Proceedings of the National
Academy of Sciences of the United States of America 107, 19207–12 (2010).
23. Liao, J.C., Mastali, M., Li, Y., Gau, V., Suchard, M.A., Babbitt, J., Gornbein, J., Landaw,
E.M., McCabe, E.R., Churchill, B.M., Haake, D.A..Development of an advanced
electrochemical DNA biosensor for bacterial pathogen detection. The Journal of
molecular diagnostics 9, 158–68 (2007).
24. Mannoor, M. S., Zhang, S., Link, A. J. & McAlpine, M. C. Electrical detection of
pathogenic bacteria via immobilized antimicrobial peptides. Proc. Natl Acad. Sci. USA
107, 19207–19212 (2010).
25. Kissinger, P. T., Lafayette, W. & Heineman, W. R. Cyclic voltammetry. Journal of
Chemical Education 60, 702–706 (1983).
26. Wang, J. Electrochemical glucose biosensors. Chemical reviews 108, 814–25 (2008).
27. Watkins, J. J., Zhang, B. & White, H. S. Chemistry at the Nanometer Scale
Electrochemistry at Nanometer-Scaled Electrodes. Journal of Chemical Education 82, 712
(2005).
28. Bin, X., Sargent, E. H. & Kelley, S. O. Nanostructuring of Sensors Determines the
Efficiency of Biomolecular Capture. Analytical Chemistry 82, 5928–5931 (2010).
29. Gasparac, R. et al. Ultrasensitive electrocatalytic DNA detection at two- and three-
dimensional nanoelectrodes. Journal of the American Chemical Society 126, 12270–1
(2004).
30. Lapierre, M. a, O’Keefe, M., Taft, B. J. & Kelley, S. O. Electrocatalytic detection of
pathogenic DNA sequences and antibiotic resistance markers. Analytical chemistry 75,
6327–33 (2003).

28
31. Yang, H.; Hui, A.; Pampalakis, G.; Soleymani, L.; Liu, F.-F.; Sargent, E. H.; Kelley, S. O.
Direct, electronic microRNA detection for the rapid determination of differential
expression profiles. Angew. Chem. Int. Ed. 48, 8461–8464 (2009).
32. Nielsen, P. E. Peptide Nucleic Acid. A Molecule with Two Identities. Accounts of
Chemical Research 32, 624–630 (1999).
33. Soleymani, L., Fang, Z., Sargent, E. H. & Kelley, S. O. Programming the detection limits
of biosensors through controlled nanostructuring. Nature nanotechnology 4, 844–8 (2009).
34. Fang, Z., Soleymani, L., Pampalakis, G., Yoshimoto, M., Squire, J.A., Sargent,
E.H., Kelley, S.O. Direct Profiling of Cancer Biomarkers in Tumor Tissue Using a
Multiplexed Nanostructured Microelectrode Integrated Circuit. ACS nano 3, 3207–3213
(2009).
29
3 Polymerase Chain Reaction-Free, Sample-to-Answer Bacterial Detection in 30 Minutes with Integrated Cell Lysis
Our goal was to perform efficient and simple processing for direct detection of cancer and
pathogenic bacteria with our nanostructured microelectrode platform. Prior to my first
manuscript we utilized a microfluidic electrical lysis platform for lysis of bacteria [22] and
cancer cells [23] additional details of the microfluidic approach can be found in the
supplementary information. We followed this work by developing a simple parallel plate
electrical lysis chamber and directly integrated it with our NME detection platform.
Disclosure of work within this manuscript; B.L., E.H.S and S.O.K developed parallel plate lysis
chambers, B.L. fabricated, tested and characterized parallel plate lysis chambers, B.L. and Z.F.
performed bacterial lysate detection. B.L., E.H.S. and S.O.K. wrote the manuscript.
Lam, B., Fang, Z., Sargent, E. H. & Kelley, S. O. ―Polymerase Chain Reaction-Free, Sample-to-
Answer Bacterial Detection in 30 Minutes with Integrated Cell Lysis.‖ Analytical
Chemistry 84, 21-25 (2012).
3.1 Abstract
An important goal for improved diagnosis and management of infectious disease is the
development of rapid and accurate technologies for the decentralized detection of bacterial
pathogens. Most current clinical methods that identify bacterial strains require time-consuming
culture of the sample or procedures involving the polymerase chain reaction [1-3]. Neither of
these approaches has enabled testing at the point-of-need because of the requirement for skilled
technicians and laboratory facilities. Here, we demonstrate the performance of an effective,
integrated platform for the rapid detection of bacteria that combines a universal bacterial lysis
approach and a sensitive nanostructured electrochemical biosensor. The lysis is rapid, is effective
at releasing intercellular RNA from bacterial samples, and can be performed in a simple, cost-
effective device integrated with an analysis chip. The platform was directly challenged with
these unpurified lysates in buffer and urine. We successfully detected the presence of bacteria
with high sensitivity and specificity and achieved a sample-to-answer turnaround time of 30 min.
We have met the clinically relevant detection limit of 1 cfu/μL, indicating that uncultured
30
samples can be analyzed. This advance will greatly reduce time to successful detection from
days to minutes.
3.2 Introduction
The effective management of infectious disease caused by bacterial pathogens is a major
problem in clinical medicine that is hampered by the lack of rapid diagnostic methods [1-4]
Approaches currently used for correct diagnosis of infectious bacterial strains include phenotypic
testing and assays that rely on the polymerase chain reaction (PCR) [3,5,6]. Many methods
require a time-consuming culture step that takes days to weeks depending on the strain of
bacteria, and phenotypic testing to confirm antibiotic resistance can double the diagnosis time.
To speed analysis, PCR may also be performed on cultured samples or in some cases uncultured
samples; however, this approach typically requires stringent purification of nucleic acids. The
delays in the availability of diagnostic information limits the effectiveness of treatment. Hence,
there is need for a rapid platform that can classify bacterial species.
A great deal of effort has gone into the development of point-of-need methods to meet the
challenge of rapid bacterial identification;[7-10] most of the methods developed rely on PCR and
face inherent limitations because of the requirement for enzymatic components and thermal
control. In addition, methods based on surface plasmon resonance,[11-13] quartz crystal
microbalance,[14,15] and fluorescence[16,17] have been reported with good detection limits.
However, many of these are immunological[11,12,14,16] and are ineffective at providing
genetic-level information required for strain typing. Furthermore, these methods can require
labeled markers[13,15] and additional optical[11-13, 16, 17] and/or fluid handling systems,[7-10,
12, 13, 15] which adds to their complexity, cost, and lack of applicability to point-of-care testing.
Work in our laboratories has focused on developing an electrochemical strategy that combines
ultrasensitive detection, straightforward sample processing, and inexpensive components that can
be integrated into a cost-effective, user-friendly device. Our detection platform combines an
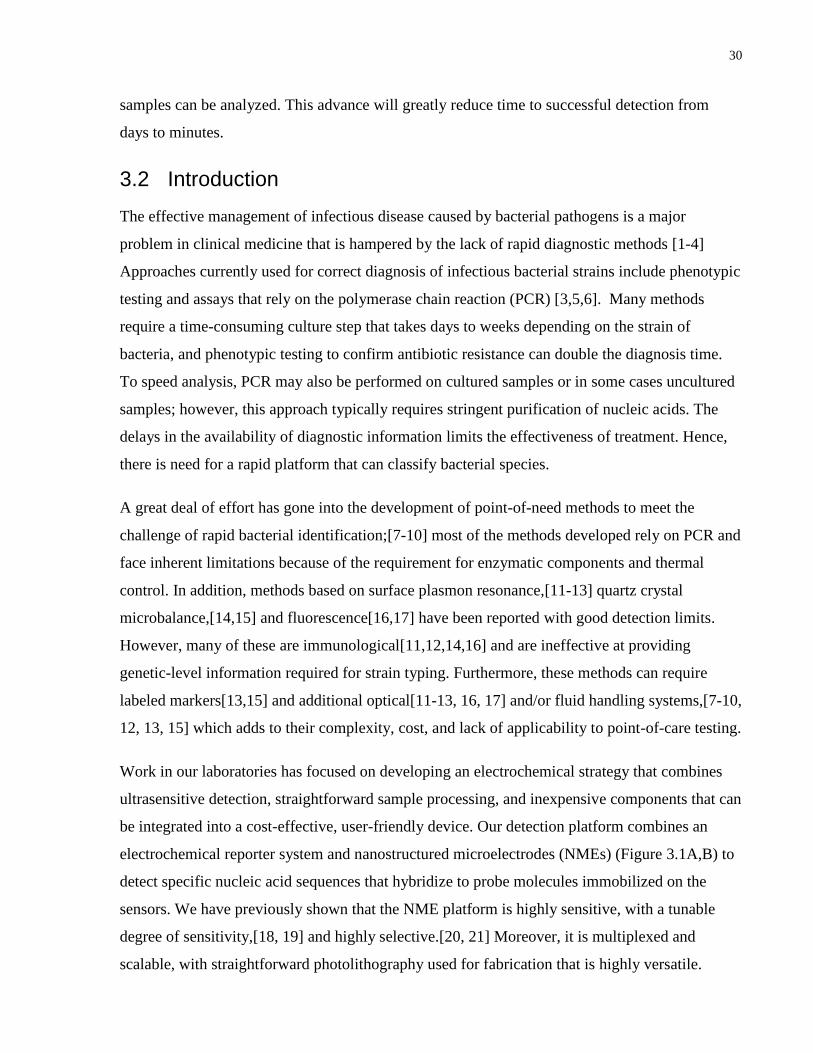
electrochemical reporter system and nanostructured microelectrodes (NMEs) (Figure 3.1A,B) to
detect specific nucleic acid sequences that hybridize to probe molecules immobilized on the
sensors. We have previously shown that the NME platform is highly sensitive, with a tunable
degree of sensitivity,[18, 19] and highly selective.[20, 21] Moreover, it is multiplexed and
scalable, with straightforward photolithography used for fabrication that is highly versatile.
31
Figure 3.1 - Bacterial detection sensors. (A) The NME platform consisting of Si chip with
patterned Au working, reference, and auxiliary electrodes. The working electrode surface is
passivated with SiO2, and 5 μm apertures are etched at the tip of each electrode. NMEs are
electroplated within each aperture, with a typical size of 100 μm. (B) Electrochemical detection
scheme for nucleic acids utilizing Ru3+
and Fe3+
electrocatalytic reporter pair.
While prior efforts to exploit this platform for RNA detection showed that very high levels of
performance could be achieved both with bacterial and mammalian targets,[22, 23] integrated
sample processing, an essential feature for a point-of-care diagnostic device, had not yet been
addressed. We therefore explored a processing approach that would be complementary to our
electronic readout strategy: electrical cell lysis. Alternative methods that could be used for this
purpose include chemical, physical,[24, 25] and thermal lysis methods.[26] However, the
addition of chemical agents, complicated device geometries, or thermal elements are undesirable
given that they can introduce interfering agents or increase the complexity of the device.
Electrical lysis of bacterial cells has been well studied in the past.[27-30] The major drawback is
that high electric field requirements, greater than 10 kV/cm, are required to lyse bacterial cells,
which has limited its use for inline sensing. Prior work in our laboratories utilized microfludic
32
lysis chambers[31, 32] which take advantage of geometrical field effects to lower applied
voltages. However, voltage requirements were still high (1000 V). In addition, this and other
systems[33] require fluidics that can only analyze small sample volumes and increase processing
times.
To address these issues, we hypothesized that, by assembling a chamber composed of two
conductive gold electrodes with a very thin spacer (500 μm), we could lyse bacteria introduced
to the electrodes with an applied potential. If this type of sample processing module was coupled
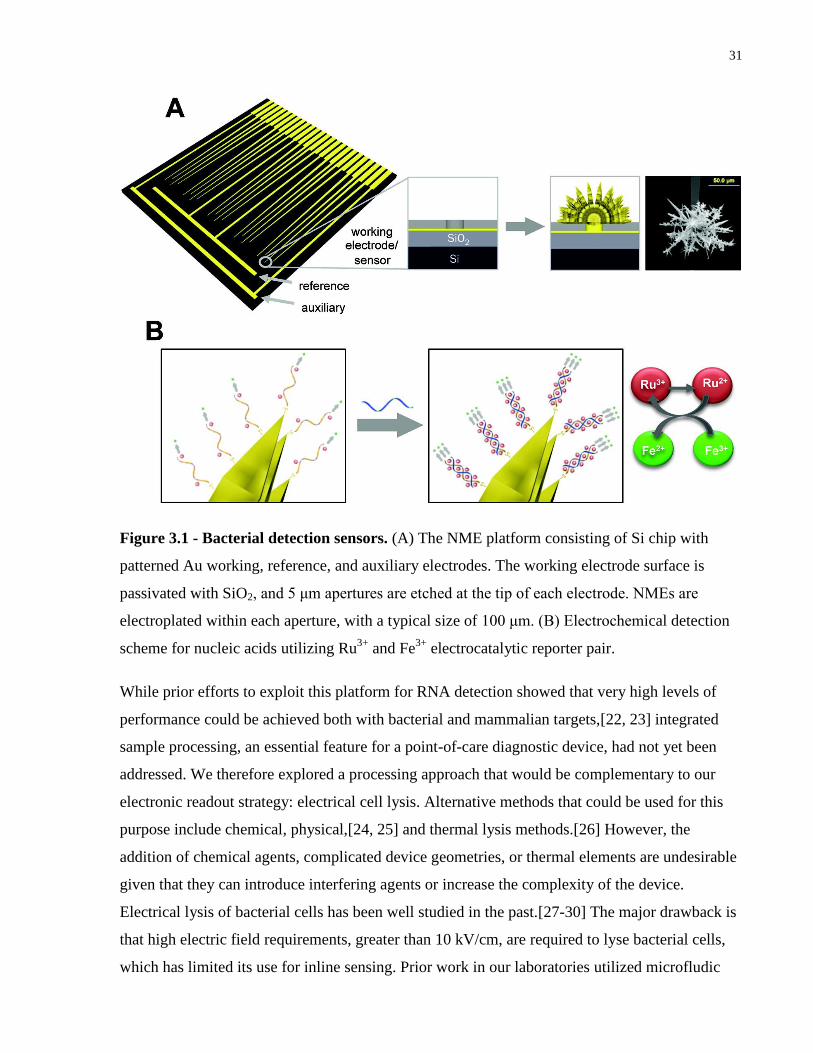
with a NME chip (Figure 3.2A), it could be used to achieve rapid sample-to-answer bacterial
detection with minimal intervention by the user (Figure 3.2B). The workflow used here involved:
(1) a solution being introduced into the chamber with a syringe, (2) lysis being induced with an
applied field, (3) the sample being moved to the chip with an injection of air, (4) mixing with
reporter groups, and (5) readout. This workflow can be completed in less than 30 min and
permits bacterial identification and classification.
33
Figure 3.2 - Integrated sensing system. (A) Schematic of cartridge integrating lysis chamber,
NME chip, and connector to analyzer. (B) Overview of detection scheme; injection, lysis,
delivery, and readout in 30 min. (C) Typical differential pulse voltammograms of positive (left)
and negative (right) samples where the dotted line is the background and the solid line is the
readout.
34
3.3 Methods and Materials
Chip Fabrication
Detection chips were fabricated using 6 in. thin silicon wafers passivated with a thick thermally
grown silicon oxide layer. First, a positive photoresist was patterned to the desired electrical
contact and lead structure using standard photolithographic methods. Subsequently, a 500 nm
gold layer was deposited using electron-beam assisted gold evaporation, and a standard lift off
process was used to expose the desired contact and lead structure. Next, a second layer of 500
nm silicon dioxide was deposited to passivate the lead structure using chemical vapor deposition.
Finally, 5 μm apertures were etched into the second passivating silicon dioxide layer, exposing
the gold layer at the end of each lead structure.
Nanostructured Microelectrode (NME) Fabrication
Chips were cleaned by sonicating in acetone for 1 min and rinsing with isopropanol and
deionized water for 30 s. NMEs were electroplated using a standard 3 electrode system featuring
a Ag/AgCl reference, platinum auxiliary electrode and the 5 μm gold aperture as the working
electrode. An electroplating solution of 20 mM HAuCl4 in 0.5 M HCl was used. The
substructures of NMEs were plated by holding each electrode at 0 mV for 250 s. Finally, a
nanostructured overlayer was plated by holding the electrode at −700 mV for 10 s.
Synthesis and Purification of Peptide Nucleic Acid Probes
PNA probes were synthesized in house using a Protein Technologies Prelude peptide
synthesizer. The following probe sequences specific to the rpoβ mRNA were utilized for
detection of unpurified lysates: NH2-Cys-Gly-Asp-ATC TGC TCT GTG GTG TAG TT-Asp-
CONH2 (E. coli) and NH2-Cys-Gly-Asp-AAG TAA GAC ATT GAT GCA AT-Asp-CONH2 (S.
saprophyticus). All probes were stringently purified by reverse phase high performance liquid
chromatography. Probe sequences were quantified by measuring absorbance at 260 nm, and
excitation coefficients were obtained from http://www.panagene.com
Modification of NMEs with PNA probes
35
A solution of 1 μM purified thiolated PNA probe in 25 mM NaCl was deposited onto the surface
of an NME chip in a dark humidity chamber overnight at room temperature. A dam constructed
from adhesive silicone spacers was used to deposit two different probes on each NME chip.
Bacterial Samples
Escherichia coli was obtained from Invitrogen (18265-017). Staphylococcus saprophyticus,
methicillin-resistant Staphylococcus aureus, and methicillin-susceptible Staphylococcus
aureuswas obtained from ATCC (ATCC 15305, BAA-1720, 29213). All strains were grown in
the appropriate growth media in an incubating shaker at 37 °C. After growth to the desired
population, the growth media was replaced with 1× PBS.
Lysis Chamber Fabrication and Operation
Lysis chambers were fabricated using adhesive silicone hybridization spacers (0.5 × 25 × 25
mm) obtained from Grace Biolabs and gold coated slides (25 × 25 mm) obtained from EMF
Corporation. Chambers were constructed by first cutting a narrow channel 1 mm wide into the
spacer, which was then sandwiched between two gold slides. To lyse the bacterial samples, a 200
μL suspension was loaded into the chamber using a syringe and 100 V, 10 ms DC pulses were
applied to the sample at a frequency of 1 Hz for 20 s.
Hybridization Protocol and Electrochemical Measurements
Electrochemical measurements were made using a PalmSens EmStat embedded potentiostat.
After modification of NMEs with PNA probes, a background signal was scanned in
electrocatalyic buffer containing 10 μM Ru(NH3)63+
and 1 mM Fe(CN)63–
in 0.1× PBS.
Immediately after lysis, NMEs were incubated with unpurified lysates for 20 min at 37 °C. After
hybridization, chips were washed twice in 0.1× PBS. We subsequently scanned the hybridization
signal after incubation in the same electrocatalytic buffer.
Reverse-Transcriptase Polymerase Chain Reaction
Primer sequences specific to a 185 bp region of the E. coli rpoβ mRNA were synthesized. A
Qiagen one-step RT-PCR kit (210210) was used to perform RT-PCR on lysates. After lysis,
samples were centrifuged at 10 000 rpm to remove intact bacterial cells that would generate a
36
positive signal. RT-PCR was then performed on the supernatant. The products were visualized
using agarose gel electrophoresis and ethidium bromide fluorescent stain.
Flow Cytometry
Flow cytometry measurements were made utilizing a BD FACS Canto Instrument. After lysis,
samples were incubated in propidium iodide in the dark at room temperature at a concentration
of 25 μg/mL for 30 min before injection into the flow cytometer. Counts versus fluorescence
intensity measurements were made in the red channel of the flow cytometer.
3.4 Results and Discussion
To validate our lysis approach, we examined samples of two model organisms, Escherichia
coli(EC) and Staphylococcus saprophyticus (SS). Bacterial samples suspended in buffered
solution were introduced into the lysis chamber and lysed with varying voltages (0–100 V) and
pulse widths (0–10 ms). A small amount of bubbling was observed, but the escape of these
bubbles could be controlled by minimizing the width of the exit port on the lysis chamber. To
assess lysis efficiency, we first looked at cell viability after lysis by monitoring growth on agar
plates. With applied voltages as low as 2 V, all of the bacteria in processed samples were killed
(data not shown). This loss in viability, however, cannot be used as an unequivocal test for cell
lysis, as it does not indicate whether the bacterial cell walls were compromised prior to cell
death. Therefore, to confirm that the applied electrical fields did cause irreversible cell rupture,
we analyzed propidium iodide (PI) uptake using flow cytometry. PI fluoresces only when
intercalated with DNA and does not cross uncompromised cell walls and, therefore, can be used
as an indicator of cell lysis. After incubation in PI, samples were analyzed using flow cytometry
and histograms of counts versus fluorescence intensity were plotted versus different pulse widths
(Figure 3.3A) and applied voltages (Figure 3.3B).
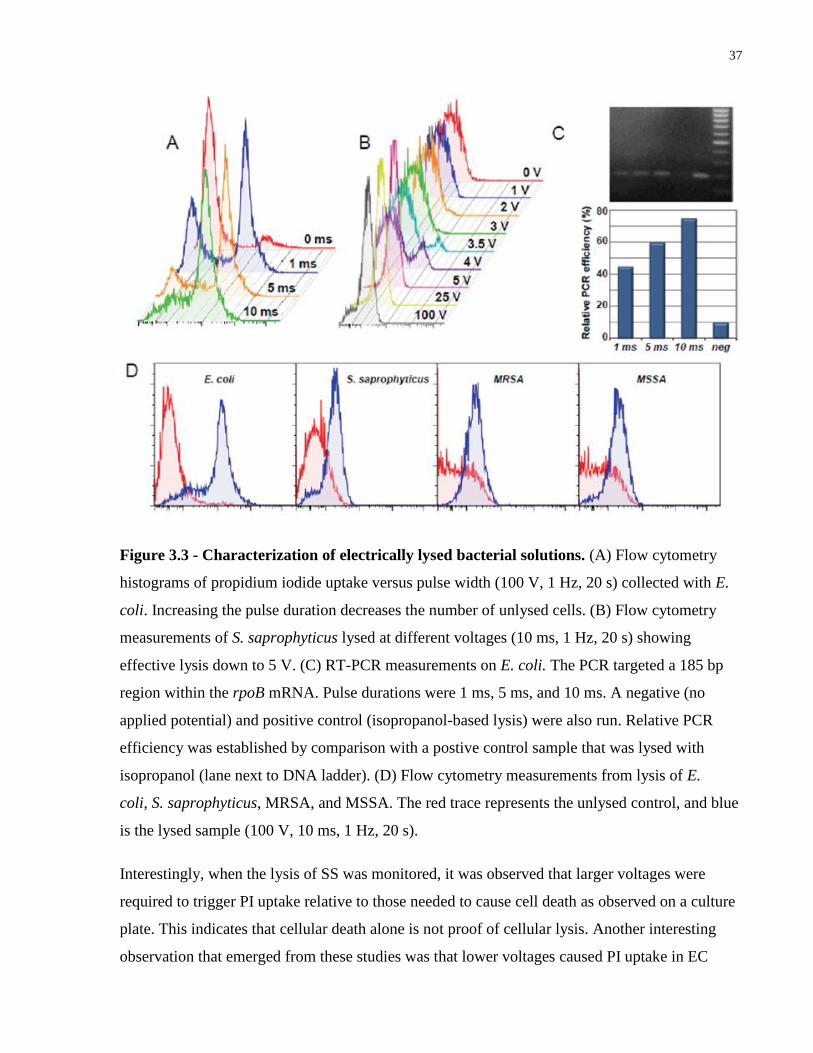
37
Figure 3.3 - Characterization of electrically lysed bacterial solutions. (A) Flow cytometry
histograms of propidium iodide uptake versus pulse width (100 V, 1 Hz, 20 s) collected with E.
coli. Increasing the pulse duration decreases the number of unlysed cells. (B) Flow cytometry
measurements of S. saprophyticus lysed at different voltages (10 ms, 1 Hz, 20 s) showing
effective lysis down to 5 V. (C) RT-PCR measurements on E. coli. The PCR targeted a 185 bp
region within the rpoB mRNA. Pulse durations were 1 ms, 5 ms, and 10 ms. A negative (no
applied potential) and positive control (isopropanol-based lysis) were also run. Relative PCR
efficiency was established by comparison with a postive control sample that was lysed with
isopropanol (lane next to DNA ladder). (D) Flow cytometry measurements from lysis of E.
coli, S. saprophyticus, MRSA, and MSSA. The red trace represents the unlysed control, and blue
is the lysed sample (100 V, 10 ms, 1 Hz, 20 s).
Interestingly, when the lysis of SS was monitored, it was observed that larger voltages were
required to trigger PI uptake relative to those needed to cause cell death as observed on a culture
plate. This indicates that cellular death alone is not proof of cellular lysis. Another interesting
observation that emerged from these studies was that lower voltages caused PI uptake in EC
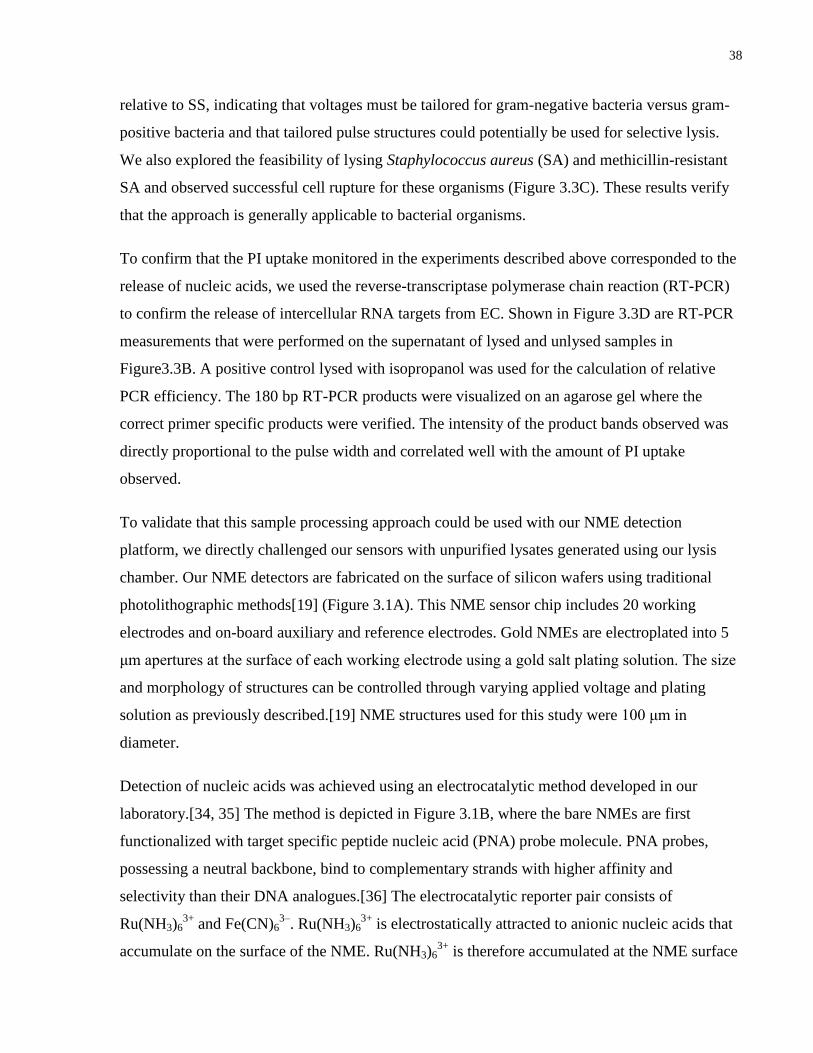
38
relative to SS, indicating that voltages must be tailored for gram-negative bacteria versus gram-
positive bacteria and that tailored pulse structures could potentially be used for selective lysis.
We also explored the feasibility of lysing Staphylococcus aureus (SA) and methicillin-resistant
SA and observed successful cell rupture for these organisms (Figure 3.3C). These results verify
that the approach is generally applicable to bacterial organisms.
To confirm that the PI uptake monitored in the experiments described above corresponded to the
release of nucleic acids, we used the reverse-transcriptase polymerase chain reaction (RT-PCR)
to confirm the release of intercellular RNA targets from EC. Shown in Figure 3.3D are RT-PCR
measurements that were performed on the supernatant of lysed and unlysed samples in
Figure3.3B. A positive control lysed with isopropanol was used for the calculation of relative
PCR efficiency. The 180 bp RT-PCR products were visualized on an agarose gel where the
correct primer specific products were verified. The intensity of the product bands observed was
directly proportional to the pulse width and correlated well with the amount of PI uptake
observed.
To validate that this sample processing approach could be used with our NME detection
platform, we directly challenged our sensors with unpurified lysates generated using our lysis
chamber. Our NME detectors are fabricated on the surface of silicon wafers using traditional
photolithographic methods[19] (Figure 3.1A). This NME sensor chip includes 20 working
electrodes and on-board auxiliary and reference electrodes. Gold NMEs are electroplated into 5
μm apertures at the surface of each working electrode using a gold salt plating solution. The size
and morphology of structures can be controlled through varying applied voltage and plating
solution as previously described.[19] NME structures used for this study were 100 μm in
diameter.
Detection of nucleic acids was achieved using an electrocatalytic method developed in our
laboratory.[34, 35] The method is depicted in Figure 3.1B, where the bare NMEs are first
functionalized with target specific peptide nucleic acid (PNA) probe molecule. PNA probes,
possessing a neutral backbone, bind to complementary strands with higher affinity and
selectivity than their DNA analogues.[36] The electrocatalytic reporter pair consists of
Ru(NH3)63+
and Fe(CN)63–
. Ru(NH3)63+
is electrostatically attracted to anionic nucleic acids that
accumulate on the surface of the NME. Ru(NH3)63+
is therefore accumulated at the NME surface
39
if the complementary nucleic acid target is bound to the PNA probe. Using differential pulse
voltammetry (DPV), the surface of the NME is scanned over a specified potential window before
and after hybridization. Reduction of Ru(NH3)63+
to Ru(NH3)62+
occurs near the surface when the
Ru(III) reduction potential is reached. Fe(CN)63–
then oxidizes Ru(NH3)62+
back to Ru(NH3)63+
,
generating an electrocatalytic current. Typical positive and negative DPV are shown in
Figure 3.2C.
The use of this method with unpurified lysates of EC and SS generated using electrical lysis is
demonstrated in Figure 3.4A,B. NME sensors were modified with probes corresponding to the
sequence of the RNA polymerase β mRNA found in EC or SS. The lysed bacteria were
introduced, and electrochemical signals were obtained within 30 min. Typical background
subtracted DPV measurements obtained at NME sensors are shown in Figure 3.4C. Evaluation of
limits of detection (Figure 3.4B) verify that this approach is successful with as few as 1 bacterial
cell per microliter, a concentration that corresponds to the levels of bacteria found in many types
of clinical samples. A limited dynamic range was explored in this study, but if analysis of a
larger range of concentrations was desired, prior work on the use of sensor nanostructuring[19]
and size[20] could be leveraged to widen dynamic range.
40
Figure 3.4 - Direct bacterial detection in unpurified lysates (A) Representative background-
subtracted electrochemical differential pulse voltammograms used for study of sensitivity and
specificity. The data shown was collected with the SS probe directly challenged with the
corresponding unpurified lysates. (B) Background-subtracted peak currents of sensors challenged
with unpurified lysates demonstrating sensitivity and specificity. Values shown represent
averages of >6 trials; coefficient of variation was <20%. (C) Direct detection of E. coli and S.
saprophyticus in urine samples. Sensors were challenged directly with unpurified lysates of
spiked urine samples for 30 min prior to electrochemical analysis. A control probe was used in
each trial to assess background signals. A current value was collected for each trial and was
plotted individually. (D) Real-time analysis of a 100 cfu/uL E.coli lysate spiked with the
electrocatalytic reporter groups. A differential pulse voltammogram was measured at each time
point for both complementary and noncomplementary sensors, and peak currents were plotted as
41
a function of time. (Bacterial lysis and sample preparation: Brian Lam, Electrochemical
measurements: Zhichao Fang)
To validate applicability of our integrated platform to samples resembling those relevant for
clinical analysis, we challenged it with samples of urine spiked with both EC and SS. This
analysis simulates real-world urinary tract infections where the relevant threshold is 100
cfu/μL.[37] After crude urine samples were lysed, they were directly applied to NME sensors
specific to EC and SS. Successful detection of both EC and SS was achieved even in the
presence of this complex biological background (Figure 3.4C).
The adaptation of this approach to real-time detection was investigated, with signals being
collected during hybridization of NME sensors with an unpurified lysate. This analysis was done
in ―one-pot‖, with reporter groups present during hybridization. Specific detection of EC could
be achieved using this approach, with very rapid readout achieved within minutes at a
concentration of this pathogen that corresponds to its levels in samples collected from patients
with a urinary tract infection (Figure 3.4D). This indicates that a positive result could be obtained
from this type of sample within 2 min, a significant improvement over the culture-based methods
typically employed for this type of analysis.
3.5 Conclusions
The advances reported here demonstrate the first PCR-free, chip-based sensing system to provide
sample-to-answer sensing of bacterial pathogens at clinically relevant levels. A simple lysis
chamber was used to trigger electrical rupture of bacteria, and these crude lysates, generated in
buffer or urine, were directly analyzed with an ultrasensitive microchip featuring nanostructured
microsensors. Real-time analysis is also enabled by the robust sensors that are resistant to fouling
by cellular contents.
42
3.6 References
1. Greenwood, D. Antimicrobial Susceptibility Tests and Their Clinical Relevance. Journal of
Infectious Disease 144, 380–385 (1981).
2. Optimal DNA Isolation Method for Detection of Bacteria in Clinical Specimens by Broad-
Range PCR. 40, 4211–4217 (2002).
3. Tang, Y. W. & Stratton, C. W. Advanced techniques in diagnostic microbiology. (Springer:
New York: 2006).
4. Levy, S. B. & Marshall, B. Antibacterial resistance worldwide: causes, challenges and
responses. Nature medicine 10, S122–9 (2004).
5. Institute., C. and L. S. CLSI document M02-A10. (Clinical and Laboratories Standards
Institute: Pennsylvania: 2009).
6. Institute, C. and L. S. CLSI document M100-S21. (Clinical and Laboratories Standards
Institute: Pennsylvania: 2011).
7. Miniature on-chip detection of unpurified methicillin-resistant Staphylococcus aureus
(MRSA) DNA using real-time PCR. Journal of biotechnology 146, 93–9 (2010).
8. Self-contained, fully integrated biochip for sample preparation, polymerase chain reaction
amplification, and DNA microarray detection. Analytical chemistry 76, 1824–31 (2004).
9. Shen, F. et al. Nanoliter Multiplex PCR Arrays on a SlipChip. Lab on a Chip 82, 4606–4612
(2010).
10. A DNA biochip for on-the-spot multiplexed pathogen identification. Nucleic acids research
34, e118 (2006).
11. Surface plasmon resonance immunosensor for the detection of Salmonella typhimurium.
Biosensors & bioelectronics 19, 1497–504 (2004).
12. A mixed self-assembled monolayer-based surface plasmon immunosensor for detection of E.
coli O157:H7. Biosensors & bioelectronics 21, 998–1006 (2006).
43
13. Colloidal Au-Enhanced Surface Plasmon Resonance for Ultrasensitive Detection of DNA
Hybridization. 9071–9077 (2000).
14. Su, X.-L. & Li, Y. A self-assembled monolayer-based piezoelectric immunosensor for rapid
detection of Escherichia coli O157:H7. Biosensors and Bioelectronics 19, 563–574
(2004).
15. Mao, X., Yang, L., Su, X.-L. & Li, Y. A nanoparticle amplification based quartz crystal
microbalance DNA sensor for detection of Escherichia coli O157:H7. Biosensors &
bioelectronics 21, 1178–85 (2006).
16. Ko, S. & Grant, S. a A novel FRET-based optical fiber biosensor for rapid detection of
Salmonella typhimurium. Biosensors & bioelectronics 21, 1283–90 (2006).
17. Edgar, R. et al. High-sensitivity bacterial detection using biotin-tagged phage and quantum-
dot nanocomplexes. Proceedings of the National Academy of Sciences of the United States
of America 103, 4841–5 (2006).
18. Bin, X., Sargent, E. H. & Kelley, S. O. Letters to Analytical Chemistry Nanostructuring of
Sensors Determines the Efficiency of Biomolecular Capture. 82, 5928–5931 (2010).
19. Soleymani, L., Fang, Z., Sargent, E. H. & Kelley, S. O. Programming the detection limits of
biosensors through controlled nanostructuring. Nature nanotechnology 4, 844–8 (2009).
20. Bin, X., Sargent, E. H. & Kelley, S. O. Nanostructuring of sensors determines the efficiency
of biomolecular capture. Anal. Chem. 82, 5928–5931 (2010).
21. Yang, H.; Hui, A.; Pampalakis, G.; Soleymani, L.; Liu, F.-F.; Sargent, E. H.; Kelley, S. O.
Direct, electronic microRNA detection for the rapid determination of differential
expression profiles. Angew. Chem. Int. Ed. 48, 8461–8464 (2009).
22. Soleymani, L. et al. Hierarchical nanotextured microelectrodes overcome the molecular
transport barrier to achieve rapid, direct bacterial detection. ACS nano 5, 3360–6 (2011).
44
23. Vasilyeva, E. et al. Direct genetic analysis of ten cancer cells: tuning sensor structure and
molecular probe design for efficient mRNA capture. Angewandtbe Chemie (International
ed. in English) 50, 4137–41 (2011).
24. Huh, Y. S. et al. Microfluidic cell disruption system employing a magnetically actuated
diaphragm. Electrophoresis 28, 4748–57 (2007).
25. Di Carlo, D., Jeong, K.-H. & Lee, L. P. Reagentless mechanical cell lysis by nanoscale barbs
in microchannels for sample preparation. Lab on a chip 3, 287–91 (2003).
26. Privorotskaya, N. et al. Rapid thermal lysis of cells using silicon-diamond microcantilever
heaters. Lab on a chip 10, 1135–41 (2010).
27. Grahl, T. & Märkl, H. Killing of microorganisms by pulsed electric fields. Applied
microbiology and biotechnology 45, 148–57 (1996).
28. Hülsheger, H., Potel, J. & Niemann, E. G. Electric field effects on bacteria and yeast cells.
Radiation and environmental biophysics 22, 149–62 (1983).
29. Sale, A. J. H. . H. Effects of high electric field on microorganisms I. Killing of bacteria and
yeasts. Biochim. Biophys. Acta 148, 781–788 (1967).
30. Hamilton, W. A.; Sale, A. J. H. Effects of high electric fields on microorganisms: II.
Mechanism of action of lethal effect. Biochim. Biophys. Acta 48, 789–800 (1967).
31. Wang, H.-Y., Bhunia, A. K. & Lu, C. A microfluidic flow-through device for high
throughput electrical lysis of bacterial cells based on continuous dc voltage. Biosensors &
bioelectronics 22, 582–8 (2006).
32. Bao, N. & Lu, C. A microfluidic device for physical trapping and electrical lysis of bacterial
cells. Applied Physics Letters 92, 214103 (2008).
33. Lee, S. & Tai, Y. A micro cell lysis device. Sensors and Actuators A 73, 74–79 (1999).
45
34. Gasparac, R. et al. Ultrasensitive electrocatalytic DNA detection at two- and three-
dimensional nanoelectrodes. Journal of the American Chemical Society 126, 12270–1
(2004).
35. Lapierre, M. A., O’Keefe, M., Taft, B. J. & Kelley, S. O. Electrocatalytic detection of
pathogenic DNA sequences and antibiotic resistance markers. Anal. Chem. 75, 6327–6333
(2003).
36. Nielsen, P. E. Peptide Nucleic Acid. A Molecule with Two Identities. Accounts of Chemical
Research 32, 624–630 (1999).
37. Aguirre-Avalos, G., Zavala-Silva, M. L., Díaz-Nava, a, Amaya-Tapia, G. & Aguilar-
Benavides, S. Asymptomatic bacteriuria and inflammatory response to urinary tract
infection of elderly ambulatory women in nursing homes. Archives of medical research
30, 29–32 (1999).
46
4 Optimized templates for bottom-up growth of high-performance integrated biomolecular detectors
Another important aspect of biosensors is consideration of the materials and techniques utilized
in fabrication. Since the materials a detection platform is restricted by can determine if the
platform will rise or fall on the open market. The goal of my second manuscript was to address
these material issues by testing various material platforms including printed circuit boards,
plastics and glass, as suitable material platforms for the growth of nanostructured
microelectrodes.
Disclosure of work within this manuscript; B.L. designed and manufactured alternate materials
test platforms, B.L. and R.D.H. tested and characterized different platforms, B.L. and J.D.
performed electrochemical detection assay on platforms, M. P. designed and tested various size
templates on glass. B.L., R.D.H., J.D., E.H.S. and S.O.K. wrote the manuscript with
contributions from all of the other authors.
Lam, B., Holmes, R. D., Das, J., Poudineh, M., Sargent, E. H., & Kelley, S. O. ―Optimized
Templates for Bottom-Up Growth of High-Performance Integrated Biomolecular
Detectors.‖ Lab on a Chip 13, 2569-75 (2013)
4.1 Abstract
Electrochemical deposition of metals represents an important approach in the bottom-up
fabrication of nanostructures and microstructures. We have used this approach to generate high-
performance chip-based biosensors using silicon as a platform for the generation of sensor
arrays. Here, we explore the applicability of different materials to support the electrodeposition
and identify the parameters that are essential for robust sensor growth. We show that inexpensive
materials can be used as templates for electrodeposition, and demonstrate that these low-cost
sensors exhibit clinically-relevant levels of sensitivity and specificity. In particular, we prove
herein that the glass-based sensors successfully detect E. coli in urine, when present at the 100
cfu μL−1
levels found typically in samples of patients with urinary tract infections.
47
4.2 Introduction
Chip-based biosensors are an important class of tools for integrated biomolecular detection
devices, and enable specific identification of clinically-relevant biomarkers [1-8]. Sensors that
read out protein, nucleic acid or small molecular biomarkers can be used to classify disease states
or monitor progression. A variety of readout methods have been used in conjunction with chip-
based sensors, including colorimetric [7,9], fluorescence [3,10], electronic [8,11] and
electrochemical approaches [4, 12-17].
A key limitation of chip-based sensors relates to efficient capture of molecular analytes [18-20].
Generating a detectable signal requires a collision between a molecule of interest and a sensor
that is able to capture and detect the molecule. Unfortunately, collisional frequencies achieved
with planar sensors can be low. We recently reported a solution to this limitation, one that relies
on the fabrication of microscale three-dimensional electrodeposited structures sensors that enable
efficient capture and readout of slow-moving mRNA molecules [21]. Electrodeposition is one of
the few approaches available that permits the production of large (>50 micron) structures that are
three-dimensional, and has the added advantage of producing tunable surface morphology at the
nanoscale [22-23]. We have used these features of nanostructured microelectrodes (NMEs) to
control dynamic range, and have also shown that a combination of structural features on the
nano- and microscale are essential for attaining clinically-relevant levels of sensitivity [21,22].
Templated electrodeposition is widely used in the generation of nanostructured surfaces,
nanowires, and nanoparticles, and its tunability has been exploited to tailor the sizes and shapes
of these nanomaterials [24-29]. Less work has been done, however, on the growth of three-
dimensional microscale structures that are produced using this technique. The properties of the
base substrate, the material used for templating, and the size and shape of the aperture used as a
template could all have an effect on the resultant structure and its performance. Our previous
work leveraged electrodeposition to produce nanostructured microelectrodes-structures
composed of gold or palladium that were coated with a nanostructured layer of palladium. In
prior studies, we explored how nanostructuring and sensor size affect sensor performance, but
did not investigate the tolerance of the approach to different chip structures and substrates [16,
21-23]. Here, we investigate a variety of materials – including glass, plastic and printed circuit
board as substrates – and evaluate their performance. We identify the critical features that a
48
material must have to support the electrodeposition of microscale structures. Using low-cost-
substrates identified during this study, we demonstrate that high levels of sensitivity and
specificity are maintained by the sensors, and we explore the relationship between template
properties and sensor morphology.
4.3 Materials and Methods
Silicon chip fabrication
Chips were fabricated by Advanced Micro Sensors (Shrewsbury, MA) on the surface of 6′′
diameter 300 μm thick prime silicon wafers obtained from Silicon Valley Microelectronics
(Santa Clara, CA). Wafers were first passivated with a 1 μm layer of thermal SiO2 to isolate the
sensing electrodes. Using positive photoresist a lift-off layer was patterned on the surface of the
oxide. A metal layer consisting of 5 nm Ti followed by 50 nm Au was evaporated onto the
surface, followed by lift-off to create the sensing electrode layer. A SiO2 passivating layer was
deposited on the surface using Plasma Enhanced Chemical Vapor Deposition. Using positive
photoresist an aperture etch mask was patterned on the surface and 5 μm apertures were etched
into the SiO2 layer using hydrofluoric acid. Fabrication of nanostructured microelectrodes
(NMEs) on the surface was done by electroplating in a solution of 20 mM HAuCl4 and 0.5 M
HCl at a constant potential of 0 mV for 90 s. A finely nanostructured Pd coating was
electroplated by using a solution of 5 mM PdCl2 and 0.5 M HClO4 at a constant potential of
−250 mV for 10 s.
Printed circuit board chip and nme fabrication
PCB chips were fabricated by Omega Circuits (Toronto, ON) on the surface of standard FR-4
fiberglass board. Boards were pre-coated with copper foil. A shadowmask is first laminated onto
the surface of the board and patterned in similar fashion to positive photolithography, but
achieving less fine resolution (e.g. typical critical dimensions on the 10–20 μm lengthscale).
Boards are immersed in a copper etchant to create the sensing electrode layer. Soldermask is
applied to the surface of the board, and acts as an aperture layer similar to the silicon chips. The
soldermask is patterned in a similar fashion to negative photoresist and apertures 40 μm in
diameter were created in the aperture layer. Individual PCB chips are machined from the board
using an auto router. Corrosion of the Cu layer immediately occurs in above plating solution. An
49
alternative plating method utilizes a Ni protection layer from electroplating in 200 mM
NiSO4 and 0.5 M HBO3 at −850 mV for 1 h followed by an Au electrode layer from
electroplating in 20 mM HAuCl4 and 0.5 M NaOH at −400 mV for 60 s. A second alternative
method utilized a Au sulfite protection layer by electroplating in a gold sulfite solution obtained
from Transene Inc (Danvers, MA) at −500 mV for 1 h followed by an Au electrode layer from
electroplating in 20 mM HAuCl4 and 0.5 M HCl at 0 mV for 90 s.
Plastic chip and nme fabrication
Plastic chips were fabricated by MiniFAB (Scoresby, AUS) on the surface of fluorinated
eythlene polymer (FEP) film. Sensing electrodes were printed on the surface of the film using a
colloidal gold ink. Chips were made on flexible FEP film which is not suitable for spin coating,
hence we first adhered them to glass to act as a rigid substrate. We spun a negative photoresist
SU-8 3005 (3000 rpm, 30 s) to create the aperture layer, which is patterned using contact
lithography to create apertures 40 μm in diameter. Better resolution was not achievable because
the substrate is not perfectly rigid and the contact of the mask to the surface is not optimal.
Fabrication of NMEs on the surface was done by electroplating in a solution of 20 mM
HAuCl4 and 0.5 M HCl at a constant potential of 0 mV for 90 s.
Glass chip fabrication
Glass chips were fabricated in-house utilizing substrates obtained from Telic Company
(Valencia, CA) that were pre-coated with 5 nm Cr – 50 nm Au and AZ1600 positive photoresist.
Sensing electrodes were patterned using standard contact lithography and etched using Au and
Cr wet etchants followed by removal of the positive photoresist etchant mask. We spin-coated a
negative photoresist SU-8 2002 (5000 rpm, 30 s) to create the aperture layer, and is patterned
using contact lithography to create apertures 5 μm in diameter. Shipley 1811 positive photoresist
was spun on the surface and patterned to create the plasma etch well layer. Chips were diced in
house using a standard glass cutter. Fabrication of NMEs on the surface was done by
electroplating in a solution of 20 mM HAuCl4 and 0.5 M HCl at a constant potential of 0 mV for
90 s. A fine nanostructured Pd coating was electroplated by using a solution of 5 mM PdCl2 and
0.5 M HClO4 at a constant potential of −250 mV for 10 s.
Synthesis and purification of peptide nucleic acid

50
In-house synthesis of peptide nucleic acid (PNA) probes was carried out using a Protein
Technologies Prelude peptide synthesizer. The following probe sequences specific to mRNA
targets were utilized for detection: NH2-Cys-Gly-Asp-ATC TGC TCT GTG GTG TAG TT-Asp-
CONH2 (E. coli), NH2-Cys-Gly-Asp-CCC GGG GAT TTC ACA TCC AAC TT-Asp-CONH2 (P.
aergugin.), NH2-Cys-Gly-Asp-CGA CAC CCG AAA GCG CC TTT-Asp-CONH2 (E. faecalis.)
and NH2-Cys-Gly-Asp-CCA CAC ATC TTA TCA CCA AC-Asp-CONH2 (S. aureus). All probes
were stringently purified by reverse phase high performance liquid chromatography. Probe
sequences were quantified by measuring absorbance at 260 nm with a NanoDrop and excitation
coefficients were calculated from http://www.panagene.com
Bacterial samples and lysis
Escherichia coli was acquired from Invitrogen (18265-017). E. coli was grown in LB-Broth
medium in an incubating shaker at 37 °C. After growth to the desired population the growth
media was replaced with 1× PBS. Total RNA was extracted utilizing an Invitrogen Purelink
Total RNA Extraction Kit (12183020) and quantified with the NanoDrop. Lysis of bacteria was
performed utilizing a Claremont BioSolutions OmniLyse rapid cell lysis kit. Human urine
samples were obtained from Bioreclamation (Westbury, NY) and were spiked with E. coli prior
to lysis.
G. Electrochemical measurements
Electrochemical measurements were performed using a BASi EC Epsilon potentiostat in a
standard 3-electrode configuration with a Ag/AgCl reference and Pt counter electrode. Acid etch
scans were performed in 50 mM H2SO4 in H2O. Electrocatalytic solutions contained 10μM
Ru(NH3)63+
and 4 mM Fe(CN)63-
in a 0.1× PBS buffer solution. Electrocatalytic solutions were
purged with N2 gas for 5 min prior to electrochemical scans. Differential pulse voltammetry
(DPV) was utilized to scan before and after hybridization signals.
Functionalization and hybridization protocol
Electrodes were functionalized with 100 nM of the designated probe and 900 nM
mercaptohexanol for 30 min at room temperature. Chips were washed 2 × 5min with 0.1× PBS
buffer after probe deposition and sample hybridization. After washing DPV measurements were
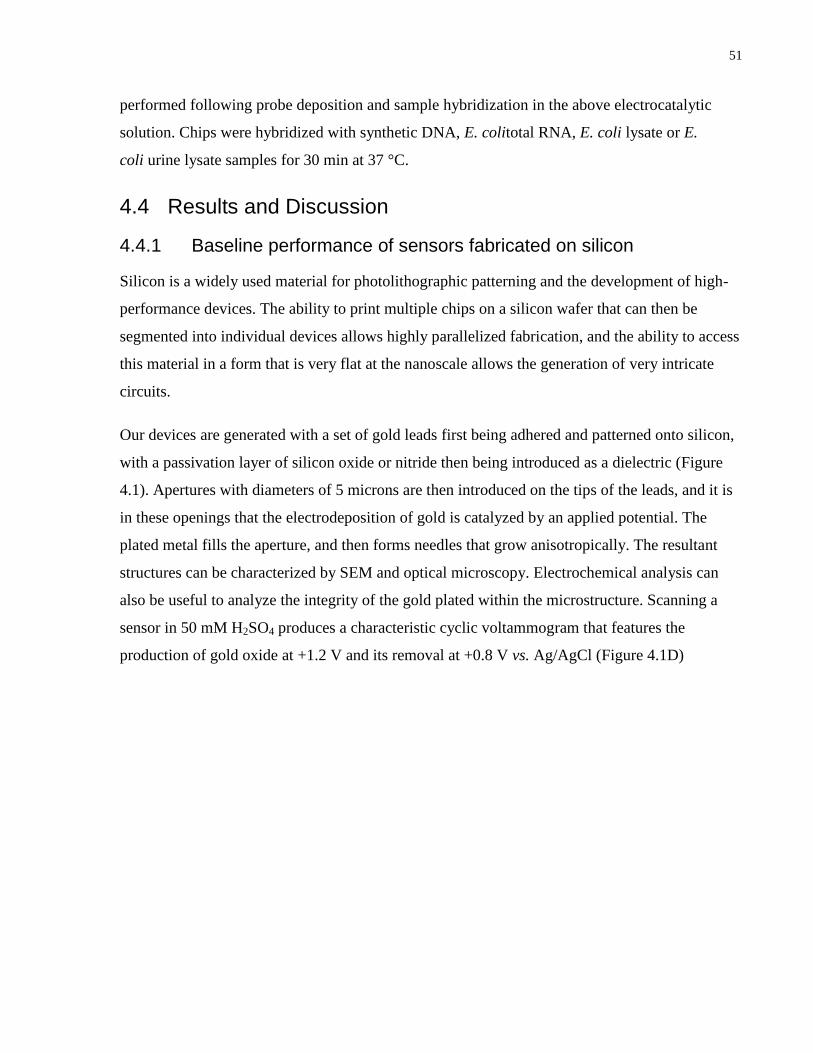
51
performed following probe deposition and sample hybridization in the above electrocatalytic
solution. Chips were hybridized with synthetic DNA, E. colitotal RNA, E. coli lysate or E.
coli urine lysate samples for 30 min at 37 °C.
4.4 Results and Discussion
4.4.1 Baseline performance of sensors fabricated on silicon
Silicon is a widely used material for photolithographic patterning and the development of high-
performance devices. The ability to print multiple chips on a silicon wafer that can then be
segmented into individual devices allows highly parallelized fabrication, and the ability to access
this material in a form that is very flat at the nanoscale allows the generation of very intricate
circuits.
Our devices are generated with a set of gold leads first being adhered and patterned onto silicon,
with a passivation layer of silicon oxide or nitride then being introduced as a dielectric (Figure
4.1). Apertures with diameters of 5 microns are then introduced on the tips of the leads, and it is
in these openings that the electrodeposition of gold is catalyzed by an applied potential. The
plated metal fills the aperture, and then forms needles that grow anisotropically. The resultant
structures can be characterized by SEM and optical microscopy. Electrochemical analysis can
also be useful to analyze the integrity of the gold plated within the microstructure. Scanning a
sensor in 50 mM H2SO4 produces a characteristic cyclic voltammogram that features the
production of gold oxide at +1.2 V and its removal at +0.8 V vs. Ag/AgCl (Figure 4.1D)
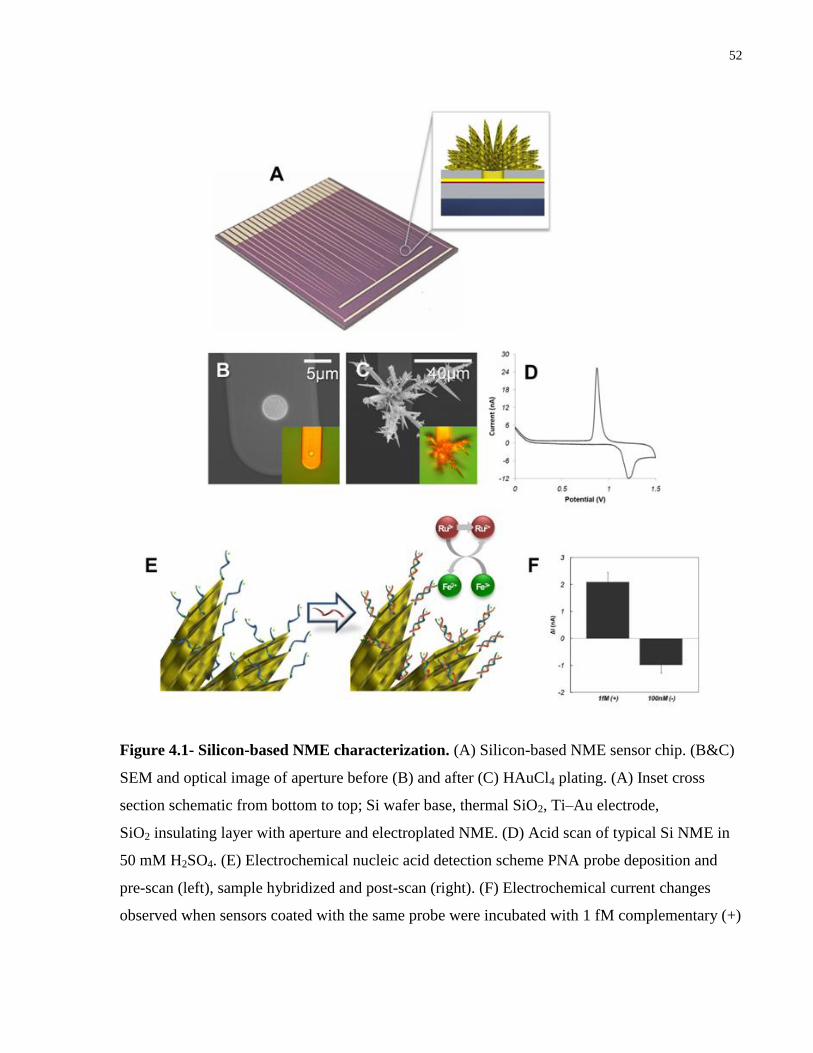
52
Figure 4.1- Silicon-based NME characterization. (A) Silicon-based NME sensor chip. (B&C)
SEM and optical image of aperture before (B) and after (C) HAuCl4 plating. (A) Inset cross
section schematic from bottom to top; Si wafer base, thermal SiO2, Ti–Au electrode,
SiO2 insulating layer with aperture and electroplated NME. (D) Acid scan of typical Si NME in
50 mM H2SO4. (E) Electrochemical nucleic acid detection scheme PNA probe deposition and
pre-scan (left), sample hybridized and post-scan (right). (F) Electrochemical current changes
observed when sensors coated with the same probe were incubated with 1 fM complementary (+)
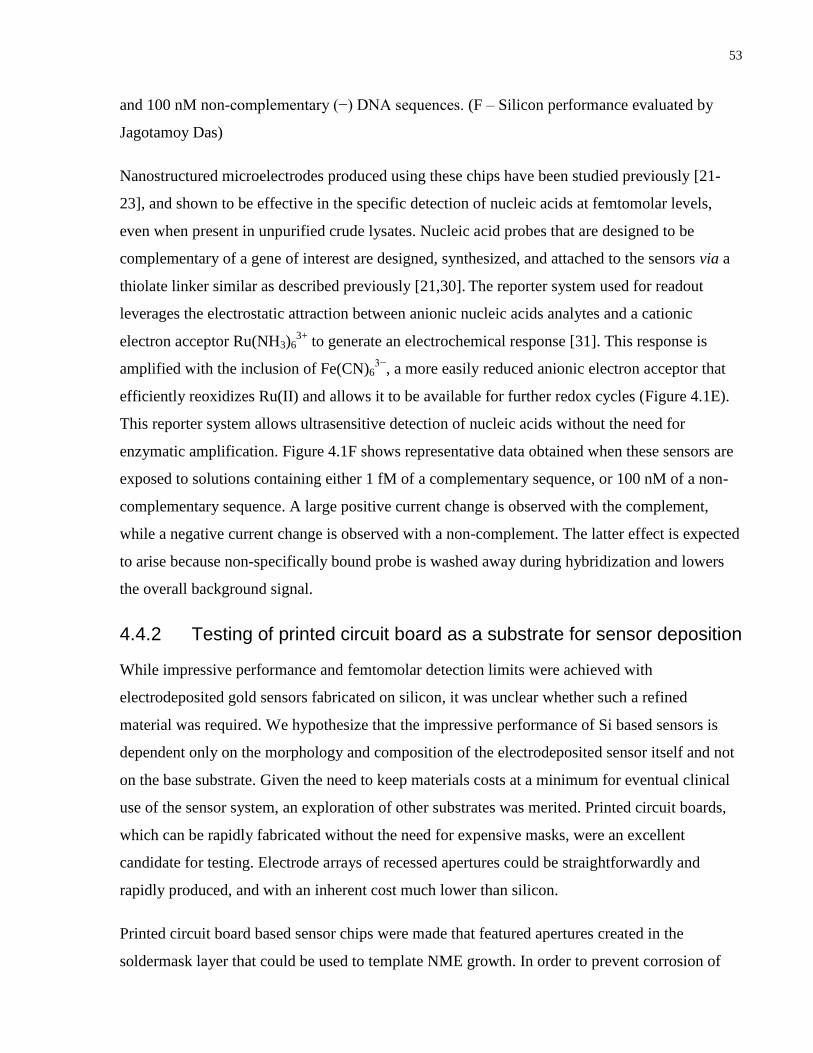
53
and 100 nM non-complementary (−) DNA sequences. (F – Silicon performance evaluated by
Jagotamoy Das)
Nanostructured microelectrodes produced using these chips have been studied previously [21-
23], and shown to be effective in the specific detection of nucleic acids at femtomolar levels,
even when present in unpurified crude lysates. Nucleic acid probes that are designed to be
complementary of a gene of interest are designed, synthesized, and attached to the sensors via a
thiolate linker similar as described previously [21,30]. The reporter system used for readout
leverages the electrostatic attraction between anionic nucleic acids analytes and a cationic
electron acceptor Ru(NH3)63+
to generate an electrochemical response [31]. This response is
amplified with the inclusion of Fe(CN)63−
, a more easily reduced anionic electron acceptor that
efficiently reoxidizes Ru(II) and allows it to be available for further redox cycles (Figure 4.1E).
This reporter system allows ultrasensitive detection of nucleic acids without the need for
enzymatic amplification. Figure 4.1F shows representative data obtained when these sensors are
exposed to solutions containing either 1 fM of a complementary sequence, or 100 nM of a non-
complementary sequence. A large positive current change is observed with the complement,
while a negative current change is observed with a non-complement. The latter effect is expected
to arise because non-specifically bound probe is washed away during hybridization and lowers
the overall background signal.
4.4.2 Testing of printed circuit board as a substrate for sensor deposition
While impressive performance and femtomolar detection limits were achieved with
electrodeposited gold sensors fabricated on silicon, it was unclear whether such a refined
material was required. We hypothesize that the impressive performance of Si based sensors is
dependent only on the morphology and composition of the electrodeposited sensor itself and not
on the base substrate. Given the need to keep materials costs at a minimum for eventual clinical
use of the sensor system, an exploration of other substrates was merited. Printed circuit boards,
which can be rapidly fabricated without the need for expensive masks, were an excellent
candidate for testing. Electrode arrays of recessed apertures could be straightforwardly and
rapidly produced, and with an inherent cost much lower than silicon.
Printed circuit board based sensor chips were made that featured apertures created in the
soldermask layer that could be used to template NME growth. In order to prevent corrosion of
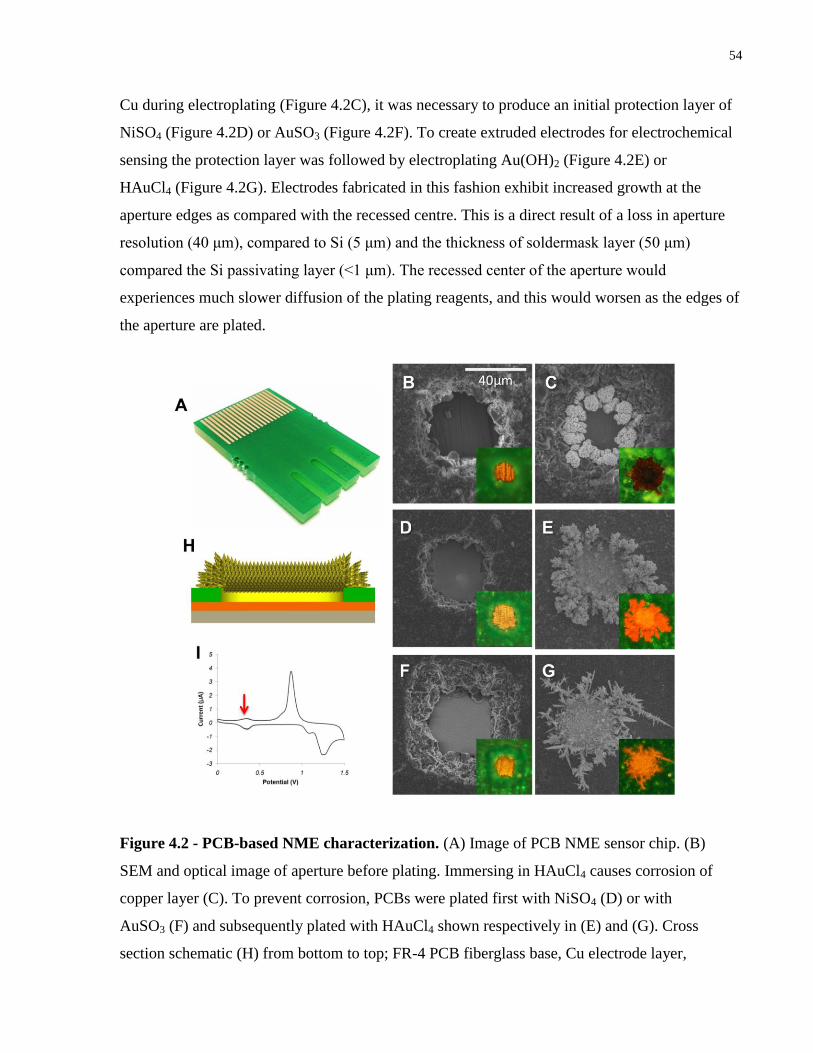
54
Cu during electroplating (Figure 4.2C), it was necessary to produce an initial protection layer of
NiSO4 (Figure 4.2D) or AuSO3 (Figure 4.2F). To create extruded electrodes for electrochemical
sensing the protection layer was followed by electroplating Au(OH)2 (Figure 4.2E) or
HAuCl4 (Figure 4.2G). Electrodes fabricated in this fashion exhibit increased growth at the
aperture edges as compared with the recessed centre. This is a direct result of a loss in aperture
resolution (40 μm), compared to Si (5 μm) and the thickness of soldermask layer (50 μm)
compared the Si passivating layer (<1 μm). The recessed center of the aperture would
experiences much slower diffusion of the plating reagents, and this would worsen as the edges of
the aperture are plated.
Figure 4.2 - PCB-based NME characterization. (A) Image of PCB NME sensor chip. (B)
SEM and optical image of aperture before plating. Immersing in HAuCl4 causes corrosion of
copper layer (C). To prevent corrosion, PCBs were plated first with NiSO4 (D) or with
AuSO3 (F) and subsequently plated with HAuCl4 shown respectively in (E) and (G). Cross
section schematic (H) from bottom to top; FR-4 PCB fiberglass base, Cu electrode layer,
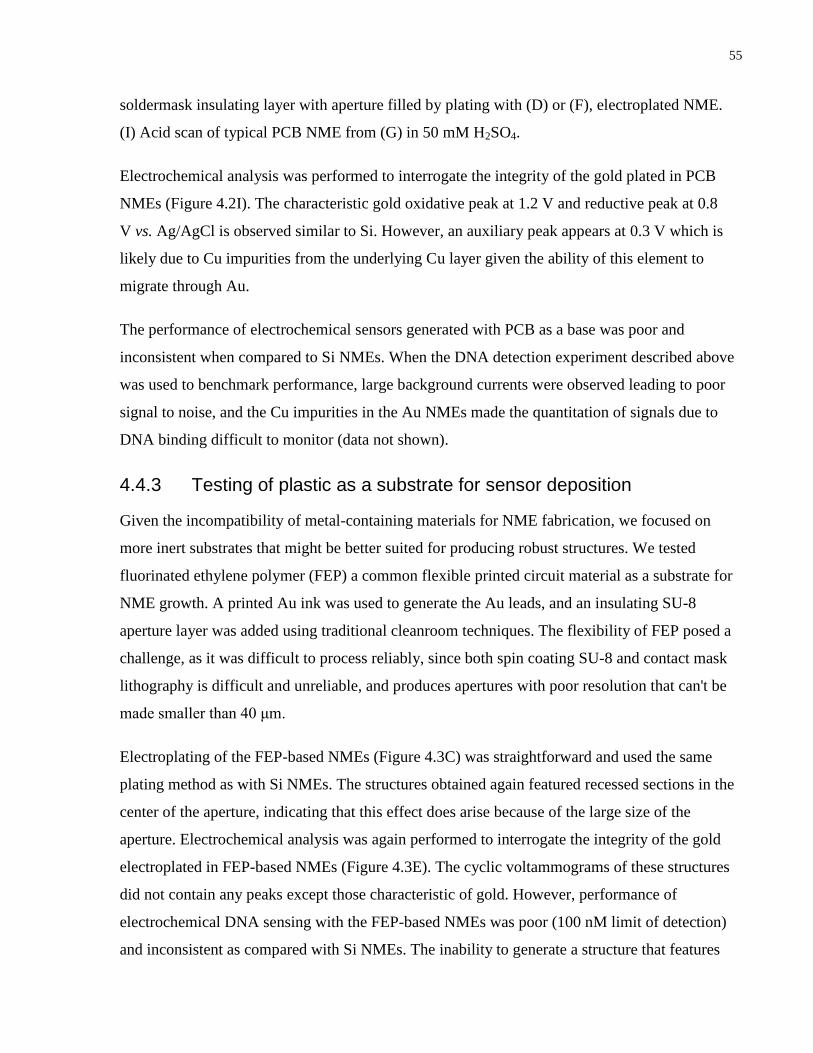
55
soldermask insulating layer with aperture filled by plating with (D) or (F), electroplated NME.
(I) Acid scan of typical PCB NME from (G) in 50 mM H2SO4.
Electrochemical analysis was performed to interrogate the integrity of the gold plated in PCB
NMEs (Figure 4.2I). The characteristic gold oxidative peak at 1.2 V and reductive peak at 0.8
V vs. Ag/AgCl is observed similar to Si. However, an auxiliary peak appears at 0.3 V which is
likely due to Cu impurities from the underlying Cu layer given the ability of this element to
migrate through Au.
The performance of electrochemical sensors generated with PCB as a base was poor and
inconsistent when compared to Si NMEs. When the DNA detection experiment described above
was used to benchmark performance, large background currents were observed leading to poor
signal to noise, and the Cu impurities in the Au NMEs made the quantitation of signals due to
DNA binding difficult to monitor (data not shown).
4.4.3 Testing of plastic as a substrate for sensor deposition
Given the incompatibility of metal-containing materials for NME fabrication, we focused on
more inert substrates that might be better suited for producing robust structures. We tested
fluorinated ethylene polymer (FEP) a common flexible printed circuit material as a substrate for
NME growth. A printed Au ink was used to generate the Au leads, and an insulating SU-8
aperture layer was added using traditional cleanroom techniques. The flexibility of FEP posed a
challenge, as it was difficult to process reliably, since both spin coating SU-8 and contact mask
lithography is difficult and unreliable, and produces apertures with poor resolution that can't be
made smaller than 40 μm.
Electroplating of the FEP-based NMEs (Figure 4.3C) was straightforward and used the same
plating method as with Si NMEs. The structures obtained again featured recessed sections in the
center of the aperture, indicating that this effect does arise because of the large size of the
aperture. Electrochemical analysis was again performed to interrogate the integrity of the gold
electroplated in FEP-based NMEs (Figure 4.3E). The cyclic voltammograms of these structures
did not contain any peaks except those characteristic of gold. However, performance of
electrochemical DNA sensing with the FEP-based NMEs was poor (100 nM limit of detection)
and inconsistent as compared with Si NMEs. The inability to generate a structure that features
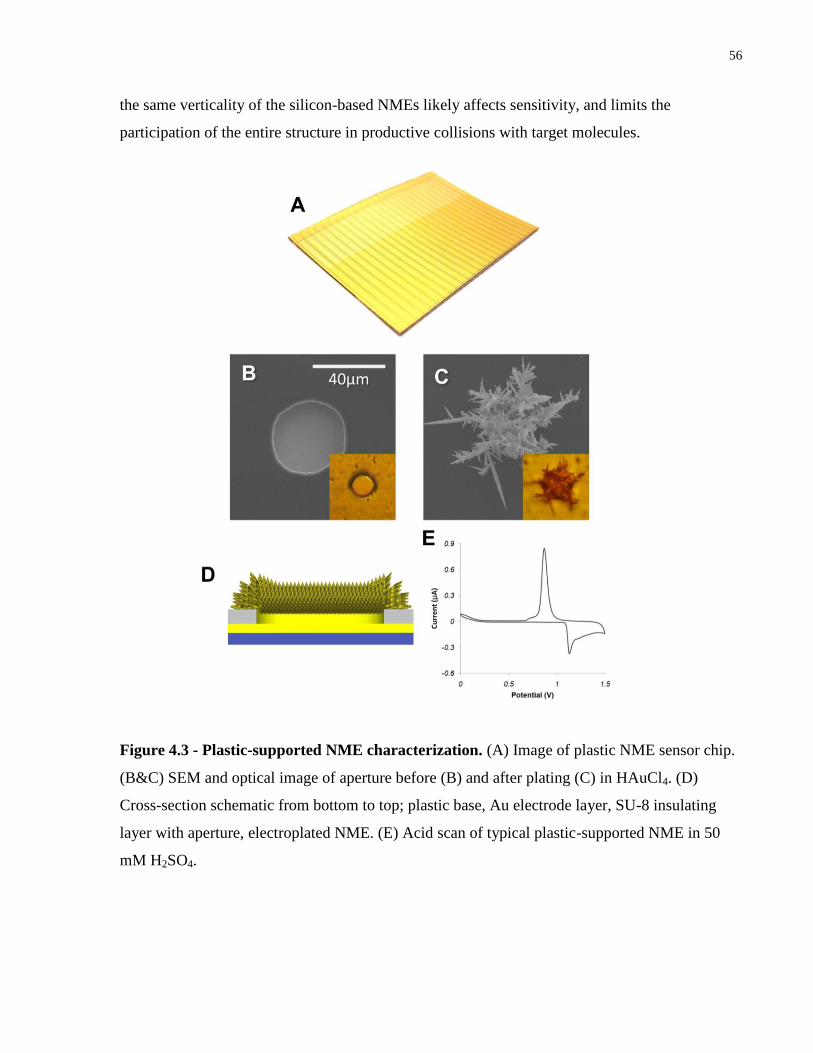
56
the same verticality of the silicon-based NMEs likely affects sensitivity, and limits the
participation of the entire structure in productive collisions with target molecules.
Figure 4.3 - Plastic-supported NME characterization. (A) Image of plastic NME sensor chip.
(B&C) SEM and optical image of aperture before (B) and after plating (C) in HAuCl4. (D)
Cross-section schematic from bottom to top; plastic base, Au electrode layer, SU-8 insulating
layer with aperture, electroplated NME. (E) Acid scan of typical plastic-supported NME in 50
mM H2SO4.
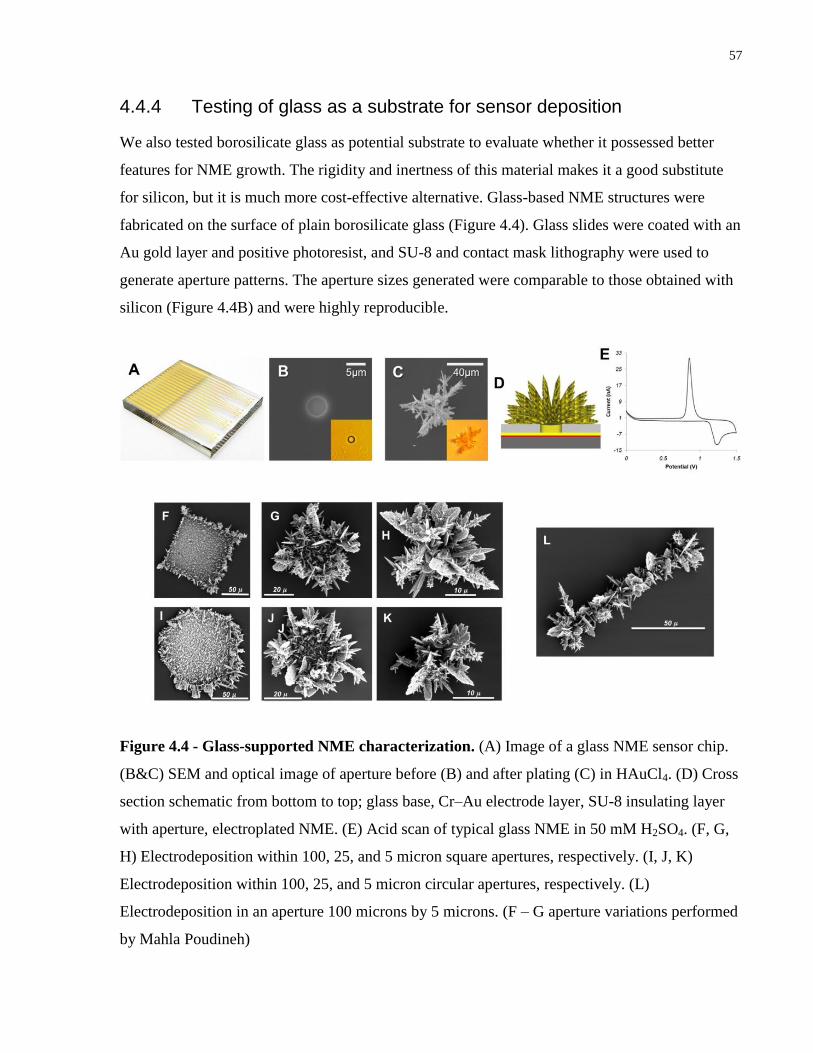
57
4.4.4 Testing of glass as a substrate for sensor deposition
We also tested borosilicate glass as potential substrate to evaluate whether it possessed better
features for NME growth. The rigidity and inertness of this material makes it a good substitute
for silicon, but it is much more cost-effective alternative. Glass-based NME structures were
fabricated on the surface of plain borosilicate glass (Figure 4.4). Glass slides were coated with an
Au gold layer and positive photoresist, and SU-8 and contact mask lithography were used to
generate aperture patterns. The aperture sizes generated were comparable to those obtained with
silicon (Figure 4.4B) and were highly reproducible.
Figure 4.4 - Glass-supported NME characterization. (A) Image of a glass NME sensor chip.
(B&C) SEM and optical image of aperture before (B) and after plating (C) in HAuCl4. (D) Cross
section schematic from bottom to top; glass base, Cr–Au electrode layer, SU-8 insulating layer
with aperture, electroplated NME. (E) Acid scan of typical glass NME in 50 mM H2SO4. (F, G,
H) Electrodeposition within 100, 25, and 5 micron square apertures, respectively. (I, J, K)
Electrodeposition within 100, 25, and 5 micron circular apertures, respectively. (L)
Electrodeposition in an aperture 100 microns by 5 microns. (F – G aperture variations performed
by Mahla Poudineh)
58
Electroplating of glass-based NMEs (Figure 4.4C) was performed using the same protocol
needed to produce Si-based NMEs, and structures were produced that exhibited similar sizes and
morphologies. Electrochemistry was again used to investigate the integrity of the Au
electroplated in glass NMEs (Figure 4.4E), and the expected scans were obtained reflecting pure
Au NMEs.
We also investigated the role of aperture size and shape on the morphology of glass NME
structures (Figure 4.4F–4.4L). We observed that structures with larger aperture size 25 μm or
greater exhibit edge effects and recessed interiors, regardless if the aperture is square or circular
(Figure 4.4F, 4.4G, 4.4I, 4.4J). As aperture size is decreased to 5 μm (Figure 4.4H, 4.4K), edge
effects are no longer an issue and structures protrude in a more uniform fashion without apparent
recessed areas. Restriction to 5 μm in one-dimension only (Figure 4.4L) is sufficient to eliminate
the edge effect, where electrodes protrude in a uniform fashion along the lateral direction.
4.4.5 Validation of clinically-relevant sensitivity and specificity using glass chips
Given that glass appeared to support the growth of structures that were physically and
electrochemically indistinguishable from those made on silicon, we evaluated the performance of
the NMEs when challenged with synthetic oligonucleotides, and crude E. coli lysates in buffer
and urine. These experiments were performed with different types of sensors that target different
bacterial organisms: E. coli, E. faecalis, S. aureus, or P. aeruginosa. In any given trial, E.
coli sensors were tested alongside two types of non-target sensors in order to assess specificity
(Figure 4.5). Excellent sensitivity and specificity was observed, indicating that the glass-based
sensors are comparable to those originally generated on silicon.
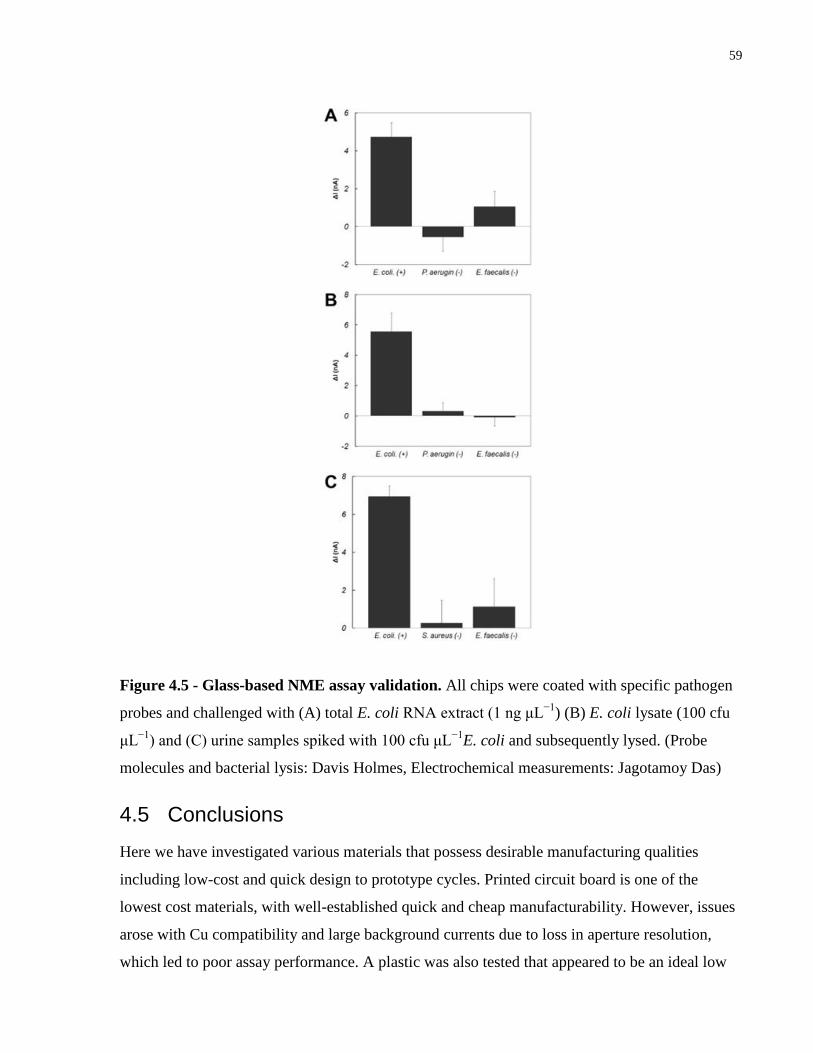
59
Figure 4.5 - Glass-based NME assay validation. All chips were coated with specific pathogen
probes and challenged with (A) total E. coli RNA extract (1 ng μL−1
) (B) E. coli lysate (100 cfu
μL−1
) and (C) urine samples spiked with 100 cfu μL−1
E. coli and subsequently lysed. (Probe
molecules and bacterial lysis: Davis Holmes, Electrochemical measurements: Jagotamoy Das)
4.5 Conclusions
Here we have investigated various materials that possess desirable manufacturing qualities
including low-cost and quick design to prototype cycles. Printed circuit board is one of the
lowest cost materials, with well-established quick and cheap manufacturability. However, issues
arose with Cu compatibility and large background currents due to loss in aperture resolution,
which led to poor assay performance. A plastic was also tested that appeared to be an ideal low
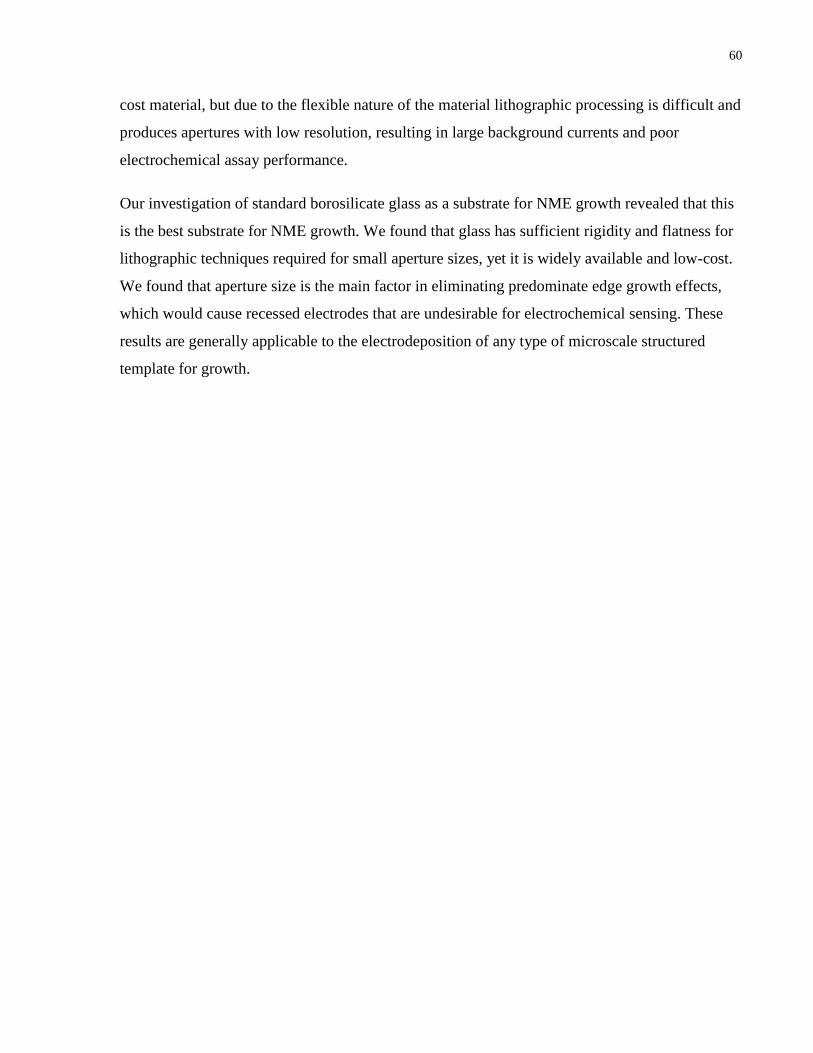
60
cost material, but due to the flexible nature of the material lithographic processing is difficult and
produces apertures with low resolution, resulting in large background currents and poor
electrochemical assay performance.
Our investigation of standard borosilicate glass as a substrate for NME growth revealed that this
is the best substrate for NME growth. We found that glass has sufficient rigidity and flatness for
lithographic techniques required for small aperture sizes, yet it is widely available and low-cost.
We found that aperture size is the main factor in eliminating predominate edge growth effects,
which would cause recessed electrodes that are undesirable for electrochemical sensing. These
results are generally applicable to the electrodeposition of any type of microscale structured
template for growth.
61
4.6 References
1. Washburn, A. L. & Bailey, R. C. Photonics-on-a-chip: recent advances in integrated
waveguides as enabling detection elements for real-world, lab-on-a-chip biosensing
applications. The Analyst 136, 227–36 (2011).
2. Balasubramanian, K. Challenges in the use of 1D nanostructures for on-chip biosensing and
diagnostics: a review. Biosensors & bioelectronics 26, 1195–204 (2010).
3. Walt, D. R. Chemistry. Miniature analytical methods for medical diagnostics. Science (New
York, N.Y.) 308, 217–9 (2005).
4. Cederquist, K. B. & Kelley, S. O. Nanostructured biomolecular detectors: pushing
performance at the nanoscale. Current opinion in chemical biology 16, 415–21 (2012).
5. Rosi, N. L. & Mirkin, C. a Nanostructures in biodiagnostics. Chemical reviews 105, 1547–62
(2005).
6. Hianik, T. & Wang, J. Electrochemical Aptasensors - Recent Achievements and Perspectives.
Electroanalysis 21, 1223–1235 (2009).
7. Giljohann, D. a et al. Gold nanoparticles for biology and medicine. Angewandte Chemie
(International ed. in English) 49, 3280–94 (2010).
8. Sapsford, K. E., Francis, J., Sun, S., Kostov, Y. & Rasooly, A. Miniaturized 96-well ELISA
chips for staphylococcal enterotoxin B detection using portable colorimetric detector.
Analytical and bioanalytical chemistry 394, 499–505 (2009).
9. Park, C. H. et al. A Direct, Multiplex Biosensor Platform for Pathogen Detection Based on
Cross-linked Polydiacetylene (PDA) Supramolecules. Advanced Functional Materials 19,
3703–3710 (2009).
10. Duan, X. et al. Quantification of the affinities and kinetics of protein interactions using
silicon nanowire biosensors. Nature nanotechnology 7, 401–7 (2012).
11. Alligrant, T. M., Nettleton, E. G. & Crooks, R. M. Electrochemical detection of individual
DNA hybridization events. Lab on a chip 13, 349–54 (2013).

62
12. Slinker, J. D., Muren, N. B., Gorodetsky, A. A. & Barton, J. K. Multiplexed DNA-
modified electrodes. J. Am. Chem. Soc. 132, 2769–2774 (2010).
13. Xiao, Y., Lubin, A. a, Baker, B. R., Plaxco, K. W. & Heeger, A. J. Single-step electronic
detection of femtomolar DNA by target-induced strand displacement in an electrode-
bound duplex. Proceedings of the National Academy of Sciences of the United States of
America 103, 16677–80 (2006).
14. Malhotra, R., Patel, V., Vaqué, J. P., Gutkind, J. S. & Rusling, J. F. Ultrasensitive
electrochemical immunosensor for oral cancer biomarker IL-6 using carbon nanotube
forest electrodes and multilabel amplification. Anal. Chem. 82, 3118–3123 (2010).
15. Das, J. & Kelley, S. O. Protein detection using arrayed microsensor chips: tuning sensor
footprint to achieve ultrasensitive readout of CA-125 in serum and whole blood.
Analytical chemistry 83, 1167–72 (2011).
16. Das, J. et al. An ultrasensitive universal detector based on neutralizer displacement. 4,
(2012).
17. Squires, T. M., Messinger, R. J. & Manalis, S. R. Making it stick: convection, reaction and
diffusion in surface-based biosensors. Nature biotechnology 26, 417–26 (2008).
18. Sheehan, P. E. & Whitman, L. J. Detection limits for nanoscale biosensors. Nano letters 5,
803–7 (2005).
19. Nair, P. R. & Alam, M. a Screening-limited response of nanobiosensors. Nano letters 8,
1281–5 (2008).
20. Soleymani, L. et al. Hierarchical nanotextured microelectrodes overcome the molecular
transport barrier to achieve rapid, direct bacterial detection. ACS nano 5, 3360–6 (2011).
21. Soleymani, L., Fang, Z., Sargent, E. H. & Kelley, S. O. Programming the detection limits
of biosensors through controlled nanostructuring. Nature nanotechnology 4, 844–8 (2009).
22. Bin, X., Sargent, E. H. & Kelley, S. O. Nanostructuring of sensors determines the
efficiency of biomolecular capture. Anal. Chem. 82, 5928–5931 (2010).
63
23. Plowman, B. J., Bhargava, S. K. & O’Mullane, A. P. Electrochemical fabrication of
metallic nanostructured electrodes for electroanalytical applications. Analyst 136, 5107–19
(2011).
24. S. E. Brunker, K. B. C. and C. D. K. Metallic barcodes for multiplexed bioassays.
Nanomedicine 2, 695–710 (2007).
25. Bera, D., Kuiry, S. C. & Seal, S. Synthesis of nanostructured materials using template-
assisted electrodeposition. JOM 56, 49–53 (2004).
26. Bera, D., Kuiry, S. C., Patil, S. & Seal, S. Palladium nanoparticle arrays using template-
assisted electrodeposition. Applied Physics Letters 82, 3089 (2003).
27. Fasol, G. & Runge, K. Selective electrodeposition of nanometer scale magnetic wires.
Applied Physics Letters 70, 2467 (1997).
28. Wang, B. D. et al. Electrodeposition of Metallic Nanowire Thin Films Using Mesoporous
Silica Templates. Advanced Materials 130–133 (2003).
29. Vasilyeva, E. et al. Direct genetic analysis of ten cancer cells: tuning sensor structure and
molecular probe design for efficient mRNA capture. Angewandtbe Chemie (International
ed. in English) 50, 4137–41 (2011).
30. Lapierre, M. a, O’Keefe, M., Taft, B. J. & Kelley, S. O. Electrocatalytic detection of
pathogenic DNA sequences and antibiotic resistance markers. Analytical chemistry 75,
6327–6333 (2003).
64
5 Solution-based circuits enable rapid and multiplexed pathogen detection
An important goal for biosensors is the multiplexed analysis of samples with a single device. For
many applications highly multiplexed analysis would provide valuable utility providing accurate
analysis on a panel of relevant biomarkers. An issue with highly multiplexed electrochemical
sensors is the need for electrical connections to each sensor element. In a serial connection
approach this requires n electrical output connections for n number of sensors. In a parallel
connection approach the number of electrical output connections can be reduced to 2√n, however
this requires the on chip integration of active switching electronics. The goal of my third
manuscript was to develop a passive switching method that is equivalent to resource heavy active
switching electronics. A more in depth description of the method and illustration of the crosstalk
issue is given in the supplementary information.
Disclosure of work within this manuscript; B.L., J.D., R.D.H., L.L., A.S., E.H.S. and S.O.K.
developed the concepts described and designed the experiments; B.L. designed and fabricated
multiplexed chips, B.L. performed electrochemical crosstalk experiments; R.D.H. developed
probes for analysis, R.D.H., L.L. and A.S. validated probes, B.L. and J.D. performed multiplexed
lysate experiments, B.L., J.D., E.H.S. and S.O.K. wrote the manuscript with contributions from
all of the other authors.
Lam, B., Das, J., Holmes, R. D., Live, L., Sage, A., Sargent, E. H., & Kelley, S. O. ―Solution-
Based Circuits Enable Multiplexed, Rapid Pathogen Detection.‖ Nature Communications
4, 2001 (2013)
5.1 Abstract
Electronic readout of markers of disease provides compelling simplicity, sensitivity and
specificity in the detection of small panels of biomarkers in clinical samples; however, the most
important emerging tests for disease, such as infectious disease speciation and antibiotic-
resistance profiling, will need to interrogate samples for many dozens of biomarkers. Electronic
readout of large panels of markers has been hampered by the difficulty of addressing large arrays
of electrode-based sensors on inexpensive platforms. Here we report a new concept—solution-
based circuits formed on chip—that makes highly multiplexed electrochemical sensing feasible

65
on passive chips. The solution-based circuits switch the information-carrying signal readout
channels and eliminate all measurable crosstalk from adjacent, biomolecule-specific
microsensors. We build chips that feature this advance and prove that they analyse unpurified
samples successfully, and accurately classify pathogens at clinically relevant concentrations. We
also show that signature molecules can be accurately read 2 minutes after sample introduction.
5.2 Introduction
Electronic readout of the presence of specific biological molecules in solution represents a
powerful means to detect disease-related markers [1-4]. In particular, highly sensitive and
specific methods have been developed to detect nucleic acids [5-13], proteins [14-18] and small
molecules [19-22], using electrochemical readout, and it has been shown that the robustness of
electrochemistry allows accurate detection to be done in the presence of heterogeneous,
unpurified samples [20, 23-25]. Numerous studies documenting the application of
electrochemical sensing to cancer [17, 23, 26, 27] and infectious disease [25, 28] markers have
illustrated the promise of this strategy for future clinical diagnostics, and the cost-effectiveness
of the simple instrumentation needed for analysis further enhances the appeal of electrochemical
detection for further development [1].
Arrays of serially addressed biosensors can be fabricated to work in conjunction with
electrochemical reporter systems, enabling multiplexing and detection of several analytes
simultaneously [29]. However, the need for independently addressed electrical contacts
corresponding to each sensor, as well as reference and counter electrodes, requires that highly
multiplexed arrays employ an active multiplexing strategy. The additional complexity of
integrated active electronics explains why, before this work, electrochemical biodetection reports
describe studies that employ very low levels of multiplexing [5-29].
Here we create distinct columns of connected biosensors, perpendicular to which we array
distinct rows of electrochemical solution. Using this two-dimensional array of electrodes, we
programme transient, solution-based circuits that permit individual analysis of sensors using
shared contacts. This approach allows a much higher level of multiplexing than was attainable
previously using a small set of contacts. We apply this advance towards the detection of panels
of pathogenic bacteria and antibiotic-resistance markers.
66
5.3 Methods and Materials
Multiplexed chip fabrication
Multiplexed chips were fabricated in house on plain glass substrates obtained from Telic
Company (Valencia, CA). The substrates are precoated with 5 nm Cr followed by 50 nm Au and
positive photoresist (AZ1600). The common WEs were imaged using standard contact
lithography and etched using Au and Cr wet etchants, followed by removal of the positive
photoresist. A negative photoresist SU-8 2002 was spin coated at 5,000 r.p.m. for 30 s and the
aperture layer was imaged into the surface. A positive photoresist S1811 was spin coated on the
surface and imaged to act as a lift-off layer. The AUX/REF electrodes (5 nm Cr–50 nm Au) were
fabricated onto the surface using standard e-beam evaporation followed by lift-off by sonication
in acetone. The probe well layer was created using SU-8 2002 spin coated at 3,000 r.p.m. for
30 s. A thicker liquid channel layer was fabricated with SU-8 3025 at 2,000 r.p.m. for 30 s. A
plasma etch mask layer with openings defined for the probe wells was patterned on the surface
using SPR 7.0 at 2,000 r.p.m. for 30 s. Chips were diced in house using a standard straight edge
scriber. Before electroplating, chips were O2 plasma etched in a Samco-RIE-1C reactive ion
etcher at 15 W for 15 s to create a hydrophilic probe well area. The core structure of the
nanostructured microelectrodes was fabricated by electroplating chips in a solution of 50 mM
HAuCl4 and 0.5 M HCl at 0 mV for 100 s. The nanostructured surface of the nanostructured
microelectrodes was generated by electrodeposition of a Pd coating in a solution of 5 mM PdCl2
and 0.5 HClO4 at −250 mV for 10 s.
Electrochemical chip characterization
Ferricyanide was used to evaluate the electrochemical characteristics of the multiplexed chip.
Standard cyclic voltammetry in 2 mM Fe(CN)63−
in 0.1 × PBS scanned from 50 mV to −300 mV
at 100 mV s−1 versus on-chip Au AUX/REF was performed on the surface of chips of similar
layout that have WEs that are individually addressed versus the multiplexed chips with solution
circuits. In addition, ferricyanide crosstalk was evaluated by filling a single channel with 2 mM
Fe(CN)63−
in 0.1 × PBS and adjacent channels with 0.1 × PBS. Differential pulse voltammetry
from 50 mV to −300 mV was performed in the ferricyanide-containing channel and adjacent
channels without ferricyanide.
67
Spectroscopic chip characterization
The methylene blue crosstalk experiment was performed on the surface of SCCs by first loading
each liquid channel with a solution of 100 μM MB and 50 mM NaCl. Chips were placed in a
humidity chamber where the middle lane WEs and AUX/REF was held under bias for 1 h at
−650 mV, which is a sufficient potential for reduction of MB. The MB in each channel was then
diluted by a factor of 10 and the corresponding absorbance was measured with a ultraviolet–
visible spectrophotometer.
Electrochemical assay crosstalk evaluation
Probe wells on the surface of multiplexed chips were used to functionalize with target-specific
PNA probes. Each well was filled with 1.5 μl of complementary or non-complementary probe
solution initially heated to 60 °C for 5 min, containing 100 nM probe and 900 nM
mercaptohexanol, and was incubated directly on chip for 30 min at room temperature. Chips
were washed with 0.1 × PBS twice for 5 min after probe deposition, and an initial DPV
background scan in electrocatalytic solution (10 μM Ru(NH3)63+
and 4 mM Fe(CN)63−
in a 0.1 ×
PBS) was performed. Chips were then hybridized with 10 nM complementary target in 1 × PBS
for 30 min at 37 °C. Chips were washed with 0.1 × PBS twice for 5 min after target hybridization
and differential pulse voltammetry hybridization scan in electrocatalytic solution was performed.
Identification of pathogen-specific probes
A list of potential probes based on the rpoβ gene sequences of the bacteria under study was first
generated. All sequences were obtained from the NCBI Nucleotide Database. For a given
bacterial sequence, a BLAST search was performed to identify the rpoβ sequence of the most
similar bacterial species that could potentially cross-hybridize. This sequence was retrieved and
aligned with the targeted bacterial sequence using CLUSTALW2. A computer script was used to
identify regions of greatest variability, as they can be used to best differentiate the target species
from non-target species. Potential rpoβ probes that could cross-hybridize with non-target
molecules in patient samples were eliminated first. Other probe characteristics, such as
secondary structure melting temperature, were also analysed to ensure optimal specificity. If

68
suitable probes could not be identified targeting the rpoβ mRNA, then the 16S rRNA
(Morganella morganii, Pseudomonas aeruginosa, Enterobacteria family and universal probe) or
the 28S rRNA (Candida albicans) was used as a target instead.
Synthesis of probes
Synthesis of PNA probes was performed in house using a Protein Technologies Prelude peptide
synthesizer. The following pathogen probe sequences (NH2-Cys-Gly-Asp SEQUENCE Asp-
CONH2) that are specific to mRNA targets were synthesized: E. coli, 5′-ATC-TGC-TCT-GTG-
GTG-TAG-TT-3′; Proteus mirabilis, 5′-AAG-CGA-GCT-AAC-ACA-TCT-AA-3′; S.
saprophyticus, 5′-AAG-TAA-GAC-ATT-GAT-GCA-AT-3′; S. aureus, 5′-CCA-CAC-ATC-
TTA-TCA-CCA-AC-3′; Klebsiella pneumoniae, 5′-GTT-TAG-CCA-CGG-CAG-TAA-CA-3′;
M. morganii, 5′-CGC-TTT-GGT-CCG-AAG-ACA-TTA-T-3′; P. aeruginosa, 5′-CCC-GGG-
GAT-TTC-ACA-TCC-AAC-TT-3′; K. oxytoca, 5′-CCA-GTA-GAT-TCG-TCA-ACA-TA-3′;
Serratia marescens, 5′-TGC-GAG-TAA-CGT-CAA-TTG-ATG-A-3′; Enterococcus faecalis, 5′-
CGA-CAC-CCG-AAA-GCG-CCT-TT-3′; Acinetobacter baumannii, 5′-CGT-CAA-GTC-AGC-
ACG-TAA-TG-3′; Streptococcus pyogenes, 5′-TCT-TGA-CGA-CGG-ATT-TCC-AC-3′;
Streptococcus agalactiae, 5′-GTT-CAG-TAA-CTA-CAG-CAT-AA-3′; Staphylococcus
epidermidis, 5′-AAA-TAA-CTC-ATT-GAG-GCA-AC-3′; Enterobacter cloacae, 5′-TCA-ACG-
TAA-TCT-TTC-GCG-GC-3′; Streptococcus pneumoniae, 5′-GTT-ACG-ACG-CGA-TCT-GGA-
TC-3′; Providencia stuartii, 5′-GCC-AAG-TGC-CAA-TTC-ACC-TAG-3′; C. albicans, 5′-GCT-
ATA-ACA-CAC-AGC-AGA-AG-3′; Chlamydia trachomatis, 5′-TGC-ATT-TGC-CGT-CAA-
CTG-3′; Enterobacteriaceae, 5′-ACT-TTA-TGA-GGT-CCG-CTT-GCT-CT-3′; and Universal
bacteria probe, 5′-GGT-TAC-CTT-GTT-ACG-ACT-T-3′. After synthesis, all probes were
stringently purified using reverse-phase HPLC. Excitation coefficients were calculated from
http://www.panagene.com and concentrations of probe molecules were determined by measuring
absorbance at 260 nm with a NanoDrop spectrophotometer.
Preparation of bacterial samples and lysis
The following bacterial strains were used in this study: K. pneumoniae ATCC 27799, E. coli
K12 ATCC 33876, E. coli Invitrogen 18265-017, S. saprophyticus ATCC 15305, P. aeruginosa
PAO1, E. faecalis ATCC 29212, S. aureus, C. trachomatis and C. albicans. All bacteria were
grown in the appropriate growth media and conditions. Approximate quantification of bacteria
69
was performed by measuring the optical density at 600 nm with an Agilent 8453 ultraviolet–
visible spectrometer. After the desired population was reached, the growth media was replaced
with 1 × PBS. Lysis of bacteria was performed utilizing the Claremont BioSolutions OmniLyse
rapid cell lysis kit.
Probe validation
Probe solutions were initially heated to 60 °C for 5 min before deposition, and contained 100 nM
probe and 900 nM mercaptohexanol. Deposition was carried out for 30 min at room temperature.
Chips were washed with 0.1 × PBS twice for 5 min after probe deposition and chips were then
challenged with a non-complementary oligomer at 100 nM in 1 × PBS for 30 min. Chips were
washed with 0.1 × PBS twice for 5 min, and then an initial non-complementary DPV background
scan was performed in electrocatalytic solution (10 Ru(NH3)63+
and 4 mM Fe(CN)63−
in a 0.1 ×
PBS). Chips were then hybridized with 1 nM complementary target in 1 × PBS for 30 min at
37 °C. Chips were washed with 0.1 × PBS twice for 5 min after target hybridization and a DPV
in electrocatalytic solution was then performed. A similar protocol was followed for lysate
testing. Chips were hybridized with lysates in 1 × PBS for 30 min at 37 °C. Chips were washed
with 0.1 × PBS twice for 5 min after target hybridization and DPV hybridization scan in
electrocatalytic solution was performed.
Multiplexed bacterial lysate experiments
Multiplexed chips for bacterial lysate testing were functionalized with nine probes using nine
probe wells. Probe solutions were initially heated to 60 °C for 5 min, and contained 100 nM
probe and 900 nM mercaptohexanol that was incubated directly on chip for 30 min at room
temperature. Chips were washed with 0.1 × PBS twice for 5 min after probe deposition and an
initial DPV background scan was collected in electrocatalytic solution. Multiplexed chips were
then hybridized with individual and mixed lysates at 100 cells per μl in 1 × PBS for 30 min at
37 °C in a 200-μl volume.
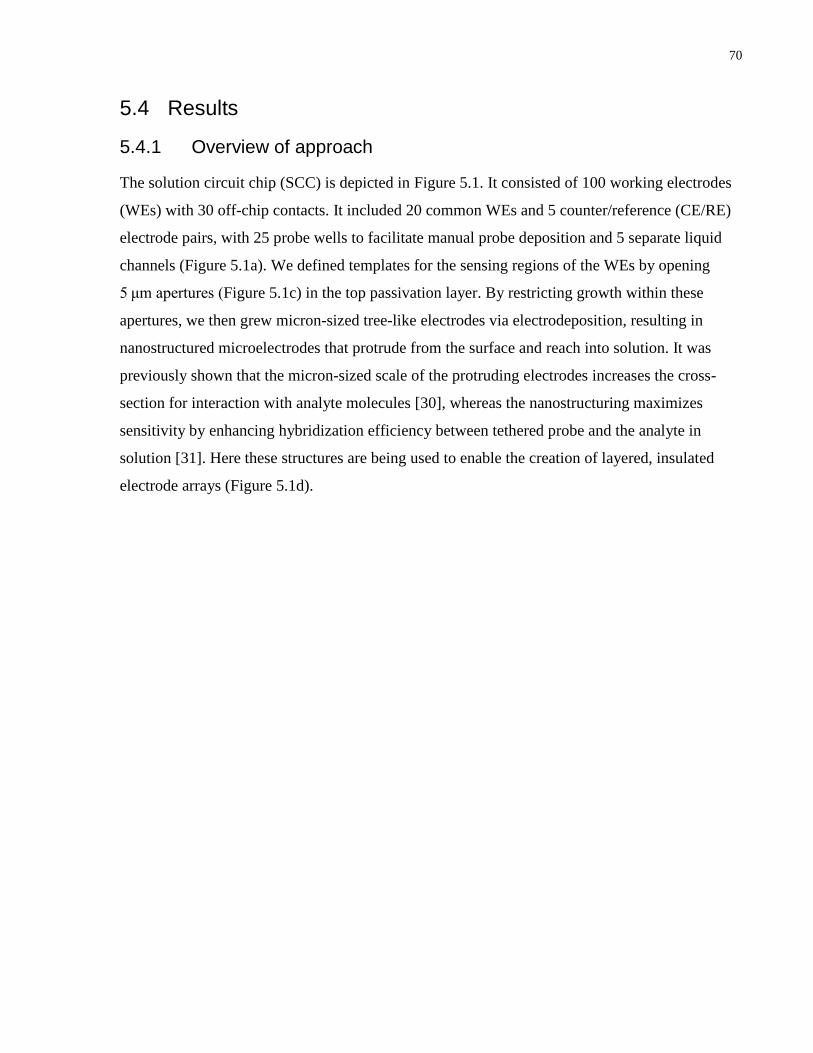
70
5.4 Results
5.4.1 Overview of approach
The solution circuit chip (SCC) is depicted in Figure 5.1. It consisted of 100 working electrodes
(WEs) with 30 off-chip contacts. It included 20 common WEs and 5 counter/reference (CE/RE)
electrode pairs, with 25 probe wells to facilitate manual probe deposition and 5 separate liquid
channels (Figure 5.1a). We defined templates for the sensing regions of the WEs by opening
5 μm apertures (Figure 5.1c) in the top passivation layer. By restricting growth within these
apertures, we then grew micron-sized tree-like electrodes via electrodeposition, resulting in
nanostructured microelectrodes that protrude from the surface and reach into solution. It was
previously shown that the micron-sized scale of the protruding electrodes increases the cross-
section for interaction with analyte molecules [30], whereas the nanostructuring maximizes
sensitivity by enhancing hybridization efficiency between tethered probe and the analyte in
solution [31]. Here these structures are being used to enable the creation of layered, insulated
electrode arrays (Figure 5.1d).
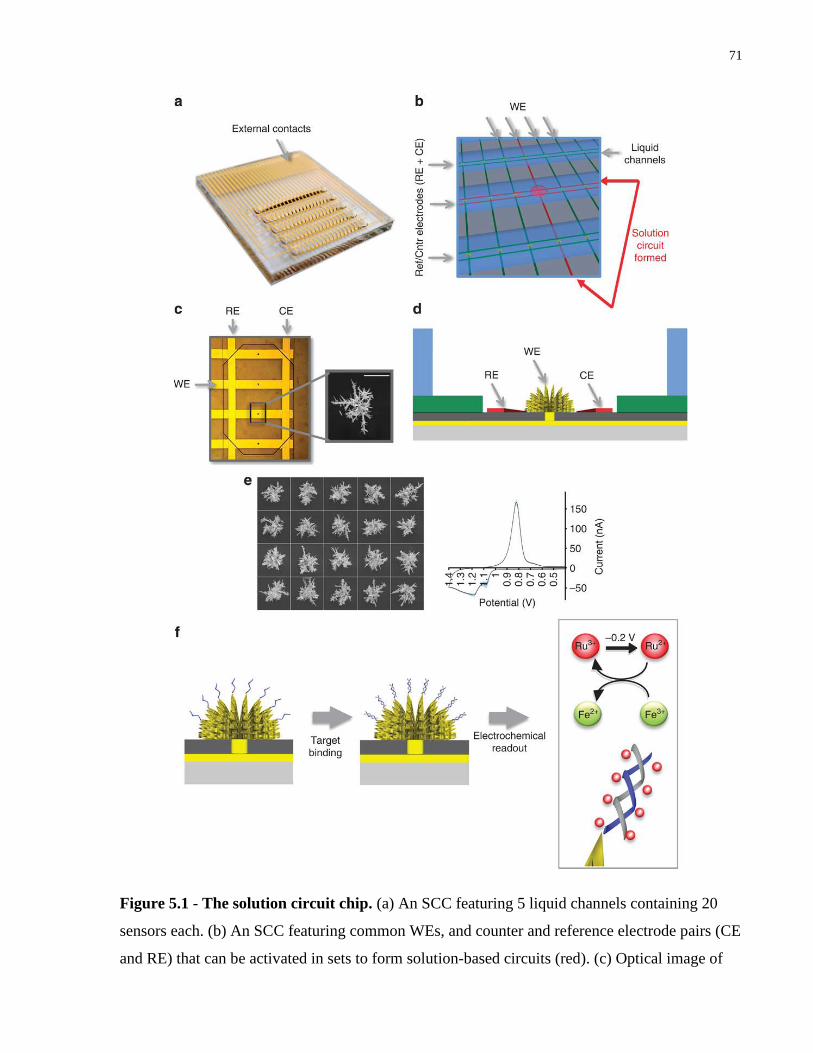
71
Figure 5.1 - The solution circuit chip. (a) An SCC featuring 5 liquid channels containing 20
sensors each. (b) An SCC featuring common WEs, and counter and reference electrode pairs (CE
and RE) that can be activated in sets to form solution-based circuits (red). (c) Optical image of
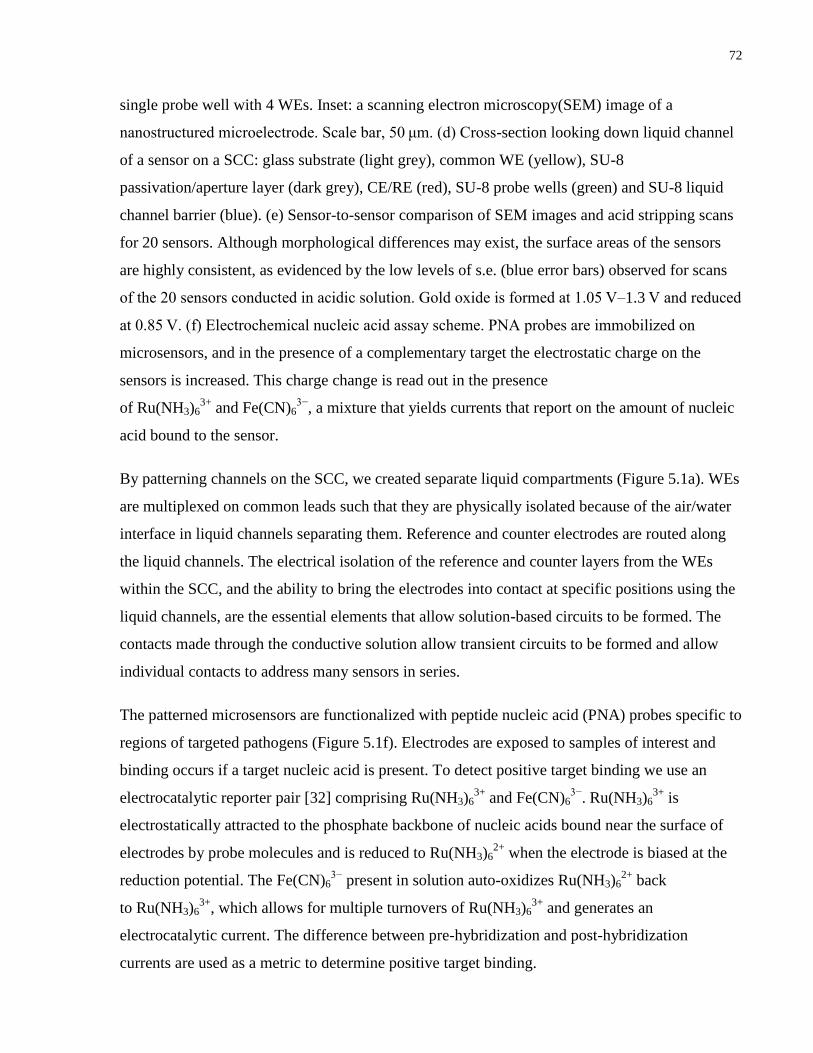
72
single probe well with 4 WEs. Inset: a scanning electron microscopy(SEM) image of a
nanostructured microelectrode. Scale bar, 50 μm. (d) Cross-section looking down liquid channel
of a sensor on a SCC: glass substrate (light grey), common WE (yellow), SU-8
passivation/aperture layer (dark grey), CE/RE (red), SU-8 probe wells (green) and SU-8 liquid
channel barrier (blue). (e) Sensor-to-sensor comparison of SEM images and acid stripping scans
for 20 sensors. Although morphological differences may exist, the surface areas of the sensors
are highly consistent, as evidenced by the low levels of s.e. (blue error bars) observed for scans
of the 20 sensors conducted in acidic solution. Gold oxide is formed at 1.05 V–1.3 V and reduced
at 0.85 V. (f) Electrochemical nucleic acid assay scheme. PNA probes are immobilized on
microsensors, and in the presence of a complementary target the electrostatic charge on the
sensors is increased. This charge change is read out in the presence
of Ru(NH3)63+
and Fe(CN)63−
, a mixture that yields currents that report on the amount of nucleic
acid bound to the sensor.
By patterning channels on the SCC, we created separate liquid compartments (Figure 5.1a). WEs
are multiplexed on common leads such that they are physically isolated because of the air/water
interface in liquid channels separating them. Reference and counter electrodes are routed along
the liquid channels. The electrical isolation of the reference and counter layers from the WEs
within the SCC, and the ability to bring the electrodes into contact at specific positions using the
liquid channels, are the essential elements that allow solution-based circuits to be formed. The
contacts made through the conductive solution allow transient circuits to be formed and allow
individual contacts to address many sensors in series.
The patterned microsensors are functionalized with peptide nucleic acid (PNA) probes specific to
regions of targeted pathogens (Figure 5.1f). Electrodes are exposed to samples of interest and
binding occurs if a target nucleic acid is present. To detect positive target binding we use an
electrocatalytic reporter pair [32] comprising Ru(NH3)63+
and Fe(CN)63−
. Ru(NH3)63+
is
electrostatically attracted to the phosphate backbone of nucleic acids bound near the surface of
electrodes by probe molecules and is reduced to Ru(NH3)62+
when the electrode is biased at the
reduction potential. The Fe(CN)63−
present in solution auto-oxidizes Ru(NH3)62+
back
to Ru(NH3)63+
, which allows for multiple turnovers of Ru(NH3)63+
and generates an
electrocatalytic current. The difference between pre-hybridization and post-hybridization
currents are used as a metric to determine positive target binding.
73
5.4.2 Characterization of the SCC
The SCC was fabricated using a series of simple lithographic steps followed by the
electrodeposition of three-dimensional microsensors. The electrodeposition process produces
sensors with somewhat variable nanoscopic morphologies, but as it is programmed to deposit the
same number of gold atoms in each structure, it produces sensors with surface areas that vary by
less than 10% (Figure 5.1e).
We employed electrochemical analysis to determine whether SCCs provided the necessary level
of electrochemical isolation. We also devised a spectroscopic approach to confirm the isolation
analysis. Cyclic voltammetry of ferrocyanide was used to evaluate electrochemical
characteristics of SCCs versus standard serially connected chips (Figure 5.2a). We observed that
SCCs have nearly identical electrochemical signals to serially wired chips. It is noteworthy that
grounding of all other unbiased counter, reference and working electrodes is required to
eliminate crosstalk, as evidenced by the differential pulse voltammetry scans
of ferrocyanide with and without the grounding of these electrodes (Figure 5.2b). To further
investigate whether signals from adjacent liquid channels were picked up by individual sensors,
we added ferrocyanide adjacent to channels and monitored the effect on the signals obtained
(Figure 5.2c). It was observed that when ferrocyanide is added to an adjacent channel, there is
minimal perturbation of the signal of ferrocyanide within the channel of interest. The effects of
repeated scanning were also explored and were found to be minimal (data not shown).
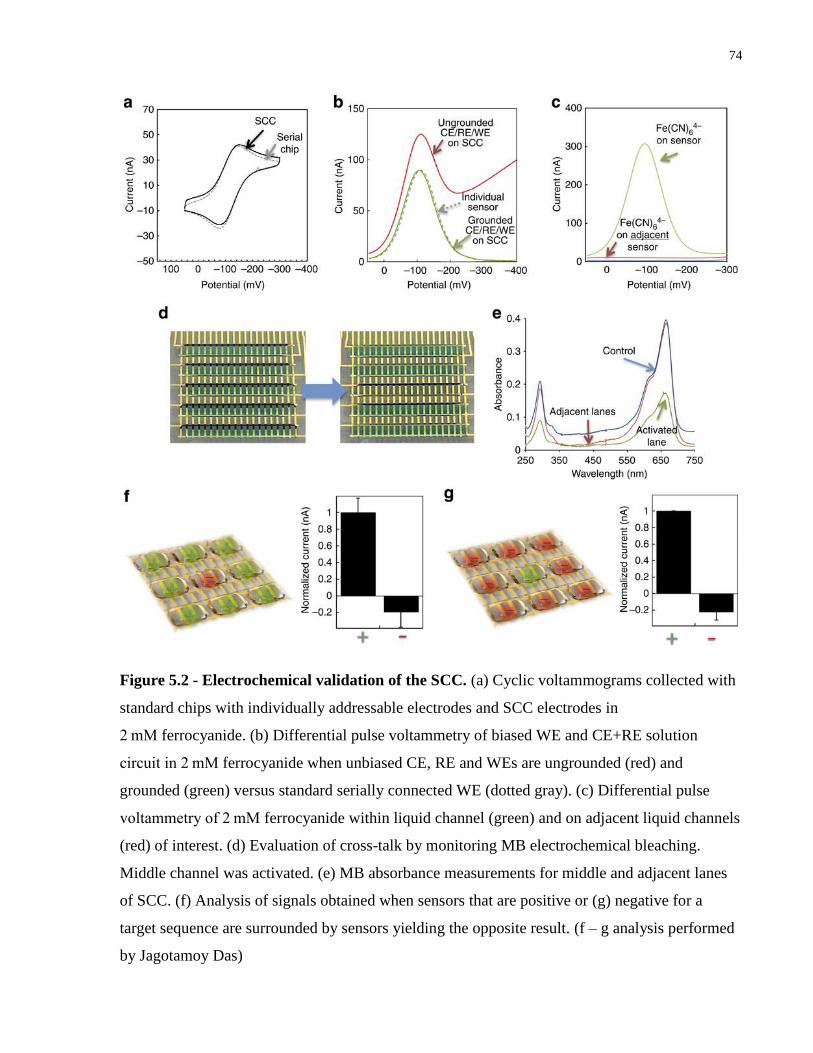
74
Figure 5.2 - Electrochemical validation of the SCC. (a) Cyclic voltammograms collected with
standard chips with individually addressable electrodes and SCC electrodes in
2 mM ferrocyanide. (b) Differential pulse voltammetry of biased WE and CE+RE solution
circuit in 2 mM ferrocyanide when unbiased CE, RE and WEs are ungrounded (red) and
grounded (green) versus standard serially connected WE (dotted gray). (c) Differential pulse
voltammetry of 2 mM ferrocyanide within liquid channel (green) and on adjacent liquid channels
(red) of interest. (d) Evaluation of cross-talk by monitoring MB electrochemical bleaching.
Middle channel was activated. (e) MB absorbance measurements for middle and adjacent lanes
of SCC. (f) Analysis of signals obtained when sensors that are positive or (g) negative for a
target sequence are surrounded by sensors yielding the opposite result. (f – g analysis performed
by Jagotamoy Das)
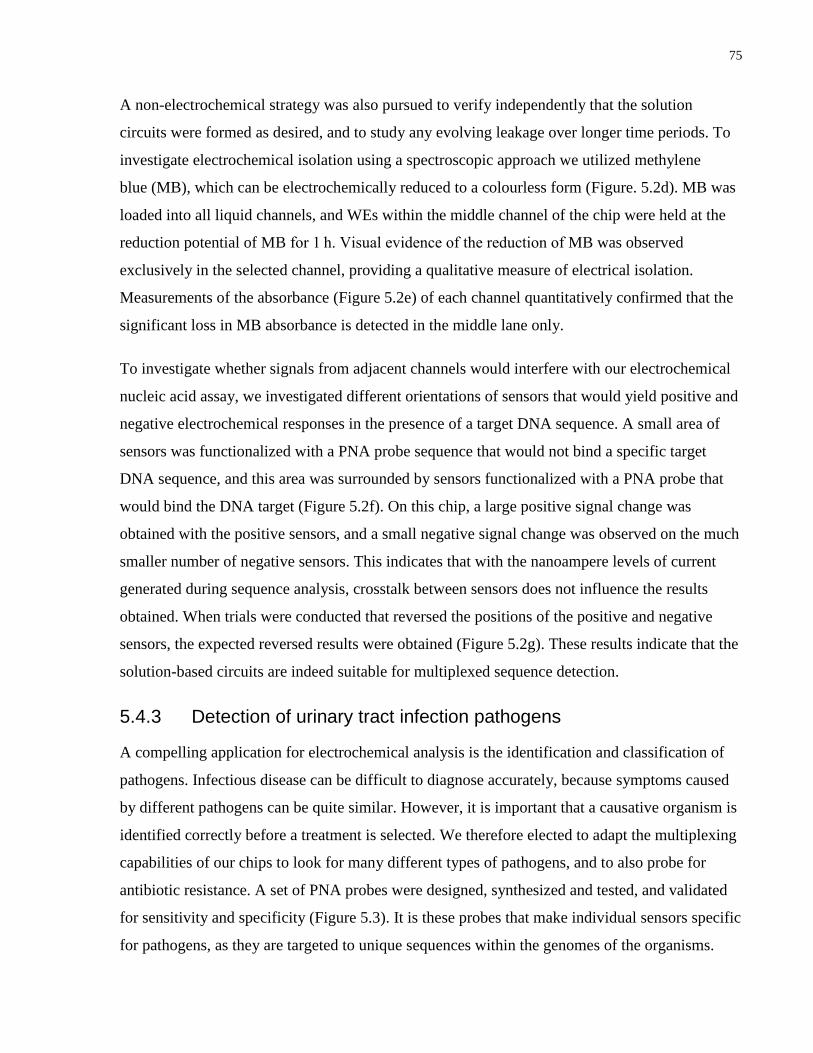
75
A non-electrochemical strategy was also pursued to verify independently that the solution
circuits were formed as desired, and to study any evolving leakage over longer time periods. To
investigate electrochemical isolation using a spectroscopic approach we utilized methylene
blue (MB), which can be electrochemically reduced to a colourless form (Figure. 5.2d). MB was
loaded into all liquid channels, and WEs within the middle channel of the chip were held at the
reduction potential of MB for 1 h. Visual evidence of the reduction of MB was observed
exclusively in the selected channel, providing a qualitative measure of electrical isolation.
Measurements of the absorbance (Figure 5.2e) of each channel quantitatively confirmed that the
significant loss in MB absorbance is detected in the middle lane only.
To investigate whether signals from adjacent channels would interfere with our electrochemical
nucleic acid assay, we investigated different orientations of sensors that would yield positive and
negative electrochemical responses in the presence of a target DNA sequence. A small area of
sensors was functionalized with a PNA probe sequence that would not bind a specific target
DNA sequence, and this area was surrounded by sensors functionalized with a PNA probe that
would bind the DNA target (Figure 5.2f). On this chip, a large positive signal change was
obtained with the positive sensors, and a small negative signal change was observed on the much
smaller number of negative sensors. This indicates that with the nanoampere levels of current
generated during sequence analysis, crosstalk between sensors does not influence the results
obtained. When trials were conducted that reversed the positions of the positive and negative
sensors, the expected reversed results were obtained (Figure 5.2g). These results indicate that the
solution-based circuits are indeed suitable for multiplexed sequence detection.
5.4.3 Detection of urinary tract infection pathogens
A compelling application for electrochemical analysis is the identification and classification of
pathogens. Infectious disease can be difficult to diagnose accurately, because symptoms caused
by different pathogens can be quite similar. However, it is important that a causative organism is
identified correctly before a treatment is selected. We therefore elected to adapt the multiplexing
capabilities of our chips to look for many different types of pathogens, and to also probe for
antibiotic resistance. A set of PNA probes were designed, synthesized and tested, and validated
for sensitivity and specificity (Figure 5.3). It is these probes that make individual sensors specific
for pathogens, as they are targeted to unique sequences within the genomes of the organisms.
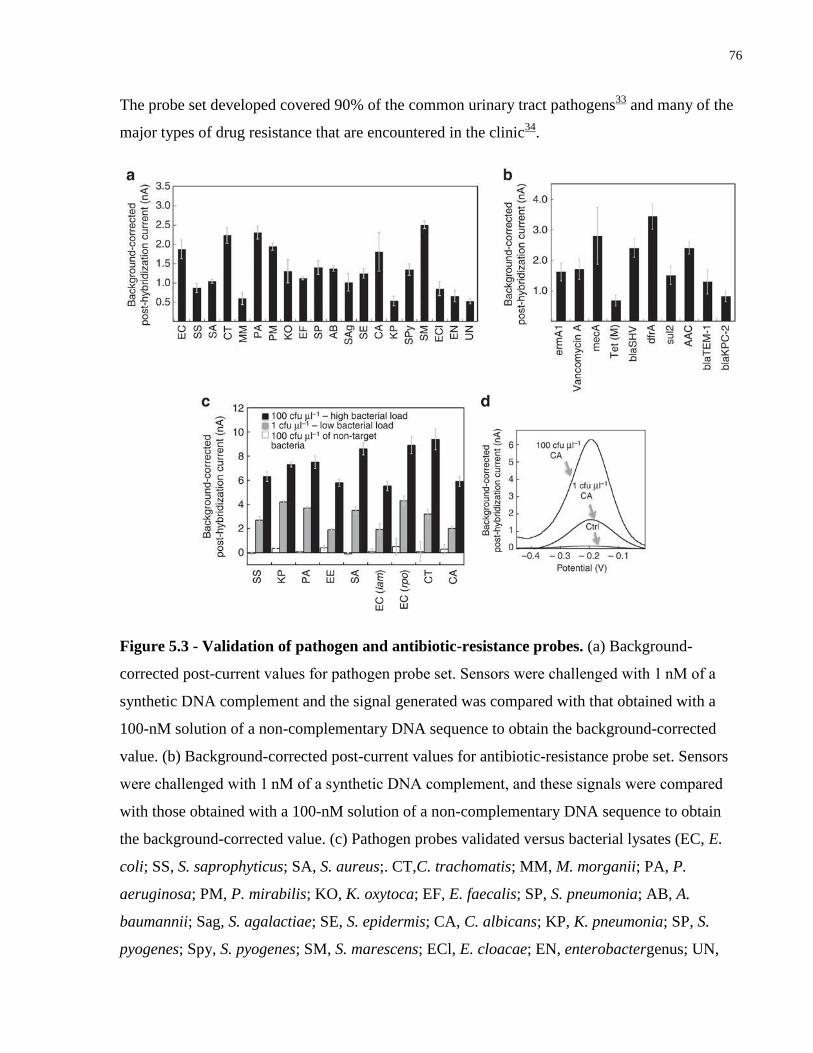
76
The probe set developed covered 90% of the common urinary tract pathogens33
and many of the
major types of drug resistance that are encountered in the clinic34
.
Figure 5.3 - Validation of pathogen and antibiotic-resistance probes. (a) Background-
corrected post-current values for pathogen probe set. Sensors were challenged with 1 nM of a
synthetic DNA complement and the signal generated was compared with that obtained with a
100-nM solution of a non-complementary DNA sequence to obtain the background-corrected
value. (b) Background-corrected post-current values for antibiotic-resistance probe set. Sensors
were challenged with 1 nM of a synthetic DNA complement, and these signals were compared
with those obtained with a 100-nM solution of a non-complementary DNA sequence to obtain
the background-corrected value. (c) Pathogen probes validated versus bacterial lysates (EC, E.
coli; SS, S. saprophyticus; SA, S. aureus;. CT,C. trachomatis; MM, M. morganii; PA, P.
aeruginosa; PM, P. mirabilis; KO, K. oxytoca; EF, E. faecalis; SP, S. pneumonia; AB, A.
baumannii; Sag, S. agalactiae; SE, S. epidermis; CA, C. albicans; KP, K. pneumonia; SP, S.
pyogenes; Spy, S. pyogenes; SM, S. marescens; ECl, E. cloacae; EN, enterobactergenus; UN,
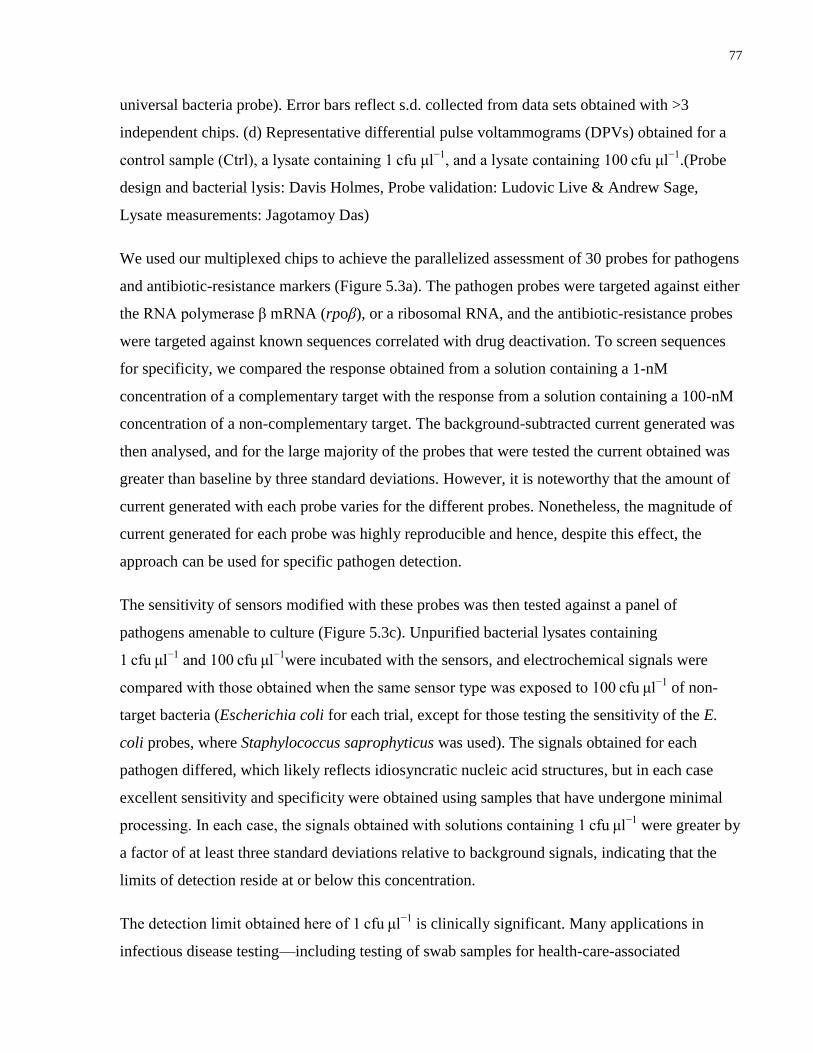
77
universal bacteria probe). Error bars reflect s.d. collected from data sets obtained with >3
independent chips. (d) Representative differential pulse voltammograms (DPVs) obtained for a
control sample (Ctrl), a lysate containing 1 cfu μl−1
, and a lysate containing 100 cfu μl−1
.(Probe
design and bacterial lysis: Davis Holmes, Probe validation: Ludovic Live & Andrew Sage,
Lysate measurements: Jagotamoy Das)
We used our multiplexed chips to achieve the parallelized assessment of 30 probes for pathogens
and antibiotic-resistance markers (Figure 5.3a). The pathogen probes were targeted against either
the RNA polymerase β mRNA (rpoβ), or a ribosomal RNA, and the antibiotic-resistance probes
were targeted against known sequences correlated with drug deactivation. To screen sequences
for specificity, we compared the response obtained from a solution containing a 1-nM
concentration of a complementary target with the response from a solution containing a 100-nM
concentration of a non-complementary target. The background-subtracted current generated was
then analysed, and for the large majority of the probes that were tested the current obtained was
greater than baseline by three standard deviations. However, it is noteworthy that the amount of
current generated with each probe varies for the different probes. Nonetheless, the magnitude of
current generated for each probe was highly reproducible and hence, despite this effect, the
approach can be used for specific pathogen detection.
The sensitivity of sensors modified with these probes was then tested against a panel of
pathogens amenable to culture (Figure 5.3c). Unpurified bacterial lysates containing
1 cfu μl−1
and 100 cfu μl−1
were incubated with the sensors, and electrochemical signals were
compared with those obtained when the same sensor type was exposed to 100 cfu μl−1
of non-
target bacteria (Escherichia coli for each trial, except for those testing the sensitivity of the E.
coli probes, where Staphylococcus saprophyticus was used). The signals obtained for each
pathogen differed, which likely reflects idiosyncratic nucleic acid structures, but in each case
excellent sensitivity and specificity were obtained using samples that have undergone minimal
processing. In each case, the signals obtained with solutions containing 1 cfu μl−1
were greater by
a factor of at least three standard deviations relative to background signals, indicating that the
limits of detection reside at or below this concentration.
The detection limit obtained here of 1 cfu μl−1
is clinically significant. Many applications in
infectious disease testing—including testing of swab samples for health-care-associated
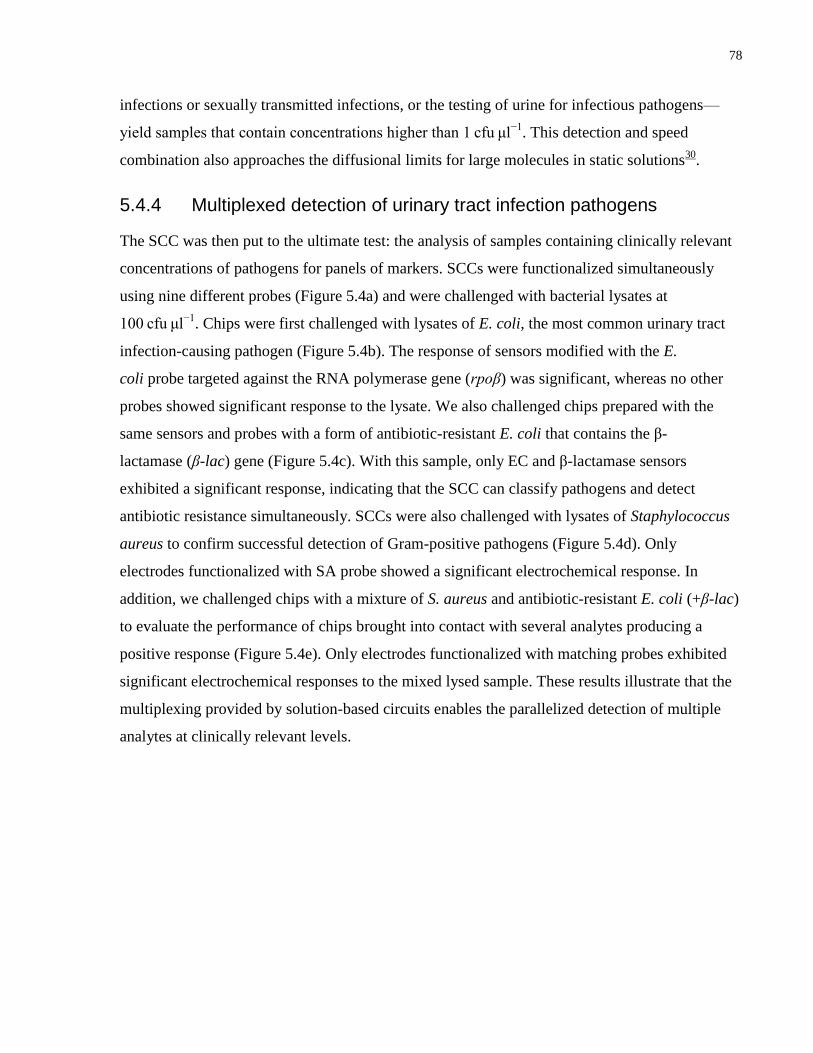
78
infections or sexually transmitted infections, or the testing of urine for infectious pathogens—
yield samples that contain concentrations higher than 1 cfu μl−1
. This detection and speed
combination also approaches the diffusional limits for large molecules in static solutions30
.
5.4.4 Multiplexed detection of urinary tract infection pathogens
The SCC was then put to the ultimate test: the analysis of samples containing clinically relevant
concentrations of pathogens for panels of markers. SCCs were functionalized simultaneously
using nine different probes (Figure 5.4a) and were challenged with bacterial lysates at
100 cfu μl−1
. Chips were first challenged with lysates of E. coli, the most common urinary tract
infection-causing pathogen (Figure 5.4b). The response of sensors modified with the E.
coli probe targeted against the RNA polymerase gene (rpoβ) was significant, whereas no other
probes showed significant response to the lysate. We also challenged chips prepared with the
same sensors and probes with a form of antibiotic-resistant E. coli that contains the β-
lactamase (β-lac) gene (Figure 5.4c). With this sample, only EC and β-lactamase sensors
exhibited a significant response, indicating that the SCC can classify pathogens and detect
antibiotic resistance simultaneously. SCCs were also challenged with lysates of Staphylococcus
aureus to confirm successful detection of Gram-positive pathogens (Figure 5.4d). Only
electrodes functionalized with SA probe showed a significant electrochemical response. In
addition, we challenged chips with a mixture of S. aureus and antibiotic-resistant E. coli (+β-lac)
to evaluate the performance of chips brought into contact with several analytes producing a
positive response (Figure 5.4e). Only electrodes functionalized with matching probes exhibited
significant electrochemical responses to the mixed lysed sample. These results illustrate that the
multiplexing provided by solution-based circuits enables the parallelized detection of multiple
analytes at clinically relevant levels.
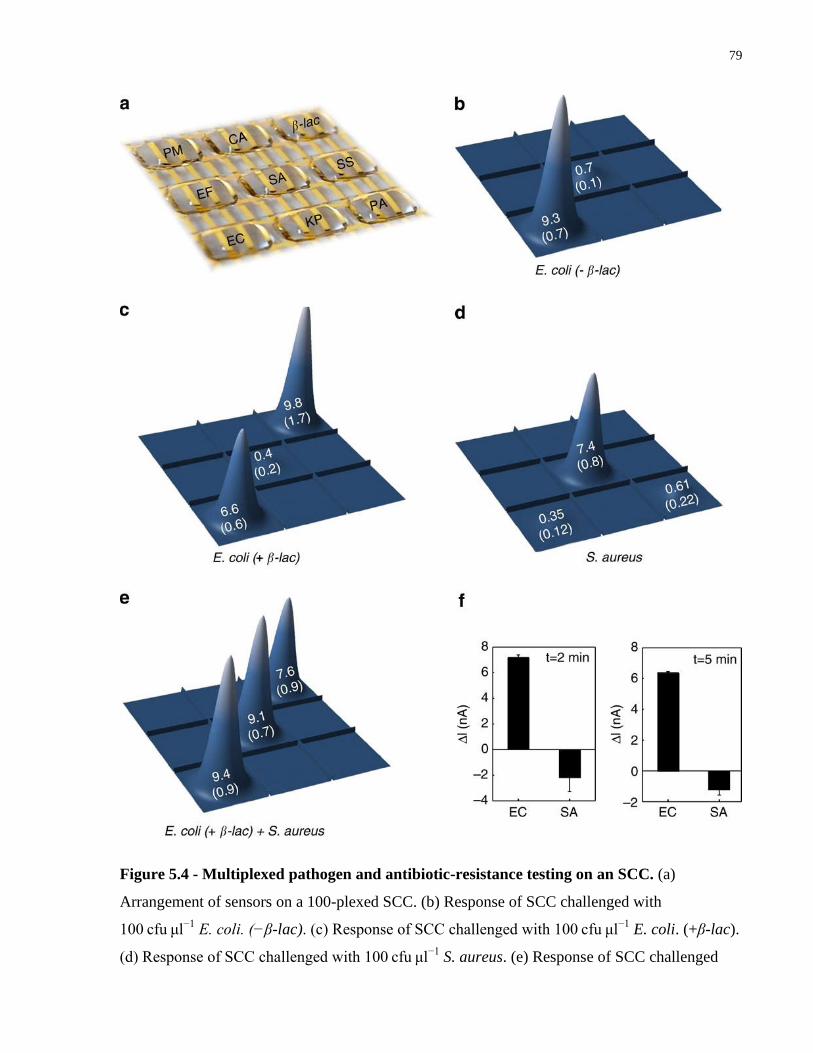
79
Figure 5.4 - Multiplexed pathogen and antibiotic-resistance testing on an SCC. (a)
Arrangement of sensors on a 100-plexed SCC. (b) Response of SCC challenged with
100 cfu μl−1
E. coli. (−β-lac). (c) Response of SCC challenged with 100 cfu μl−1
E. coli. (+β-lac).
(d) Response of SCC challenged with 100 cfu μl−1
S. aureus. (e) Response of SCC challenged
80
with 100 cfu μl−1
S. aureus+E. coli (+β-lac) bacterial lysate. (f) Response of SCC at 2 min and
5 min challenged with E. coli lysates at 100 cfu μl−1
. (Bacterial lysis: Brian Lam, Electrochemical
measurements: Jagotamoy Das)
As a final test of the utility of the SCC, we investigated whether very short hybridization times
could be used to enable very rapid bacterial detection (Figure 5.4f). We investigated the
evolution of signals that could be detected on chip with a 2- and 5-min hybridization, and
determined that a pathogen-specific response could be obtained even with the shortest time
studied. These results indicate that SCCs can be used for highly multiplexed pathogen detection,
and can also be used to deliver the very rapid results needed to make diagnostic information
clinically actionable.
5.5 Discussion
Using the simple idea that solution-based circuits could be harnessed on chip to enhance the
level of multiplexing that could be achieved on a passive chip, we created a new method for
electrochemical multiplexing. Compared with complicated and expensive active electronics on
the surface of silicon, this approach has significant advantages for the development of low-cost
diagnostic tools. A simple six-step fabrication approach, where most of the steps were performed
using transparency masks and low-grade glass was used as a substrate, is advantageous over
more involved protocols used to create active silicon electronics. The approach reported herein is
scalable in that it could be deployed to produce chips with higher levels of multiplexing than
shown here. Given the current capabilities of photolithography and technologies that can be used
to deliver probe molecules to high-density arrays, thousands of sensors could be addressed using
the solution circuit strategy. The development of strategies to maintain the large number of liquid
channels would represent the greatest challenge in realizing this level of multiplexing.
The sensor technology used here, which relies on the electrodeposition of microscale, three-
dimensional sensors, is a powerful tool in the analysis of complex samples. It has been shown to
perform well in the presence of blood [23] and urine [25], and can also discriminate single base
changes in sequence [35]. As demonstrated here, it is compatible with unpurified bacterial
lysates and, therefore, is easily integrated for sample-to-answer testing. These features provide a
significant advantage over gold standard molecular testing methods, such as the PCR, which
typically requires sample clean-up and the use of costly enzymatic reagents. It is also compatible
81
with samples ranging from microlitres to millilitres, which broadens the potential clinical utility.
Here we have demonstrated that in addition to possessing these features, it can also be used with
a highly multiplexed format if the solution circuit approach is used to contact the sensors. The
solution-based circuit chip, as it yields rapid and accurate information on the identity and
antibiotic resistance of pathogens, represents a significant advance in the field of biomolecular
sensing.

82
5.6 References
1. Ronkainen, N. J. Halsall, H. B. & Heineman, W. R. Electrochemical biosensors. Chem. Soc.
Rev. 39, 1747–1763 (2010).
2. Drummond, T. G. Hill, M. G. & Barton, J. K. Electrochemical DNA sensors. Nat.
Biotechnol. 21,1192–1199 (2003).
3. Song, S. et al. Functional nanoprobes for ultrasensitive detection of biomolecules. Chem.
Soc. Rev. 39, 4234–4243 (2010).
4. Lin, P. & Yan, F. Organic thin-film transistors for chemical and biological sensing. Adv.
Mater.24, 34–51 (2012).
5. Soleymani, L. Fang, Z. Sargent, E. H. & Kelley, S. O. Programming the detection limits of
biosensors through controlled nanostructuring. Nat. Nanotechnol. 4, 844–848 (2009).
6. Alligrant, T. M. Nettleton, E. G. & Crooks, R. M. Electrochemical detection of individual
DNA hybridization events. Lab. Chip. 13, 349–354 (2013).
7. Sorgenfrei, S. et al. Label-free single-molecule detection of DNA-hybridization kinetics with
a carbon nanotube field-effect transistor. Nat. Nanotechnol. 6, 126–132 (2011).
8. Slinker, J. D. Muren, N. B. Gorodetsky, A. A. & Barton, J. K. Multiplexed DNA-modified
electrodes. J. Am. Chem. Soc. 132, 2769–2774 (2010).
9. Fan, C. Plaxco, K. W. & Heeger, A. J. Electrochemical interrogation of conformational
changes as a reagentless method for the sequence-specific detection of DNA. Proc. Natl
Acad. Sci. USA 100, 9134–9137 (2003).
10. Patolsky, F. Lichtenstein, A. & Willner, I. Detection of single-base DNA mutations by
enzyme-amplified electronic transduction. Nat. Biotechnol. 19, 253–257 (2001).
11. Pheeney, C. G. Guerra, L. F. & Barton, J. K. DNA sensing by electrocatalysis with
hemoglobin. Proc. Natl Acad. Sci. USA 109, 11528–11533 (2012).
83
12. Wanunu, M. et al. Rapid electronic detection of probe-specific microRNAs using thin
nanopore sensors. Nat. Nano 5, 807–814 (2010).
13. Khan, H. U. et al. In situ, label-free DNA detection using organic transistor sensors. Adv.
Mater. 22, 4452–4456 (2010).
14. Das, J. & Kelley, S. O. Protein detection using arrayed microsensor chips: tuning sensor
footprint to achieve ultrasensitive readout of CA-125 in serum and whole blood. Anal.
Chem.83, 1167–1172 (2011).
15. Duan, X. et al. Quantification of the affinities and kinetics of protein interactions using
silicon nanowire biosensors. Nat. Nano 7, 401–407 (2012).
16. Tang, D. Yuan, R. & Chai, Y. Ultrasensitive electrochemical immunosensor for clinical
immunoassay using thionine-doped magnetic gold nanospheres as labels and horseradish
peroxidase as enhancer. Anal. Chem. 80, 1582–1588 (2008).
17. Malhotra, R. Patel, V. Vaqué, J. P. Gutkind, J. S. & Rusling, J. F. Ultrasensitive
electrochemical immunosensor for oral cancer biomarker IL-6 using carbon nanotube
forest electrodes and multilabel amplification. Anal. Chem. 82, 3118–3123 (2010).
18. Xiang, Y. Xie, M. Bash, R. Chen, J. J. L. & Wang, J. Ultrasensitive label-free aptamer-based
electronic detection. Angew. Chem. Int. Ed. 46, 9054–9056 (2007).
19. Das, J. et al. An ultrasensitive universal detector based on neutralizer displacement. Nat.
Chem. 4, 642–648 (2012).
20. Zuo, X. Xiao, Y. & Plaxco, K. W. High specificity, electrochemical sandwich assays based
on single aptamer sequences and suitable for the direct detection of small-molecule
targets in blood and other complex matrices. J. Am. Chem. Soc. 131, 6944–6945 (2009).
21. Liu, H. Xiang, Y. Lu, Y. & Crooks, R. M. Aptamer-based origami paper analytical device for
electrochemical detection of adenosine. Angew. Chem. Int. Ed. 51, 6925–6928 (2012).
84
22. Kuang, Z. Kim, S. N. Crookes-Goodson, W. J. Farmer, B. L. & Naik, R. R. Biomimetic
chemosensor: designing peptide recognition elements for surface functionalization of
carbon nanotube field effect transistors. ACS Nano 4, 452–458 (2010).
23. Vasilyeva, E. et al. Direct genetic analysis of ten cancer cells: tuning sensor structure and
molecular probe design for efficient mRNA capture. Angew. Chem. Int. Ed. 50, 4137–
4141(2011).
24. Swensen, J. S. et al. Continuous, real-time monitoring of cocaine in undiluted blood serum
via a microfluidic, electrochemical aptamer-based sensor. J. Am. Chem. Soc. 131, 4262–
4266(2009).
25. Lam, B. Fang, Z. Sargent, E. H. & Kelley, S. O. Polymerase chain reaction-free, sample-to-
answer bacterial detection in 30 min with integrated cell lysis. Anal. Chem. 84, 21–
25 (2012).
26. Mani, V. Chikkaveeraiah, B. V. Patel, V. Gutkind, J. S. & Rusling, J. F. Ultrasensitive
immunosensor for cancer multienzyme-particle amplification. ACS Nano 3, 585–
594 (2009).
27. Lerner, M. B. et al. Hybrids of a genetically engineered antibody and a carbon nanotube
transistor for detection of prostate cancer biomarkers. ACS Nano 6, 5143–5149 (2012).
28. Mannoor, M. S. Zhang, S. Link, A. J. & McAlpine, M. C. Electrical detection of pathogenic
bacteria via immobilized antimicrobial peptides. Proc. Natl Acad. Sci. USA 107, 19207–
19212(2010).
29. Zheng, G. Patolsky, F. Cui, Y. Wang, W. U. & Lieber, C. M. Multiplexed electrical detection
of cancer markers with nanowire sensor arrays. Nat. Biotechnol. 23, 1294–1301 (2005).
30. Soleymani, L. et al. Hierarchical nanotextured microelectrodes overcome the molecular
transport barrier to achieve rapid, direct bacterial detection. ACS Nano 5, 3360–
3366 (2011).
31. Bin, X. Sargent, E. H. & Kelley, S. O. Nanostructuring of sensors determines the efficiency
of biomolecular capture. Anal. Chem. 82, 5928–5931 (2010).
85
32. Lapierre, M. A. O’Keefe, M. Taft, B. J. & Kelley, S. O. Electrocatalytic detection of
pathogenic DNA sequences and antibiotic resistance markers. Anal. Chem. 75, 6327–
6333 (2003).
33. Foxman, B. The epidemiology of urinary tract infection. Nat. Rev. Urol. 7, 653–660 (2010).
34. Levy, S. B. & Marshall, B. Antibacterial resistance worldwide: causes, challenges and
responses. Nat. Med. 10, S122–S129 (2004).
35. Yang, H. et al. Direct, electronic microRNA detection for the rapid determination of
differential expression profiles. Angew. Chem. Int. Ed. 48, 8461–8464 (2009).
86
6 Conclusions and Future Directions
6.1 Thesis Findings
The goal of this work was to develop new effective methods for nanomaterial point-of-care
electrochemical biosensors. Sample handling and process is an important aspect of any point of
care diagnostic technique and must be simple, rapid and effective. High applied voltages,
external pump requirements and difficult direct intergration with our NME platform were distinct
drawbacks of microchannel electrical lysis (supplementary information). In chapter 3 we
developed simple parallel plate lysis chambers that could operate at lower voltages, did not need
external pumps and could be directly coupled to our NME chips. We showed these chambers are
effective at lysing pathogenic bacteria, releasing intercellular genetic targets. We were able to
detect intercellular genetic markers of bacteria and cancer cells by combining our parallel plate
lysis platform with our NME detection platform. Remarkably we were able to perform detection
at clinically relevant concentrations in crude lysates in buffer and urine without any purification.
In chapter 4 we evaluated various materials that possessed desirable manufacturing qualities,
such as low cost and quick prototype turnaround times. PCB is one of the cheapest materials
with simple and rapid prototyping cycles. However, we ran into many material compatibility
issues since copper is the only widely available base metal material and other materials would be
costly. Impurities in PCB NME and large background produced poor sensitivities when PCB
NMEs were used in our electrocatalyic nucleic acid assay. We also tried FEP, a common plastic
used in the electronics industry for manufacturing FPCs. Plastics are cheap materials, however
we needed to post process manufactured devices to fabricate a passivating aperture layer for
template electrodeposition of NMEs. Flexibility of FEP was an issue and lead to poor aperture
resolutions when compared to silicon devices along with poor assay sensitivities due to high
background currents.
Net we evaluated plain borosilicate glass since it is a cheap and rigid material. We fabricated
similar chips to our silicon based devices with similar aperture resolutions and NMEs fabricated
on glass were of comparable morphology and electrochemical character to silicon based NMEs.
We tested our electrocatalyic nucleic acid assay on glass and found comparable sensitivities to
silicon. In addition we challenged our glass platform with bacterial lysates and found we could
detect clinically relevant concentrations similar to the silicon platform.

87
An important goal for future medical diagnostic technologies is the highly multiplexed analysis
of multiple biomarkers. For electrochemical biosensors the most common multiplexing method
is the implementation of active switching electronics. However, active electronics are complex
and costly to develop and manufacture limiting their practicality for use in consumable
biosensors. In chapter 5 we developed a simple passive method for electrochemical multiplexing
using simple physical separation of liquid to create SCCs. We characterize this method and show
that interference between channels is not significant when non-biased NMEs are held at a fixed
potential such as ground. We demonstrate the utility of this method in the successful multiplexed
analysis of bacterial lysates at clinically relevant concentrations.
6.2 Future Work
We showed that parallel plate lysis chambers were rapid, effective and could be directly coupled
to our NME detection platform. Further development of parallel lysis chambers should include
indepth analysis of the mechanism of lysis since it is unclear if bacteria are lysed
electrochemically and/or electrically. In future developments we intend to design electrical lysis
areas directly on chip in cost effective and efficient manner. To aid in the ease of use in the
system a method spontaneous fluid flow should be developed to reduce operator involvement in
detection of infectious diseases and/or cancers. A mobile integrated measurement system should
be developed since testing in developing countries will become an important goal for our
platform.
From a materials and manufacturing standpoint it would be invaluable to develop non-
lithographic methods for fabrication of glass based NME chips which will be instrumental in
reducing costs. Fabrication of NMEs on flexible materials is an interesting avenue to pursue,
which could used in biosensors directly applied to the skin or used in other applications where
rigid materials would not be suitable.
The liquid channel multiplexing platform is still in prototyping stages and better liquid channel
methods should be investigated. Currently manual filling of liquid channels is not optimal and
spontaneous filling methods should be investigated. Another issue with the liquid channel system
is the time required to scan an entire chip, since we utilize a single potentiostat and scan each
working electrode individually. For high levels of multiplexing this scanning time would become
prohibitive, for example if it takes 2 sec per scan, and there are 1000 electrodes it would take

88
over 30 min to scan all sensors on a single chip. Therefore it would be invaluable to develop a
method that could scan working electrodes in parallel. A possible method is to scan working
electrodes in parallel where a single working electrode within each liquid channel is scanned
simultaneously with different potentiostats. This would reduce scan times by the root factor of
the number of electrodes which would increase the viability of this platform to highly
multiplexed systems in point of care settings.
89
7 Publications and Other Contributions
1. Lam, B., Das, J., Holmes, R. D., Live, L., Sage, A., Sargent, E. H., & Kelley, S. O.
―Solution-Based Circuits Enable Multiplexed, Rapid Pathogen Detection.‖ Nature
Communications 4, 2001 (2013)
2. Lam, B., Holmes, R. D., Das, J., Poudineh, M., Sargent, E. H., & Kelley, S. O. ―Optimized
Templates for Bottom-Up Growth of High-Performance Integrated Biomolecular
Detectors.‖ Lab on a Chip 13, 2569-75 (2013)
3. Kelley, S.O., Lam, B. & Sargent, E. H. ―Electrochemical Multiplexer.‖ U.S. Patent
61/651132 (2012)
4. Lam, B., Fang, Z., Sargent, E. H. & Kelley, S. O. ―Polymerase Chain Reaction-Free,
Sample-to-Answer Bacterial Detection in 30 Minutes with Integrated Cell Lysis.‖
Analytical Chemistry 84, 21-25 (2012).
5. Vasilyeva, E., Lam, B., Fang, Z., Minden, M. D., Sargent, E. H., & Kelley, S. O. ―Direct
genetic analysis of ten cancer cells: tuning sensor structure and molecular probe design
for efficient mRNA capture.‖ Angewandte Chemie (International ed. in English) 50,
4137–41 (2011).
6. Soleymani, L. Fang, Z., Lam, B., Bin, X., Vasilyeva, E., Ross, A. J., Sargent, E. H., &
Kelley, S. O. ―Hierarchical nanotextured microelectrodes overcome the molecular
transport barrier to achieve rapid, direct bacterial detection.‖ ACS nano 5, 3360–6 (2011).
90
8 Supplementary Information
8.1 Microchannel Electrical Lysis
Our goal at the beginning of my studies was to perform efficient and simple processing for direct
detection of cancer and pathogenic bacteria with our nanostructured microelectrode platform. We
first utilized a microchannel electrical lysis platform for lysis of bacteria and cancer cells. We
were able to accurately detect the presence of pathogenic bacteria [1] and cancer [2] in
unpurified lysates samples.
8.1.1 Platform Description
Traditional electrical lysis methods required extremely high voltages greater than 10kV [3-4] to
generate high enough electrical fields required for electrical lysis of bacteria. Wang, et al [5]
developed a microchannel lysis method which reduces required voltages by roughly an order of
magnitude to ~1000V. We first utilized a microchannel lysis method developed in their group
(Figure 8.1) [5]. The microchannels are made using traditional soft lithographic techniques,
utilizing the casting of polydimethylsiloxane (PDMS) over physical master molds which were
microfabricated in house. The PDMS microchannels consist of two reservoirs connected by a
channel consisting of narrow section in the middle and wide sections connecting the narrow
section to the reservoirs (Figure 8.1A). Electrical contact to the microchannel is made by piecing
the PDMS with Pt wire, such that the wires make contact with the interior of the reservoirs
(Figure 8.1B).
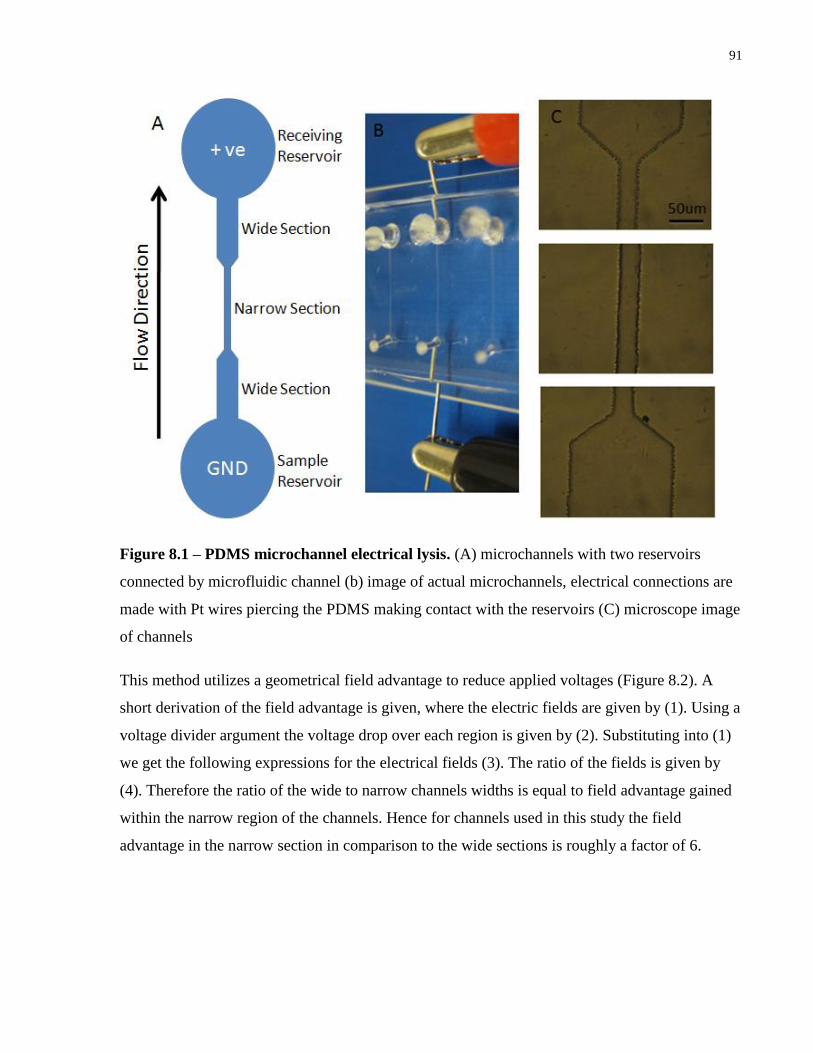
91
Figure 8.1 – PDMS microchannel electrical lysis. (A) microchannels with two reservoirs
connected by microfluidic channel (b) image of actual microchannels, electrical connections are
made with Pt wires piercing the PDMS making contact with the reservoirs (C) microscope image
of channels
This method utilizes a geometrical field advantage to reduce applied voltages (Figure 8.2). A
short derivation of the field advantage is given, where the electric fields are given by (1). Using a
voltage divider argument the voltage drop over each region is given by (2). Substituting into (1)
we get the following expressions for the electrical fields (3). The ratio of the fields is given by
(4). Therefore the ratio of the wide to narrow channels widths is equal to field advantage gained
within the narrow region of the channels. Hence for channels used in this study the field
advantage in the narrow section in comparison to the wide sections is roughly a factor of 6.
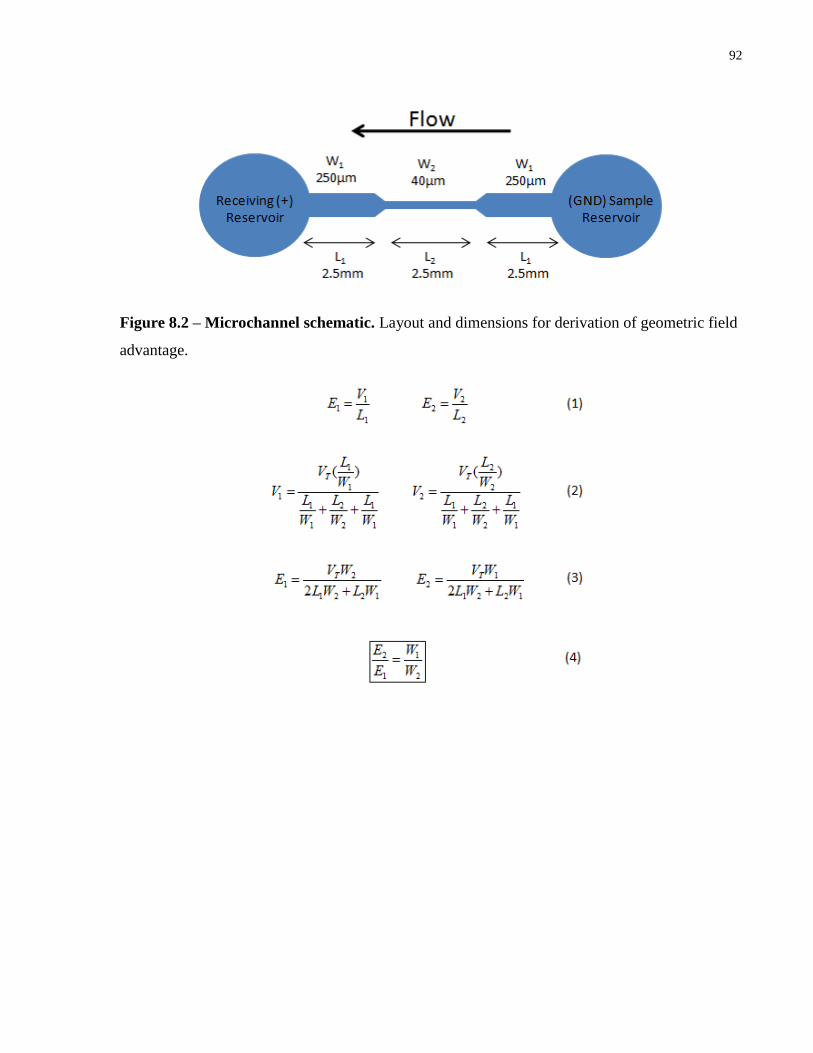
92
Figure 8.2 – Microchannel schematic. Layout and dimensions for derivation of geometric field
advantage.
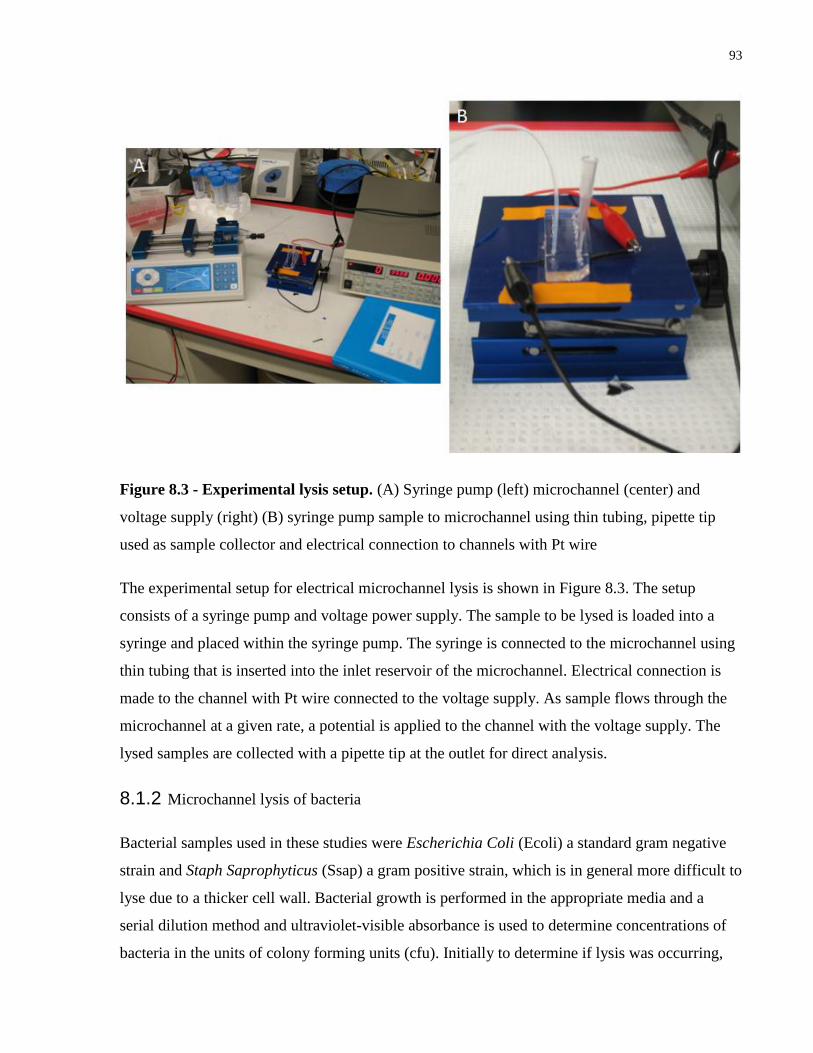
93
Figure 8.3 - Experimental lysis setup. (A) Syringe pump (left) microchannel (center) and
voltage supply (right) (B) syringe pump sample to microchannel using thin tubing, pipette tip
used as sample collector and electrical connection to channels with Pt wire
The experimental setup for electrical microchannel lysis is shown in Figure 8.3. The setup
consists of a syringe pump and voltage power supply. The sample to be lysed is loaded into a
syringe and placed within the syringe pump. The syringe is connected to the microchannel using
thin tubing that is inserted into the inlet reservoir of the microchannel. Electrical connection is
made to the channel with Pt wire connected to the voltage supply. As sample flows through the
microchannel at a given rate, a potential is applied to the channel with the voltage supply. The
lysed samples are collected with a pipette tip at the outlet for direct analysis.
8.1.2 Microchannel lysis of bacteria
Bacterial samples used in these studies were Escherichia Coli (Ecoli) a standard gram negative
strain and Staph Saprophyticus (Ssap) a gram positive strain, which is in general more difficult to
lyse due to a thicker cell wall. Bacterial growth is performed in the appropriate media and a
serial dilution method and ultraviolet-visible absorbance is used to determine concentrations of
bacteria in the units of colony forming units (cfu). Initially to determine if lysis was occurring,
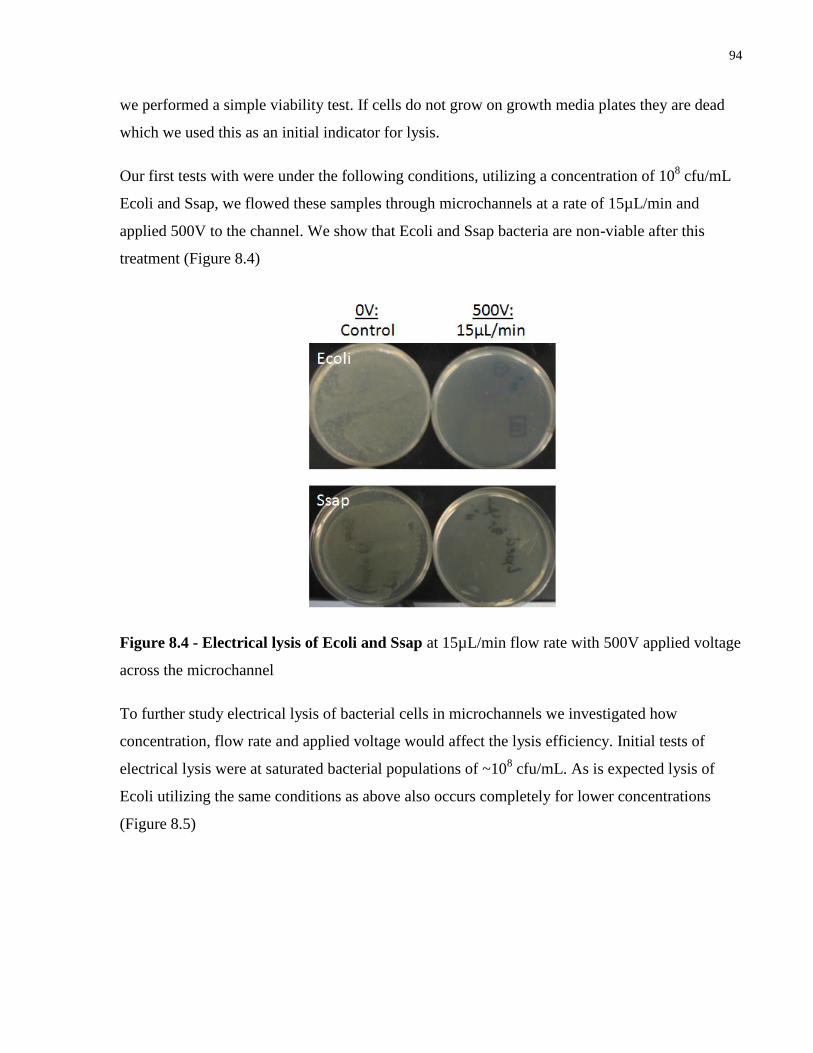
94
we performed a simple viability test. If cells do not grow on growth media plates they are dead
which we used this as an initial indicator for lysis.
Our first tests with were under the following conditions, utilizing a concentration of 108 cfu/mL
Ecoli and Ssap, we flowed these samples through microchannels at a rate of 15µL/min and
applied 500V to the channel. We show that Ecoli and Ssap bacteria are non-viable after this
treatment (Figure 8.4)
Figure 8.4 - Electrical lysis of Ecoli and Ssap at 15µL/min flow rate with 500V applied voltage
across the microchannel
To further study electrical lysis of bacterial cells in microchannels we investigated how
concentration, flow rate and applied voltage would affect the lysis efficiency. Initial tests of
electrical lysis were at saturated bacterial populations of ~108 cfu/mL. As is expected lysis of
Ecoli utilizing the same conditions as above also occurs completely for lower concentrations
(Figure 8.5)
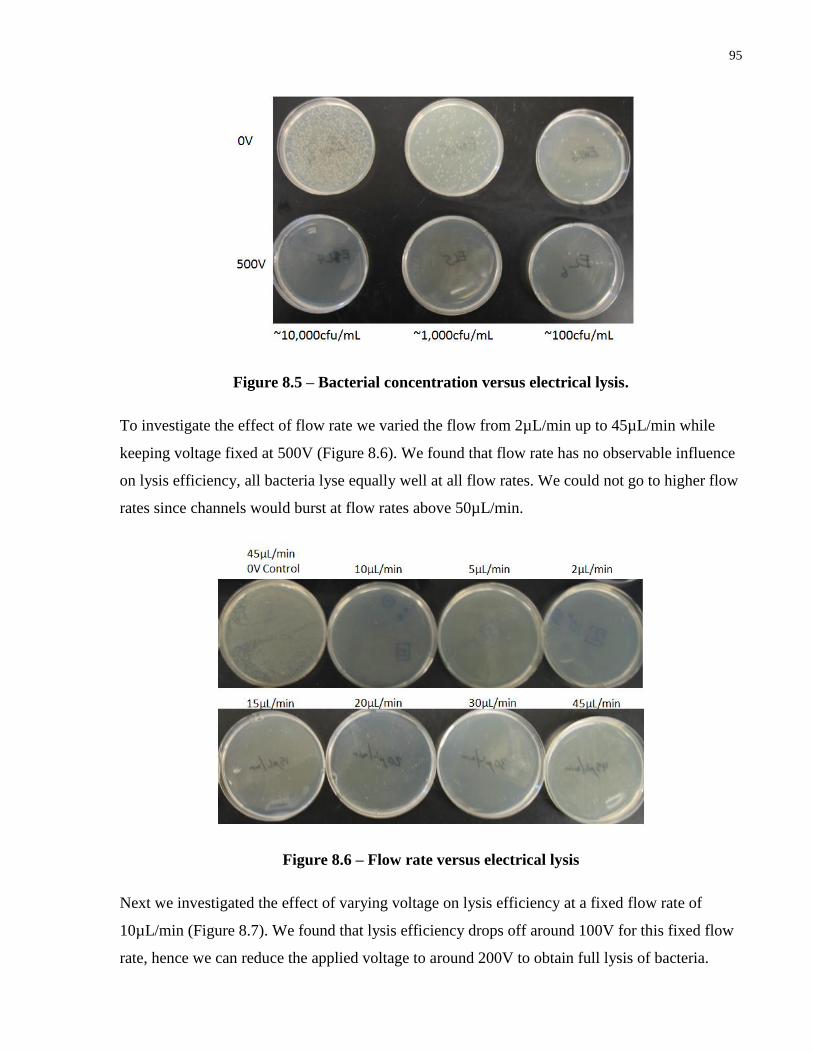
95
Figure 8.5 – Bacterial concentration versus electrical lysis.
To investigate the effect of flow rate we varied the flow from 2µL/min up to 45µL/min while
keeping voltage fixed at 500V (Figure 8.6). We found that flow rate has no observable influence
on lysis efficiency, all bacteria lyse equally well at all flow rates. We could not go to higher flow
rates since channels would burst at flow rates above 50µL/min.
Figure 8.6 – Flow rate versus electrical lysis
Next we investigated the effect of varying voltage on lysis efficiency at a fixed flow rate of
10µL/min (Figure 8.7). We found that lysis efficiency drops off around 100V for this fixed flow
rate, hence we can reduce the applied voltage to around 200V to obtain full lysis of bacteria.
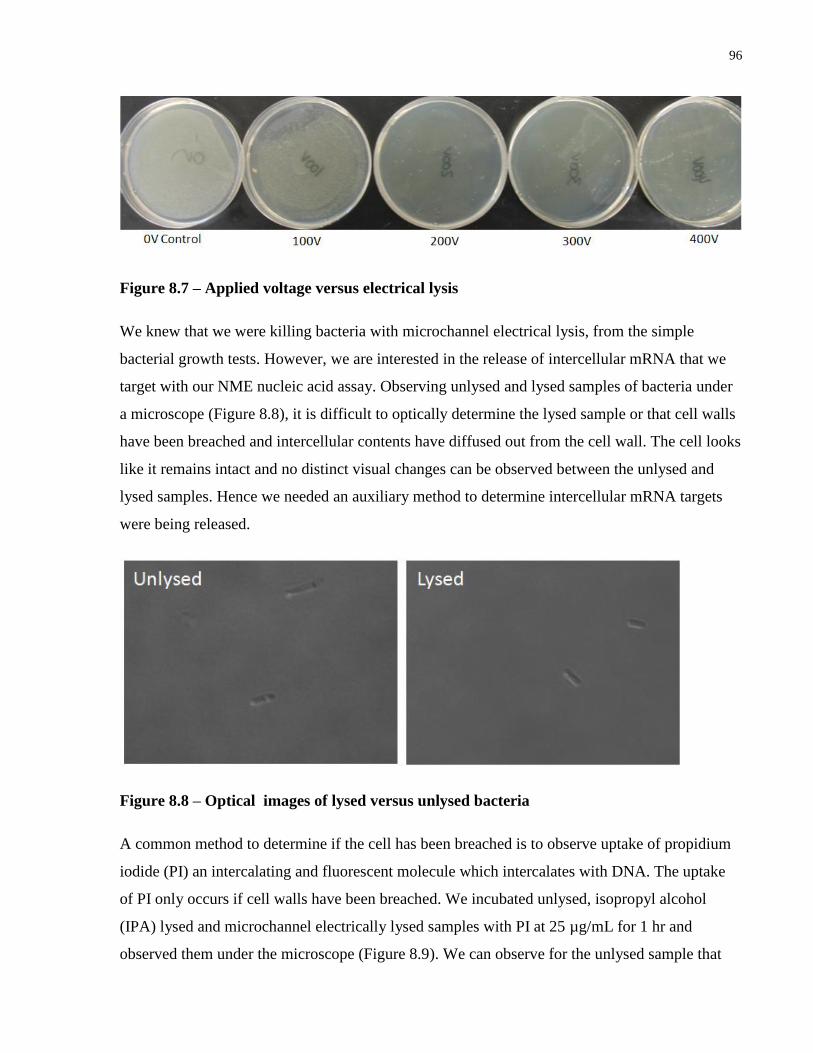
96
Figure 8.7 – Applied voltage versus electrical lysis
We knew that we were killing bacteria with microchannel electrical lysis, from the simple
bacterial growth tests. However, we are interested in the release of intercellular mRNA that we
target with our NME nucleic acid assay. Observing unlysed and lysed samples of bacteria under
a microscope (Figure 8.8), it is difficult to optically determine the lysed sample or that cell walls
have been breached and intercellular contents have diffused out from the cell wall. The cell looks
like it remains intact and no distinct visual changes can be observed between the unlysed and
lysed samples. Hence we needed an auxiliary method to determine intercellular mRNA targets
were being released.
Figure 8.8 – Optical images of lysed versus unlysed bacteria
A common method to determine if the cell has been breached is to observe uptake of propidium
iodide (PI) an intercalating and fluorescent molecule which intercalates with DNA. The uptake
of PI only occurs if cell walls have been breached. We incubated unlysed, isopropyl alcohol
(IPA) lysed and microchannel electrically lysed samples with PI at 25 µg/mL for 1 hr and
observed them under the microscope (Figure 8.9). We can observe for the unlysed sample that
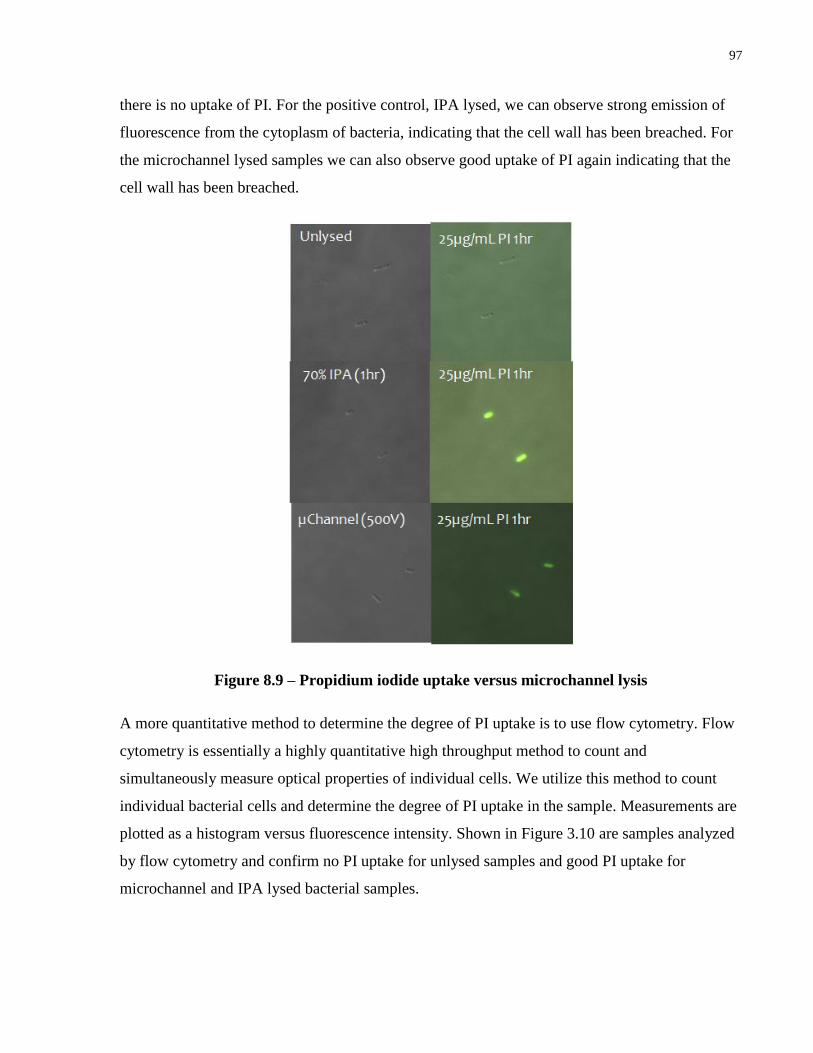
97
there is no uptake of PI. For the positive control, IPA lysed, we can observe strong emission of
fluorescence from the cytoplasm of bacteria, indicating that the cell wall has been breached. For
the microchannel lysed samples we can also observe good uptake of PI again indicating that the
cell wall has been breached.
Figure 8.9 – Propidium iodide uptake versus microchannel lysis
A more quantitative method to determine the degree of PI uptake is to use flow cytometry. Flow
cytometry is essentially a highly quantitative high throughput method to count and
simultaneously measure optical properties of individual cells. We utilize this method to count
individual bacterial cells and determine the degree of PI uptake in the sample. Measurements are
plotted as a histogram versus fluorescence intensity. Shown in Figure 3.10 are samples analyzed
by flow cytometry and confirm no PI uptake for unlysed samples and good PI uptake for
microchannel and IPA lysed bacterial samples.
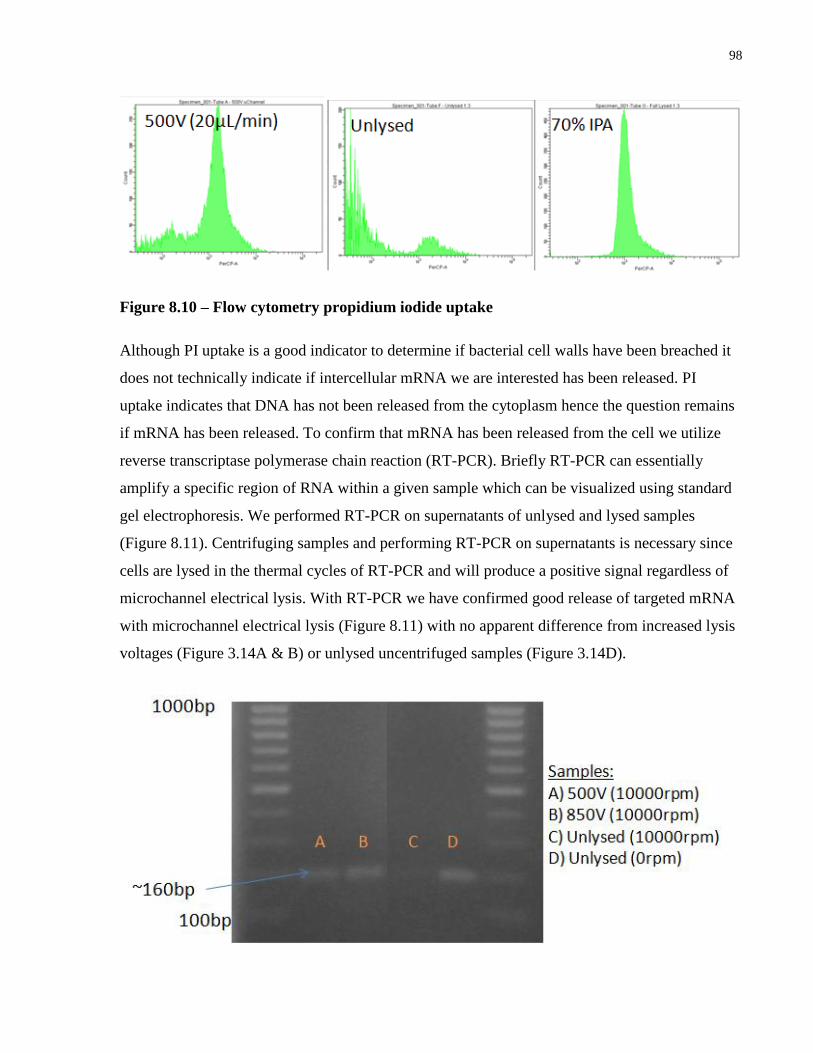
98
Figure 8.10 – Flow cytometry propidium iodide uptake
Although PI uptake is a good indicator to determine if bacterial cell walls have been breached it
does not technically indicate if intercellular mRNA we are interested has been released. PI
uptake indicates that DNA has not been released from the cytoplasm hence the question remains
if mRNA has been released. To confirm that mRNA has been released from the cell we utilize
reverse transcriptase polymerase chain reaction (RT-PCR). Briefly RT-PCR can essentially
amplify a specific region of RNA within a given sample which can be visualized using standard
gel electrophoresis. We performed RT-PCR on supernatants of unlysed and lysed samples
(Figure 8.11). Centrifuging samples and performing RT-PCR on supernatants is necessary since
cells are lysed in the thermal cycles of RT-PCR and will produce a positive signal regardless of
microchannel electrical lysis. With RT-PCR we have confirmed good release of targeted mRNA
with microchannel electrical lysis (Figure 8.11) with no apparent difference from increased lysis
voltages (Figure 3.14A & B) or unlysed uncentrifuged samples (Figure 3.14D).
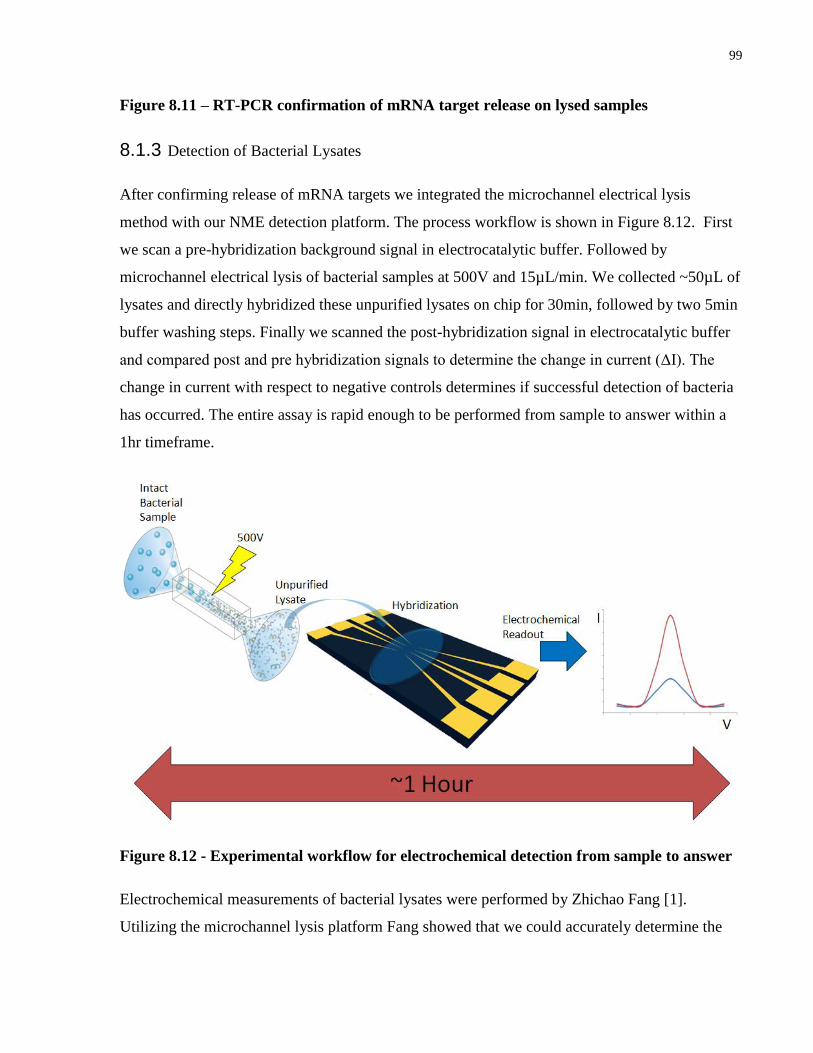
99
Figure 8.11 – RT-PCR confirmation of mRNA target release on lysed samples
8.1.3 Detection of Bacterial Lysates
After confirming release of mRNA targets we integrated the microchannel electrical lysis
method with our NME detection platform. The process workflow is shown in Figure 8.12. First
we scan a pre-hybridization background signal in electrocatalytic buffer. Followed by
microchannel electrical lysis of bacterial samples at 500V and 15µL/min. We collected ~50µL of
lysates and directly hybridized these unpurified lysates on chip for 30min, followed by two 5min
buffer washing steps. Finally we scanned the post-hybridization signal in electrocatalytic buffer
and compared post and pre hybridization signals to determine the change in current (ΔI). The
change in current with respect to negative controls determines if successful detection of bacteria
has occurred. The entire assay is rapid enough to be performed from sample to answer within a
1hr timeframe.
Figure 8.12 - Experimental workflow for electrochemical detection from sample to answer
Electrochemical measurements of bacterial lysates were performed by Zhichao Fang [1].
Utilizing the microchannel lysis platform Fang showed that we could accurately determine the
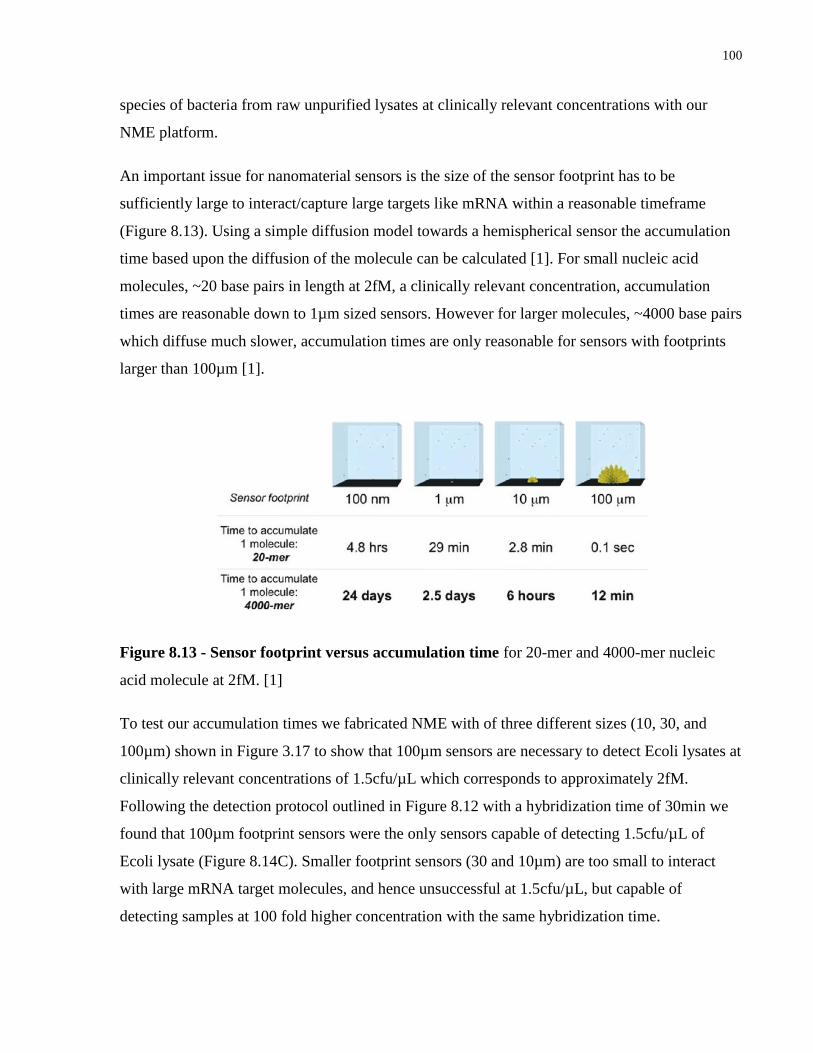
100
species of bacteria from raw unpurified lysates at clinically relevant concentrations with our
NME platform.
An important issue for nanomaterial sensors is the size of the sensor footprint has to be
sufficiently large to interact/capture large targets like mRNA within a reasonable timeframe
(Figure 8.13). Using a simple diffusion model towards a hemispherical sensor the accumulation
time based upon the diffusion of the molecule can be calculated [1]. For small nucleic acid
molecules, ~20 base pairs in length at 2fM, a clinically relevant concentration, accumulation
times are reasonable down to 1µm sized sensors. However for larger molecules, ~4000 base pairs
which diffuse much slower, accumulation times are only reasonable for sensors with footprints
larger than 100µm [1].
Figure 8.13 - Sensor footprint versus accumulation time for 20-mer and 4000-mer nucleic
acid molecule at 2fM. [1]
To test our accumulation times we fabricated NME with of three different sizes (10, 30, and
100µm) shown in Figure 3.17 to show that 100µm sensors are necessary to detect Ecoli lysates at
clinically relevant concentrations of 1.5cfu/µL which corresponds to approximately 2fM.
Following the detection protocol outlined in Figure 8.12 with a hybridization time of 30min we
found that 100µm footprint sensors were the only sensors capable of detecting 1.5cfu/µL of
Ecoli lysate (Figure 8.14C). Smaller footprint sensors (30 and 10µm) are too small to interact
with large mRNA target molecules, and hence unsuccessful at 1.5cfu/µL, but capable of
detecting samples at 100 fold higher concentration with the same hybridization time.
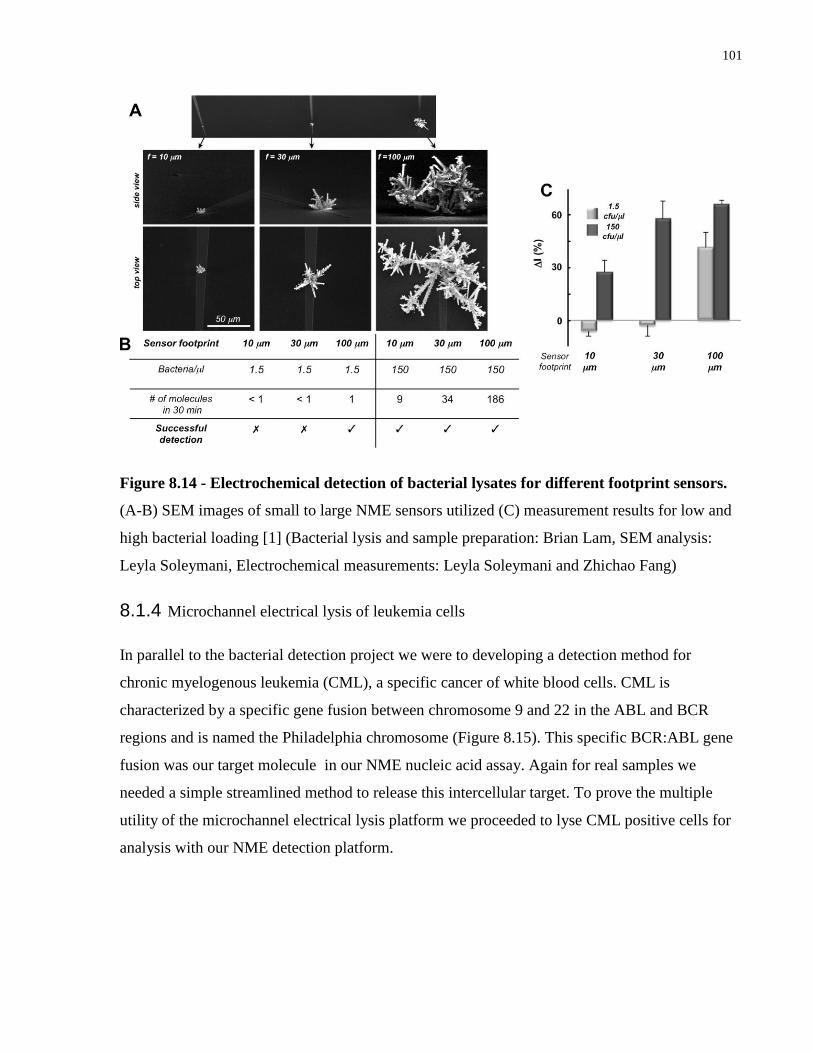
101
Figure 8.14 - Electrochemical detection of bacterial lysates for different footprint sensors.
(A-B) SEM images of small to large NME sensors utilized (C) measurement results for low and
high bacterial loading [1] (Bacterial lysis and sample preparation: Brian Lam, SEM analysis:
Leyla Soleymani, Electrochemical measurements: Leyla Soleymani and Zhichao Fang)
8.1.4 Microchannel electrical lysis of leukemia cells
In parallel to the bacterial detection project we were to developing a detection method for
chronic myelogenous leukemia (CML), a specific cancer of white blood cells. CML is
characterized by a specific gene fusion between chromosome 9 and 22 in the ABL and BCR
regions and is named the Philadelphia chromosome (Figure 8.15). This specific BCR:ABL gene
fusion was our target molecule in our NME nucleic acid assay. Again for real samples we
needed a simple streamlined method to release this intercellular target. To prove the multiple
utility of the microchannel electrical lysis platform we proceeded to lyse CML positive cells for
analysis with our NME detection platform.
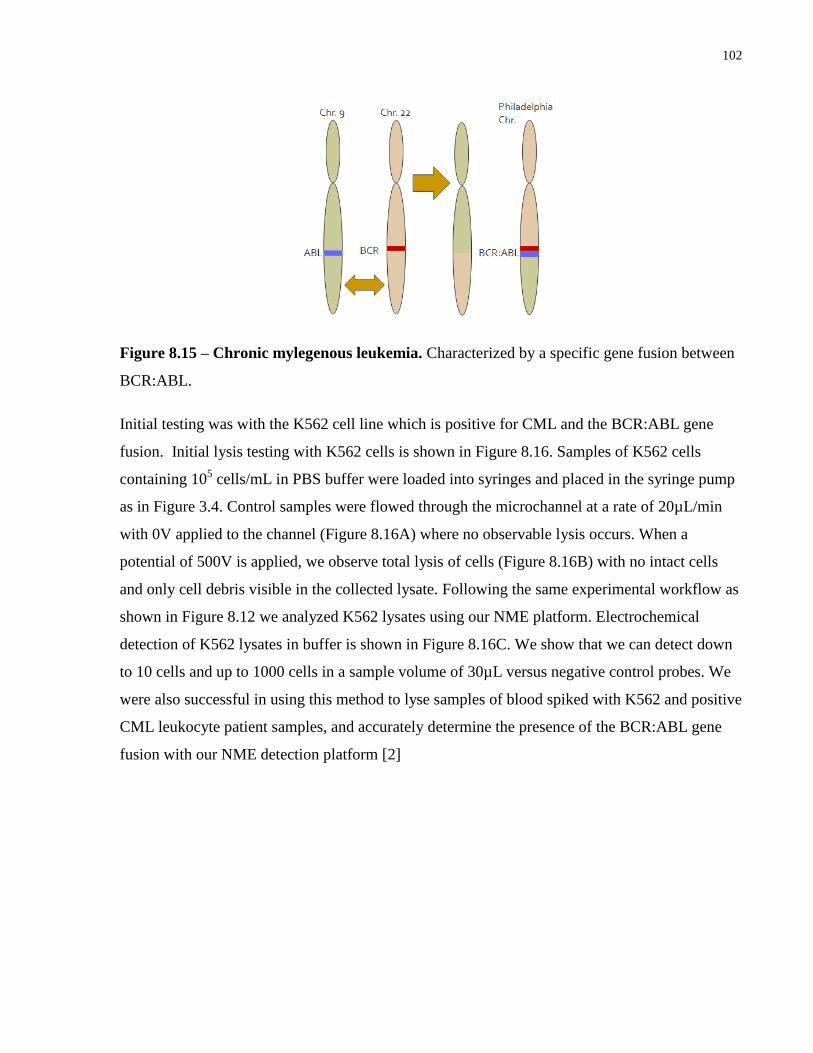
102
Figure 8.15 – Chronic mylegenous leukemia. Characterized by a specific gene fusion between
BCR:ABL.
Initial testing was with the K562 cell line which is positive for CML and the BCR:ABL gene
fusion. Initial lysis testing with K562 cells is shown in Figure 8.16. Samples of K562 cells
containing 105 cells/mL in PBS buffer were loaded into syringes and placed in the syringe pump
as in Figure 3.4. Control samples were flowed through the microchannel at a rate of 20µL/min
with 0V applied to the channel (Figure 8.16A) where no observable lysis occurs. When a
potential of 500V is applied, we observe total lysis of cells (Figure 8.16B) with no intact cells
and only cell debris visible in the collected lysate. Following the same experimental workflow as
shown in Figure 8.12 we analyzed K562 lysates using our NME platform. Electrochemical
detection of K562 lysates in buffer is shown in Figure 8.16C. We show that we can detect down
to 10 cells and up to 1000 cells in a sample volume of 30µL versus negative control probes. We
were also successful in using this method to lyse samples of blood spiked with K562 and positive
CML leukocyte patient samples, and accurately determine the presence of the BCR:ABL gene
fusion with our NME detection platform [2]
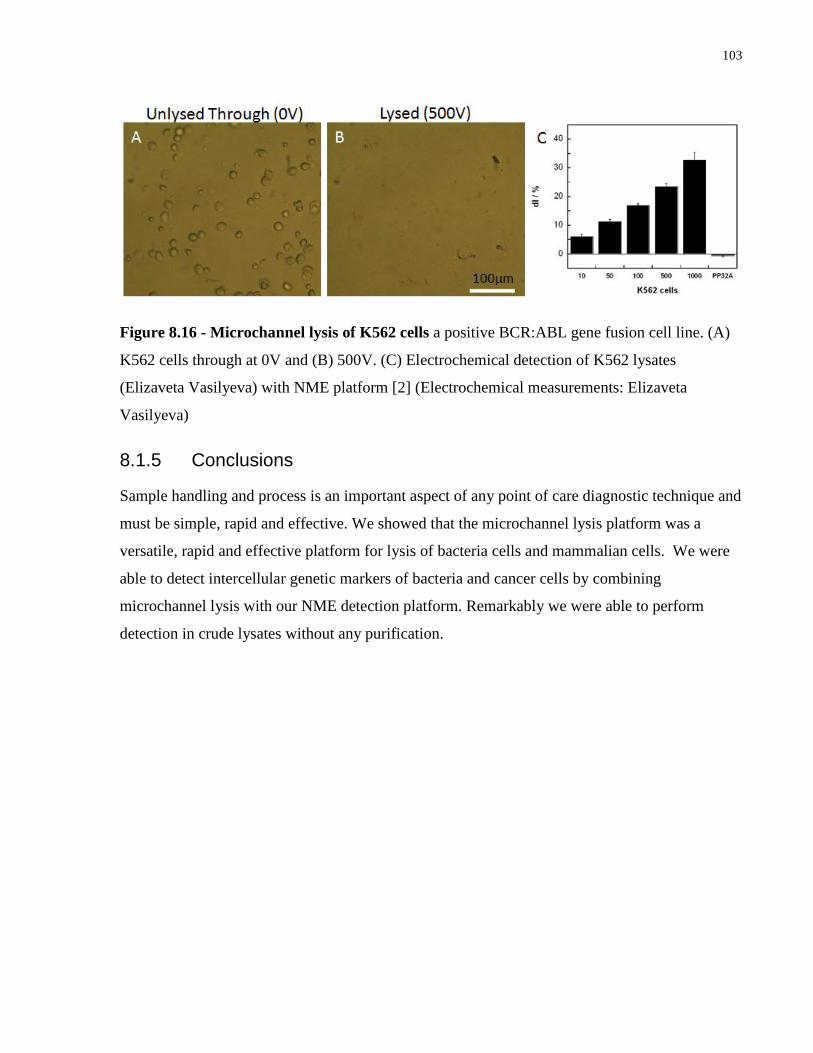
103
Figure 8.16 - Microchannel lysis of K562 cells a positive BCR:ABL gene fusion cell line. (A)
K562 cells through at 0V and (B) 500V. (C) Electrochemical detection of K562 lysates
(Elizaveta Vasilyeva) with NME platform [2] (Electrochemical measurements: Elizaveta
Vasilyeva)
8.1.5 Conclusions
Sample handling and process is an important aspect of any point of care diagnostic technique and
must be simple, rapid and effective. We showed that the microchannel lysis platform was a
versatile, rapid and effective platform for lysis of bacteria cells and mammalian cells. We were
able to detect intercellular genetic markers of bacteria and cancer cells by combining
microchannel lysis with our NME detection platform. Remarkably we were able to perform
detection in crude lysates without any purification.
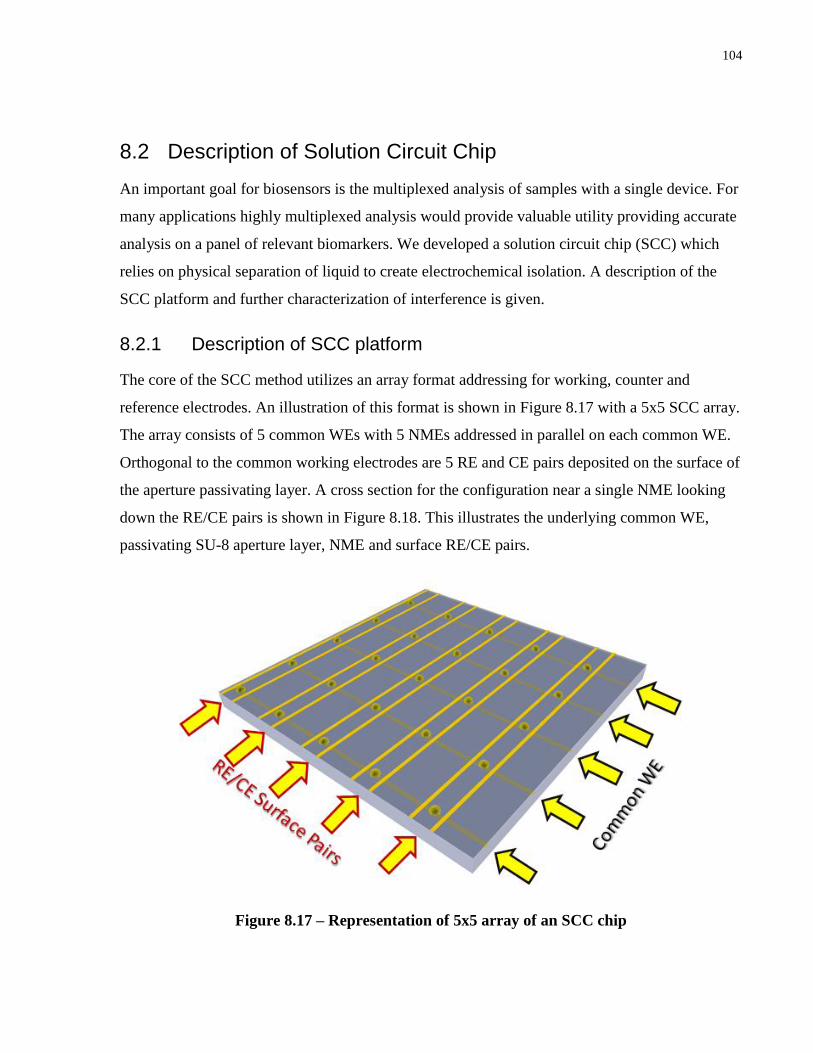
104
8.2 Description of Solution Circuit Chip
An important goal for biosensors is the multiplexed analysis of samples with a single device. For
many applications highly multiplexed analysis would provide valuable utility providing accurate
analysis on a panel of relevant biomarkers. We developed a solution circuit chip (SCC) which
relies on physical separation of liquid to create electrochemical isolation. A description of the
SCC platform and further characterization of interference is given.
8.2.1 Description of SCC platform
The core of the SCC method utilizes an array format addressing for working, counter and
reference electrodes. An illustration of this format is shown in Figure 8.17 with a 5x5 SCC array.
The array consists of 5 common WEs with 5 NMEs addressed in parallel on each common WE.
Orthogonal to the common working electrodes are 5 RE and CE pairs deposited on the surface of
the aperture passivating layer. A cross section for the configuration near a single NME looking
down the RE/CE pairs is shown in Figure 8.18. This illustrates the underlying common WE,
passivating SU-8 aperture layer, NME and surface RE/CE pairs.
Figure 8.17 – Representation of 5x5 array of an SCC chip
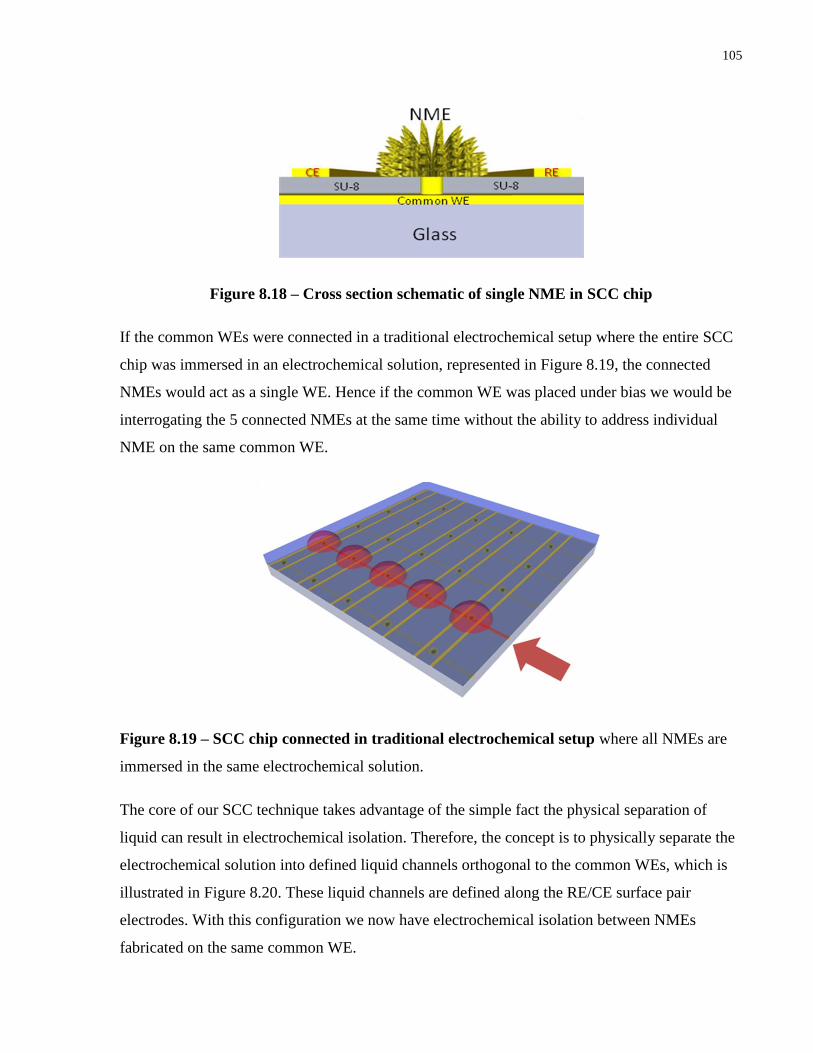
105
Figure 8.18 – Cross section schematic of single NME in SCC chip
If the common WEs were connected in a traditional electrochemical setup where the entire SCC
chip was immersed in an electrochemical solution, represented in Figure 8.19, the connected
NMEs would act as a single WE. Hence if the common WE was placed under bias we would be
interrogating the 5 connected NMEs at the same time without the ability to address individual
NME on the same common WE.
Figure 8.19 – SCC chip connected in traditional electrochemical setup where all NMEs are
immersed in the same electrochemical solution.
The core of our SCC technique takes advantage of the simple fact the physical separation of
liquid can result in electrochemical isolation. Therefore, the concept is to physically separate the
electrochemical solution into defined liquid channels orthogonal to the common WEs, which is
illustrated in Figure 8.20. These liquid channels are defined along the RE/CE surface pair
electrodes. With this configuration we now have electrochemical isolation between NMEs
fabricated on the same common WE.
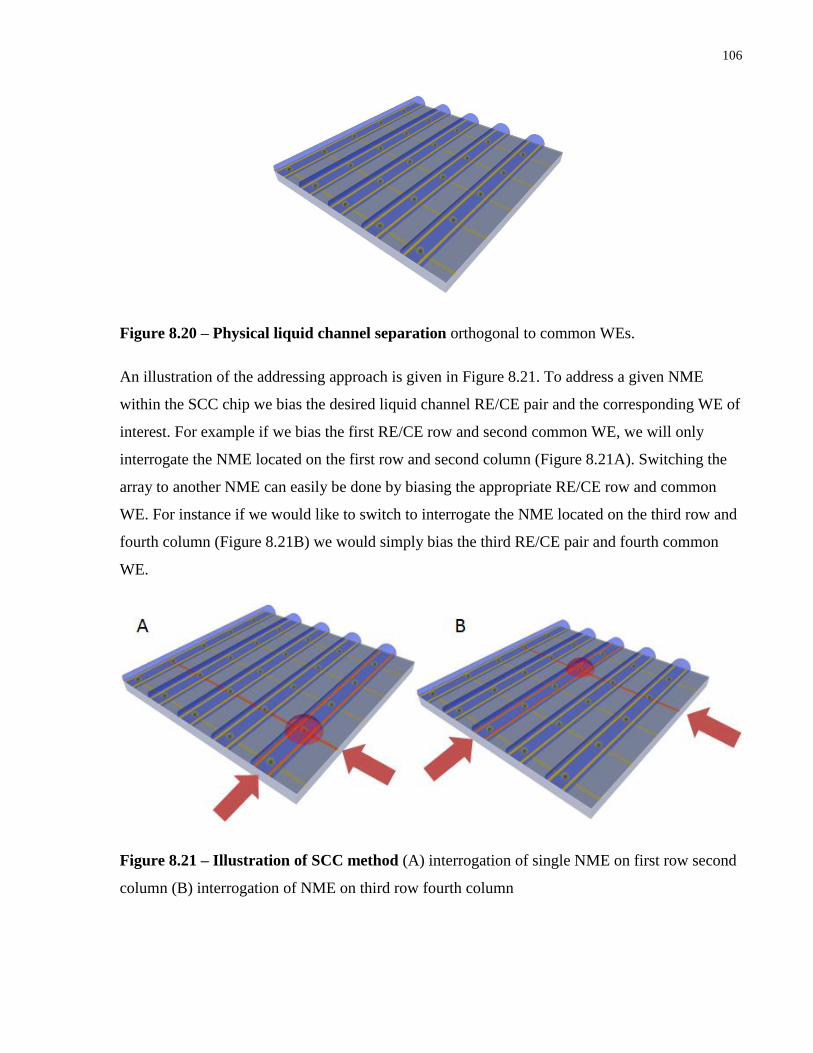
106
Figure 8.20 – Physical liquid channel separation orthogonal to common WEs.
An illustration of the addressing approach is given in Figure 8.21. To address a given NME
within the SCC chip we bias the desired liquid channel RE/CE pair and the corresponding WE of
interest. For example if we bias the first RE/CE row and second common WE, we will only
interrogate the NME located on the first row and second column (Figure 8.21A). Switching the
array to another NME can easily be done by biasing the appropriate RE/CE row and common
WE. For instance if we would like to switch to interrogate the NME located on the third row and
fourth column (Figure 8.21B) we would simply bias the third RE/CE pair and fourth common
WE.
Figure 8.21 – Illustration of SCC method (A) interrogation of single NME on first row second
column (B) interrogation of NME on third row fourth column
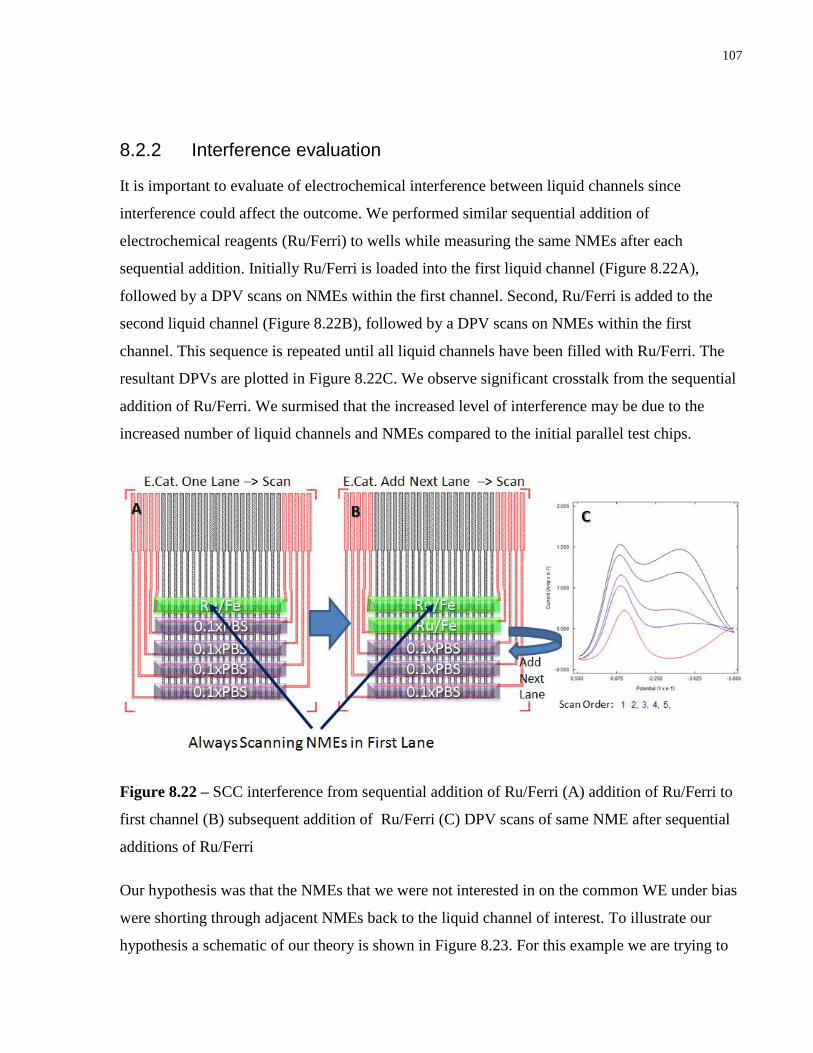
107
8.2.2 Interference evaluation
It is important to evaluate of electrochemical interference between liquid channels since
interference could affect the outcome. We performed similar sequential addition of
electrochemical reagents (Ru/Ferri) to wells while measuring the same NMEs after each
sequential addition. Initially Ru/Ferri is loaded into the first liquid channel (Figure 8.22A),
followed by a DPV scans on NMEs within the first channel. Second, Ru/Ferri is added to the
second liquid channel (Figure 8.22B), followed by a DPV scans on NMEs within the first
channel. This sequence is repeated until all liquid channels have been filled with Ru/Ferri. The
resultant DPVs are plotted in Figure 8.22C. We observe significant crosstalk from the sequential
addition of Ru/Ferri. We surmised that the increased level of interference may be due to the
increased number of liquid channels and NMEs compared to the initial parallel test chips.
Figure 8.22 – SCC interference from sequential addition of Ru/Ferri (A) addition of Ru/Ferri to
first channel (B) subsequent addition of Ru/Ferri (C) DPV scans of same NME after sequential
additions of Ru/Ferri
Our hypothesis was that the NMEs that we were not interested in on the common WE under bias
were shorting through adjacent NMEs back to the liquid channel of interest. To illustrate our
hypothesis a schematic of our theory is shown in Figure 8.23. For this example we are trying to
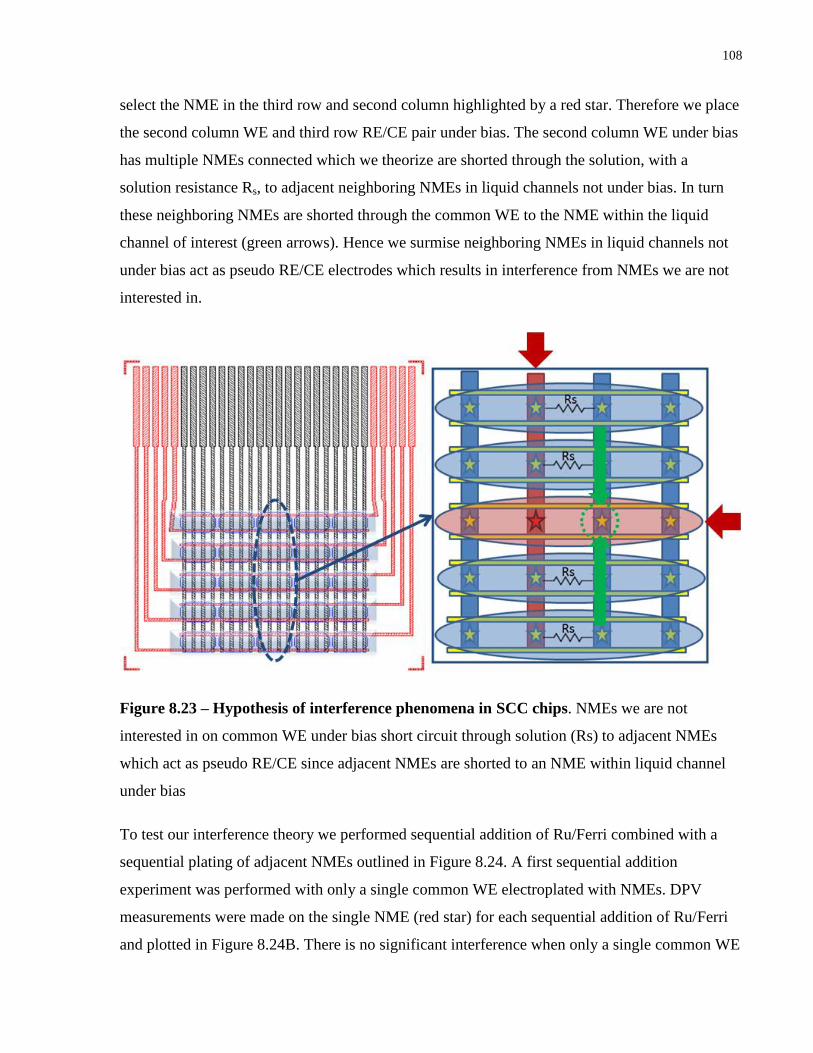
108
select the NME in the third row and second column highlighted by a red star. Therefore we place
the second column WE and third row RE/CE pair under bias. The second column WE under bias
has multiple NMEs connected which we theorize are shorted through the solution, with a
solution resistance Rs, to adjacent neighboring NMEs in liquid channels not under bias. In turn
these neighboring NMEs are shorted through the common WE to the NME within the liquid
channel of interest (green arrows). Hence we surmise neighboring NMEs in liquid channels not
under bias act as pseudo RE/CE electrodes which results in interference from NMEs we are not
interested in.
Figure 8.23 – Hypothesis of interference phenomena in SCC chips. NMEs we are not
interested in on common WE under bias short circuit through solution (Rs) to adjacent NMEs
which act as pseudo RE/CE since adjacent NMEs are shorted to an NME within liquid channel
under bias
To test our interference theory we performed sequential addition of Ru/Ferri combined with a
sequential plating of adjacent NMEs outlined in Figure 8.24. A first sequential addition
experiment was performed with only a single common WE electroplated with NMEs. DPV
measurements were made on the single NME (red star) for each sequential addition of Ru/Ferri
and plotted in Figure 8.24B. There is no significant interference when only a single common WE
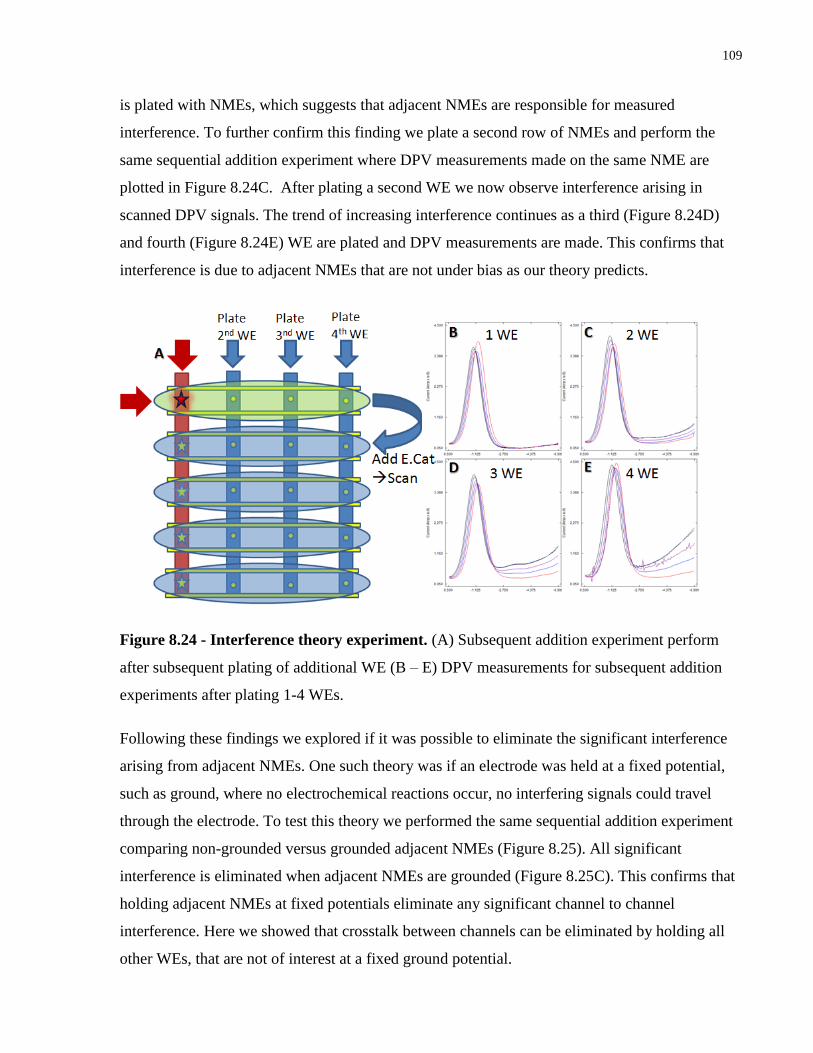
109
is plated with NMEs, which suggests that adjacent NMEs are responsible for measured
interference. To further confirm this finding we plate a second row of NMEs and perform the
same sequential addition experiment where DPV measurements made on the same NME are
plotted in Figure 8.24C. After plating a second WE we now observe interference arising in
scanned DPV signals. The trend of increasing interference continues as a third (Figure 8.24D)
and fourth (Figure 8.24E) WE are plated and DPV measurements are made. This confirms that
interference is due to adjacent NMEs that are not under bias as our theory predicts.
Figure 8.24 - Interference theory experiment. (A) Subsequent addition experiment perform
after subsequent plating of additional WE (B – E) DPV measurements for subsequent addition
experiments after plating 1-4 WEs.
Following these findings we explored if it was possible to eliminate the significant interference
arising from adjacent NMEs. One such theory was if an electrode was held at a fixed potential,
such as ground, where no electrochemical reactions occur, no interfering signals could travel
through the electrode. To test this theory we performed the same sequential addition experiment
comparing non-grounded versus grounded adjacent NMEs (Figure 8.25). All significant
interference is eliminated when adjacent NMEs are grounded (Figure 8.25C). This confirms that
holding adjacent NMEs at fixed potentials eliminate any significant channel to channel
interference. Here we showed that crosstalk between channels can be eliminated by holding all
other WEs, that are not of interest at a fixed ground potential.
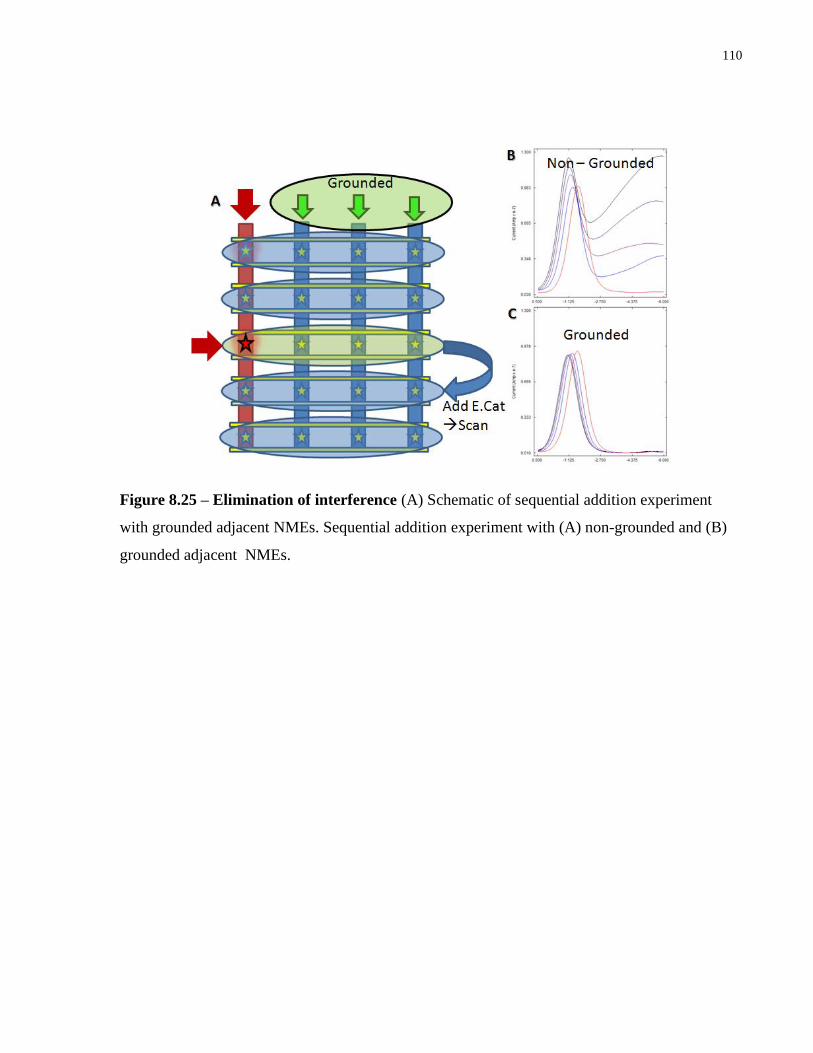
110
Figure 8.25 – Elimination of interference (A) Schematic of sequential addition experiment
with grounded adjacent NMEs. Sequential addition experiment with (A) non-grounded and (B)
grounded adjacent NMEs.
111
8.3 References
1. Soleymani, L. et al. Hierarchical nanotextured microelectrodes overcome the molecular
transport barrier to achieve rapid, direct bacterial detection. ACS nano 5, 3360–6 (2011).
2. Vasilyeva, E. et al. Direct genetic analysis of ten cancer cells: tuning sensor structure and
molecular probe design for efficient mRNA capture. Angewandtbe Chemie (International
ed. in English) 50, 4137–41 (2011).
3. Sale, A. J. H. . H. Effects of high electric field on microorganisms I. Killing of bacteria and
yeasts. Biochim. Biophys. Acta 148, 781–788 (1967).
4. Hamilton, W. A.; Sale, A. J. H. Effects of high electric fields on microorganisms: II.
Mechanism of action of lethal effect. Biochim. Biophys. Acta 48, 789–800 (1967).
5. Wang, H.-Y., Bhunia, A. K. & Lu, C. A microfluidic flow-through device for high
throughput electrical lysis of bacterial cells based on continuous dc voltage. Biosensors &
bioelectronics 22, 582–8 (2006).