Embed Size (px)
Citation preview
19 Shea Way, Newark, DE 19713 Tel: (302) 368-7824 Fax: (302) 368-7830 Web: www.bwtek.com 290020235-G (09/16/2015) Copyright 2015 B&W Tek, Inc.
BWSpec™ 4 Software User Manual

19 Shea Way, Newark, DE 19713 Tel: (302) 368-7824 Fax: (302) 368-7830 Web: www.bwtek.com 290020235-G (09/16/2015) Copyright 2015 B&W Tek, Inc.
Table of Contents 1 Introduction _____________________________________________________________________ 1
2 Installation ______________________________________________________________________ 1
2.1 Supported Operating Systems __________________________________________________________ 1
2.2 Minimum System Requirements ________________________________________________________ 1
2.3 Software & Hardware Installation _______________________________________________________ 1
3 Run BWSpec _____________________________________________________________________ 2
4 Main Window ____________________________________________________________________ 3
5 Menu Bar _______________________________________________________________________ 3
5.1 File ________________________________________________________________________________ 4
5.2 View _______________________________________________________________________________ 7
5.3 Acquire ___________________________________________________________________________ 14
5.4 Tools______________________________________________________________________________ 15
5.5 Option ____________________________________________________________________________ 20
5.6 Plug-in ____________________________________________________________________________ 22
5.7 Setup _____________________________________________________________________________ 23
5.8 Help ______________________________________________________________________________ 27
5.9 Language __________________________________________________________________________ 28
6 Toolbar ________________________________________________________________________ 29
6.1 Open _____________________________________________________________________________ 29
6.2 Save ______________________________________________________________________________ 29
6.3 Print ______________________________________________________________________________ 30
6.4 Excel ______________________________________________________________________________ 30
6.5 Integration Time Control______________________________________________________________ 30
6.6 Acquire Control _____________________________________________________________________ 31
6.7 Reset Graph ________________________________________________________________________ 31
6.8 Clear Display _______________________________________________________________________ 31

19 Shea Way, Newark, DE 19713 Tel: (302) 368-7824 Fax: (302) 368-7830 Web: www.bwtek.com 290020235-G (09/16/2015) Copyright 2015 B&W Tek, Inc.
6.9 Display Scales ______________________________________________________________________ 31
7 Spectrum List Panel ______________________________________________________________ 32
8 Spectrometer Control Panel ________________________________________________________ 33
8.1 Enable Cursor ______________________________________________________________________ 34
8.2 Dual Chart _________________________________________________________________________ 35
8.3 X Axis Unit _________________________________________________________________________ 35
8.4 Y Axis Type ________________________________________________________________________ 36
8.5 Acquire Control _____________________________________________________________________ 37
9 Spectrum Information Panel _______________________________________________________ 38
10 Status Bar ____________________________________________________________________ 39
11 Plug-In Manager _______________________________________________________________ 40
11.1 Background Removal Plug-in __________________________________________________________ 41
11.2 BAC-151x Camera Plug-in _____________________________________________________________ 42
11.3 Export Data Plug-in __________________________________________________________________ 43
11.4 Irradiance Correction Plug-in __________________________________________________________ 44
11.5 Linearity Correction Plug-in ___________________________________________________________ 48
11.6 Reference Material Correction Plug-in ___________________________________________________ 54
11.7 Relative Intensity Correction Plug-in ____________________________________________________ 56
11.8 Spectra Math Plug-in ________________________________________________________________ 60
11.9 Timeline Plug-in ____________________________________________________________________ 62
11.10 Wavelength Calibration Plug-in ______________________________________________________ 67
11.11 Raman Shift Calibration Plug-in ______________________________________________________ 67
11.12 Performance Test Plug-in ___________________________________________________________ 67
11.13 System Response Standardization ____________________________________________________ 75
12 Color Measurement ____________________________________________________________ 75
13 Irradiance Ratio File Data Definition _______________________________________________ 87
14 Definition of Irradiance Data File Format ___________________________________________ 88 Appendix A: Declaration of Text File___________________________________________________ 89
19 Shea Way, Newark, DE 19713 Tel: (302) 368-7824 Fax: (302) 368-7830 Web: www.bwtek.com 290020235-G (09/16/2015) Page 1 of 91 Copyright 2015 B&W Tek, Inc.
1 INTRODUCTION BWSpec™ 4 is a Spectrometer Data Acquisition Software Program. It supports two types of B&W Tek, Inc. spectrometer interface: USB2.0 and USB 3.0.
2 INSTALLATION
2.1 Supported Operating Systems
Windows XP (32 bit) Windows Vista (32 bit & 64 bit) Windows 7 (32 bit & 64 bit) Windows 8 / 8.1 (32 bit & 64 bit) *Note although the above operating systems are supported, Windows 7 and 8 / 8.1 are preferred.
2.2 Minimum System Requirements
Meets or exceeds the System Requirements for your PC’s Operating System respectively Processor: 1.5GHz or faster RAM: 1GB or more Hard disk space: 250MB available or more*
* Excluding additional hard disk space required to store generated data by the application.
2.3 Software & Hardware Installation
• Insert the BWSpec 4 CD into the computer’s CD/DVD Drive; if it’s in a USB flash drive, copy the installation file to local computer.
• Refer to “BWSpec Software and Hardware Installation Guide”: o General Installation Guidelines
Install the software; After software installation, do not run/open the BWSpec program; Connect the spectrometer to the PC via an USB Cable; Install the Hardware Driver(s) for the spectrometer; After hardware driver installation, open/run the BWSpec program.
19 Shea Way, Newark, DE 19713 Tel: (302) 368-7824 Fax: (302) 368-7830 Web: www.bwtek.com 290020235-G (09/16/2015) Page 2 of 91 Copyright 2015 B&W Tek, Inc.
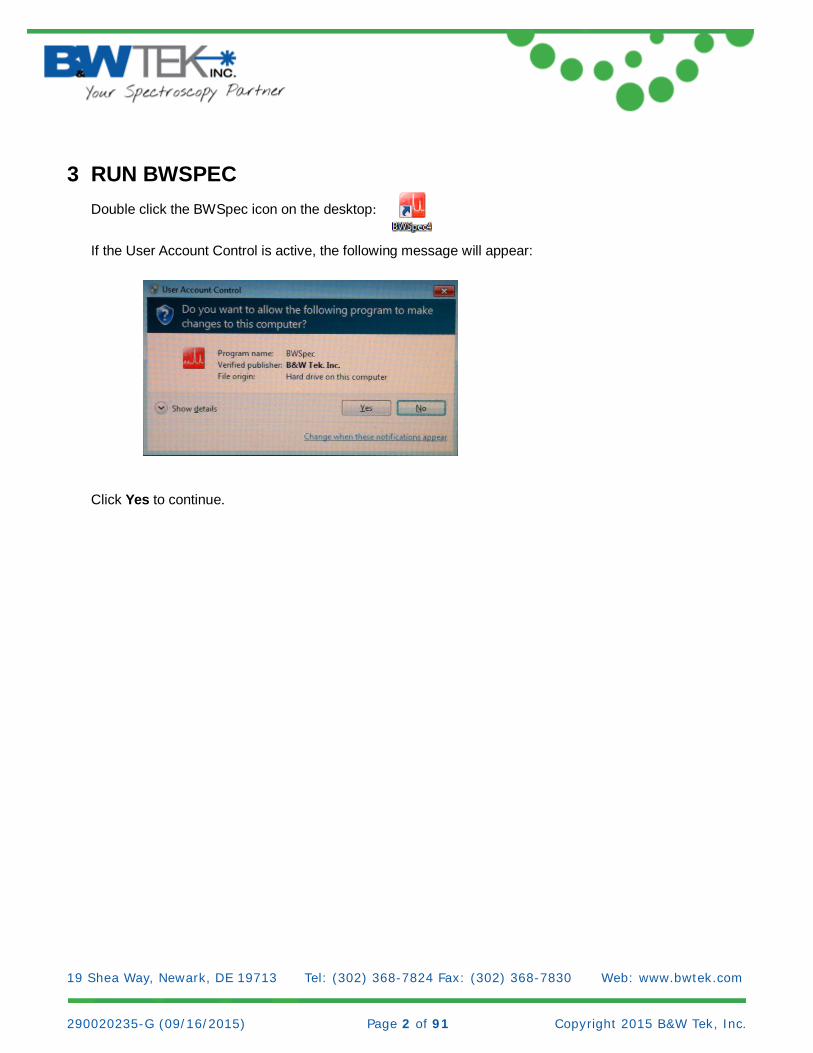
3 RUN BWSPEC Double click the BWSpec icon on the desktop:
If the User Account Control is active, the following message will appear: Click Yes to continue.
19 Shea Way, Newark, DE 19713 Tel: (302) 368-7824 Fax: (302) 368-7830 Web: www.bwtek.com 290020235-G (09/16/2015) Page 3 of 91 Copyright 2015 B&W Tek, Inc.
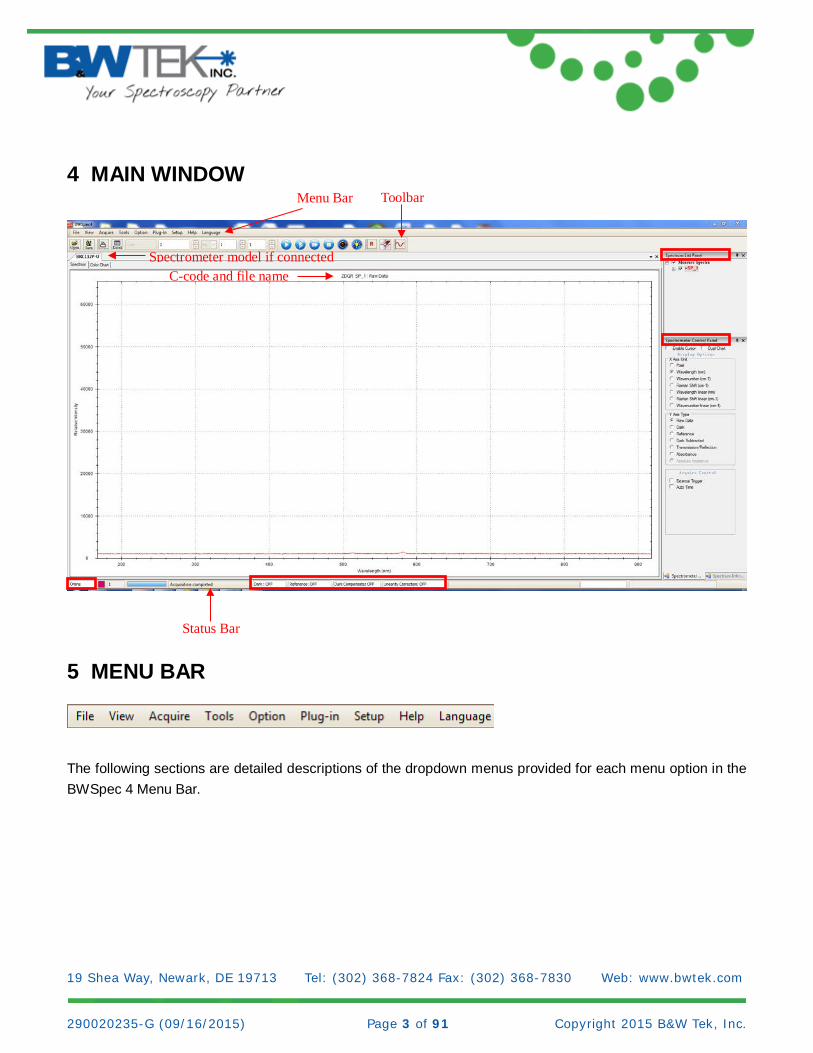
4 MAIN WINDOW
5 MENU BAR
The following sections are detailed descriptions of the dropdown menus provided for each menu option in the BWSpec 4 Menu Bar.
Menu Bar Toolbar
Spectrometer model if connected
Status Bar
C-code and file name

19 Shea Way, Newark, DE 19713 Tel: (302) 368-7824 Fax: (302) 368-7830 Web: www.bwtek.com 290020235-G (09/16/2015) Page 4 of 91 Copyright 2015 B&W Tek, Inc.
5.1 File
• Open Spectrum…
o Open a window to load a spectrum file. • Save Selected Spectrum…
o Open a window to save the spectrum selected in the Spectrum List Panel.
• Save All Spectra As…(Manually)
o Open a window to save one after another, all the spectra listed in the Spectrum List Panel.
19 Shea Way, Newark, DE 19713 Tel: (302) 368-7824 Fax: (302) 368-7830 Web: www.bwtek.com 290020235-G (09/16/2015) Page 5 of 91 Copyright 2015 B&W Tek, Inc.
• Save All Spectra…(Automatically) o Open a window to save all the spectra in the Spectrum List Panel all at once.
• Save All Spectra into a BIN File… o Open a window to save all the spectra in the Spectrum List Panel all at once with .BwRams
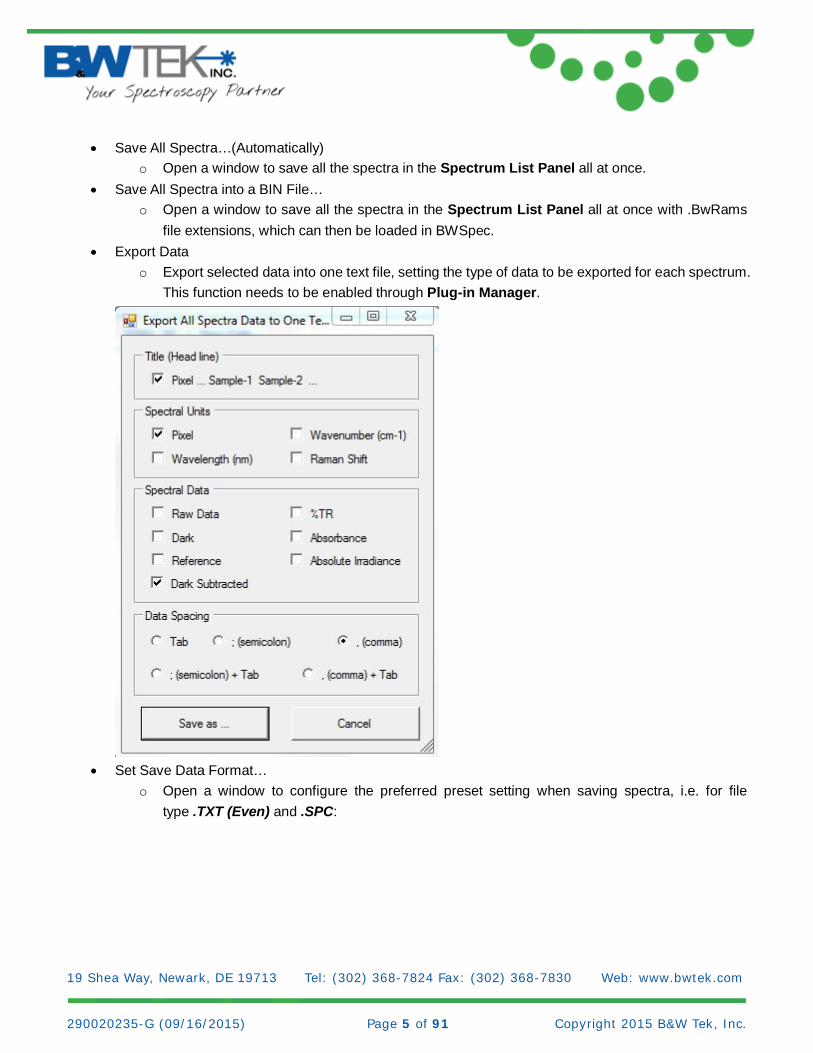
file extensions, which can then be loaded in BWSpec. • Export Data
o Export selected data into one text file, setting the type of data to be exported for each spectrum. This function needs to be enabled through Plug-in Manager.
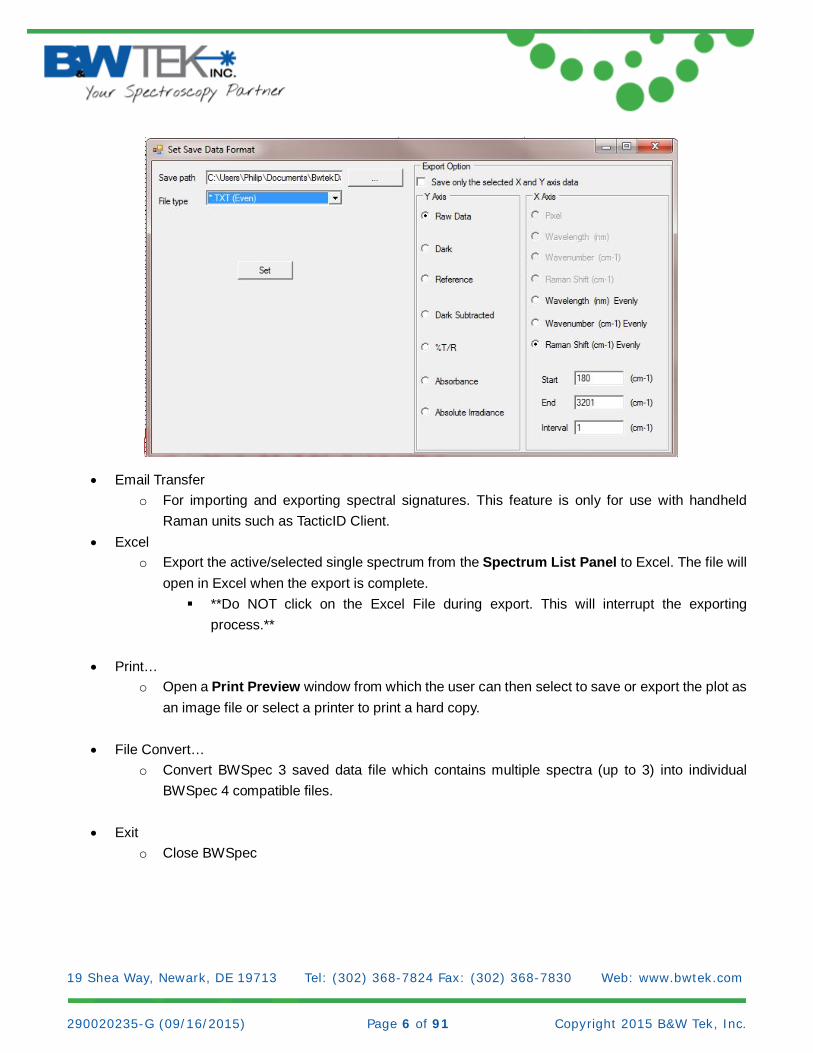
• Set Save Data Format…
o Open a window to configure the preferred preset setting when saving spectra, i.e. for file type .TXT (Even) and .SPC:
19 Shea Way, Newark, DE 19713 Tel: (302) 368-7824 Fax: (302) 368-7830 Web: www.bwtek.com 290020235-G (09/16/2015) Page 6 of 91 Copyright 2015 B&W Tek, Inc.
• Email Transfer o For importing and exporting spectral signatures. This feature is only for use with handheld
Raman units such as TacticID Client. • Excel
o Export the active/selected single spectrum from the Spectrum List Panel to Excel. The file will open in Excel when the export is complete. **Do NOT click on the Excel File during export. This will interrupt the exporting
process.**
• Print… o Open a Print Preview window from which the user can then select to save or export the plot as
an image file or select a printer to print a hard copy.
• File Convert… o Convert BWSpec 3 saved data file which contains multiple spectra (up to 3) into individual
BWSpec 4 compatible files.
• Exit o Close BWSpec
19 Shea Way, Newark, DE 19713 Tel: (302) 368-7824 Fax: (302) 368-7830 Web: www.bwtek.com 290020235-G (09/16/2015) Page 7 of 91 Copyright 2015 B&W Tek, Inc.
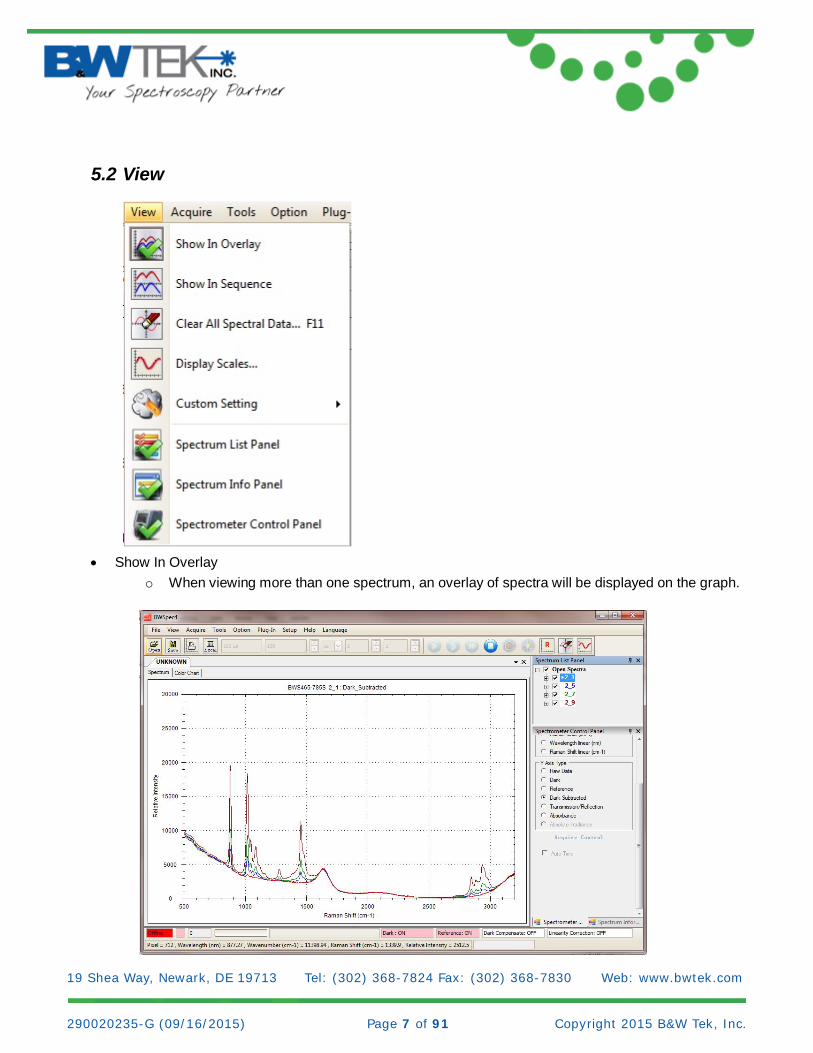
5.2 View
• Show In Overlay
o When viewing more than one spectrum, an overlay of spectra will be displayed on the graph.
19 Shea Way, Newark, DE 19713 Tel: (302) 368-7824 Fax: (302) 368-7830 Web: www.bwtek.com 290020235-G (09/16/2015) Page 8 of 91 Copyright 2015 B&W Tek, Inc.
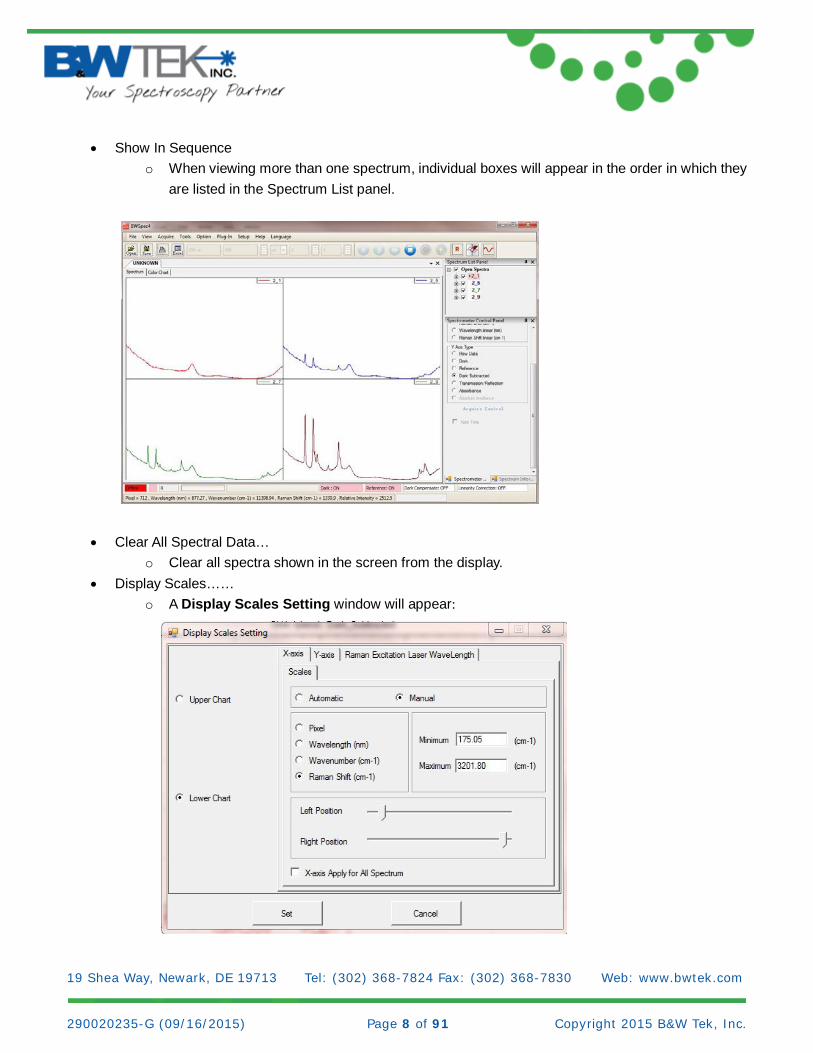
• Show In Sequence o When viewing more than one spectrum, individual boxes will appear in the order in which they
are listed in the Spectrum List panel.
• Clear All Spectral Data… o Clear all spectra shown in the screen from the display.
• Display Scales…… o A Display Scales Setting window will appear:

19 Shea Way, Newark, DE 19713 Tel: (302) 368-7824 Fax: (302) 368-7830 Web: www.bwtek.com 290020235-G (09/16/2015) Page 9 of 91 Copyright 2015 B&W Tek, Inc.
o This window will show the X-axis and Y-axis settings for the software for the spectrometer.
X-axis scale settings are based on the calibration settings for the spectrometer.
• Custom Setting o Spectra Color Setting…
Opens a Spectra Color Settings window where the spectrum color order for overlays can be set / adjusted. The sequence is based on spectrums listed in the spectrum list panel.
19 Shea Way, Newark, DE 19713 Tel: (302) 368-7824 Fax: (302) 368-7830 Web: www.bwtek.com 290020235-G (09/16/2015) Page 10 of 91 Copyright 2015 B&W Tek, Inc.
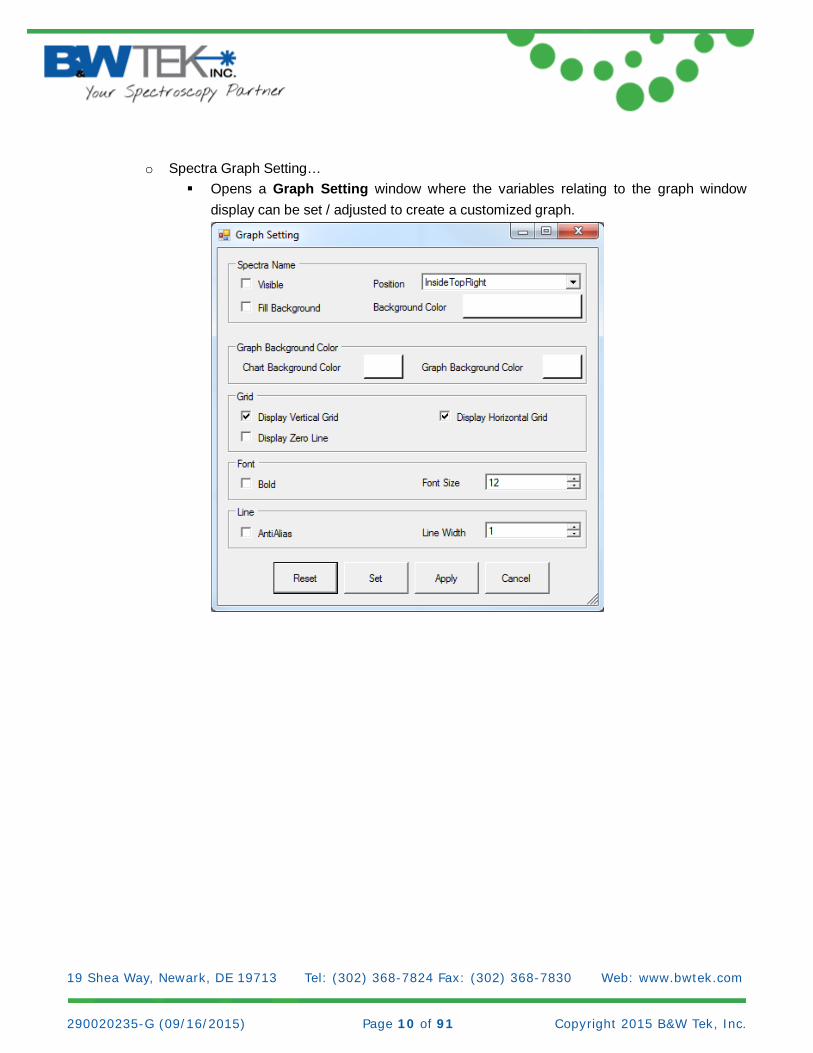
o Spectra Graph Setting…
Opens a Graph Setting window where the variables relating to the graph window display can be set / adjusted to create a customized graph.
19 Shea Way, Newark, DE 19713 Tel: (302) 368-7824 Fax: (302) 368-7830 Web: www.bwtek.com 290020235-G (09/16/2015) Page 11 of 91 Copyright 2015 B&W Tek, Inc.
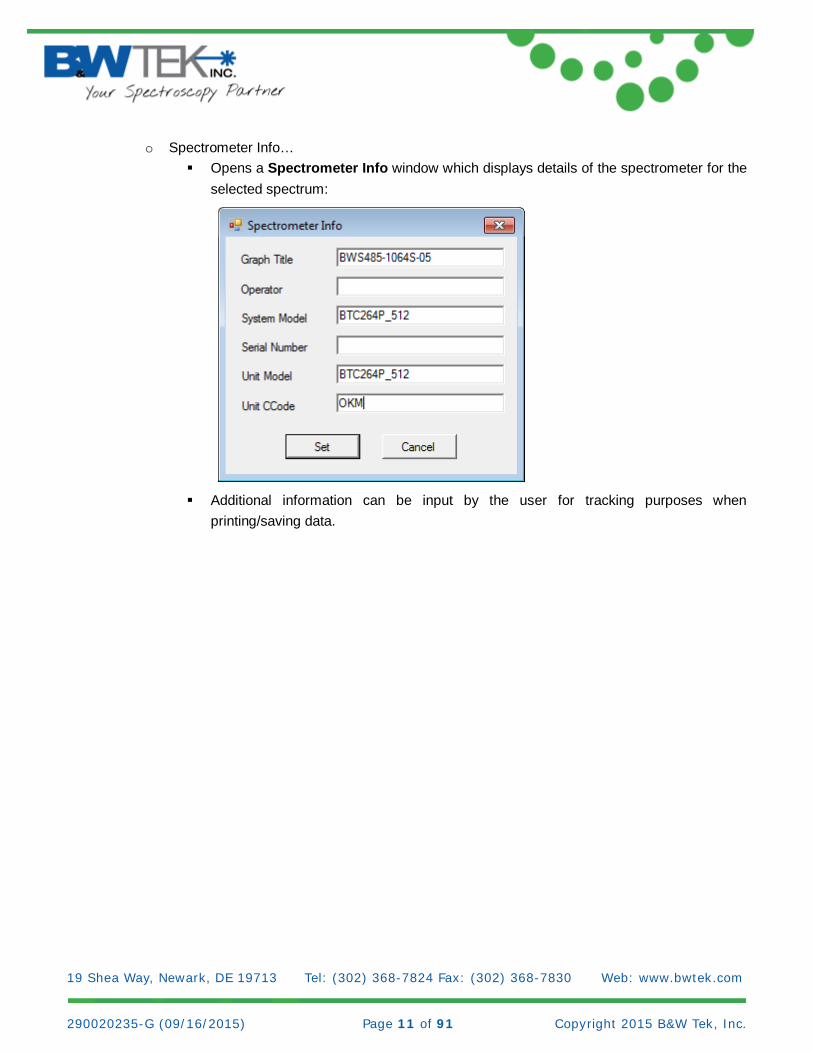
o Spectrometer Info… Opens a Spectrometer Info window which displays details of the spectrometer for the
selected spectrum:
Additional information can be input by the user for tracking purposes when
printing/saving data.
19 Shea Way, Newark, DE 19713 Tel: (302) 368-7824 Fax: (302) 368-7830 Web: www.bwtek.com 290020235-G (09/16/2015) Page 12 of 91 Copyright 2015 B&W Tek, Inc.
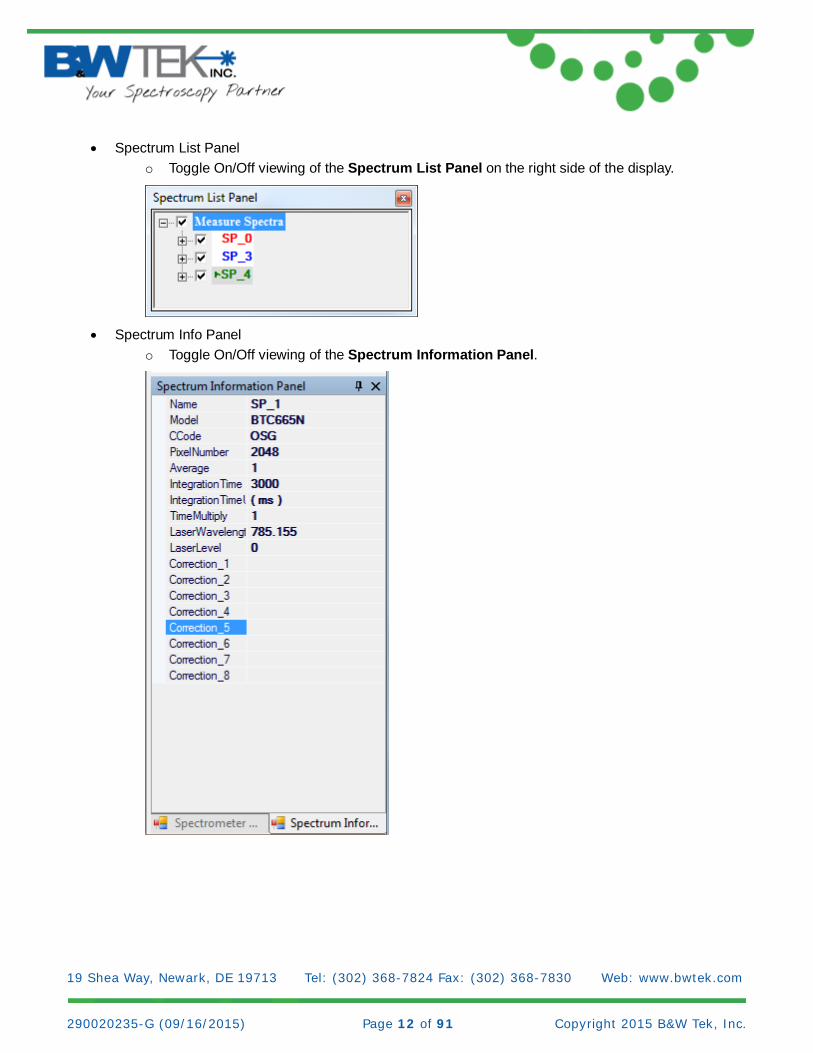
• Spectrum List Panel o Toggle On/Off viewing of the Spectrum List Panel on the right side of the display.
• Spectrum Info Panel
o Toggle On/Off viewing of the Spectrum Information Panel.
19 Shea Way, Newark, DE 19713 Tel: (302) 368-7824 Fax: (302) 368-7830 Web: www.bwtek.com 290020235-G (09/16/2015) Page 13 of 91 Copyright 2015 B&W Tek, Inc.
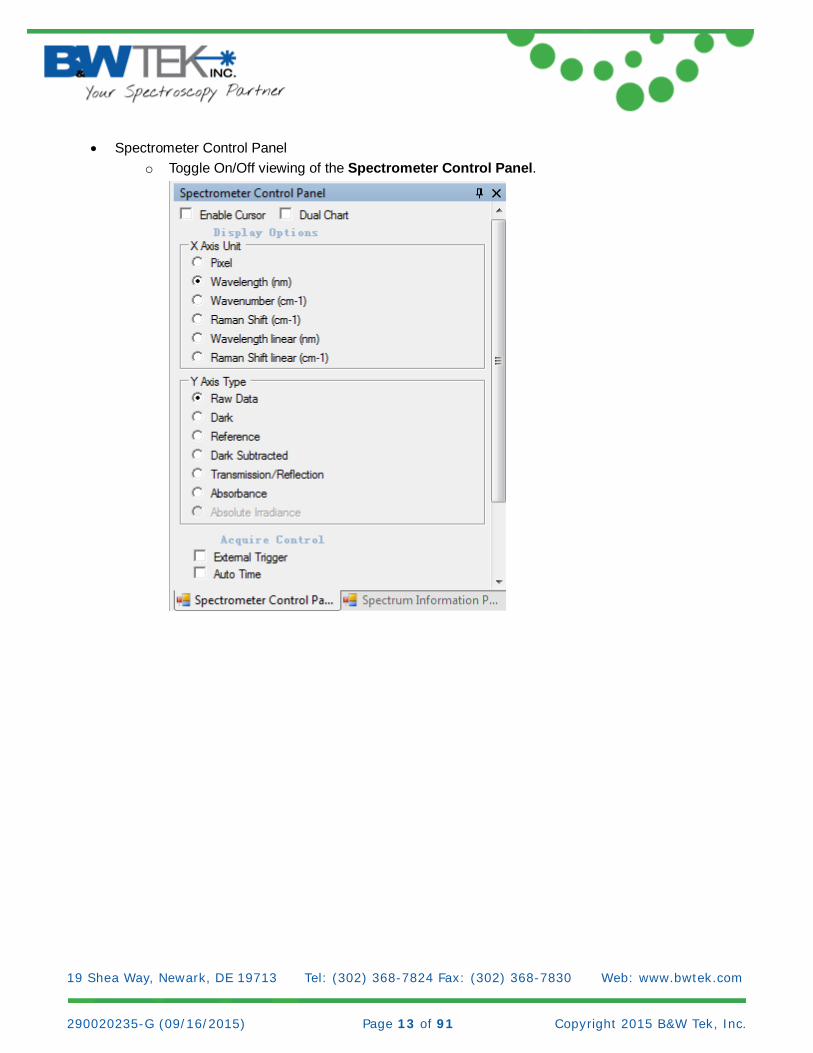
• Spectrometer Control Panel o Toggle On/Off viewing of the Spectrometer Control Panel.
19 Shea Way, Newark, DE 19713 Tel: (302) 368-7824 Fax: (302) 368-7830 Web: www.bwtek.com 290020235-G (09/16/2015) Page 14 of 91 Copyright 2015 B&W Tek, Inc.
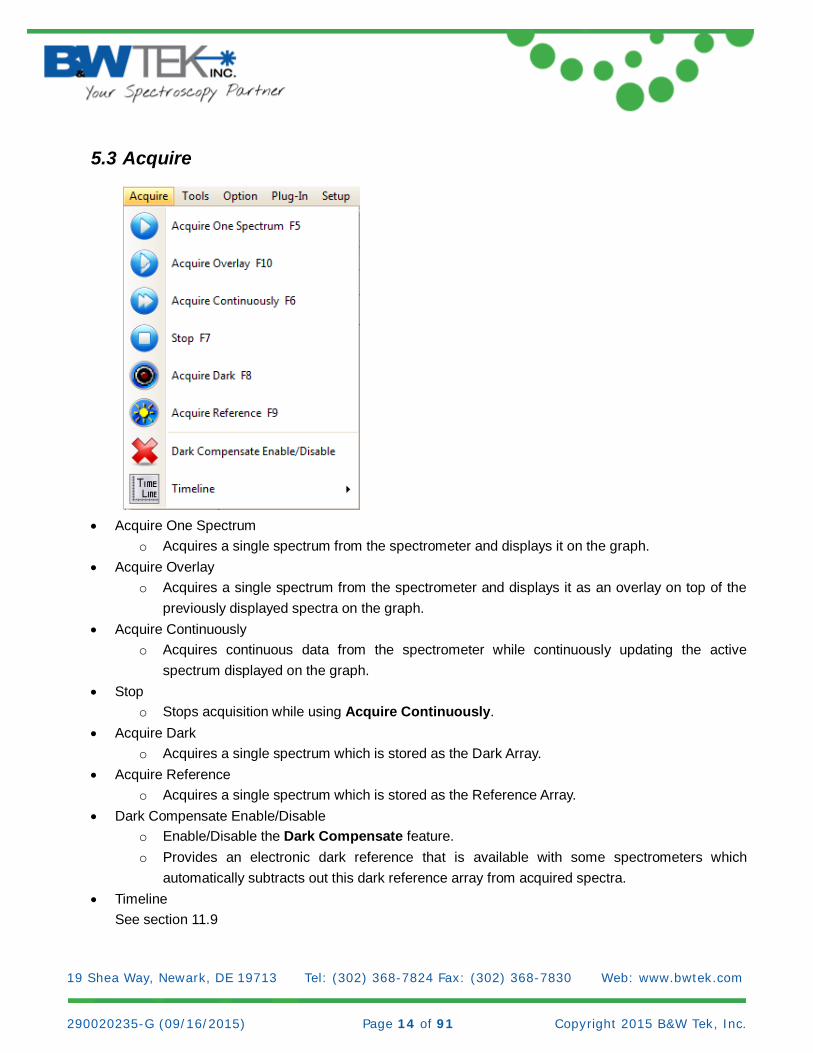
5.3 Acquire
• Acquire One Spectrum
o Acquires a single spectrum from the spectrometer and displays it on the graph. • Acquire Overlay
o Acquires a single spectrum from the spectrometer and displays it as an overlay on top of the previously displayed spectra on the graph.
• Acquire Continuously o Acquires continuous data from the spectrometer while continuously updating the active
spectrum displayed on the graph. • Stop
o Stops acquisition while using Acquire Continuously. • Acquire Dark
o Acquires a single spectrum which is stored as the Dark Array. • Acquire Reference
o Acquires a single spectrum which is stored as the Reference Array. • Dark Compensate Enable/Disable
o Enable/Disable the Dark Compensate feature. o Provides an electronic dark reference that is available with some spectrometers which
automatically subtracts out this dark reference array from acquired spectra. • Timeline
See section 11.9
19 Shea Way, Newark, DE 19713 Tel: (302) 368-7824 Fax: (302) 368-7830 Web: www.bwtek.com 290020235-G (09/16/2015) Page 15 of 91 Copyright 2015 B&W Tek, Inc.
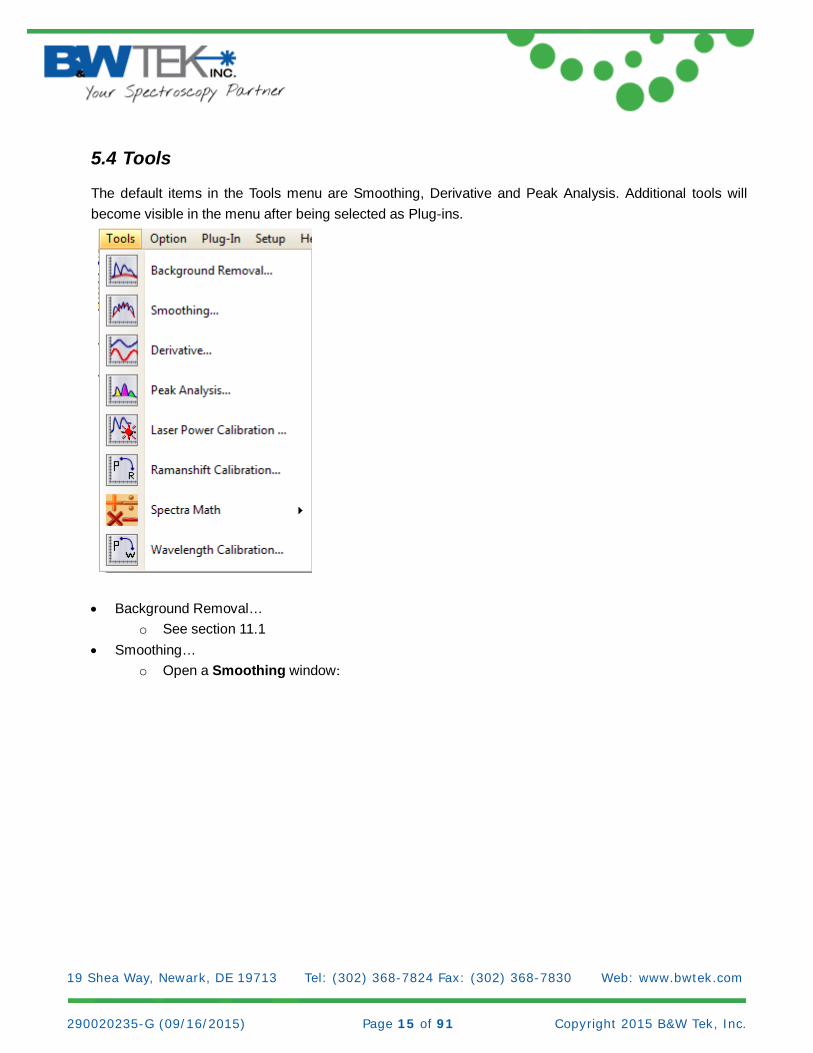
5.4 Tools
The default items in the Tools menu are Smoothing, Derivative and Peak Analysis. Additional tools will become visible in the menu after being selected as Plug-ins.
• Background Removal… o See section 11.1
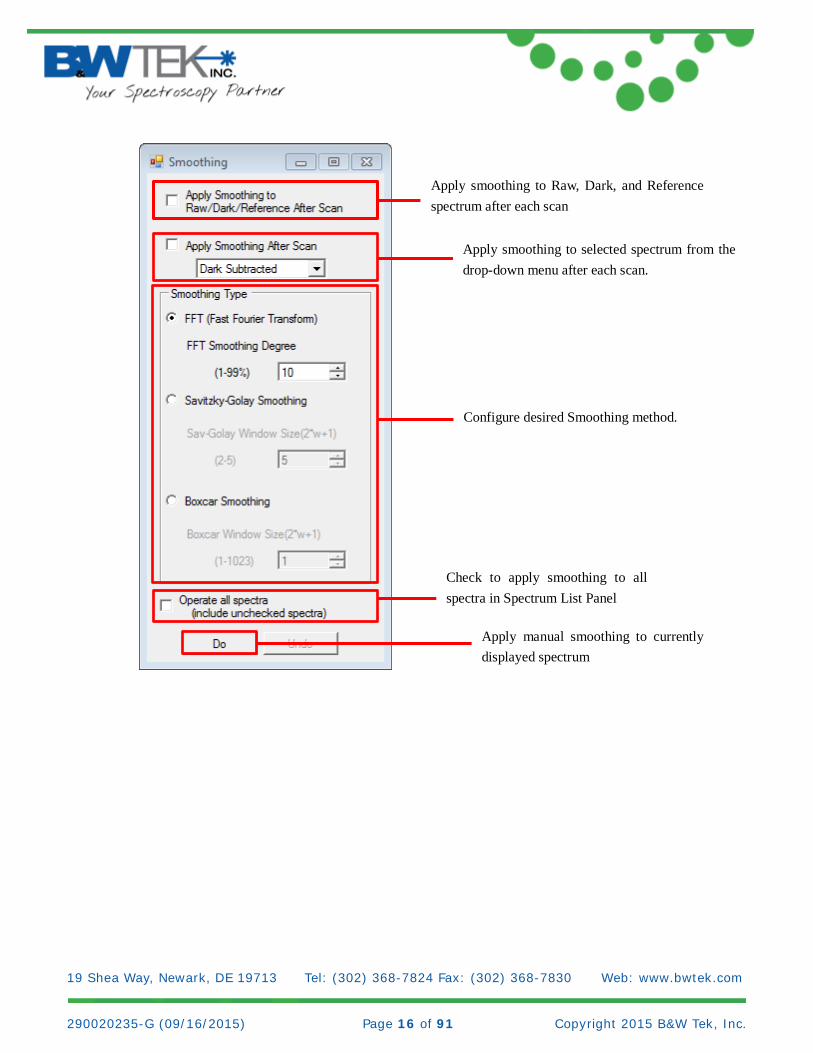
• Smoothing… o Open a Smoothing window:
19 Shea Way, Newark, DE 19713 Tel: (302) 368-7824 Fax: (302) 368-7830 Web: www.bwtek.com 290020235-G (09/16/2015) Page 16 of 91 Copyright 2015 B&W Tek, Inc.
Apply smoothing to Raw, Dark, and Reference spectrum after each scan
Apply smoothing to selected spectrum from the drop-down menu after each scan.
Configure desired Smoothing method.
Check to apply smoothing to all spectra in Spectrum List Panel
Apply manual smoothing to currently displayed spectrum

19 Shea Way, Newark, DE 19713 Tel: (302) 368-7824 Fax: (302) 368-7830 Web: www.bwtek.com 290020235-G (09/16/2015) Page 17 of 91 Copyright 2015 B&W Tek, Inc.
o FFT (Fast Fourier Transform) Smoothing can be applied to the original spectrum using a smoothing factor of 1-99%.
The smoothing factor needs to be carefully selected so as not to cause a distorted spectrum.
o Savitzky-Golay Smoothing Savitzky-Golay (Savitzky-Golay Filters): smoothing can be applied to the original
spectrum with a “window size” setting from 2-5. This is a very commonly used smoothing method with less chance to cause distortion and degradation to the spectral resolution.
o Boxcar Smoothing Boxcar: smoothing can be applied to the original spectrum using a “window size”
setting from 1-1023. The smoothing function will apply the forward moving smoothing by taking the average of the specified number of pixels plus one pixel to the left of the group and one pixel to the right of the group. This is an effective smoothing operation that comes at the expense of degraded spectral resolution; hence, do not use a larger than necessary “window size” setting in order to preserve the needed spectral information.
o Operate all spectra (include unchecked spectra) This will apply smoothing to all the currently open spectra, including all unchecked
spectra.
19 Shea Way, Newark, DE 19713 Tel: (302) 368-7824 Fax: (302) 368-7830 Web: www.bwtek.com 290020235-G (09/16/2015) Page 18 of 91 Copyright 2015 B&W Tek, Inc.
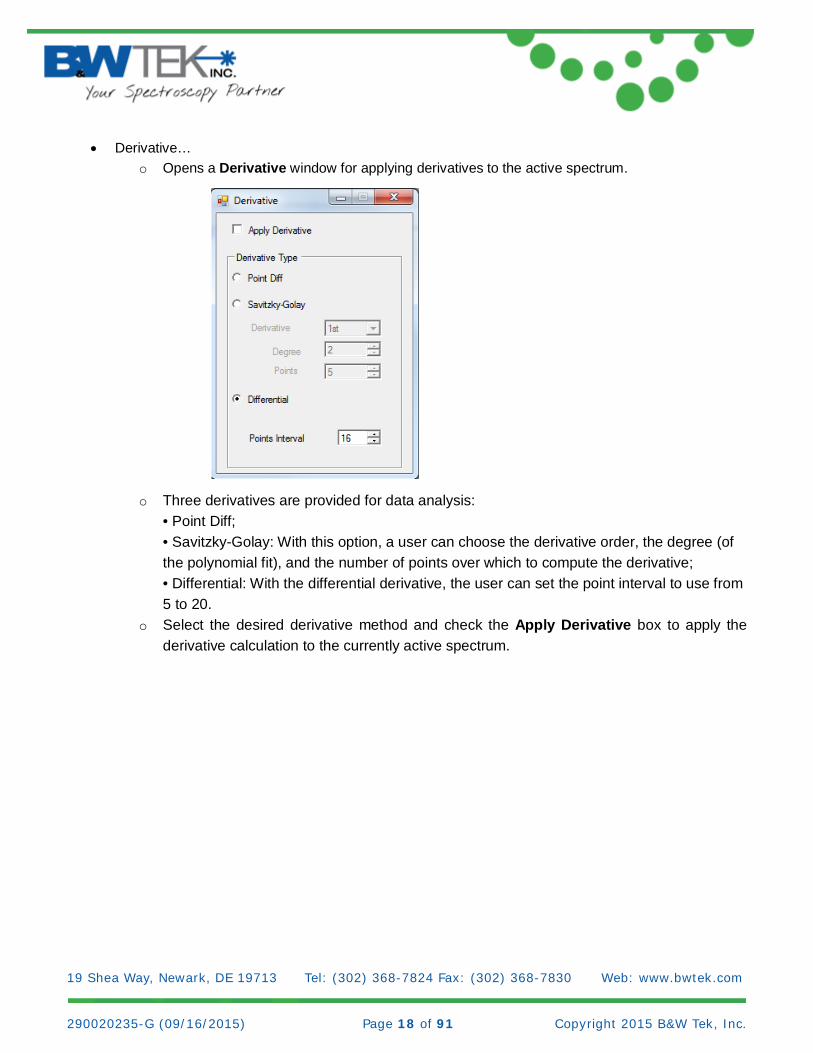
• Derivative… o Opens a Derivative window for applying derivatives to the active spectrum.
o Three derivatives are provided for data analysis: • Point Diff; • Savitzky-Golay: With this option, a user can choose the derivative order, the degree (of the polynomial fit), and the number of points over which to compute the derivative; • Differential: With the differential derivative, the user can set the point interval to use from 5 to 20.
o Select the desired derivative method and check the Apply Derivative box to apply the derivative calculation to the currently active spectrum.
19 Shea Way, Newark, DE 19713 Tel: (302) 368-7824 Fax: (302) 368-7830 Web: www.bwtek.com 290020235-G (09/16/2015) Page 19 of 91 Copyright 2015 B&W Tek, Inc.
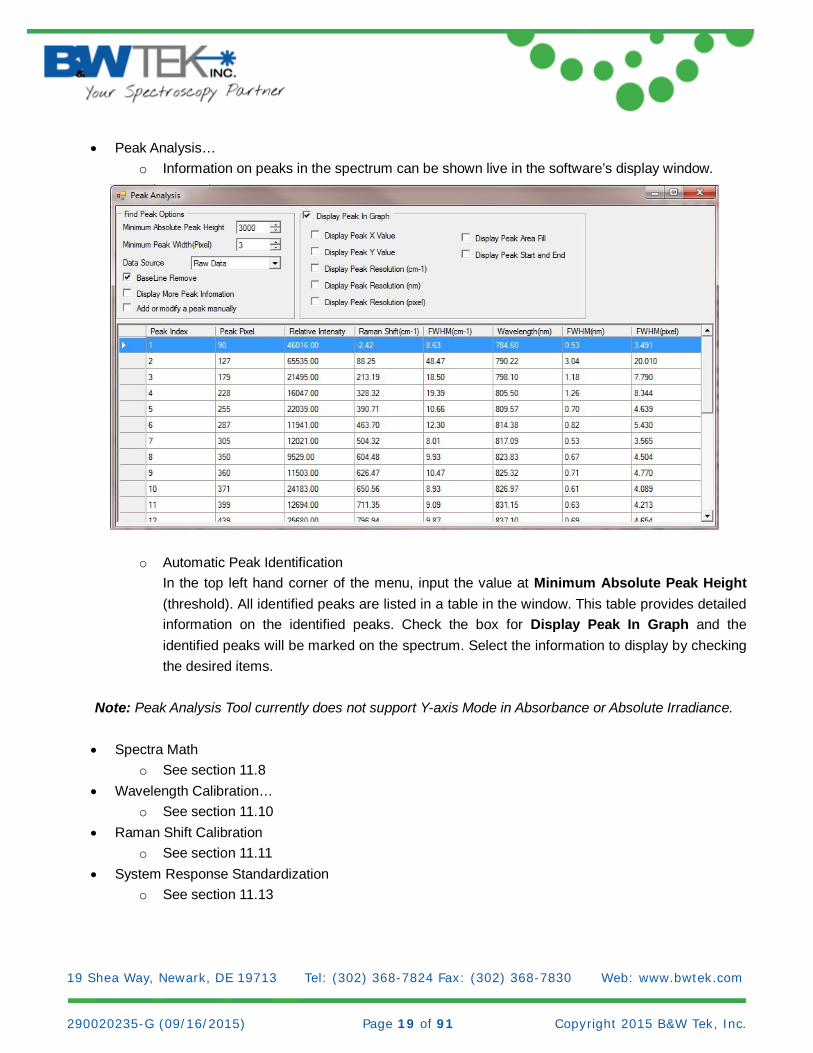
• Peak Analysis… o Information on peaks in the spectrum can be shown live in the software’s display window.
o Automatic Peak Identification In the top left hand corner of the menu, input the value at Minimum Absolute Peak Height (threshold). All identified peaks are listed in a table in the window. This table provides detailed information on the identified peaks. Check the box for Display Peak In Graph and the identified peaks will be marked on the spectrum. Select the information to display by checking the desired items.
Note: Peak Analysis Tool currently does not support Y-axis Mode in Absorbance or Absolute Irradiance.
• Spectra Math o See section 11.8
• Wavelength Calibration… o See section 11.10
• Raman Shift Calibration o See section 11.11
• System Response Standardization o See section 11.13
19 Shea Way, Newark, DE 19713 Tel: (302) 368-7824 Fax: (302) 368-7830 Web: www.bwtek.com 290020235-G (09/16/2015) Page 20 of 91 Copyright 2015 B&W Tek, Inc.
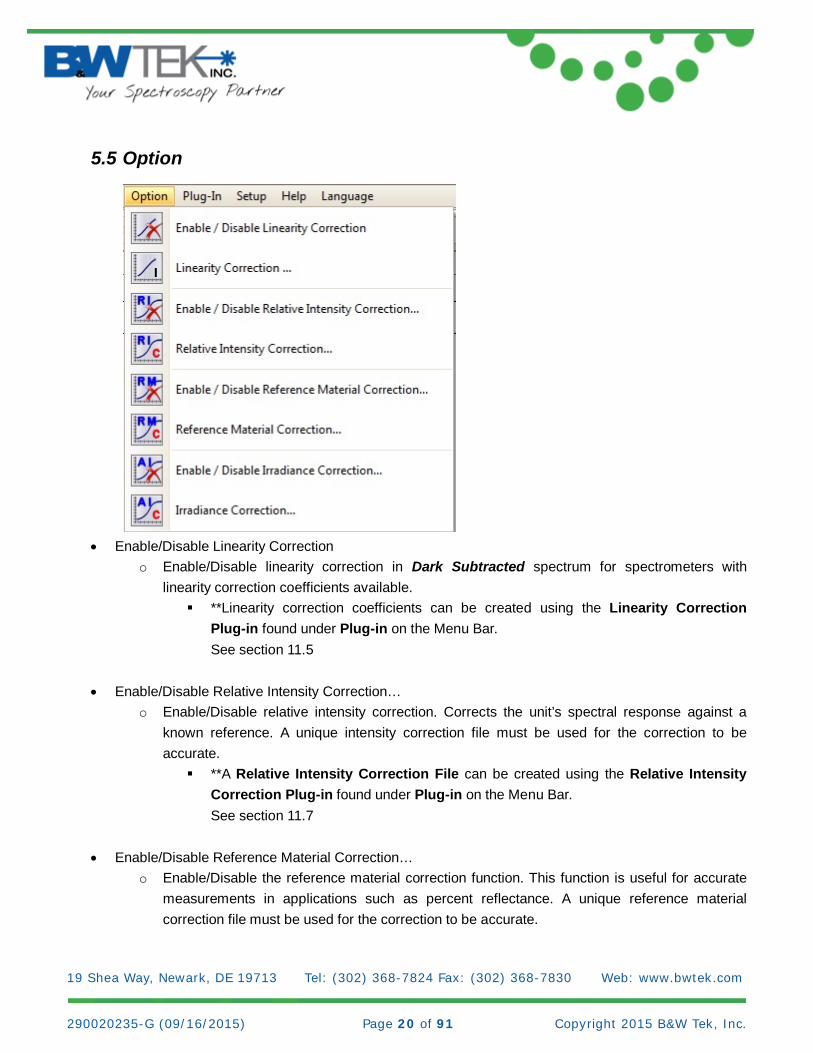
5.5 Option
• Enable/Disable Linearity Correction
o Enable/Disable linearity correction in Dark Subtracted spectrum for spectrometers with linearity correction coefficients available. **Linearity correction coefficients can be created using the Linearity Correction
Plug-in found under Plug-in on the Menu Bar. See section 11.5
• Enable/Disable Relative Intensity Correction… o Enable/Disable relative intensity correction. Corrects the unit’s spectral response against a
known reference. A unique intensity correction file must be used for the correction to be accurate. **A Relative Intensity Correction File can be created using the Relative Intensity
Correction Plug-in found under Plug-in on the Menu Bar. See section 11.7
• Enable/Disable Reference Material Correction… o Enable/Disable the reference material correction function. This function is useful for accurate
measurements in applications such as percent reflectance. A unique reference material correction file must be used for the correction to be accurate.

19 Shea Way, Newark, DE 19713 Tel: (302) 368-7824 Fax: (302) 368-7830 Web: www.bwtek.com 290020235-G (09/16/2015) Page 21 of 91 Copyright 2015 B&W Tek, Inc.
**A Reference Material Correction File can be created using the Reference Material Correction Plug-in found under Plug-in on the Menu Bar. See section 11.6
• Enable/Disable Irradiance Correction… o Enable/Disable irradiance correction. A unique irradiance correction file must be used for the
correction to be accurate. **An Irradiance Correction File can be created using the Irradiance Correction
Plug-in found under Plug-in on the Menu Bar. See section11.4
19 Shea Way, Newark, DE 19713 Tel: (302) 368-7824 Fax: (302) 368-7830 Web: www.bwtek.com 290020235-G (09/16/2015) Page 22 of 91 Copyright 2015 B&W Tek, Inc.
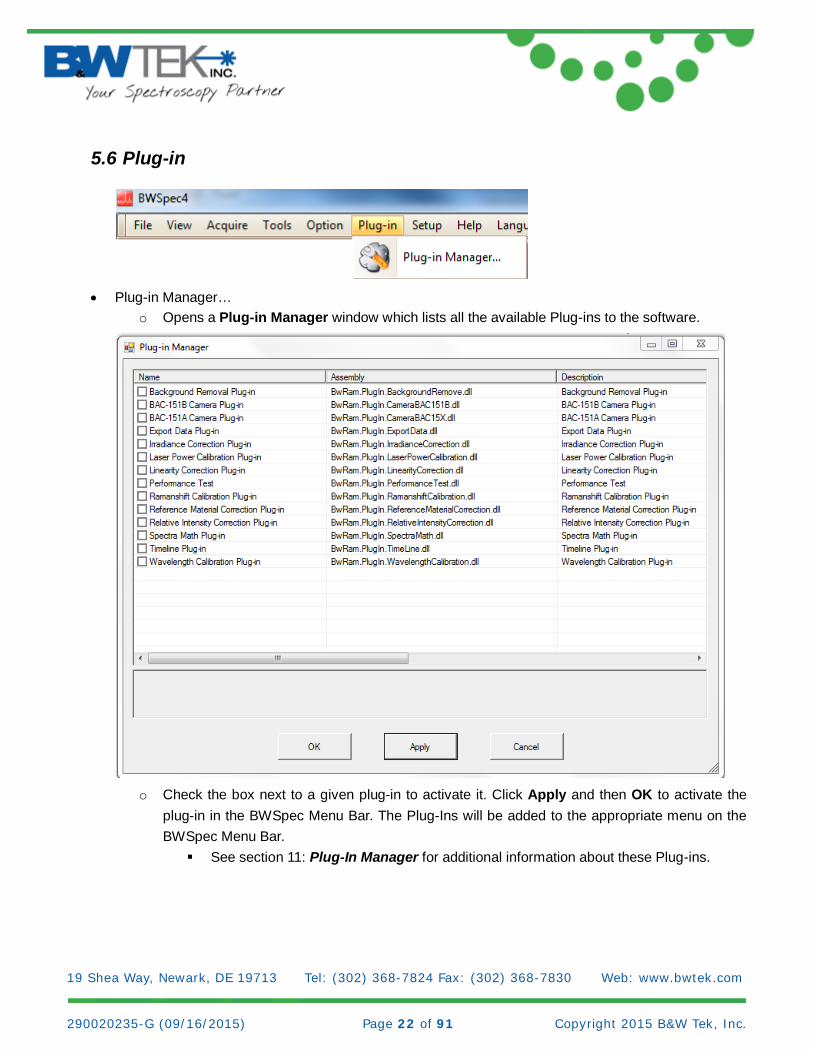
5.6 Plug-in
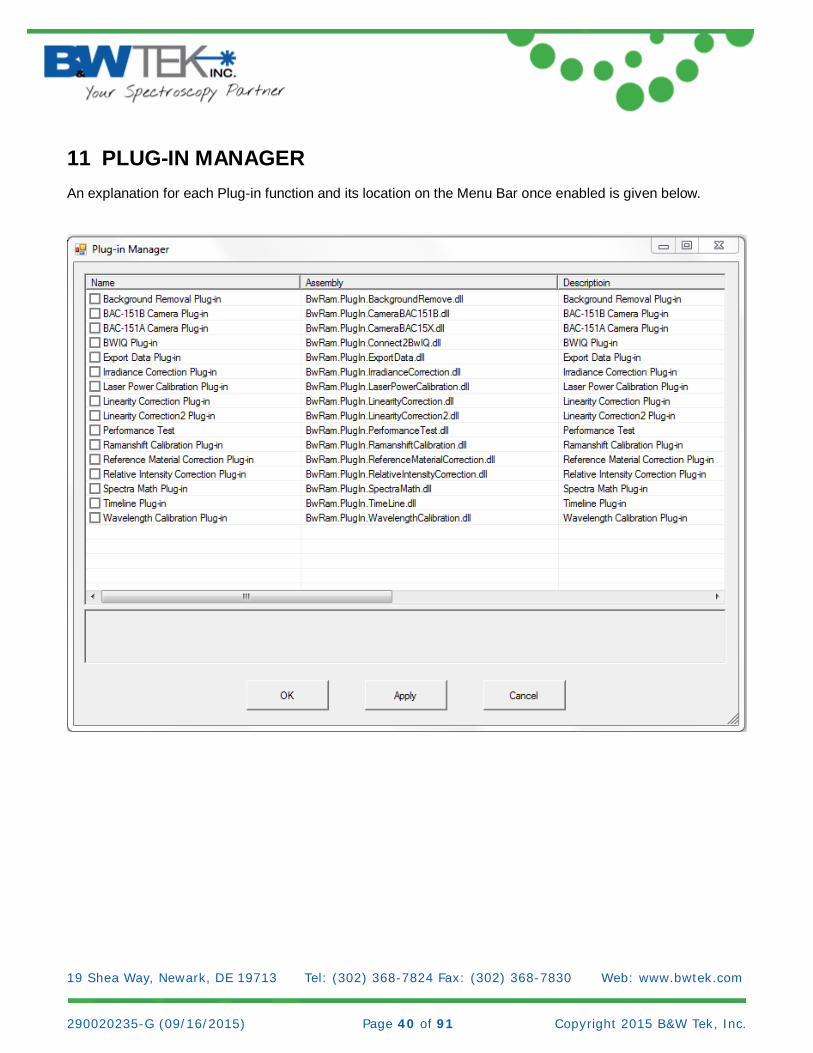
• Plug-in Manager…
o Opens a Plug-in Manager window which lists all the available Plug-ins to the software.
o Check the box next to a given plug-in to activate it. Click Apply and then OK to activate the
plug-in in the BWSpec Menu Bar. The Plug-Ins will be added to the appropriate menu on the BWSpec Menu Bar. See section 11: Plug-In Manager for additional information about these Plug-ins.
19 Shea Way, Newark, DE 19713 Tel: (302) 368-7824 Fax: (302) 368-7830 Web: www.bwtek.com 290020235-G (09/16/2015) Page 23 of 91 Copyright 2015 B&W Tek, Inc.
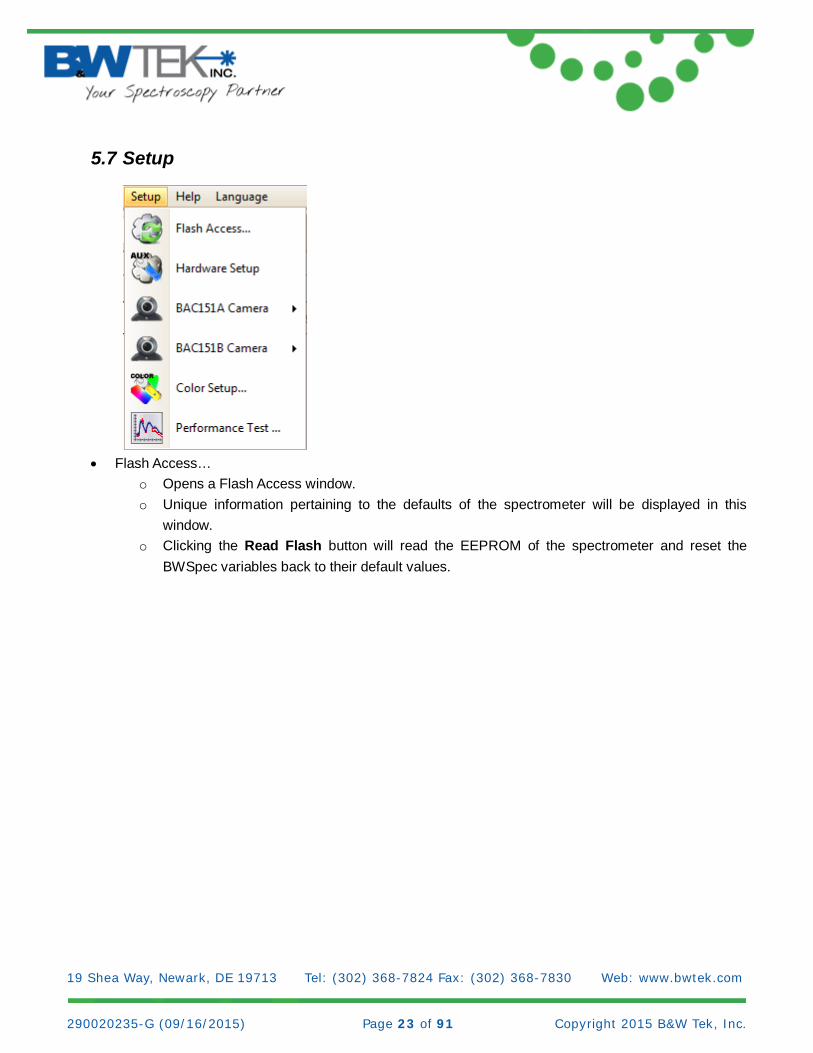
5.7 Setup
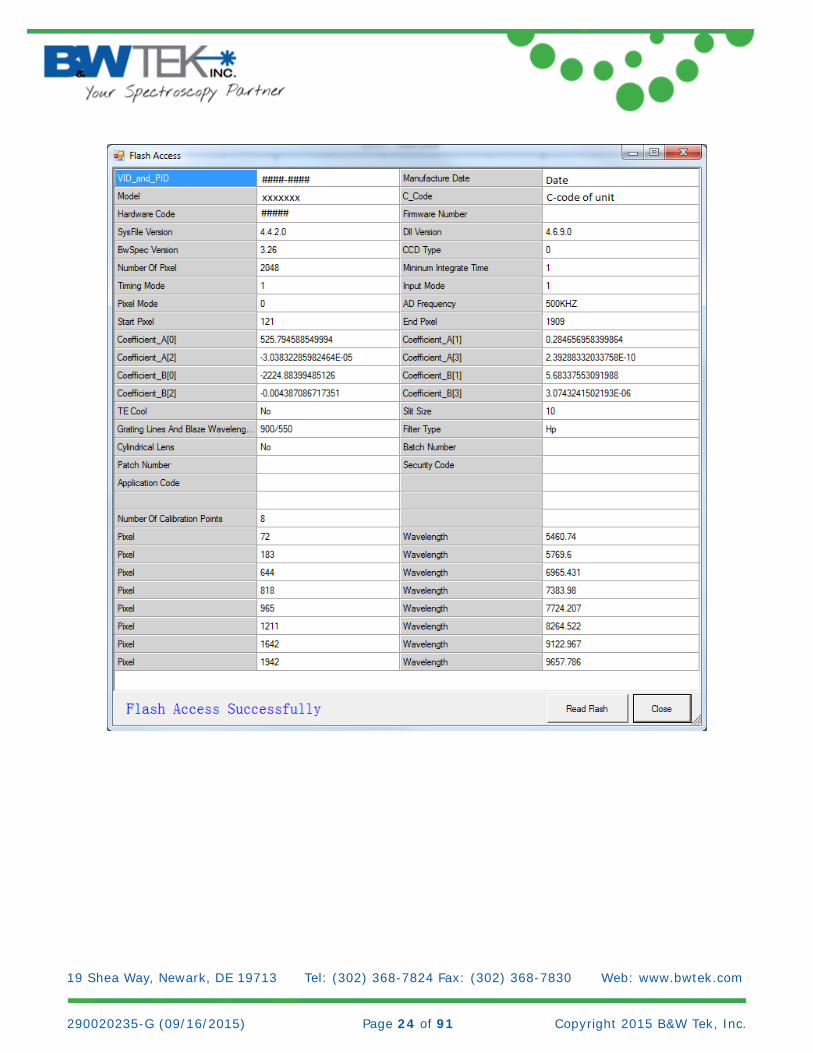
• Flash Access…
o Opens a Flash Access window. o Unique information pertaining to the defaults of the spectrometer will be displayed in this
window. o Clicking the Read Flash button will read the EEPROM of the spectrometer and reset the
BWSpec variables back to their default values.
19 Shea Way, Newark, DE 19713 Tel: (302) 368-7824 Fax: (302) 368-7830 Web: www.bwtek.com 290020235-G (09/16/2015) Page 24 of 91 Copyright 2015 B&W Tek, Inc.
19 Shea Way, Newark, DE 19713 Tel: (302) 368-7824 Fax: (302) 368-7830 Web: www.bwtek.com 290020235-G (09/16/2015) Page 25 of 91 Copyright 2015 B&W Tek, Inc.
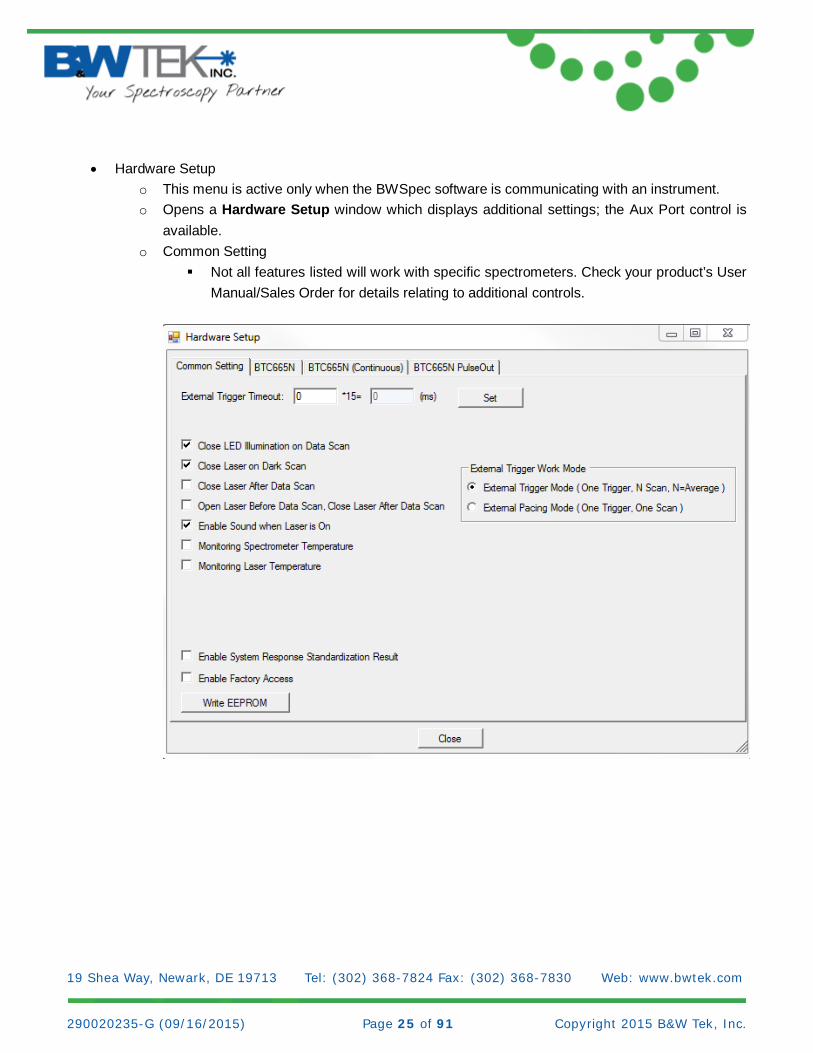
• Hardware Setup
o This menu is active only when the BWSpec software is communicating with an instrument. o Opens a Hardware Setup window which displays additional settings; the Aux Port control is
available. o Common Setting
Not all features listed will work with specific spectrometers. Check your product’s User Manual/Sales Order for details relating to additional controls.
19 Shea Way, Newark, DE 19713 Tel: (302) 368-7824 Fax: (302) 368-7830 Web: www.bwtek.com 290020235-G (09/16/2015) Page 26 of 91 Copyright 2015 B&W Tek, Inc.
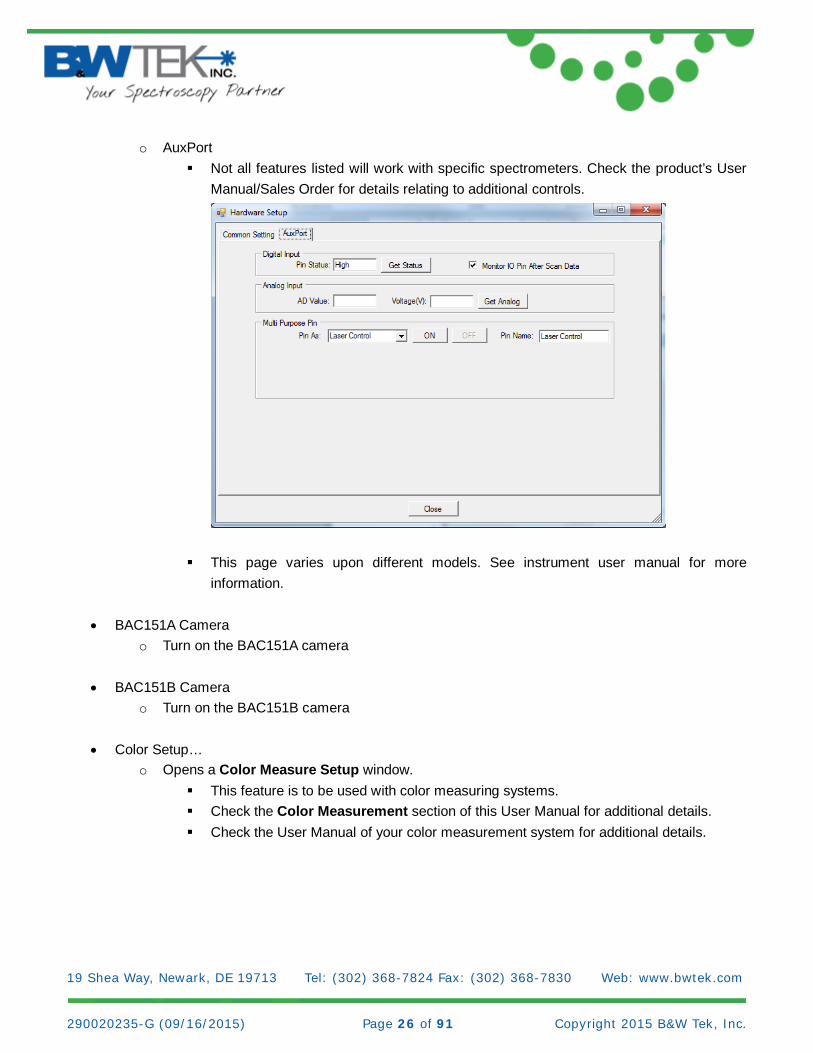
o AuxPort Not all features listed will work with specific spectrometers. Check the product’s User
Manual/Sales Order for details relating to additional controls.
This page varies upon different models. See instrument user manual for more information.
• BAC151A Camera
o Turn on the BAC151A camera
• BAC151B Camera o Turn on the BAC151B camera
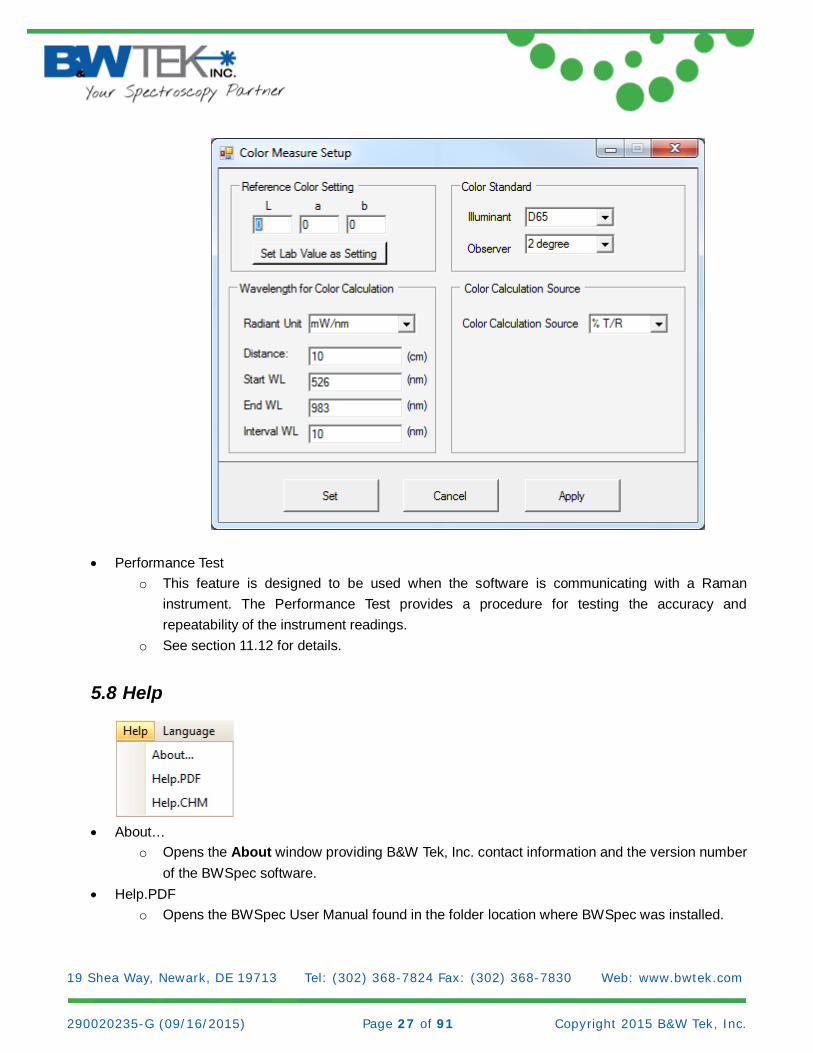
• Color Setup…
o Opens a Color Measure Setup window. This feature is to be used with color measuring systems. Check the Color Measurement section of this User Manual for additional details. Check the User Manual of your color measurement system for additional details.
19 Shea Way, Newark, DE 19713 Tel: (302) 368-7824 Fax: (302) 368-7830 Web: www.bwtek.com 290020235-G (09/16/2015) Page 27 of 91 Copyright 2015 B&W Tek, Inc.
• Performance Test o This feature is designed to be used when the software is communicating with a Raman
instrument. The Performance Test provides a procedure for testing the accuracy and repeatability of the instrument readings.
o See section 11.12 for details.
5.8 Help
• About…
o Opens the About window providing B&W Tek, Inc. contact information and the version number of the BWSpec software.
• Help.PDF o Opens the BWSpec User Manual found in the folder location where BWSpec was installed.
19 Shea Way, Newark, DE 19713 Tel: (302) 368-7824 Fax: (302) 368-7830 Web: www.bwtek.com 290020235-G (09/16/2015) Page 28 of 91 Copyright 2015 B&W Tek, Inc.
• Help.CHM o Opens an XML version of the BWSpec User Manual.
5.9 Language
• English
o Changes the BWSpec GUI to English. A Restart of BWSpec is required for this change to take place.
• Chinese o Changes the BWSpec GUI to Chinese.
A Restart of BWSpec is required for this change to take place. • Japanese
o Changes the BWSpec GUI to Japanese. This is an option that is sold separately. A password is required to enable this feature.
• To purchase this feature, contact us at http://bwtek.com/support/ A Restart of BWSpec is required for this change to take place.
• Import License File o This is needed to change the BWSpec GUI to Japanese.
19 Shea Way, Newark, DE 19713 Tel: (302) 368-7824 Fax: (302) 368-7830 Web: www.bwtek.com 290020235-G (09/16/2015) Page 29 of 91 Copyright 2015 B&W Tek, Inc.
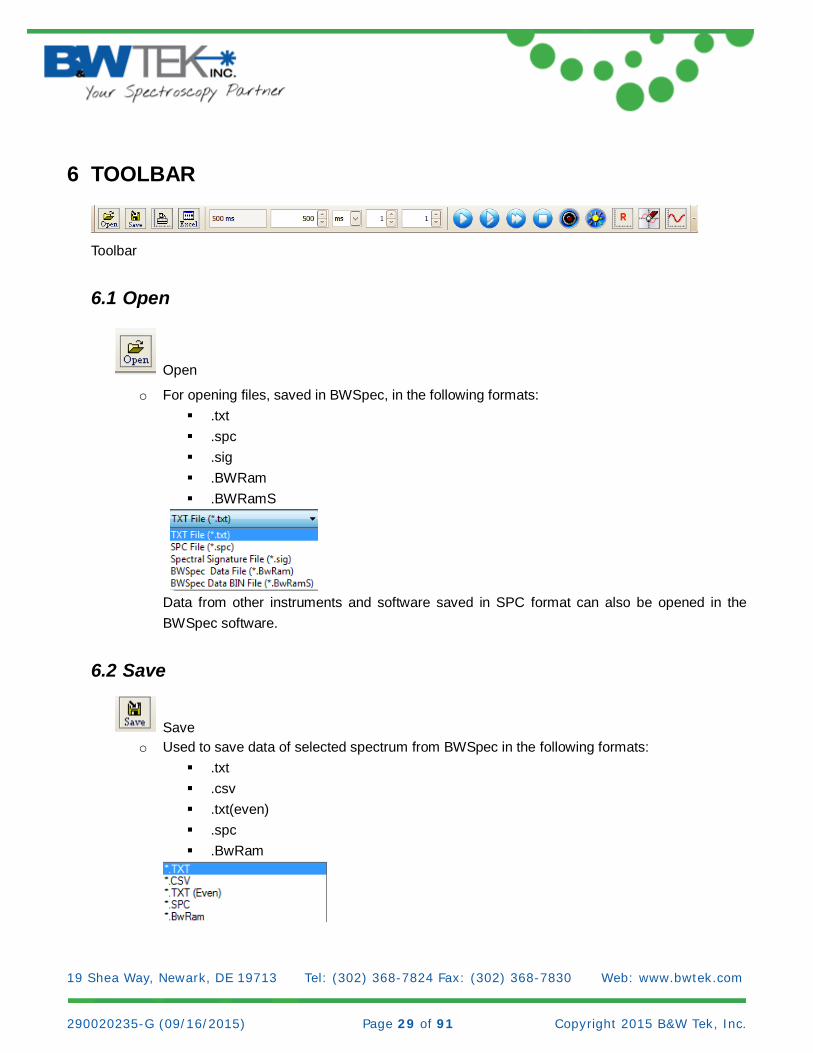
6 TOOLBAR
Toolbar
6.1 Open
Open
o For opening files, saved in BWSpec, in the following formats: .txt .spc .sig .BWRam .BWRamS
Data from other instruments and software saved in SPC format can also be opened in the BWSpec software.
6.2 Save
Save o Used to save data of selected spectrum from BWSpec in the following formats:
.txt .csv .txt(even) .spc .BwRam
19 Shea Way, Newark, DE 19713 Tel: (302) 368-7824 Fax: (302) 368-7830 Web: www.bwtek.com 290020235-G (09/16/2015) Page 30 of 91 Copyright 2015 B&W Tek, Inc.
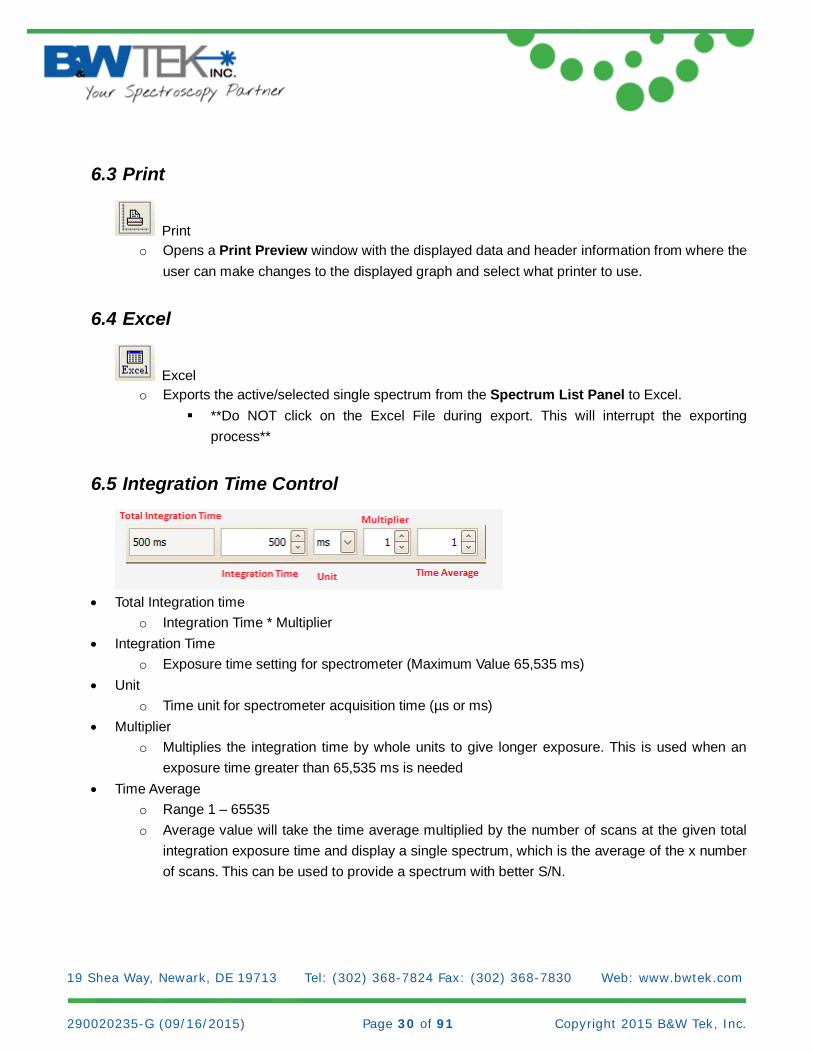
6.3 Print
Print o Opens a Print Preview window with the displayed data and header information from where the
user can make changes to the displayed graph and select what printer to use.
6.4 Excel
Excel o Exports the active/selected single spectrum from the Spectrum List Panel to Excel.
**Do NOT click on the Excel File during export. This will interrupt the exporting process**
6.5 Integration Time Control
• Total Integration time
o Integration Time * Multiplier • Integration Time
o Exposure time setting for spectrometer (Maximum Value 65,535 ms) • Unit
o Time unit for spectrometer acquisition time (µs or ms) • Multiplier
o Multiplies the integration time by whole units to give longer exposure. This is used when an exposure time greater than 65,535 ms is needed
• Time Average o Range 1 – 65535 o Average value will take the time average multiplied by the number of scans at the given total
integration exposure time and display a single spectrum, which is the average of the x number of scans. This can be used to provide a spectrum with better S/N.
19 Shea Way, Newark, DE 19713 Tel: (302) 368-7824 Fax: (302) 368-7830 Web: www.bwtek.com 290020235-G (09/16/2015) Page 31 of 91 Copyright 2015 B&W Tek, Inc.
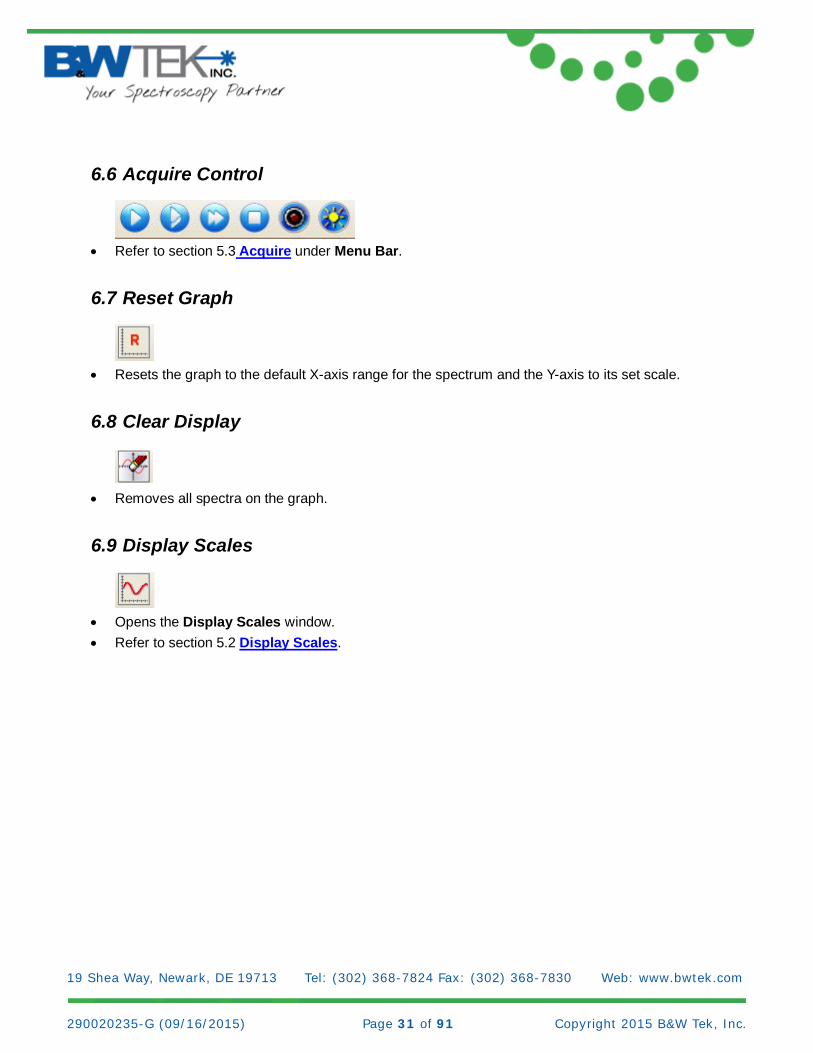
6.6 Acquire Control
• Refer to section 5.3 Acquire under Menu Bar.
6.7 Reset Graph
• Resets the graph to the default X-axis range for the spectrum and the Y-axis to its set scale.
6.8 Clear Display
• Removes all spectra on the graph.
6.9 Display Scales
• Opens the Display Scales window. • Refer to section 5.2 Display Scales.
19 Shea Way, Newark, DE 19713 Tel: (302) 368-7824 Fax: (302) 368-7830 Web: www.bwtek.com 290020235-G (09/16/2015) Page 32 of 91 Copyright 2015 B&W Tek, Inc.
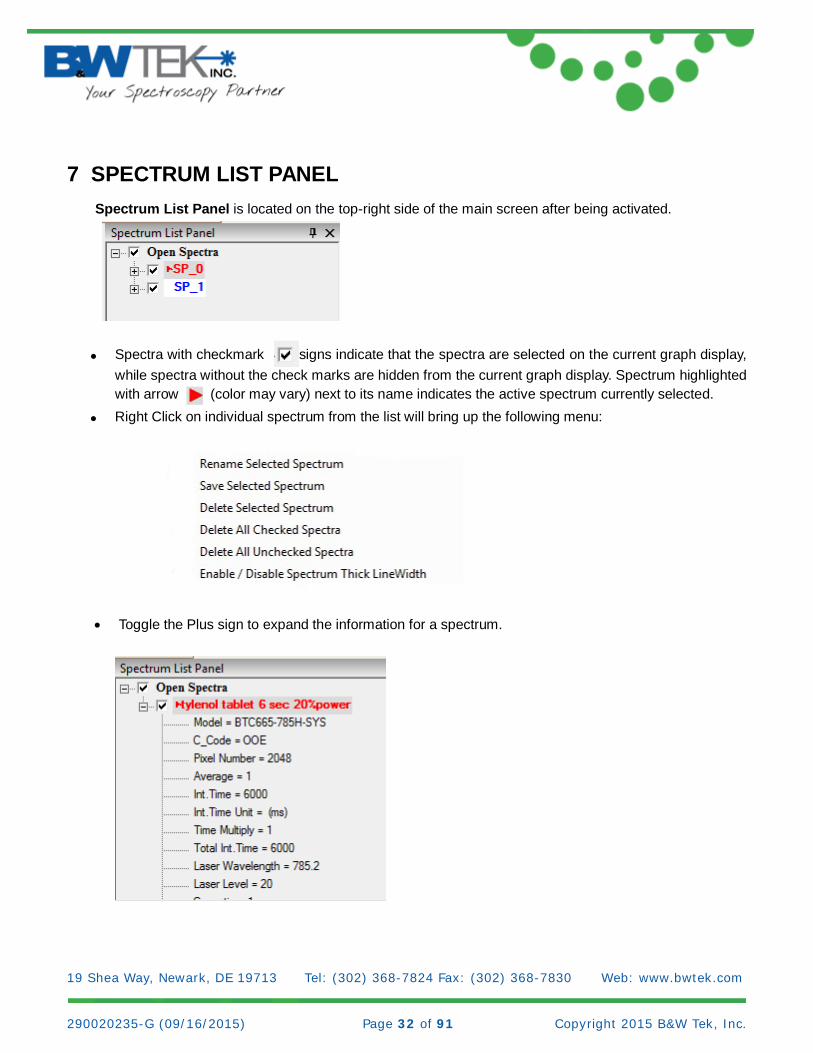
7 SPECTRUM LIST PANEL Spectrum List Panel is located on the top-right side of the main screen after being activated.
• Spectra with checkmark signs indicate that the spectra are selected on the current graph display,
while spectra without the check marks are hidden from the current graph display. Spectrum highlighted with arrow (color may vary) next to its name indicates the active spectrum currently selected.
• Right Click on individual spectrum from the list will bring up the following menu:
• Toggle the Plus sign to expand the information for a spectrum.
19 Shea Way, Newark, DE 19713 Tel: (302) 368-7824 Fax: (302) 368-7830 Web: www.bwtek.com 290020235-G (09/16/2015) Page 33 of 91 Copyright 2015 B&W Tek, Inc.
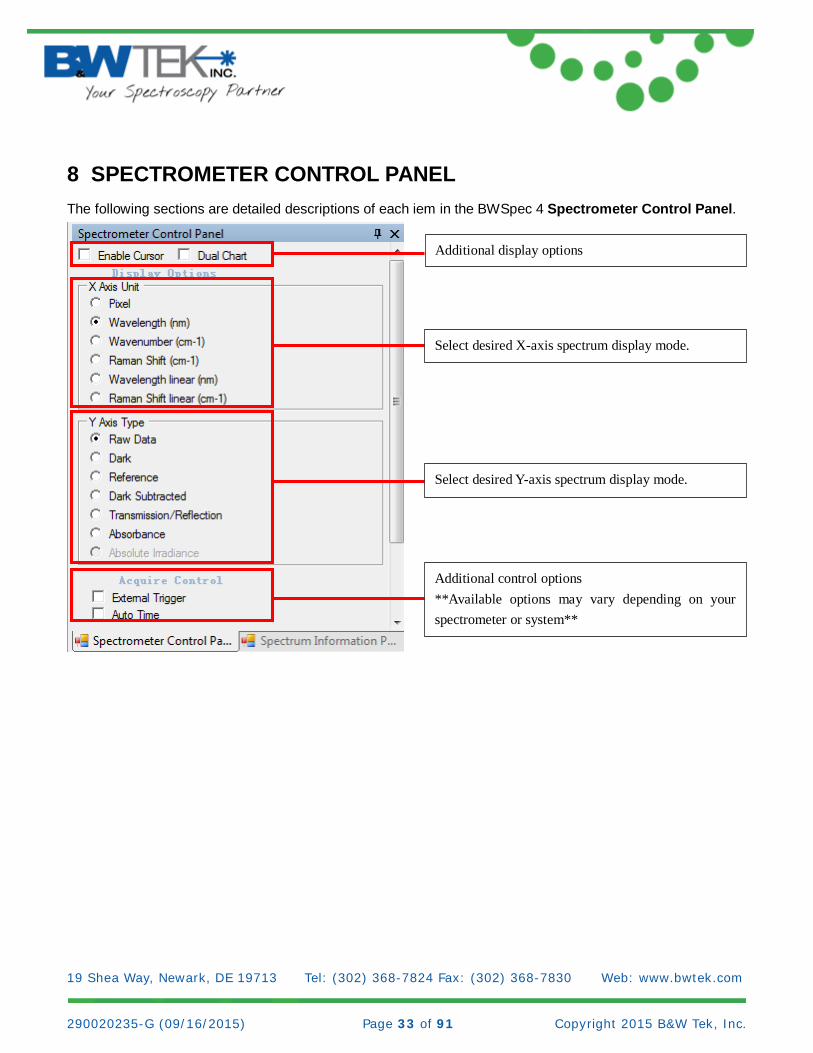
8 SPECTROMETER CONTROL PANEL The following sections are detailed descriptions of each iem in the BWSpec 4 Spectrometer Control Panel.
Additional display options
Additional control options **Available options may vary depending on your spectrometer or system**
Select desired Y-axis spectrum display mode.
Select desired X-axis spectrum display mode.
19 Shea Way, Newark, DE 19713 Tel: (302) 368-7824 Fax: (302) 368-7830 Web: www.bwtek.com 290020235-G (09/16/2015) Page 34 of 91 Copyright 2015 B&W Tek, Inc.
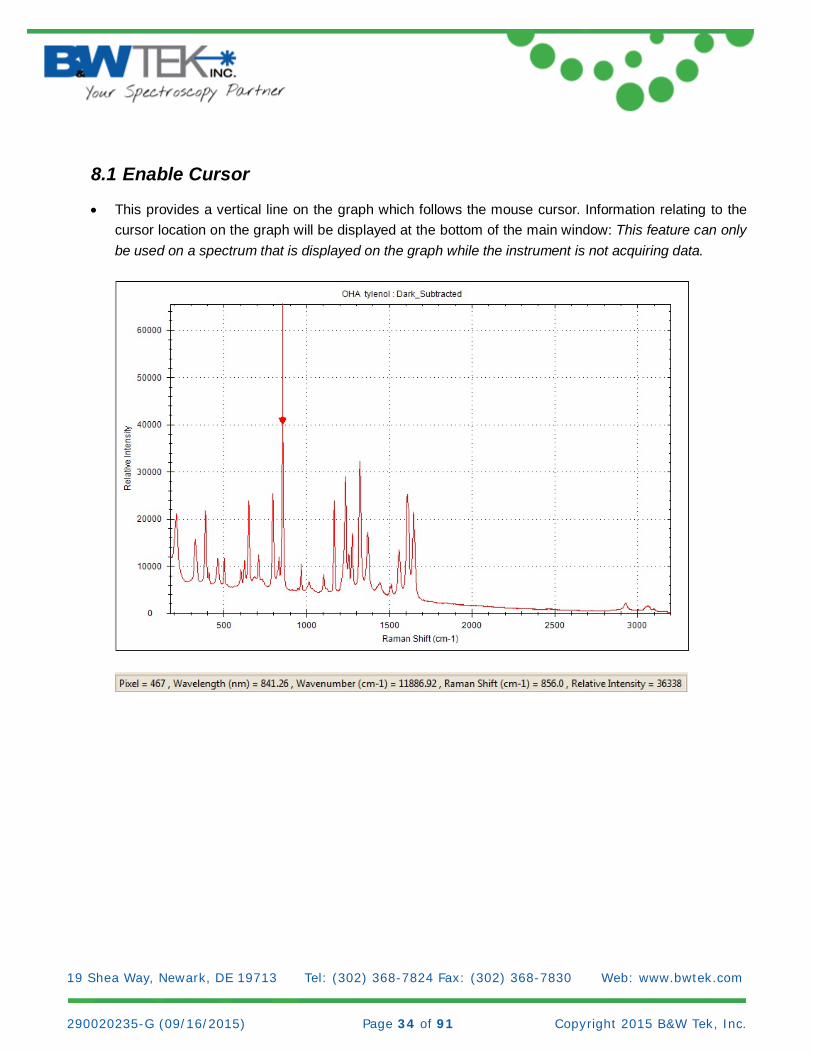
8.1 Enable Cursor
• This provides a vertical line on the graph which follows the mouse cursor. Information relating to the cursor location on the graph will be displayed at the bottom of the main window: This feature can only be used on a spectrum that is displayed on the graph while the instrument is not acquiring data.
19 Shea Way, Newark, DE 19713 Tel: (302) 368-7824 Fax: (302) 368-7830 Web: www.bwtek.com 290020235-G (09/16/2015) Page 35 of 91 Copyright 2015 B&W Tek, Inc.
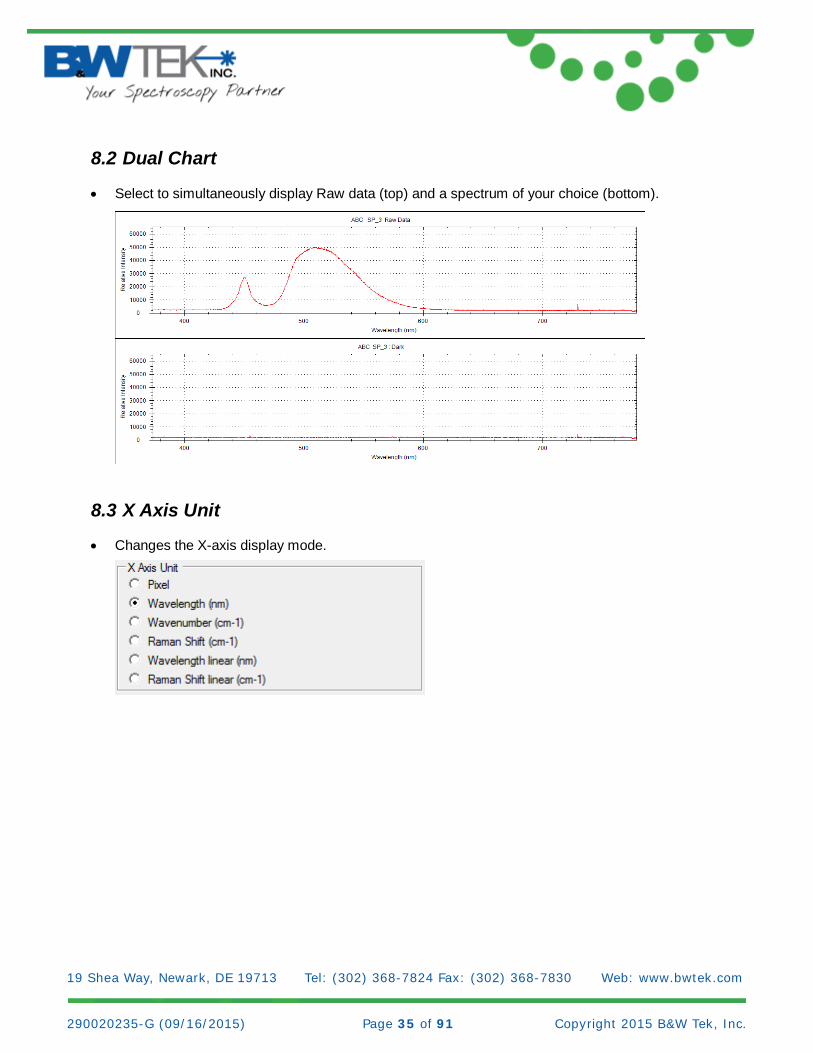
8.2 Dual Chart
• Select to simultaneously display Raw data (top) and a spectrum of your choice (bottom).
8.3 X Axis Unit
• Changes the X-axis display mode.
19 Shea Way, Newark, DE 19713 Tel: (302) 368-7824 Fax: (302) 368-7830 Web: www.bwtek.com 290020235-G (09/16/2015) Page 36 of 91 Copyright 2015 B&W Tek, Inc.
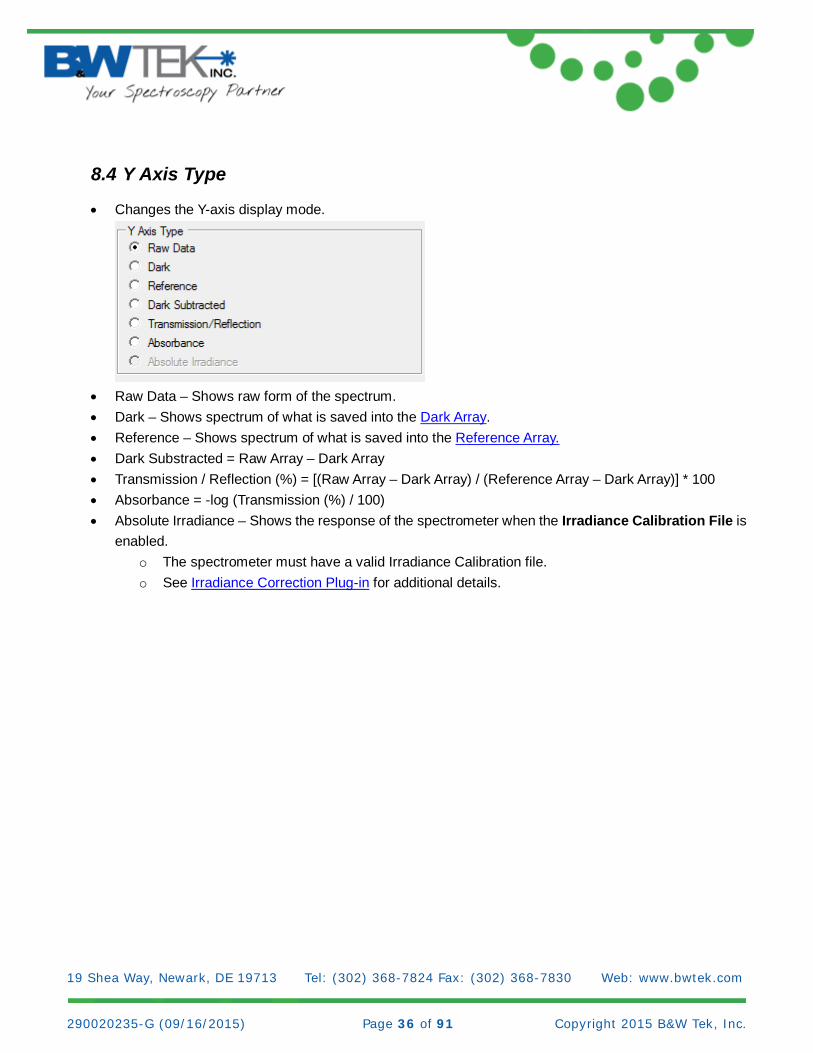
8.4 Y Axis Type
• Changes the Y-axis display mode.
• Raw Data – Shows raw form of the spectrum. • Dark – Shows spectrum of what is saved into the Dark Array. • Reference – Shows spectrum of what is saved into the Reference Array. • Dark Substracted = Raw Array – Dark Array • Transmission / Reflection (%) = [(Raw Array – Dark Array) / (Reference Array – Dark Array)] * 100 • Absorbance = -log (Transmission (%) / 100) • Absolute Irradiance – Shows the response of the spectrometer when the Irradiance Calibration File is
enabled. o The spectrometer must have a valid Irradiance Calibration file. o See Irradiance Correction Plug-in for additional details.

19 Shea Way, Newark, DE 19713 Tel: (302) 368-7824 Fax: (302) 368-7830 Web: www.bwtek.com 290020235-G (09/16/2015) Page 37 of 91 Copyright 2015 B&W Tek, Inc.
8.5 Acquire Control
• External Trigger
When enabled, the external trigger will have the following two behaviors depending on hardware setup: o External Trigger Mode(default): 1 trigger pulse triggers all averages (a scan with 20 averages
will need only 1 trigger pulse); o External Pacing Mode: 1 trigger pulse only triggers one average (a scan with 20 averages will
need 20 trigger pulses); o Refer to section 5.7 and the product user manual for additional details.
• Auto Time o When enabled, the software will automatically scan and increase the integration time in
increments until the response is close to saturation.
Note: Additional control options may also appear depending on your spectrometer or system. Eg: illumination LED, laser control, etc.
19 Shea Way, Newark, DE 19713 Tel: (302) 368-7824 Fax: (302) 368-7830 Web: www.bwtek.com 290020235-G (09/16/2015) Page 38 of 91 Copyright 2015 B&W Tek, Inc.
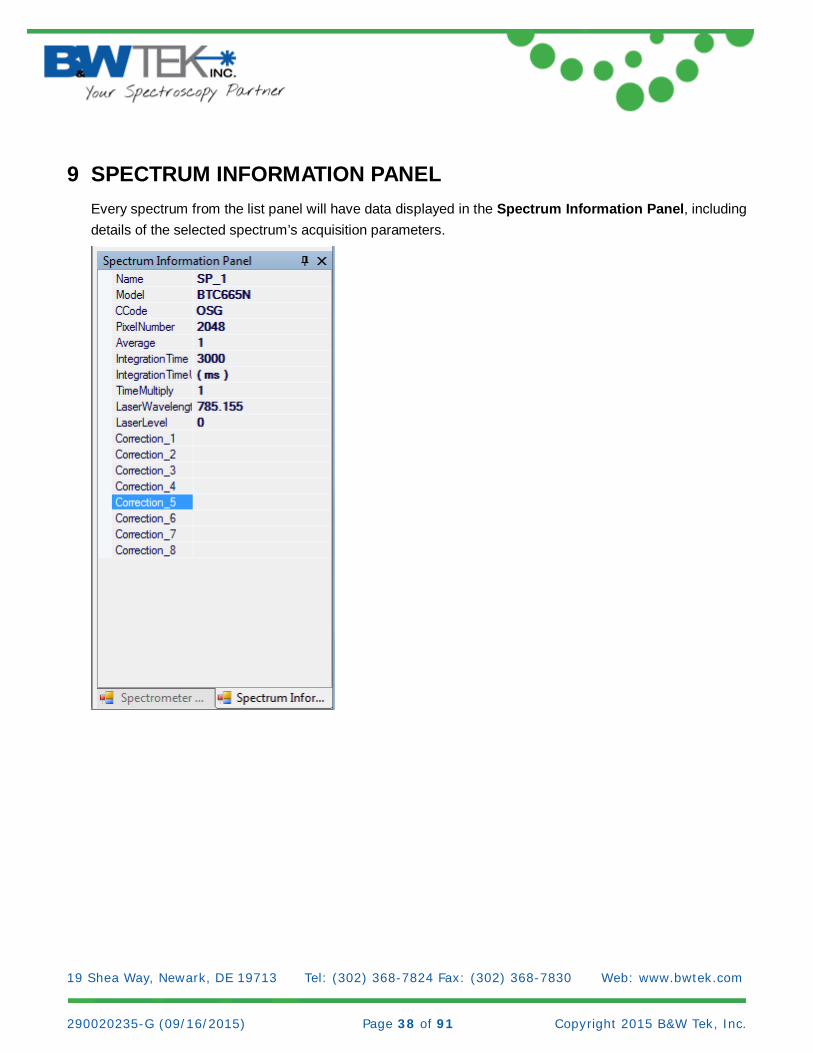
9 SPECTRUM INFORMATION PANEL Every spectrum from the list panel will have data displayed in the Spectrum Information Panel, including details of the selected spectrum’s acquisition parameters.

19 Shea Way, Newark, DE 19713 Tel: (302) 368-7824 Fax: (302) 368-7830 Web: www.bwtek.com 290020235-G (09/16/2015) Page 39 of 91 Copyright 2015 B&W Tek, Inc.
10 STATUS BAR The Status Bar is located at the bottom of the main window.
• Shows status of spectrometer.
o – Spectrometer connected
o - Spectrometer not connected
• - Scan count
• - Acquisition status bar
• - Dark Array Status
o Gives status if a Dark Scan was taken and saved into the Dark Array.
• - Reference Array Status
o Gives status if a Reference Scan was taken and saved into the Reference Array.
• - Dark Compensate
o Gives status of the Dark Compensate function
• - Linearity Correction
o Gives status of the Linear Correction function
19 Shea Way, Newark, DE 19713 Tel: (302) 368-7824 Fax: (302) 368-7830 Web: www.bwtek.com 290020235-G (09/16/2015) Page 40 of 91 Copyright 2015 B&W Tek, Inc.
11 PLUG-IN MANAGER An explanation for each Plug-in function and its location on the Menu Bar once enabled is given below.
19 Shea Way, Newark, DE 19713 Tel: (302) 368-7824 Fax: (302) 368-7830 Web: www.bwtek.com 290020235-G (09/16/2015) Page 41 of 91 Copyright 2015 B&W Tek, Inc.
11.1 Background Removal Plug-in
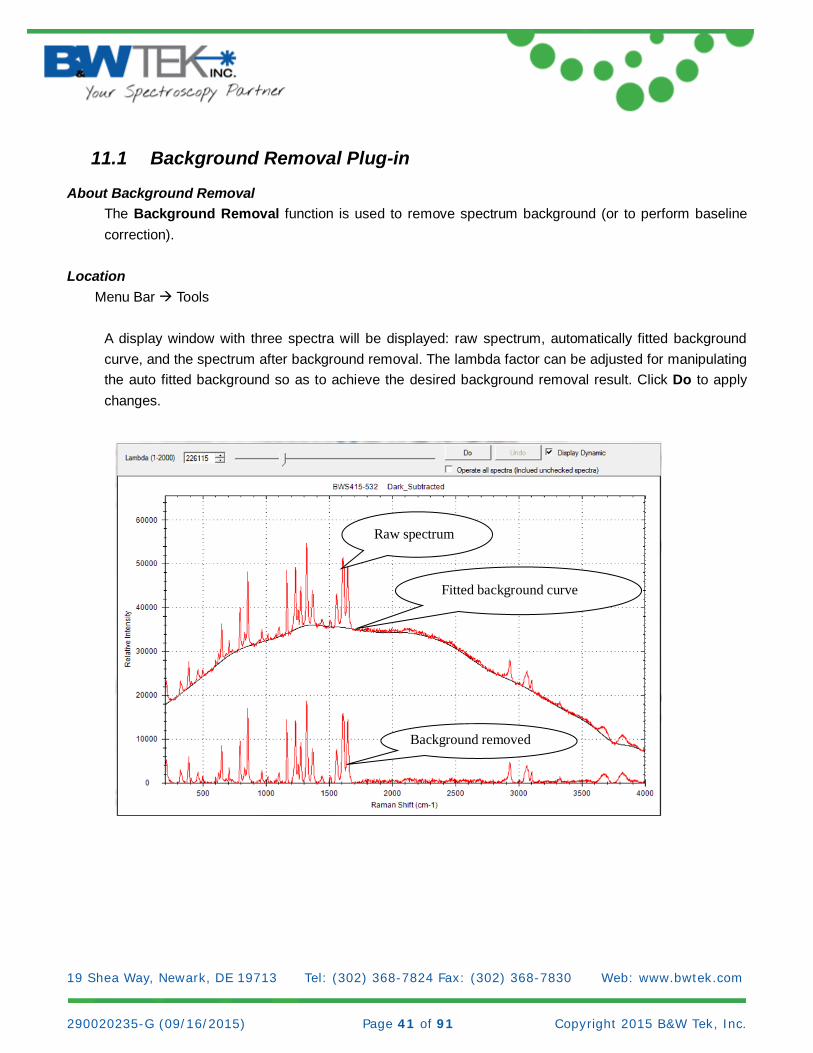
About Background Removal The Background Removal function is used to remove spectrum background (or to perform baseline correction).
Location Menu Bar Tools
A display window with three spectra will be displayed: raw spectrum, automatically fitted background curve, and the spectrum after background removal. The lambda factor can be adjusted for manipulating the auto fitted background so as to achieve the desired background removal result. Click Do to apply changes.
Raw spectrum
Fitted background curve
Background removed

19 Shea Way, Newark, DE 19713 Tel: (302) 368-7824 Fax: (302) 368-7830 Web: www.bwtek.com 290020235-G (09/16/2015) Page 42 of 91 Copyright 2015 B&W Tek, Inc.
11.2 BAC-151x Camera Plug-in
About the BAC-151x Camera This Plug-in is to be used with the accessory BAC151x.
Location Menu Bar Tools
Refer to the BAC151x User Manual for details.
19 Shea Way, Newark, DE 19713 Tel: (302) 368-7824 Fax: (302) 368-7830 Web: www.bwtek.com 290020235-G (09/16/2015) Page 43 of 91 Copyright 2015 B&W Tek, Inc.
11.3 Export Data Plug-in
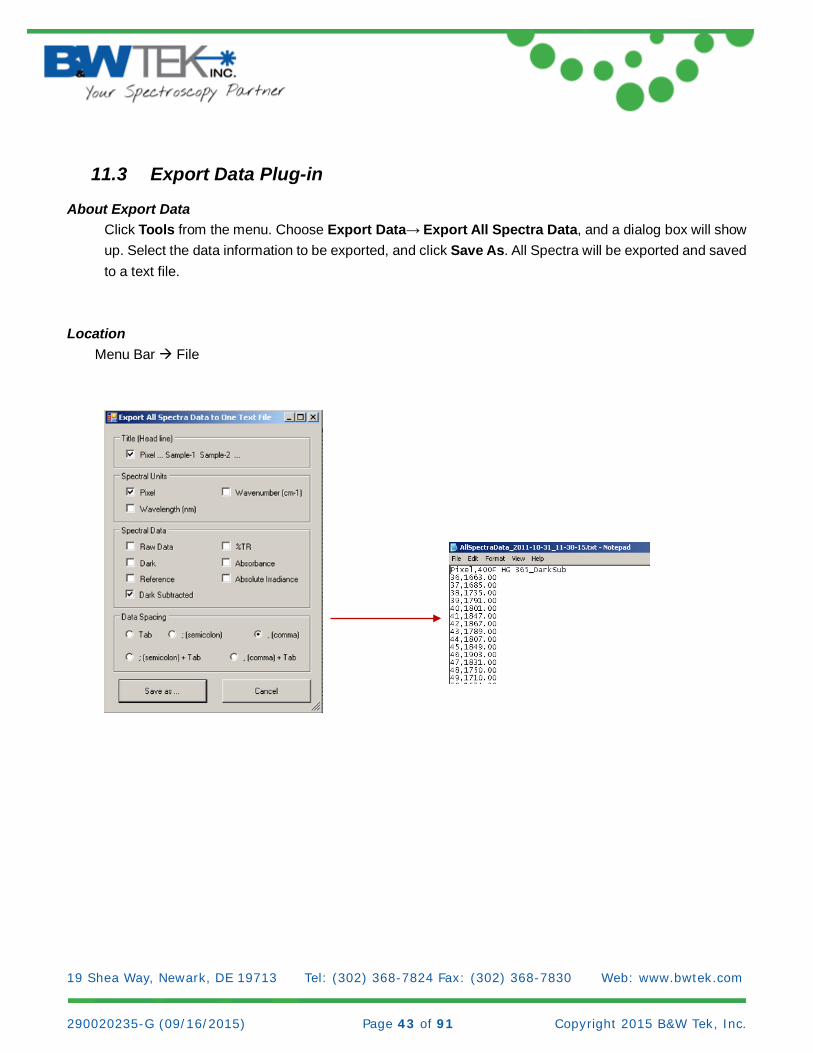
About Export Data Click Tools from the menu. Choose Export Data→ Export All Spectra Data, and a dialog box will show up. Select the data information to be exported, and click Save As. All Spectra will be exported and saved to a text file.
Location Menu Bar File
19 Shea Way, Newark, DE 19713 Tel: (302) 368-7824 Fax: (302) 368-7830 Web: www.bwtek.com 290020235-G (09/16/2015) Page 44 of 91 Copyright 2015 B&W Tek, Inc.
11.4 Irradiance Correction Plug-in
About Irradiance Correction Irradiance Calibration can be conducted by B&W Tek, Inc. using NIST Traceable Irradiance Standards and calibration setups, if so desired. Irradiance Calibration is an option that can be ordered upon placing a spectrometer order, or through a service request.
Location Menu Bar Option How to Conduct Irradiance Correction
This section is for advanced users only. In order to conduct an Irradiance Calibration, you must first have a NIST Traceable Lamp Source with Certified Values which cover the spectral range you will be calibrating your spectrometer to and the .DAT file that accompanies your lamp. It is also necessary to have the correct input optics for your spectrometer to collect the light, such as a fiber and an integrating sphere. The spectral irradiance calibration will allow a spectrometer to convert spectral measurements to absolute spectral irradiance measurements in units of light power in W/ [cm2*nm], mW / [cm2*nm] or µW / [cm2*nm]. Alternatively, a spectral irradiance calibration can be used to calibrate the spectrometer for emissive photometric measurements, such as for the color of an emissive source (for example, LED). Your setup conditions, distance from source, and lamp current must be as close as possible to what your NIST Certificate states in order to conduct a successful calibration process. Ideally, the light source should not fill the entire spectrometer’s angular aperture. The light source should illuminate the spectrometer at a distance specified in the lamp source’s calibration data. Given a correct experimental setup, the spectral irradiance calibration proceeds as followings with the assumption that the spectrometer is equipped with a suitable input optic (linearity correction is highly recommended):
• Adjust the integration time so that the maximum spectral response is just below the spectrometer’s saturation level against the certified lamp at a specified distance. Stop the acquisition and freeze all physical setup with minimal disturbance.
19 Shea Way, Newark, DE 19713 Tel: (302) 368-7824 Fax: (302) 368-7830 Web: www.bwtek.com 290020235-G (09/16/2015) Page 45 of 91 Copyright 2015 B&W Tek, Inc.
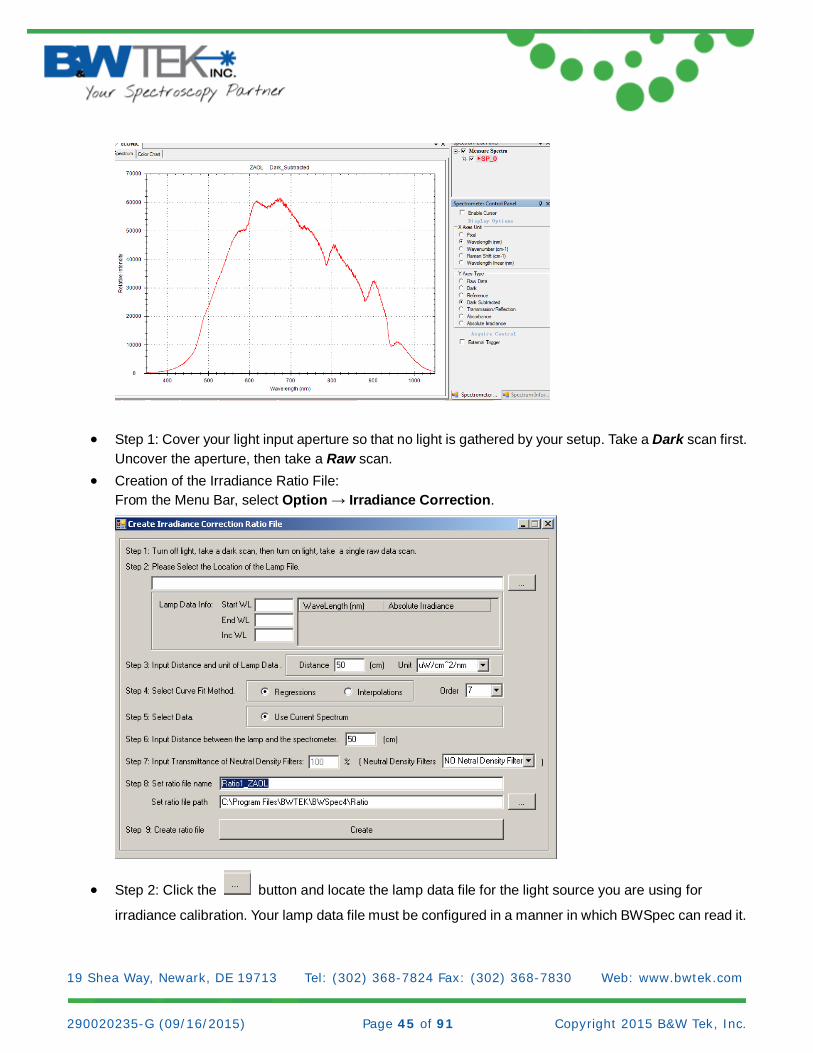
• Step 1: Cover your light input aperture so that no light is gathered by your setup. Take a Dark scan first. Uncover the aperture, then take a Raw scan.
• Creation of the Irradiance Ratio File: From the Menu Bar, select Option → Irradiance Correction.
• Step 2: Click the button and locate the lamp data file for the light source you are using for
irradiance calibration. Your lamp data file must be configured in a manner in which BWSpec can read it.
19 Shea Way, Newark, DE 19713 Tel: (302) 368-7824 Fax: (302) 368-7830 Web: www.bwtek.com 290020235-G (09/16/2015) Page 46 of 91 Copyright 2015 B&W Tek, Inc.
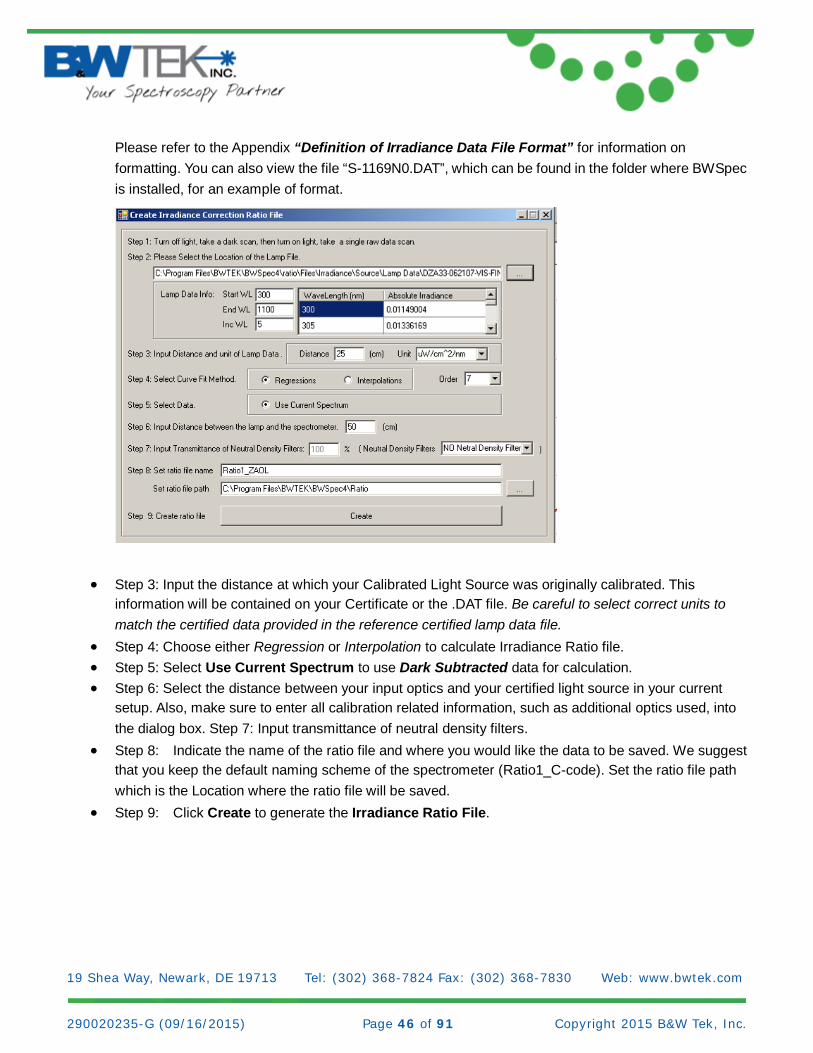
Please refer to the Appendix “Definition of Irradiance Data File Format” for information on formatting. You can also view the file “S-1169N0.DAT”, which can be found in the folder where BWSpec is installed, for an example of format.
• Step 3: Input the distance at which your Calibrated Light Source was originally calibrated. This
information will be contained on your Certificate or the .DAT file. Be careful to select correct units to match the certified data provided in the reference certified lamp data file.
• Step 4: Choose either Regression or Interpolation to calculate Irradiance Ratio file. • Step 5: Select Use Current Spectrum to use Dark Subtracted data for calculation. • Step 6: Select the distance between your input optics and your certified light source in your current
setup. Also, make sure to enter all calibration related information, such as additional optics used, into the dialog box. Step 7: Input transmittance of neutral density filters.
• Step 8: Indicate the name of the ratio file and where you would like the data to be saved. We suggest that you keep the default naming scheme of the spectrometer (Ratio1_C-code). Set the ratio file path which is the Location where the ratio file will be saved.
• Step 9: Click Create to generate the Irradiance Ratio File.
19 Shea Way, Newark, DE 19713 Tel: (302) 368-7824 Fax: (302) 368-7830 Web: www.bwtek.com 290020235-G (09/16/2015) Page 47 of 91 Copyright 2015 B&W Tek, Inc.
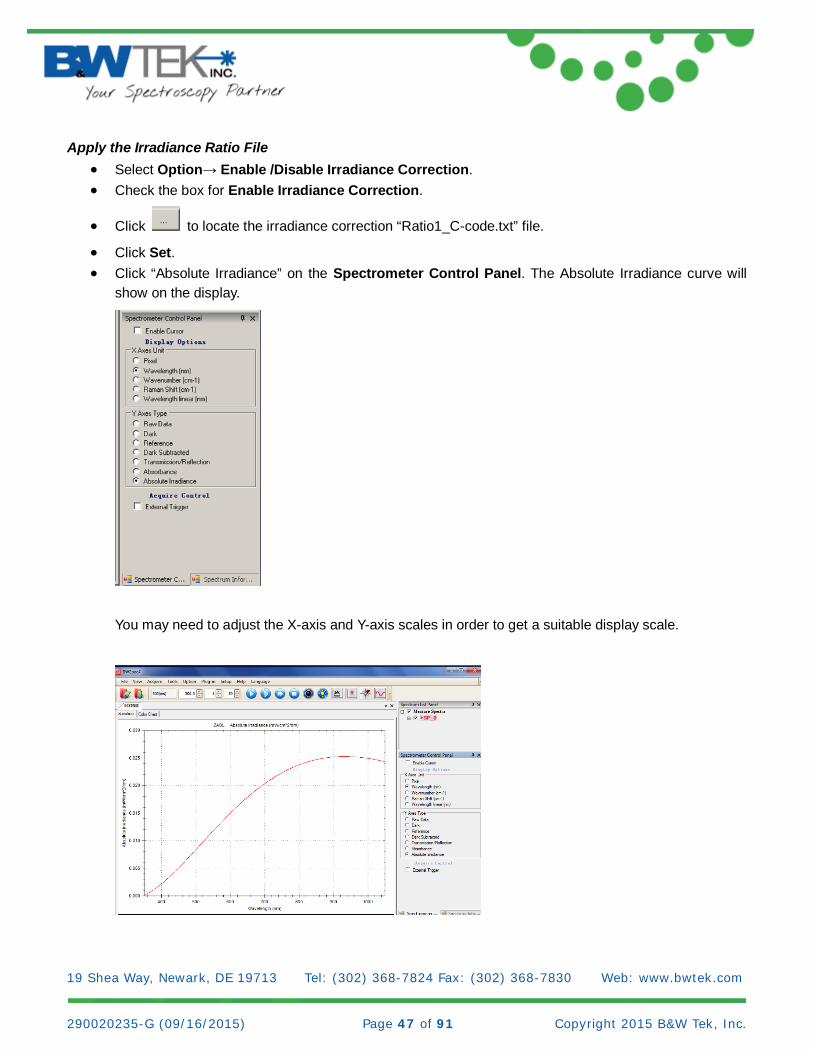
Apply the Irradiance Ratio File • Select Option→ Enable /Disable Irradiance Correction. • Check the box for Enable Irradiance Correction.
• Click to locate the irradiance correction “Ratio1_C-code.txt” file. • Click Set. • Click “Absolute Irradiance” on the Spectrometer Control Panel. The Absolute Irradiance curve will
show on the display.
You may need to adjust the X-axis and Y-axis scales in order to get a suitable display scale.
19 Shea Way, Newark, DE 19713 Tel: (302) 368-7824 Fax: (302) 368-7830 Web: www.bwtek.com 290020235-G (09/16/2015) Page 48 of 91 Copyright 2015 B&W Tek, Inc.
11.5 Linearity Correction Plug-in
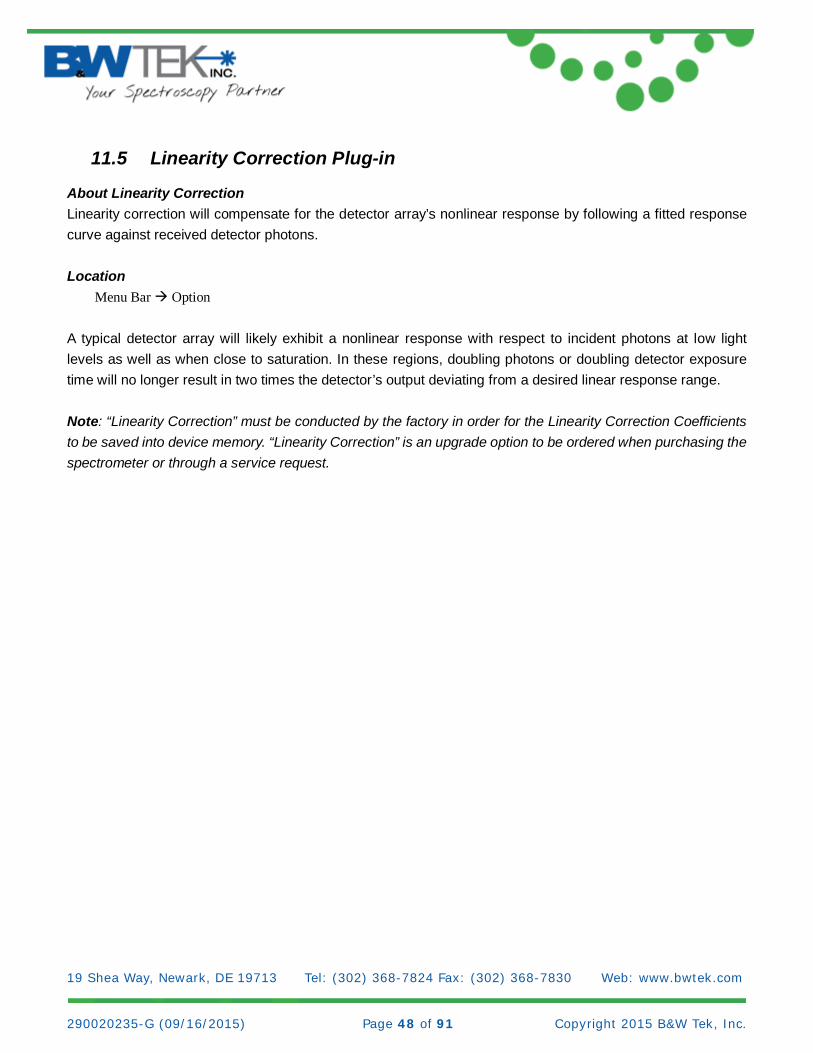
About Linearity Correction Linearity correction will compensate for the detector array’s nonlinear response by following a fitted response curve against received detector photons. Location Menu Bar Option A typical detector array will likely exhibit a nonlinear response with respect to incident photons at low light levels as well as when close to saturation. In these regions, doubling photons or doubling detector exposure time will no longer result in two times the detector’s output deviating from a desired linear response range. Note: “Linearity Correction” must be conducted by the factory in order for the Linearity Correction Coefficients to be saved into device memory. “Linearity Correction” is an upgrade option to be ordered when purchasing the spectrometer or through a service request.
19 Shea Way, Newark, DE 19713 Tel: (302) 368-7824 Fax: (302) 368-7830 Web: www.bwtek.com 290020235-G (09/16/2015) Page 49 of 91 Copyright 2015 B&W Tek, Inc.
How to Conduct Linearity Correction For Advanced users, the linearity correction may be conducted at the customer site. From the Menu Bar, select Option→Linearity Correction. The linearity correction window will appear. Follow Step 1 through Step 9 instructions in the window to proceed.
Print Linearity Correction Report
Adjust starting integration time, multiplier, and average
Enable Boxcar smoothing during correction process
Display current active Linearity Correction Coefficients
Display current active Linearity Correction Coefficients
Select from 4-7 order fitting curves and calculate Linearity Correction Coefficients
19 Shea Way, Newark, DE 19713 Tel: (302) 368-7824 Fax: (302) 368-7830 Web: www.bwtek.com 290020235-G (09/16/2015) Page 50 of 91 Copyright 2015 B&W Tek, Inc.
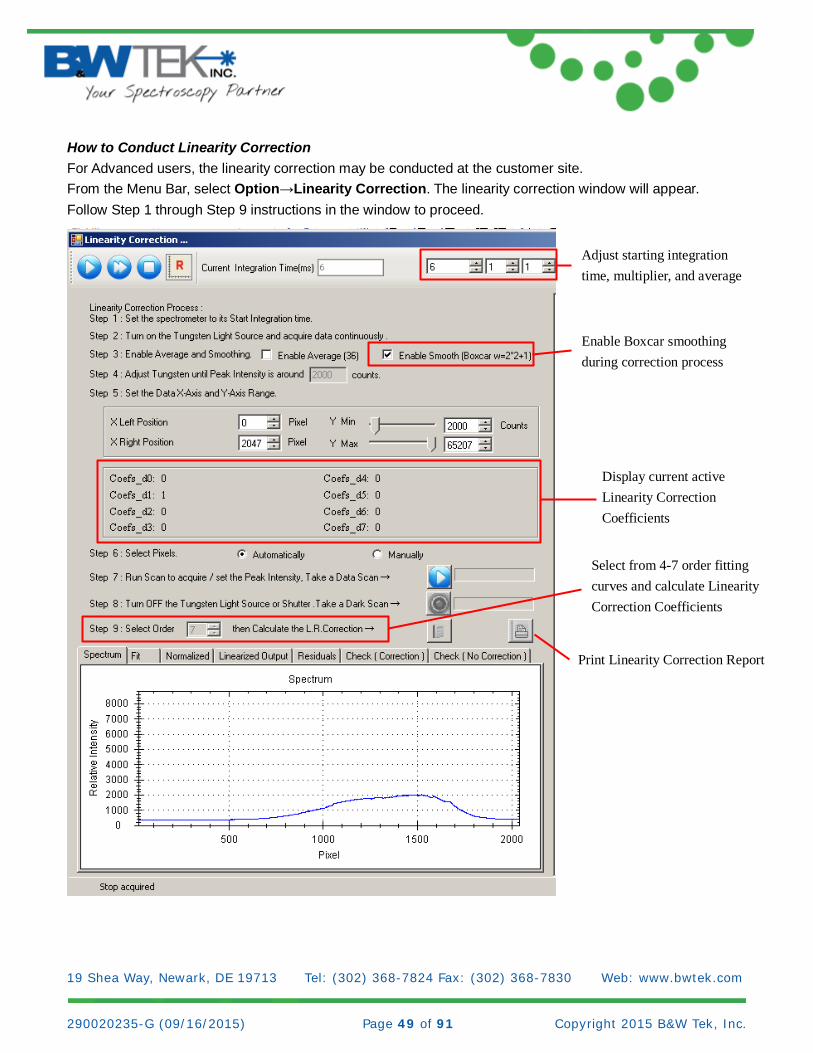
• Spectrum o Displays the current spectrum based on the integration time at the top of the window. o The graph may be zoomed in or panned just like the main window. o Displayed is a Tungsten spectrum that has been attenuated to a Relative Intensity of ~2000
counts.
• Fit o Displays the fitting curve of the correction based on the Order (Step 9)

19 Shea Way, Newark, DE 19713 Tel: (302) 368-7824 Fax: (302) 368-7830 Web: www.bwtek.com 290020235-G (09/16/2015) Page 51 of 91 Copyright 2015 B&W Tek, Inc.
• Normalized
o Displays the output before correction
• Linearized
o Displays the output after correction.
19 Shea Way, Newark, DE 19713 Tel: (302) 368-7824 Fax: (302) 368-7830 Web: www.bwtek.com 290020235-G (09/16/2015) Page 52 of 91 Copyright 2015 B&W Tek, Inc.
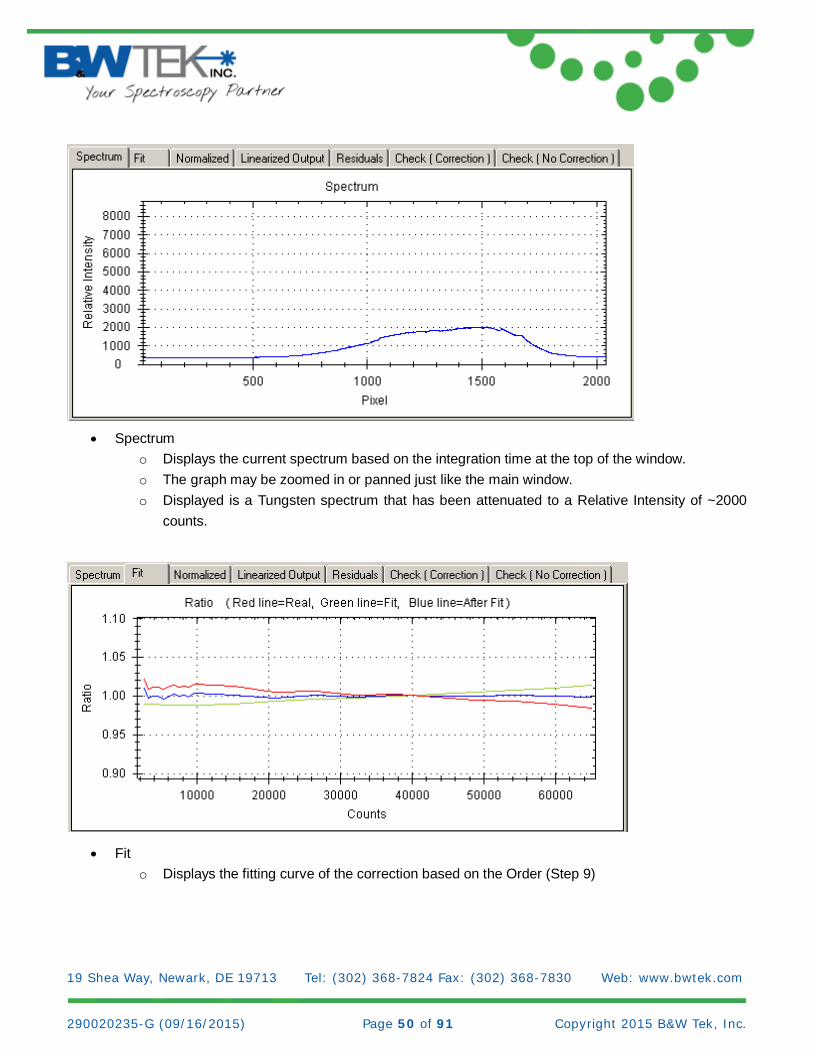
• Residuals o Displays the percent difference between the corrected value and the real value of intensity.
• Check (Correction) o Displays the corrected Spectrum/Integration vs Time graph
19 Shea Way, Newark, DE 19713 Tel: (302) 368-7824 Fax: (302) 368-7830 Web: www.bwtek.com 290020235-G (09/16/2015) Page 53 of 91 Copyright 2015 B&W Tek, Inc.
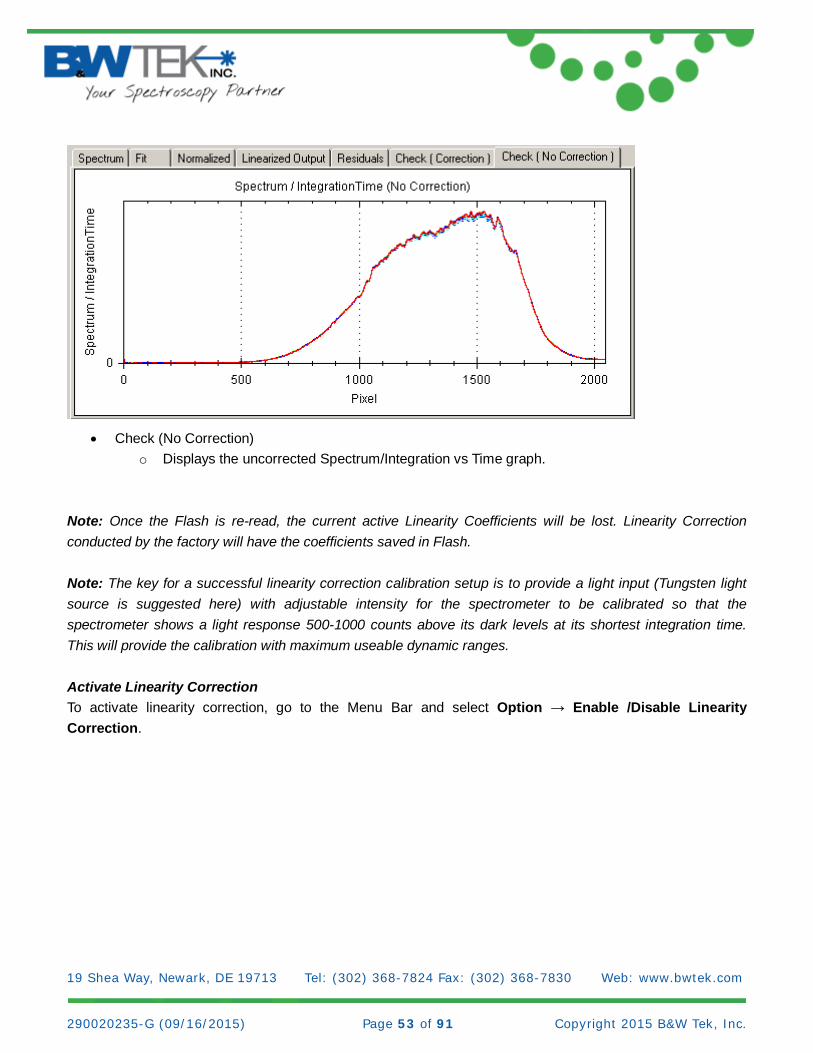
• Check (No Correction)
o Displays the uncorrected Spectrum/Integration vs Time graph. Note: Once the Flash is re-read, the current active Linearity Coefficients will be lost. Linearity Correction conducted by the factory will have the coefficients saved in Flash. Note: The key for a successful linearity correction calibration setup is to provide a light input (Tungsten light source is suggested here) with adjustable intensity for the spectrometer to be calibrated so that the spectrometer shows a light response 500-1000 counts above its dark levels at its shortest integration time. This will provide the calibration with maximum useable dynamic ranges. Activate Linearity Correction To activate linearity correction, go to the Menu Bar and select Option → Enable /Disable Linearity Correction.
19 Shea Way, Newark, DE 19713 Tel: (302) 368-7824 Fax: (302) 368-7830 Web: www.bwtek.com 290020235-G (09/16/2015) Page 54 of 91 Copyright 2015 B&W Tek, Inc.
11.6 Reference Material Correction Plug-in
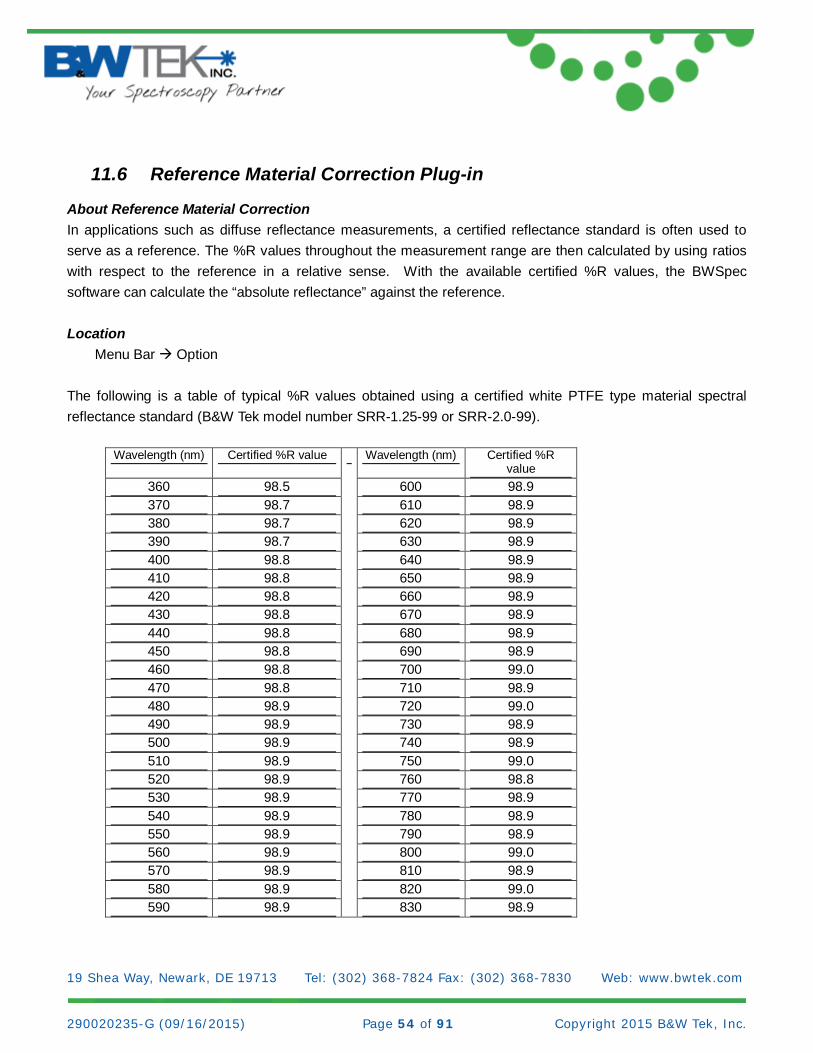
About Reference Material Correction In applications such as diffuse reflectance measurements, a certified reflectance standard is often used to serve as a reference. The %R values throughout the measurement range are then calculated by using ratios with respect to the reference in a relative sense. With the available certified %R values, the BWSpec software can calculate the “absolute reflectance” against the reference. Location Menu Bar Option The following is a table of typical %R values obtained using a certified white PTFE type material spectral reflectance standard (B&W Tek model number SRR-1.25-99 or SRR-2.0-99).
Wavelength (nm) Certified %R value Wavelength (nm) Certified %R value
360 98.5 600 98.9 370 98.7 610 98.9 380 98.7 620 98.9 390 98.7 630 98.9 400 98.8 640 98.9 410 98.8 650 98.9 420 98.8 660 98.9 430 98.8 670 98.9 440 98.8 680 98.9 450 98.8 690 98.9 460 98.8 700 99.0 470 98.8 710 98.9 480 98.9 720 99.0 490 98.9 730 98.9 500 98.9 740 98.9 510 98.9 750 99.0 520 98.9 760 98.8 530 98.9 770 98.9 540 98.9 780 98.9 550 98.9 790 98.9 560 98.9 800 99.0 570 98.9 810 98.9 580 98.9 820 99.0 590 98.9 830 98.9
19 Shea Way, Newark, DE 19713 Tel: (302) 368-7824 Fax: (302) 368-7830 Web: www.bwtek.com 290020235-G (09/16/2015) Page 55 of 91 Copyright 2015 B&W Tek, Inc.
If we define %Rs (non-correction) as the sample percent reflectance at a given wavelength: %Rs (non-correction) = (Sample intensity/Reference intensity)*100.
After reference material correction: %Rs (absolute) = %Rs (non-correction) * Certified %R value/100 where all values are calculated at given wavelengths across the calibration wavelength range.
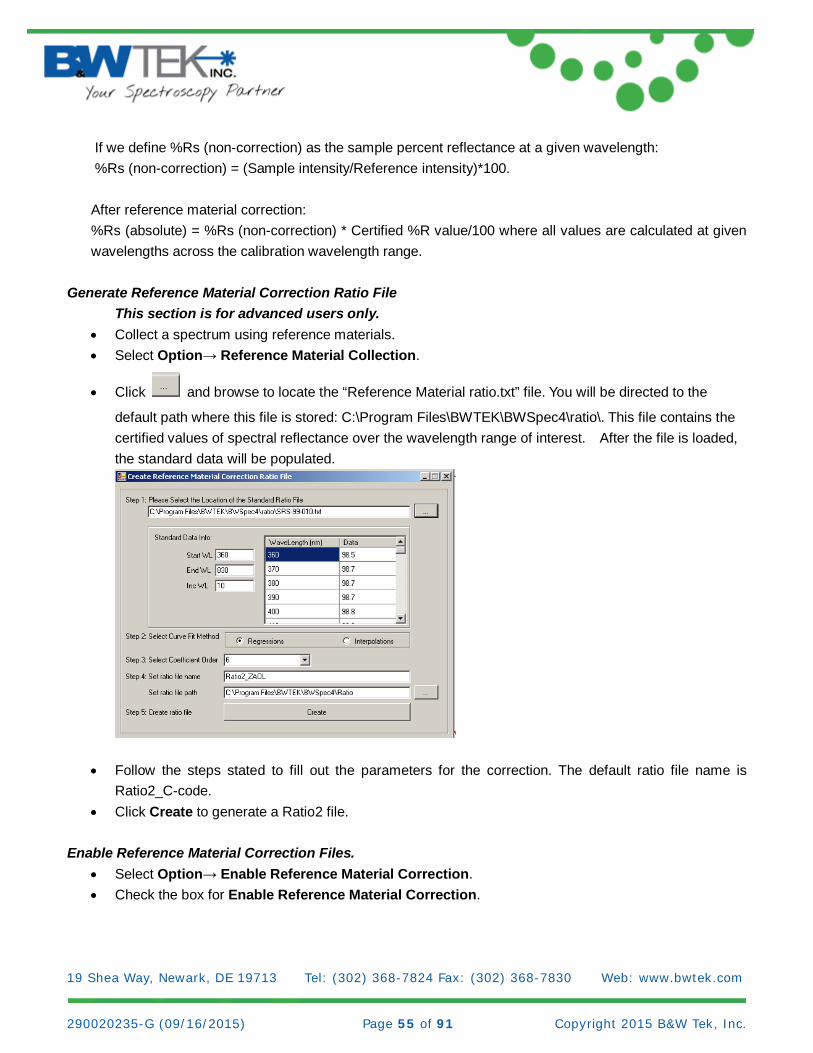
Generate Reference Material Correction Ratio File This section is for advanced users only.
• Collect a spectrum using reference materials. • Select Option→ Reference Material Collection.
• Click and browse to locate the “Reference Material ratio.txt” file. You will be directed to the
default path where this file is stored: C:\Program Files\BWTEK\BWSpec4\ratio\. This file contains the certified values of spectral reflectance over the wavelength range of interest. After the file is loaded, the standard data will be populated.
• Follow the steps stated to fill out the parameters for the correction. The default ratio file name is Ratio2_C-code.
• Click Create to generate a Ratio2 file.
Enable Reference Material Correction Files. • Select Option→ Enable Reference Material Correction. • Check the box for Enable Reference Material Correction.
19 Shea Way, Newark, DE 19713 Tel: (302) 368-7824 Fax: (302) 368-7830 Web: www.bwtek.com 290020235-G (09/16/2015) Page 56 of 91 Copyright 2015 B&W Tek, Inc.
• Click and locate the “Reference Material correction ratio2.txt” file.
• Click Set.
11.7 Relative Intensity Correction Plug-in
About Relative Intensity Correction Relative intensity correction is specific for Raman spectrometer users. Its purpose is to correct unique relative spectral responses against a traceable standard for individual spectrometers. The corrected spectral response of a Raman spectrometer makes meaningful comparisons between data obtained from different instruments possible. The calibrated spectral response also reveals quantitative vibrational intensity information between different Raman features within a given Raman spectrum. The relative intensity correction involves the use of Standard Reference Material 2241 (SRM 2241) for Raman spectrometers when a 785nm excitation laser source is used, SRM2242 when a 532nm excitation laser source is used and SRM2244 when a 1064nm excitation laser source is used. Location Menu Bar Option How to conduct a relative intensity correction This calibration comes standard with B&W Tek’s applicable portable Raman systems. For advanced users, this may be conducted at a customer site with appropriate equipment. A probe must be connected to a Raman system or a laser and a spectrometer in order to get proper results.
• Ensure that the wavelength of the excitation laser you are using is entered into the Raman Excitation Laser Wavelength page on the Display Scales (for example, 785nm). You will need to determine the laser wavelength and put in the appropriate measured value.
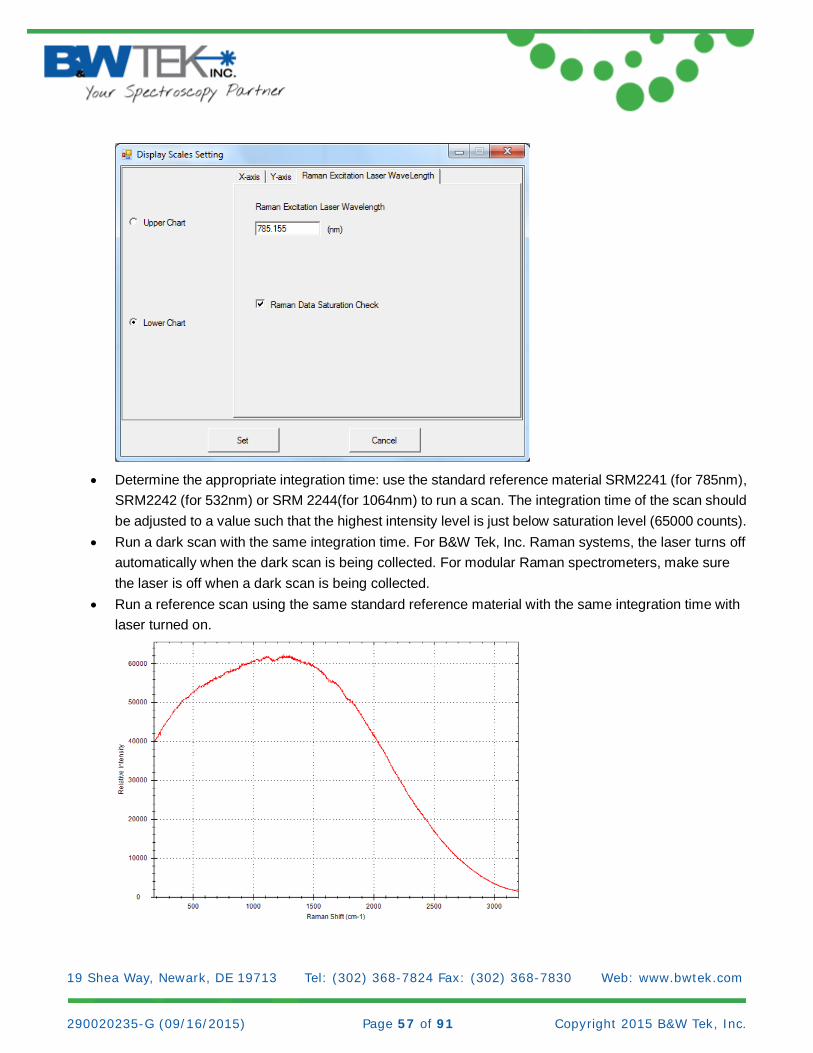
19 Shea Way, Newark, DE 19713 Tel: (302) 368-7824 Fax: (302) 368-7830 Web: www.bwtek.com 290020235-G (09/16/2015) Page 57 of 91 Copyright 2015 B&W Tek, Inc.
• Determine the appropriate integration time: use the standard reference material SRM2241 (for 785nm),
SRM2242 (for 532nm) or SRM 2244(for 1064nm) to run a scan. The integration time of the scan should be adjusted to a value such that the highest intensity level is just below saturation level (65000 counts).
• Run a dark scan with the same integration time. For B&W Tek, Inc. Raman systems, the laser turns off automatically when the dark scan is being collected. For modular Raman spectrometers, make sure the laser is off when a dark scan is being collected.
• Run a reference scan using the same standard reference material with the same integration time with laser turned on.
19 Shea Way, Newark, DE 19713 Tel: (302) 368-7824 Fax: (302) 368-7830 Web: www.bwtek.com 290020235-G (09/16/2015) Page 58 of 91 Copyright 2015 B&W Tek, Inc.
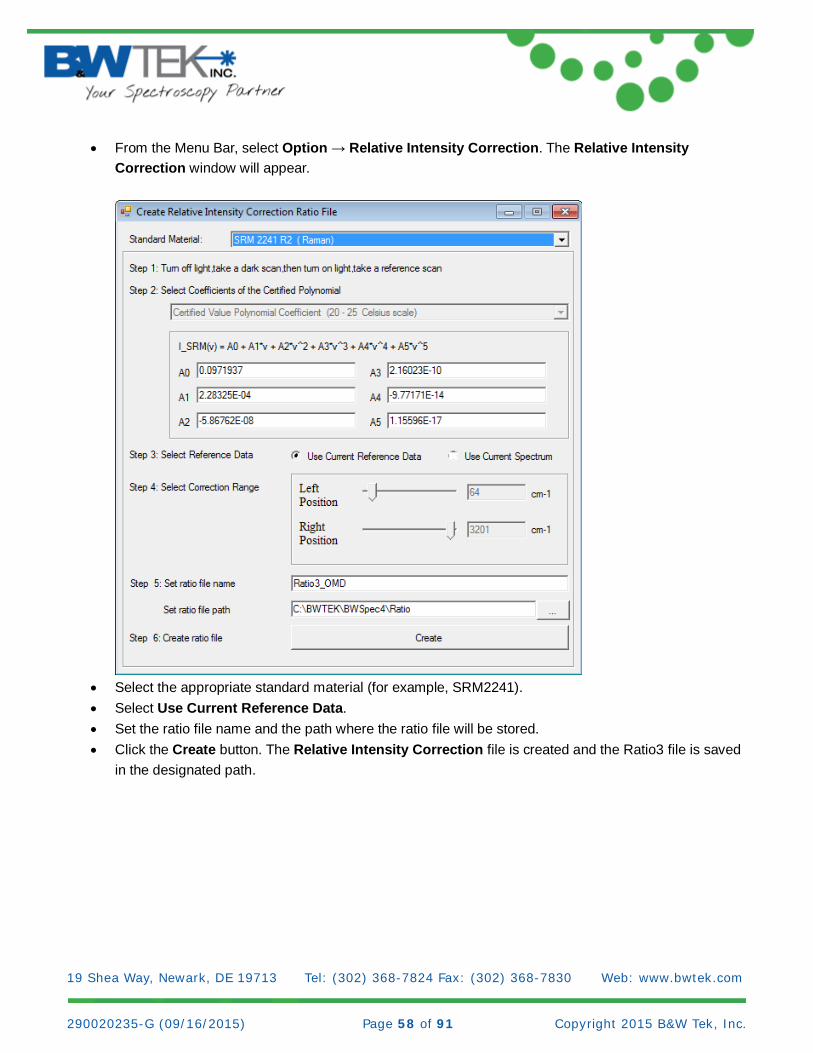
• From the Menu Bar, select Option → Relative Intensity Correction. The Relative Intensity Correction window will appear.
• Select the appropriate standard material (for example, SRM2241). • Select Use Current Reference Data. • Set the ratio file name and the path where the ratio file will be stored. • Click the Create button. The Relative Intensity Correction file is created and the Ratio3 file is saved
in the designated path.
19 Shea Way, Newark, DE 19713 Tel: (302) 368-7824 Fax: (302) 368-7830 Web: www.bwtek.com 290020235-G (09/16/2015) Page 59 of 91 Copyright 2015 B&W Tek, Inc.
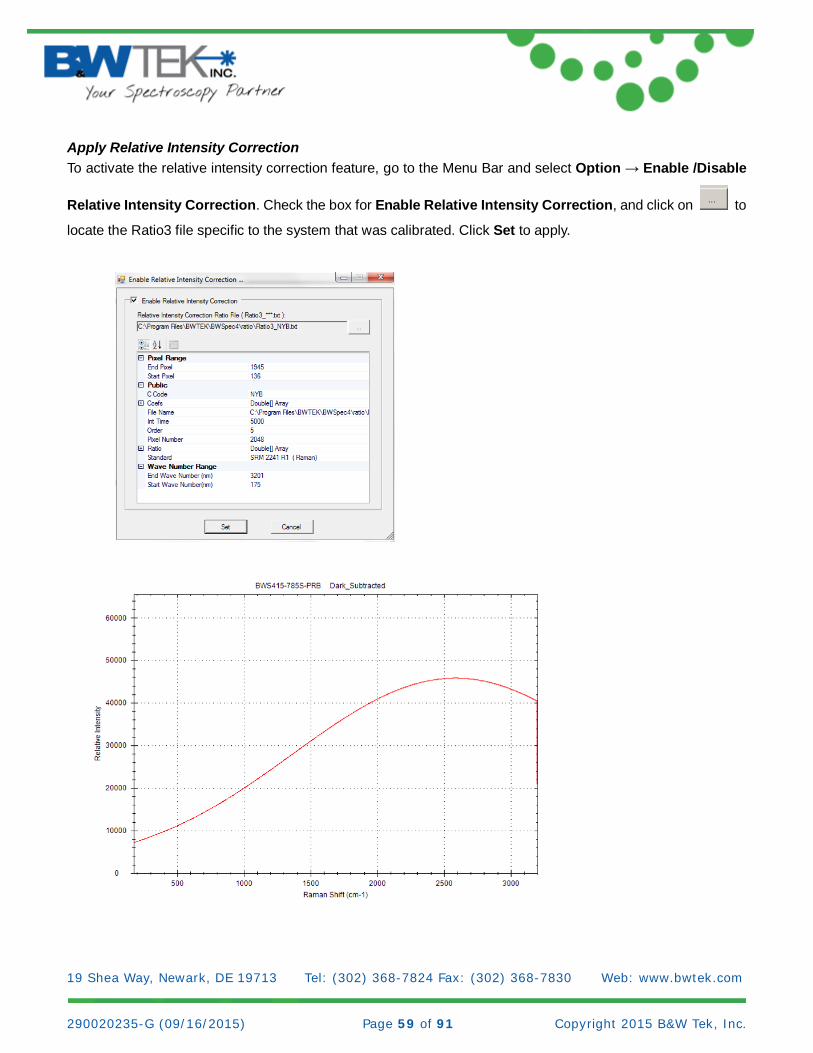
Apply Relative Intensity Correction To activate the relative intensity correction feature, go to the Menu Bar and select Option → Enable /Disable
Relative Intensity Correction. Check the box for Enable Relative Intensity Correction, and click on to
locate the Ratio3 file specific to the system that was calibrated. Click Set to apply.
19 Shea Way, Newark, DE 19713 Tel: (302) 368-7824 Fax: (302) 368-7830 Web: www.bwtek.com 290020235-G (09/16/2015) Page 60 of 91 Copyright 2015 B&W Tek, Inc.
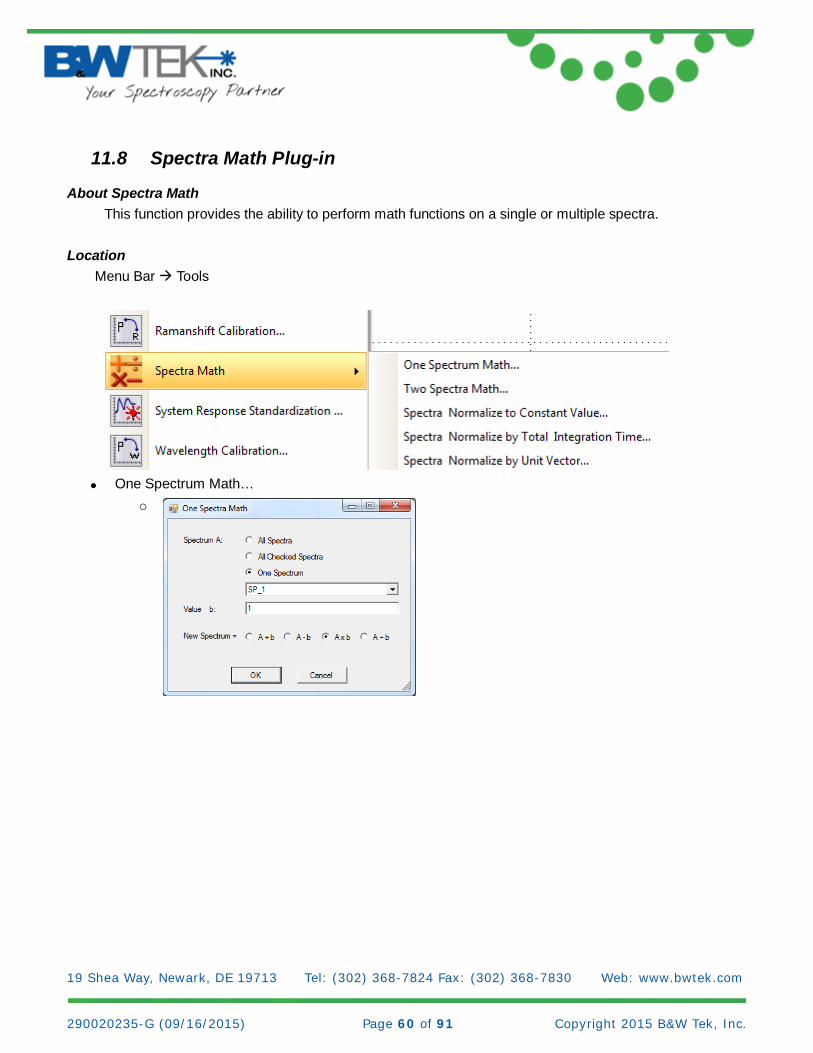
11.8 Spectra Math Plug-in
About Spectra Math This function provides the ability to perform math functions on a single or multiple spectra.
Location Menu Bar Tools
• One Spectrum Math… o
19 Shea Way, Newark, DE 19713 Tel: (302) 368-7824 Fax: (302) 368-7830 Web: www.bwtek.com 290020235-G (09/16/2015) Page 61 of 91 Copyright 2015 B&W Tek, Inc.
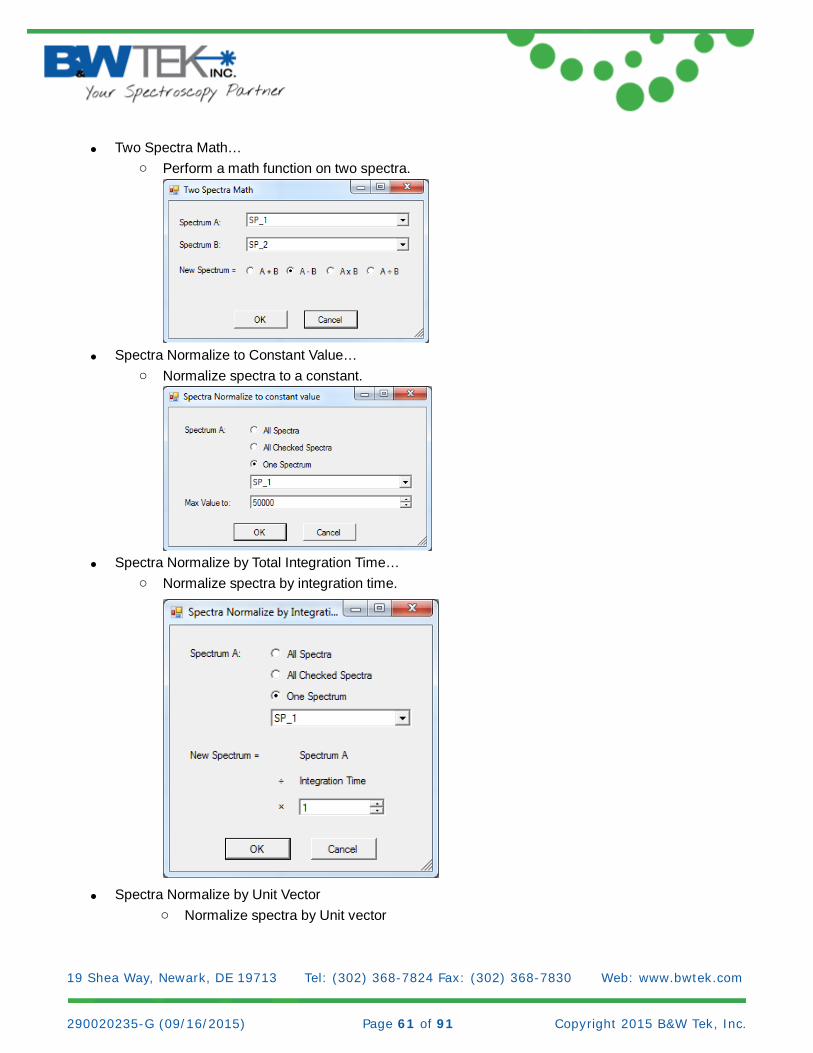
• Two Spectra Math… o Perform a math function on two spectra.
• Spectra Normalize to Constant Value… o Normalize spectra to a constant.
• Spectra Normalize by Total Integration Time… o Normalize spectra by integration time.
• Spectra Normalize by Unit Vector o Normalize spectra by Unit vector

19 Shea Way, Newark, DE 19713 Tel: (302) 368-7824 Fax: (302) 368-7830 Web: www.bwtek.com 290020235-G (09/16/2015) Page 62 of 91 Copyright 2015 B&W Tek, Inc.
11.9 Timeline Plug-in
About Timeline The Timeline function provides automated, timed recording of acquired spectra within the scheduled time interval parameters set by the user. These spectra are then saved into individual files. The data acquisition parameters such as laser power and integration time must be set before entering the timeline dialog.
Location Menu Bar Acquire Timeline (Equal Integration Time)
19 Shea Way, Newark, DE 19713 Tel: (302) 368-7824 Fax: (302) 368-7830 Web: www.bwtek.com 290020235-G (09/16/2015) Page 63 of 91 Copyright 2015 B&W Tek, Inc.
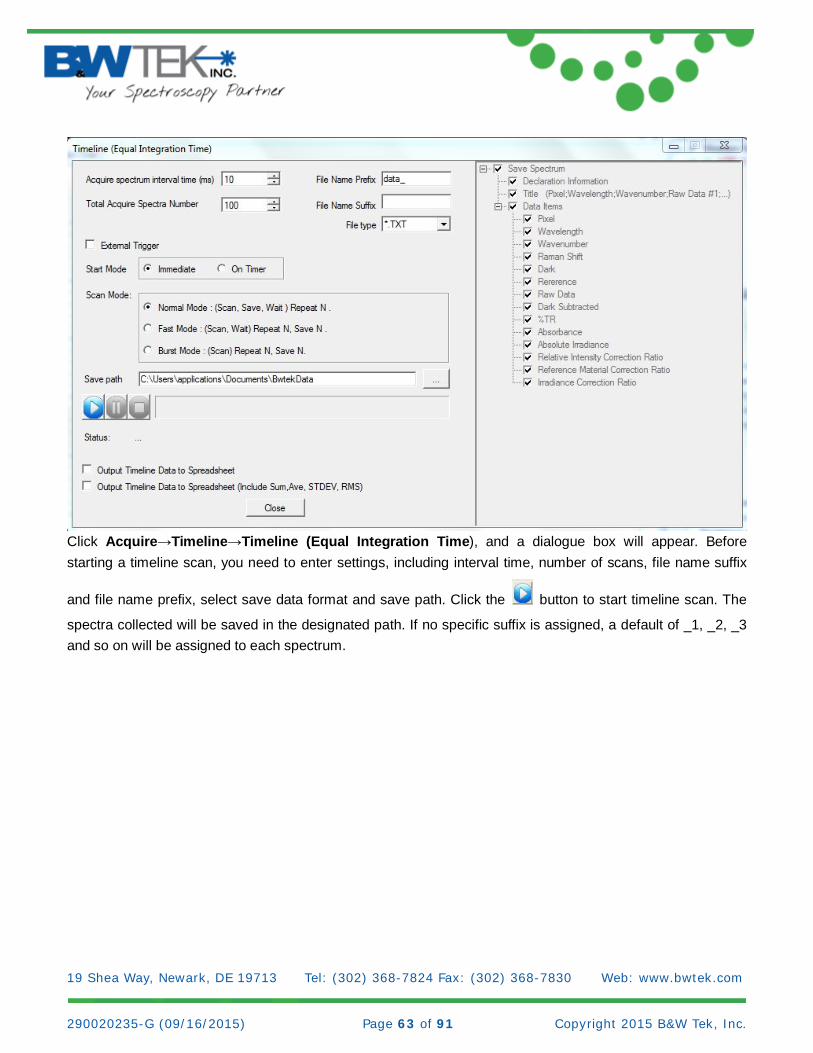
Click Acquire→Timeline→Timeline (Equal Integration Time), and a dialogue box will appear. Before starting a timeline scan, you need to enter settings, including interval time, number of scans, file name suffix
and file name prefix, select save data format and save path. Click the button to start timeline scan. The
spectra collected will be saved in the designated path. If no specific suffix is assigned, a default of _1, _2, _3 and so on will be assigned to each spectrum.
19 Shea Way, Newark, DE 19713 Tel: (302) 368-7824 Fax: (302) 368-7830 Web: www.bwtek.com 290020235-G (09/16/2015) Page 64 of 91 Copyright 2015 B&W Tek, Inc.
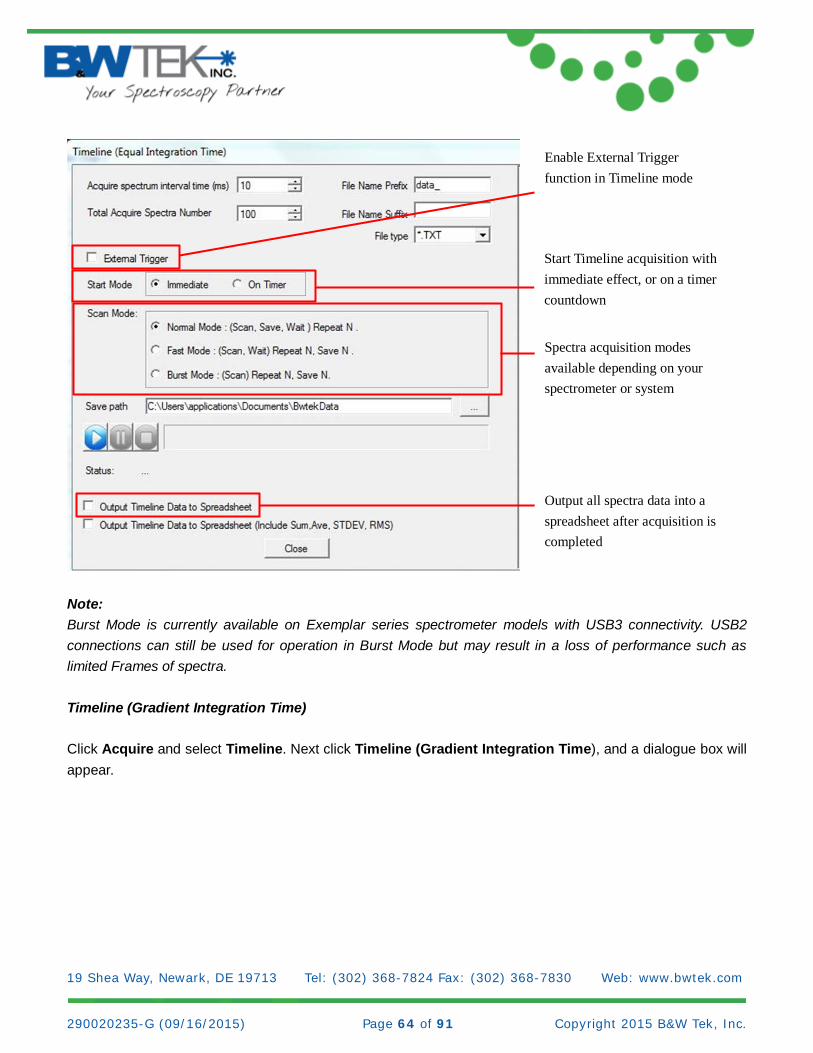
Note: Burst Mode is currently available on Exemplar series spectrometer models with USB3 connectivity. USB2 connections can still be used for operation in Burst Mode but may result in a loss of performance such as limited Frames of spectra. Timeline (Gradient Integration Time) Click Acquire and select Timeline. Next click Timeline (Gradient Integration Time), and a dialogue box will appear.
Enable External Trigger function in Timeline mode
Start Timeline acquisition with immediate effect, or on a timer countdown
Spectra acquisition modes available depending on your spectrometer or system
Output all spectra data into a spreadsheet after acquisition is completed
19 Shea Way, Newark, DE 19713 Tel: (302) 368-7824 Fax: (302) 368-7830 Web: www.bwtek.com 290020235-G (09/16/2015) Page 65 of 91 Copyright 2015 B&W Tek, Inc.
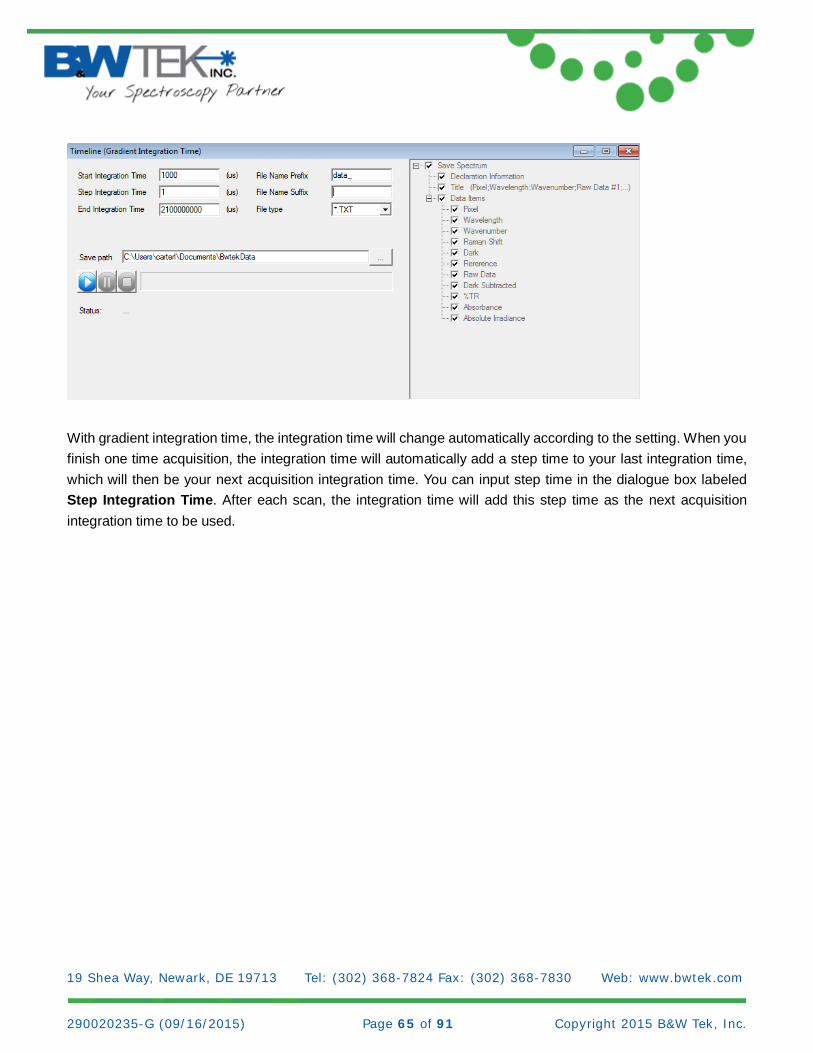
With gradient integration time, the integration time will change automatically according to the setting. When you finish one time acquisition, the integration time will automatically add a step time to your last integration time, which will then be your next acquisition integration time. You can input step time in the dialogue box labeled Step Integration Time. After each scan, the integration time will add this step time as the next acquisition integration time to be used.
19 Shea Way, Newark, DE 19713 Tel: (302) 368-7824 Fax: (302) 368-7830 Web: www.bwtek.com 290020235-G (09/16/2015) Page 66 of 91 Copyright 2015 B&W Tek, Inc.
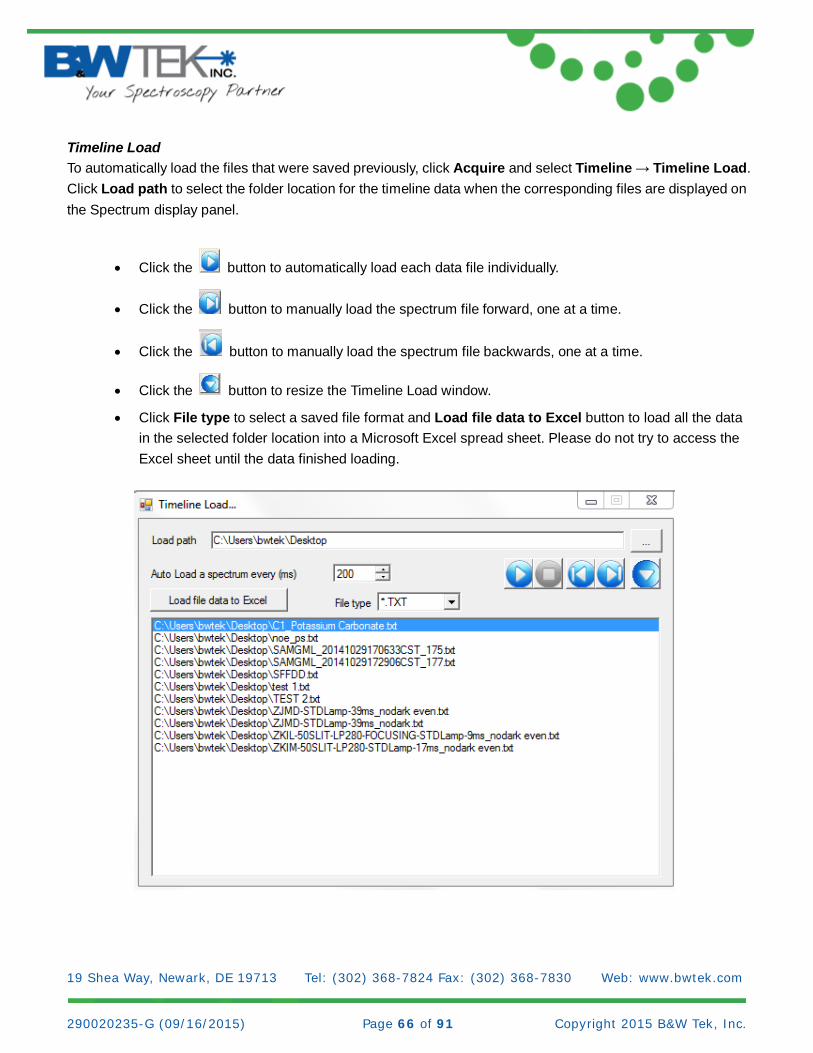
Timeline Load To automatically load the files that were saved previously, click Acquire and select Timeline → Timeline Load. Click Load path to select the folder location for the timeline data when the corresponding files are displayed on the Spectrum display panel.
• Click the button to automatically load each data file individually.
• Click the button to manually load the spectrum file forward, one at a time.
• Click the button to manually load the spectrum file backwards, one at a time.
• Click the button to resize the Timeline Load window.
• Click File type to select a saved file format and Load file data to Excel button to load all the data in the selected folder location into a Microsoft Excel spread sheet. Please do not try to access the Excel sheet until the data finished loading.

19 Shea Way, Newark, DE 19713 Tel: (302) 368-7824 Fax: (302) 368-7830 Web: www.bwtek.com 290020235-G (09/16/2015) Page 67 of 91 Copyright 2015 B&W Tek, Inc.
11.10 Wavelength Calibration Plug-in
This Plug-in is not intended to be used by end users. If your spectrometer is in need of calibration, please contact B&W Tek, Inc. at http://bwtek.com/support/. Wavelength Calibration must be conducted by B&W Tek, Inc. or OEM customers equipped with certified and traceable Light Standards and specialized calibration setups.
11.11 Raman Shift Calibration Plug-in
This Plug-in is not intended to be used by end users. Raman Shift Calibration must be conducted by B&W Tek, Inc., certified Service Center, or Distributor equipped with specialized calibration setups. B&W Tek, Inc. will not be responsible for any loss of your work and for any consequence if factory configuration is accidentally changed or corrupted.
11.12 Performance Test Plug-in
About Performance Test The Performance Test is a procedure that evaluates a Raman instrument’s performance with regards to accuracy and repeatability of instrument readings. This feature designed to be used when the software is communicating with a Raman instrument. The performance test will validate a single peak of a reference standard spectrum. It will check if the peak is within acceptable limits: the peak’s signal must be within 30% of the factory settings and the peak’s shift must be no more than one pixel off of the factory settings, where the factory setting is a predefined reference standard spectrum. It is recommended that a reference file be created as soon as possible with the new unit. Reference files are user created and do not come pre-loaded with the software. The performance test should be performed on a regular basis to ensure consistency in the performance and operation of the instrument.
Location Menu Bar Setup Create Reference File
A new reference file may be created in this tab. The user is responsible for providing a Raman-active
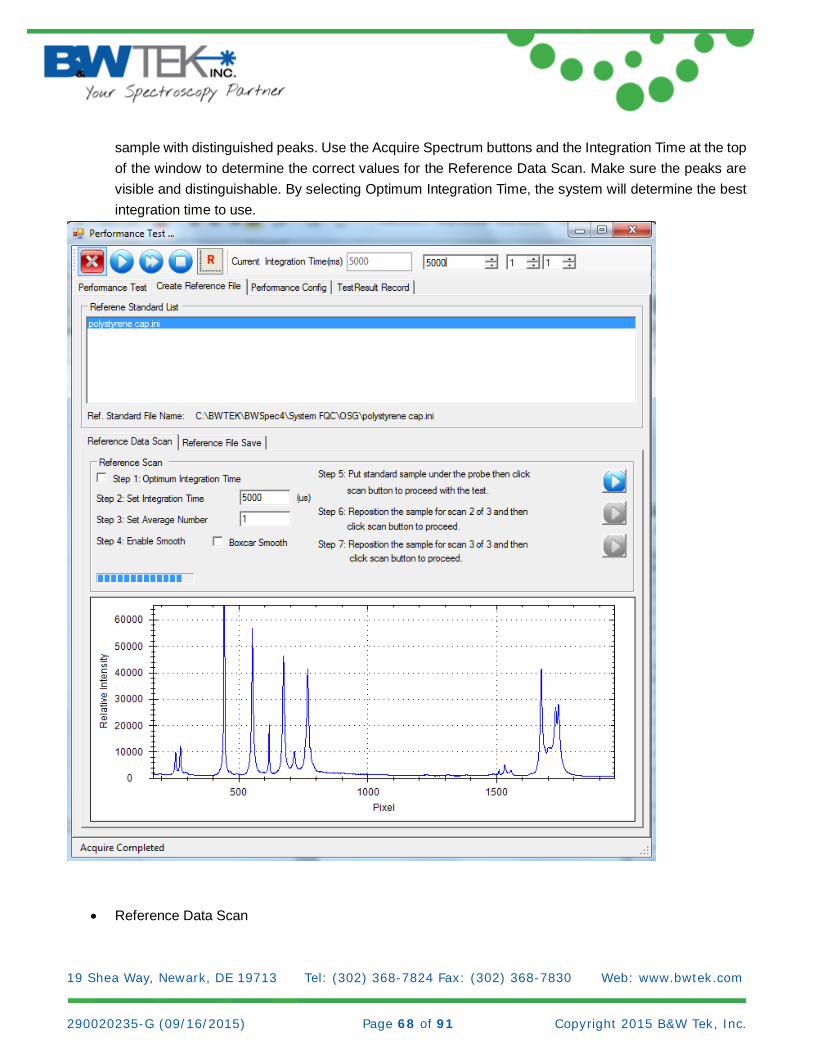
19 Shea Way, Newark, DE 19713 Tel: (302) 368-7824 Fax: (302) 368-7830 Web: www.bwtek.com 290020235-G (09/16/2015) Page 68 of 91 Copyright 2015 B&W Tek, Inc.
sample with distinguished peaks. Use the Acquire Spectrum buttons and the Integration Time at the top of the window to determine the correct values for the Reference Data Scan. Make sure the peaks are visible and distinguishable. By selecting Optimum Integration Time, the system will determine the best integration time to use.
• Reference Data Scan
19 Shea Way, Newark, DE 19713 Tel: (302) 368-7824 Fax: (302) 368-7830 Web: www.bwtek.com 290020235-G (09/16/2015) Page 69 of 91 Copyright 2015 B&W Tek, Inc.
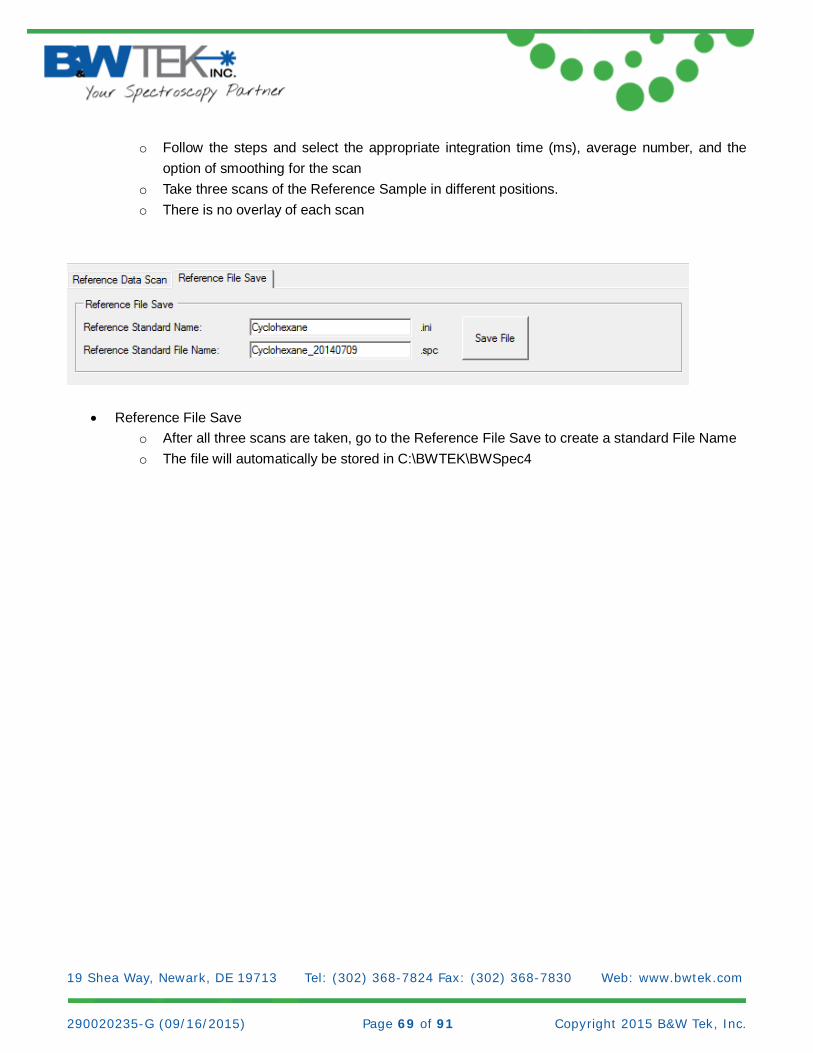
o Follow the steps and select the appropriate integration time (ms), average number, and the option of smoothing for the scan
o Take three scans of the Reference Sample in different positions. o There is no overlay of each scan
• Reference File Save o After all three scans are taken, go to the Reference File Save to create a standard File Name o The file will automatically be stored in C:\BWTEK\BWSpec4
19 Shea Way, Newark, DE 19713 Tel: (302) 368-7824 Fax: (302) 368-7830 Web: www.bwtek.com 290020235-G (09/16/2015) Page 70 of 91 Copyright 2015 B&W Tek, Inc.
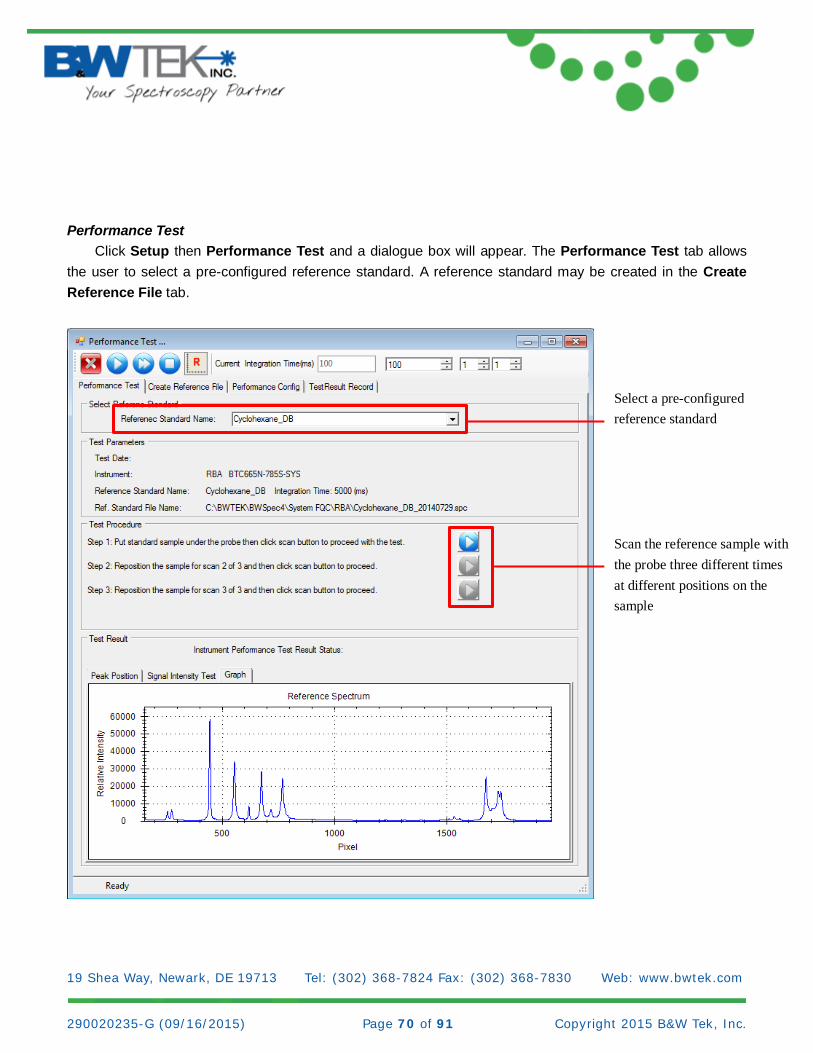
Performance Test
Click Setup then Performance Test and a dialogue box will appear. The Performance Test tab allows the user to select a pre-configured reference standard. A reference standard may be created in the Create Reference File tab.
Select a pre-configured reference standard
Scan the reference sample with the probe three different times at different positions on the sample

19 Shea Way, Newark, DE 19713 Tel: (302) 368-7824 Fax: (302) 368-7830 Web: www.bwtek.com 290020235-G (09/16/2015) Page 71 of 91 Copyright 2015 B&W Tek, Inc.
• Select Reference Standard
o Use the same reference standard that is going to be used as a sample in the performance test. The default is polystyrene.
• Test Parameters o Test Date: will be filled in at the conclusion of the test. o Instrument: Is the Raman unit that is currently being used for testing and is automatically filled. o Reference Standard name: Is the name of the reference standard selected; this will also show
the integration time when the Reference Standard was made. o Ref. Standard File Name: The file name and location of the reference file.
• Test Procedure o Follow each of the steps to take three scans of the Reference Standard at different positions. o The integration time is pre-selected based on the Reference Standard.
• Test Result o After the three sample scans are taken the software will compare the scans to the reference
sample. o The shift between the measured peak and predefined reference peak is no more than one pixel
and the measured peak’s signal is within 30% of the predefined reference peak‘s intensity (factory settings).
o The performance test will fail if the peak position, signal intensity test or HQI fails. In such cases, the instrument should not be used for measurements since it cannot provide consistent readings.
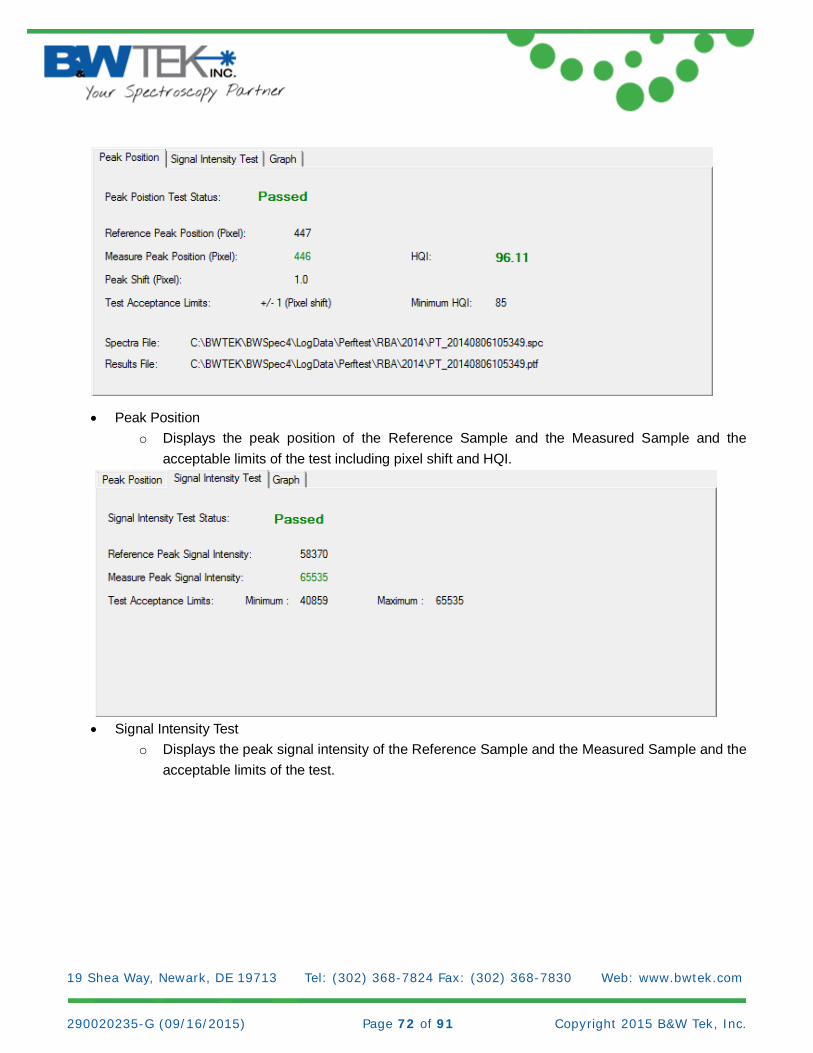
o Once the test is completed, the collected spectrum and test results are saved in the files. The spectrum is stored in a Grams SPC data file format (*.spc), while the test results are saved in a BWTek proprietary binary file format (*.ptf). These can be viewed in the Test Result Record tab.
19 Shea Way, Newark, DE 19713 Tel: (302) 368-7824 Fax: (302) 368-7830 Web: www.bwtek.com 290020235-G (09/16/2015) Page 72 of 91 Copyright 2015 B&W Tek, Inc.
• Peak Position o Displays the peak position of the Reference Sample and the Measured Sample and the
acceptable limits of the test including pixel shift and HQI.
• Signal Intensity Test
o Displays the peak signal intensity of the Reference Sample and the Measured Sample and the acceptable limits of the test.
19 Shea Way, Newark, DE 19713 Tel: (302) 368-7824 Fax: (302) 368-7830 Web: www.bwtek.com 290020235-G (09/16/2015) Page 73 of 91 Copyright 2015 B&W Tek, Inc.
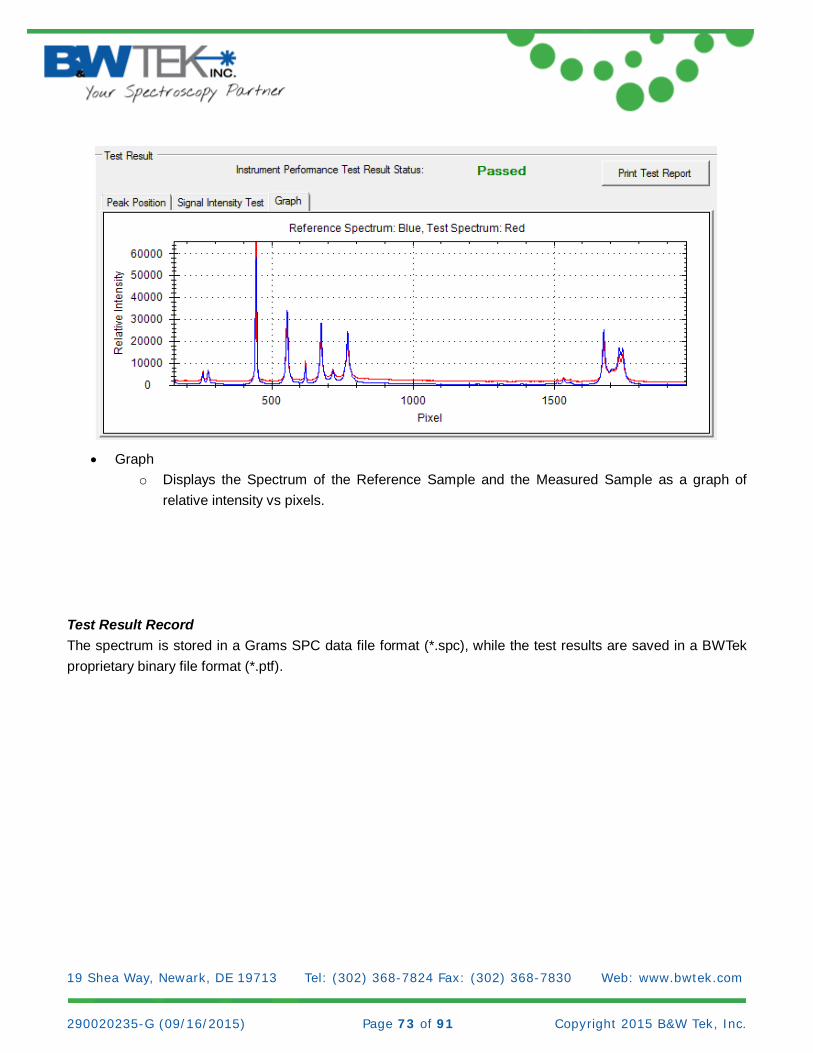
• Graph o Displays the Spectrum of the Reference Sample and the Measured Sample as a graph of
relative intensity vs pixels.
Test Result Record The spectrum is stored in a Grams SPC data file format (*.spc), while the test results are saved in a BWTek proprietary binary file format (*.ptf).
19 Shea Way, Newark, DE 19713 Tel: (302) 368-7824 Fax: (302) 368-7830 Web: www.bwtek.com 290020235-G (09/16/2015) Page 74 of 91 Copyright 2015 B&W Tek, Inc.
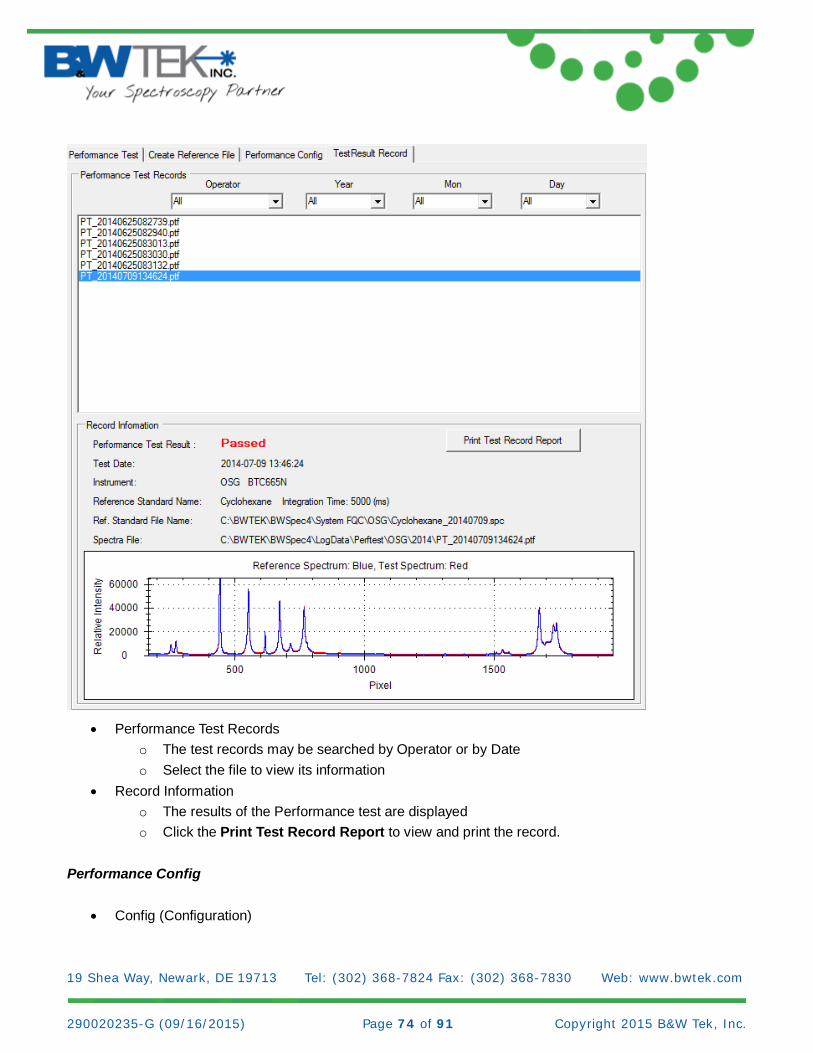
• Performance Test Records
o The test records may be searched by Operator or by Date o Select the file to view its information
• Record Information o The results of the Performance test are displayed o Click the Print Test Record Report to view and print the record.
Performance Config
• Config (Configuration)
19 Shea Way, Newark, DE 19713 Tel: (302) 368-7824 Fax: (302) 368-7830 Web: www.bwtek.com 290020235-G (09/16/2015) Page 75 of 91 Copyright 2015 B&W Tek, Inc.
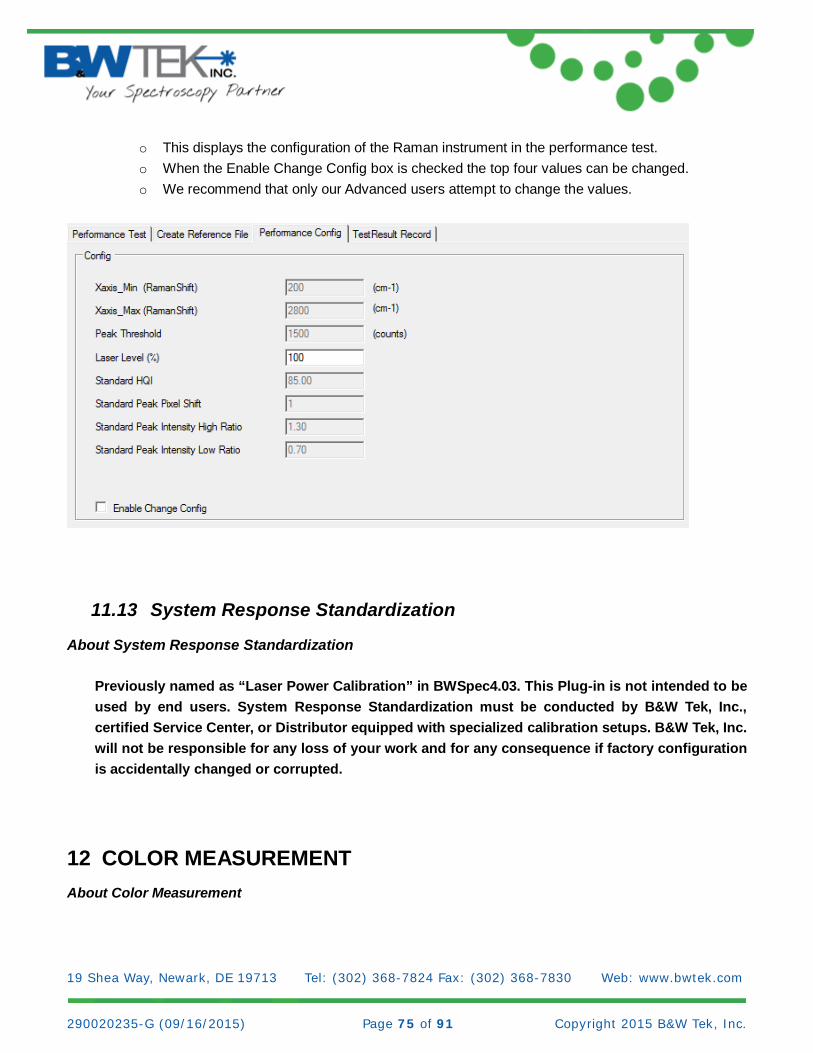
o This displays the configuration of the Raman instrument in the performance test. o When the Enable Change Config box is checked the top four values can be changed. o We recommend that only our Advanced users attempt to change the values.
11.13 System Response Standardization
About System Response Standardization
Previously named as “Laser Power Calibration” in BWSpec4.03. This Plug-in is not intended to be used by end users. System Response Standardization must be conducted by B&W Tek, Inc., certified Service Center, or Distributor equipped with specialized calibration setups. B&W Tek, Inc. will not be responsible for any loss of your work and for any consequence if factory configuration is accidentally changed or corrupted.
12 COLOR MEASUREMENT About Color Measurement
19 Shea Way, Newark, DE 19713 Tel: (302) 368-7824 Fax: (302) 368-7830 Web: www.bwtek.com 290020235-G (09/16/2015) Page 76 of 91 Copyright 2015 B&W Tek, Inc.
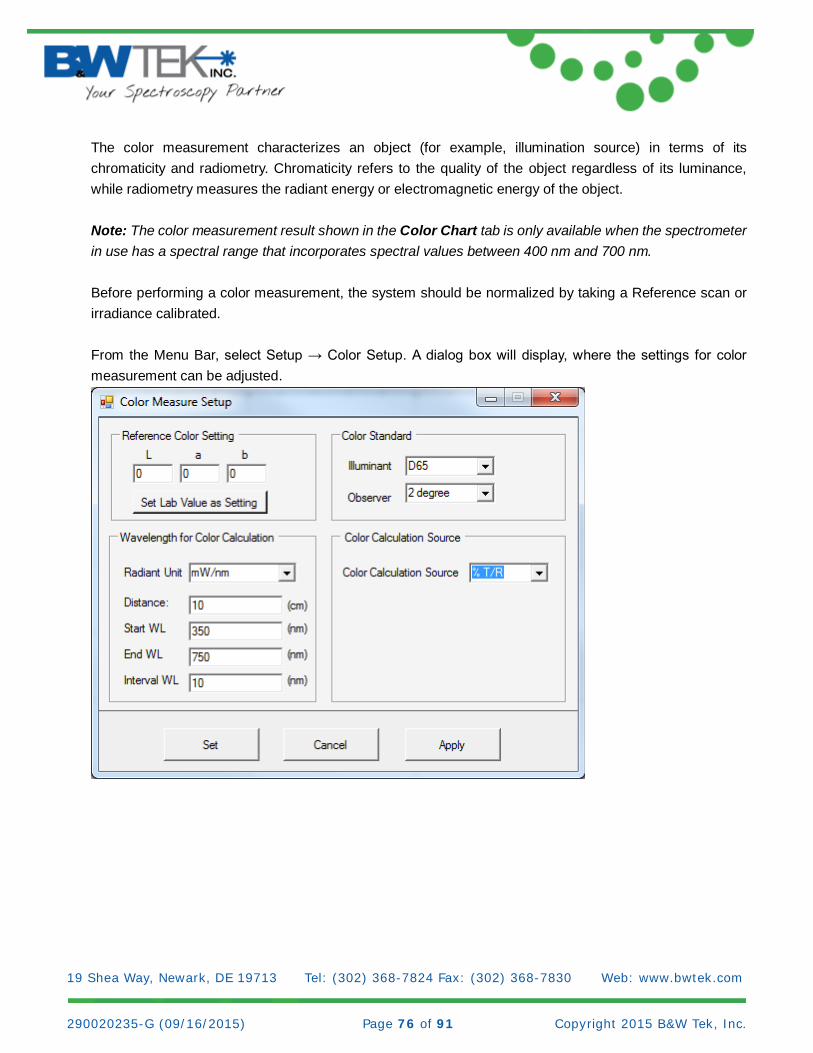
The color measurement characterizes an object (for example, illumination source) in terms of its chromaticity and radiometry. Chromaticity refers to the quality of the object regardless of its luminance, while radiometry measures the radiant energy or electromagnetic energy of the object. Note: The color measurement result shown in the Color Chart tab is only available when the spectrometer in use has a spectral range that incorporates spectral values between 400 nm and 700 nm. Before performing a color measurement, the system should be normalized by taking a Reference scan or irradiance calibrated.
From the Menu Bar, select Setup → Color Setup. A dialog box will display, where the settings for color measurement can be adjusted.
19 Shea Way, Newark, DE 19713 Tel: (302) 368-7824 Fax: (302) 368-7830 Web: www.bwtek.com 290020235-G (09/16/2015) Page 77 of 91 Copyright 2015 B&W Tek, Inc.
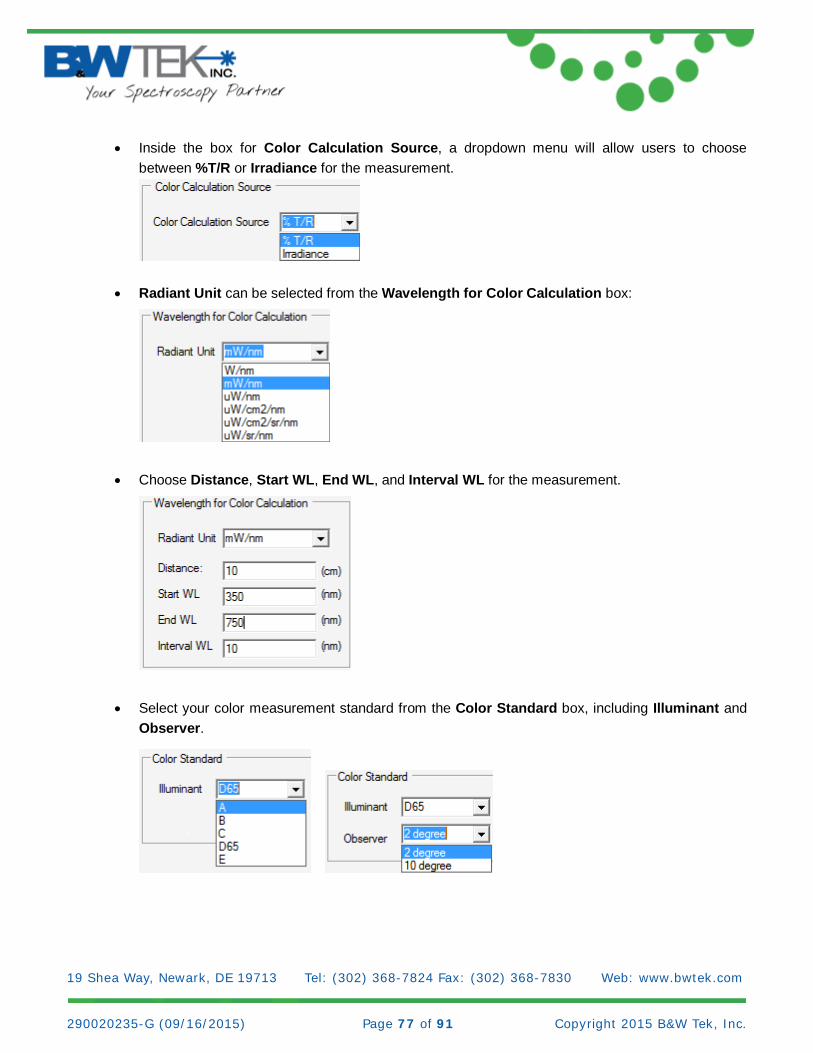
• Inside the box for Color Calculation Source, a dropdown menu will allow users to choose between %T/R or Irradiance for the measurement.
• Radiant Unit can be selected from the Wavelength for Color Calculation box:
• Choose Distance, Start WL, End WL, and Interval WL for the measurement.
• Select your color measurement standard from the Color Standard box, including Illuminant and Observer.

19 Shea Way, Newark, DE 19713 Tel: (302) 368-7824 Fax: (302) 368-7830 Web: www.bwtek.com 290020235-G (09/16/2015) Page 78 of 91 Copyright 2015 B&W Tek, Inc.
Reference and Dark Scan for %T/R Measurement To perform a %T/R based color measurement, a white reflectance standard in reflectance setup and a stable light source covering the color range should be used. Light sources such as the BPS101 and BPS120 from B&W Tek, Inc. are suitable candidates. As the apparent color of reflective objects depends upon both the spectral response of the spectrometer and the spectral output of the illumination source, a reflectance reference scan should be performed often so that the error due to the lamp drift is minimized.
Connect the light source and the spectrometer via a fiber reflectance probe. Turn on the light source and allow it to warm up.
• Perform a reference scan. • Perform a dark scan using the same integration time as the reference scan. Make sure to place the
probe onto an absorbing black material or physically block the light from entering into the probe for the dark scan.
19 Shea Way, Newark, DE 19713 Tel: (302) 368-7824 Fax: (302) 368-7830 Web: www.bwtek.com 290020235-G (09/16/2015) Page 79 of 91 Copyright 2015 B&W Tek, Inc.
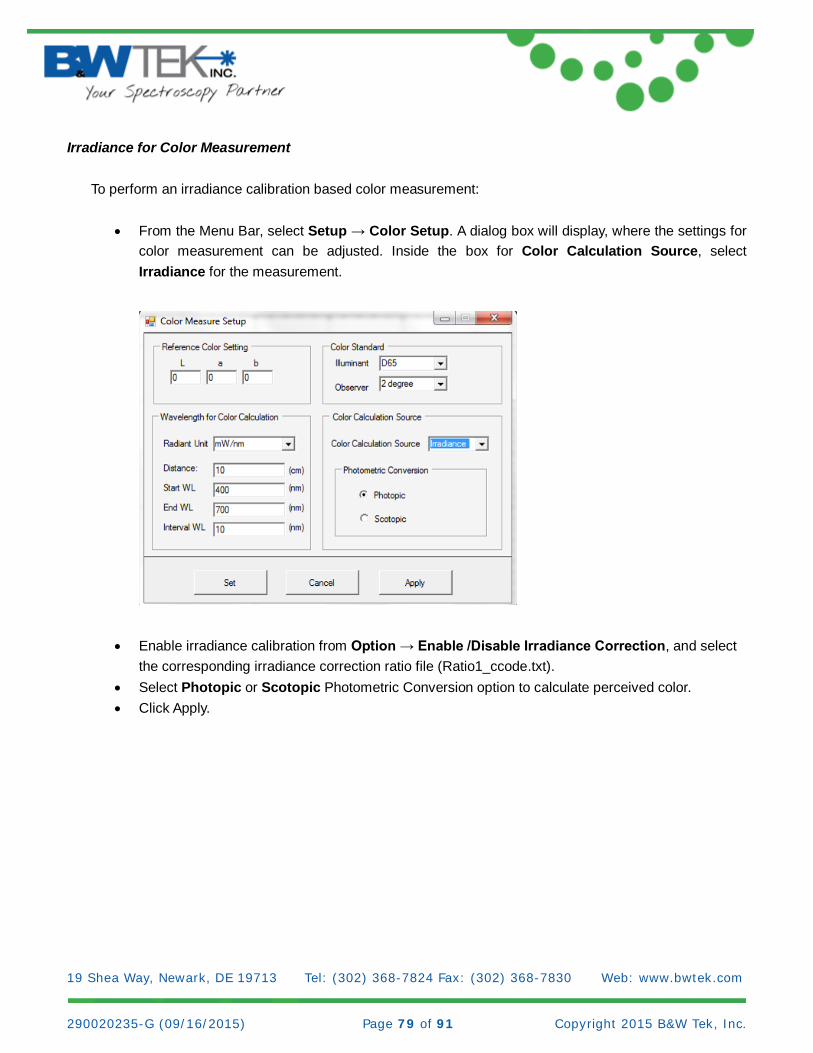
Irradiance for Color Measurement To perform an irradiance calibration based color measurement:
• From the Menu Bar, select Setup → Color Setup. A dialog box will display, where the settings for
color measurement can be adjusted. Inside the box for Color Calculation Source, select Irradiance for the measurement.
• Enable irradiance calibration from Option → Enable /Disable Irradiance Correction, and select
the corresponding irradiance correction ratio file (Ratio1_ccode.txt). • Select Photopic or Scotopic Photometric Conversion option to calculate perceived color. • Click Apply.

19 Shea Way, Newark, DE 19713 Tel: (302) 368-7824 Fax: (302) 368-7830 Web: www.bwtek.com 290020235-G (09/16/2015) Page 80 of 91 Copyright 2015 B&W Tek, Inc.
Color Analysis
To acquire sample color data: • Place the probe onto the desired sample to be measured. • Acquire data scan on the sample material intended for color analysis.

19 Shea Way, Newark, DE 19713 Tel: (302) 368-7824 Fax: (302) 368-7830 Web: www.bwtek.com 290020235-G (09/16/2015) Page 81 of 91 Copyright 2015 B&W Tek, Inc.
Data Display
Click the Color Chart tab for the chromaticity diagram and data display. Options for four different CIE color spaces are available:
• CIEXYZ color space

19 Shea Way, Newark, DE 19713 Tel: (302) 368-7824 Fax: (302) 368-7830 Web: www.bwtek.com 290020235-G (09/16/2015) Page 82 of 91 Copyright 2015 B&W Tek, Inc.
• CIELUV color space
• CIELAB color space
19 Shea Way, Newark, DE 19713 Tel: (302) 368-7824 Fax: (302) 368-7830 Web: www.bwtek.com 290020235-G (09/16/2015) Page 83 of 91 Copyright 2015 B&W Tek, Inc.
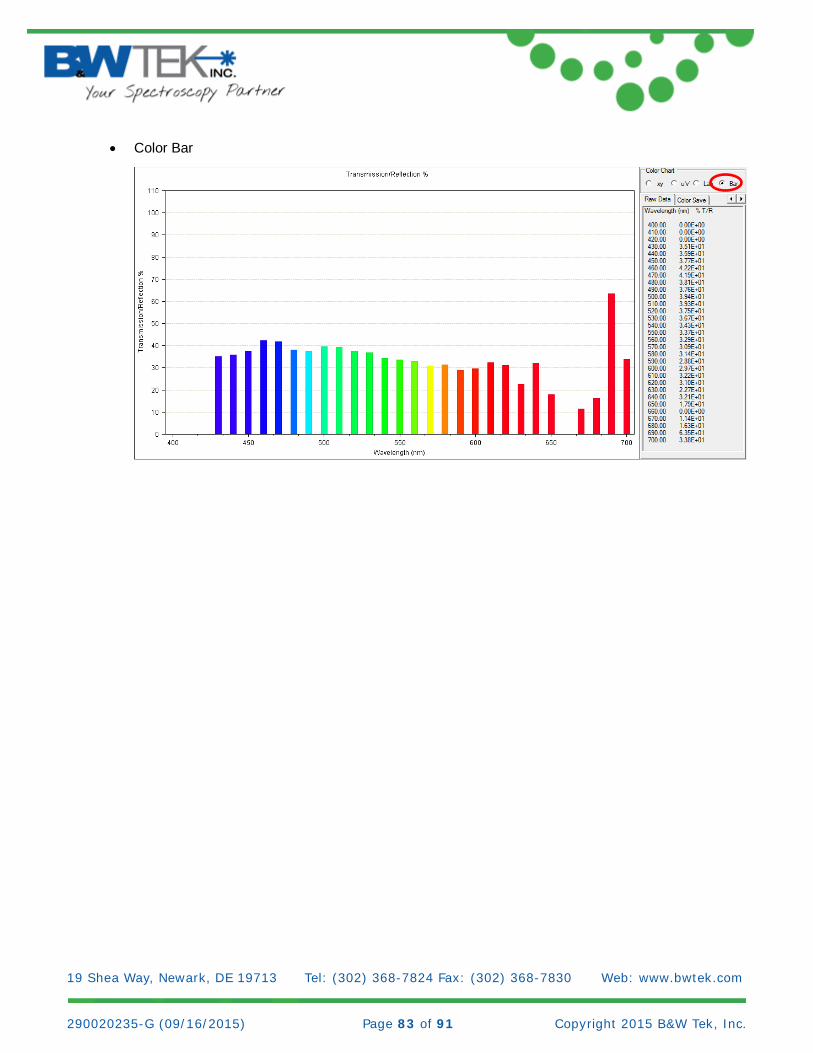
• Color Bar
19 Shea Way, Newark, DE 19713 Tel: (302) 368-7824 Fax: (302) 368-7830 Web: www.bwtek.com 290020235-G (09/16/2015) Page 84 of 91 Copyright 2015 B&W Tek, Inc.
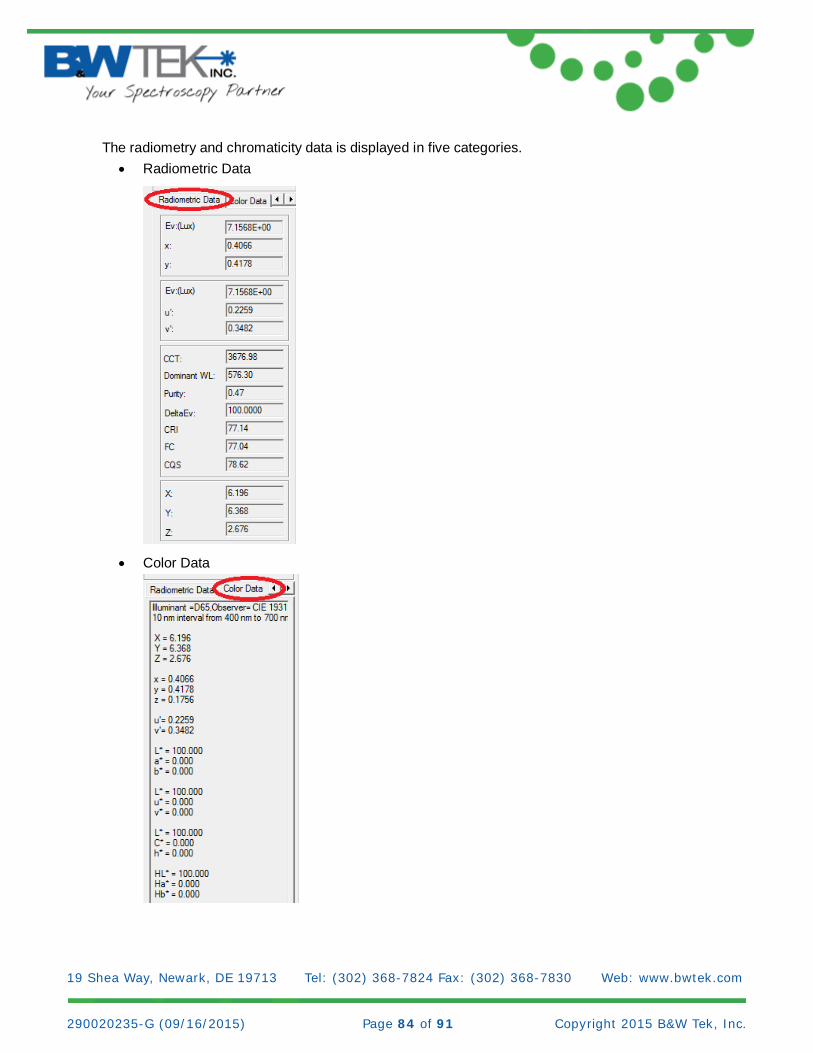
The radiometry and chromaticity data is displayed in five categories. • Radiometric Data
• Color Data

19 Shea Way, Newark, DE 19713 Tel: (302) 368-7824 Fax: (302) 368-7830 Web: www.bwtek.com 290020235-G (09/16/2015) Page 85 of 91 Copyright 2015 B&W Tek, Inc.
• Luminous Intensity
• Raw Data
19 Shea Way, Newark, DE 19713 Tel: (302) 368-7824 Fax: (302) 368-7830 Web: www.bwtek.com 290020235-G (09/16/2015) Page 86 of 91 Copyright 2015 B&W Tek, Inc.
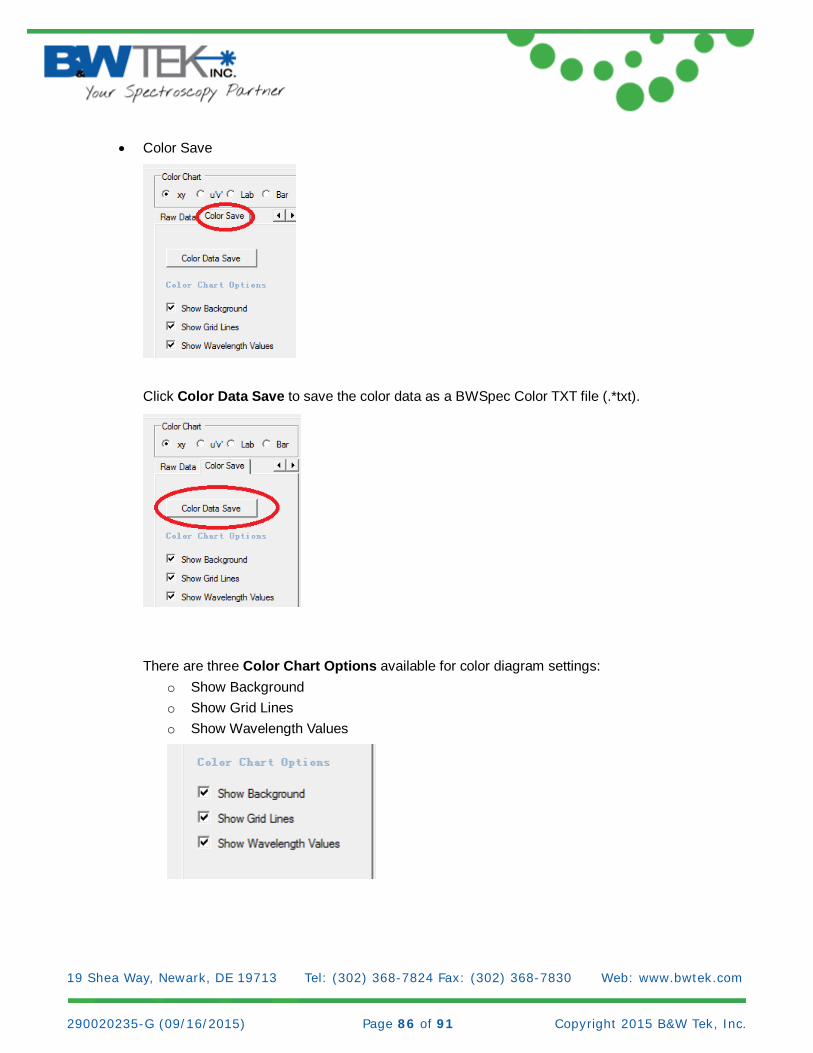
• Color Save
Click Color Data Save to save the color data as a BWSpec Color TXT file (.*txt).
There are three Color Chart Options available for color diagram settings:
o Show Background o Show Grid Lines o Show Wavelength Values
19 Shea Way, Newark, DE 19713 Tel: (302) 368-7824 Fax: (302) 368-7830 Web: www.bwtek.com 290020235-G (09/16/2015) Page 87 of 91 Copyright 2015 B&W Tek, Inc.
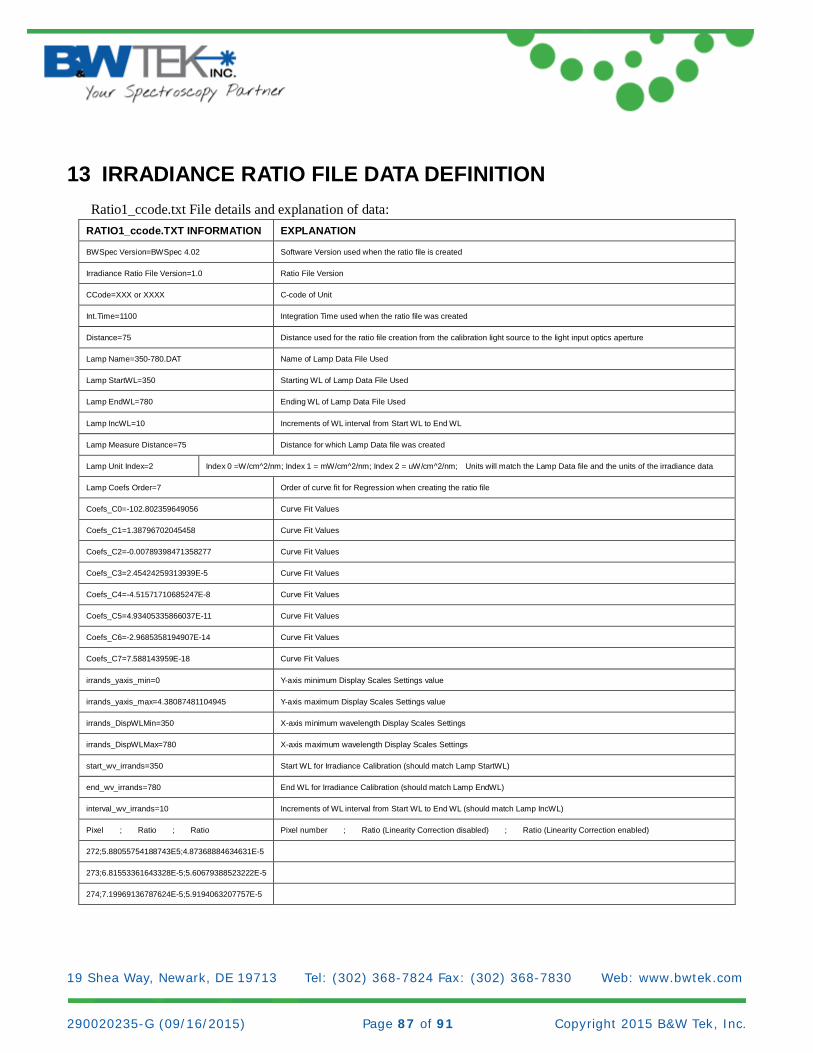
13 IRRADIANCE RATIO FILE DATA DEFINITION Ratio1_ccode.txt File details and explanation of data:
RATIO1_ccode.TXT INFORMATION EXPLANATION
BWSpec Version=BWSpec 4.02 Software Version used when the ratio file is created
Irradiance Ratio File Version=1.0 Ratio File Version
CCode=XXX or XXXX C-code of Unit
Int.Time=1100 Integration Time used when the ratio file was created
Distance=75 Distance used for the ratio file creation from the calibration light source to the light input optics aperture
Lamp Name=350-780.DAT Name of Lamp Data File Used
Lamp StartWL=350 Starting WL of Lamp Data File Used
Lamp EndWL=780 Ending WL of Lamp Data File Used
Lamp IncWL=10 Increments of WL interval from Start WL to End WL
Lamp Measure Distance=75 Distance for which Lamp Data file was created
Lamp Unit Index=2 Index 0 =W/cm^2/nm; Index 1 = mW/cm^2/nm; Index 2 = uW/cm^2/nm; Units will match the Lamp Data file and the units of the irradiance data
Lamp Coefs Order=7 Order of curve fit for Regression when creating the ratio file
Coefs_C0=-102.802359649056 Curve Fit Values
Coefs_C1=1.38796702045458 Curve Fit Values
Coefs_C2=-0.00789398471358277 Curve Fit Values
Coefs_C3=2.45424259313939E-5 Curve Fit Values
Coefs_C4=-4.51571710685247E-8 Curve Fit Values
Coefs_C5=4.93405335866037E-11 Curve Fit Values
Coefs_C6=-2.9685358194907E-14 Curve Fit Values
Coefs_C7=7.588143959E-18 Curve Fit Values
irrands_yaxis_min=0 Y-axis minimum Display Scales Settings value
irrands_yaxis_max=4.38087481104945 Y-axis maximum Display Scales Settings value
irrands_DispWLMin=350 X-axis minimum wavelength Display Scales Settings
irrands_DispWLMax=780 X-axis maximum wavelength Display Scales Settings
start_wv_irrands=350 Start WL for Irradiance Calibration (should match Lamp StartWL)
end_wv_irrands=780 End WL for Irradiance Calibration (should match Lamp EndWL)
interval_wv_irrands=10 Increments of WL interval from Start WL to End WL (should match Lamp IncWL)
Pixel ; Ratio ; Ratio Pixel number ; Ratio (Linearity Correction disabled) ; Ratio (Linearity Correction enabled)
272;5.88055754188743E5;4.87368884634631E-5
273;6.81553361643328E-5;5.60679388523222E-5
274;7.19969136787624E-5;5.9194063207757E-5
19 Shea Way, Newark, DE 19713 Tel: (302) 368-7824 Fax: (302) 368-7830 Web: www.bwtek.com 290020235-G (09/16/2015) Page 88 of 91 Copyright 2015 B&W Tek, Inc.
14 DEFINITION OF IRRADIANCE DATA FILE FORMAT Certified Standard Lamp data file example: Start WL=250 --------------------- starting wavelength (nm) End WL=2500 --------------------- ending wavelength (nm) Distance=50 --------------------- distance at which lamp data is generated units=mW/cm^2/nm --------------------- lamp data unit, choice of: W/cm^2/nm; mW/cm^2/nm; uW/cm^2/nm S-1169 --------------------- designation of the standard lamp (name, serial number …etc.) 5 --------------------- starting flag 250 --------------------- flag for starting wavelength (nm) 2500 --------------------- flag for ending wavelength (nm) 10 --------------------- increment of wavelength per data point 0.760E-05 --------------------- standard lamp irradiance data at wavelength = 250 nm (250+0*10) 1.788E-05 --------------------- standard lamp irradiance data at wavelength = 260nm (250+1*10) 3.156E-05 --------------------- standard lamp irradiance data at wavelength = 270nm (250+2*10) ….. ….. 3.795E-03 --------------------- standard lamp irradiance data at wavelength = 2500nm (250+225*10) 5 --------------------- ending flag

19 Shea Way, Newark, DE 19713 Tel: (302) 368-7824 Fax: (302) 368-7830 Web: www.bwtek.com 290020235-G (09/16/2015) Page 89 of 91 Copyright 2015 B&W Tek, Inc.
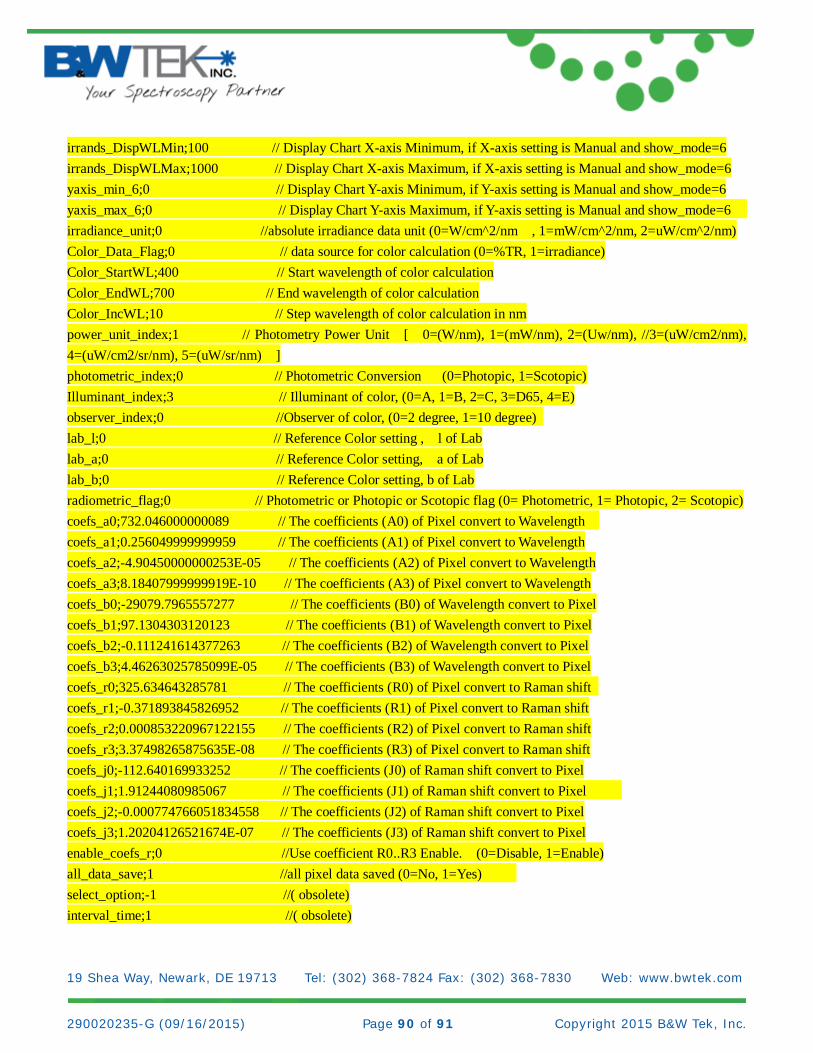
Appendix A: Declaration of Text File The text file has two block areas: flag block and data block. The flag block contains acquisition parameters and settings. The data block contains the acquired spectra data. The flag block length may vary and an example of text file (flag block highlighted by yellow) is shown below. To read all data, user should
1. Find line “Pixel; Wavelength; Wavenumber; Raman Shift; Dark; Reference; Raw data #1;Dark Subtracted #1;%TR #1;Absorbance #1;Irradiance (lumen) #1”;
2. Read from next line , it is the data of pixel 0 3. Continue to read the next [pixelnumber-1] line
File Version;BWSpec4.03_20_C //BWSpec4 version that saved file Date;2015-07-16 19:56:56 //saved file date title;BRC112 //spectrometer title name that saved data model;BRC112 //spectrometer model c code;ABC //spectrometer c code operator; //operator that saved file port1;0 //port number if spectrometer is RS232 interface (obsolete ) baud1;3 //baudrate index if spectrometer is RS232 interface (obsolete) pixel_start;0 //start pixel pixel_end;2047 //end pixel step;1 //the data index step units;0 // Spectrometer x-axis unit (0=Pixel, 1=wavelength, 2=wavenumber, 3=Raman shift ) bkcolor;16777215 //Display Chart background color RGB value show_mode;0 //Spectrometer display option 0=RawData,1=Dark,2=Reference,3=Dark Subtracted, 4=%TR, 5=Absorbance,6=Absolute Irradiance) data_mode;0 // Transmit data mode, 0=Binary data mode, 1=ASCII data mode (obsolete) pixel_mode;0 // Display Chart Mode .0=normal, 1=Pixel Monitoring (obsolete) intigration times(ms);1 //Spectrometer integration time of saved data average number;1 //Spectrometer average number of saved data time_multiply;1 // Integration time multiplier spectrometer_type ;17 // Spectrometer model id number yaxis;1 // Display Chart Y-axis Setting (0=Auto, 1=Manual) yaxis_min;0 // Display Chart Y-axis Minimum, if Y-axis setting is Manual yaxis_max;65535 // Display Chart Y-axis Maximum, if Y-axis setting is Manual xaxis;1 // Display Chart X-axis Setting (0=Auto, 1=Manual) xaxis_min;71 //Display Chart X-axis Minimum, if X-axis setting is Manual xaxis_max;1949 // Display Chart X-axis Maximum, if X-axis setting is Manual
19 Shea Way, Newark, DE 19713 Tel: (302) 368-7824 Fax: (302) 368-7830 Web: www.bwtek.com 290020235-G (09/16/2015) Page 90 of 91 Copyright 2015 B&W Tek, Inc.
irrands_DispWLMin;100 // Display Chart X-axis Minimum, if X-axis setting is Manual and show_mode=6 irrands_DispWLMax;1000 // Display Chart X-axis Maximum, if X-axis setting is Manual and show_mode=6 yaxis_min_6;0 // Display Chart Y-axis Minimum, if Y-axis setting is Manual and show_mode=6 yaxis_max_6;0 // Display Chart Y-axis Maximum, if Y-axis setting is Manual and show_mode=6 irradiance_unit;0 //absolute irradiance data unit (0=W/cm^2/nm , 1=mW/cm^2/nm, 2=uW/cm^2/nm) Color_Data_Flag;0 // data source for color calculation (0=%TR, 1=irradiance) Color_StartWL;400 // Start wavelength of color calculation Color_EndWL;700 // End wavelength of color calculation Color_IncWL;10 // Step wavelength of color calculation in nm power_unit_index;1 // Photometry Power Unit [ 0=(W/nm), 1=(mW/nm), 2=(Uw/nm), //3=(uW/cm2/nm), 4=(uW/cm2/sr/nm), 5=(uW/sr/nm) ] photometric_index;0 // Photometric Conversion (0=Photopic, 1=Scotopic) Illuminant_index;3 // Illuminant of color, (0=A, 1=B, 2=C, 3=D65, 4=E) observer_index;0 //Observer of color, (0=2 degree, 1=10 degree) lab_l;0 // Reference Color setting , l of Lab lab_a;0 // Reference Color setting, a of Lab lab_b;0 // Reference Color setting, b of Lab radiometric_flag;0 // Photometric or Photopic or Scotopic flag (0= Photometric, 1= Photopic, 2= Scotopic) coefs_a0;732.046000000089 // The coefficients (A0) of Pixel convert to Wavelength coefs_a1;0.256049999999959 // The coefficients (A1) of Pixel convert to Wavelength coefs_a2;-4.90450000000253E-05 // The coefficients (A2) of Pixel convert to Wavelength coefs_a3;8.18407999999919E-10 // The coefficients (A3) of Pixel convert to Wavelength coefs_b0;-29079.7965557277 // The coefficients (B0) of Wavelength convert to Pixel coefs_b1;97.1304303120123 // The coefficients (B1) of Wavelength convert to Pixel coefs_b2;-0.111241614377263 // The coefficients (B2) of Wavelength convert to Pixel coefs_b3;4.46263025785099E-05 // The coefficients (B3) of Wavelength convert to Pixel coefs_r0;325.634643285781 // The coefficients (R0) of Pixel convert to Raman shift coefs_r1;-0.371893845826952 // The coefficients (R1) of Pixel convert to Raman shift coefs_r2;0.000853220967122155 // The coefficients (R2) of Pixel convert to Raman shift coefs_r3;3.37498265875635E-08 // The coefficients (R3) of Pixel convert to Raman shift coefs_j0;-112.640169933252 // The coefficients (J0) of Raman shift convert to Pixel coefs_j1;1.91244080985067 // The coefficients (J1) of Raman shift convert to Pixel coefs_j2;-0.000774766051834558 // The coefficients (J2) of Raman shift convert to Pixel coefs_j3;1.20204126521674E-07 // The coefficients (J3) of Raman shift convert to Pixel enable_coefs_r;0 //Use coefficient R0..R3 Enable. (0=Disable, 1=Enable) all_data_save;1 //all pixel data saved (0=No, 1=Yes) select_option;-1 //( obsolete) interval_time;1 //( obsolete)
19 Shea Way, Newark, DE 19713 Tel: (302) 368-7824 Fax: (302) 368-7830 Web: www.bwtek.com 290020235-G (09/16/2015) Page 91 of 91 Copyright 2015 B&W Tek, Inc.
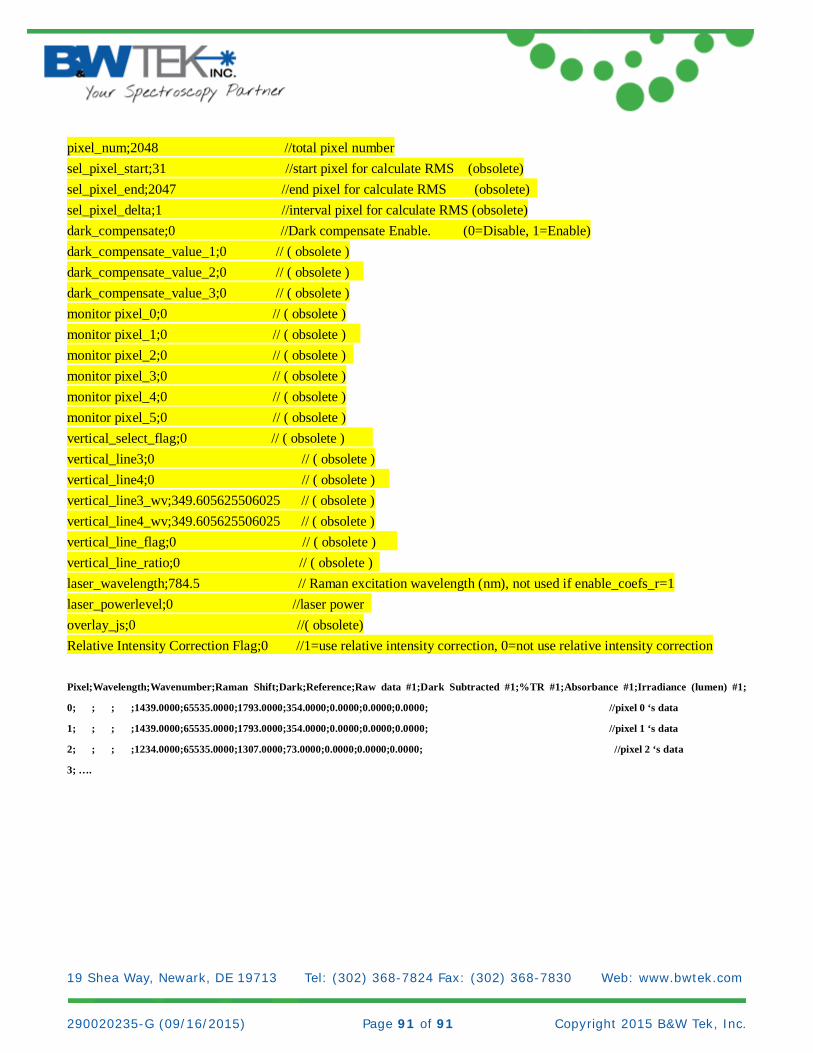
pixel_num;2048 //total pixel number sel_pixel_start;31 //start pixel for calculate RMS (obsolete) sel_pixel_end;2047 //end pixel for calculate RMS (obsolete) sel_pixel_delta;1 //interval pixel for calculate RMS (obsolete) dark_compensate;0 //Dark compensate Enable. (0=Disable, 1=Enable) dark_compensate_value_1;0 // ( obsolete ) dark_compensate_value_2;0 // ( obsolete ) dark_compensate_value_3;0 // ( obsolete ) monitor pixel_0;0 // ( obsolete ) monitor pixel_1;0 // ( obsolete ) monitor pixel_2;0 // ( obsolete ) monitor pixel_3;0 // ( obsolete ) monitor pixel_4;0 // ( obsolete ) monitor pixel_5;0 // ( obsolete ) vertical_select_flag;0 // ( obsolete ) vertical_line3;0 // ( obsolete ) vertical_line4;0 // ( obsolete ) vertical_line3_wv;349.605625506025 // ( obsolete ) vertical_line4_wv;349.605625506025 // ( obsolete ) vertical_line_flag;0 // ( obsolete ) vertical_line_ratio;0 // ( obsolete ) laser_wavelength;784.5 // Raman excitation wavelength (nm), not used if enable_coefs_r=1 laser_powerlevel;0 //laser power overlay_js;0 //( obsolete) Relative Intensity Correction Flag;0 //1=use relative intensity correction, 0=not use relative intensity correction Pixel;Wavelength;Wavenumber;Raman Shift;Dark;Reference;Raw data #1;Dark Subtracted #1;%TR #1;Absorbance #1;Irradiance (lumen) #1; 0; ; ; ;1439.0000;65535.0000;1793.0000;354.0000;0.0000;0.0000;0.0000; //pixel 0 ‘s data
1; ; ; ;1439.0000;65535.0000;1793.0000;354.0000;0.0000;0.0000;0.0000; //pixel 1 ‘s data
2; ; ; ;1234.0000;65535.0000;1307.0000;73.0000;0.0000;0.0000;0.0000; //pixel 2 ‘s data
3; ….


![Hard Disk Sentinel - Acronis · 2/27/2020 · Physical Disk Information - Disk: #0: Corsair Force GS Hard Disk Summary Hard Disk Number : 0 Interface : Intel RAID #0/0 [11/0 (0)]](https://img.pdfslide.us/doc/110x75/5fd4e819b229fa4ab0119a4e/hard-disk-sentinel-acronis-2272020-physical-disk-information-disk-0.jpg)