Embed Size (px)
Citation preview
General rights Copyright and moral rights for the publications made accessible in the public portal are retained by the authors and/or other copyright owners and it is a condition of accessing publications that users recognise and abide by the legal requirements associated with these rights.
• Users may download and print one copy of any publication from the public portal for the purpose of private study or research. • You may not further distribute the material or use it for any profit-making activity or commercial gain • You may freely distribute the URL identifying the publication in the public portal
If you believe that this document breaches copyright please contact us providing details, and we will remove access to the work immediately and investigate your claim.
Downloaded from orbit.dtu.dk on: Sep 09, 2018
Nanoporous Polymers for Membrane Applications
Li, Li; Ndoni, Sokol; Jonsson, Gunnar Eigil; Vigild, Martin Etchells
Publication date:2012
Document VersionPublisher's PDF, also known as Version of record
Link back to DTU Orbit
Citation (APA):Li, L., Ndoni, S., Jonsson, G. E., & Vigild, M. E. (2012). Nanoporous Polymers for Membrane Applications.Kgs.Lyngby: Technical University of Denmark, Department of Chemical Engineering.
Li LiPh.D. ThesisJanuary 2012
Nanoporous Polymers for Membrane Applications

Nanoporous Polymers for Membrane Applications
Li Li
Ph.D. Thesis
Department of Chemical and Biochemical Engineering Technical University of Denmark
Jan 2012
1
Copyright©: Li Li
April 2011
Address: The Danish Polymer Centre
Department of Chemical and Biochemical Engineering
Technical University of Denmark
Sølvtofts Plads
DK-2800 Kgs. Lyngby
Denmark
Phone: +45 4525 2800
Web: www.dpc.kt.dtu.dk
Print: J&R Frydenberg A/S
København
January 2012
ISBN: 978-87-92481-61-0
2
i
Acknowledgements
This thesis is the result of my Ph.D. project carried out at the Danish Polymer Center (DPC)
in Department of Chemical and Biochemical Engineering at the Technical University of
Denmark (DTU) from 2009 to 2011. The overall project was co-financed by DTU,
Radiometer Medical ApS, and Danish government. The work conducted at Radiometer
Medical ApS in 2008 is not included in this thesis due to confidential agreement.
First, I thank to my supervisors, Senior Scientist Sokol Ndoni, Associate Professor Gunnar
E. Jonsson and Professor Martin E. Vigild from DTU, along with Lydia D. Clausen and
Kristian M. Hansen from Radiometer Medical Aps. I thank Martin for giving me an
opportunity to work on this interesting project. I thank Gunnar for taking over the position as
my main supervisor from 2009 to 2011. Thank for your guidance and suggestions to my
research. I thank Lydia and Kristian for your great help and support on my study. Most
importantly, I appreciate Sokol for your endless patience and massive encouragement and
help to me all the way. Thanks for your guidance and suggestions to my work, your
availability for discussing results and answering my questions, and your help with
manuscripts preparation.
I thank Lars Schulte who synthesized all the polymers used to fabricate the membranes in
this thesis work. Lars also gave me help in SEM measurements. I thank Thomas W. Hansen
for TEM measurements at the Center for Electron Nanoscopy (CEN) at DTU, Lene Hubert
for XPS measurements at Risø, Lotte Nielsen for SEC measurements at Risø and the KT-
workshop at DTU for building up the stainless steel filtration cell and the pneumatic-drive
compressing set-up. I thank Liang Yang from Department of Systems Biology at DTU for a
happy collaboration in anti-biofilm research at the end of my Ph.D. project.
I thank Piotr P. Szewczykowski, Fengxiao Guo, Kaushal S. Sagar, Anton Berthold and
other former and current members of the Nanoporous Group for your helpful discussions and
advices in the project and bringing me a lot of fun in group social activities. I particularly
thank to Kaushal and Anton for your encouragement as things did not always go in the
direction as expected.
3

ii
I also thank DPC which provides me a nice lab platform. Thanks to Professor Ole Hassager
for accepting me at DPC as a master student 5 years ago. Thanks to Associate Professor for
your concern and help in my study and daily life. Thanks to the lab coordinator Kim C. Szabo
for your help in lab work. Thanks to the administrative coordinator Vibeke H. Christiansen
for your help in daily work. Thanks to my officemate Yanwei Wang for inspiring discussions
and useful suggestions. Thanks to other colleagues at DPC for many good experiences in the
past 3 years, like cake club, pizza seminar, beer club, Christmas lunch, summer dinner, and
annual polymer day. Anca, I will miss your lovely smile and constant enthusiasm. Mads and
Sarah Maria, I enjoyed a lot talking with you.
I sincerely thank my family and friends who gave me your hands whenever I needed.
Without your assistance, it would not be possible for me to achieve what I have today.
Lastly, I would like to thank everybody who has ever impressed, inspired, taught,
influenced and helped me along the way. I feel sorry that I could not mention all the names
within the limit space, but I will remember you in my life.
Kgs. Lyngby, 23th April 2011
Li Li
4
iii
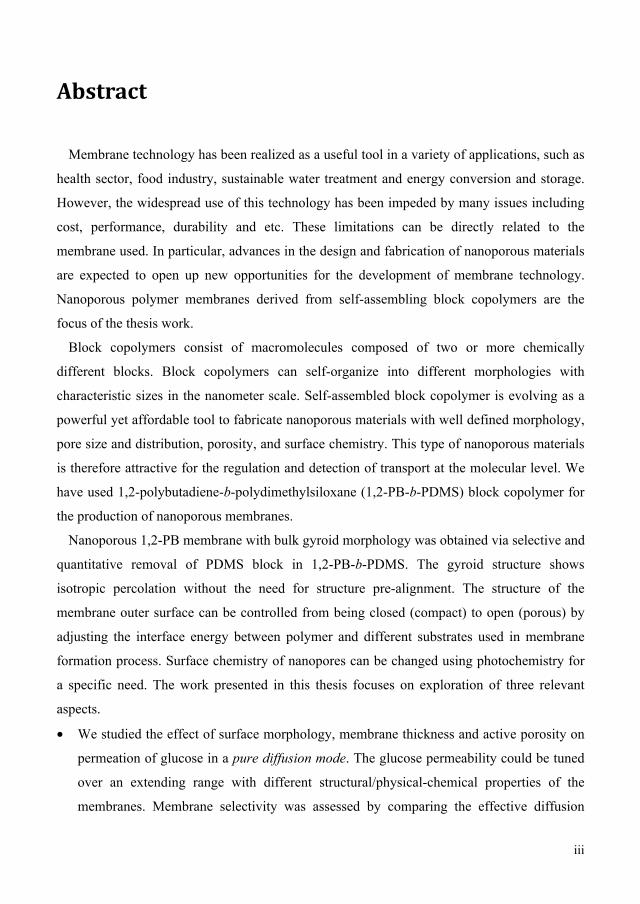
Abstract
Membrane technology has been realized as a useful tool in a variety of applications, such as
health sector, food industry, sustainable water treatment and energy conversion and storage.
However, the widespread use of this technology has been impeded by many issues including
cost, performance, durability and etc. These limitations can be directly related to the
membrane used. In particular, advances in the design and fabrication of nanoporous materials
are expected to open up new opportunities for the development of membrane technology.
Nanoporous polymer membranes derived from self-assembling block copolymers are the
focus of the thesis work.
Block copolymers consist of macromolecules composed of two or more chemically
different blocks. Block copolymers can self-organize into different morphologies with
characteristic sizes in the nanometer scale. Self-assembled block copolymer is evolving as a
powerful yet affordable tool to fabricate nanoporous materials with well defined morphology,
pore size and distribution, porosity, and surface chemistry. This type of nanoporous materials
is therefore attractive for the regulation and detection of transport at the molecular level. We
have used 1,2-polybutadiene-b-polydimethylsiloxane (1,2-PB-b-PDMS) block copolymer for
the production of nanoporous membranes.
Nanoporous 1,2-PB membrane with bulk gyroid morphology was obtained via selective and
quantitative removal of PDMS block in 1,2-PB-b-PDMS. The gyroid structure shows
isotropic percolation without the need for structure pre-alignment. The structure of the
membrane outer surface can be controlled from being closed (compact) to open (porous) by
adjusting the interface energy between polymer and different substrates used in membrane
formation process. Surface chemistry of nanopores can be changed using photochemistry for
a specific need. The work presented in this thesis focuses on exploration of three relevant
aspects.
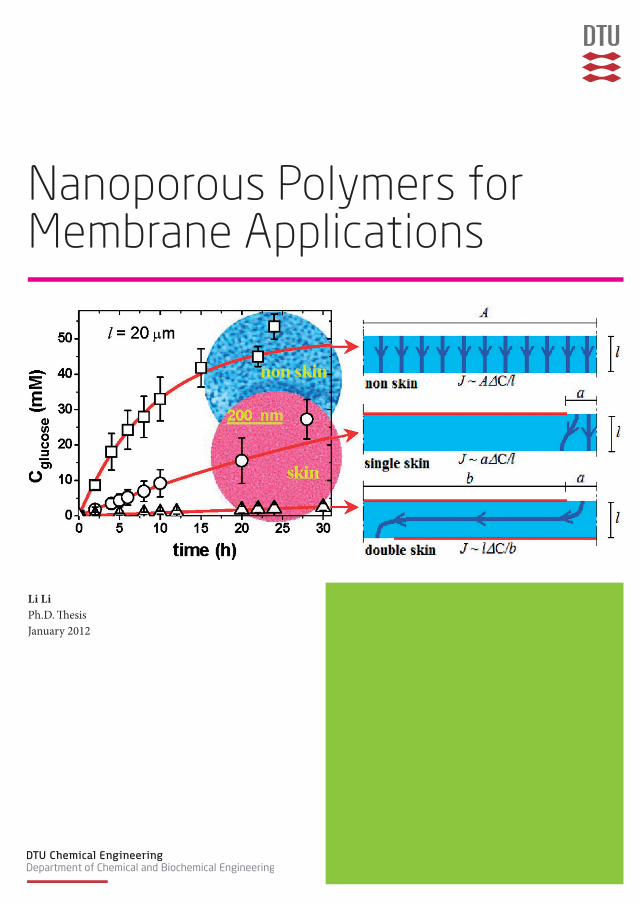
• We studied the effect of surface morphology, membrane thickness and active porosity on
permeation of glucose in a pure diffusion mode. The glucose permeability could be tuned
over an extending range with different structural/physical-chemical properties of the
membranes. Membrane selectivity was assessed by comparing the effective diffusion
5
iv
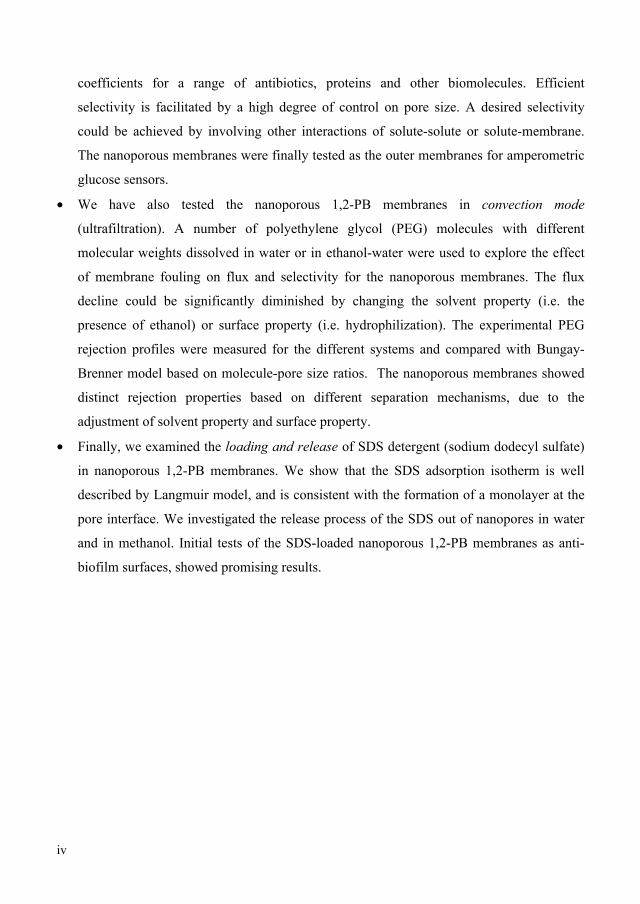
coefficients for a range of antibiotics, proteins and other biomolecules. Efficient
selectivity is facilitated by a high degree of control on pore size. A desired selectivity
could be achieved by involving other interactions of solute-solute or solute-membrane.
The nanoporous membranes were finally tested as the outer membranes for amperometric
glucose sensors.
• We have also tested the nanoporous 1,2-PB membranes in convection mode
(ultrafiltration). A number of polyethylene glycol (PEG) molecules with different
molecular weights dissolved in water or in ethanol-water were used to explore the effect
of membrane fouling on flux and selectivity for the nanoporous membranes. The flux
decline could be significantly diminished by changing the solvent property (i.e. the
presence of ethanol) or surface property (i.e. hydrophilization). The experimental PEG
rejection profiles were measured for the different systems and compared with Bungay-
Brenner model based on molecule-pore size ratios. The nanoporous membranes showed
distinct rejection properties based on different separation mechanisms, due to the
adjustment of solvent property and surface property.
• Finally, we examined the loading and release of SDS detergent (sodium dodecyl sulfate)
in nanoporous 1,2-PB membranes. We show that the SDS adsorption isotherm is well
described by Langmuir model, and is consistent with the formation of a monolayer at the
pore interface. We investigated the release process of the SDS out of nanopores in water
and in methanol. Initial tests of the SDS-loaded nanoporous 1,2-PB membranes as anti-
biofilm surfaces, showed promising results.
6
v
Dansk resumé
Membranteknologi er et vigtigt redskab i en lang række anvendelser inden for
sundhedssektoren, fødevareindustrien, bæredygtig vandbehandling, energi konvertering og
lagring mm. På trods af den udbredte brug af teknologien, er der behov for øget forståelse og
forbedringer på en række centrale områder angående ydeevne, holdbarhed, omkostning mv.
Specifikke begrænsninger for en given membrantype kan direkte relateres til de anvendte
materialer og fremstillingsmetoder. Fremskridt i design og fremstilling af nanoporøse
materialer, og i særdeleshed af nanoporøse polymerer, forventes at åbne nye
udviklingsmuligheder indenfor membranteknologi. Nanoporøse polymermembraner
fremstillet af selvorganiserende blok copolymerer er i centrum for det arbejde, vi præsenterer
i denne afhandling.
Blok copolymerer består af makromolekyler sammensat af to eller flere kemisk forskellige
blokke. Blok copolymererne kan selvorganisere i forskellige morfologier med karakteristiske
størrelser i nanometer skalaen. Blok copolymerers selvorganisering er en kraftfuld og
overkommelig princip til fabrikationen af nanoporøse materialer med veldefineret morfologi,
porestørrelse og porestørrelses fordeling, porøsitet, og overflade kemi. Denne type af
nanoporøse materialer er derfor attraktiv for regulering og detektering af stoftransport på
molekylært niveau. Vi har brugt 1,2-polybutadien-b-polydimethylsiloxan (1,2-PB-b-PDMS)
som blok copolymer til fremstilling af nanoporøse membraner.
Nanoporøse 1,2-PB membraner med gyroid bulk morfologi blev fremstillet via selektiv og
kvantitativ ætsning af PDMS blokken i 1,2-PB-b-PDMS. Den gyroide struktur viser
isotropisk perkolation uden behov for struktur pre-alignment. Strukturen på membranens ydre
overflade kan styres fra at være lukket (kompakt) til åbnet (porøs) ved tilpasning af
grænsefladeenergien mellem polymer og forskellige anvendte substrater i
membrandannelsesprocessen. Overflade kemien i nanoporerne kan ændres vha. fotokemi til et
specifikt behov. Det præsenterede arbejde i afhandlingen fokuserer på udforskning af tre
relevante aspekter.
• Vi undersøgte effekten af overflademorfologi, membrantykkelse og aktiv porøsitet på
gennemsivning af glukose i en ren diffusions mode. Membranens selektivitet vurderes ved
7
vi
at sammenligne de effektive diffusionskoefficienter for en række antibiotika, proteiner og
andre biomolekyler. De nanoporøse membraner blev til sidst testet som ydre membraner
til amperometriske glukose sensorer.
• Vi har også testet de nanoporøse 1,2-PB membraner i konvektions mode (ultrafiltrering).
En række af PEG molekyler med forskellige molekylvægte opløst i vand eller i ethanol-
vand, blev brugt til at udforske effekten af fouling på membranens fluks og selektivitet.
Den eksperimentelle PEG størrelsesselektivitet målt for de forskellige systemer blev
sammen-lignet med Bungay-Brenner modellen baseret på molekyle-pore størrelses
forholdene.
• Endelig har vi undersøgt load-release af SDS sæbe (natriumdodecylsulfat) opløsninger i
nanoporøse 1,2-PB membraner. Vi viser at SDS adsorption isotermen er godt beskrevet af
Langmuir modellen, og stemmer overens med dannelsen af en monolag på pore
grænsefladen. Vi undersøgte frigivelsesprocessen af SDS ud af nanoporerne i vand og i
methanol. Indledende tests af SDS-loaded nanoporøse 1,2-PB membraner som anti-
biofilm overflader, viste lovende resultater.
8
vii
Table of Contents
Acknowledgements ................................................................................................................................... i Abstract .................................................................................................................................................... iii Dansk resumé ........................................................................................................................................... v
Table of Contents .................................................................................................................................... vii Chapter 1 Scope and Outline .................................................................................................................. 1
Chapter 2 Introduction ............................................................................................................................ 3
2.1. Nanoporous polymers ............................................................................................................... 4
2.2. Introduction to membrane process ......................................................................................... 10
2.3. Membranes for biosensors ...................................................................................................... 14
2.4. Membranes for ultrafiltration ................................................................................................. 18
2.5. Membranes for controlled release .......................................................................................... 22
2.6. References .............................................................................................................................. 25
Chapter 3 Preparation of Nanoporous 1,2-PB Membranes .................................................................. 31
3.1. Block copolymers ................................................................................................................... 32
3.2. Membrane preparation and fabrication .................................................................................. 33
3.3. Surface modification .............................................................................................................. 35
3.4. Summary ................................................................................................................................. 36
3.5. References .............................................................................................................................. 37
Chapter 4 Structural Characteristics of Nanoporous 1,2-PB Membranes ........................................... 39
4.1. Experimental ........................................................................................................................... 39
4.2. Results and discussion ............................................................................................................ 40
4.2.1. Bulk morphology ................................................................................................................. 40
4.2.2. Surface morphology ............................................................................................................. 43
4.3. Summary ................................................................................................................................. 49
4.4. References .............................................................................................................................. 50
Chapter 5 Gas Permeation and Liquid Flow across Nanoporous 1,2-PB Membranes ........................ 53
5.1. Background ............................................................................................................................. 53
5.1.1. Gas diffusion in nanoporous membranes ............................................................................ 53
5.1.2. Liquid flow in nanoporous membranes ............................................................................... 55
5.2. Experimental ........................................................................................................................... 56
5.2.1. Gas permeation .................................................................................................................... 56
5.2.2. Hydraulic permeability ........................................................................................................ 57
5.3. Results and discussion ............................................................................................................ 58
5.3.1. Gas permeation .................................................................................................................... 58
9
viii
5.3.2. Liquid flow .......................................................................................................................... 59
5.4. Conclusions ............................................................................................................................ 62
5.5. References and notes .............................................................................................................. 63
Chapter 6 Dialysis Performance of Nanoporous 1,2-PB Membranes .................................................. 65
6.1. Background ............................................................................................................................. 66
6.1.1. Outer membranes for amperometric glucose sensors .......................................................... 66
6.1.2. Diffusive solute transport in pores ...................................................................................... 70
6.2. Experimental ........................................................................................................................... 73
6.2.1. Diffusion tests ...................................................................................................................... 74
6.2.2. Sensor tests .......................................................................................................................... 77
6.3. Results and discussion ............................................................................................................ 80
6.3.1. Diffusive permeability of glucose across nanoporous 1,2-PB membranes ........................ 80
6.3.2. Selectivity of nanoporous 1,2-PB membranes in dialysis ................................................... 84
6.3.3. Sensor tests of nanoporous 1,2-PB membranes as outer membranes ................................. 88
6.4. Conclusions ............................................................................................................................ 93
6.5. References .............................................................................................................................. 95
Chapter 7 Ultrafiltration Performance of Nanoporous 1,2-PB Membranes ....................................... 97
7.1. Background ............................................................................................................................. 98
7.1.1. Flux model ........................................................................................................................... 98
7.1.2. Transport model ................................................................................................................... 99
7.1.3. Concentration polarization and fouling ............................................................................. 101
7.2. Experimental ......................................................................................................................... 103
7.2.1. Static adsorption of PEG ................................................................................................... 103
7.2.2. Ultrafiltration of PEGs ....................................................................................................... 104
7.3. Results and discussion .......................................................................................................... 106
7.3.1. Membrane fouling under static and dynamic conditions .................................................. 106
7.3.2. Ultrafiltration of single PEGs filtrate flux ...................................................................... 113
7.3.3. Ultrafiltration of single PEGs rejection profiles ............................................................ 113
7.3.4. Ultrafiltration of single PEGs sieving vs. flux rates ...................................................... 116
7.3.5. Ultrafiltration of mixture PEGs ......................................................................................... 117
7.4. Conclusions .......................................................................................................................... 118
7.5. References ............................................................................................................................ 119
Chapter 8 SDS Loading and Release in Nanoporous 1,2-PB Membranes ........................................ 121
8.1. Background ........................................................................................................................... 122
8.1.1. Capillary filling .................................................................................................................. 122
8.1.2. Surfactants ......................................................................................................................... 123
10
ix
8.1.3. Biofilm ............................................................................................................................... 123
8.2. Experimental ......................................................................................................................... 124
8.2.1. SDS loading and release in nanoporous 1,2-PB membranes ............................................ 125
8.2.2. Anti-biofilm demonstrations by SDS-infilled nanoporous 1,2-PB membranes ............... 126
8.3. Results and discussion .......................................................................................................... 127
8.3.1. Polymer films ..................................................................................................................... 127
8.3.2. Loading of SDS aqueous solution: kinetics ....................................................................... 129
8.3.3. Loading of SDS aqueous solution: equilibrium ................................................................ 134
8.3.4. SDS adsorption isotherm ................................................................................................... 137
8.3.5. Stability of SDS physisorption in nanoporous 1,2-PB membranes .................................. 138
8.3.6. SDS release from nanoporous 1,2-PB membranes in water and methanol ..................... 140
8.3.7. Anti-biofilm demonstrations .............................................................................................. 142
8.4. Conclusions .......................................................................................................................... 145
8.5. References and notes ............................................................................................................ 147
Chapter 9 Summary and Suggestions for Future Work ..................................................................... 151
References ........................................................................................................................................ 155
Appendix A Fabrication Methods ...................................................................................................... 158
Appendix B Etching Process .............................................................................................................. 164
Appendix C DSC Results ................................................................................................................... 169
Appendix D Diffusion of PEGs across Nanoporous 1,2-PB Membranes ......................................... 173
References ............................................................................................................................................. 174
List of Abbreviations ............................................................................................................................ 175
List of Symbols ..................................................................................................................................... 177
11

x
12

Chapter 1 Scope and Outline
1
Chapter 1 Scope and Outline
The aim of this thesis has been to explore the potential of block copolymer templated
nanoporous polymers in membrane applications. A large amount of fundamental research from
literature has been undertaken to study block polymers in the aspects of production,
characterization, modification and property enhancement. Block copolymers have proven
particularly advantageous for templating porous membranes. With nanoscale pores, high
porosity, narrow pore size distributions, and tunable chemical and mechanical properties, the
block copolymer derived nanoporous polymers hold tremendous potential as robust, efficient,
and highly selective separation membranes. We have been thus motivated to systematically
investigate membrane property and performance of these materials for different applications.
In this project, 1,2-polybutadiene-b-polydimethylsiloxane (1,2-PB-b-PDMS) has been selected
to fabricate nanoporous 1,2-PB membranes since 1,2-PB-b-PDMS copolymer and its derived
nanostructure have been well-developed and comprehensively characterized in the previous work
by our group (Self-organized Nanoporous Materials group, DTU-Nanotech). The proposed
membranes have been designed to hold the gyroid structure with bicontinuous nanoporosity
across the entire membrane thickness without need of pre-alignment. Along with precise control
over the bulk structure, the surface morphology and chemistry were intended to show diverse to
match specific demands in different membrane applications. Membrane behaviors of the
nanoporous 1,2-PB membranes have been investigated by evaluating permeability and selectivity
in both diffusive mode and convective mode. The purpose is to understand the correlation of
structural/ physical-chemical properties and functional properties of the membranes. Interests
have been focused on the potential use as a permselective dialysis membrane for amperometric
glucose biosensors and as an efficient ultrafilter. In addition, the nanoporous 1,2-PB membrane
has been pursued as a sustained release membrane, thus research in adsorption isotherm, loading
and release equilibrium and kinetics have been studied. A demonstration of anti-biofilm surface
has been presented.
The thesis gives a general background in Chapter 2. It contains a short introduction to
nanoporous polymers and membrane process and brief descriptions of membrane applications in
biosensors, ultrafiltration, and control-release. Chapter 3 presents a detailed description of the
13

Chapter 1 Scope and Outline
2
preparation of nanoporous 1,2-PB membranes and the surface modifications used in this study.
Structural characteristics, particularly surface morphology of the prepared membranes have been
in detail clarified in Chapter 4. Hydraulic permeability and gas permeation as basic
characteristics in membrane property are first presented in Chapter 5. Chapter 6 focuses on the
diffusive transport property of nanoporous 1,2-PB as a dialysis membrane. Following a series of
fundamental characterizations of transport properties, the nanoporous membrane was taken as an
outer membrane and tested in amperometric glucose sensors. In Chapter 7, a series of PEG
molecules with varying molecular weights were used to explore the effects of membrane fouling
on flux and rejection profiles for the nanoporous 1,2-PB membranes. Chapter 8 describes the
loading and release of SDS into/from the nanoporous 1,2-PB membranes. The SDS-loaded
nanoporous 1,2-PB membranes were preliminarily tested as anti-biofilm surface to show the
potential as a drug-release carrier. Finally, Chapter 9 summarizes the thesis work and gives some
suggestions for future work. The Appendices covers four topics, i.e. fabrication methods, etching
process, DSC results and PEG diffusion tests.
The overall thesis is based on the publications and the submitted manuscripts listed below:
1) Li, L.; Wang, Y.W.; Vigild, M. E. Ndoni, S. Physisorption of SDS in a Hydrocarbon
Nanoporous Polymer. Langmuir 2010, 26 (16), 13457–13465.
2) Li, L.; Schulte, L.; Clausen, L. D.; Hansen, K. M.; Jonsson, G. E.; Ndoni, S. Gyroid Nanoporous Membranes with Tunable Permeability. ACS Nano 2011, 5 (10), 7754 – 7766.
3) Li, L.; Szewczykowski, P.; Clausen, L. D.; Hansen, K. M.; Jonsson, G. E.; Ndoni, S. Ultrafiltration by Gyroid Nanoporous Polymer Membranes. Journal of Membrane Science 2011, 384, 126-135.
4) Li, L.; Yang, L.; Molin, S.; Ndoni, S. Sodium Dodecyl Sulfate (SDS)-Loaded Nanoporous
Polymer as Anti-Biofilm Surface Coating Material. Biofouling 2011 (Has been submitted and reviewed).
14
Chapter 2 Introduction
3
Chapter 2 Introduction
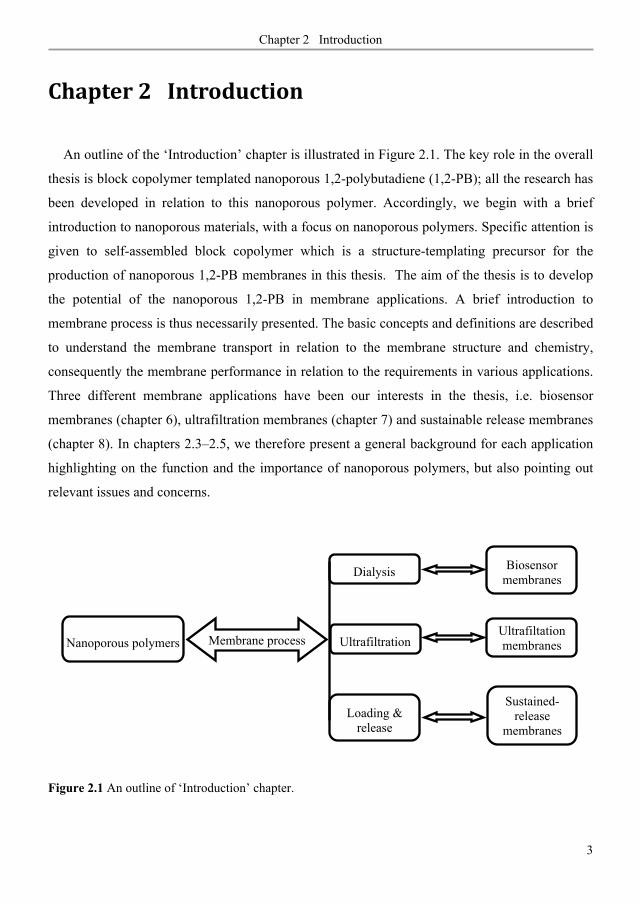
An outline of the ‘Introduction’ chapter is illustrated in Figure 2.1. The key role in the overall
thesis is block copolymer templated nanoporous 1,2-polybutadiene (1,2-PB); all the research has
been developed in relation to this nanoporous polymer. Accordingly, we begin with a brief
introduction to nanoporous materials, with a focus on nanoporous polymers. Specific attention is
given to self-assembled block copolymer which is a structure-templating precursor for the
production of nanoporous 1,2-PB membranes in this thesis. The aim of the thesis is to develop
the potential of the nanoporous 1,2-PB in membrane applications. A brief introduction to
membrane process is thus necessarily presented. The basic concepts and definitions are described
to understand the membrane transport in relation to the membrane structure and chemistry,
consequently the membrane performance in relation to the requirements in various applications.
Three different membrane applications have been our interests in the thesis, i.e. biosensor
membranes (chapter 6), ultrafiltration membranes (chapter 7) and sustainable release membranes
(chapter 8). In chapters 2.3–2.5, we therefore present a general background for each application
highlighting on the function and the importance of nanoporous polymers, but also pointing out
relevant issues and concerns.
Figure 2.1 An outline of ‘Introduction’ chapter.
Nanoporous polymers Membrane process
Dialysis
Ultrafiltration
Loading & release
Biosensor membranes
Ultrafiltation membranes
Sustained- release
membranes
15
Chapter 2 Introduction
4
2.1. Nanoporous polymers
In the past few decades, nanomaterials have received substantial attention and efforts from
academic and industrial world, due to the distinct properties at the nano-scale. Nanoporous
materials as a subset of nanomaterials possess a set of unique properties: large specific surface-
volume ratio, high interior surface area, exclusive size sieving and shape selectivity, nano-scale
space confinement, and specific gas/fluid permeability. Moreover, pore-filled nanoporous
materials can offer synergistic properties that can never be reached by pure compounds. As a
result, nanoporous materials are of scientific and technological importance and also considerable
interest in a broad range of applications that include templating, sorting, sensing, isolating and
releasing.
Nanoporous materials can be classified by pore geometry (size, shape, and order) or
distinguished by type of bulk materials. According to IUPAC, nanoporous materials can be
subdivided to microporous materials (< 2 nm), mesoporous materials (2–50 nm) and
macroporous (50–1000 nm).1, 2 In the literature, nanoporous materials are mainly referred to as
porous materials typically having pore diameter between 1 nm and 100 nm. 3, 4 Nanoporous
materials are considered uniform if the pore size distribution is relatively narrow and the pore
shape is relatively homogenous. The pores can be cylindrical, conical, slit-like, or irregular in
shape. They can be well ordered with an alignment as opposed to a random network of tortuous
pores. Nanoporous materials cover a wide variety of materials, which can be generally divided
into inorganic, organic and composite materials. The majority of investigated nanoporous
materials have been inorganic, including oxides, carbon, silicon, silicate, and metal.3-5 On the
other side, polymers have been identified as materials that offer low cost, less toxicity, easy
fabrication process, diverse chemical functionality, and extensive mechanical properties.
Naturally, the success of inorganic materials to form nanoporous materials has promoted the
development of analogous polymers. More importantly, advances in polymer synthesis and novel
processing techniques have led to various nanoporous polymers.
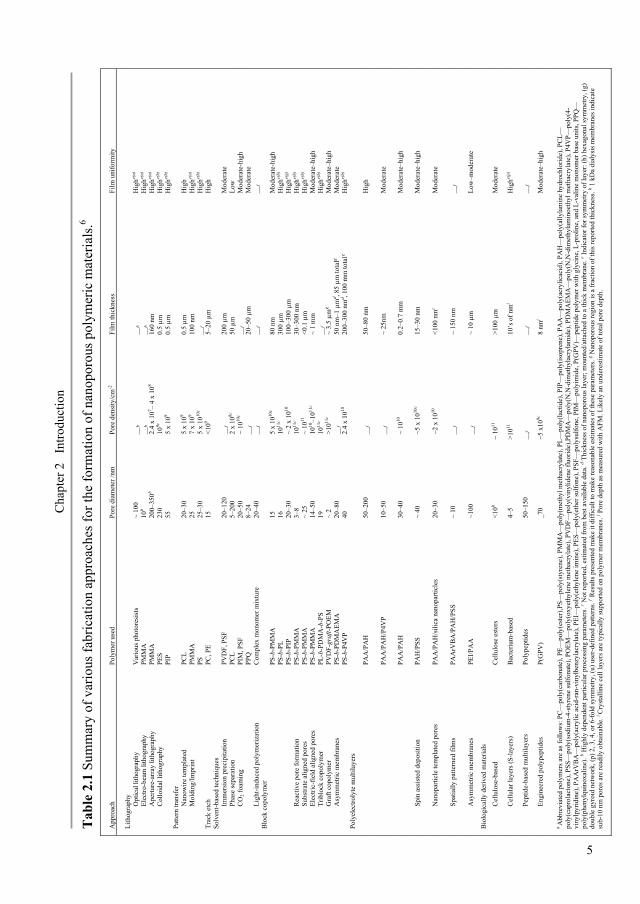
Table 2.1 reported in Ref 6 summarizes existing preparation approaches towards nanoporous
polymers along with their characteristic pore size and density, film thickness, and structural
uniformity.
16
C
hapt
er 2
In
trodu
ctio
n
5
Tab
le 2
.1 S
umm
ary
of v
ario
us fa
bric
atio
n ap
proa
ches
for t
he fo
rmat
ion
of n
anop
orou
s pol
ymer
ic m
ater
ials
.6 A
ppro
ach
Po
lym
er u
sed
Pore
dia
met
er /n
m
Pore
den
sity
/cm
-2
Film
thic
knes
s Fi
lm u
nifo
rmity
Lith
ogra
phy
Opt
ical
lith
ogra
phy
Var
ious
pho
tore
sist
s ~
100
__b
__b
Hig
he(u)
Elec
tro-b
eam
lith
ogra
phy
PMM
A
10b
__b
__b
Hig
he(u)
Ape
rture
-arr
ay li
thog
raph
y PM
MA
20
0–35
0b 2.
4 x
107 –
4 x
108
160
nm
Hig
he(u)
Col
loid
al li
thog
raph
y PE
S 23
0 10
9c
0.5 μm
H
ighe(
h)
PIP
55
5 x
109
0.5 μm
H
ighe(
h)
Pa
ttern
tran
sfer
Nan
owire
tem
plat
ed
PCL
20–3
0 5
x 10
9 0.
5 μm
H
igh
Mol
ding
/Impr
int
PMM
A
25
7 x
109
100
nm
Hig
he(u)
PS
25–3
0 5
x 10
10c
__f
Hig
he(h)
Trac
k et
ch
PC, P
E 15
<1
09 5–
20 μ
m
Hig
h
Solv
ent-b
ased
tech
niqu
es
Im
mer
sion
pre
cipi
tatio
n PV
DF,
PSF
20
–120
__
f 20
0 μm
M
oder
ate
Phas
e se
para
tion
PCL
5–20
0 2
x 10
8c
50 μ
m
Low
C
O2 f
oam
ing
PIM
, PSF
20
–50
~ 10
10c
__f
Mod
erat
e-hi
gh
PP
Q
8–24
__
f 20
–50 μm
M
oder
ate
Ligh
t-ind
uced
pol
ymer
izat
ion
Com
plex
mon
omer
mix
ture
20
–40
__f
__f
__f
B
lock
cop
olym
er
PS-b
-PM
MA
15
5
x 10
10c
80 n
m
Mod
erat
e-hi
gh
PS
-b-P
L 16
10
11c
300 μm
H
ighe(
h)
PS
-b-P
IP
20–3
0 ~
2 x
1010
10
0–30
0 μm
H
ighe(
g)
Rea
ctiv
e po
re fo
rmat
ion
PS-b
-PM
MA
3–
8 10
11c
30–3
00 n
m
Hig
he(h)
Su
bstra
te a
ligne
d po
res
PS-b
-PM
MA
~
25
~ 10
11
<0.1
μm
H
ighe(
h)
Elec
tric-
field
alig
ned
pore
s PS
-b-P
MM
A
14–5
0
1010
–1011
c ~
1 m
m
Mod
erat
e–hi
gh
Trib
lock
cop
olym
er
PL-b
-PD
MA
-b-P
S
19
1011
c __
f H
ighe(
h)
Gra
ft co
poly
mer
PV
DF-
graf
t-PO
EM
~ 2
>1
011c
~ 3.
5 μm
g M
oder
ate–
high
A
sym
met
ric m
embr
anes
PS
-b-P
DM
AEM
A
20–8
0
__f
50 n
m–1
μm
d , 85 μm
tota
lg M
oder
ate
PS
-b-P
4VP
40
2.
4 x
1010
20
0–30
0 nm
d , 100
mm
tota
lg H
ighe(
h)
Po
lyel
ectro
lyte
mul
tilay
ers
PAA
/PA
H
50–2
00
__f
50–8
0 nm
H
igh
PAA
/PA
H/P
4VP
10
–50
__
f ~
25nm
M
oder
ate
PAA
/PA
H
30–4
0
~ 10
10
0.2–
0.7
mm
M
oder
ate–
high
Sp
in a
ssis
ted
depo
sitio
n
PAH
/PSS
~
40
~5 x
1010
c 15
–30
nm
Mod
erat
e–hi
gh
N
anop
artic
le te
mpl
ated
por
es
PAA
/PA
H/s
ilica
nan
opar
ticle
s 20
–30
~2
x 1
010
<100
nm
c M
oder
ate
Sp
atia
lly p
atte
rned
film
s PA
ArV
BA
/PA
H/P
SS
~ 10
__
f ~
150
nm
__f
A
sym
met
ric m
embr
anes
PE
I/PA
A
~100
__
f ~
10 μ
m
Low
–mod
erat
e
Bio
logi
cally
der
ived
mat
eria
ls
C
ellu
lose
-bas
ed
Cel
lulo
se e
ster
s <1
0h ~
1011
>1
00 μ
m
Mod
erat
e
C
ellu
lar l
ayer
s (S-
laye
rs)
Bac
teriu
m-b
ased
4–
5
>1011
10
’s o
f nm
i H
ighe(
p)
Pe
ptid
e-ba
sed
mul
tilay
ers
Poly
pept
ides
50
–150
__
f __
f __
f
En
gine
ered
pol
ypep
tides
P(
GPV
) _7
0
~5 x
109c
8
nmj
Mod
erat
e–hi
gh
a A
bbre
viat
ed p
olym
ers a
re a
s fol
low
s: P
C—
poly
(car
bona
te),
PE—
poly
(est
er),P
S—po
ly(s
tyre
ne),
PMM
A—
poly
(met
hyl m
etha
cryl
ate)
, PL—
poly
(lact
ide)
, PIP
—po
ly(is
opre
ne),
PAA
—po
ly(a
cryl
icac
id),
PAH
—po
ly(a
llyla
min
e hy
droc
hlor
ide)
, PC
L—po
ly(c
apro
lact
one)
, PSS
—po
ly(s
odiu
m-4
-sty
rene
sulfo
nate
), PO
EM—
poly
(oxy
ethy
lene
met
hacr
ylat
e), P
VD
F—po
ly(v
inyl
iden
e flu
orid
e),P
DM
A—
poly
(N,N
-dim
ethy
lacr
ylam
ide)
, PD
MA
EMA
—po
ly(N
,N-d
imet
hyla
min
oeth
yl m
etha
cryl
ate)
, P4V
P—po
ly(4
-vi
nylp
yrid
ine)
, PA
ArV
BA
—po
ly(a
cryl
ic a
cid-
ran-
viny
lben
zyla
cryl
ate)
, PEI
—po
ly(e
thyl
ene
imin
e), P
ES—
poly
(eth
er su
lfone
), PS
F—po
lysu
lfone
, PIM
—po
lyim
ide,
P(G
PV)—
pept
ide
poly
mer
with
gly
cine
, L-p
rolin
e, a
nd L
-val
ine
mon
omer
bas
e un
its, P
PQ—
poly
(phe
nylq
uino
xalin
e). b H
ighl
y de
pend
ent p
artic
ular
pro
cess
ing
para
met
ers.
c Not
repo
rted,
est
imat
ed fr
om b
est a
vaila
ble
data
. d Thi
ckne
ss o
f nan
opor
ous l
ayer
; mou
nted
/atta
ched
to a
thic
k m
embr
ane.
e Indi
cato
r for
sym
met
ry o
f lay
er: (
h) h
exag
onal
sym
met
ry, (
g)
doub
le g
yroi
d ne
twor
k, (p
) 2, 3
, 4, o
r 6-f
old
sym
met
ry, (
u) u
ser-
defin
ed p
atte
rns.
f R
esul
ts p
rese
nted
mak
e it
diff
icul
t to
mak
e re
ason
able
est
imat
es o
f the
se p
aram
eter
s. g N
anop
orou
s reg
ion
is a
frac
tion
of th
is re
porte
d th
ickn
ess.
h 1 k
Da
dial
ysis
mem
bran
es in
dica
te
sub-
10 n
m p
ores
are
read
ily o
btai
nabl
e. i C
ryst
allin
e ce
ll la
yers
are
typi
cally
supp
orte
d on
pol
ymer
mem
bran
es. j P
ore
dept
h as
mea
sure
d w
ith A
FM. L
ikel
y an
und
eres
timat
e of
tota
l por
e de
pth.
17
Chapter 2 Introduction
6
The techniques listed in Table 2.1 include lithography, pattern-transfer, track etching, solvent-
based formation, layer-by-layer growth, block copolymer self-assembly, and various biologically
derived materials. These techniques can be generally divided into two approaches: ‘bottom-up’
approach and ‘top-down’ approach. 7, 8
‘Top-down’ approaches
Lithographic and pattern-transfer approaches9, 10 utilize pre-defined patterns that are
transferred into a polymer film, e.g. photoresist coating or template structure. The primary
advantage of lithographic techniques is the ability to produce user-defined patterns. Optical
lithography is the most widely used lithographic technique. Direct use of lithographic techniques
requires a photo-cross-linkable or photodegradable polymer, which restricts potential materials
selection.
Track etch technique can produce nanoporous membranes by irradiating polymers with high
energy particles.11 Porous structures can be generated by etching the linear paths of travel
associated with incident particles within the polymer film. Since each pore is the result of a
spatially random incident particle, agglomeration of pores limits maximum pore density in order
to maintain a low dispersion in pore size. It is a useful approach for some commercial
membranes.
‘Bottom-up’ approaches
Various solvent-based procedures take advantage of natural formation of nanostructured
polymers via precipitation.12, 13 The most prevalent are solvent-based precipitation techniques,
which exploit solubility variations of a target polymer, depending on concentration, solvent, or
process conditions. When initially dissolved in a good solvent, nanostructures can be induced
from a polymer solution by solvent evaporation, cooling, or exposure to non-solvents (often
water). Control of pore size and distribution is a challenge with this technique, but the ease and
simplicity of this approach make it an attractive option.
Layer-by-layer (LbL) assembly forms layered structures of polyelectrolytes by the sequential
deposition of cationic and anionic polymers, which take advantage of attractive and repulsive
electrostatic forces.14, 15 The primary limitation of this approach is available materials, which
require a combination of polyelectrolytes. One drawback cited for LbL films is the lack of
biocompatible materials.
18
Chapter 2 Introduction
7
Self-assembly of block copolymers employ a combination of polymer design and processing to
allow formation of nanostructures (often highly ordered).16, 17 Block copolymer (BCP) techniques
make use of phase separation in polymers with two or more distinct chemical blocks. A wide
range of structures have been demonstrated depending highly on the chemical functionality and
block lengths. A common route to generate porous structures is through cross-linking and
subsequent solvent removal of a degradable block. (We will draw specific attention to this
technique, which has been a core fabrication method used in the thesis work.)
Finally, a range of biologically derived structures can form nanostructures, including widely
available biomaterials such as cellulose, naturally forming structures like bacterial-derived
crystalline cellular layers (S-layers), or synthetically engineered polypeptides.18,19 Derivative
forms of cellulose, such celluslose nitrate and cellulose acetate allow the use of solvent casting as
a preparation technique.20 The sysnthetic polypeptides have been deposited with LbL technique
to form nanostructure. 21
Block copolymers (BCPs)
This thesis focuses on nanoporous polymers derived from BCPs. The basic concepts will be
given to understand the context of BCPs. Various approaches to create nanoporous materials
from BCPs will be briefly described.
Block copolymers consist of two or more chemically distinct polymer chains connected at their
ends via covalent bonds, which exhibit compositional heterogeneities on the nanometer scale. 22
Many modern synthetic techniques have contributed to an expanding number of BCP
architectures classified by number of monomer types (e.g. ABA, ABC) and topology (linear
versus branched sequencing).
The unique properties, and thus the applications, of BCPs rely on their mesoscopic (between 5
nm and 50 nm) self-assembly in the molten and solid states. For small molecules unfavorable
enthalpy is often counter-balanced by entropy gain of mixing. Therefore Gmix< 0 is quite often
and miscibility is quite common. For polymers the configurational entropy is significantly
reduced therefore enthalpy is the determining factor for miscibility. Miscibility of polymers is
seldom. If the respective blocks are sufficiently long, and unfavorable enthalpic interactions exist
between them, they will then phase separate below the order-to-disorder transition (ODT)
temperature. A minimum free energy configuration would form under a delicate balance of
19
Chapter 2 Introduction
8
interfacial energy, constraint of incompressibility as well as the entropic penalty of extended
chain configurations.22, 23 Block copolymers, therefore, form highly ordered supramolecular
structures at the length of 5–50 nm. These phenomena have been studied by a large amount of
theoretic and experimental work. We will restrict our attention to the simplest case of a linear
AB diblock, consisting of two distinct segments.
A wealth of self-assembled structures can be determined by three experimental parameters, the
overall degree of polymerization N, the composition fA (i.e. the volume fraction of block A in the
copolymer) and the Flory-Huggins interaction parameter .22, 23 The first two parameters can
influence the entropy factor; the interaction parameter represents the degree of incompatibility
between the two blocks, which is inversely proportional to temperature.
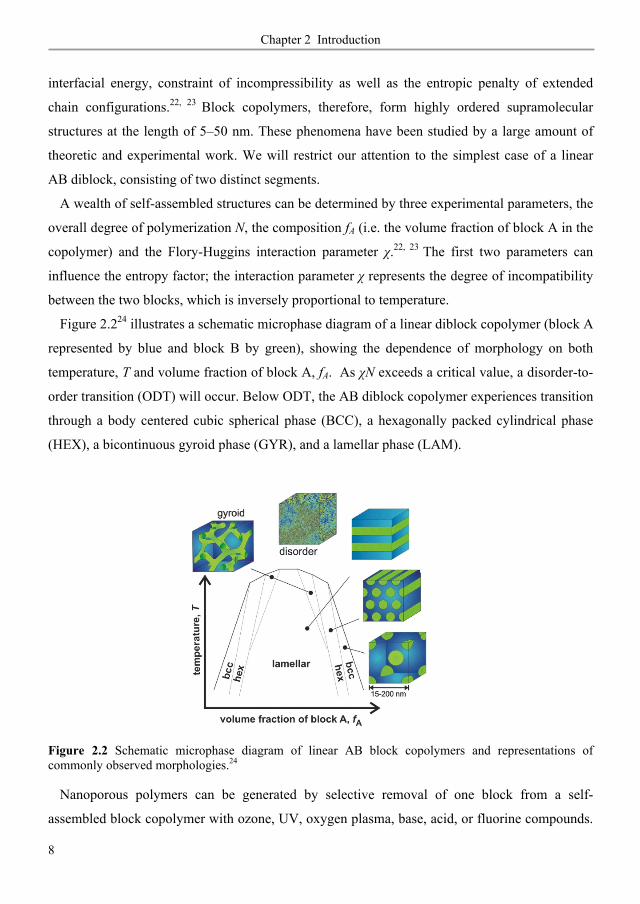
Figure 2.224 illustrates a schematic microphase diagram of a linear diblock copolymer (block A
represented by blue and block B by green), showing the dependence of morphology on both
temperature, T and volume fraction of block A, fA. As N exceeds a critical value, a disorder-to-
order transition (ODT) will occur. Below ODT, the AB diblock copolymer experiences transition
through a body centered cubic spherical phase (BCC), a hexagonally packed cylindrical phase
(HEX), a bicontinuous gyroid phase (GYR), and a lamellar phase (LAM).
Figure 2.2 Schematic microphase diagram of linear AB block copolymers and representations of commonly observed morphologies.24
Nanoporous polymers can be generated by selective removal of one block from a self-
assembled block copolymer with ozone, UV, oxygen plasma, base, acid, or fluorine compounds.
20

Chapter 2 Introduction
9
The first nanoporous polymer prepared from an ordered block copolymer poly(4-vinylphenyl-
dimethyl-2-propoxysilane)-b-polyisoprene-b-poly(4-vinylphenyl-dimethyl-2-propoxysilane)
(PPS-b-PI-b-PPS) was demonstrated by Lee et al. in 1988. 25 PI component was removed via
ozonolysis-based degradation. Layered-like (lamellar) porous structure was obtained similar to
that of segregated microphase of the precursor. In 1993, Hedrick et al.26 published work on the
preparation of nanoporous poly (phenylquinoxaline) (PPQ) with spherical morphology. The
thermally labile blocks such as poly (propylene oxide) or poly (methyl methacrylate) were
successfully removed by heating up above their decomposition temperatures. Later, the same
group demonstrated formation of a series of nanoporous polyimides originally with different
thermally degradable blocks in precursors. Liu et al.27 demonstrated a new method to prepare
cylindrical nanoporous poly(2-cinnamoylethyl methacrylate) (PCEMA) from PCEMA-b-
poly(tert-butyl acrylate) (PCEMA-b-PtBA). The PCEMA block was first cross-linked by
exposure to UV irradiation. PCEMA-b-PtBA was then treated in CH2Cl2 solution of
trimethylsilyl iodide to hydrolyze tert-butyl groups. Poly (acrylic acid) was formed after the
hydrolysis, generating the pores due to the leave of tert-butyl groups. Thurn-Albrecht et al.28
created ordered hexagonally packed cylindrical porosity in polystyrene (PS) matrix by electric
field aligning poly (methyl methacrylate) (PMMA) block in the precursor and removing it by UV
irradiation. Xu et al.29 reported a generation of nanoporous PS matrix via exposure of PS-PMMA
to acetic acid/water mixtures without any prior UV treatment. Asakawa et al.30 also achieved to
selectively remove the PMMA phase from PS-PMMA by oxygen plasma reactive ion etching
(O2-RIE). Zalusky et al.31 published a paper on the formation of nanoporous PS monoliths from
the selective hydrolytic degradation of a PS-PLA diblock copolymer. In our group, Ndoni et al.
successfully generated a series of nanoporous PI and PS by selectively and quantitatively etching
PDMS with anhydrous hydrogen fluoride32 or tetrabutyl ammonium fluoride33.
An in-depth review of preparation of nanoporous materials from block copolymers is beyond
the scope of this thesis and can be found in reviews by Hillmyer. 34
Unique features like controllable morphology, tunable pore size and orientation, high porosity,
narrow pore size distribution, and easy surface functionalization make the block copolymer
derived nanoporous materials very attractive for many membrane applications.34 A large amount
of theoretical and experimental research from literature and our previous work gives a strong
foundation for our attempts to develop nanoporous membranes from block copolymers and
21

Chapter 2 Introduction
10
explore great potential in membrane applications. The proposed membranes in this work will be
designed to hold the gyroid structure with bicontinuous domains across the entire membrane
thickness without need of pre-alignment. Along with control of the microstructure, the surface
morphology and chemistry can be varied to match particular demands in different membrane
applications. In order to understand the function and importance of membrane technology in
relevant applications and optimize the membrane performance, it is necessary to give a short
introduction to membrane process before further introducing specific membrane applications.
2.2. Introduction to membrane process
Every membrane separation process is characterized by the use of a membrane to accomplish a
particular separation. The goal is to allow one or more components of a mixture to permeate the
membrane readily while eliminating one or other components thereby producing a purified
product. Membrane is at the heart of a membrane process and can be considered as a
permselective barrier between two phases.35 The ability to selectively transport components is
attributed to differences in physical or chemical properties between the membrane and the
permeating components. Passive transport through membranes takes place when a driving force
is applied, i.e. a chemical potential gradient across the membrane in, e.g. concentration, pressure,
electrical potential or temperature. 35
The performance or efficiency of a given membrane is determined by two parameters: flux and
selectivity. The flux of species through the membrane is proportional to the driving force as
described by the equation 2-1,
(2-1)ii p
FJ Ll
Δ= −
The driving force Fi can be expressed as the gradient of a pressure or concentration difference
across the membrane, as summarized in Table 2.235. The proportionality coefficient that relates
the flux to the driving force is called the membrane permeance, /pL l . The permeance is the
quotient of the permeability of species pL , an intrinsic material property and the effective
membrane thickness l.
22

Chapter 2 Introduction
11
Selectivity, a measure of a membrane’s ability to separate the components of a mixture, can be
expressed by the retention (Ret ) or the separation factor ( ). For a dilute solution, the retention R
towards the solute can be defined as
Ret 1 (2-2)f p p
f f
c c cc c−
= = −
where cf is the solute concentration in the feed and cp is the solute concentration in the permeate.
Table 2.2 Phenomenological equations. 35
Mass flux Jm = -D c/l Fick Diffusion coefficient Volume flux Jv = -Lp P/l Darcy Permeability coefficient Heat flux Jh = - T/l Fourier Thermal diffusivity Momentum flux Jn = - υ v/l Newton Kinematic viscosity Electrical flux Ji = -1/R E/l Ohm Electrical conductivity
For a mixture consisting of components i and j the separation factor is expressed by
/
/ (2-3)
/pi pj
i jfi fj
c cc c
α =
where cpi and cpj are the concentrations of the components in the permeate and cfi and cfj are the
concentrations of the components in the feed. The separation factor is defined in such a way
that its value is greater than unity, e.g. if component i permeates preferentially then the
separation factor is given by i/j.
Membrane with high flux and selectivity are desired for economic process design. A high
selectivity depends on the selection of membrane material. Once the material is selected, the
permeability of the different components is fixed. In order to achieve the high permeance (e.g.
low membrane resistance) desired, the effective membrane thickness should be as thin as
possible.
The barrier structure of membranes can be classified according to their porous character (Table
2.336). Accordingly, various membrane processes can be accomplished based on the barrier
structure by use of different driving forces. For nonporous membranes, e.g. reverse osmosis,
pervaporation, and gas separation membranes, transport occurs by molecular diffusion and is
described by the solution-diffusion model37. In this case, permeants dissolve in the membrane
material and then diffuse through the membrane down a concentration gradient. The free-
23
Chapter 2 Introduction
12
volumes in the membrane are tiny spaces between polymer chains caused by thermal mothion of
the polymer molecules; they appear and disappear on about the same timescale as the motions of
the permeants traversing the membrane. The membrane permeability is determined by solubility
of the permeants in the membrane and diffusion coefficient of the permeants through the
membrane.
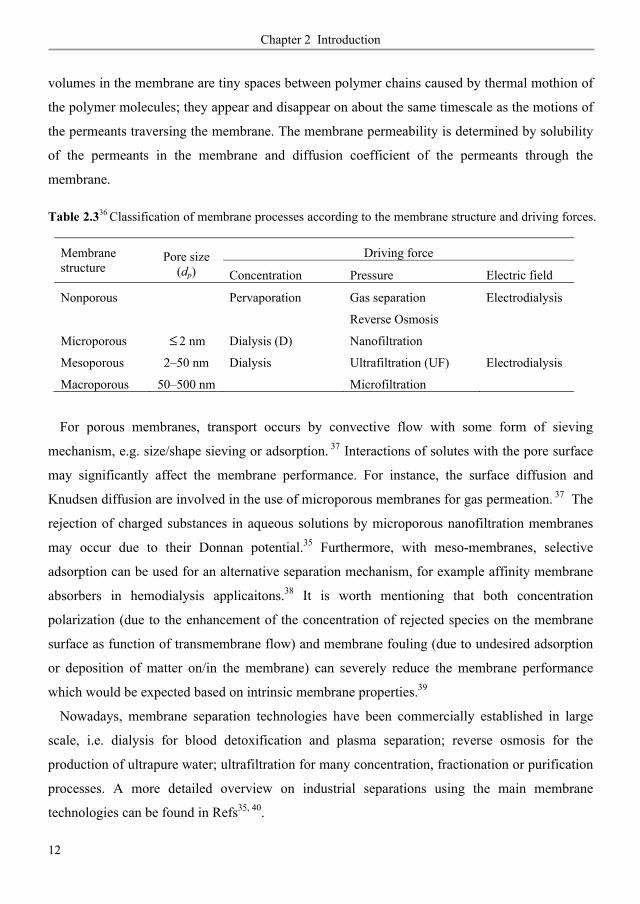
Table 2.336 Classification of membrane processes according to the membrane structure and driving forces.
Membrane structure
Pore size (dp)
Driving force
Concentration Pressure Electric field
Nonporous
Microporous
Mesoporous
Macroporous
≤ 2 nm
2–50 nm
50–500 nm
Pervaporation
Dialysis (D)
Dialysis
Gas separation
Reverse Osmosis
Nanofiltration
Ultrafiltration (UF)
Microfiltration
Electrodialysis
Electrodialysis
For porous membranes, transport occurs by convective flow with some form of sieving
mechanism, e.g. size/shape sieving or adsorption. 37 Interactions of solutes with the pore surface
may significantly affect the membrane performance. For instance, the surface diffusion and
Knudsen diffusion are involved in the use of microporous membranes for gas permeation. 37 The
rejection of charged substances in aqueous solutions by microporous nanofiltration membranes
may occur due to their Donnan potential.35 Furthermore, with meso-membranes, selective
adsorption can be used for an alternative separation mechanism, for example affinity membrane
absorbers in hemodialysis applicaitons.38 It is worth mentioning that both concentration
polarization (due to the enhancement of the concentration of rejected species on the membrane
surface as function of transmembrane flow) and membrane fouling (due to undesired adsorption
or deposition of matter on/in the membrane) can severely reduce the membrane performance
which would be expected based on intrinsic membrane properties.39
Nowadays, membrane separation technologies have been commercially established in large
scale, i.e. dialysis for blood detoxification and plasma separation; reverse osmosis for the
production of ultrapure water; ultrafiltration for many concentration, fractionation or purification
processes. A more detailed overview on industrial separations using the main membrane
technologies can be found in Refs35, 40.
24
Chapter 2 Introduction
13
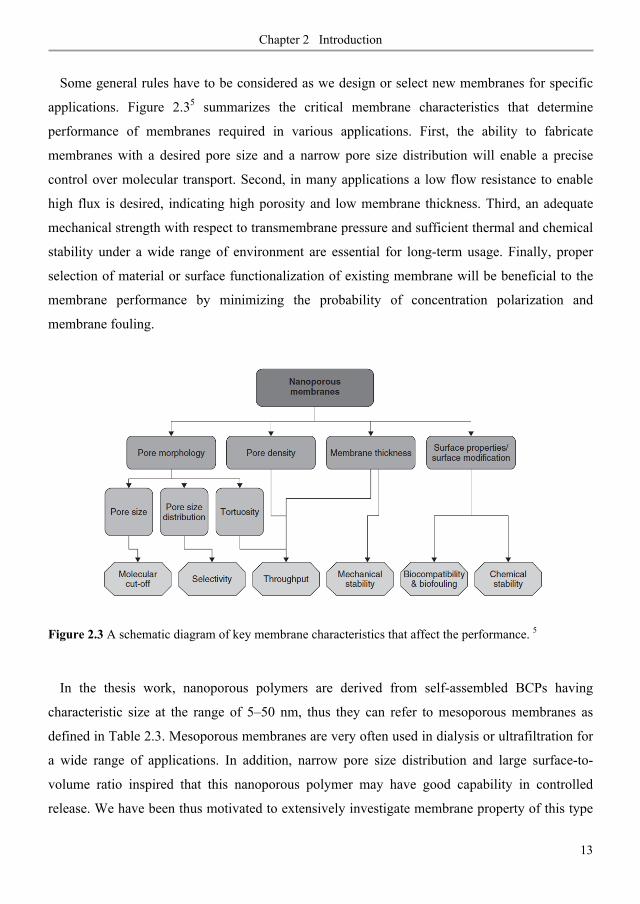
Some general rules have to be considered as we design or select new membranes for specific
applications. Figure 2.35 summarizes the critical membrane characteristics that determine
performance of membranes required in various applications. First, the ability to fabricate
membranes with a desired pore size and a narrow pore size distribution will enable a precise
control over molecular transport. Second, in many applications a low flow resistance to enable
high flux is desired, indicating high porosity and low membrane thickness. Third, an adequate
mechanical strength with respect to transmembrane pressure and sufficient thermal and chemical
stability under a wide range of environment are essential for long-term usage. Finally, proper
selection of material or surface functionalization of existing membrane will be beneficial to the
membrane performance by minimizing the probability of concentration polarization and
membrane fouling.
Figure 2.3 A schematic diagram of key membrane characteristics that affect the performance. 5
In the thesis work, nanoporous polymers are derived from self-assembled BCPs having
characteristic size at the range of 5–50 nm, thus they can refer to mesoporous membranes as
defined in Table 2.3. Mesoporous membranes are very often used in dialysis or ultrafiltration for
a wide range of applications. In addition, narrow pore size distribution and large surface-to-
volume ratio inspired that this nanoporous polymer may have good capability in controlled
release. We have been thus motivated to extensively investigate membrane property of this type
25

Chapter 2 Introduction
14
of nanoporous polymers in pure diffusive mode for dialysis (chapter 6) and in convective mode
for ultrafiltration (chapter 7). The loading and release of the nanoporous polymers has been also
studied (chapter 8). Therefore, in the following three subchapters we give a background to the
relevant applications for which we aim to explore the nanoporous polymer as an appropriate
membrane (i.e. dialysis membrane, ultrafiltration membrane, and sustained release membrane).
The topics will focus on functions required in each membrane application and in turn the
membrane transport properties needed, as well as some common concerned issues.
2.3. Membranes for biosensors
Impressive publications and patents, doubtlessly, suggest a continuing bright future for R&D
activities in biosensor technology, particularly in blood glucose sensing because of its abundant
market potential. However, commercial adoption has significantly lagged behind the research
output. This could be attributed to cost considerations and some key technical barriers such as
stability, detection sensitivity, and reliability. 41-43 Membrane technology has been realized as a
useful and cost-effective tool to overcome the technical difficulties in many established sensor
systems. The membrane structure may be rather diverse but they should fulfill at least one of the
following main functions:36
• barrier between the sensor system and its environment, allowing selective permeation
of analytes to the receptor while hindering interferences from the environment;
• matrix for the immobilization of the receptor or tool for bringing it into proximity to
the detector.
Effective polymers are designed or selected on the basis of knowledge of the way in which
polymer structure governs those properties of relevance to a particular biosensor application.
Three groups of membrane properties must be considered in selecting polymer membranes for
biosensor applications.44 The first relates to the transport behavior of the polymer and
encompasses permeability, permselectivity and transmembrane potential. These are important to
different extents in different types of sensors e.g. potentiometric, amperometric, fiber optic, etc.
The second group of properties relates to the role of the membrane as an immobilization matrix.
Often the sensed species is so large (as in antibody/antigen interactions) that the polymer is
26

Chapter 2 Introduction
15
configured so as to enable unmodulated diffusion to specific sites.45 The third group of properties
relates to surface and interface behavior. These properties are in many ways the most difficult to
control without compromising other functions of the polymer, e.g. permeability. Even so, surface
and interfacial phenomena are extremely important in the overall performance of a given
biosensor, both because of their contribution to transport phenomena and their role in controlling
biocompatibility.
A real progress in membrane technology has been noticed in recent years with an obvious
benefit in the design of biosensors. Glucose oxidase immobilized in porous nanocrystalline TiO2
film is shown to be capable of sensing blood glucose.46 Recently a glucose sensing system based
on nanoporous platinum electrode embedded in a microfluidic chip comprising a microfluidic
transport channel network and a miniaturized electrochemical cell has been demonstrated.47
Bohn et al.48 have proposed exploiting an array of electrically switchable nanocapillary
membranes to perform sequential sensing and analytic operations in TAS devices.
Here we limit our primary concern with amperometric glucose biosensors. When it comes to
glucose biosensors, we should first date back to the first historic experiment (Leland C. Clark)
that served as the origin of glucose biosensors.49 Their first device relied on a thin layer of
glucose oxidase enzyme (GOx) entrapped over an oxygen electrode (via a semipermeable
dialysis membrane), and monitoring the oxygen consumed by the enzyme-catalyzed reaction: GOx
2 2 2glucose+O gluconic acid+H O (2-4)⎯⎯⎯→
On the other hand, lower glucose content results in more hydrogen peroxide. Guilbault and
Lubrano50 described in 1973 an enzyme electrode for the determination of blood glucose based
on amperometric (anodic) monitoring of the liberated hydrogen peroxide: + -
2 2 2H O O +2H +2e (2-5)→ Hence, either the consumption of oxygen or the production of hydrogen peroxide can be
detected with electrodes measuring glucose concentration. First-generation devices have relied
on the use of the natural oxygen, and the production and detection of hydrogen peroxide
(equations 1 and 2) as shown in Figure 2.451. It consists of polycarbonate membrane (outer
membrane), immobilized enzyme (enzyme layer), cellulose acetate membrane (inner membrane)
and platinum electrode. Today, commercial glucose sensors in market are mainly based on this
classic model, including: Yellowsprings instruments (YSI), Nova's StatStrip™, Abbott
Laboratories, Bayer AG, Roche Diagnosti, etc.51 These biosensors have been made available in
27

Chapter 2 Introduction
16
the market in various shapes and forms such as glucose pens and glucose displays. Innovation is
increasingly driven by automation, miniaturization and system integration with high throughput
for multiple tasks.52
Figure 2.4 Schematic drawing of a ‘first-generation’ glucose biosensor (based on a probe manufactured by YSI Inc.).51
A clinically useful sensor for the continuous monitoring of glucose must satisfy the following
characteristics: 53
• Fast response change in glucose concentration must be detected within 1–5 minutes,
depending on the specific application;
• Accuracy glucose level must be measured within minimum errors due to the
presence of interfering species or changes in physiological parameters;
• Sensitivity the signal to noise ratio must be large and a detectable signal must result
from small e.g. 0.1 mM changes in glucose concentration;
• Range all glucose concentrations in the physiological (normoglycernia) and
pathophysiological range (hypo- and hyperglycernia) from 1 to 30 mM must be
measurable;
• Stability depending on the specific application, the signal due to glucose must not
deviate more than ±5% of its average value during the operational time of the
measuring instrument;
• Biocompatibility have proved to be the major barriers to the development of reliable
implantable devices.
28
Chapter 2 Introduction
17
These characteristics require significant improvements of the biosensor performance in terms
of selectivity, detection sensitivity, and biocompatibility. One of the strategies is the use of a
suitable outer membrane to facilitate a prolonged and reliable operation in whole blood. The
outer membrane is expected to mechanically protect the sensor, prevent against protein
adsorption or interferent’s fouling, and filter out interfering substances. Most importantly, it can
regulate glucose diffusion well below the saturation threshold of enzyme layer and the level of
dissolved oxygen to the enzyme layer, thus allowing a linear response in the biosensor. Changes
in diffusion coefficients of outer membrane make it possible to regulate the sensor operational
range, response time and sensitivity. For the use as an outer membrane, various materials have
been reported such as polyvinyl chloride, polyethylene, polymethacrylate, polyurethane, a series
of polycarbonate, silicone rubber, porous silicon membrane and amphiphilic polymers.54
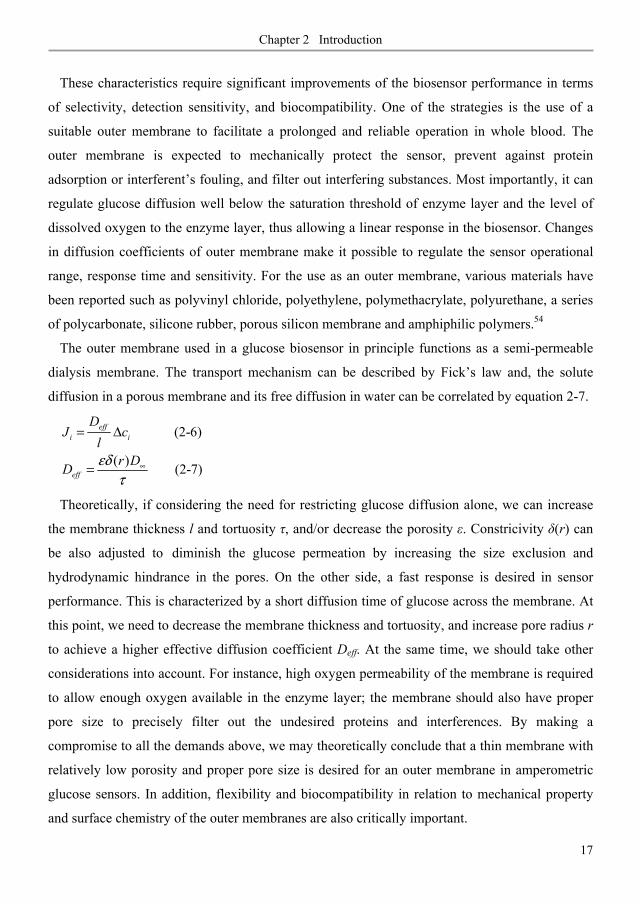
The outer membrane used in a glucose biosensor in principle functions as a semi-permeable
dialysis membrane. The transport mechanism can be described by Fick’s law and, the solute
diffusion in a porous membrane and its free diffusion in water can be correlated by equation 2-7.
(2-6)
( ) (2-7)
effi i
eff
DJ c
lr DD εδτ
∞
= Δ
=
Theoretically, if considering the need for restricting glucose diffusion alone, we can increase
the membrane thickness l and tortuosity , and/or decrease the porosity . Constricivity (r) can
be also adjusted to diminish the glucose permeation by increasing the size exclusion and
hydrodynamic hindrance in the pores. On the other side, a fast response is desired in sensor
performance. This is characterized by a short diffusion time of glucose across the membrane. At
this point, we need to decrease the membrane thickness and tortuosity, and increase pore radius r
to achieve a higher effective diffusion coefficient Deff. At the same time, we should take other
considerations into account. For instance, high oxygen permeability of the membrane is required
to allow enough oxygen available in the enzyme layer; the membrane should also have proper
pore size to precisely filter out the undesired proteins and interferences. By making a
compromise to all the demands above, we may theoretically conclude that a thin membrane with
relatively low porosity and proper pore size is desired for an outer membrane in amperometric
glucose sensors. In addition, flexibility and biocompatibility in relation to mechanical property
and surface chemistry of the outer membranes are also critically important.
29
Chapter 2 Introduction
18
We attempt to develop nanoporous 1,2-PB polymers as outer membranes in amperometric
glucose biosensors. In this thesis work, we begin with our effort to evaluate the 1,2-PB
nanoporous membranes by a series of fundamental work. Various relevant characters, such as
skin structure, intrinsic porosity /active porosity, thickness and surface modification are
considered to optimize the membrane performance in amperometric enzyme-based sensors.
Details will be presented and discussed in chapters 3, 4 and 6. If the nanoporous 1,2-PB
membranes are assessed not to be a good candidate as the outer membrane, this fundamental
work can still provide an useful information to understand transport properties of this membrane
used in dialysis and may open up other new applications, e.g. hemodialysis. In addition to
dialysis, developing the nanoporous membranes as an efficient ultrafiltor for different
applications is also one of our interests. Therefore we present a short introduction to
ultrafiltration membranes in the succeeding subchapter.
2.4. Membranes for ultrafiltration
Ultrafiltration (UF) is typically used to separate macromolecules and colloids from a solution,
e.g. water or microsolutes. The average pore size of the membranes used is in the 1–100 nm
range. 3,4 Nowadays, ultrafiltration has been used in a wide field of applications such as food and
dairy industry, pharmaceutical and biotechnology industry, textile industry, chemical industry
and so on. The first large successful application was the recovery of electrocoat paint in
automobile plants.37 Later, various applications developed in the food and diary industries, first
in the production of cheese, then in the production of juices and, more recently, in the production
of alcoholic beverages. Industrial wastewater and process water treatment is a growing
application, but high costs limit growth.
UF membranes have an asymmetric structure traditionally made by the Loeb-Sourirajan
process,55, 56 having a much denser toplayer (smaller pore size and lower surface porosity) on a
much open micro-size substrate. The finely porous toplayer serves the separation with a much
higher hydrodynamic resistance; the microporous support provides mechanical strength. An
ultrafiltration membrane normally functions through size/shape sieving mechanism. The cut-off
30

Chapter 2 Introduction
19
of ultrafiltration is usually characterized by solute molecular weight. However, the shape of the
molecule can give an import impact on the rejection. 37 Flexible, linear macromolecules usually
have rejection much lower than the rejection measured for rigid, globular proteins of the same
molecular weight. It is considered that linear polymers can be able to snake through the
membrane pores under perturbed states as triggered by external forces; while protein molecules
exist in solution as tightly wound globular coils hold together by hydrogen bonds. These globular
molecules can not deform to pass through the membrane pores and are therefore rejected. In
addition, the solution environment e.g. pH, ionic strength, can also affect permeation through
ultrafiltration membrane, particularly with polyelectrolytes.
Figure 2.5 The effect of pressure on ultrafiltration membrane flux and the formation of a secondary gel layer. Ultrafiltration membranes are best operated at pressures between p2 and p3 at which the gel layer is thin. Operation at high pressures such as p4 leads to formation of thick gel layers, which can consolidate over time, resulting in permanent fouling of the membrane2.6.37
31
Chapter 2 Introduction
20
Concentration polarization and membrane fouling are inherent features of ultrafiltration. The
process performance in ultrafiltration is, therefore, not equal to the intrinsic membrane properties
in actual separations. The retained macromolecular solutes accumulate at the membrane surface
resulting in a concentration build-up. At steady state, the convection flow of the solute to the
membrane equals to the diffusional back-flow from the membrane to the bulk solution. As the
applied pressure further increases, a limiting flux will be attained due to an increase in the
resistance of the boundary layer as seen from Figure 2.537. The concentration of the accumulated
solutes may become so high that a gel layer can be formed as called membrane
fouling deposition of retained colloidal and macromolecules on the membrane surface.
Concentration polarization and membrane fouling can result in severe flux decline, undesired
rejection behavior and shorten membrane lifetime. Thus, except the intrinsic properties that
determine the flux and selectivity of membrane in ultrafiltration, the ability to reduce fouling is
one of the critical considerations. Surface functionalization of established membranes is a key
route in membrane development; the major aim is to improve the performance of the existing
material by either minimizing undesired interactions to improve the selectivity or by introducing
additional (tailored) interactions to create an entirely novel separation function.
Most of today’s ultrafiltration membranes are made by variations of the Loeb–Sourirajan
process.37 A limited number of materials are used, primarily polyacrylonitrile, poly(vinyl
chloride)–polyacrylonitrile copolymers, polysulfone, poly(ether sulfone), poly(vinylidene
fluoride), some aromatic polyamides, and cellulose acetate. In general, the more hydrophilic
membranes are more fouling resistant than the completely hydrophobic materials. For this reason
water-soluble polymers such as poly(vinyl pyrrolidone), poly(ethylene glycol) or poly(vinyl
methyl ether) are often added to the membrane casting solutions used for hydrophobic polymers
such as polysulfone or poly(vinylidene fluoride). Because the pore size and thickness of these
membranes can be altered by changing the process conditions, the flux can be adjusted without
much difficulty. At present, phase inversion is one of dominating techniques to prepare UF
membranes in industry due to its ease and simplicity. One of the main issues is insufficient
membrane selectivity. The wide distribution of pore sizes (Figure 2.6a) causes a broad molecular
weight cut off, which limits their applicability to many applications.57 Composite membranes
have been developed with a robust, inexpensive membrane with micrometer-size pores as a
mechanical support and a thin highly selective layer deposited onto the support.
32
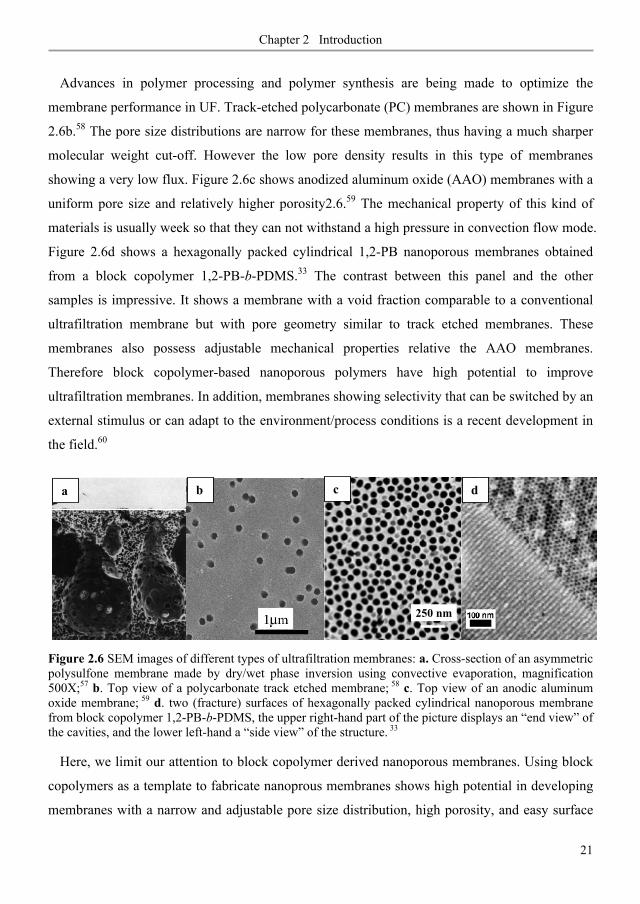
Chapter 2 Introduction
21
Advances in polymer processing and polymer synthesis are being made to optimize the
membrane performance in UF. Track-etched polycarbonate (PC) membranes are shown in Figure
2.6b.58 The pore size distributions are narrow for these membranes, thus having a much sharper
molecular weight cut-off. However the low pore density results in this type of membranes
showing a very low flux. Figure 2.6c shows anodized aluminum oxide (AAO) membranes with a
uniform pore size and relatively higher porosity2.6.59 The mechanical property of this kind of
materials is usually week so that they can not withstand a high pressure in convection flow mode.
Figure 2.6d shows a hexagonally packed cylindrical 1,2-PB nanoporous membranes obtained
from a block copolymer 1,2-PB-b-PDMS.33 The contrast between this panel and the other
samples is impressive. It shows a membrane with a void fraction comparable to a conventional
ultrafiltration membrane but with pore geometry similar to track etched membranes. These
membranes also possess adjustable mechanical properties relative the AAO membranes.
Therefore block copolymer-based nanoporous polymers have high potential to improve
ultrafiltration membranes. In addition, membranes showing selectivity that can be switched by an
external stimulus or can adapt to the environment/process conditions is a recent development in
the field.60
Figure 2.6 SEM images of different types of ultrafiltration membranes: a. Cross-section of an asymmetric polysulfone membrane made by dry/wet phase inversion using convective evaporation, magnification 500X;57 b. Top view of a polycarbonate track etched membrane; 58 c. Top view of an anodic aluminum oxide membrane; 59 d. two (fracture) surfaces of hexagonally packed cylindrical nanoporous membrane from block copolymer 1,2-PB-b-PDMS, the upper right-hand part of the picture displays an “end view” of the cavities, and the lower left-hand a “side view” of the structure. 33
Here, we limit our attention to block copolymer derived nanoporous membranes. Using block
copolymers as a template to fabricate nanoprous membranes shows high potential in developing
membranes with a narrow and adjustable pore size distribution, high porosity, and easy surface
a b c d
250 nm
33
Chapter 2 Introduction
22
functionalization. Several recent studies have examined the performance of block copolymer
derived nanoporous membranes as UF membranes. Russell et al.61 developed an asymmetric
membrane showing ultrahigh selectivity and flux for the filtration of viruses where a thin
nanoporous layer from PS-b-PMMA functioned as a dense top-layer. Later, good dimensional
stability under high pressures and excellent solvent resistance was also reported for the same
type of nanoporous block copolymers for the virus filtration.62 Block copolymer templated
nanoporous membranes are also highly considered as next-generation membranes for waste
water treatments.63 Hillmyer et al. 64 has studied gas and water liquid transport through
nanoporous membranes based on block copolymers for water treatment. Later, they reported
ultrafiltration across nanoporous polydicyclopentadiene-based membranes, showing a significant
sharper molecular cutoff curves than commercial membranes.65
One of the main objectives in the thesis work is to explore in detail the transport properties of
the nanoprous 1,2-PB membranes in ultrafiltration and challenge its capability as an ultrafilter.
Double bonds in 1,2-PB allow the nanoporous matrix with an intrinsic active surface. An
extensive of modification methods have been investigated and developed by the Ph.D. students
in our groups66-68. In this thesis work, surfactant physisorbtion method692.6, UV photooxidation68
and thiolene chemistry67 are considered because of low-cost, simple and efficient attributes.
Details of our work in UF will be reported and discussed in chapters 3, 4, 5 and 7.
As reported in a perspective article by Hillmyer et al.,70 in addition to ultrafitlration application
in sustainable water treatment, block copolymer derived nanoporous polymers are also very
attractive to controlled drug delivery. The third aim of the thesis work is to develop the
nanoporous 1,2-PB polymers as sustained-release films for drug delivery, by use of both the
large surface-to-volume ratio for immobilizing sufficient drug within a small volume and the
unique nano-structure for regulating the permeation rate of a drug. In the following subchapter,
we give a short introduction to membrane technology in controlled delivery application.
2.5. Membranes for controlled release
Controlled delivery systems are designed to release definite amounts of therapeutic agents to a
specific site over prolonged duration time and with a definite kinetics.37, 38, 71 The advantages of
34
Chapter 2 Introduction
23
controlled release include greater drug effectiveness, better balanced drug concentrations in the
body, and more convenience to the patient. The local delivery eliminates the risks of side effects
associated with oral or parenteral therapies such as systemic toxicity. It also improves the
efficacy of the treatment by achieving higher drug concentrations at target site than those
reachable with systemic administration. 37, 38, 71
Membrane-based controlled release delivery systems have been widely used in a variety of
(bio-) medical applications, such as treatment of ophthalmologic disorders, heart disease,
contraception, bone infection prophylaxis and existing osteomyelitis.72-74 In controlled drug
delivery systems a membrane is used to moderate the rate of delivery of drug to the body. In
some devices the membrane controls permeation of the drug from a reservoir to achieve the drug
delivery rate required. Other devices use the osmotic pressure produced by diffusion of water
across a membrane to power miniature pumps. In yet other devices the drug is impregnated into
the membrane material, which then slowly dissolves or degrades in the body. Drug delivery is
then controlled by a combination of diffusion and bioderadation. By tailoring the properties of
the membrane at the molecular level, one can effectively design materials that possess specific
release kinetics. The kinetics can be designed so as to provide a sustained release of drug
delivery in the desired application of the membrane. Rose and Nelson38 were responsible for the
first introduction of membranes for controlling drug release using osmotic pumps. ALZA38 in
1973 originally introduced the OROS oral drug delivery technology to the market as a
gastrointestinal transport system. In the past decades, membrane-based controlled release drug
delivery systems have been an important field in both academic and industrial worlds.
Nanoporous membranes with large surface-volume ratio, well-controlled pore size, porosity,
and membrane thickness offer an attractive route for making capsules that may be used for
providing controlled release of pharmacologic agents. 75 For example, nanoporous materials are
researched for use in drug eluting stents to treat coronary artery disease.76 Recently, nanoporous
inorganic membranes have been tested for sustained release of ophthalmic drugs to treat
conditions related to the eye. 77 When coupled to biosensors, smart drug delivery systems that
respond to physiological conditions could be developed. Especially, a novel development in
stimuli responsive nanoporous membranes triggers a new perspective for controlled release
delivery systems.60 The deposition of “intelligent polymers” onto the surfaces of membrane
pores can create permeation switches or gates. For example, incorporation of a drug within a
35
Chapter 2 Introduction
24
biodegradable, biocompatible polymer nanostructure is a promising approach. The combination
of the environmentally-sensitive hydro gels within micro/nano porous polymer matrices is
presently researched for developing a novel intelligent drug delivery system. 78 These polymer
gels undergo reversible swelling changes in response to small changes in pH, temperature,
intensity of light as well as magnetic and/or electric fields, causing the release of an active agent
at predetermined intervals. Precise control over the release of drug from the micro-reservoirs
may be enabled by integrating the system with temperature, pH, magnetic and electric fields. The
volume swelling hydro gel in the system releases active compounds at a precisely predefined rate,
thus delivering them to the right place in right amounts.
The existing types of membrane-based controlled drug delivery systems include diffusion-
controlled, osmotically controlled, swelling-controlled, and chemically controlled systems.38
Specific attention will be given to diffusion-controlled systems which find broad commercial
application. In diffusion controlled membrane systems, the drug release is controlled by transport
of the drug across a membrane. The transport depends on the drug diffusivity through the
membrane and the thickness of the membrane, according to Fick’s law37. The membrane can be
porous or non-porous and biodegradable or not. These systems find broad application in pills,
implants and patches.
Exploring the potential of block copolymer-derived nanoporous matrices as a controlled
release system is of our great interest. A variety of fast responses and flexible drug delivery
systems can be attempted following three aspects: 1) a porous matrix for directly incorporating
drugs. Particularly, for nanoporous 1,2-PB membranes, their mechanical property can be
extended over a large range mainly depending on cross-linking degree.79,80 Therefore, it is also
possible to make it to be a hydrogel. Membrane pores can be open/ blocked as swelling is
stimulated. 2) A porous substrate for supporting “intelligent polymers”, e.g. UV cure stimuli-
sensitive hydro gels with entrapped enzymes and/or drugs. 3) Rate-controlling layers covering
reservoirs of therapeutic agents.
Standing at the start line, we take amphiphilic molecule SDS as a model molecule. Both
equilibrium and kinetics in loading and release are investigated for highly cross-linked
nanoporous 1,2-PB matrix. The second purpose of this work is to develop a simple and fast
surface modification approach via physisorption of SDS.69 Details will be presented and
discussed in chapters 3, 4 and 8.
36
Chapter 2 Introduction
25
2.6. References
[1] Polarz, S.; Smarsly, B. Nanoporous Materials. Journal of Nanoscience and Nanotechnology 2002, 2, 581– 612.
[2] Rouqerol, J; Avnir, D.; Fairbridge, C. W.; Everett, D. H.; Haynes, J. H.; Pernicone, J. D.; Ramsay, J. D.; Sing, S. W.; and Unger, K. K. Pure Appl. Chem. 1994, 66, 1739.
[3] Lu, G. Q.; Zhao, X. S. Nanoporous Materials: Science and Engineering. Imperial College Press: London, 2003.
[4] Nanoporous Materials. Holister, P.; Roman, C; Harper, T. Cientifica, 2003.
[5] Adiga, S. P.; Jin, C.; Curtiss, L. A.; Monterio-Riviere, N. A. and Narayan, R. J. Nanoporous Membranes for Medical and Biological Applications.
[6] Bernards, D and Desai, T. A. Nanoscale Porosity in Polymer Films: Fabrication and Therapeutic Applications. Soft Matter 2010, 6, 1621–1631.
[7] Mijatovic, D.; Eijkel, J. C. T.; van den Berg, A. Technologies for Nanofluidic Systems: Top-Down vs. Bottom-up—A review. Lab Chip, 2005, 5, 492–500.
[8]Cheng, J. Y.; Ross ,C. A.; Smith, H. I.; Thomas, E. L. Templated Self-Assembly of Block Copolymers: Top-Down Helps Bottom-Up. Advanced Materials 2006,18, 2505–2521.
[9] Madou, M. J. Fundamentals of Microfabrication. CRC, Boca Raton, 2nd edn, 2002.
[10] Martin, C. R. Science 1994, 266, 1961–1966.
[11] Fleischer, R. L. Tracks to Innovation: Nuclear Tracks in Science and Technology. Springer, New York, 1998.
[12] Akthakul, A.; McDonald, W. F. and Mayes, A. M. J. Membr. Sci. 2002, 208, 147–155.
[13] Krause, B.; Diekmann, K.; van der Vegt, N. F. A. and Wessling, M. Macromolecules 2007, 40, 2070–2078.
[14] Decher, G. Science 1997, 277, 1232–1237.
[15] Zhang, X.; Chen, H. and Zhang, H. Y. Chem Commun. 2007, 1395–1405.
[16] Park, C.; Yoon, J. and Thomas, E. L. Polymer 2003, 44, 6725 – 6760.
[17] Hashimoto, T.; Tsutsumi, K.; Funaki, Y. Langmuir 1997, 12, 6869 – 6872.
[18] Sara, M.; Sleytr, U. B. J. Bacteriol. 2000, 182, 859 – 868.
[19] Sleytr, U. B.; Sara, M. Trends Biotechnol. 1997, 15, 20–26.
[20] Kamide, K. Cellulose and Cellulose Derivatives, Elsevier Science, Amsterdam, 2005.
[21] Zhong, Y.; Whittington, C. F.; Zhang, L. and Haynie, D. T. Nanomed. Nanotechnol. Bol. Med. 2007, 3, 154–160.
37
Chapter 2 Introduction
26
[22] Bates, F. S.; Fredrickson, G. H. Annu. Rev. Phys. Chem. 1990, 41, 527.
[23] Bates, F. S. Science 1991, 251, 898.
[24] Vigild, M. E.; Ndoni, S.; Mortensen, K. Dansk Kemi 2004, 11, 32.
[25] Lee, J.-S.; Hirao, A.; Nakahama, S. Macromolecules 1988, 21, 274.
[26] Hedrick , J. L.; Labadie, J.; Russell, T.; Hofer, D.; Wakharker ,V. Polymer 1993, 34, 4717.
[27] Liu, G.; Ding, J.; Guo, A.; Herfort, M.; Bazett-Jones, D. Macromolecules 1997, 30, 1851.
[28]Thurn-Albrecht, T.; Schotter, J.; Kastle, G. A.; Emley, N.; Shibauchi, T.; Krusin-Elbaum, L.; Guarini, K.; Black, C. T.; Tuominen, M. T.; Russell, T. P. Science 2000, 290, 2126.
[29] Xu, T.; Stevens, J.; Villa, J. A.; Goldbach, J. T.; Guarini, K. W.; Black, C. T.; Hawker, C. J. Russell, T. P. Adv. Funct. Mater. 2003, 13, 698.
[30] Asakawa, K.; Hiraoka, T. Jpn. J. Appl. Phys. 2002, 41, 6112.
[31] Zalusky, A. S.; Olayo-Valles, R.; Taylor C. J.; Hillmyer, M. A. J. Am. Chem. Soc. 2001, 123, 1519.
[32] Ndoni, S.; Vigild, M. E.; Berg, R. H. Nanoporous Materials with Spherical and Gyroid Cavities Created by Quantitative Etching of Polydimethylsiloxane in Polystyrene Polydimethylsiloxane Block Copolymers. J. Am. Chem. Soc. 2003, 125 (44), 13366–13367.
[33] Schulte, L.; Grydgaard, A.; Jakobsen, M. R.; Szewczykowski, P. P.; Guo, F.; Vigild, M. E.; Berg, R. H.; Ndoni, S. Nanoporous Materials from Stable and Metastable Structures of 1,2-PB-b-PDMS Block Copolymers. Polymer 2011, 52, 422.
[34] Hillmyer, M. A. Adv. Polym. Sci. 2005, 190, 137.
[35] Mulder, M. Basic Principles of Membrane Technology, 2ed ed., Kluwer Academic, Netherlands 1996.
[36] Ulbricht, M. Advanced Functional Polymer Membranes. Polymer 2006, 47, 2217–2262.
[37] Baker, R. W. Membrane Technology and Applications, 2nd ed., John Wiley& Sons, Ltd., Chichester, 2004.
[38] Peinemann, K. V.; Nunes, S. P. Membrane Technology, Volume 1: Membranes for Life Sciences. Wiley-Vch, Weinheim, 2008.
[39] Belfort,G.; Davis, R. H.; Zydney, A. L. The Behavior of Suspensions and Macromolecular Solutions in Crossflow Microfiltration, J. Membr. Sci. 1996, 96, 1–58.
[40] Nunes S, Peinemann KV, editors. Membrane Technology in the Chemical Industry. Weinheim: Wiley–VCH; 2001.
[41] Malhotra, B. D.; Singhal, R.; Chaubey, A.; Sharma, S. K.; Kumar, A. Recent Trends in Biosensors. Current Applied Physics 2005, 5, 92–97.
[42] Smah, A. J. and Anthony P. F. T. Recent Advances in Amperometric Glucose Biosensors for in vivo Monitoring. Physial. Meas. 1995, 16, 1–15.
38
Chapter 2 Introduction
27
[43] Wang, J. Electrochemical Glucose Biosensors Chem. Rev. 2008, 108, 814–825.
[44] Davies, M. L.; Hamilton, C. J.; Murphy, S. M. and Tighe, B. J. Polymer Membranes in Clinical Sensor Applications– An Overview of Membrane Function. Biomaterials 1992, 13, 14.
[45] Teles, F. R. R.; Fonseca, L. P. Applications of Polymers for Biomolecule Immobilization in Electrochemical Biosensors. Materials Science and Engineering 2008, 28, 1530–1543.
[46] Li, Q.; Luo, G.; Feng, J.; Zhou, Q.; Zhang, L. Amperometric Detection of Glucose with Glucose Oxidase Absorbed on Porous Nanocystalline TiO2 film. Electroanalysis 2001, 12, 413–416.
[47] Joo, S.; Park, S.; Chung, T. D.; Kim, H. C. Integration of a Nanoporous Platinum Thin Film into a Microfluidic System for Non-Enzymatic Electrochemical Glucose Sensing. Anal Sci 2007, 23, 277–281.
[48] Gatimu, E. N.; Sweedler, J. V.; Bohn, P. W. Nanofluidics and the Role of Nanocapillary Array Membranes in Mass-Limited Chemical Analysis. Analyst 2006, 131, 705–709.
[49] Clark Jr., L.; Lyons, C. Ann. NY Acad. Sci. 1962, 102, 29.
[50] Guilbault, G. ; Lubrano, G. Anal. Chim. Acta 1973, 64, 439.
[51] Wang, J. Glucose Biosensors: 40 Years of Advances and Challenges. Electroanalysis 2001, 13, 983–988.
[52] Luong, J. H. T.; Male, K. B.; Glennon, J. D. Biosensor Technology: Technology Push versus Market Pull. Biotechnology Advances 2008, 26, 492–500.
[53] Wilson, G. S.; Gifford, R. Biosens. Bioelectron. 2005, 20, 2388.
[54] Hana, J. H.; Taylor, J. D.; Kima, D. S.; Kim, Y. S.; Kim, Y. T.; Cha, G. S.; Nama, H. Glucose Biosensor with a Hydrophilic Polyurethane (HPU) Blended with Polyvinyl Alcohol/vinyl Butyral Copolymer (PVAB) Outer Membrane. Sensors and Actuators 2007, 123, 384–390.
[55] Loeb, S.; Sourirajan, S. Patent Application Country: Application: US; Patent Country: US; Priority Application Country: US Patent 3133132, 1964.
[56] Loeb, S.; Sourirajan, S.; Weaver, D. E. Patent Application Country: Application: US; Patent Country: US; Priority Application Country: US Patent 3133137, 1964.
[57] Pinnau, I. and Koros, W. J. Structures and Gas Separation Properties of Asymmetric Polysulfone Membranes Made by Dry, Wet, and Dry/ Wet Phase Inversion. J. App. Pol. Sci. 1991, 43, 1491–1502.
[58] Smuleac, V.; Butterfield, D. A. and Bhattacharyya, D. Permeability and Separation Characteristics of Polypeptide-Functionalized Polycarbonate Track-Etched Membranes. Chem. Mater. 2004, 16, 2762-2771.
[59] Thormann, A.; Teuscher, N.; Pfannmçller, M.; Rothe, U. and Heilmann, A. Nanoporous Aluminum Oxide Membranes for Filtration and Biofunctionalization. Small 2007, 3, 1032 – 1040.
[60] Adiga, S. P.; Curtiss, L. A.; Elam, J. W. Nanoporous Materials for Biomedical Devices. JOM 2008, 26–32.
[61] Yang, S. Y.; Ryu, I.; Kim, H. Y.; Kim, J. K.; Jang, S. K.; Russell, T. P. Nanoporous membranes with ultrahigh selectivity and flux for the filtration of viruses. Adv. Mater. 2006, 18, 709–712.
39
Chapter 2 Introduction
28
[62] Yang, S. Y.; Park, J.; Yoon, J.; Ree, M.; Jang, S. K. and Kim, J. K. Virus filtration membranes prepared from nanoporous block copolymers with good dimensional stability under high pressures and excellent solvent resistance. Adv. Func. Mater. 2008, 18, 1371–1377.
[63] Shannon, M. A.; Bohn, P. W.; Elimelech, M.; Georgiadis, J. G.; Marinas, B. J.; Mayes, A. M. Science and technology for water purification in the coming decades. Nature 2008, 452, 301.
[64] Phillip, W. A.; Rzayev, J.; Hillmyer, M. A.; Cussler, E. L. Gas and water liquid transport through nanoporous block copolymer membranes. J. Membr. Sci. 2006, 286, 144–152.
[65] Phillip, W. A.; O’Neill, B.; Rodwogin, M.; Hillmyer, M. A.; Cussler, E. L. Self-assembled block copolymer thin films as water filtration membranes. Applied Materials & Interfaces 2010, 2, 847–853.
[66] Guo, F.; Jankova, K.; Schulte, L.; Vigild, M. E.; Ndoni, S. One-Step Routes from Di- and Triblock Copolymer Precursors to Hydrophilic Nanoporous Poly(acrylic acid)-b-polystyrene. Macromolecules 2008, 41, 1486-1493.
[67] Berthold, A.; Sagar, K.; Ndoni, S. Manuscript in preparation.
[68]Sagar, K.; Christiansen, M. B.; Ndoni, S. Type and Distribution of Chemical Groups from Controlled Photo-Oxidation of Nanoporous 1, 2-Polybutadiene. Polymer Chemistry 2011.
[69] Li, L.; Wang, Y.W.; Vigild, M. E. Ndoni, S. Physisorption of SDS in a Hydrocarbon Nanoporous Polymer. Langmuir 2010, 26 (16), 13457–13465.
[70] Jackson, E. A. and Hillmyer, M. A. Nanoporous Membranes Derived from Block Copolymers: From Drug Delivery to Water Filtration. ACS NANO 2010, 4 , 3548–3553.
[71] Stamatialis, D. F.; Papenburg, B. J.; Girones, M.; Saiful, S, Bettahalli, S.N.M.; Schmitmeier, S.; Wessling, M. Medical Applications of Membranes: Drug Delivery, Artificial Organs and Tissue Engineering. J. Mem. Sci. 2008, 3, 1–34.
[72] Siepmann, F.; Siepmann, J.; Walther, M.; MacRae, R. J.; Bodmeier, R. Polymer Blends for Controlled Release Coatings, J. Controlled Release 2008, 125, 1–15.
[73] Aminabhavi, T. M.; Kulkarini, R. V.; Kulkarini, A. R. Polymers in Drug Delivery. Polymer News 2004, 29, 214–218.
[74] Adiga, S. P.; Jin, C.; Curtiss, L. A.; Monteiro-Riviere, N. A. and Narayan, R. J. Nanoporous Membranes for Medical and Biological Applications. Nanomed Nanobiotechnol 2009, 1, 568–581.
[75] Desai, T. A.; Sharma, S.; Walczak, R. J.; Boiarski, A.; Cohen, M.; Shapiro, J.; West, T.; Melnik, K.; Cosentino, C.; Sinha, P.M.; Ferrari, M. Nanoporous Implants for Controlled Drug Delivery. In: Desai TA, Bhatia S eds. BioMEMS and Biomedical Nanotechnology Volume III Therapeutic Micro/Nanotechnology. New York: Springer, 2007.
[76] Desai, T. A.; Chu, W. H.; Tu, J. K; Beattie, G. M.; Hayek, A. Microfabricated Immunoisolating Biocapsules. Biotechnol Bioeng 1998, 57, 118–120.
[77] Orosz, K. E.; Gupta, S.; Hassink, M.; Abdel-Rahman, M.; Moldovan, L. Delivery of Antiangiogenic and Antioxidant Drugs of Ophthalmic Interest through a Nanoporous Inorganic Filter. Mol Vis 2004, 10, 555–565.
40
Chapter 2 Introduction
29
[78] He, C. L.; Kim. S. W. ; Lee, D. Su. In Situ Gelling Stimuli-Sensitive Block Copolymer Hydrogels for Drug Delivery. Journal of Controlled Release 2008, 127, 189–207.
[79]Szewczykowski, P. Nano-porous Materials from Diblock Copolymers and Its Membrane Application, Ph.D. thesis, Technical University of Denmark, 2009.
[80] Guo, F. Functional Nanoporous Polymers from Block Copolymer Precursors. Ph.D. thesis, Technical University of Denmark, 2010.
41

Chapter 2 Introduction
30
42

Chapter 3 Preparation of Nanoporous 1,2-PB Membranes
31
Chapter 3 Preparation of Nanoporous 1,2-PB Membranes
During the overall Ph.D. project, all the membranes were prepared with the same material, e.g.
1,2-polybutadiene-b-polydimetylsiloxane (1,2-PB-b-PDMS). This chapter will detail how
nanoporous 1,2-PB membranes were prepared from the 1,2-PB-b-PDMS precursors in the thesis
work. The extensive characterization results and discussion will be saved for the next chapter.
These nanoporous membranes will be in detail explored for different membrane applications as
reported in chapter 6, 7 and 8.
Figure 3.1 illustrates the preparation procedures in general terms without focusing on specific
formulations. The general procedure is the same for all the membrane samples used in this work.
It consists of four main steps:
• Design and synthesis of block copolymer precursors a specific nanostructure (e.g.
LAM, HEX, GYR, etc.) is determined at this step.1
• Thermally cross-linking the precursor the mechanical properties of the resultant
nanoporous material are mainly controlled at this step;2 surface morphology can also be
defined at this step.3
• Selectively etching the cross-linked precursor to remove one block a nanoporous
matrix is created at this step; different intrinsic bulk porosity can be derived depending on
the etching conditions.
• Surface functionalization of nanoporous matrices different surface modification
techniques can be used to produce proper surface properties for a particular application. 0
Figure 3.1 Schematic illustration of the fabrication of cross-linked nanoporous 1,2-PB polymer from 1,2-PB-b-PDMS block copolymer. The precursor 1,2-PB-b-PDMS self-assembles into gyroid morphology at the cross-linking temperature (a). PDMS is selectively cleaved from the sample and a nanoporous
Cross-link and selectively etch
Surface functionalization
a b c
43
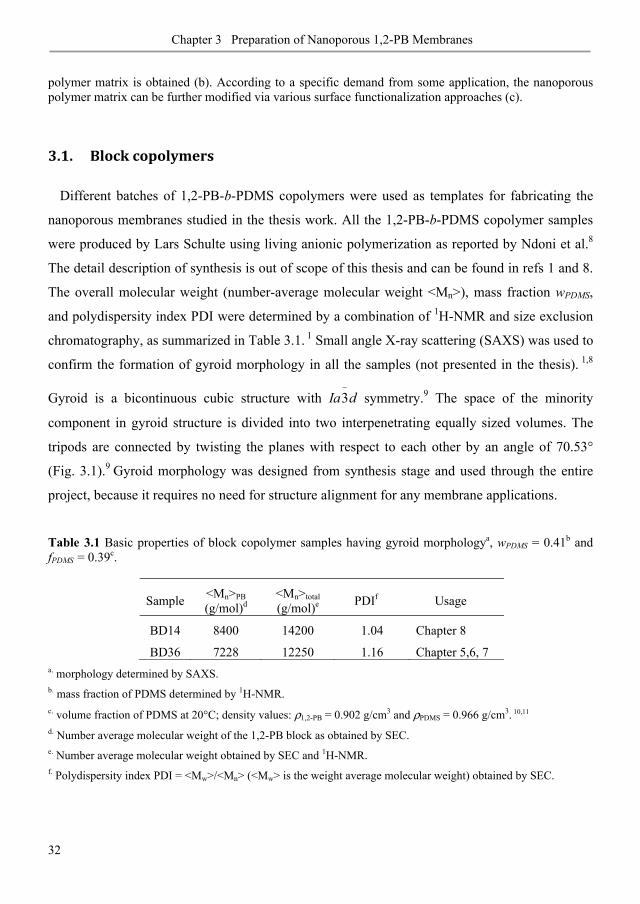
Chapter 3 Preparation of Nanoporous 1,2-PB Membranes
32
polymer matrix is obtained (b). According to a specific demand from some application, the nanoporous polymer matrix can be further modified via various surface functionalization approaches (c).
3.1. Block copolymers
Different batches of 1,2-PB-b-PDMS copolymers were used as templates for fabricating the
nanoporous membranes studied in the thesis work. All the 1,2-PB-b-PDMS copolymer samples
were produced by Lars Schulte using living anionic polymerization as reported by Ndoni et al.8
The detail description of synthesis is out of scope of this thesis and can be found in refs 1 and 8.
The overall molecular weight (number-average molecular weight <Mn>), mass fraction wPDMS,
and polydispersity index PDI were determined by a combination of 1H-NMR and size exclusion
chromatography, as summarized in Table 3.1. 1 Small angle X-ray scattering (SAXS) was used to
confirm the formation of gyroid morphology in all the samples (not presented in the thesis). 1,8
Gyroid is a bicontinuous cubic structure with 3Ia d−
symmetry.9 The space of the minority
component in gyroid structure is divided into two interpenetrating equally sized volumes. The
tripods are connected by twisting the planes with respect to each other by an angle of 70.53°
(Fig. 3.1).9 Gyroid morphology was designed from synthesis stage and used through the entire
project, because it requires no need for structure alignment for any membrane applications.
Table 3.1 Basic properties of block copolymer samples having gyroid morphologya, wPDMS = 0.41b and fPDMS = 0.39c.
Sample <Mn>PB (g/mol)d
<Mn>total (g/mol)e PDIf Usage
BD14
BD36
8400
7228
14200
12250
1.04
1.16
Chapter 8
Chapter 5,6, 7 a. morphology determined by SAXS. b. mass fraction of PDMS determined by 1H-NMR. c. volume fraction of PDMS at 20°C; density values: ρ1,2-PB = 0.902 g/cm3 and ρPDMS = 0.966 g/cm3. 10,11 d. Number average molecular weight of the 1,2-PB block as obtained by SEC.
e. Number average molecular weight obtained by SEC and 1H-NMR. f. Polydispersity index PDI = <Mw>/<Mn> (<Mw> is the weight average molecular weight) obtained by SEC.
44

Chapter 3 Preparation of Nanoporous 1,2-PB Membranes
33
3.2. Membrane preparation and fabrication
Cross-linking of 1,2-PB Dicumyl peroxide (bis(α,α-dimethylbenzyl) peroxide) (DCP, Merck)
was used as received for cross-linking 1,2-PB in the precursor 1,2-PB-b-PDMS. 1 % mole DCP
relative to the molar amount of double bonds in 1,2-PB was dissolved in tetrahydrofuran (THF,
Sigma-Aldrich) solutions of 1,2-PB-b-PDMS prior to solution casting. Two casting methods
were used to respectively fabricate thick samples (~ 500 μm) and thin samples (< 150 μm), as
schematically illustrated in Figure 3.2. For fabricating a thick membrane, the sample solution
was cast onto a glass petri-dish, and dried under nitrogen flow at room temperature. After
overnight drying, the optically transparent films experienced cross-linking in a preheated
thermostated oven at 140 °C for 2 hours under nitrogen atmosphere. The cross-linking reaction
happened thus with one side of the film exposed to the atmosphere and the other in contact with
glass. For comparison, one 1,2-PB-b-PDMS sample was cross-linked sandwiched between two
glass petri-dishes, thereby eliminating the free surface. Spacers (500 m in thickness) were
placed at the edge of the petri-dish in order to control the thickness of the polymer film.
Figure 3.2 Schematic illustration of solvent casting of the precursor solutions (green) onto a petri-dish (grey) for preparation of thick membranes (left) and onto a flat plate (glass or FTDS-coated glass, dark yellow) for preparation of thin membranes (right). Spacers (red) with a desired thickness were used for membrane thickness control.
Various approaches were tried to form a thin film at the start of the thesis work. Here we only
present the successful method i.e. sandwich method; the others that are to some extent failure
will be reported in Appendix A. For the sandwich method, two sets of substrates were used for
casting the precursor film. One is a glass plate; the other is a FDTS-coated glass plate via
molecular vapor deposition.12 FDTS stands for Cl3Si(CH2)2(CF2)7CF3. The sample solution was
cast onto a clean substrate (glass or FDTS coated glass), followed by evaporating under nitrogen
flow first and then drying in a vacuum at room temperature. The dried sample was covered with
a second plate (glass or FDTS-coated glass). The two plates were squeezed together under 4 bars
pressure pressure
45
Chapter 3 Preparation of Nanoporous 1,2-PB Membranes
34
at room temperature with a homemade pneumatic-drive compressing set-up under vacuum for 2
hrs. The thickness of the sample was controlled with a few pieces of 0.5 cm wide aluminum
spacers with a desired thickness. The sandwiched block copolymer samples were cross-linked at
140 °C for 2 hours under nitrogen atmosphere. We expect the membrane prepared between two
glass plates would show ‘open’ porous outer surface while the membrane prepared between two
FDTS-coated plates would show a ‘closed’ skin layer near the surface (To be explained in
chapter 4.2.2). For the sake of convenience, membranes prepared between two glasses are
referred to in this thesis as non-skin (ns) membranes to denote a porous surface, while
membranes prepared between fluorinated glasses are referred to as double-skin (ds) membranes
to denote a dense top layer on the membranes prepared.
Etching of PDMS As described elsewhere1, the general procedure for etching 500–1000 μm
thick samples is as follows. Tetrabutylamonium fluoride (TBAF) (Aldrich) was used as etching
reagent to selectively remove PDMS. Cross-linked samples were reacted for 36 h with 1 M
TBAF in THF at 2 molar excess amounts relative to the concentration of repeating unit |
|Si O− − − in PDMS1. After etching, each sample was taken out of the solution and rinsed in
mixtures with varying ratio (v/v) of THF/Methanol. Solvent evaporation followed under a
Nitrogen flow. Besides the thick samples, we also made effort to prepare thin nanoporous
membranes e.g. 20 μm by optimizing the etching formulations, e.g. TBAF concentration
0[ ]TBAF , molar ratio of TBAF and |
|Si O− − − ( /TBAF Si Om m − ), and etching time t (See the
detailed results and discussion in Appendix B). Finally, we used a formulation of 0[ ]TBAF
=0.005 M, /TBAF Si Om m − = 1 (mol/mol) and the excess time 5h for etching the thin membranes
with thickness below 100 μm. In the entire thesis work, a complete etching was performed to
obtain samples with the maximum porosity, i.e. 0.39. For a particular interest, a batch of samples
with different porosities were prepared for investigating the effect of intrinsic porosity on
diffusive transport in membranes as presented in Appendix B.
46
Chapter 3 Preparation of Nanoporous 1,2-PB Membranes
35
3.3. Surface modification
Nanoporous 1,2-PB membranes are naturally hydrophobic. Aqueous solution can not
spontaneously infiltrate the membranes by capillary force. Extensive work in relation to surface
functionalization of nanoporous 1,2-PB membranes has been reported by pre-Ph.D. student
Fengxiao Guo in our group.13 Three different methods were used in the thesis work to render the
membrane surface hydrophilic to some extent.
SDS physisorbtion It is a simple and low-cost physical modification14. Sodium dodecyl sulfate
(purity 98.5%, Sigma-Aldrich) was used as received. We prepared SDS solutions in deionized
(DI) water and stirred on a shaker at room temperature for at least 15 h before use. Molar
concentrations in the range 0.5 – 50 mM were used for the SDS loading experiments. In the SDS
loading experiment, each piece of nanoporous 1,2-PB film (20 ± 1 mg) was placed in 15 mL of
SDS aqueous solution and kept under shaking at planned time intervals. The solution loading
rates for different SDS concentrations were followed by gravimetry. Each sample was taken out
of the solution, gently wiped with a tissue, immediately weighed in a balance with precision 0.1
mg, and placed back to the solution for the next time interval. At the end of the loading
experiment, the outer surface of the sample was wiped with a tissue and dried under nitrogen
flow without further treatment. The mass of the SDS-loaded film was notified after complete
drying. See details in chapter 8.
UV photooxidation We first reported the initial findings of UV photooxidation of nanoporous
1,2-PB matrices15 and an extensive work on photooxidation mechanism was investigated by
Ph.D. student Kaushal Sagar in our group.6 For comparison in diffusion properties (See chapter
6), a batch of original nanoporous 1,2-PB membranes were functionalized via UV
photooxidation. 20 μm NP films were photooxidized in air at 37 ºC up to 12 h by UV generated
from Philips Cleo 25W RS UV lamps. The radiation wavelength range was 310 – 420 nm,
peaking at 350 nm; the UV intensity is in the range of 14 – 16 mW/cm2. The UV irradiation
‘hits’ the samples from the top side. Simple masks were made on paper sheets and used for
controlling the exposure area to UV.
UV-induced thiolene chemistry Pre-Ph.D. student Anton Berthold7 in our group first developed
this technique for surface functionalization of nanoporous 1,2-PB membranes, and an expanding
investigations were further conducted by Kaushal Sagar16. For comparison of the ultrafiltration
47

Chapter 3 Preparation of Nanoporous 1,2-PB Membranes
36
properties (See chapter 7), a batch of original nanoporous 1,2-PB membranes were
functionalized via UV-initiated thoil-ene chemistry. The surface hydrophilization was performed
with 500 mM MESNA (sodium 2-sulfanylethanesulfonate, Sigmaaldrich) solutions in ultrapure
water mixed with equal volume of 10 mM photoinitiator DMPA (2,2-Dimethoxy-2-
phenylacetophenone, Sigma-Aldrich) solution in DMF (N,N-dimethylmethanamide, Sigma-
Aldrich).
A 9 cm long UVA-lamp (SolData, Denmark) with a main peak at 365 nm and emission range
315 nm –400 nm was used for the photo-grafting. The membranes were immersed in the grafting
solution in a 20 ml Al-wrapped glass bottle for 1 hour preloading. Subsequently, the samples
were taken out and placed between two glass plates. The samples were irradiated for 10 min at a
constant intensity of 8 mW/cm2 measured with an UVA power meter from SolData.
After the pore surface modification, the samples were cleaned in large excess of ethanol and
water followed by drying under N2 flow. The pore surface was expected to be grafted with
sulfonated groups of average surface density 1.6 groups/ nm2. The relevant characterizations, e.g.
gravimety, FTIR and water uptake were performed to evaluate the extent of the hydrophilization,
as reported in detail elsewhere7.
3.4. Summary
Table 3.2 A list of membrane samples used in the thesis work.
Membrane Thickness (μm)
Surface morphology Surface modification Application Chapter Non-
skina Skina
1 20 ~ 150 Yes Yes UV photooxidation Dialysis 6
2 20 ~ 30 Yes No Thiolene chemisty Ultrafiltration 7
3 500 Yes Yes SDS physisorbtion Release 8 a. ‘Non-skin’ denotes a porous surface without a top dense layer on the membranes prepared; ‘Skin’ denotes a dense top layer so called skin layer on the membranes prepared. See the details in Chapter 4.
The goal of this thesis is to explore the potential of nanoporous 1,2-PB in membrane
applications involving dialysis, ultrafiltration, and sustained release. We prepared a series of
nanoporous 1,2-PB membranes with different membrane characteristics, hence different
48
Chapter 3 Preparation of Nanoporous 1,2-PB Membranes
37
membrane properties and performance would be expected. Table 3.2 summarizes some basic
characteristics of the membrane samples used in the work presented in the following chapters.
3.5. References
[1] Schulte, L.; Grydgaard, A.; Jakobsen, M. R.; Szewczykowski, P. P.; Guo, F.; Vigild, M. E.; Berg, R. H.; Ndoni, S. Nanoporous Materials from Stable and Metastable Structures of 1,2-PB-b-PDMS Block Copolymers. Polymer 2011, 52, 422.
[2] Guo, F.; Andreasen, J. W.; Vigild, M. E.; Ndoni, S. Influence of 1,2-PB matrix cross-linking on structure and properties of selectively etched 1,2-PB-b-PDMS block copolymers. Macromolecules 2007, 40(10), 3669-3675.
[3] Li, L.; Schulte, L.; Clausen, L. D.; Hansen, K. M.; Jonsson, G. E.; Ndoni, S. Gyroid Nanoporous Membranes with Tunable Permeability. ACS Nano 2011, 5 (10), 7754 – 7766.
[4] Guo, F.; Jankova, A. K.; Schulte, L.; Vigild, M. E.; Ndoni, S. Surface Modification of Nanoporous 1,2-Polybutadiene by Atom Transfer Radical Polymerization or Click Chemistry. Langmuir 2010, 26, 2008-2013.
[5]Guo, F.; Jankova, A. K.; Vigild, M. E.; Ndoni, S. Hydrophilic Nanoporous 1,2-Polybutadiene via Surface-Initiated Atom Transfer Radical Polymerisation. Polymer Preprints 2008, 49, 540-541,
[6] Sagar, K.; Christiansen, M. B.; Ndoni, S. Type and Distribution of Chemical Groups from Controlled Photo-Oxidation of Nanoporous 1, 2-Polybutadiene. Polymer Chemistry 2011.
[7] Berthold, A.; Sagar, K.; Ndoni, S. Manuscript in preparation.
[8] Ndoni, S.; Vigild, M. E.; Berg, R. H. Nanoporous Materials with Spherical and Gyroid Cavities Created by Quantitative Etching of Polydimethylsiloxane in Polystyrene Polydimethylsiloxane Block Copolymers. J. Am. Chem. Soc. 2003, 125 (44), 13366–13367.
[9] Vigild., M. E.; Almdal, K.; Mortensen, K. Macromolecules 1998, 31, 5702-5716.
[10] Mark, J. E. editor, Polymer Data Handbook, Oxford University Press, 1999.
[11] Brandrup, J.; Immergut, E. H. Polymer Handbook, 3rd ed., John Wiley & Sons: New York, 1989.
[12] Szewczykowski, P. Nano-porous Materials from Diblock Copolymers and Its Membrane Application, Ph.D. thesis, Technical University of Denmark, 2009.
[13] Guo, F. Functional Nanoporous Polymers from Block Copolymer Precursors. Ph.D. thesis, Technical University of Denmark, 2010.
[14] Li, L.; Wang, Y.W.; Vigild, M. E. Ndoni, S. Physisorption of SDS in a Hydrocarbon Nanoporous Polymer. Langmuir 2010, 26 (16), 13457–13465
[15] Ndoni, S.; Li L.; Schulte, L.; Szewczykowski, P. P.; Hansen, T. W.; Guo, F. X.; Berg, R. H.; Vigild, M. E. Controlled Photooxidation of Nanoporous Polymers Macromolecules, 2009, 42, 3877–3880.
49

Chapter 3 Preparation of Nanoporous 1,2-PB Membranes
38
50
Chapter 4 Structural Characteristics of Nanoporous 1,2-PB Membranes
39
Chapter 4 Structural Characteristics of Nanoporous 1,2-PB Membranes
Structural parameters such as morphology, pore size and distribution, porosity, thickness, and
etc. are crucially important in determining intrinsic properties of a given membrane and are
associated with final membrane performance. It is necessary to comprehensively characterize a
newly developed membrane prior to any other actions. For the nanoporous 1,2-PB membranes
derived from 1,2-PB-b-PDMS copolymers, a well-defined recipe has been developed in
previously work and followed as it is in the thesis work. Fourier transformed infrared (FTIR)
spectroscopic data confirmed cross-linking degree and etching efficiency1. In most cases, highly
cross-linked nanoporous 1,2-PB matrices with complete removal of PDMS components were
prepared; if not the case, a particular emphasis will be given. The porosity of the resultant
membranes is checked by gravimetry and water uptake (max. 0.79 cm3 per gram), which can
directly reflect the PDMS etching efficiency. Small angle x-ray scattering (SAXS) demonstrates
gyroid morphology in both precursors and nanoporous films with 15 nm in pore diameter. 2, 3 N2
adsorption data revealed a continuous porous structure with a narrow pore distribution, interior
surface area of 278 ± 40 m2/g and pore diameter of 15 nm. 2, 3 This chapter will present Scanning
electron microscopy (SEM), Transmission electron microscopy (TEM) and Atomic force
microscopy (AFM) images to show structural characteristics of the nanoporous membranes used
in the thesis work. A detailed discussion will be given to the formation of surface morphology
caused by different substrates. The complementary X-ray photoelectron spectroscopy (XPS) and
Contact angle measurements (CA) data provide supporting information for the proposed
structure concluded from electron microscopy.
4.1. Experimental
Scanning electron microscopy (SEM) was done on a HELIOS instrument or a Quantum
FEGSEM instrument from FEI using an acceleration voltage of 5 kV. The samples were sputter-
coated with 2 nm thick Pt/Pd prior to SEM imaging. Top surface and fracture surface were
51
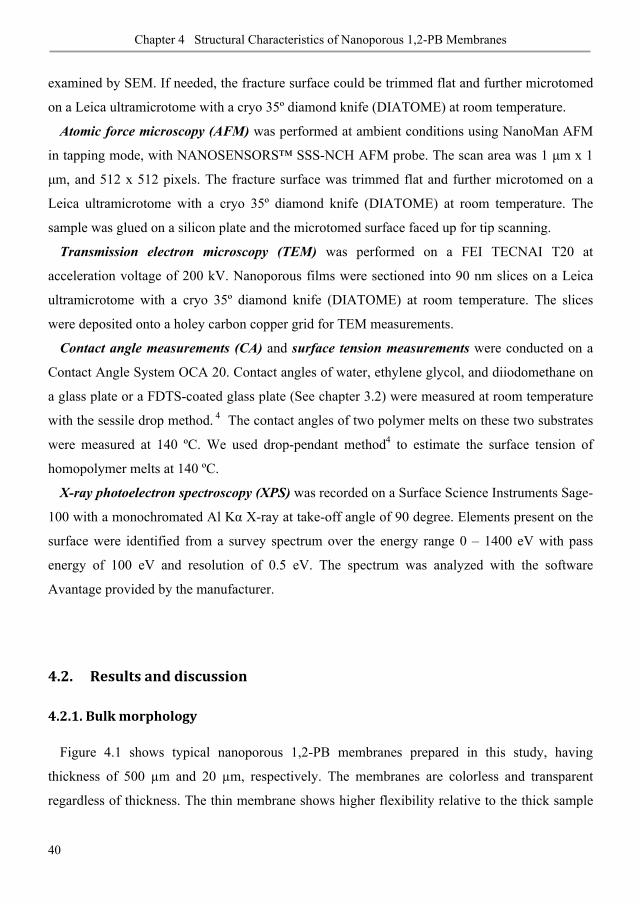
Chapter 4 Structural Characteristics of Nanoporous 1,2-PB Membranes
40
examined by SEM. If needed, the fracture surface could be trimmed flat and further microtomed
on a Leica ultramicrotome with a cryo 35º diamond knife (DIATOME) at room temperature.
Atomic force microscopy (AFM) was performed at ambient conditions using NanoMan AFM
in tapping mode, with NANOSENSORS™ SSS-NCH AFM probe. The scan area was 1 m x 1
m, and 512 x 512 pixels. The fracture surface was trimmed flat and further microtomed on a
Leica ultramicrotome with a cryo 35º diamond knife (DIATOME) at room temperature. The
sample was glued on a silicon plate and the microtomed surface faced up for tip scanning.
Transmission electron microscopy (TEM) was performed on a FEI TECNAI T20 at
acceleration voltage of 200 kV. Nanoporous films were sectioned into 90 nm slices on a Leica
ultramicrotome with a cryo 35º diamond knife (DIATOME) at room temperature. The slices
were deposited onto a holey carbon copper grid for TEM measurements.
Contact angle measurements (CA) and surface tension measurements were conducted on a
Contact Angle System OCA 20. Contact angles of water, ethylene glycol, and diiodomethane on
a glass plate or a FDTS-coated glass plate (See chapter 3.2) were measured at room temperature
with the sessile drop method. 4 The contact angles of two polymer melts on these two substrates
were measured at 140 ºC. We used drop-pendant method4 to estimate the surface tension of
homopolymer melts at 140 ºC.
X-ray photoelectron spectroscopy (XPS) was recorded on a Surface Science Instruments Sage-
100 with a monochromated Al K X-ray at take-off angle of 90 degree. Elements present on the
surface were identified from a survey spectrum over the energy range 0 – 1400 eV with pass
energy of 100 eV and resolution of 0.5 eV. The spectrum was analyzed with the software
Avantage provided by the manufacturer.
4.2. Results and discussion
4.2.1. Bulk morphology
Figure 4.1 shows typical nanoporous 1,2-PB membranes prepared in this study, having
thickness of 500 μm and 20 μm, respectively. The membranes are colorless and transparent
regardless of thickness. The thin membrane shows higher flexibility relative to the thick sample
52
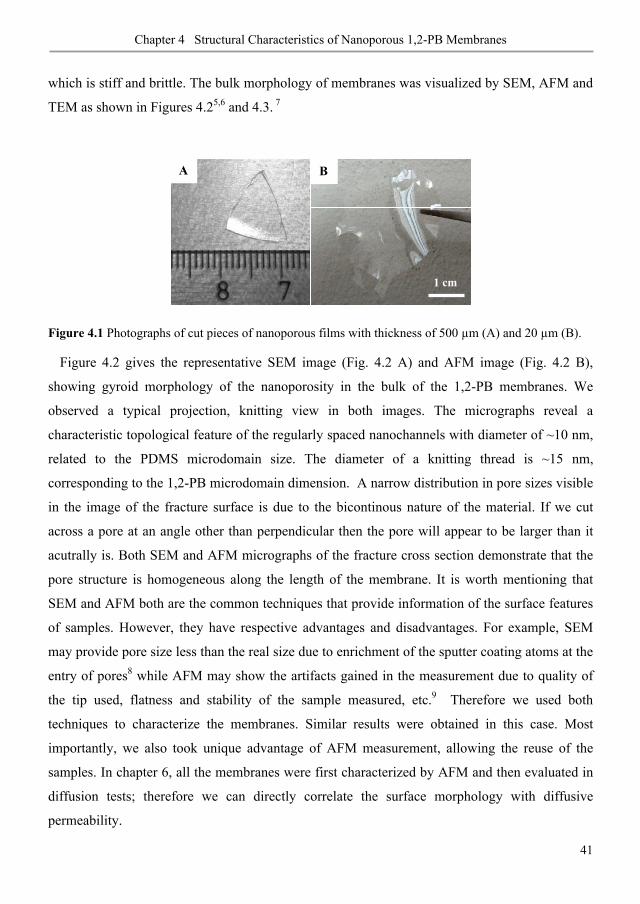
Chapter 4 Structural Characteristics of Nanoporous 1,2-PB Membranes
41
which is stiff and brittle. The bulk morphology of membranes was visualized by SEM, AFM and
TEM as shown in Figures 4.25,6 and 4.3. 7
Figure 4.1 Photographs of cut pieces of nanoporous films with thickness of 500 μm (A) and 20 μm (B).
Figure 4.2 gives the representative SEM image (Fig. 4.2 A) and AFM image (Fig. 4.2 B),
showing gyroid morphology of the nanoporosity in the bulk of the 1,2-PB membranes. We
observed a typical projection, knitting view in both images. The micrographs reveal a
characteristic topological feature of the regularly spaced nanochannels with diameter of ~10 nm,
related to the PDMS microdomain size. The diameter of a knitting thread is ~15 nm,
corresponding to the 1,2-PB microdomain dimension. A narrow distribution in pore sizes visible
in the image of the fracture surface is due to the bicontinous nature of the material. If we cut
across a pore at an angle other than perpendicular then the pore will appear to be larger than it
acutrally is. Both SEM and AFM micrographs of the fracture cross section demonstrate that the
pore structure is homogeneous along the length of the membrane. It is worth mentioning that
SEM and AFM both are the common techniques that provide information of the surface features
of samples. However, they have respective advantages and disadvantages. For example, SEM
may provide pore size less than the real size due to enrichment of the sputter coating atoms at the
entry of pores8 while AFM may show the artifacts gained in the measurement due to quality of
the tip used, flatness and stability of the sample measured, etc.9 Therefore we used both
techniques to characterize the membranes. Similar results were obtained in this case. Most
importantly, we also took unique advantage of AFM measurement, allowing the reuse of the
samples. In chapter 6, all the membranes were first characterized by AFM and then evaluated in
diffusion tests; therefore we can directly correlate the surface morphology with diffusive
permeability.
1 cm
B A
53
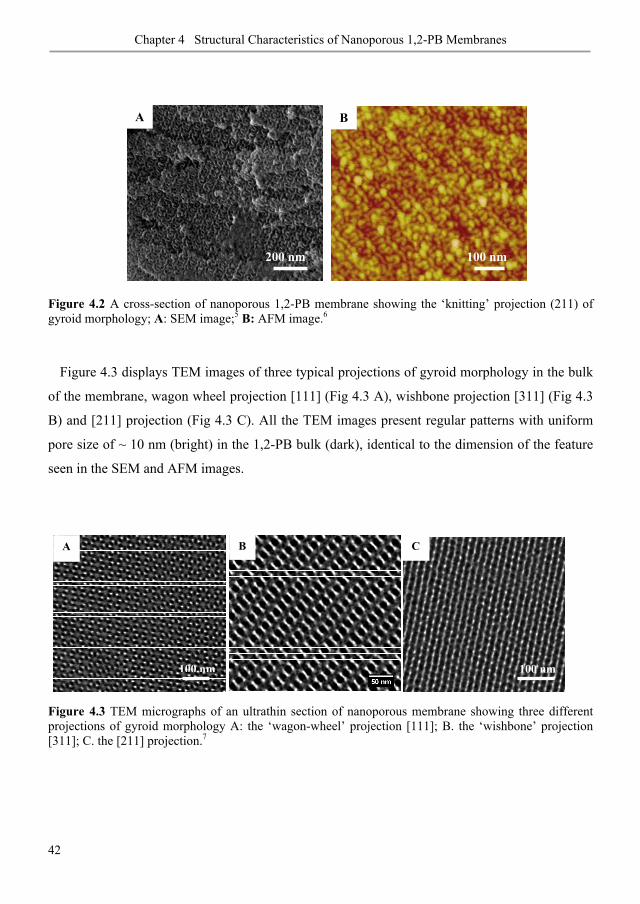
Chapter 4 Structural Characteristics of Nanoporous 1,2-PB Membranes
42
Figure 4.2 A cross-section of nanoporous 1,2-PB membrane showing the ‘knitting’ projection (211) of gyroid morphology; A: SEM image;5 B: AFM image.6
Figure 4.3 displays TEM images of three typical projections of gyroid morphology in the bulk
of the membrane, wagon wheel projection [111] (Fig 4.3 A), wishbone projection [311] (Fig 4.3
B) and [211] projection (Fig 4.3 C). All the TEM images present regular patterns with uniform
pore size of ~ 10 nm (bright) in the 1,2-PB bulk (dark), identical to the dimension of the feature
seen in the SEM and AFM images.
Figure 4.3 TEM micrographs of an ultrathin section of nanoporous membrane showing three different projections of gyroid morphology A: the ‘wagon-wheel’ projection [111]; B. the ‘wishbone’ projection [311]; C. the [211] projection.7
100 nm
B
200 nm
A
100 nm
C
100 nm
A B
54
Chapter 4 Structural Characteristics of Nanoporous 1,2-PB Membranes
43
4.2.2. Surface morphology
Much attention has been given in the last decades to the study of microphase separation in
block copolymers, since it is one of the most important factors imparting the physical and
mechanical properties unique to these systems. On the other hand, a great interest has been
generated in surface behavior of block copolymers, since surface is of critical importance in
many applications. A large amount of theoretical and experimental work has shown that the
surface may differ from the bulk in chemical composition and morphology.10 In thermodynamic
equilibrium, such block copolymer samples are generally terminated by a thin layer of the lower
surface energy block on the free surface and, therefore, exhibit a chemically homogeneous
surface. 11,12 The following results and discussion have been reported in the manuscript Gyroid
Nanoporous Membranes with Tunable Permeability published in ACS Nano2011.6
As we described in chapter 3.2, a 500 μm thick membrane was prepared by casting onto a
glass petri-dish under N2. During cross-linking, as the temperature increases from 20 ºC to 140
ºC the microphase in the film bulk (far away from the surface) is expected to transform from
lamellar (LAM) to gyroid (GYR) passing through the metastable hexagonally perforated layer
morphology (HPL).2 LAM is the stable structure at room temperature and GYR at 140 ºC.
Therefore a gyroid structure was captured in the film bulk after cross-linking as shown in Figs.
4.2 and 4.3. However, the outer surface morphology of the block copolymer film is dependent on
the interfacial energy between polymer and selected substrate. The SEM image in Figure 4.4 A
shows two distinct regions in the cross section near the free surface of the nanoporous film, a
dense thin layer, approximately 30 nm as highlighted by red lines and a uniform pattern of GYR
nanostructure beneath. This suggests that a dense skin layer may form on the polymer/nitrogen
interface (during cross-linking) of the nanoporous film. A top view of the free surface is further
visualized in Figure 4.4 B showing no visible pores at the surface. Figure 4.4 C shows a top view
of the edge at the free surface. A piece of ‘skin’ with the same closed surface as seen in Figure
4.4 B is partially peeled off from the surface. The surface beneath displays characteristic feature
of HPL morphology, which is the transient morphology between LAM and GYR.2 The periods
of both LAM and HPL for a 1,2-PB-b-PDMS sample similar to the precursor of this study are
~21 nm as determined by SAXS. 2 Therefore the observed average skin layer thickness is equal
to 1.5 periods of HPL (32 nm), or to one PB lamella and one period of HPL (34 nm). 2 In short,
55
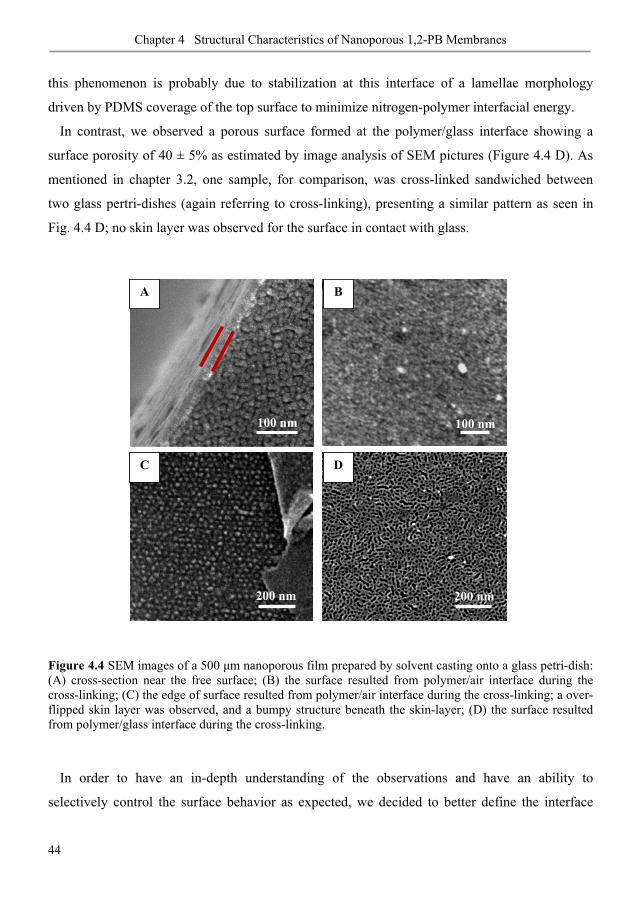
Chapter 4 Structural Characteristics of Nanoporous 1,2-PB Membranes
44
this phenomenon is probably due to stabilization at this interface of a lamellae morphology
driven by PDMS coverage of the top surface to minimize nitrogen-polymer interfacial energy.
In contrast, we observed a porous surface formed at the polymer/glass interface showing a
surface porosity of 40 ± 5% as estimated by image analysis of SEM pictures (Figure 4.4 D). As
mentioned in chapter 3.2, one sample, for comparison, was cross-linked sandwiched between
two glass pertri-dishes (again referring to cross-linking), presenting a similar pattern as seen in
Fig. 4.4 D; no skin layer was observed for the surface in contact with glass.
Figure 4.4 SEM images of a 500 m nanoporous film prepared by solvent casting onto a glass petri-dish: (A) cross-section near the free surface; (B) the surface resulted from polymer/air interface during the cross-linking; (C) the edge of surface resulted from polymer/air interface during the cross-linking; a over-flipped skin layer was observed, and a bumpy structure beneath the skin-layer; (D) the surface resulted from polymer/glass interface during the cross-linking.
In order to have an in-depth understanding of the observations and have an ability to
selectively control the surface behavior as expected, we decided to better define the interface
A
100 nm
B
100 nm
D
200 nm
C
200 nm
56
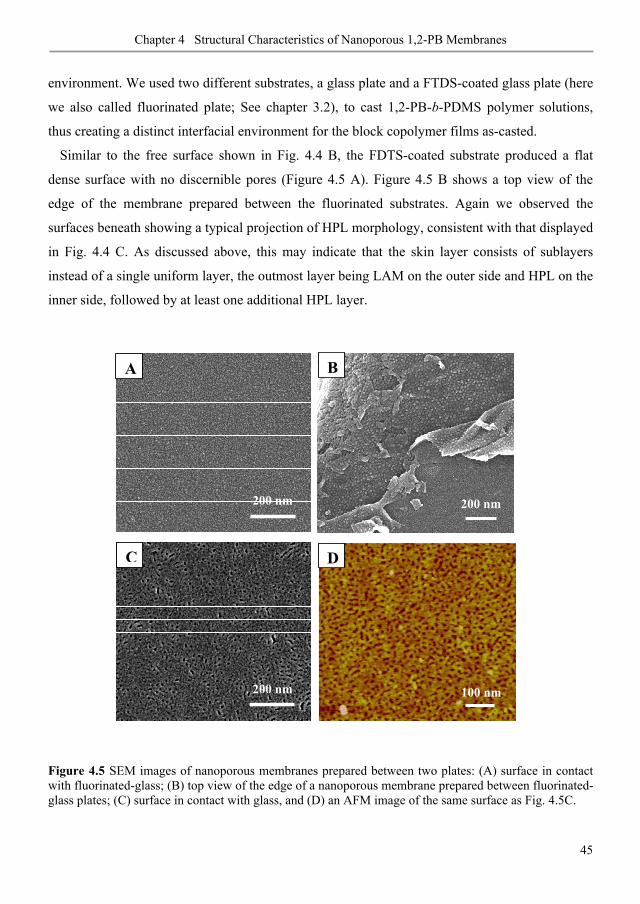
Chapter 4 Structural Characteristics of Nanoporous 1,2-PB Membranes
45
environment. We used two different substrates, a glass plate and a FTDS-coated glass plate (here
we also called fluorinated plate; See chapter 3.2), to cast 1,2-PB-b-PDMS polymer solutions,
thus creating a distinct interfacial environment for the block copolymer films as-casted.
Similar to the free surface shown in Fig. 4.4 B, the FDTS-coated substrate produced a flat
dense surface with no discernible pores (Figure 4.5 A). Figure 4.5 B shows a top view of the
edge of the membrane prepared between the fluorinated substrates. Again we observed the
surfaces beneath showing a typical projection of HPL morphology, consistent with that displayed
in Fig. 4.4 C. As discussed above, this may indicate that the skin layer consists of sublayers
instead of a single uniform layer, the outmost layer being LAM on the outer side and HPL on the
inner side, followed by at least one additional HPL layer.
Figure 4.5 SEM images of nanoporous membranes prepared between two plates: (A) surface in contact with fluorinated-glass; (B) top view of the edge of a nanoporous membrane prepared between fluorinated-glass plates; (C) surface in contact with glass, and (D) an AFM image of the same surface as Fig. 4.5C.
200 nm
BA
200 nm
200 nm
C D
100 nm
57
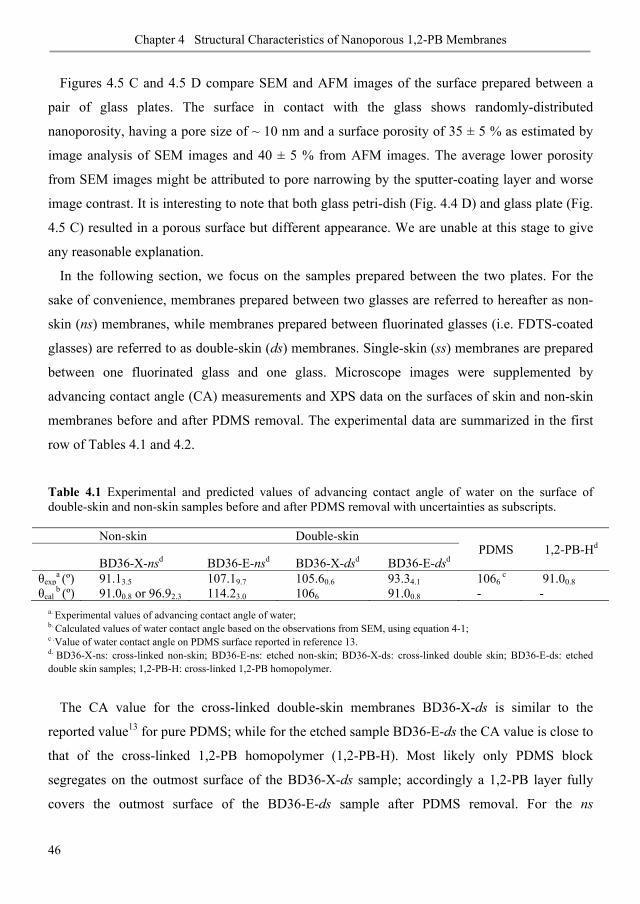
Chapter 4 Structural Characteristics of Nanoporous 1,2-PB Membranes
46
Figures 4.5 C and 4.5 D compare SEM and AFM images of the surface prepared between a
pair of glass plates. The surface in contact with the glass shows randomly-distributed
nanoporosity, having a pore size of ~ 10 nm and a surface porosity of 35 ± 5 % as estimated by
image analysis of SEM images and 40 ± 5 % from AFM images. The average lower porosity
from SEM images might be attributed to pore narrowing by the sputter-coating layer and worse
image contrast. It is interesting to note that both glass petri-dish (Fig. 4.4 D) and glass plate (Fig.
4.5 C) resulted in a porous surface but different appearance. We are unable at this stage to give
any reasonable explanation.
In the following section, we focus on the samples prepared between the two plates. For the
sake of convenience, membranes prepared between two glasses are referred to hereafter as non-
skin (ns) membranes, while membranes prepared between fluorinated glasses (i.e. FDTS-coated
glasses) are referred to as double-skin (ds) membranes. Single-skin (ss) membranes are prepared
between one fluorinated glass and one glass. Microscope images were supplemented by
advancing contact angle (CA) measurements and XPS data on the surfaces of skin and non-skin
membranes before and after PDMS removal. The experimental data are summarized in the first
row of Tables 4.1 and 4.2.
Table 4.1 Experimental and predicted values of advancing contact angle of water on the surface of double-skin and non-skin samples before and after PDMS removal with uncertainties as subscripts.
Non-skin Double-skin PDMS 1,2-PB-Hd
BD36-X-nsd BD36-E-nsd BD36-X-dsd BD36-E-dsd exp
a (º) 91.13.5 107.19.7 105.60.6 93.34.1 1066
c 91.00.8 cal
b (º) 91.00.8 or 96.92.3 114.23.0 1066 91.00.8 - -
a. Experimental values of advancing contact angle of water; b. Calculated values of water contact angle based on the observations from SEM, using equation 4-1; c .Value of water contact angle on PDMS surface reported in reference 13. d. BD36-X-ns: cross-linked non-skin; BD36-E-ns: etched non-skin; BD36-X-ds: cross-linked double skin; BD36-E-ds: etched double skin samples; 1,2-PB-H: cross-linked 1,2-PB homopolymer.
The CA value for the cross-linked double-skin membranes BD36-X-ds is similar to the
reported value13 for pure PDMS; while for the etched sample BD36-E-ds the CA value is close to
that of the cross-linked 1,2-PB homopolymer (1,2-PB-H). Most likely only PDMS block
segregates on the outmost surface of the BD36-X-ds sample; accordingly a 1,2-PB layer fully
covers the outmost surface of the BD36-E-ds sample after PDMS removal. For the ns
58

Chapter 4 Structural Characteristics of Nanoporous 1,2-PB Membranes
47
membranes, the water contact angle increased from the cross linked sample BD36-X-ns to the
etched sample BD36-E-ns. This might be due to the porous surface (Fig. 4.5 D) of the etched
sample where air-filled nanopores lower the surface energy. We compared the obtained CA
values with predictions by Cassie’s equation,14 using the information of surface porosity from the
AFM images (See Fig 4.5 D).
cos cos cos (4-1)p A A B Bf fθ θ θ= +
where pθ is the water contact angle of the surface made of A and B. Af and Bf are surface
fractions of component A and B, respectively. In our case, A is 1,2-PB; B is PDMS for the cross-
linked samples or air for the etched samples. The calculated values are given in the second row
of Table 4.1. For the BD36-X-ns sample, there are two possibilities, either (1) the outmost
surface is covered by a layer of pure 1,2-PB, then the calculated CA value is 91.0º; or (2) a CA
value of 96.9 ± 2.3 º can be calculated assuming coexistence of 1,2-PB and PDMS on the surface
with the same concentration of PDMS as the surface porosity of the etched sample (40 ± 5 %
PDMS). XPS analysis favors this latter scenario (to be addressed later). It’s also possible that
some slight surface oxidation is present on the outermost PB layer, which may lower the contact
angle of PB, accidentally lowering the overall contact angle close to that of pure 1,2-PB. After
PDMS removal, the BD36-E-ns sample shows a porous surface with surface porosity of 40 ± 5
% consistent with a calculated CA value of 114.2 ± 3.0º.
For the BD36-X-ds sample, the observed value is consistent with a surface fully covered by
PDMS (106º) 13. The enrichment of PDMS on the surface in contact with fluorinated glass is
driven by minimization of interfacial energy. A CA value of 91º, equal to that of pure 1,2-PB, is
predicted for the BD36-E-ds sample based on the non porous surface revealed by the SEM image
in Fig. 4.5 A combined with the quantitative removal of PDMS in the etching process.
The surface composition of the skin and non-skin samples was further assessed by XPS
measurements. The surface composition was studied by XPS analyses at takeoff angle of 90° on
skin and non-skin samples before and after PDMS removal. The results on the atomic abundance
of C and Si in the skin and non-skin samples are summarized in Table 4.2.
First, all the etched samples show Si concentrations close to zero, consistent with the complete
removal of PDMS. The cross-linked non-skin sample show Si/C atomic ratio of 10.1%, close to
the ratio of 9.9% predicted for the cross-linked sample with a surface composition equal to that
59
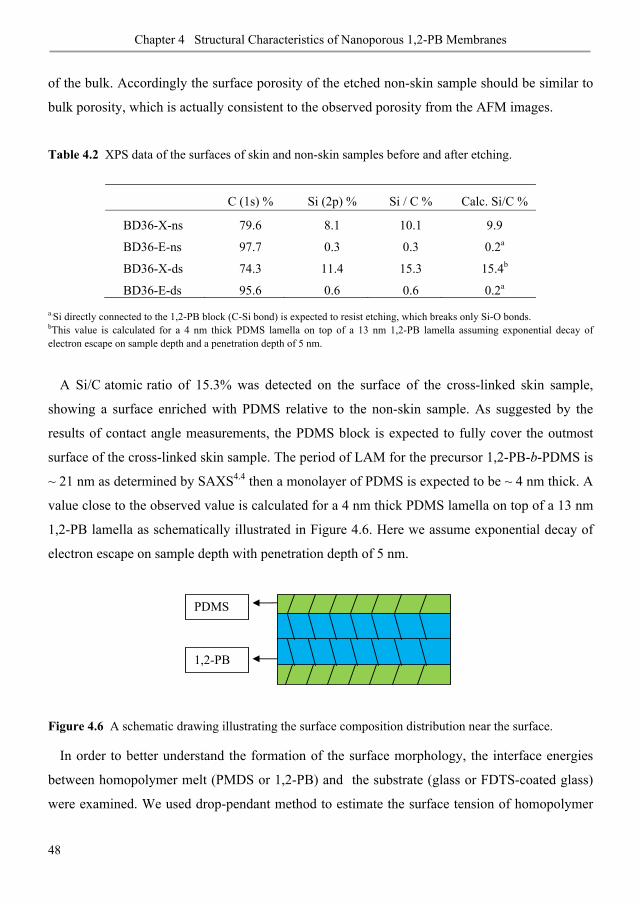
Chapter 4 Structural Characteristics of Nanoporous 1,2-PB Membranes
48
of the bulk. Accordingly the surface porosity of the etched non-skin sample should be similar to
bulk porosity, which is actually consistent to the observed porosity from the AFM images.
Table 4.2 XPS data of the surfaces of skin and non-skin samples before and after etching.
a.Si directly connected to the 1,2-PB block (C-Si bond) is expected to resist etching, which breaks only Si-O bonds. bThis value is calculated for a 4 nm thick PDMS lamella on top of a 13 nm 1,2-PB lamella assuming exponential decay of electron escape on sample depth and a penetration depth of 5 nm.
A Si/C atomic ratio of 15.3% was detected on the surface of the cross-linked skin sample,
showing a surface enriched with PDMS relative to the non-skin sample. As suggested by the
results of contact angle measurements, the PDMS block is expected to fully cover the outmost
surface of the cross-linked skin sample. The period of LAM for the precursor 1,2-PB-b-PDMS is
~ 21 nm as determined by SAXS4.4 then a monolayer of PDMS is expected to be ~ 4 nm thick. A
value close to the observed value is calculated for a 4 nm thick PDMS lamella on top of a 13 nm
1,2-PB lamella as schematically illustrated in Figure 4.6. Here we assume exponential decay of
electron escape on sample depth with penetration depth of 5 nm.
Figure 4.6 A schematic drawing illustrating the surface composition distribution near the surface.
In order to better understand the formation of the surface morphology, the interface energies
between homopolymer melt (PMDS or 1,2-PB) and the substrate (glass or FDTS-coated glass)
were examined. We used drop-pendant method to estimate the surface tension of homopolymer
C (1s) % Si (2p) % Si / C % Calc. Si/C %
BD36-X-ns 79.6 8.1 10.1 9.9
BD36-E-ns 97.7 0.3 0.3 0.2a
BD36-X-ds 74.3 11.4 15.3 15.4b
BD36-E-ds 95.6 0.6 0.6 0.2a
PDMS
1,2-PB
60
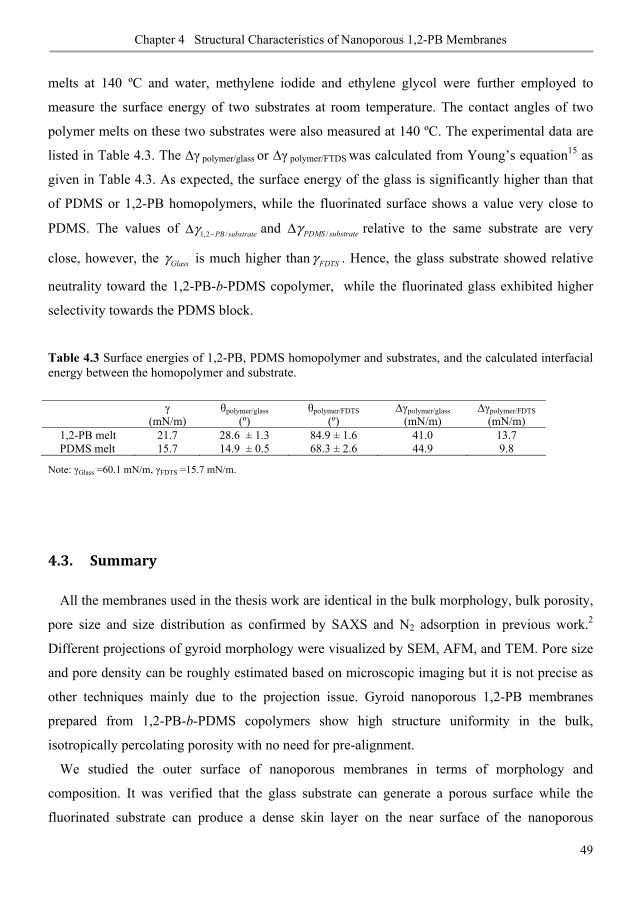
Chapter 4 Structural Characteristics of Nanoporous 1,2-PB Membranes
49
melts at 140 ºC and water, methylene iodide and ethylene glycol were further employed to
measure the surface energy of two substrates at room temperature. The contact angles of two
polymer melts on these two substrates were also measured at 140 ºC. The experimental data are
listed in Table 4.3. The polymer/glass or polymer/FTDS was calculated from Young’s equation15 as
given in Table 4.3. As expected, the surface energy of the glass is significantly higher than that
of PDMS or 1,2-PB homopolymers, while the fluorinated surface shows a value very close to
PDMS. The values of 1,2 /PB substrateγ −Δ and /PDMS substrateγΔ relative to the same substrate are very
close, however, the Glassγ is much higher than FDTSγ . Hence, the glass substrate showed relative
neutrality toward the 1,2-PB-b-PDMS copolymer, while the fluorinated glass exhibited higher
selectivity towards the PDMS block.
Table 4.3 Surface energies of 1,2-PB, PDMS homopolymer and substrates, and the calculated interfacial energy between the homopolymer and substrate.
Note: Glass =60.1 mN/m, FDTS =15.7 mN/m.
4.3. Summary
All the membranes used in the thesis work are identical in the bulk morphology, bulk porosity,
pore size and size distribution as confirmed by SAXS and N2 adsorption in previous work.2
Different projections of gyroid morphology were visualized by SEM, AFM, and TEM. Pore size
and pore density can be roughly estimated based on microscopic imaging but it is not precise as
other techniques mainly due to the projection issue. Gyroid nanoporous 1,2-PB membranes
prepared from 1,2-PB-b-PDMS copolymers show high structure uniformity in the bulk,
isotropically percolating porosity with no need for pre-alignment.
We studied the outer surface of nanoporous membranes in terms of morphology and
composition. It was verified that the glass substrate can generate a porous surface while the
fluorinated substrate can produce a dense skin layer on the near surface of the nanoporous
(mN/m)
polymer/glass (º)
polymer/FDTS (º)
polymer/glass (mN/m)
polymer/FDTS (mN/m)
1,2-PB melt 21.7 28.6 ± 1.3 84.9 ± 1.6 41.0 13.7 PDMS melt 15.7 14.9 ± 0.5 68.3 ± 2.6 44.9 9.8
61
Chapter 4 Structural Characteristics of Nanoporous 1,2-PB Membranes
50
membrane. As previously reported, 11,12,16,17 if one component of any binary fluid mixture has a
lower surface energy than the other then the system as a whole may save free energy by having
the free surface enriched by the lower surface energy component which is higher than the bulk
composition. On the other hand, there is a free energy cost associated with creating a surface
layer with a different composition as the bulk; an additional unfavorable free energy is also
associated with the interface between the surface layer and the bulk material. The equilibrium
surface composition and morphology are given by the minimization of the overall system free
energy. In our case, the glass substrate showed relative preference toward the 1,2-PB block
whereas the fluorinated glass exhibited higher selectivity towards the PDMS block, as confirmed
by surface energy measurements. For the cross-linked block copolymer film prepared between
the fluorinated substrates, lamellae morphology is stabilized at this interface driven by PDMS
coverage of the top surface to minimize the interfacial energy between the polymer and the
fluorinated surface. A HPL layer was formed beneath the outmost LAM layer and was linked
down to the GYR bulk. After selectively removal of PDMS, the skin layer on the nanoporous
membrane is a layer of the cross-linked 1,2-PB with coexistence of the LAM and the HPL
morphologes in series from the outmost surface.
We can selectively pattern the self-assembled architecture through suitable choice of substrates
in the process of membrane fabrication. This in turn significantly affects the membrane
permeation and separation as they will be demonstrated in the following chapters.
4.4. References
[1] Guo, F.; Andreasen, J. W.; Vigild, M. E.; Ndoni, S. Influence of 1,2-PB Matrix Cross-linking on Structure and Properties of Sselectively Etched 1,2-PB-b-PDMS Block Copolymers. Macromolecules 2007, 40(10), 3669-3675.
[2] Schulte, L.; Grydgaard, A.; Jakobsen, M. R.; Szewczykowski, P. P.; Guo, F.; Vigild, M. E.; Berg, R. H.; Ndoni, S. Nanoporous Materials from Stable and Metastable Structures of 1,2-PB-b-PDMS Block Copolymers. Polymer 2011, 52, 422.
[3] Jakobsen, M. R.; Grydgaard, A Characterization of Nano Cavities in Polymeric Materials, B.Sc. Thesis. Technical University of Denmark, 2006.
[4] Gaines, G. L. Surface and Interfacial Tension of Polymer Liquids. Polymer Engineering and Science 1972, 12, 1–11.
62

Chapter 4 Structural Characteristics of Nanoporous 1,2-PB Membranes
51
[5] Li, L.; Szewczykowski, P.; Clausen, L. D.; Hansen, K. M.; Jonsson, G. E.; Ndoni, S. Ultrafiltration by Gyroid Nanoporous Polymer Membranes. Journal of Membrane Science 2011, 384, 126-135.
[6] Li, L.; Schulte, L.; Clausen, L. D.; Hansen, K. M.; Jonsson, G. E.; Ndoni, S. Gyroid Nanoporous Membranes with Tunable Permeability. ACS Nano 2011, 5 (10), 7754 – 7766.
[7] Li, L.; Wang, Y.W.; Vigild, M. E. Ndoni, S. Physisorption of SDS in a Hydrocarbon Nanoporous Polymer. Langmuir 2010, 26 (16), 13457–13465.
[8] Smuleac, V.; Butterfield, D. A.; and Bhattacharyya, D. Permeability and Separation Characteristics of Polypeptide-Functionalized Polycarbonate Track-Etched Membranes. Chem. Mater. 2004, 16, 2762-2771.
[9] West, P.; Starostina, N. A Guide to AFM Image Artifacts. http://os.tnw.utwente.nl/otonly/afm%20artifacts.pdf
[10] Bates, F. S. Block Copolymer Thermodynamics: Theory and Experiment. Annu. Rev. Phys. Chem. 1990, 41, 525–557.
[11] Binder, K. Acta Surface Effects on Polymer Blends and Block Copolymer Melts: Theoretical Concepts of Surface Enrichment, Surface Induced Phase Separation and Ordering. Polymer 1995, 46, 204-225.
[12] Jones, R.A.L., Kramer, E.J. The Surface Composition of Miscible Polymer Blends. Polymer 1993, 34, 115-118.
[13] Bodas, D.; Malek, C. K. Formation of More Stable Hydrophilic Surfaces of PDMS by Plasma and Chemical Treatments. Microelectronic Engineering 2006, 83, 1277–1279.
[14] Cassie, A. B. D.; Baxter, S. Wettability of Porous Surfaces. Faraday Soc. 1944, 40, 546–551.
[15] Chow, T. S. Wetting of Rough Surfaces. Journal of Physics: Condensed Matter 1998, 10, L445.
[16] Hasegawa, H. and Hashimotot ,T. Morphology of Block Copolymers and Mixtures of Block Copolymers at Free Surfaces. Polymer 1992, 33, 475-487.
[17] Mansky, P.; Russell, T. P.; Hawker, C. J.; Pitsikalis, M.; Mays, J. Ordered Diblock Copolymer Films on Random Copolymer Brushes. Macromolecules 1997, 30, 6810-6813.
63

Chapter 4 Structural Characteristics of Nanoporous 1,2-PB Membranes
52
64

Chapter 5 Gas Permeation and Liquid Flow
53
Chapter 5 Gas Permeation and Liquid Flow across Nanoporous 1,2-PB Membranes
The previous chapter discussed structural characteristics of gyroid nanoporous membranes as
demonstrated by microscopy techniques. This chapter will play a role of linking the previous
chapter and the succeeding ones. Here, we focus on the study of the gas permeation and liquid
flow in nanoporous 1,2-PB membranes. We limit our efforts to the non-skin thin membranes
(See chapters 3.2 & 4.2.2) in this chapter. The aim is to carry on the demonstration of pore
structure, e.g. pore size and tortuosity, and address the transport behavior of gas and liquid in the
gyroid nanoporous membranes. This part will thus provide useful information for studying the
ultrafiltration property as further presented in chapter 7. The work presented in this chapter has
been reported in the manuscript Ultrafiltration by Gyroid Nanoporous Polymer Membranes
published in Journal of Membrane Science 2011.
5.1. Background
As described in chapter 1.1, nanoporous membranes refer to the porous materials with average
pore diameter in the 2 – 100 nm range. Prior to discussing the results for our nanoporous
membranes, we first briefly review several theories for transport through porous membranes.
These theories help to guide our interpretation and understanding of the experimental results for
the membranes discussed in this chapter.
5.1.1. Gas diffusion in nanoporous membranes
Both porous and dense membranes can be used as selective gas separation barriers as
illustrated in Figure 5.1. The gas permeation in dense membranes is often described by solution-
diffusion model.1 Our non-skin membrane without a dense top layer is certainly in the range of
porous membranes. In small nanopores, the mechanism of gas permeation can be dramatically
different, depending on the Knudsen number, i.e., the ratio of the mean-free path to the pore
65

Chapter 5 Gas Permeation and Liquid Flow
54
diameter ( / r).2 If the membrane pores are extremely small, of the order 5 – 20 Å, then gases
are separated by molecular sieving. Transport through this type of membrane is complex and
includes both diffusion in the gas phase and diffusion of adsorbed species on the surface of the
pores (surface diffusion). If the pores are relatively large, i.e. from 0.1 to 10 m, the mean-free
path is much smaller than the pore size. In this region, diffusion is the result of random collisions
between different molecules. Gases permeate the membrane by convective flow as described by
Poiseuille’s law 2 (equation 5-1), and no separation occurs. 2 [ ][ ] (5-1)
8o l o lP P P PrJ
l RTε
η− +=
⋅
where J is the gas flux across the membrane of pore radius r and thickness l under a pressure
difference [ ]o lP P− ; ε is the porosity; is the viscosity of the gas. R is gas constant and T is
temperature. The difference from Poiseuille equation for liquids (See equation 5-6) is the
additional term [Po+Pl] which arises from the expansion of a gas as it moves down the pressure
gradient.
Figure 5.1 Mechanisms for permeation of gases through porous and dense gas separation membranes.2
If the pores become comparable with the mean free path of the gas molecules, diffusing gas
molecules then have more collision with pore walls than with other gas molecules. Diffusion
through such pores is governed by Knudsen diffusion.1-3 The gas flow in a membrane for
Knudsen diffusion is given by equation 5-2,
66
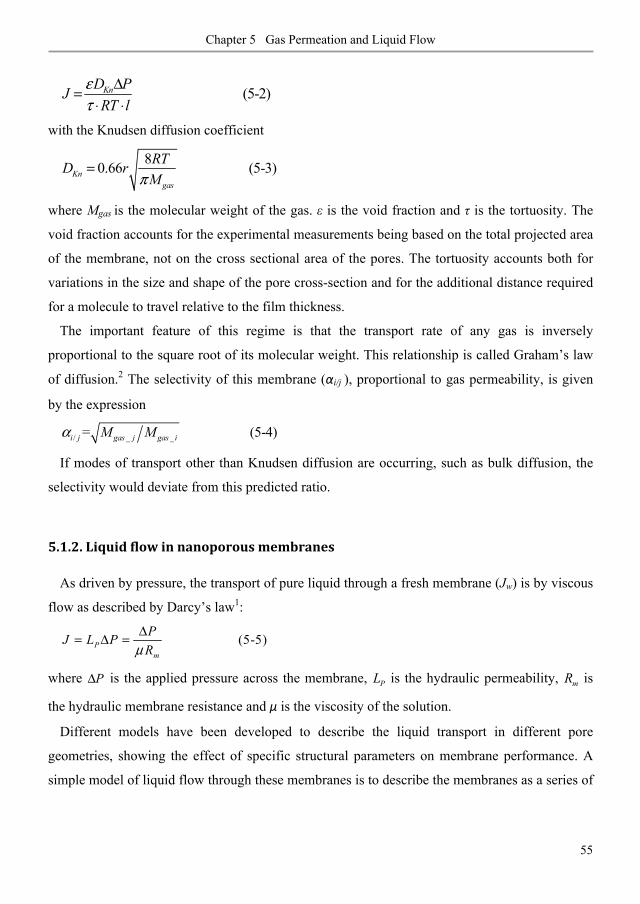
Chapter 5 Gas Permeation and Liquid Flow
55
(5-2)KnD PJRT l
ετ
Δ=⋅ ⋅
with the Knudsen diffusion coefficient
80.66 (5-3)Kngas
RTD rMπ
=
where Mgas is the molecular weight of the gas. is the void fraction and is the tortuosity. The
void fraction accounts for the experimental measurements being based on the total projected area
of the membrane, not on the cross sectional area of the pores. The tortuosity accounts both for
variations in the size and shape of the pore cross-section and for the additional distance required
for a molecule to travel relative to the film thickness.
The important feature of this regime is that the transport rate of any gas is inversely
proportional to the square root of its molecular weight. This relationship is called Graham’s law
of diffusion.2 The selectivity of this membrane ( i/j ), proportional to gas permeability, is given
by the expression
/ _ _= (5-4)i j gas j gas iM Mα
If modes of transport other than Knudsen diffusion are occurring, such as bulk diffusion, the
selectivity would deviate from this predicted ratio.
5.1.2. Liquid flow in nanoporous membranes
As driven by pressure, the transport of pure liquid through a fresh membrane (Jw) is by viscous
flow as described by Darcy’s law1:
(5-5)Pm
PJ L PRμ
Δ= Δ =
where PΔ is the applied pressure across the membrane, PL is the hydraulic permeability, mR is
the hydraulic membrane resistance and μ is the viscosity of the solution.
Different models have been developed to describe the liquid transport in different pore
geometries, showing the effect of specific structural parameters on membrane performance. A
simple model of liquid flow through these membranes is to describe the membranes as a series of
67
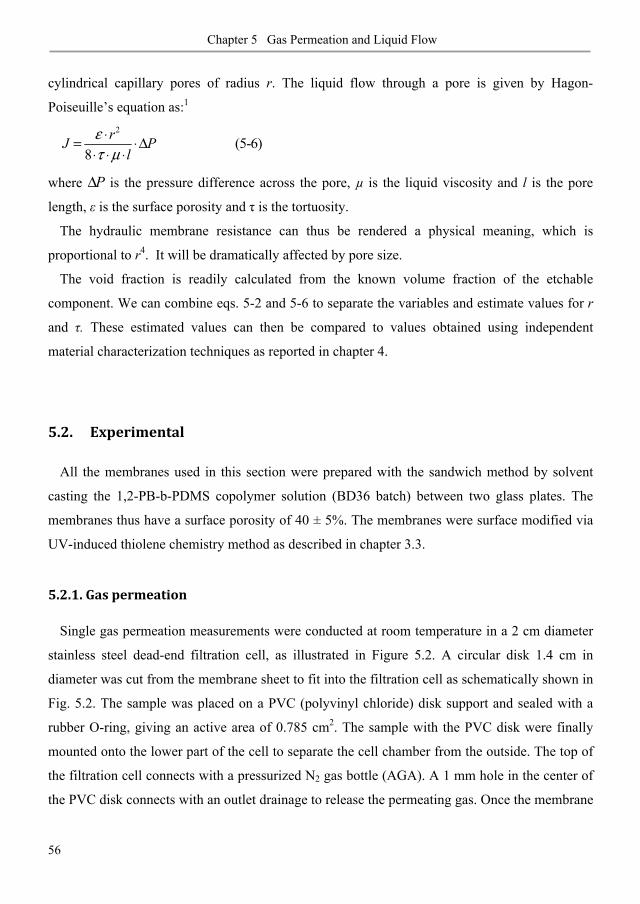
Chapter 5 Gas Permeation and Liquid Flow
56
cylindrical capillary pores of radius r. The liquid flow through a pore is given by Hagon-
Poiseuille’s equation as:1 2
(5-6) 8
rJ Pl
ετ μ
⋅= ⋅Δ⋅ ⋅ ⋅
where PΔ is the pressure difference across the pore, μ is the liquid viscosity and l is the pore
length, is the surface porosity and is the tortuosity.
The hydraulic membrane resistance can thus be rendered a physical meaning, which is
proportional to r4. It will be dramatically affected by pore size.
The void fraction is readily calculated from the known volume fraction of the etchable
component. We can combine eqs. 5-2 and 5-6 to separate the variables and estimate values for r
and . These estimated values can then be compared to values obtained using independent
material characterization techniques as reported in chapter 4.
5.2. Experimental
All the membranes used in this section were prepared with the sandwich method by solvent
casting the 1,2-PB-b-PDMS copolymer solution (BD36 batch) between two glass plates. The
membranes thus have a surface porosity of 40 ± 5%. The membranes were surface modified via
UV-induced thiolene chemistry method as described in chapter 3.3.
5.2.1. Gas permeation
Single gas permeation measurements were conducted at room temperature in a 2 cm diameter
stainless steel dead-end filtration cell, as illustrated in Figure 5.2. A circular disk 1.4 cm in
diameter was cut from the membrane sheet to fit into the filtration cell as schematically shown in
Fig. 5.2. The sample was placed on a PVC (polyvinyl chloride) disk support and sealed with a
rubber O-ring, giving an active area of 0.785 cm2. The sample with the PVC disk were finally
mounted onto the lower part of the cell to separate the cell chamber from the outside. The top of
the filtration cell connects with a pressurized N2 gas bottle (AGA). A 1 mm hole in the center of
the PVC disk connects with an outlet drainage to release the permeating gas. Once the membrane
68
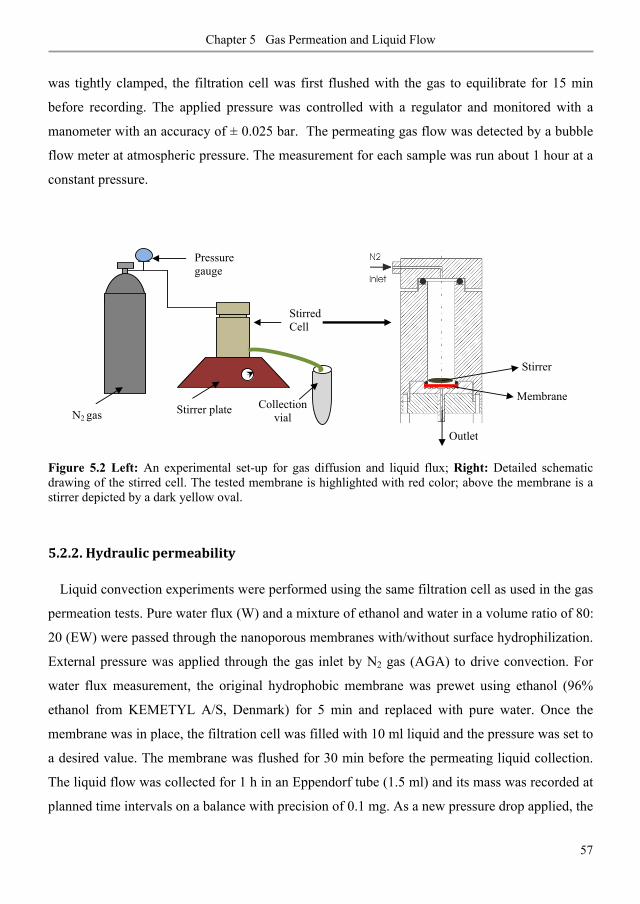
Chapter 5 Gas Permeation and Liquid Flow
57
was tightly clamped, the filtration cell was first flushed with the gas to equilibrate for 15 min
before recording. The applied pressure was controlled with a regulator and monitored with a
manometer with an accuracy of ± 0.025 bar. The permeating gas flow was detected by a bubble
flow meter at atmospheric pressure. The measurement for each sample was run about 1 hour at a
constant pressure.
Figure 5.2 Left: An experimental set-up for gas diffusion and liquid flux; Right: Detailed schematic drawing of the stirred cell. The tested membrane is highlighted with red color; above the membrane is a stirrer depicted by a dark yellow oval.
5.2.2. Hydraulic permeability
Liquid convection experiments were performed using the same filtration cell as used in the gas
permeation tests. Pure water flux (W) and a mixture of ethanol and water in a volume ratio of 80:
20 (EW) were passed through the nanoporous membranes with/without surface hydrophilization.
External pressure was applied through the gas inlet by N2 gas (AGA) to drive convection. For
water flux measurement, the original hydrophobic membrane was prewet using ethanol (96%
ethanol from KEMETYL A/S, Denmark) for 5 min and replaced with pure water. Once the
membrane was in place, the filtration cell was filled with 10 ml liquid and the pressure was set to
a desired value. The membrane was flushed for 30 min before the permeating liquid collection.
The liquid flow was collected for 1 h in an Eppendorf tube (1.5 ml) and its mass was recorded at
planned time intervals on a balance with precision of 0.1 mg. As a new pressure drop applied, the
Membrane
Stirrer
N2 gas Stirrer plate
Pressure gauge
Stirred Cell
Collection vial
Outlet
69

Chapter 5 Gas Permeation and Liquid Flow
58
liquid flow was stabilized for 15 min before the sample collection. Hydraulic permeability was
evaluated from the slope of experimental data of the flux (Jw) as a function of the applied
pressure drop ( P) as described by eq.5-5.
5.3. Results and discussion
5.3.1. Gas permeation
Typical data of H2, N2, and CO2 flow through the original nanoporous membranes are shown
in Figure 5.3 as function of applied pressure. The membrane thickness was 25 2 μm. The
reproducibility of the same membrane sample and the variation among different membranes of
the same thickness were within ± 5%. As expected, the permeation rate of H2 was greater than
N2, which was in turn greater than CO2.
Figure 5.3 Gas permeation vs. pressure. The thickness of membranes was normalized to 25 μm. The solid lines are linear fits of experimental data.
The occurrence of convection flow or Knudsen flow in a pore is mainly determined by the
ratio of pore size relative to mean free path of the diffusing gas molecules.2 At atmospheric
pressure the mean free path of common gases is in the range of 50 – 200 nm.2 It is larger than the
pore size (~ 10 nm) of the nanoporous membranes. The diffusing gas molecules then have more
frequent collisions with the pore walls than with other gas molecules. Knudsen diffusion is
therefore expected to be the dominant mechanism for the gas permeation in the nanoporous
0.0 0.5 1.0 1.5 2.0 2.5 3.00.00
0.02
0.04
0.06
0.08
0.10
0.12
0.14
H2 N2 CO2
flux
(m3 m
-2s-1
)
pressure (bar)
70

Chapter 5 Gas Permeation and Liquid Flow
59
membranes. In this regime, the gas flow in a membrane is given by eq.5-2; the Knudsen
diffusion coefficient can be calculated by eq. 5-3.
Table 5.1 summarizes the experimental diffusion coefficient
_ expKnD from eq.5-2, using the
slope of gas flux vs. applied pressure in Fig. 5.3. Values of theoretical diffusion coefficient
_Kn theoryD for each gas calculated from eq. 5-3 are also listed in Table 5.1 for a comparison.
Table 5.1 Comparison of experimental and theoretical data of gas diffusion coefficient.
Gas DKn_theory a,b
(x10-6 m2s-1) DKn_exp
b
(x10-6 m2s-1) i_Poiseuille i_Kn i_exp
H2 5.81 5.52 1.00 1.00 1.00 N2 1.55 1.52 2.00 3.75 3.63
CO2 1.24 1.22 1.69 4.69 4.52 a, b. assume r = 4.95 nm. b. assume = 1.95, = 0.39. The variation of gas diffusion is within ± 5%.
Here porosity ε = 0.39 is determined by volume fraction of PDMS block in the precursor 1,2-
PB-b-PDMS. We assume tortuosity τ = 1.95, and pore radius r = 4.95 nm (to be addressed
later). The values of _ expKnD are very close to the values of _K n theoryD for each gas tested. The
selectivity _ expiα for the gas relative to H2 found from experiments is similar within 5% to _i K nα
calculated for Knudsen diffusion from eq. 5-3, showing the molecular weight dependence, i.e.
(1/Mgas)½ . In addition, _ expiα shows a big difference from _i Poiseuilleα (3rd data column in Table 5.1)
that was obtained for convective flow described by Poiseuille’s equation (eq. 5-1). Notably, the
order of selectivity for N2 and CO2 is wrongly predicted by Poiseuille’s flow but rightly
predicted by Knudsen diffusion. These findings definitely demonstrate that the gas permeation in
the nanoporous membranes occurred by Knudsen diffusion.
5.3.2. Liquid flow
Flux of pure water (W) or 80/20 (v/v) mixture of ethanol and water (EW) were measured for
the originally hydrophobic membranes (M) and the hydrophilized membranes (HM) (UV-
induced thiolene chemistry, see chapter 3.3). Figure 5.4 shows a plot of liquid flux versus
applied pressure across 25 2 μm thick membranes. The hydraulic permeability Lp is listed in
71

Chapter 5 Gas Permeation and Liquid Flow
60
Table 5.2, corresponding to the slope of linear fitting lines (Fig. 5.4) based on Darcy’s law, eq.
(5-5).
Figure 5.4 Liquid flux through hydrophobic membranes (M): water (W, close square) and a mixture of ethanol and water in volume ratio of 80: 20 (EW, close circle); liquid flux through hydrophilic membranes (HM): W (open square). Black lines are linear fittings to experimental data. Red line: use Hagen Pouiseuille equation to fit experimental data of water flux across the hydrophobic membrane (M+W). Here porosity = 0.39 and assume = 1.95 and r = 4.95 nm, equal to the gas permeation case (to be addressed later).
For the hydrophobic membranes, the water flux can be well described by the Hagen-Poiseuille
equation (eq.5-6) as shown in Fig. 5.4. In the Hagen-Poiseuille equation, the hydraulic
permeability Lp is related to membrane structure parameters, porosityε = 0.39, pore radius r =
4.95 nm, tortuosityτ = 1.95 (equal to the gas permeation case) and thickness l = 25 μm, as well
as liquid viscosityμ. The measured EW permeability is only 38% of the water permeability. Most
of the lower EW permeability can be explained by an increase of solvent viscosity. The viscosity
of EW (v/v 80:20) is twice as large as that of pure water.4 Other physical or chemical parameters,
such as surface tension or surface interaction could also give a contribution to the EW
permeability reduction.5,6
The hydrophilic membranes experienced a reduction in water permeability by a factor of ~ 2.5.
An effective pore size of r ~ 4 nm can be predicted from the dependence of Lp ~ r4 according to
the Hagen-Poiseuille equation. Firstly, the sulfonated grafting layer on the pore wall was roughly
4.5 Å with surface density 1.6 groups per nm7 as estimated from 12% mass increase after the
functionalization. This caused a direct reduction in the effective pore size.
0.0 0.2 0.4 0.6 0.8 1.0 1.2 1.4 1.60
1
2
3
4
5
M+WM+EWHM+WPoiseuille equation
flux
(x 1
0-6 m
3 m-2
s-1)
pressure (bar)
72
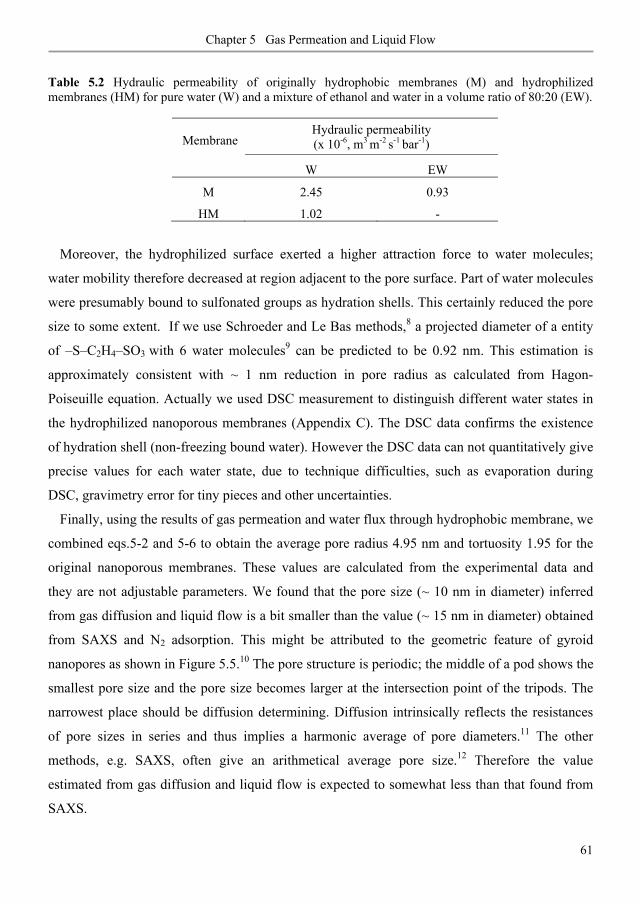
Chapter 5 Gas Permeation and Liquid Flow
61
Table 5.2 Hydraulic permeability of originally hydrophobic membranes (M) and hydrophilized membranes (HM) for pure water (W) and a mixture of ethanol and water in a volume ratio of 80:20 (EW).
Membrane Hydraulic permeability (x 10-6, m3 m-2 s-1 bar-1)
W EW
M 2.45 0.93
HM 1.02 -
Moreover, the hydrophilized surface exerted a higher attraction force to water molecules;
water mobility therefore decreased at region adjacent to the pore surface. Part of water molecules
were presumably bound to sulfonated groups as hydration shells. This certainly reduced the pore
size to some extent. If we use Schroeder and Le Bas methods,8 a projected diameter of a entity
of –S–C2H4–SO3 with 6 water molecules9 can be predicted to be 0.92 nm. This estimation is
approximately consistent with ~ 1 nm reduction in pore radius as calculated from Hagon-
Poiseuille equation. Actually we used DSC measurement to distinguish different water states in
the hydrophilized nanoporous membranes (Appendix C). The DSC data confirms the existence
of hydration shell (non-freezing bound water). However the DSC data can not quantitatively give
precise values for each water state, due to technique difficulties, such as evaporation during
DSC, gravimetry error for tiny pieces and other uncertainties.
Finally, using the results of gas permeation and water flux through hydrophobic membrane, we
combined eqs.5-2 and 5-6 to obtain the average pore radius 4.95 nm and tortuosity 1.95 for the
original nanoporous membranes. These values are calculated from the experimental data and
they are not adjustable parameters. We found that the pore size (~ 10 nm in diameter) inferred
from gas diffusion and liquid flow is a bit smaller than the value (~ 15 nm in diameter) obtained
from SAXS and N2 adsorption. This might be attributed to the geometric feature of gyroid
nanopores as shown in Figure 5.5.10 The pore structure is periodic; the middle of a pod shows the
smallest pore size and the pore size becomes larger at the intersection point of the tripods. The
narrowest place should be diffusion determining. Diffusion intrinsically reflects the resistances
of pore sizes in series and thus implies a harmonic average of pore diameters.11 The other
methods, e.g. SAXS, often give an arithmetical average pore size.12 Therefore the value
estimated from gas diffusion and liquid flow is expected to somewhat less than that found from
SAXS.
73
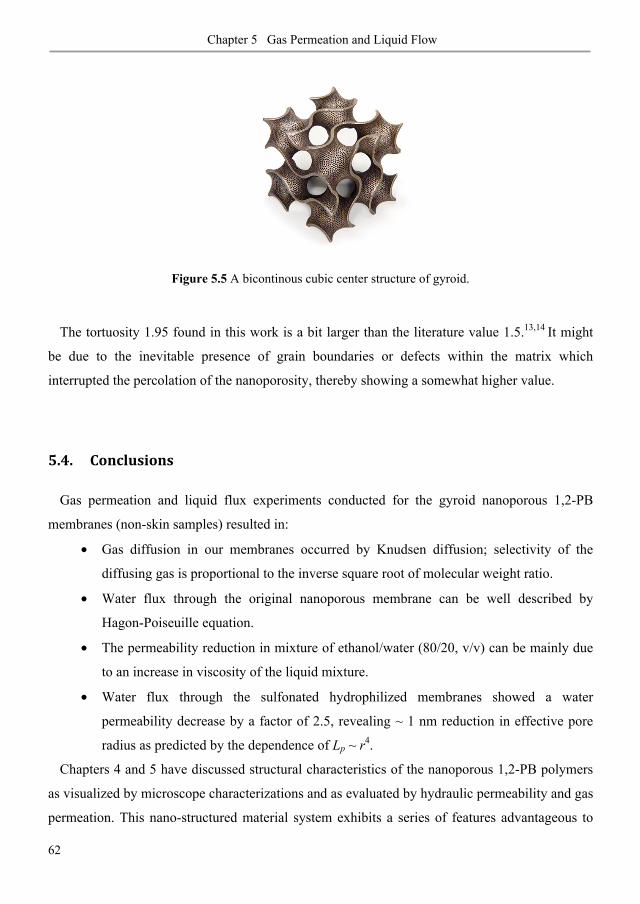
Chapter 5 Gas Permeation and Liquid Flow
62
Figure 5.5 A bicontinous cubic center structure of gyroid.
The tortuosity 1.95 found in this work is a bit larger than the literature value 1.5.13,14 It might
be due to the inevitable presence of grain boundaries or defects within the matrix which
interrupted the percolation of the nanoporosity, thereby showing a somewhat higher value.
5.4. Conclusions
Gas permeation and liquid flux experiments conducted for the gyroid nanoporous 1,2-PB
membranes (non-skin samples) resulted in:
• Gas diffusion in our membranes occurred by Knudsen diffusion; selectivity of the
diffusing gas is proportional to the inverse square root of molecular weight ratio.
• Water flux through the original nanoporous membrane can be well described by
Hagon-Poiseuille equation.
• The permeability reduction in mixture of ethanol/water (80/20, v/v) can be mainly due
to an increase in viscosity of the liquid mixture.
• Water flux through the sulfonated hydrophilized membranes showed a water
permeability decrease by a factor of 2.5, revealing ~ 1 nm reduction in effective pore
radius as predicted by the dependence of Lp ~ r4.
Chapters 4 and 5 have discussed structural characteristics of the nanoporous 1,2-PB polymers
as visualized by microscope characterizations and as evaluated by hydraulic permeability and gas
permeation. This nano-structured material system exhibits a series of features advantageous to
74

Chapter 5 Gas Permeation and Liquid Flow
63
various membrane applications, such as a uniform and controllable morphology, high
nanoporosity, narrow pore size distribution, large surface-volume ratio, and isotropic percolation
with no need for structure pre-alignment. At this point, we start to systematically explore the
membrane performance of nanoporous 1,2-PB polymer as a dialysis membrane (Chapter 6),
ultrafiltration membrane (Chapter 7) and controlled-release membrane (Chapter 8).
5.5. References and notes
[1] Mulder, M. Basic Principles of Membrane Technology, 2ed ed., Kluwer Academic, Netherlands 1996.
[2] Baker, R. W. Membrane Technology and Applications, 2nd ed., John Wiley& Sons, Ltd., Chichester, 2004.
[3] Cussler, E. L. In Diffusion, Mass Transfer in Fluid System. Cambridge University Press: New York, 2009
[4] ] Shukla, R.; Cheryan, M. Performance of Ultrafiltration Membranes in Ethanol–Water Solutions: Effect of Membrane Conditioning, J. Membr. Sci. 2002,198, 75–85.
[5] Machado, D. R.; Hasson, D.; Semiat, R. Effect of Solvent Properties on Permeate Flow through Nanofiltration Membranes. Part 1: Investigation of Parameters Affecting Solvent Flux, J. Membr. Sci. 1999, 163, 93–102.
[6] Zaidi, S. K.; Kumar, A. Effects of Ethanol Concentration on Flux and Gel Formation in Dead End Ultrafiltration of PEG and Dextran, J. Membr. Sci. 2004, 237 , 189–197.
[7] Surface modification grafts the pore surface with –S–C2H4–SO3 Na via UV-induced thio-lene chemistry. Gravimetry shows 12% mass gain after surface modification, indicating 7.36e-4 mol sulfonate group per unit gram of nanoporous membrane (The molar mass of –S–C2H4–SO3 Na is 163g/mol.). This corresponds to 1.6 group per nm2 surface area (Specific surface area of the nanoporous membrane is 280 m2/g, Avogadro number is 6.02e-23.).
[8] Poling, B. E.; Prausnitz, J. M. and O’Connell, J. P. The Properties of Gases and Liquids, Fifth Edition, McGraw-Hill, 2004.
[9] Helfferich, F. Ion exchange, Constable and Company, Ltd, London, 1995.
[10] http://www.bathsheba.com/math/gyroid/
[11] W. A. Phillip, B. O’Neill, M. Rodwogin, M. A. Hillmyer, E. L., Cussler, Self-assembled block copolymer thin films as water filtration membranes. Applied Materials & Interfaces 2010, 2, 847–853.
[12] Schulte, L.; Grydgaard, A.; Jakobsen, M. R.; Szewczykowski, P. P.; Guo, F.; Vigild, M. E.; Berg, R. H.; Ndoni, S. Nanoporous Materials from Stable and Metastable Structures of 1,2-PB-b-PDMS Block Copolymers. Polymer 2011, 52, 422.
75
Chapter 5 Gas Permeation and Liquid Flow
64
[13] Hamersky, M. W.; Hillmyer, M. A.; Tirrell, M. ; Bates, F. S. and Lodge, T. P. Block Copolymer Self-Diffusion in the Gyroid and Cylinder Morphologies. Macromolecules 1998, 31, 5363–5370.
[14] Milhaupt, J. M. and Lodge, T. P. Homopolymer and Small-Molecule Tracer Diffusion in a Gyroid Matrix. Journal of Polymer Science: Part B: Polymer Physics 2001, 39, 843–859.
76

Chapter 6 Dialysis Performance
65
Chapter 6 Dialysis Performance of Nanoporous 1,2-PB Membranes
As briefly reviewed in Introduction chapter (chapter 2.3), membrane technology has been
realized as a useful tool in biosensor applications.1 The role of the polymer membranes and the
physical properties required intimately rely on the requirements of different types of sensors. Our
interest is to develop a diffusion-restricting outer membrane for use in amperometric glucose
biosensors. This chapter will focus on the fundamental work on diffusive transport property of
nanoporous 1,2-PB polymers as permselective dialysis membranes. Understanding the diffusive
permeability properties of the membranes is facilitated by using materials and procedures that
allow high degree of control on morphology, substrate-directing surface structure, and tunable
active porosity via selectively hydrophilic pattern. This part of work has been reported in the
manuscript Gyroid Nanoporous Membranes with Tunable Permeability published in ACS Nano
2011. The second part of the chapter reports the extended work on evaluation of the performance
of the nanoporous 1,2-PB membrane (NPM) in an amperometric glucose sensor. Some
problematic issues will be discussed.
77
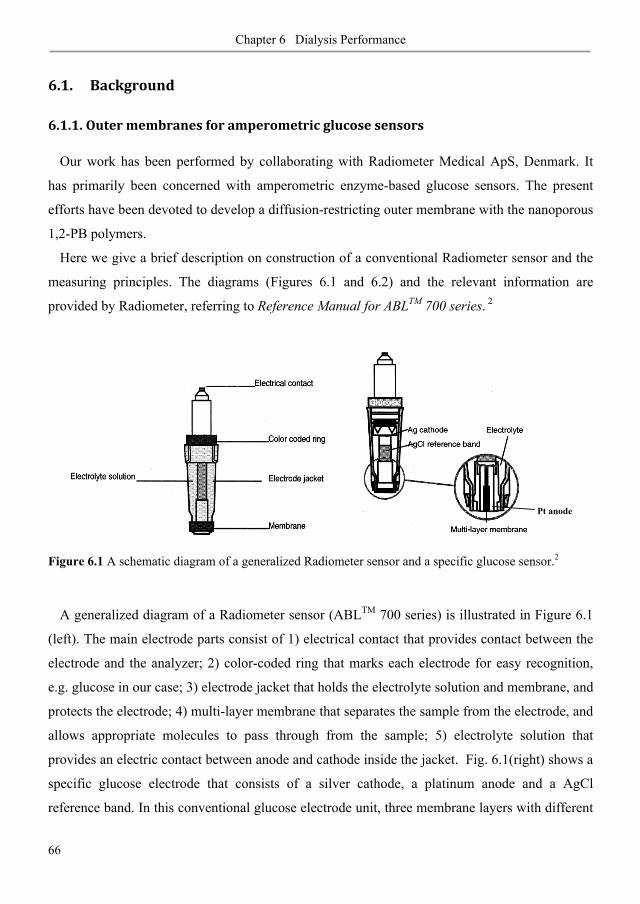
Chapter 6 Dialysis Performance
66
6.1. Background
6.1.1. Outer membranes for amperometric glucose sensors
Our work has been performed by collaborating with Radiometer Medical ApS, Denmark. It
has primarily been concerned with amperometric enzyme-based glucose sensors. The present
efforts have been devoted to develop a diffusion-restricting outer membrane with the nanoporous
1,2-PB polymers.
Here we give a brief description on construction of a conventional Radiometer sensor and the
measuring principles. The diagrams (Figures 6.1 and 6.2) and the relevant information are
provided by Radiometer, referring to Reference Manual for ABLTM 700 series. 2
Figure 6.1 A schematic diagram of a generalized Radiometer sensor and a specific glucose sensor.2
A generalized diagram of a Radiometer sensor (ABLTM 700 series) is illustrated in Figure 6.1
(left). The main electrode parts consist of 1) electrical contact that provides contact between the
electrode and the analyzer; 2) color-coded ring that marks each electrode for easy recognition,
e.g. glucose in our case; 3) electrode jacket that holds the electrolyte solution and membrane, and
protects the electrode; 4) multi-layer membrane that separates the sample from the electrode, and
allows appropriate molecules to pass through from the sample; 5) electrolyte solution that
provides an electric contact between anode and cathode inside the jacket. Fig. 6.1(right) shows a
specific glucose electrode that consists of a silver cathode, a platinum anode and a AgCl
reference band. In this conventional glucose electrode unit, three membrane layers with different
Pt anode
78

Chapter 6 Dialysis Performance
67
functionality are assembled as a multi-layer membrane and mounted at the tip of the jacket
surrounding the electrode. Close to the Pt anode is an inner membrane (IM). It is made of
cellulose acetate) which is permeable to H2O2 and eliminates interferences as e.g. paracetamol.
The middle enzyme layer (EM) composes of glucose oxidase with stabilizers. On the top of the
multi-layer membrane is an outer membrane (OM), limiting the throughput of glucose. Enzymes
inherently have a maximum rate at which they can catalyze a reaction. If the enzyme is saturated,
the rate of reaction is not any longer proportional to the substrate concentration. By placing a
diffusion limiting membrane over the enzyme electrode it is possible to increase the external
substrate concentration while the rate of reaction is still proportional to the substrate
concentration. This is referred to as increased linear range and relies on a decreasing
concentration gradient across the membrane. In addition, the outer membrane would be expected
to exclude passage of proteins and other large molecules while allowing passage of glucose,
oxygen and other small molecules.
Figure 6.2 A diagram of the electrode chain in amperometric measurements, consisting of the sample, the two electrodes (Pt anode and Ag cathode) and the reference AgCl band, an amperemeter, a voltage source, the membranes and the electrode solutions. 2
During operation a polarization potential of +675 mV is applied between the working and
reference electrode, and the current through the electrode chain is measured by an amperemeter
as depicted in Figure 6.2. This current is proportional to glucose concentration in the sample
79
Chapter 6 Dialysis Performance
68
after appropriate background correction. The potential is applied constantly and the sensor is
kept at 37 ºC.
Glucose molecules are transported across the outer membrane of the multi-layer membrane.
The enzyme glucose oxidase immobilized between the inner and outer membrane layers converts
the glucose by the following set of reactions:
C6H12O6 + H2O + O2 C5H11O5COOH + H2O2 (6-1)
Glucose reaches the enzyme, where it is oxidized to gluconic acid by oxygen, leaving H2O2. One
molecule of glucose gives one molecule of H2O2 at the expense of one molecule of oxygen. O2
for this reaction is supplied by the outer membrane layer and also by the oxidation of H2O2 at the
Pt anode. This may require high O2 permeability of outer membrane, enabling enough O2
available for the consumption at high glucose concentration. The H2O2 produced by the enzyme
reaction is transported across the inner membrane to the Pt anode. At the Pt anode H2O2 is
oxidized and oxygen is regenerated:
H2O2 O2 + 2H+ + 2e- (6-2)
When a potential is applied to the electrode chain, the oxidation of H2O2 produces an electrical
current proportional to the amount of H2O2, which is directly related to the amount of glucose. In
case all the enzymatically generated H2O2 reaches the Pt anode the oxygen is fully recovered. In
fact, this never happens because the generated H2O2 diffuses in all directions, including a
diffusion flow back to the sample. In order to limit this back-diffusion the outer membrane must
have low permeability towards H2O2. To complete the electrical circuit a reduction reaction
(where electrons are consumed) at the cathode converts Ag+ (from AgCl) to Ag:
Ag+ + e- Ag (6-3)
In the conventional sensor the total processes lead to a net production of HCl, Ag and gluconic
acid (at the expense of AgCl, H2O, and glucose).
A list of specific requirements to the outer membranes used in the conventional glucose
sensors is presented here as provided by Lydia D. Clausen from Radiometer Medical ApS at the
start of the project.
1. Diffusion limiting in order to show linear response; the characteristic glucose diffusion
should be less than 1 x 10⁻⁹ cm2/s, maybe even lower, thus enabling that glucose
concentration never exceeds 2 to 4 mM in the enzyme layer in order to determine
glucose concentrations up to minimum 30 mM in sample;
80
Chapter 6 Dialysis Performance
69
2. Fast wet-up (< 30 min);
3. Response time < 60 s;
4. Stable glucose diffusion (no swelling);
5. Stable reaction between measurements on blood and aqueous samples (low hematocrit
effect); the most pronounced hematocrit effects occur at low and at high hematocrit
levels. Block the pores of outer membrane can be one of the reasons causing the
hematocrit effect.
6. Allow ion- and buffer diffusion (This is important as the buffer, which stabilizes the pH
during the enzymatic reaction must be supplied from the sample/rinse/calibration
solution.);
7. Have large O2-capacity and fast oxygen diffusion rate (must be able to measure on
samples with low oxygen content; evaluated by comparison of the measurement results
on a 50 mM Glucose sample with 700 mmHg O2 and 50 mmHg O2 (Max. 5%
decrease);
8. Low paracetamol permeability (no specific value is given);
9. Ratio between H2O2 permeability and Glucose permeability close to 3,5 (3,5 is the
theoretical value due to differences in their aqueous diffusion coefficients.)
This set of requirements could serve as a reference for our study. However, we did not limit
our interests only to biosensor application. In fact, our effort has primarily focused on the study
of fundamental transport properties of the membranes. We expect to understand a correlation
between structural/physical-chemical properties and diffusive properties of the membranes.
Therefore we did not point by point assess the nanoporous 1,2-PB membranes according the
requirements above. Instead, we extensively investigated the diffusive transport property of the
nanoporous 1,2-PB membranes by adjusting the surface morphology, membrane thickness and
active porosity. Membrane selectivity was judged by use of a series of solutes, such as H2O2,
glucose, proteins, antibiotics and other biomolecules. These results would provide useful
information directly or indirectly in relation to the points as listed above.
81
Chapter 6 Dialysis Performance
70
6.1.2. Diffusive solute transport in pores
The outer membrane in principle functions as a semi-permeable dialysis membrane in the
glucose sensor described above. In the absence of significant convective flux, diffusion is an
important mechanism for the transport of solutes through the porous membranes. Diffusive
transport typically is described using Fick’s law that relates the diffusive solute flux to the
difference in aqueous phase solute concentration between adjacent regions by means of a
diffusion coefficient.3 Separation between the solutes is obtained as a result of differences in
diffusion rates across the membrane arising from differences in molecular size and difference in
solubility. Therefore, one of fundamental issues involved in selecting an appropriate outer
membrane is to characterize both biomolecule diffusion and size selectivity properties as a
function of pore size and pore surface chemistry.
In a porous membrane, the effective diffusion coefficient (Deff) for solute transport is
significantly lower than the free-water diffusion coefficient (D ), because of the constricted and
elongated (tortuous) solute flow paths. The effective diffusion coefficient is related to the free
water diffusion coefficient as
effDD δε
τ∞=
(6-4)
where is the effective, transport-through porosity; is a constrictivity factor to account for the
constricted transport paths caused by the small pores and pore throats in a porous medium; and
is a tortuosity factor that accounts for the reduction in diffusive flux caused by the tortuous path
lengths traced by the solute molecule, compared to the straight paths in an unrestricted aqueous
medium. The term Deff /D is also referred to as diffusive resistance, a measure of the resistance
offered by the porous medium to diffusion. 4
To analyze our diffusion data in relation to pore size and solute size, we used the model which
pictures the dissolved solutes as rigid spheres in a cylindrical pore5,6 as shown in Figure 6.3.
Basic assumptions are made regarding the system: 1) the radius of the pore rp and that of the
solute molecules rs greatly exceed that of the solvent, which is treated as a continuum. 2) The
bulk concentration is sufficiently dilute, allowing the solute-solute interactions to be neglected. 3)
The pore length l is much larger than its radius rp. This allows the velocity profile v (r) to fully
develop and the velocity of solute molecule to be taken as a constant U (i.e., the system is at
steady-state).
82
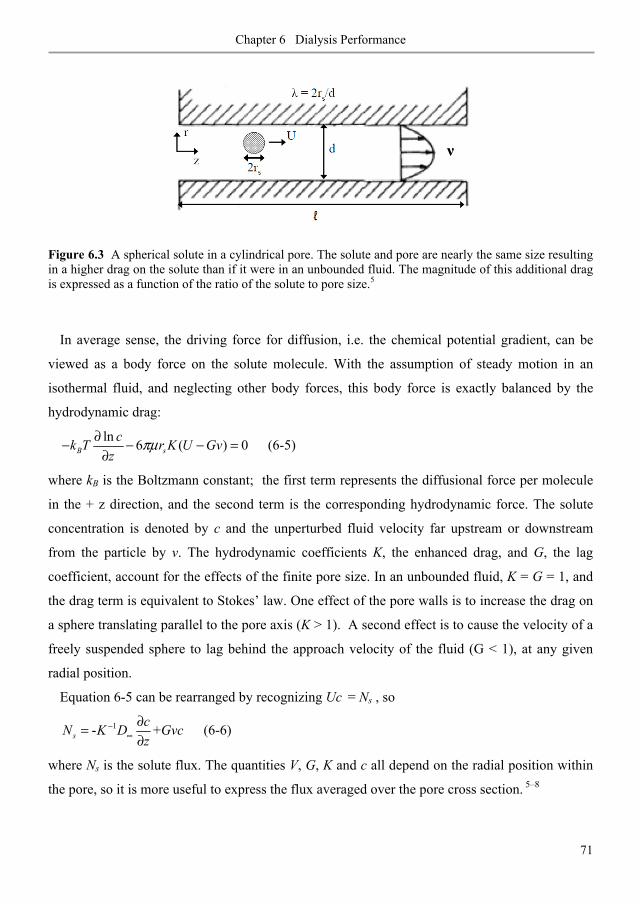
Chapter 6 Dialysis Performance
71
Figure 6.3 A spherical solute in a cylindrical pore. The solute and pore are nearly the same size resulting in a higher drag on the solute than if it were in an unbounded fluid. The magnitude of this additional drag is expressed as a function of the ratio of the solute to pore size.5
In average sense, the driving force for diffusion, i.e. the chemical potential gradient, can be
viewed as a body force on the solute molecule. With the assumption of steady motion in an
isothermal fluid, and neglecting other body forces, this body force is exactly balanced by the
hydrodynamic drag:
ln 6 ( ) 0B sck T r K U Gv
zπμ∂− − − =
∂ (6-5)
where kB is the Boltzmann constant; the first term represents the diffusional force per molecule
in the + z direction, and the second term is the corresponding hydrodynamic force. The solute
concentration is denoted by c and the unperturbed fluid velocity far upstream or downstream
from the particle by v. The hydrodynamic coefficients K, the enhanced drag, and G, the lag
coefficient, account for the effects of the finite pore size. In an unbounded fluid, K = G = 1, and
the drag term is equivalent to Stokes’ law. One effect of the pore walls is to increase the drag on
a sphere translating parallel to the pore axis (K > 1). A second effect is to cause the velocity of a
freely suspended sphere to lag behind the approach velocity of the fluid (G < 1), at any given
radial position.
Equation 6-5 can be rearranged by recognizing Uc = Ns , so
1- +scN K D Gvcz
−∞
∂=∂
(6-6)
where Ns is the solute flux. The quantities V, G, K and c all depend on the radial position within
the pore, so it is more useful to express the flux averaged over the pore cross section. 5–8
83
Chapter 6 Dialysis Performance
72
-s D C
d cN K D K v c
dz∞= +
(6-7)
The coefficients CK and DK are the hindrance factors for convective and diffusive transport
respectively. Assuming no electrostatic interactions between solute and membrane material, CK
and DK are functions of the ratio of solute radius and pore size ( / )s pr rλ = . In this study we used
Bungay and Brenner model8 to calculate these two parameters (to be described later).
Integrating eq. 6-7 subjected to the boundary conditions at z = 0 and z = l gives an equation for
the desired quantity, the macroscopic flux of solutes across a membrane:
[ ]00
1 ( / )exp( )1 exp( )
ls C
c c PeN K v c
Peφ
− −=
− − (6-8)
with C
D
K v lPe
K D∞
=
(6-9)
where lc is the solute concentration at z = l and 0c is the solute concentration at z = 0. The
equilibrium partition coefficient φ for a spherical solute in a cylindrical pore is given by2(1 )φ λ= − .
The dimensionless quantity Peclet number is a measure of the speed of convection relative to
the speed of diffusion. When transport is dominated by diffusion, i.e., Pe <<1 the solute flux is
given by
0( - )Ds l
K DN c cl
φ ∞=
(6-10)
When convection dominates transport i.e., Pe >> 1, the solute flux is given by
0s CN K v cφ= (6-11)
In the hydrodynamic models for membrane transport, the reduction in the convective and
diffusive contributions to the solute flux, compared with that expected in free solution, is
described in terms of the steric and hydrodynamic interactions between the solute and pore walls
as described by eqs. 6-10 and 6-11. Bungay and Brenner8 developed analytical expressions for
the hindrance factors of diffusion (KD) and convection (KC) for rigid spherical solutes in uniform
cylindrical pores using matched asymptotic expansions for both small and close fitting spheres,
yielding:
84
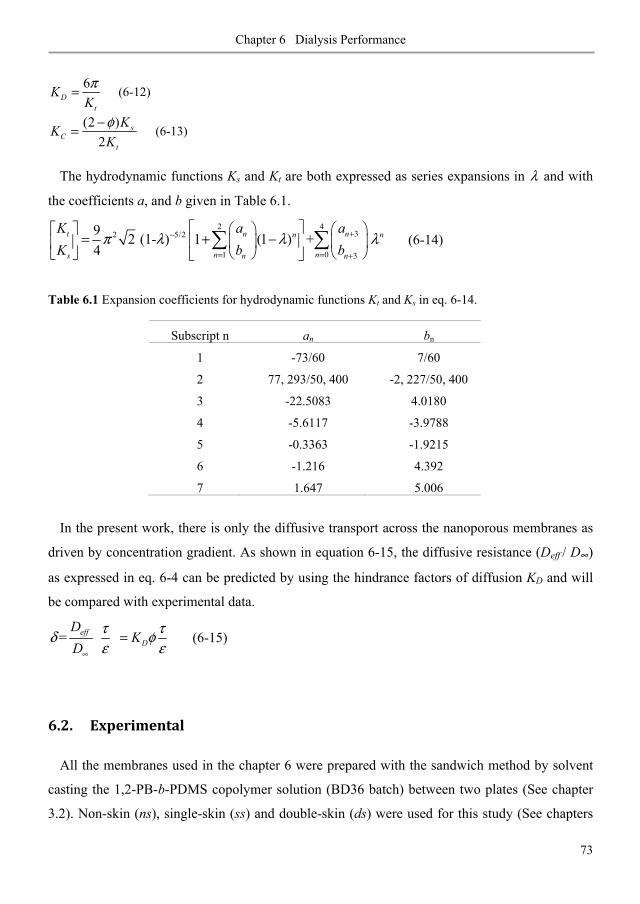
Chapter 6 Dialysis Performance
73
6D
t
KKπ= (6-12)
(2 )2
sC
t
KKKφ−= (6-13)
The hydrodynamic functions Ks and Kt are both expressed as series expansions in λ and with
the coefficients a, and b given in Table 6.1.
2 432 5/2
1 0 3
9 2 (1- ) 1 (1 ) + 4
t n nn n
n ns n n
K a aK b b
π λ λ λ+−
= = +
= + −
(6-14)
Table 6.1 Expansion coefficients for hydrodynamic functions Kt and Ks in eq. 6-14.
Subscript n an bn
1 -73/60 7/60
2 77, 293/50, 400 -2, 227/50, 400 3 -22.5083 4.0180
4 -5.6117 -3.9788
5 -0.3363 -1.9215
6 -1.216 4.392
7 1.647 5.006
In the present work, there is only the diffusive transport across the nanoporous membranes as
driven by concentration gradient. As shown in equation 6-15, the diffusive resistance (Deff / D )
as expressed in eq. 6-4 can be predicted by using the hindrance factors of diffusion KD and will
be compared with experimental data.
= effD
DK
Dτ τδ φε ε∞
=
(6-15)
6.2. Experimental
All the membranes used in the chapter 6 were prepared with the sandwich method by solvent
casting the 1,2-PB-b-PDMS copolymer solution (BD36 batch) between two plates (See chapter
3.2). Non-skin (ns), single-skin (ss) and double-skin (ds) were used for this study (See chapters
85
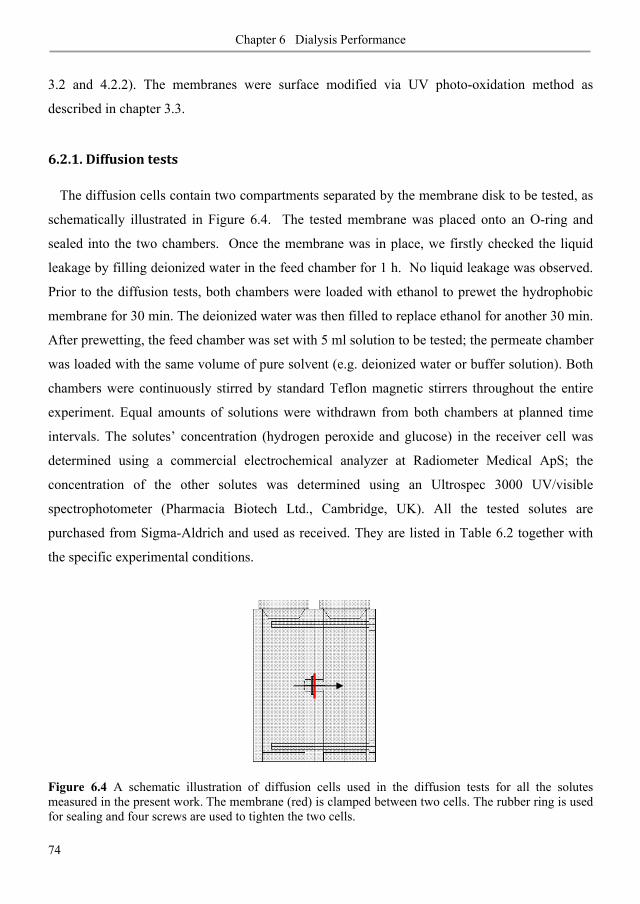
Chapter 6 Dialysis Performance
74
3.2 and 4.2.2). The membranes were surface modified via UV photo-oxidation method as
described in chapter 3.3.
6.2.1. Diffusion tests
The diffusion cells contain two compartments separated by the membrane disk to be tested, as
schematically illustrated in Figure 6.4. The tested membrane was placed onto an O-ring and
sealed into the two chambers. Once the membrane was in place, we firstly checked the liquid
leakage by filling deionized water in the feed chamber for 1 h. No liquid leakage was observed.
Prior to the diffusion tests, both chambers were loaded with ethanol to prewet the hydrophobic
membrane for 30 min. The deionized water was then filled to replace ethanol for another 30 min.
After prewetting, the feed chamber was set with 5 ml solution to be tested; the permeate chamber
was loaded with the same volume of pure solvent (e.g. deionized water or buffer solution). Both
chambers were continuously stirred by standard Teflon magnetic stirrers throughout the entire
experiment. Equal amounts of solutions were withdrawn from both chambers at planned time
intervals. The solutes’ concentration (hydrogen peroxide and glucose) in the receiver cell was
determined using a commercial electrochemical analyzer at Radiometer Medical ApS; the
concentration of the other solutes was determined using an Ultrospec 3000 UV/visible
spectrophotometer (Pharmacia Biotech Ltd., Cambridge, UK). All the tested solutes are
purchased from Sigma-Aldrich and used as received. They are listed in Table 6.2 together with
the specific experimental conditions.
Figure 6.4 A schematic illustration of diffusion cells used in the diffusion tests for all the solutes measured in the present work. The membrane (red) is clamped between two cells. The rubber ring is used for sealing and four screws are used to tighten the two cells.
86
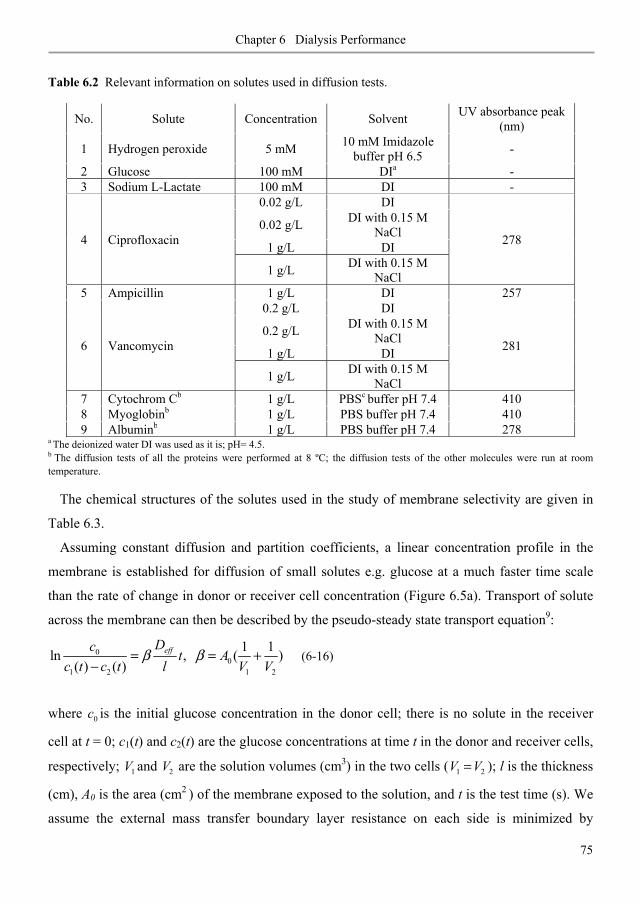
Chapter 6 Dialysis Performance
75
Table 6.2 Relevant information on solutes used in diffusion tests.
No. Solute Concentration Solvent UV absorbance peak (nm)
1 Hydrogen peroxide 5 mM 10 mM Imidazole buffer pH 6.5 -
2 Glucose 100 mM DIa - 3 Sodium L-Lactate 100 mM DI -
4 Ciprofloxacin
0.02 g/L DI
278 0.02 g/L DI with 0.15 M
NaCl 1 g/L DI
1 g/L DI with 0.15 M NaCl
5 Ampicillin 1 g/L DI 257
6 Vancomycin
0.2 g/L DI
281 0.2 g/L DI with 0.15 M
NaCl 1 g/L DI
1 g/L DI with 0.15 M NaCl
7 Cytochrom Cb 1 g/L PBSc buffer pH 7.4 410 8 Myoglobinb 1 g/L PBS buffer pH 7.4 410 9 Albuminb 1 g/L PBS buffer pH 7.4 278
a The deionized water DI was used as it is; pH= 4.5. b The diffusion tests of all the proteins were performed at 8 ºC; the diffusion tests of the other molecules were run at room temperature.
The chemical structures of the solutes used in the study of membrane selectivity are given in
Table 6.3.
Assuming constant diffusion and partition coefficients, a linear concentration profile in the
membrane is established for diffusion of small solutes e.g. glucose at a much faster time scale
than the rate of change in donor or receiver cell concentration (Figure 6.5a). Transport of solute
across the membrane can then be described by the pseudo-steady state transport equation9:
00
1 2 1 2
1 1ln , ( )( ) ( )
effDc t Ac t c t l V V
β β= = +−
(6-16)
where 0c is the initial glucose concentration in the donor cell; there is no solute in the receiver
cell at t = 0; c1(t) and c2(t) are the glucose concentrations at time t in the donor and receiver cells,
respectively; 1V and 2V are the solution volumes (cm3) in the two cells ( 1 2V V= ); l is the thickness
(cm), A0 is the area (cm2 ) of the membrane exposed to the solution, and t is the test time (s). We
assume the external mass transfer boundary layer resistance on each side is minimized by
87
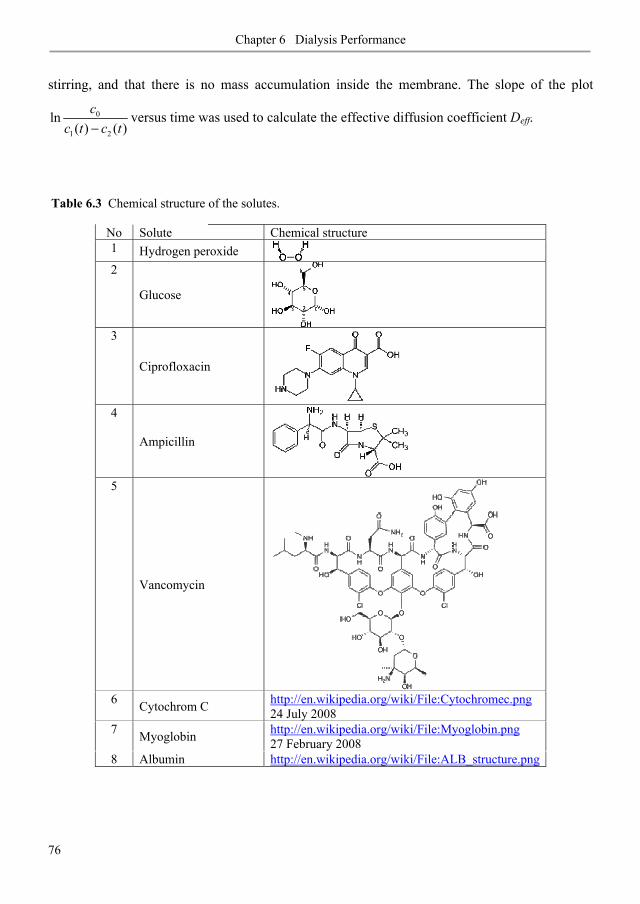
Chapter 6 Dialysis Performance
76
stirring, and that there is no mass accumulation inside the membrane. The slope of the plot
0
1 2
ln( ) ( )
cc t c t−
versus time was used to calculate the effective diffusion coefficient Deff.
Table 6.3 Chemical structure of the solutes.
No Solute Chemical structure 1 Hydrogen peroxide 2
Glucose
3
Ciprofloxacin
4
Ampicillin
5
Vancomycin
6 Cytochrom C http://en.wikipedia.org/wiki/File:Cytochromec.png
24 July 2008 7 Myoglobin http://en.wikipedia.org/wiki/File:Myoglobin.png
27 February 2008 8 Albumin http://en.wikipedia.org/wiki/File:ALB_structure.png
88
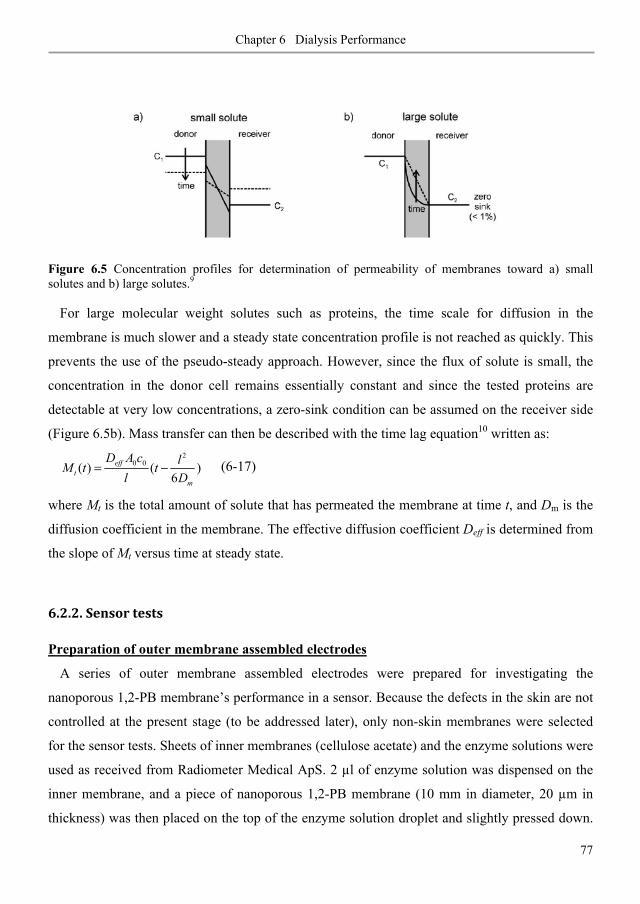
Chapter 6 Dialysis Performance
77
Figure 6.5 Concentration profiles for determination of permeability of membranes toward a) small solutes and b) large solutes.9
For large molecular weight solutes such as proteins, the time scale for diffusion in the
membrane is much slower and a steady state concentration profile is not reached as quickly. This
prevents the use of the pseudo-steady approach. However, since the flux of solute is small, the
concentration in the donor cell remains essentially constant and since the tested proteins are
detectable at very low concentrations, a zero-sink condition can be assumed on the receiver side
(Figure 6.5b). Mass transfer can then be described with the time lag equation10 written as: 2
0 0( ) ( )6
efft
m
D A c lM t tl D
= −
(6-17)
where Mt is the total amount of solute that has permeated the membrane at time t, and Dm is the
diffusion coefficient in the membrane. The effective diffusion coefficient Deff is determined from
the slope of Mt versus time at steady state.
6.2.2. Sensor tests
Preparation of outer membrane assembled electrodes
A series of outer membrane assembled electrodes were prepared for investigating the
nanoporous 1,2-PB membrane’s performance in a sensor. Because the defects in the skin are not
controlled at the present stage (to be addressed later), only non-skin membranes were selected
for the sensor tests. Sheets of inner membranes (cellulose acetate) and the enzyme solutions were
used as received from Radiometer Medical ApS. 2 μl of enzyme solution was dispensed on the
inner membrane, and a piece of nanoporous 1,2-PB membrane (10 mm in diameter, 20 μm in
thickness) was then placed on the top of the enzyme solution droplet and slightly pressed down.
89
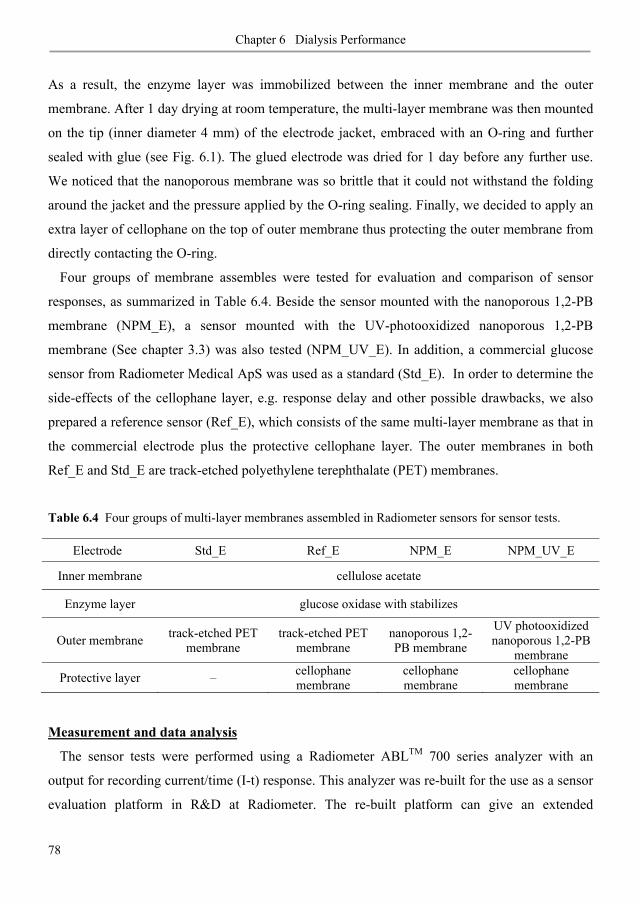
Chapter 6 Dialysis Performance
78
As a result, the enzyme layer was immobilized between the inner membrane and the outer
membrane. After 1 day drying at room temperature, the multi-layer membrane was then mounted
on the tip (inner diameter 4 mm) of the electrode jacket, embraced with an O-ring and further
sealed with glue (see Fig. 6.1). The glued electrode was dried for 1 day before any further use.
We noticed that the nanoporous membrane was so brittle that it could not withstand the folding
around the jacket and the pressure applied by the O-ring sealing. Finally, we decided to apply an
extra layer of cellophane on the top of outer membrane thus protecting the outer membrane from
directly contacting the O-ring.
Four groups of membrane assembles were tested for evaluation and comparison of sensor
responses, as summarized in Table 6.4. Beside the sensor mounted with the nanoporous 1,2-PB
membrane (NPM_E), a sensor mounted with the UV-photooxidized nanoporous 1,2-PB
membrane (See chapter 3.3) was also tested (NPM_UV_E). In addition, a commercial glucose
sensor from Radiometer Medical ApS was used as a standard (Std_E). In order to determine the
side-effects of the cellophane layer, e.g. response delay and other possible drawbacks, we also
prepared a reference sensor (Ref_E), which consists of the same multi-layer membrane as that in
the commercial electrode plus the protective cellophane layer. The outer membranes in both
Ref_E and Std_E are track-etched polyethylene terephthalate (PET) membranes.
Table 6.4 Four groups of multi-layer membranes assembled in Radiometer sensors for sensor tests.
Electrode Std_E Ref_E NPM_E NPM_UV_E
Inner membrane cellulose acetate
Enzyme layer glucose oxidase with stabilizes
Outer membrane track-etched PET membrane
track-etched PET membrane
nanoporous 1,2-PB membrane
UV photooxidized nanoporous 1,2-PB
membrane
Protective layer – cellophane membrane
cellophane membrane
cellophane membrane
Measurement and data analysis
The sensor tests were performed using a Radiometer ABLTM 700 series analyzer with an
output for recording current/time (I-t) response. This analyzer was re-built for the use as a sensor
evaluation platform in R&D at Radiometer. The re-built platform can give an extended
90
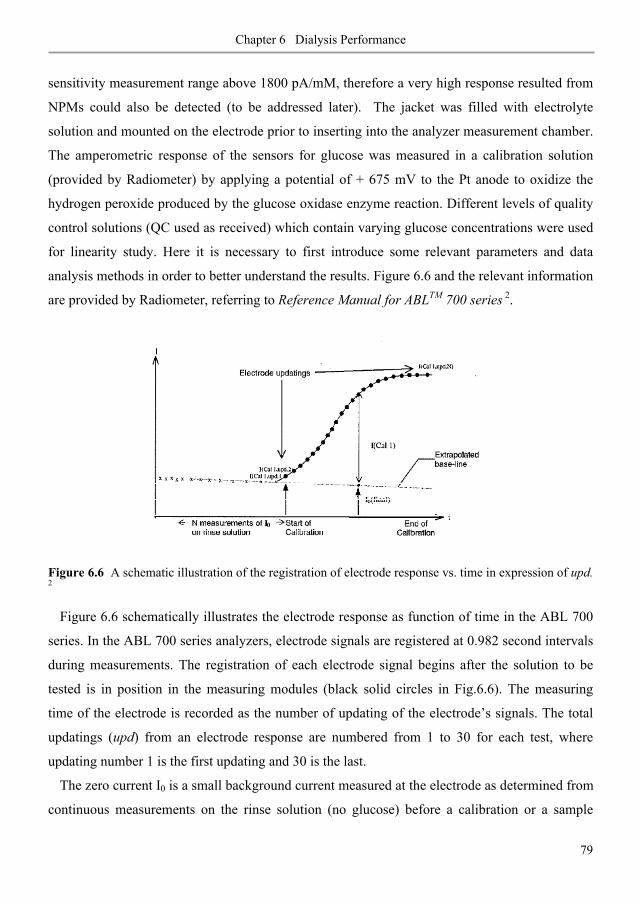
Chapter 6 Dialysis Performance
79
sensitivity measurement range above 1800 pA/mM, therefore a very high response resulted from
NPMs could also be detected (to be addressed later). The jacket was filled with electrolyte
solution and mounted on the electrode prior to inserting into the analyzer measurement chamber.
The amperometric response of the sensors for glucose was measured in a calibration solution
(provided by Radiometer) by applying a potential of + 675 mV to the Pt anode to oxidize the
hydrogen peroxide produced by the glucose oxidase enzyme reaction. Different levels of quality
control solutions (QC used as received) which contain varying glucose concentrations were used
for linearity study. Here it is necessary to first introduce some relevant parameters and data
analysis methods in order to better understand the results. Figure 6.6 and the relevant information
are provided by Radiometer, referring to Reference Manual for ABLTM 700 series 2.
Figure 6.6 A schematic illustration of the registration of electrode response vs. time in expression of upd. 2
Figure 6.6 schematically illustrates the electrode response as function of time in the ABL 700
series. In the ABL 700 series analyzers, electrode signals are registered at 0.982 second intervals
during measurements. The registration of each electrode signal begins after the solution to be
tested is in position in the measuring modules (black solid circles in Fig.6.6). The measuring
time of the electrode is recorded as the number of updating of the electrode’s signals. The total
updatings (upd) from an electrode response are numbered from 1 to 30 for each test, where
updating number 1 is the first updating and 30 is the last.
The zero current I0 is a small background current measured at the electrode as determined from
continuous measurements on the rinse solution (no glucose) before a calibration or a sample
91
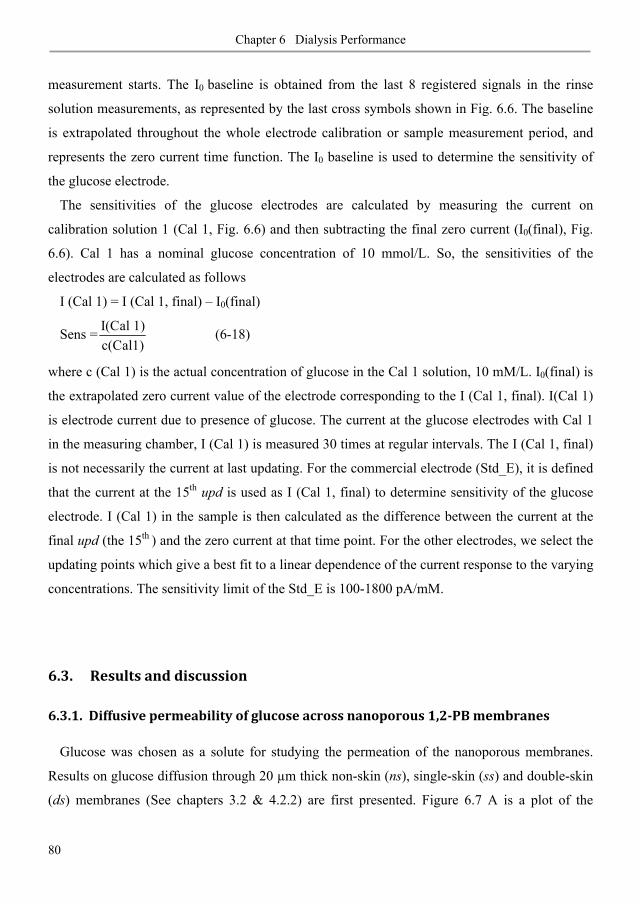
Chapter 6 Dialysis Performance
80
measurement starts. The I0 baseline is obtained from the last 8 registered signals in the rinse
solution measurements, as represented by the last cross symbols shown in Fig. 6.6. The baseline
is extrapolated throughout the whole electrode calibration or sample measurement period, and
represents the zero current time function. The I0 baseline is used to determine the sensitivity of
the glucose electrode.
The sensitivities of the glucose electrodes are calculated by measuring the current on
calibration solution 1 (Cal 1, Fig. 6.6) and then subtracting the final zero current (I0(final), Fig.
6.6). Cal 1 has a nominal glucose concentration of 10 mmol/L. So, the sensitivities of the
electrodes are calculated as follows
I (Cal 1) = I (Cal 1, final) – I0(final)
Sens = I(Cal 1)c(Cal1)
(6-18)
where c (Cal 1) is the actual concentration of glucose in the Cal 1 solution, 10 mM/L. I0(final) is
the extrapolated zero current value of the electrode corresponding to the I (Cal 1, final). I(Cal 1)
is electrode current due to presence of glucose. The current at the glucose electrodes with Cal 1
in the measuring chamber, I (Cal 1) is measured 30 times at regular intervals. The I (Cal 1, final)
is not necessarily the current at last updating. For the commercial electrode (Std_E), it is defined
that the current at the 15th upd is used as I (Cal 1, final) to determine sensitivity of the glucose
electrode. I (Cal 1) in the sample is then calculated as the difference between the current at the
final upd (the 15th ) and the zero current at that time point. For the other electrodes, we select the
updating points which give a best fit to a linear dependence of the current response to the varying
concentrations. The sensitivity limit of the Std_E is 100-1800 pA/mM.
6.3. Results and discussion
6.3.1. Diffusive permeability of glucose across nanoporous 1,2-PB membranes
Glucose was chosen as a solute for studying the permeation of the nanoporous membranes.
Results on glucose diffusion through 20 μm thick non-skin (ns), single-skin (ss) and double-skin
(ds) membranes (See chapters 3.2 & 4.2.2) are first presented. Figure 6.7 A is a plot of the
92
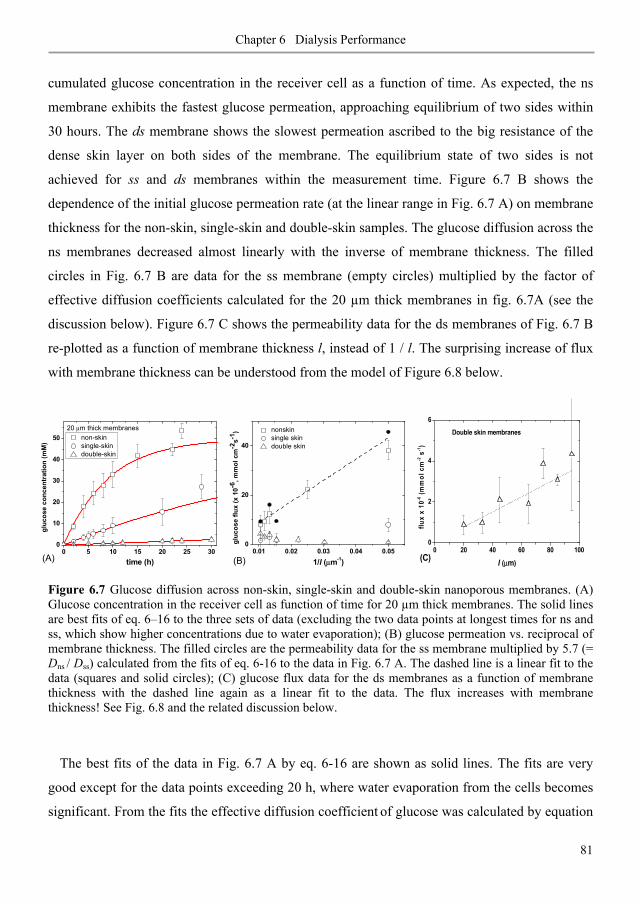
Chapter 6 Dialysis Performance
81
cumulated glucose concentration in the receiver cell as a function of time. As expected, the ns
membrane exhibits the fastest glucose permeation, approaching equilibrium of two sides within
30 hours. The ds membrane shows the slowest permeation ascribed to the big resistance of the
dense skin layer on both sides of the membrane. The equilibrium state of two sides is not
achieved for ss and ds membranes within the measurement time. Figure 6.7 B shows the
dependence of the initial glucose permeation rate (at the linear range in Fig. 6.7 A) on membrane
thickness for the non-skin, single-skin and double-skin samples. The glucose diffusion across the
ns membranes decreased almost linearly with the inverse of membrane thickness. The filled
circles in Fig. 6.7 B are data for the ss membrane (empty circles) multiplied by the factor of
effective diffusion coefficients calculated for the 20 μm thick membranes in fig. 6.7A (see the
discussion below). Figure 6.7 C shows the permeability data for the ds membranes of Fig. 6.7 B
re-plotted as a function of membrane thickness l, instead of 1 / l. The surprising increase of flux
with membrane thickness can be understood from the model of Figure 6.8 below.
Figure 6.7 Glucose diffusion across non-skin, single-skin and double-skin nanoporous membranes. (A) Glucose concentration in the receiver cell as function of time for 20 μm thick membranes. The solid lines are best fits of eq. 6–16 to the three sets of data (excluding the two data points at longest times for ns and ss, which show higher concentrations due to water evaporation); (B) glucose permeation vs. reciprocal of membrane thickness. The filled circles are the permeability data for the ss membrane multiplied by 5.7 (= Dns / Dss) calculated from the fits of eq. 6-16 to the data in Fig. 6.7 A. The dashed line is a linear fit to the data (squares and solid circles); (C) glucose flux data for the ds membranes as a function of membrane thickness with the dashed line again as a linear fit to the data. The flux increases with membrane thickness! See Fig. 6.8 and the related discussion below.
The best fits of the data in Fig. 6.7 A by eq. 6-16 are shown as solid lines. The fits are very
good except for the data points exceeding 20 h, where water evaporation from the cells becomes
significant. From the fits the effective diffusion coefficient of glucose was calculated by equation
0 5 10 15 20 25 300
10
20
30
40
50 non-skin single-skin double-skin
gluc
ose
conc
entr
atio
n (m
M)
time (h)
20 μm thick membranes
(A)0.01 0.02 0.03 0.04 0.05
0
20
40
nonskin single skin double skin
gluc
ose
flux
(x 1
0-6, m
mol
cm
-2s-1
)
1/l (μm-1)(B)0 20 40 60 80 100
0
2
4
6
flux
x 10
-6 (m
mol
cm
-2 s
-1)
l (μm)
Double skin membranes
(C)
93
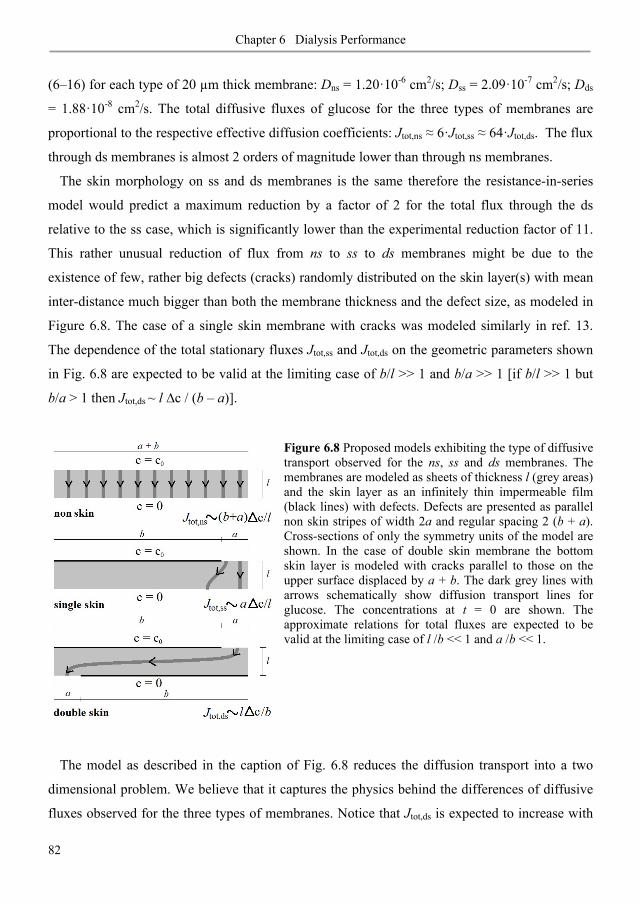
Chapter 6 Dialysis Performance
82
(6–16) for each type of 20 μm thick membrane: Dns = 1.20·10-6 cm2/s; Dss = 2.09·10-7 cm2/s; Dds
= 1.88·10-8 cm2/s. The total diffusive fluxes of glucose for the three types of membranes are
proportional to the respective effective diffusion coefficients: Jtot,ns 6·Jtot,ss 64·Jtot,ds. The flux
through ds membranes is almost 2 orders of magnitude lower than through ns membranes.
The skin morphology on ss and ds membranes is the same therefore the resistance-in-series
model would predict a maximum reduction by a factor of 2 for the total flux through the ds
relative to the ss case, which is significantly lower than the experimental reduction factor of 11.
This rather unusual reduction of flux from ns to ss to ds membranes might be due to the
existence of few, rather big defects (cracks) randomly distributed on the skin layer(s) with mean
inter-distance much bigger than both the membrane thickness and the defect size, as modeled in
Figure 6.8. The case of a single skin membrane with cracks was modeled similarly in ref. 13.
The dependence of the total stationary fluxes Jtot,ss and Jtot,ds on the geometric parameters shown
in Fig. 6.8 are expected to be valid at the limiting case of b/l >> 1 and b/a >> 1 [if b/l >> 1 but
b/a > 1 then Jtot,ds ~ l c / (b – a)].
Figure 6.8 Proposed models exhibiting the type of diffusive transport observed for the ns, ss and ds membranes. The membranes are modeled as sheets of thickness l (grey areas) and the skin layer as an infinitely thin impermeable film (black lines) with defects. Defects are presented as parallel non skin stripes of width 2a and regular spacing 2 (b + a). Cross-sections of only the symmetry units of the model are shown. In the case of double skin membrane the bottom skin layer is modeled with cracks parallel to those on the upper surface displaced by a + b. The dark grey lines with arrows schematically show diffusion transport lines for glucose. The concentrations at t = 0 are shown. The approximate relations for total fluxes are expected to be valid at the limiting case of l /b << 1 and a /b << 1.
The model as described in the caption of Fig. 6.8 reduces the diffusion transport into a two
dimensional problem. We believe that it captures the physics behind the differences of diffusive
fluxes observed for the three types of membranes. Notice that Jtot,ds is expected to increase with
94
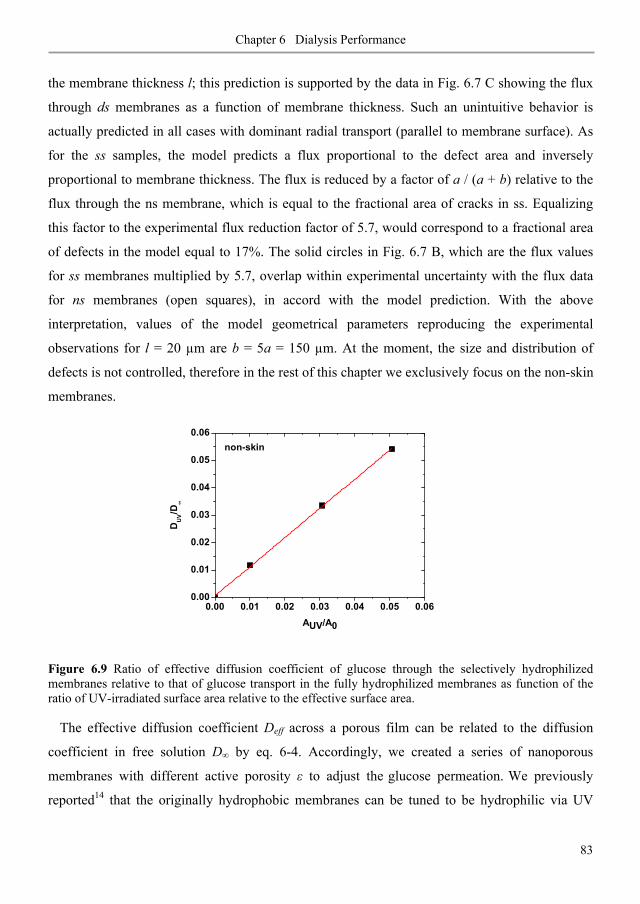
Chapter 6 Dialysis Performance
83
the membrane thickness l; this prediction is supported by the data in Fig. 6.7 C showing the flux
through ds membranes as a function of membrane thickness. Such an unintuitive behavior is
actually predicted in all cases with dominant radial transport (parallel to membrane surface). As
for the ss samples, the model predicts a flux proportional to the defect area and inversely
proportional to membrane thickness. The flux is reduced by a factor of a / (a + b) relative to the
flux through the ns membrane, which is equal to the fractional area of cracks in ss. Equalizing
this factor to the experimental flux reduction factor of 5.7, would correspond to a fractional area
of defects in the model equal to 17%. The solid circles in Fig. 6.7 B, which are the flux values
for ss membranes multiplied by 5.7, overlap within experimental uncertainty with the flux data
for ns membranes (open squares), in accord with the model prediction. With the above
interpretation, values of the model geometrical parameters reproducing the experimental
observations for l = 20 μm are b = 5a = 150 μm. At the moment, the size and distribution of
defects is not controlled, therefore in the rest of this chapter we exclusively focus on the non-skin
membranes.
Figure 6.9 Ratio of effective diffusion coefficient of glucose through the selectively hydrophilized membranes relative to that of glucose transport in the fully hydrophilized membranes as function of the ratio of UV-irradiated surface area relative to the effective surface area.
The effective diffusion coefficient Deff across a porous film can be related to the diffusion
coefficient in free solution D by eq. 6-4. Accordingly, we created a series of nanoporous
membranes with different active porosity to adjust the glucose permeation. We previously
reported14 that the originally hydrophobic membranes can be tuned to be hydrophilic via UV
0.00 0.01 0.02 0.03 0.04 0.05 0.060.00
0.01
0.02
0.03
0.04
0.05
0.06
DU
V/D∞
AUV/A0
non-skin
95

Chapter 6 Dialysis Performance
84
photo-oxidation (See chapter 3.3). Water can spontaneously penetrate into the hydrophilized
nanopores, totally filling the void fraction. As a result, the hydrophilized nanopores are
permeable to the diffusing species while no diffusion happens in the native nanopores. This
provides an easy means to change active porosity of the nanoporous membrane by
hydrophilizing selective regions of the membrane. Figure 6.9 nicely shows that the effective
diffusion coefficient of glucose in water through the nanoporous membrane is proportional to the
active porosity of the membrane expressed in terms of UV-exposed surface area.
The results above demonstrate that the permeation rate of glucose through nanoporous 1,2-PB
membranes can be widely varied either by manipulating the surface morphology of the
membrane, or by changing the active porosity. We also attempted to obtain a varying effective
diffusion coefficient of glucose by controlling the etching degree of the nanoporous membranes
(See chapter 3.2). Unfortunately, a clear correlation between the diffusion coefficient and the
etching degree could not be found. The data are presented in Appendix B.
6.3.2. Selectivity of nanoporous 1,2-PB membranes in dialysis
Selectivity was studied as the second important characteristics of the membrane performance.
The gained information would help to explore whether this type of nanoporous membrane has
practical value in medical device applications. A series of molecules were used to evaluate the
selectivity of the non-skin nanoporous membranes with a thickness of 20 μm, including
antibiotics, proteins and other biomolecules, as presented in Table 6.5. It summarizes the basic
characteristics of the tested solutes. The values of effective diffusion coefficient derived from
eqs. 6-16 and 6-17 are listed in the last second column of the table. In the case of proteins, there
was a time lag for adsorption equilibration. This equilibration period ensured that the
concentration profile across the membrane was at quasi-steady-state.15 Therefore the starting
time for a linear fitting was taken after equilibration rather than at t = 0 as described by eq. 6-17.
The values of selectivity , defined as the ratio of effective diffusion coefficient of glucose to
that of the solute tested, are summarized in the last column of Table 6.5. We found that the De
values for ciprofloxacin (3), vancomycin (4) and cytochrome C (6) were significantly lower than
expected from their sizes (see Figure 6.10). Myoglobin and albumin showed extremely little or
96
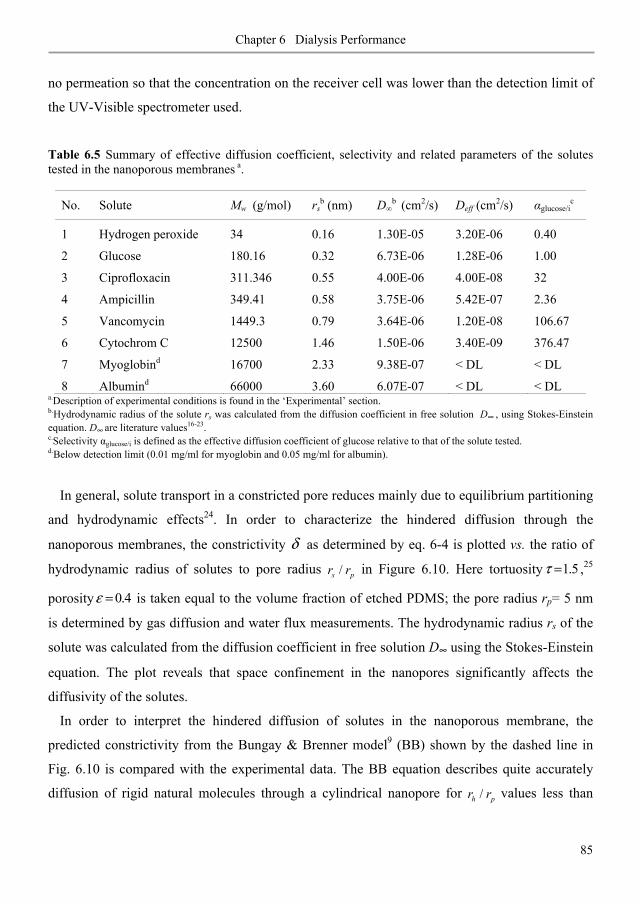
Chapter 6 Dialysis Performance
85
no permeation so that the concentration on the receiver cell was lower than the detection limit of
the UV-Visible spectrometer used.
Table 6.5 Summary of effective diffusion coefficient, selectivity and related parameters of the solutes tested in the nanoporous membranes a.
No. Solute Mw (g/mol) rsb (nm) D b
(cm2/s) Deff (cm2/s) glucose/ic
1 Hydrogen peroxide 34 0.16 1.30E-05 3.20E-06 0.40
2 Glucose 180.16 0.32 6.73E-06 1.28E-06 1.00
3 Ciprofloxacin 311.346 0.55 4.00E-06 4.00E-08 32
4 Ampicillin 349.41 0.58 3.75E-06 5.42E-07 2.36
5 Vancomycin 1449.3 0.79 3.64E-06 1.20E-08 106.67
6 Cytochrom C 12500 1.46 1.50E-06 3.40E-09 376.47
7 Myoglobind 16700 2.33 9.38E-07 < DL < DL
8 Albumind 66000 3.60 6.07E-07 < DL < DL a.Description of experimental conditions is found in the ‘Experimental’ section. b.Hydrodynamic radius of the solute rs was calculated from the diffusion coefficient in free solution D , using Stokes-Einstein equation. D are literature values16-23. c.Selectivity glucose/i is defined as the effective diffusion coefficient of glucose relative to that of the solute tested. d.Below detection limit (0.01 mg/ml for myoglobin and 0.05 mg/ml for albumin).
In general, solute transport in a constricted pore reduces mainly due to equilibrium partitioning
and hydrodynamic effects24. In order to characterize the hindered diffusion through the
nanoporous membranes, the constrictivity δ as determined by eq. 6-4 is plotted vs. the ratio of
hydrodynamic radius of solutes to pore radius /s pr r in Figure 6.10. Here tortuosity 1.5τ = ,25
porosity 0.4ε = is taken equal to the volume fraction of etched PDMS; the pore radius rp= 5 nm
is determined by gas diffusion and water flux measurements. The hydrodynamic radius rs of the
solute was calculated from the diffusion coefficient in free solution D using the Stokes-Einstein
equation. The plot reveals that space confinement in the nanopores significantly affects the
diffusivity of the solutes.
In order to interpret the hindered diffusion of solutes in the nanoporous membrane, the
predicted constrictivity from the Bungay & Brenner model9 (BB) shown by the dashed line in
Fig. 6.10 is compared with the experimental data. The BB equation describes quite accurately
diffusion of rigid natural molecules through a cylindrical nanopore for /h pr r values less than
97

Chapter 6 Dialysis Performance
86
unity; only steric effects and hydrodynamic interactions between solute and pore wall are
considered in this model. It’s evident from Fig. 6.10 that only hydrogen peroxide, glucose, and
ampicillin follow the model prediction. This indicates that size exclusion and hydrodynamic
interactions govern the diffusion of these three molecules in the nanopores.
Figure 6.10 Plot of constrictivity of solutes as a function of the ratio between solute radius and the pore radius. The experimental conditions for samples denoted by black solid circles are described in the ‘Experimental’ section; the detailed explanation of the data shown by open circles is given below in relation to the discussion of Figure 6.11. The dashed curve is prediction from the Bungay & Brenner model.
On the other hand, the hindered diffusion of the other molecules is much slower and the
selectivity much higher than expected by BB equation. The permeation of solutes across a
membrane does not only depend on the size of solutes or pores; in most cases it strongly depends
on a number of solute- solute and solute-membrane interactions26-30, such as electrostatic,
hydrophobic, charge transfer, and hydrogen bonding interactions. These interactions can be
significantly influenced by physicochemical parameters, such as pH, ionic strength,
transmembrane pressure, surface chemistry of the nanopore wall and so on. In addition, these
interactions also depend on concentration which can possibly induce concentration polarization
or surface fouling. For instance, the significant reduction in diffusion of cytocrome C can be
explained by the fact that the hydrophobic interaction between proteins and the hydrophobic
membrane are significant. The resulting reduced effective pore size accounts then for the low
transport of proteins.
0.0 0.2 0.4 0.6 0.8 1.00.00
0.25
0.50
0.75
1.00
5'
3'
876
53
4
2
δ
Rs/Rp
1
98
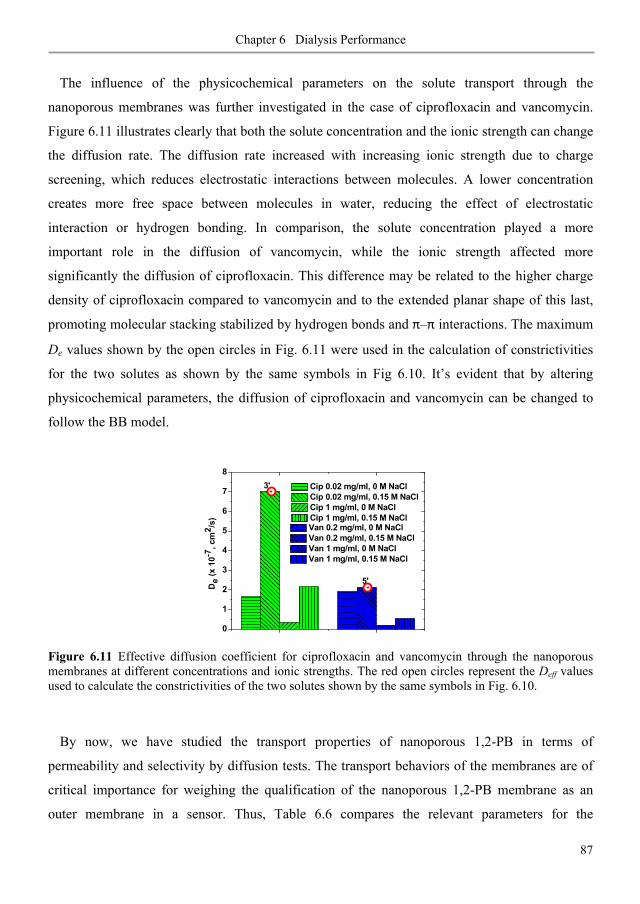
Chapter 6 Dialysis Performance
87
The influence of the physicochemical parameters on the solute transport through the
nanoporous membranes was further investigated in the case of ciprofloxacin and vancomycin.
Figure 6.11 illustrates clearly that both the solute concentration and the ionic strength can change
the diffusion rate. The diffusion rate increased with increasing ionic strength due to charge
screening, which reduces electrostatic interactions between molecules. A lower concentration
creates more free space between molecules in water, reducing the effect of electrostatic
interaction or hydrogen bonding. In comparison, the solute concentration played a more
important role in the diffusion of vancomycin, while the ionic strength affected more
significantly the diffusion of ciprofloxacin. This difference may be related to the higher charge
density of ciprofloxacin compared to vancomycin and to the extended planar shape of this last,
promoting molecular stacking stabilized by hydrogen bonds and – interactions. The maximum
De values shown by the open circles in Fig. 6.11 were used in the calculation of constrictivities
for the two solutes as shown by the same symbols in Fig 6.10. It’s evident that by altering
physicochemical parameters, the diffusion of ciprofloxacin and vancomycin can be changed to
follow the BB model.
Figure 6.11 Effective diffusion coefficient for ciprofloxacin and vancomycin through the nanoporous membranes at different concentrations and ionic strengths. The red open circles represent the Deff values used to calculate the constrictivities of the two solutes shown by the same symbols in Fig. 6.10.
By now, we have studied the transport properties of nanoporous 1,2-PB in terms of
permeability and selectivity by diffusion tests. The transport behaviors of the membranes are of
critical importance for weighing the qualification of the nanoporous 1,2-PB membrane as an
outer membrane in a sensor. Thus, Table 6.6 compares the relevant parameters for the
0
1
2
3
4
5
6
7
8
5'
De
(x 1
0-7, c
m2 /s
)
Cip 0.02 mg/ml, 0 M NaCl Cip 0.02 mg/ml, 0.15 M NaCl Cip 1 mg/ml, 0 M NaCl Cip 1 mg/ml, 0.15 M NaCl
3'
Van 0.2 mg/ml, 0 M NaCl Van 0.2 mg/ml, 0.15 M NaCl Van 1 mg/ml, 0 M NaCl Van 1 mg/ml, 0.15 M NaCl
99
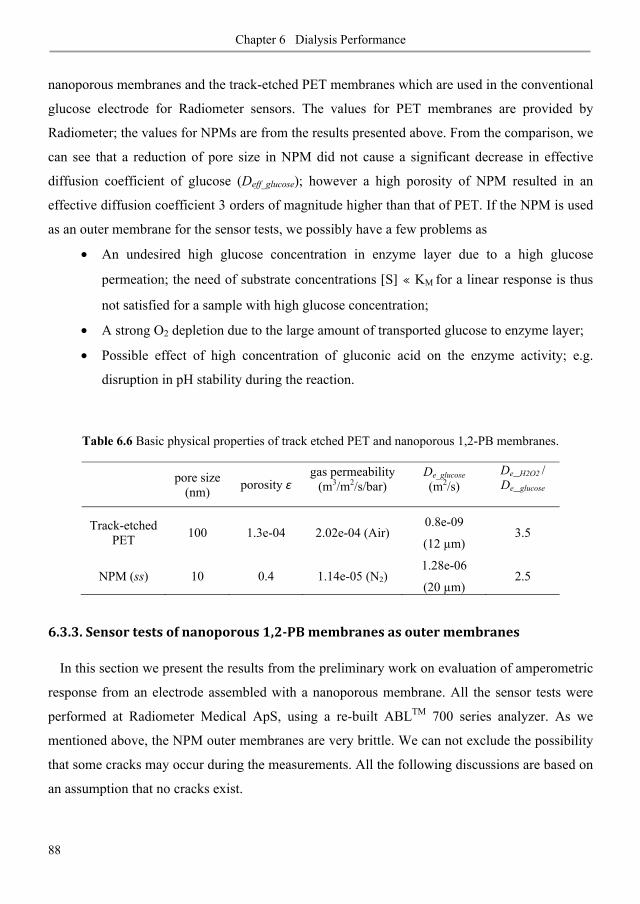
Chapter 6 Dialysis Performance
88
nanoporous membranes and the track-etched PET membranes which are used in the conventional
glucose electrode for Radiometer sensors. The values for PET membranes are provided by
Radiometer; the values for NPMs are from the results presented above. From the comparison, we
can see that a reduction of pore size in NPM did not cause a significant decrease in effective
diffusion coefficient of glucose (Deff_glucose); however a high porosity of NPM resulted in an
effective diffusion coefficient 3 orders of magnitude higher than that of PET. If the NPM is used
as an outer membrane for the sensor tests, we possibly have a few problems as
• An undesired high glucose concentration in enzyme layer due to a high glucose
permeation; the need of substrate concentrations [S] « KM for a linear response is thus
not satisfied for a sample with high glucose concentration;
• A strong O2 depletion due to the large amount of transported glucose to enzyme layer;
• Possible effect of high concentration of gluconic acid on the enzyme activity; e.g.
disruption in pH stability during the reaction.
Table 6.6 Basic physical properties of track etched PET and nanoporous 1,2-PB membranes.
pore size (nm) porosity
gas permeability (m3/m2/s/bar)
De_glucose (m2/s)
De_H2O2 / De_glucose
Track-etched PET 100 1.3e-04 2.02e-04 (Air)
0.8e-09
(12 μm) 3.5
NPM (ss) 10 0.4 1.14e-05 (N2) 1.28e-06
(20 μm) 2.5
6.3.3. Sensor tests of nanoporous 1,2-PB membranes as outer membranes
In this section we present the results from the preliminary work on evaluation of amperometric
response from an electrode assembled with a nanoporous membrane. All the sensor tests were
performed at Radiometer Medical ApS, using a re-built ABLTM 700 series analyzer. As we
mentioned above, the NPM outer membranes are very brittle. We can not exclude the possibility
that some cracks may occur during the measurements. All the following discussions are based on
an assumption that no cracks exist.
100
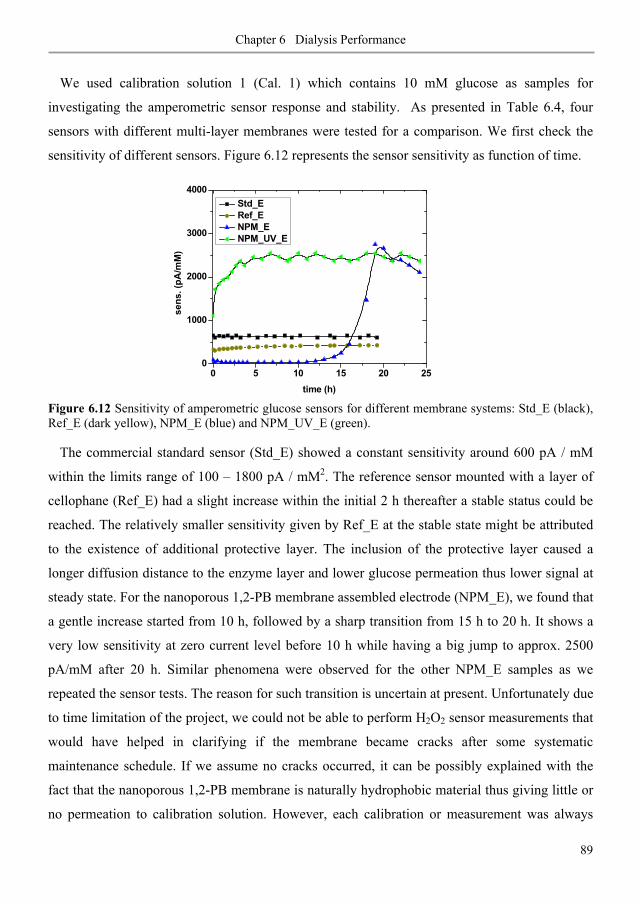
Chapter 6 Dialysis Performance
89
We used calibration solution 1 (Cal. 1) which contains 10 mM glucose as samples for
investigating the amperometric sensor response and stability. As presented in Table 6.4, four
sensors with different multi-layer membranes were tested for a comparison. We first check the
sensitivity of different sensors. Figure 6.12 represents the sensor sensitivity as function of time.
Figure 6.12 Sensitivity of amperometric glucose sensors for different membrane systems: Std_E (black), Ref_E (dark yellow), NPM_E (blue) and NPM_UV_E (green).
The commercial standard sensor (Std_E) showed a constant sensitivity around 600 pA / mM
within the limits range of 100 – 1800 pA / mM2. The reference sensor mounted with a layer of
cellophane (Ref_E) had a slight increase within the initial 2 h thereafter a stable status could be
reached. The relatively smaller sensitivity given by Ref_E at the stable state might be attributed
to the existence of additional protective layer. The inclusion of the protective layer caused a
longer diffusion distance to the enzyme layer and lower glucose permeation thus lower signal at
steady state. For the nanoporous 1,2-PB membrane assembled electrode (NPM_E), we found that
a gentle increase started from 10 h, followed by a sharp transition from 15 h to 20 h. It shows a
very low sensitivity at zero current level before 10 h while having a big jump to approx. 2500
pA/mM after 20 h. Similar phenomena were observed for the other NPM_E samples as we
repeated the sensor tests. The reason for such transition is uncertain at present. Unfortunately due
to time limitation of the project, we could not be able to perform H2O2 sensor measurements that
would have helped in clarifying if the membrane became cracks after some systematic
maintenance schedule. If we assume no cracks occurred, it can be possibly explained with the
fact that the nanoporous 1,2-PB membrane is naturally hydrophobic material thus giving little or
no permeation to calibration solution. However, each calibration or measurement was always
0 5 10 15 20 250
1000
2000
3000
4000
Std_E Ref_E NPM_E NPM_UV_E
sens
. (pA
/mM
)
time (h)
101
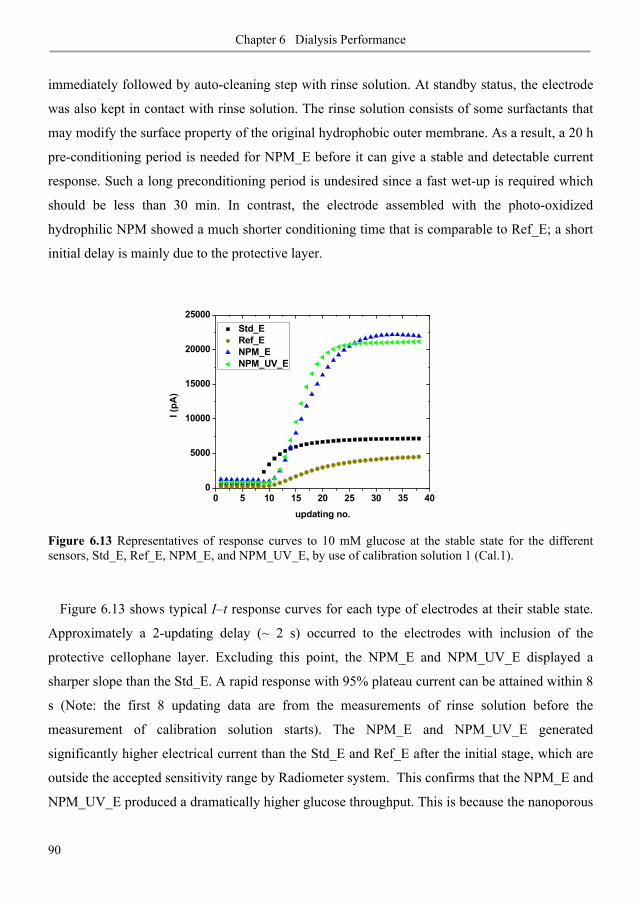
Chapter 6 Dialysis Performance
90
immediately followed by auto-cleaning step with rinse solution. At standby status, the electrode
was also kept in contact with rinse solution. The rinse solution consists of some surfactants that
may modify the surface property of the original hydrophobic outer membrane. As a result, a 20 h
pre-conditioning period is needed for NPM_E before it can give a stable and detectable current
response. Such a long preconditioning period is undesired since a fast wet-up is required which
should be less than 30 min. In contrast, the electrode assembled with the photo-oxidized
hydrophilic NPM showed a much shorter conditioning time that is comparable to Ref_E; a short
initial delay is mainly due to the protective layer.
Figure 6.13 Representatives of response curves to 10 mM glucose at the stable state for the different sensors, Std_E, Ref_E, NPM_E, and NPM_UV_E, by use of calibration solution 1 (Cal.1).
Figure 6.13 shows typical I–t response curves for each type of electrodes at their stable state.
Approximately a 2-updating delay (~ 2 s) occurred to the electrodes with inclusion of the
protective cellophane layer. Excluding this point, the NPM_E and NPM_UV_E displayed a
sharper slope than the Std_E. A rapid response with 95% plateau current can be attained within 8
s (Note: the first 8 updating data are from the measurements of rinse solution before the
measurement of calibration solution starts). The NPM_E and NPM_UV_E generated
significantly higher electrical current than the Std_E and Ref_E after the initial stage, which are
outside the accepted sensitivity range by Radiometer system. This confirms that the NPM_E and
NPM_UV_E produced a dramatically higher glucose throughput. This is because the nanoporous
0 5 10 15 20 25 30 35 400
5000
10000
15000
20000
25000
Std_E Ref_E NPM_E NPM_UV_E
I (pA
)
updating no.
102
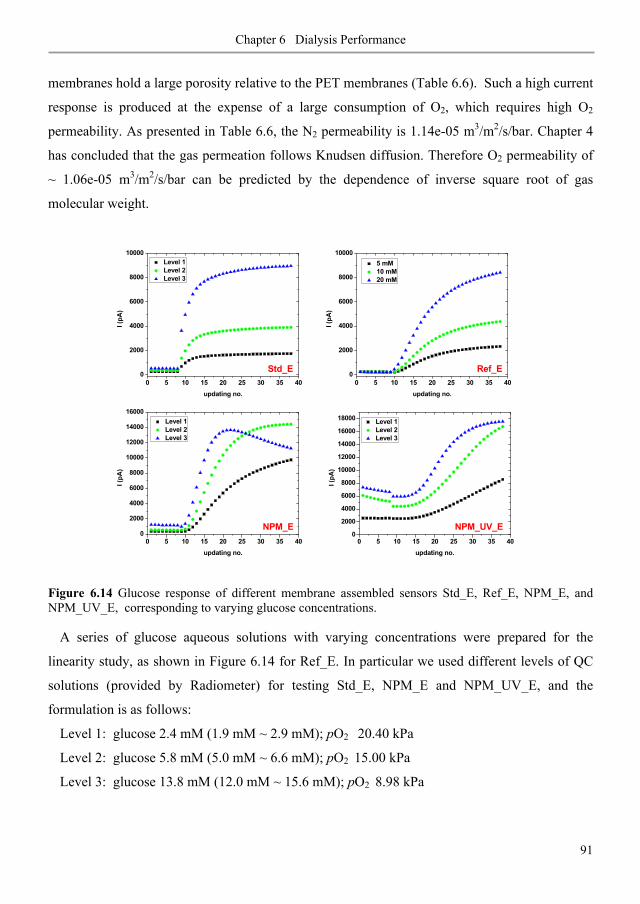
Chapter 6 Dialysis Performance
91
membranes hold a large porosity relative to the PET membranes (Table 6.6). Such a high current
response is produced at the expense of a large consumption of O2, which requires high O2
permeability. As presented in Table 6.6, the N2 permeability is 1.14e-05 m3/m2/s/bar. Chapter 4
has concluded that the gas permeation follows Knudsen diffusion. Therefore O2 permeability of
~ 1.06e-05 m3/m2/s/bar can be predicted by the dependence of inverse square root of gas
molecular weight.
Figure 6.14 Glucose response of different membrane assembled sensors Std_E, Ref_E, NPM_E, and NPM_UV_E, corresponding to varying glucose concentrations.
A series of glucose aqueous solutions with varying concentrations were prepared for the
linearity study, as shown in Figure 6.14 for Ref_E. In particular we used different levels of QC
solutions (provided by Radiometer) for testing Std_E, NPM_E and NPM_UV_E, and the
formulation is as follows:
Level 1: glucose 2.4 mM (1.9 mM ~ 2.9 mM); pO2 20.40 kPa
Level 2: glucose 5.8 mM (5.0 mM ~ 6.6 mM); pO2 15.00 kPa
Level 3: glucose 13.8 mM (12.0 mM ~ 15.6 mM); pO2 8.98 kPa
0 5 10 15 20 25 30 35 400
2000
4000
6000
8000
10000
Level 1 Level 2 Level 3
I (pA
)
updating no.
Std_E0 5 10 15 20 25 30 35 40
0
2000
4000
6000
8000
10000
Ref_E
5 mM 10 mM 20 mM
I (pA
)
updating no.
0 5 10 15 20 25 30 35 400
2000
4000
6000
8000
10000
12000
14000
16000
NPM_E
Level 1 Level 2 Level 3
I (pA
)
updating no.0 5 10 15 20 25 30 35 40
0
2000
4000
6000
8000
10000
12000
14000
16000
18000
NPM_UV_E
Level 1 Level 2 Level 3
I (pA
)
updating no.
103

Chapter 6 Dialysis Performance
92
Note that the difference in pO2 only exists for the original QC solutions as sealed in glass
containers. We leave them exposure to air for enough time before measurements, so we believe
that the influence caused by pO2 difference can be minimized between samples.
Figure 6.15 Linearity response vs. glucose concentration using different sensors Std_E, Ref_E, NPM_E, and NPM_UV_E. The data are selected from Fig. 6.14 to give a best fit to linear relationship.
A dependence of current response on glucose concentration for each type of electrodes is
presented in Figure 6.15 by selecting the data (Fig 6.14) which can best fit to a linear correlation
(Note it is not necessary to be the data at equilibrium state). As shown in Figure 6.15, Std_E and
Ref_E had a wide linear range due to low pore density PET outer membrane. The PET
membrane diminishes glucose diffusion by reduction of effective porosity while maintaining
relatively free diffusion of the enzyme co-substrate oxygen; both of these effects clearly
accentuated the benefits of low pore density membranes. Unfortunately, the NPM outer
membrane gave linearity only to ~5 mM. Apparently, decreasing the pore size of the NPM did
not result in enhancement of linearity that may balance the linearity loss due to high porosity. In
our case, the depletion of H2O2 due to a back diffusion is not significant as confirmed by the
experimental Deff ratio of H2O2 and glucose (Table 6.6). From these observations, it is clear that
proper control over the incoming glucose flux is needed to increase sensor linearity. It is
important that the sensor is linear in the whole measurement range also on samples with low
oxygen. An outer membrane which has high oxygen permeability and the ability to properly
control glucose diffusion is preferred. The gas permeation has been in detail discussed in chapter
0 5 10 15 200
2000
4000
6000
8000
Std_E Ref_E NPM_E NPM_UV_E
I (pA
)
glucose concentration (mM)
104
Chapter 6 Dialysis Performance
93
5. A proper use of diffusion limiting membranes makes it even possible to measure aqueous
glucose concentration at values several hundred times higher than the enzyme Michaelis–Menten
constant, Km.11
A decrease appeared in NPM_E response after experiencing a maximum value as shown in Fig
6.14. Similar observations were also found for some of NPM_UV_E samples. This is mainly
caused by the strong depletion of oxygen, resulting in an undesired O2 dependence response. It
can be also due to limitations in the read-out of electrical signal. In addition, we may take other
considerations into account, e.g. enzyme activity in acidic environment, the stability in
sensitivity over time as measuring such high glucose samples.
6.4. Conclusions
Diffusive transport properties of NPMs
The diffusive transport can be altered over a significant range by changing surface
morphology, thickness, and active porosity. Diffusion profiles for the glucose transport through
non-skin, single-skin and double-skin membranes were presented and interpreted by a simple
model of defects’ size and distribution on the skin layer(s). Particularly for double skin samples
the increasing flux with thickness was found. The flux through ds membranes is almost 2 orders
of magnitude lower than through ns membranes. The permeation rate of aqueous solutions can
be also tuned by generating patterned hydrophilized regions of the membranes thus varying
active porosity. The effective diffusion coefficient over a range of 3 orders of magnitude can be
possibly attained as quality of UV source and patterned mask are enhanced. The selectivity of the
nanoporous membranes was investigated relative to a series of antibiotics, proteins and other
biomolecules. The solute transport was discussed in terms of size exclusion and hydrodynamic
interactions. A precise selection can be attained by the size-sorting based on the narrow
distributed nanoporosity. In addition, a desired selectivity can be created by involving other
interaction effects depending on the nature of molecules. The demonstrated flexible diffusion
renders this type of nanoporous membranes interesting for various applications. For example, the
skin membranes (when we can well control the defects) with a low flux might be useful for
105
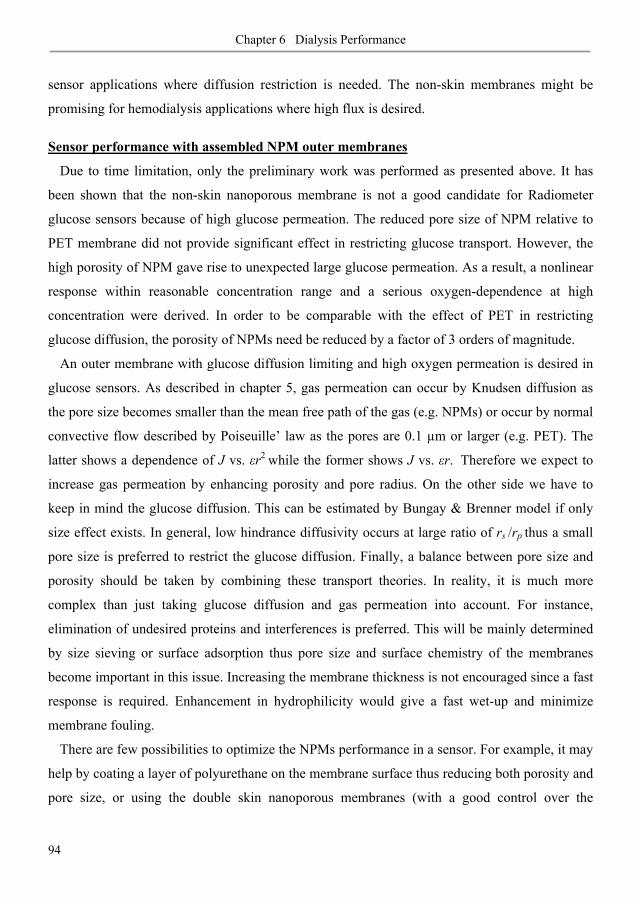
Chapter 6 Dialysis Performance
94
sensor applications where diffusion restriction is needed. The non-skin membranes might be
promising for hemodialysis applications where high flux is desired.
Sensor performance with assembled NPM outer membranes
Due to time limitation, only the preliminary work was performed as presented above. It has
been shown that the non-skin nanoporous membrane is not a good candidate for Radiometer
glucose sensors because of high glucose permeation. The reduced pore size of NPM relative to
PET membrane did not provide significant effect in restricting glucose transport. However, the
high porosity of NPM gave rise to unexpected large glucose permeation. As a result, a nonlinear
response within reasonable concentration range and a serious oxygen-dependence at high
concentration were derived. In order to be comparable with the effect of PET in restricting
glucose diffusion, the porosity of NPMs need be reduced by a factor of 3 orders of magnitude.
An outer membrane with glucose diffusion limiting and high oxygen permeation is desired in
glucose sensors. As described in chapter 5, gas permeation can occur by Knudsen diffusion as
the pore size becomes smaller than the mean free path of the gas (e.g. NPMs) or occur by normal
convective flow described by Poiseuille’ law as the pores are 0.1 μm or larger (e.g. PET). The
latter shows a dependence of J vs. r2 while the former shows J vs. r. Therefore we expect to
increase gas permeation by enhancing porosity and pore radius. On the other side we have to
keep in mind the glucose diffusion. This can be estimated by Bungay & Brenner model if only
size effect exists. In general, low hindrance diffusivity occurs at large ratio of rs /rp thus a small
pore size is preferred to restrict the glucose diffusion. Finally, a balance between pore size and
porosity should be taken by combining these transport theories. In reality, it is much more
complex than just taking glucose diffusion and gas permeation into account. For instance,
elimination of undesired proteins and interferences is preferred. This will be mainly determined
by size sieving or surface adsorption thus pore size and surface chemistry of the membranes
become important in this issue. Increasing the membrane thickness is not encouraged since a fast
response is required. Enhancement in hydrophilicity would give a fast wet-up and minimize
membrane fouling.
There are few possibilities to optimize the NPMs performance in a sensor. For example, it may
help by coating a layer of polyurethane on the membrane surface thus reducing both porosity and
pore size, or using the double skin nanoporous membranes (with a good control over the
106
Chapter 6 Dialysis Performance
95
defects). In addition, the mechanical strength of the nanoporous 1,2-PB membranes is also a
serious concern in this application and others. Both a reasonable high molecular weight
copolymer precursor with less cross-linking degree might make enhanced flexibility for the
resultant nanoporous membranes.
6.5. References
[1] Davies, M.L.; Hamilton, C.J.; Murphy, S. M. and Tighe, B. J. Polymer Membranes in Clinical Sensor Applications I. An Overview of Membrane Function. Biomaterials 1992, 13, 971–977.
[2] Reference Manual for ABLTM 700 series, Radiometer ApS.
[3]Baker, R. W. Membrane Technology and Applications, 2nd ed., John Wiley& Sons, Ltd., Chichester, 2004.
[4] Saripalli, K. P.; Serne, R.J.; Meyer, P.D.; McGrail, B.P. Prediction of Diffusion Coefficients in Porous Media Using Tortuosity Factors Based on Interfacial Areas. Ground Water 2002, 40, 346–352.
[5] Deen, W. M. Hindered Transport of Large Molecules in Liquid-Filled Pores. AIChE J. 1987, 33, 1409–1425.
[6] Dechadilok, P.; Deen, W. M. Hindrance Factors for Diffusion and Convection in Pores. Ind. Eng. Chem. Res. 2006, 45, 6953-6959.
[7] Anderson, J. L.; Quinn, J. A. Restricted Transport in Small Pores – Model for Steric Exclusion and Hindered Particle Motion. Biophys. J. 1974, 14,130–150.
[8] Bungay, P. M.; Brenner, H. The Motion of a Closely Fitting Sphere in a Fluid-Filled Tube. Int. J. Multiph. Flow, 1973, 1, 25–56.
[9] Kermis, H. R.; Rao, G.; Barbari, T. A. Transport Properties of Phema Membranes for Optical Glucose Affinity Sensors. J. Membr. Sci. 2003, 212, 75–86.
[10] Crank, J. The Mathematics of Diffusion, Oxford Univeristy Press, Oxford, 1975.
[11] Cornish-Bowden, A. Fundamentals of Enzyme Kinetics. Portland Press, London, 2004.
107

Chapter 6 Dialysis Performance
96
108
Chapter 7 Ultrafiltration Performance
97
Chapter 7 Ultrafiltration Performance of Nanoporous 1,2-PB Membranes
The previous chapter reported the work on diffusive transport properties in the nanoporous 1,2-
PB membranes towards a series of proteins, antibiotics and other biomolecules. This chapter will
present the study on ultrafiltration properties of the membranes in different conditions and
explore their values as ultrafilter. At the present stage, only the non-skin membranes (See
chapters 3.2 & 4.2.2) with thickness of 25 μm have been extensively investigated.
A series of PEG molecules with varying molecular weight (MW) were used to explore the
effects of fouling on the flux and sieving property of the nanoporous membranes. We begin with
a discussion of the membrane–solute interaction by evaluating static adsorption of PEG
molecules from two different solvents. An adsorptive fouling with PEG is reflected by reduction
of water flux after static adsorption and after ultrafiltration equilibration. We determined the
rejection profiles of the nanoporous membranes using a series of single PEG solutions and
mixtures of PEG solutions at different flux rates. The effects of solvent properties and surface
hydrophilization on the permeate flow and rejection profile were in detail investigated for the
nanoporous membranes. Different separation mechanisms can be possibly attained in the
ultrafiltration mainly depending on the pore surface chemistry. This part of work has been
reported in the manuscript Ultrafiltration by Gyroid Nanoporous Polymer Membranes published
in Journal of Membrane Science 2011.
109
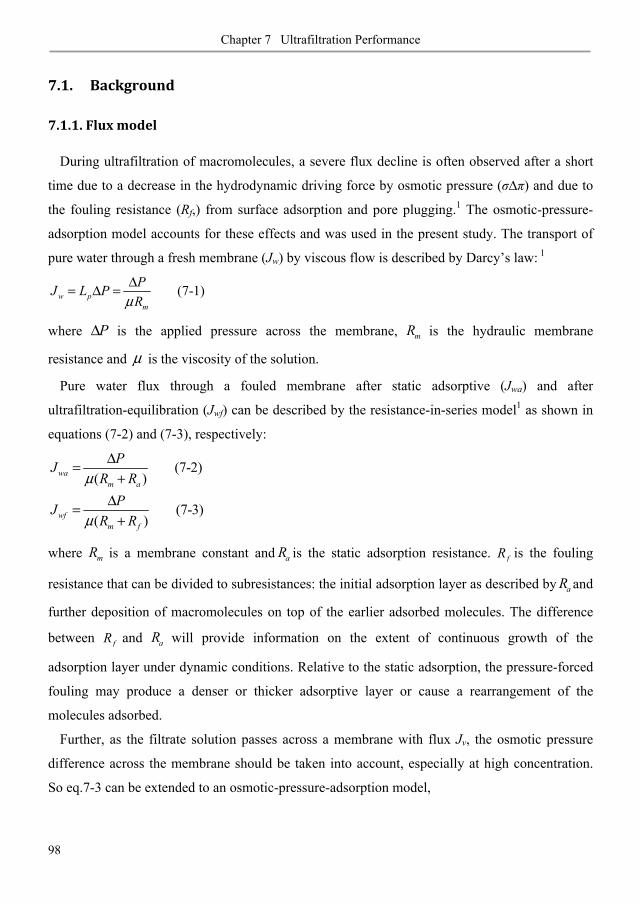
Chapter 7 Ultrafiltration Performance
98
7.1. Background
7.1.1. Flux model
During ultrafiltration of macromolecules, a severe flux decline is often observed after a short
time due to a decrease in the hydrodynamic driving force by osmotic pressure ( ) and due to
the fouling resistance (Rf,) from surface adsorption and pore plugging.1 The osmotic-pressure-
adsorption model accounts for these effects and was used in the present study. The transport of
pure water through a fresh membrane (Jw) by viscous flow is described by Darcy’s law: 1
(7-1)w pm
PJ L PRμ
Δ= Δ =
where PΔ is the applied pressure across the membrane, mR is the hydraulic membrane
resistance and μ is the viscosity of the solution.
Pure water flux through a fouled membrane after static adsorptive (Jwa) and after
ultrafiltration-equilibration (Jwf) can be described by the resistance-in-series model1 as shown in
equations (7-2) and (7-3), respectively:
(7-2)( )
(7-3)( )
wam a
wfm f
PJR R
PJR R
μ
μ
Δ=+
Δ=+
where mR is a membrane constant and aR is the static adsorption resistance. fR is the fouling
resistance that can be divided to subresistances: the initial adsorption layer as described by aR and
further deposition of macromolecules on top of the earlier adsorbed molecules. The difference
between fR and aR will provide information on the extent of continuous growth of the
adsorption layer under dynamic conditions. Relative to the static adsorption, the pressure-forced
fouling may produce a denser or thicker adsorptive layer or cause a rearrangement of the
molecules adsorbed.
Further, as the filtrate solution passes across a membrane with flux Jv, the osmotic pressure
difference across the membrane should be taken into account, especially at high concentration.
So eq.7-3 can be extended to an osmotic-pressure-adsorption model,
110
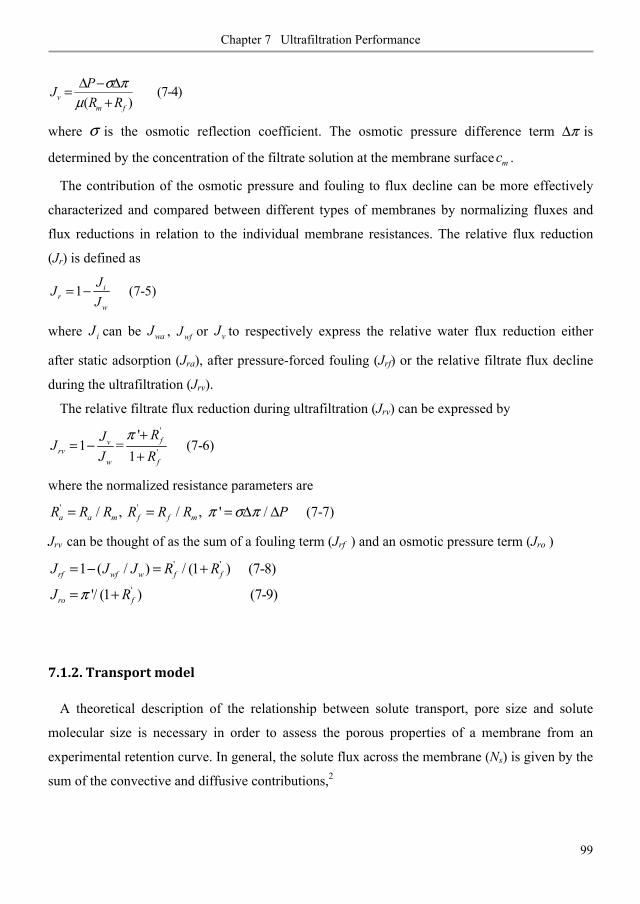
Chapter 7 Ultrafiltration Performance
99
(7-4)( )v
m f
PJR R
σ πμΔ − Δ=
+
where σ is the osmotic reflection coefficient. The osmotic pressure difference term πΔ is
determined by the concentration of the filtrate solution at the membrane surface mc .
The contribution of the osmotic pressure and fouling to flux decline can be more effectively
characterized and compared between different types of membranes by normalizing fluxes and
flux reductions in relation to the individual membrane resistances. The relative flux reduction
(Jr) is defined as
1 (7-5)ir
w
JJJ
= −
where iJ can be waJ , wfJ or vJ to respectively express the relative water flux reduction either
after static adsorption (Jra), after pressure-forced fouling (Jrf) or the relative filtrate flux decline
during the ultrafiltration (Jrv).
The relative filtrate flux reduction during ultrafiltration (Jrv) can be expressed by '
'
'1 = (7-6)
1fv
rvw f
RJJJ R
π += −
+
where the normalized resistance parameters are ' '/ , / , ' / (7-7)a a m f f mR R R R R R Pπ σ π= = = Δ Δ
Jrv can be thought of as the sum of a fouling term (Jrf ) and an osmotic pressure term (Jro ) ' '
'
1 ( / ) / (1 ) (7-8)
'/ (1 ) (7-9)rf wf w f f
ro f
J J J R R
J Rπ
= − = +
= +
7.1.2. Transport model
A theoretical description of the relationship between solute transport, pore size and solute
molecular size is necessary in order to assess the porous properties of a membrane from an
experimental retention curve. In general, the solute flux across the membrane (Ns) is given by the
sum of the convective and diffusive contributions,2
111
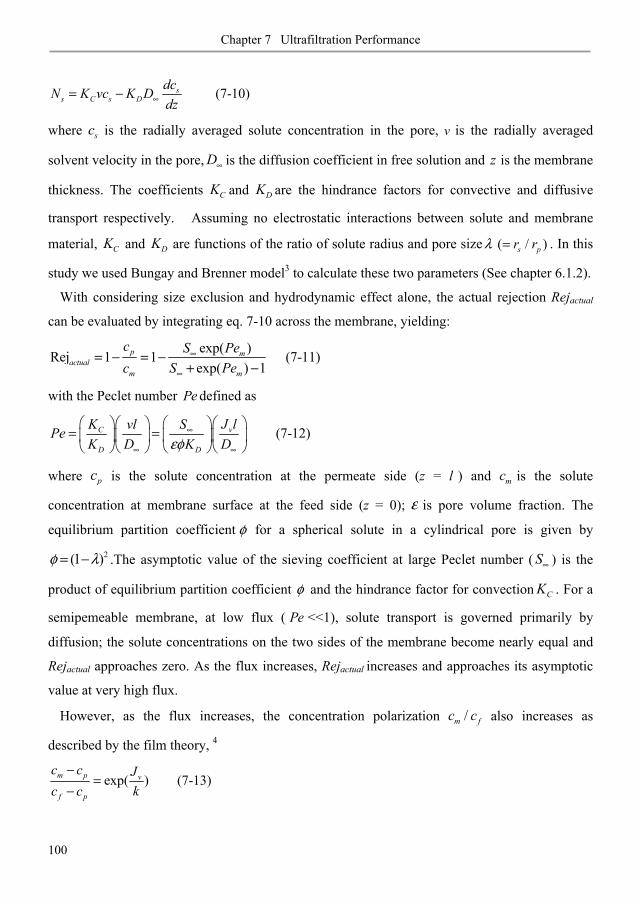
Chapter 7 Ultrafiltration Performance
100
(7-10)ss C s D
dcN K vc K Ddz∞= −
where sc is the radially averaged solute concentration in the pore, v is the radially averaged
solvent velocity in the pore, D∞ is the diffusion coefficient in free solution and z is the membrane
thickness. The coefficients CK and DK are the hindrance factors for convective and diffusive
transport respectively. Assuming no electrostatic interactions between solute and membrane
material, CK and DK are functions of the ratio of solute radius and pore size ( / )s pr rλ = . In this
study we used Bungay and Brenner model3 to calculate these two parameters (See chapter 6.1.2).
With considering size exclusion and hydrodynamic effect alone, the actual rejection Rejactual
can be evaluated by integrating eq. 7-10 across the membrane, yielding:
exp( )Rej 1 1 (7-11)exp( ) 1
p mactual
m m
c S Pec S Pe
∞
∞
= − = −+ −
with the Peclet number Pe defined as
(7-12)C v
D D
K J lSvlPeK D K Dεφ
∞
∞ ∞
= =
where pc is the solute concentration at the permeate side (z = l ) and mc is the solute
concentration at membrane surface at the feed side (z = 0); ε is pore volume fraction. The
equilibrium partition coefficient φ for a spherical solute in a cylindrical pore is given by
2(1 )φ λ= − .The asymptotic value of the sieving coefficient at large Peclet number ( S∞ ) is the
product of equilibrium partition coefficient φ and the hindrance factor for convection CK . For a
semipemeable membrane, at low flux ( Pe <<1), solute transport is governed primarily by
diffusion; the solute concentrations on the two sides of the membrane become nearly equal and
Rejactual approaches zero. As the flux increases, Rejactual increases and approaches its asymptotic
value at very high flux.
However, as the flux increases, the concentration polarization /m fc c also increases as
described by the film theory, 4
exp( ) (7-13)m p v
f p
c c Jc c k
−=
−
112
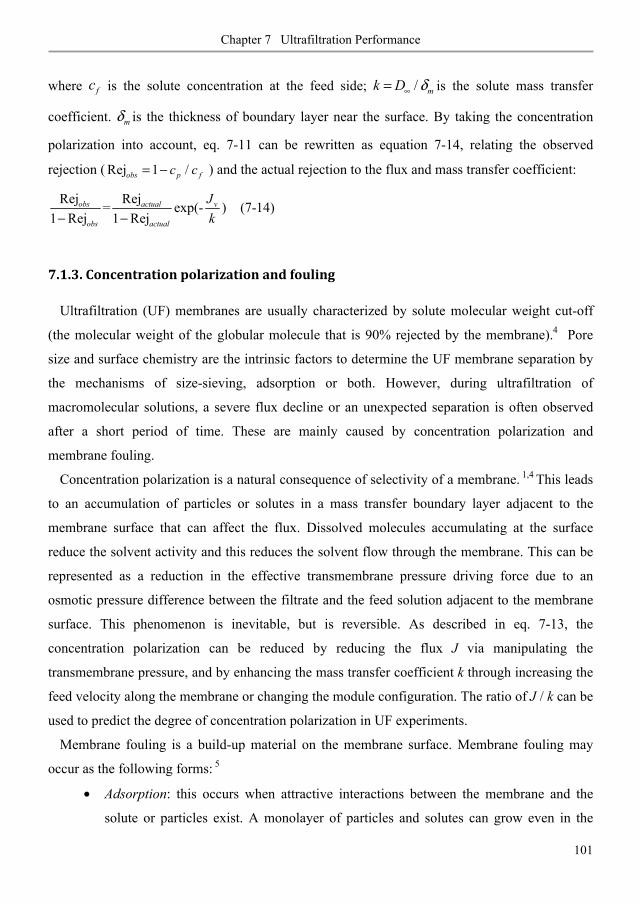
Chapter 7 Ultrafiltration Performance
101
where fc is the solute concentration at the feed side; / mk D δ∞= is the solute mass transfer
coefficient. mδ is the thickness of boundary layer near the surface. By taking the concentration
polarization into account, eq. 7-11 can be rewritten as equation 7-14, relating the observed
rejection ( Rej 1 /obs p fc c= − ) and the actual rejection to the flux and mass transfer coefficient:
Rej Rej= exp(- ) (7-14)1 Rej 1 Rej
obs actual v
obs actual
Jk− −
7.1.3. Concentration polarization and fouling
Ultrafiltration (UF) membranes are usually characterized by solute molecular weight cut-off
(the molecular weight of the globular molecule that is 90% rejected by the membrane).4 Pore
size and surface chemistry are the intrinsic factors to determine the UF membrane separation by
the mechanisms of size-sieving, adsorption or both. However, during ultrafiltration of
macromolecular solutions, a severe flux decline or an unexpected separation is often observed
after a short period of time. These are mainly caused by concentration polarization and
membrane fouling.
Concentration polarization is a natural consequence of selectivity of a membrane. 1,4 This leads
to an accumulation of particles or solutes in a mass transfer boundary layer adjacent to the
membrane surface that can affect the flux. Dissolved molecules accumulating at the surface
reduce the solvent activity and this reduces the solvent flow through the membrane. This can be
represented as a reduction in the effective transmembrane pressure driving force due to an
osmotic pressure difference between the filtrate and the feed solution adjacent to the membrane
surface. This phenomenon is inevitable, but is reversible. As described in eq. 7-13, the
concentration polarization can be reduced by reducing the flux J via manipulating the
transmembrane pressure, and by enhancing the mass transfer coefficient k through increasing the
feed velocity along the membrane or changing the module configuration. The ratio of J / k can be
used to predict the degree of concentration polarization in UF experiments.
Membrane fouling is a build-up material on the membrane surface. Membrane fouling may
occur as the following forms: 5
• Adsorption: this occurs when attractive interactions between the membrane and the
solute or particles exist. A monolayer of particles and solutes can grow even in the
113
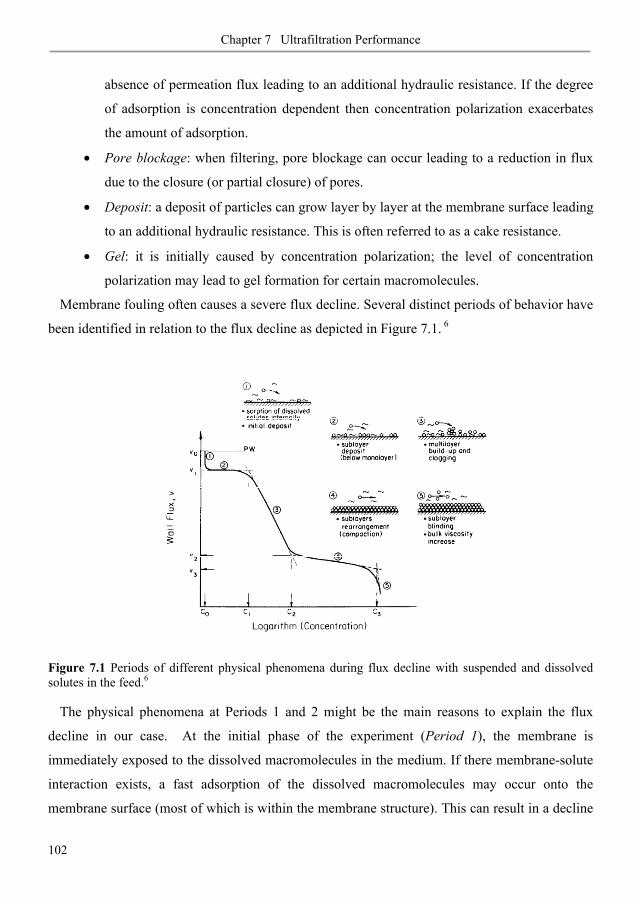
Chapter 7 Ultrafiltration Performance
102
absence of permeation flux leading to an additional hydraulic resistance. If the degree
of adsorption is concentration dependent then concentration polarization exacerbates
the amount of adsorption.
• Pore blockage: when filtering, pore blockage can occur leading to a reduction in flux
due to the closure (or partial closure) of pores.
• Deposit: a deposit of particles can grow layer by layer at the membrane surface leading
to an additional hydraulic resistance. This is often referred to as a cake resistance.
• Gel: it is initially caused by concentration polarization; the level of concentration
polarization may lead to gel formation for certain macromolecules.
Membrane fouling often causes a severe flux decline. Several distinct periods of behavior have
been identified in relation to the flux decline as depicted in Figure 7.1. 6
Figure 7.1 Periods of different physical phenomena during flux decline with suspended and dissolved solutes in the feed.6
The physical phenomena at Periods 1 and 2 might be the main reasons to explain the flux
decline in our case. At the initial phase of the experiment (Period 1), the membrane is
immediately exposed to the dissolved macromolecules in the medium. If there membrane-solute
interaction exists, a fast adsorption of the dissolved macromolecules may occur onto the
membrane surface (most of which is within the membrane structure). This can result in a decline
114
Chapter 7 Ultrafiltration Performance
103
in the permeation rate. The kinetics of macromolecule sorption is thought to be fast and the
binding constants high. 7 When all the sorption sites are occupied, a pseudo-steady state is
reached. Period 2 is build-up of first sublayer. During this period the suspended solutes begin to
deposit onto the membrane slowly increasing the sublayer coverage. Since for most of this
period monolayer coverage has not yet been attained, there is little effect on the permeate rate.
As monolayer coverage approaches, if solute-solute interaction happens, there will be followed
by a build-up of multilayer (Period 3).
7.2. Experimental
Non-skin nanoporous 1,2-PB membranes were used in the present work. All the membranes
were prepared with the sandwich method by solvent casting 1,2-PB-b-PDMS copolymer solution
(BD36 batch) between two glass plates, thus showing surface porosity of 40%. The membrane
thickness is designed to be 25 μm. The nanoporous 1,2-PB membranes are natually hydrophobic.
For comparison in ultrafiltration properties, one batch of the original membranes was
functionalized via UV-initiated thoil-ene chemistry. Both membrane preparation and surface
hydrophilization have been described in detail in chapters 3.2 and 3.3.
7.2.1. Static adsorption of PEG
Nanoporous membranes were immersed into PEG solutions (1 g/L) and kept on a shaker. Prior
to dipping in the PEG solution, the original hydrophobic membranes were prewet with ethanol
and then replaced with pure water. After 48 h of immersion, they were rinsed twice in pure water,
1 min for each time in order to remove the excess solution on membrane surface. Gravimetry,
FTIR and water flux of the membranes were measured before and after exposure to PEG
solutions. The PEG adsorption is defined as the difference in the dry mass before ( 0m ) and after
PEG adsorption ( am ) normalized by 0m as follows:
0
0
100% (7-15)aPEG
m mmm−Δ = ⋅
The static adsorption resistance Ra was calculated from experimental data of relative water flux
reduction Jwa according to eqs. 7-1 and 7-2.
115
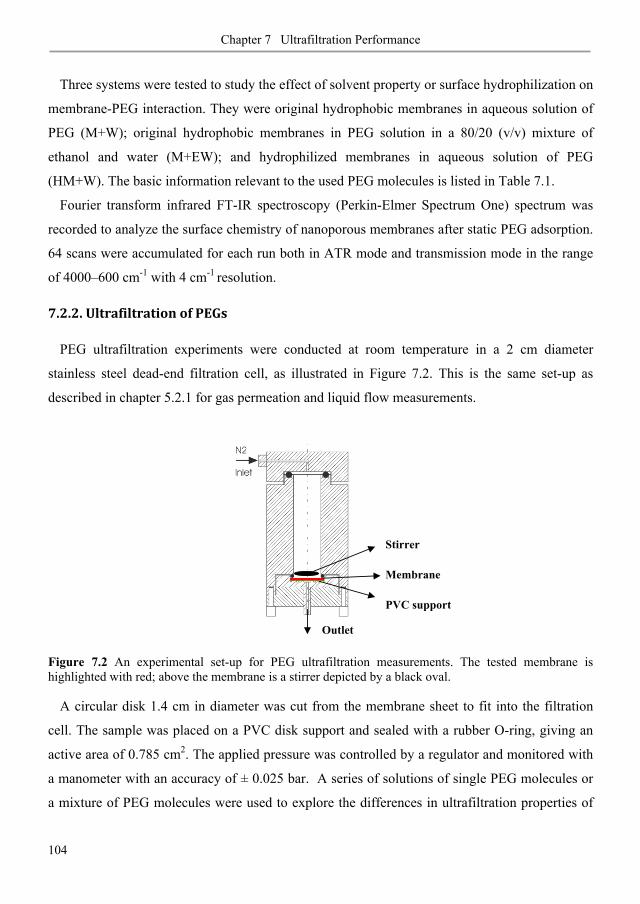
Chapter 7 Ultrafiltration Performance
104
Three systems were tested to study the effect of solvent property or surface hydrophilization on
membrane-PEG interaction. They were original hydrophobic membranes in aqueous solution of
PEG (M+W); original hydrophobic membranes in PEG solution in a 80/20 (v/v) mixture of
ethanol and water (M+EW); and hydrophilized membranes in aqueous solution of PEG
(HM+W). The basic information relevant to the used PEG molecules is listed in Table 7.1.
Fourier transform infrared FT-IR spectroscopy (Perkin-Elmer Spectrum One) spectrum was
recorded to analyze the surface chemistry of nanoporous membranes after static PEG adsorption.
64 scans were accumulated for each run both in ATR mode and transmission mode in the range
of 4000–600 cm-1 with 4 cm-1 resolution.
7.2.2. Ultrafiltration of PEGs
PEG ultrafiltration experiments were conducted at room temperature in a 2 cm diameter
stainless steel dead-end filtration cell, as illustrated in Figure 7.2. This is the same set-up as
described in chapter 5.2.1 for gas permeation and liquid flow measurements.
Figure 7.2 An experimental set-up for PEG ultrafiltration measurements. The tested membrane is highlighted with red; above the membrane is a stirrer depicted by a black oval.
A circular disk 1.4 cm in diameter was cut from the membrane sheet to fit into the filtration
cell. The sample was placed on a PVC disk support and sealed with a rubber O-ring, giving an
active area of 0.785 cm2. The applied pressure was controlled by a regulator and monitored with
a manometer with an accuracy of ± 0.025 bar. A series of solutions of single PEG molecules or
a mixture of PEG molecules were used to explore the differences in ultrafiltration properties of
Stirrer
Membrane
PVC support
Outlet
116

Chapter 7 Ultrafiltration Performance
105
the three systems, M+W, M+EW and HM+W. PEG were dissolved in either pure water (W) or a
mixture of ethanol and water (EW, v/v 80:20) at a concentration of 1.0 g/L. Seven different
molecular mass of PEG molecules (see Table 7.1) were tested to characterize the rejection
profiles of the nanoporous membranes. A mixture of PEG solutions only contains PEG
molecules with molecular weight (MW) from 1 kg/mol to 35 kg/mol and 0.2 g/L for each
molecular weight of PEG.
Table 7.1 Basic characteristics of PEG molecules used in this study.
a. the cited hydrodynamic radius of each PEG molecule.8-10
Wetting procedures were the same as for the liquid convection measurements. Once the
membrane was in place, wet, and flushed, the pure solvent flux was run for 1 h at a pressure drop
of 1 bar to check if the membrane performed consistently with the membranes used for liquid
convection experiments. At this point, the filtration cell was filled with 10 ml of feed solution,
the stirring speed was set at 500 rpm and the pressure drop was then set to the desired value. The
system was flushed for 30 min before collecting the permeate solution. The mass of the permeate
solution was measured at certain time intervals to obtain a profile of the permeate solution flux
with time. Thereafter, the solution was removed and the cell was rinsed twice by filling with pure
water to remove the excess of PEG solution on the membrane surface. Each ultrafiltration run
was followed by pure water flux measurement for 1 h in order to reveal the pressure-forced
membrane fouling and compare with the static PEG adsorption. The water flux measurement was
conducted as the liquid flow measurements presented in chapter 5.2.2. The relative water flux
reduction and fouling resistance were calculated from eqs. 7-3, 7-5 and 7-7. After each
PEG Sample Mn (kg/mol) Rh (nm)a Producer
PEG1K 1.0 0.788 Sigma-aldrich
PEG4K 4.0 1.729 Merck
PEG8K 8.0 2.628 Fluka
PEG12K 12.0 3.5310 Fluka
PEG35K 35.0 8.228 Fluka
PEG56K 55.6 10.548 Polymer Laboratories
PEG100K 97.4 18.118 Polymer Laboratories
117

Chapter 7 Ultrafiltration Performance
106
measurement, the membrane was washed in chloroform for at least 3 hours and then rinsed with
ethanol and water before it was used for next measurement.
The concentrations of the PEG solutions from both permeate side and feed side were analyzed
by size exclusion chromatography (Shimadzu) with a RI detector (RID-10A), using an
UltrahydrogelTM 250 column (particle size 6 μm, 7.8x300 mm) (Waters). The mobile phase was
95% water with 5% methanol. The flow rate was set to 1 ml/min and the injection volume 100
ul. The observed rejection Rejobs ( / )p bc c= was determined by integrating the area under the SEC
peak.
7.3. Results and discussion
7.3.1. Membrane fouling under static and dynamic conditions
Membrane performance, both filtrate flux and selectivity can be severely affected by
concentration polarization and membrane fouling.1, 4, 5, 11 The latter includes gel layer,
adsorption, pore blocking, deposit, and cake formation. Macromolecules such as proteins,
polysaccharides and synthetic polymers in the feed solution are generally considered to highly
contribute to the build-up of membrane fouling.5 In this study, PEG was selected as to examine
ultrafiltration properties of the nanoporous membranes. To reveal the potential fouling and better
interpret the ultrafiltration results, we first present the static adsorption of PEG from two
different solvents for both hydrophobic and hydrophilic membranes.
Static PEG adsorption was performed in the M+W, M+EW and HM+W systems with 1 g/L
PEG solutions for 48 h. Figure 7.3 shows the mass gain after static adsorption of PEG with
different molar masses. Over a molecular weight (MW) range of 1 – 35 kg/mol, the M+W
system showed a significant mass increase (Note it is much higher than the values expected for
the only outer-surface-adsorption); while much less mass was gained in the HM+W system and
even less in the M+EW system. In conditions of equi-partition of PEG between the pores and the
bulk, the mass would increase by at most 0.067%, which is negligible relative to the observed
adsorption values. In fact, it should be much less for the bigger molecules due to the exclusion
effect.
118
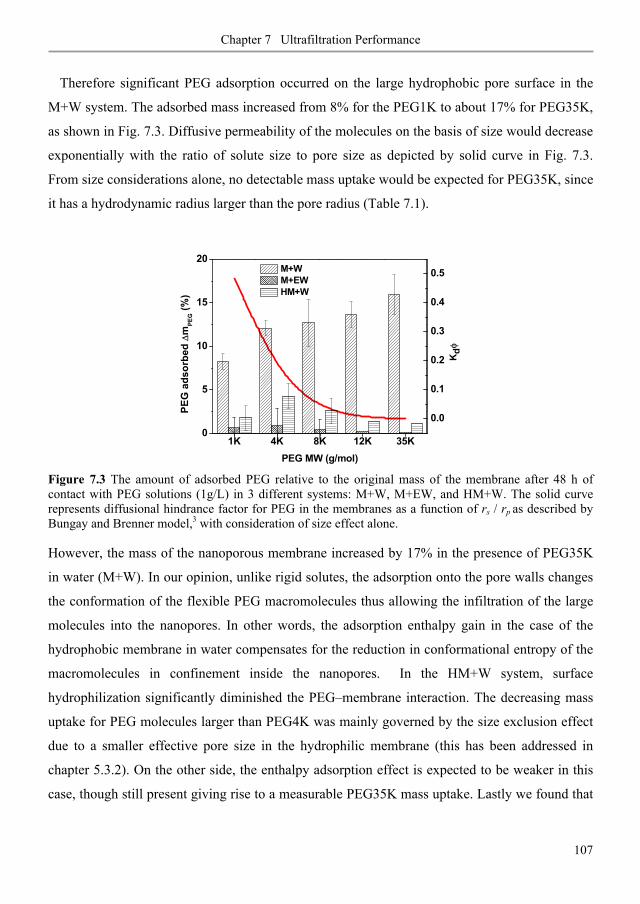
Chapter 7 Ultrafiltration Performance
107
Therefore significant PEG adsorption occurred on the large hydrophobic pore surface in the
M+W system. The adsorbed mass increased from 8% for the PEG1K to about 17% for PEG35K,
as shown in Fig. 7.3. Diffusive permeability of the molecules on the basis of size would decrease
exponentially with the ratio of solute size to pore size as depicted by solid curve in Fig. 7.3.
From size considerations alone, no detectable mass uptake would be expected for PEG35K, since
it has a hydrodynamic radius larger than the pore radius (Table 7.1).
Figure 7.3 The amount of adsorbed PEG relative to the original mass of the membrane after 48 h of contact with PEG solutions (1g/L) in 3 different systems: M+W, M+EW, and HM+W. The solid curve represents diffusional hindrance factor for PEG in the membranes as a function of rs / rp as described by Bungay and Brenner model,3 with consideration of size effect alone.
However, the mass of the nanoporous membrane increased by 17% in the presence of PEG35K
in water (M+W). In our opinion, unlike rigid solutes, the adsorption onto the pore walls changes
the conformation of the flexible PEG macromolecules thus allowing the infiltration of the large
molecules into the nanopores. In other words, the adsorption enthalpy gain in the case of the
hydrophobic membrane in water compensates for the reduction in conformational entropy of the
macromolecules in confinement inside the nanopores. In the HM+W system, surface
hydrophilization significantly diminished the PEG–membrane interaction. The decreasing mass
uptake for PEG molecules larger than PEG4K was mainly governed by the size exclusion effect
due to a smaller effective pore size in the hydrophilic membrane (this has been addressed in
chapter 5.3.2). On the other side, the enthalpy adsorption effect is expected to be weaker in this
case, though still present giving rise to a measurable PEG35K mass uptake. Lastly we found that
0.0
0.1
0.2
0.3
0.4
0.5
Kdφ
1K 4K 8K 12K 35K0
5
10
15
20
PEG
ads
orbe
d Δm
PEG (%
)
PEG MW (g/mol)
M+W M+EW HM+W
119
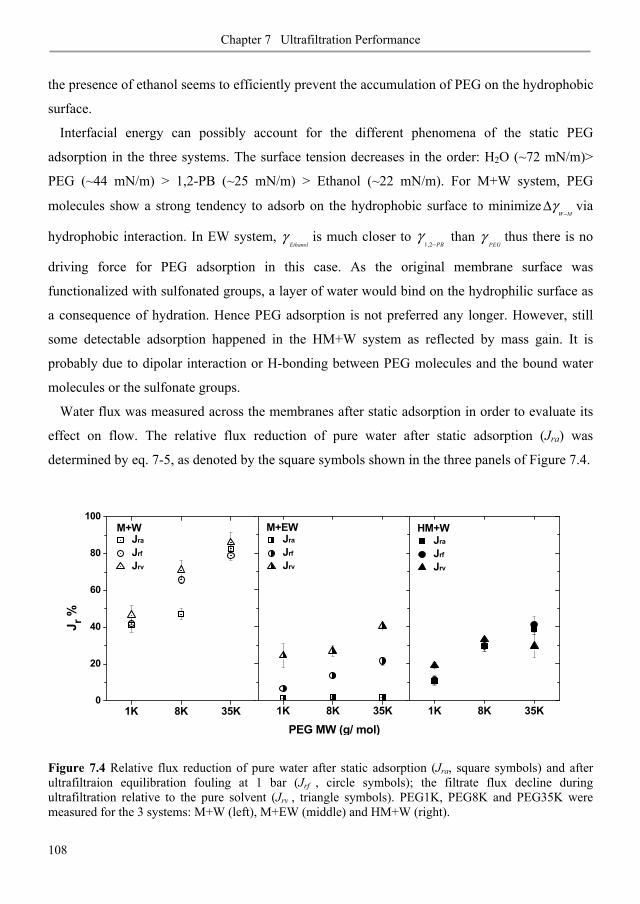
Chapter 7 Ultrafiltration Performance
108
the presence of ethanol seems to efficiently prevent the accumulation of PEG on the hydrophobic
surface.
Interfacial energy can possibly account for the different phenomena of the static PEG
adsorption in the three systems. The surface tension decreases in the order: H2O (~72 mN/m)>
PEG (~44 mN/m) > 1,2-PB (~25 mN/m) > Ethanol (~22 mN/m). For M+W system, PEG
molecules show a strong tendency to adsorb on the hydrophobic surface to minimizeW M
γ−
Δ via
hydrophobic interaction. In EW system, Ethanol
γ is much closer to 1,2 PB
γ−
than
PEGγ thus there is no
driving force for PEG adsorption in this case. As the original membrane surface was
functionalized with sulfonated groups, a layer of water would bind on the hydrophilic surface as
a consequence of hydration. Hence PEG adsorption is not preferred any longer. However, still
some detectable adsorption happened in the HM+W system as reflected by mass gain. It is
probably due to dipolar interaction or H-bonding between PEG molecules and the bound water
molecules or the sulfonate groups.
Water flux was measured across the membranes after static adsorption in order to evaluate its
effect on flow. The relative flux reduction of pure water after static adsorption (Jra) was
determined by eq. 7-5, as denoted by the square symbols shown in the three panels of Figure 7.4.
Figure 7.4 Relative flux reduction of pure water after static adsorption (Jra, square symbols) and after ultrafiltraion equilibration fouling at 1 bar (Jrf , circle symbols); the filtrate flux decline during ultrafiltration relative to the pure solvent (Jrv , triangle symbols). PEG1K, PEG8K and PEG35K were measured for the 3 systems: M+W (left), M+EW (middle) and HM+W (right).
1K 8K 35K
PEG MW (g/ mol)
Jra
Jrf
Jrv
M+EW
1K 8K 35K
Jra
Jrf
Jrv
HM+W
1K 8K 35K0
20
40
60
80
100
Jra
Jrf
Jrv
J r %
M+W
120

Chapter 7 Ultrafiltration Performance
109
After static adsorption, the M+W system presented a significantly greater reduction in water
permeability than the other two systems, giving a water flux reduction of ~ 40% for PEG1K and
up to 80% for PEG 35K. Negligible water flux reduction Jra was seen in the M+EW system; the
small difference in water flux is of the same order as the experimental uncertainty. In the HM+W
system, Jra is considerably smaller than for the M+W system, but surface hydrophilization
apparently is not as effective as ethanol in preventing PEG static adsorption. These observations
agree well with the results shown in Figure 7.3.
A pronounced effect of molar mass on the water flux reduction Jra is clearly seen in Figure 7.4
for the M+W and HM+W systems. We noticed that the dependence of Jra (Fig. 7.4) is not simply
proportional to the amount of PEG adsorbed (Fig. 7.3). In the HM+W system a relatively higher
Jra was observed than what we expected from the mass gain. Firstly, this could be interpreted as
due to pore-blocking which is more likely to occur with larger molecules; while smaller
molecules mostly cause pore-narrowing by adsorption onto the pore walls.5 With increasing
/s pr r the probability for pore blocking will increase. As suggested by Zydney et al.,5 the pore
blocking will yield a higher contribution to membrane resistance than pore narrowing. Ulbricht
et. al. also observed a similar effect from Dextran on adsorptive fouling of PES membranes.12
Secondly, water mobility could also be slowed down due to the larger PEG molecules that cause
a higher friction to water molecules inside pores. Particularly, due to the smaller effective pore
size in the HM+W system (this has been addressed in chapter 5.3.2), the same extent of static
adsorption would lead to a more serious flux reduction as shown in Fig. 7.4. At the moment we
do not understand the location of the data point (two measurements) for the sample PEG8K in
Fig. 7.4 for the M+W system.
We also examined the hydrophobic membrane samples after static adsorption in water by
performing FTIR measurements in both ATR and transmission modes (TM). Figure 7.5 gives
representatives of ATR and transmission spectra for PEG1K and PEG100K. The main feature of
these spectra is the presence of all the bands of PEG molecules in the spectrum of the
nanoporous 1,2-PB. These spectra clearly demonstrate the PEG adsorption. A peak at ~ 1640 cm-
1 is a characteristic peak of double bounds in 1,2-PB; A broad peak at ~ 1100 cm-1 is ascribed to
the –CH2–OH group in PEG molecules. ATR mode usually reflects the informative depth of 1~
2 μm while transmission mode can be able to give the information across the entire bulk
121
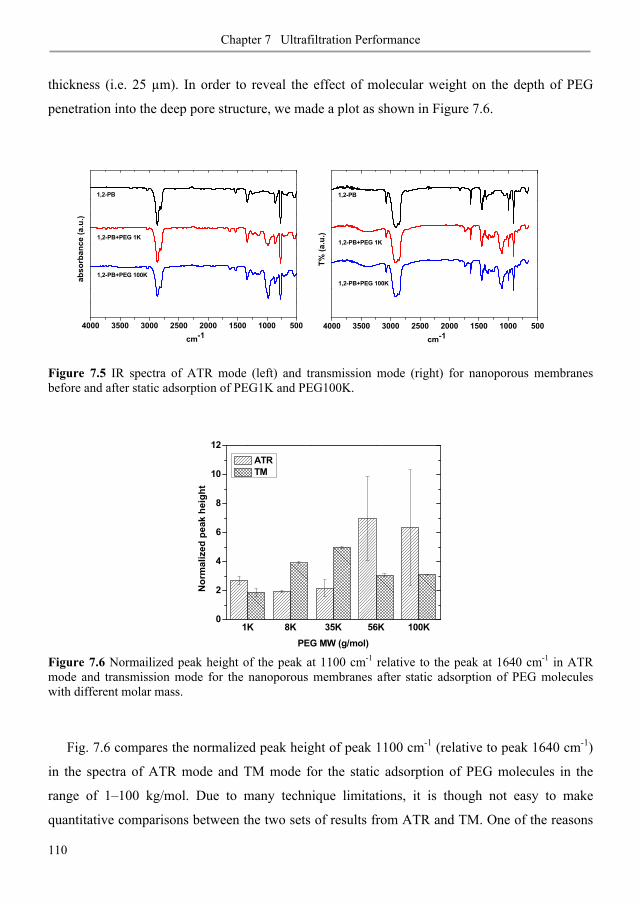
Chapter 7 Ultrafiltration Performance
110
thickness (i.e. 25 μm). In order to reveal the effect of molecular weight on the depth of PEG
penetration into the deep pore structure, we made a plot as shown in Figure 7.6.
Figure 7.5 IR spectra of ATR mode (left) and transmission mode (right) for nanoporous membranes before and after static adsorption of PEG1K and PEG100K.
Figure 7.6 Normailized peak height of the peak at 1100 cm-1 relative to the peak at 1640 cm-1 in ATR mode and transmission mode for the nanoporous membranes after static adsorption of PEG molecules with different molar mass.
Fig. 7.6 compares the normalized peak height of peak 1100 cm-1 (relative to peak 1640 cm-1)
in the spectra of ATR mode and TM mode for the static adsorption of PEG molecules in the
range of 1–100 kg/mol. Due to many technique limitations, it is though not easy to make
quantitative comparisons between the two sets of results from ATR and TM. One of the reasons
1K 8K 35K 56K 100K0
2
4
6
8
10
12
Nor
mal
ized
pea
k he
ight
PEG MW (g/mol)
ATR TM
1,2-PB
1,2-PB+PEG 1K
1,2-PB+PEG 100K
4000 3500 3000 2500 2000 1500 1000 500
abso
rban
ce (a
.u.)
cm-1
1,2-PB
1,2-PB+PEG 1K
1,2-PB+PEG 100K
4000 3500 3000 2500 2000 1500 1000 500
T% (a
.u.)
cm-1
122

Chapter 7 Ultrafiltration Performance
111
is that the probing depth of ATR increases with the wavelength, therefore it’s a problem to
compare signal ratios at two different wavelengths derived from the two techniques. Another
reason is related to the absorption coefficient, which is defined by Lambert–Beer’s law. This law
may break in cases of very high absorption/concentration or high scattering. Especially scattering
may be a problem for opaque materials and it will definitely be different in ATR relative to TM.
Thus, we can only have rough qualitative comparison between results from these two modes. For
PEG 56K and 100K, the TM mode shows the normalized peak height significantly lower than
that in ATR mode. This may indicate most of PEG 100K molecules accumulated at the outer
surface or stuck at the entry of the pores. This quantitatively supports the discussion described
above.
Pressure-forced adsorption was further performed for the three systems with 1g/L PEG
solutions at a pressure of 1 bar for 2 hours. Relative water flux reduction after ultrafiltration
equilibration (Jrf) was calculated from eq. 7-8 evaluating the extent of adsorption under dynamic
conditions, as shown by the circle symbols in Fig. 7.4.
The fouling resistance can be considered as a continuous growing deposition on the membrane
surface, including the fast built-up of adsorption layer on the membrane surface and subsequent
deposition of molecules on the initial adsorption layer. The initial adsorption layer can be
thought of to be the same as the static adsorption layer depending on intrinsic surface chemistry
of the membrane (Fig 7.1, Period 1) while the further deposition mainly depends on solute–
solute interaction, regardless of the membrane type. Fig. 7.4 shows that the M+W system and
the HM+W had each Jrf similar to Jra, that is, in these two cases the fouling resistance Rf is
similar to the static adsorption resistance Ra. This may suggest two possibilities for 1) A
maximum adsorption was reached under the static conditions and the applied pressure did not
result in further deposition of PEG molecules. This is indicative that solute-solute interactions
are negligible in the M+W and HM+W systems. 2) As suggested in Fig 7.1, Period 2 can also
occur in our case. During this period the PEG molecules, particularly for small MW, begin to
deposit onto the pore wall slowly increasing the initial layer coverage. As a result, the flux
decline can not be observed.
Interestingly, the M+EW system exhibited an increased Jrf , indicating a relatively higher
fouling resistance under pressure. This reflects that the addition of high concentration of ethanol
can not absolutely eliminate the PEG adsorption; PEG adsorption would happen and even
123
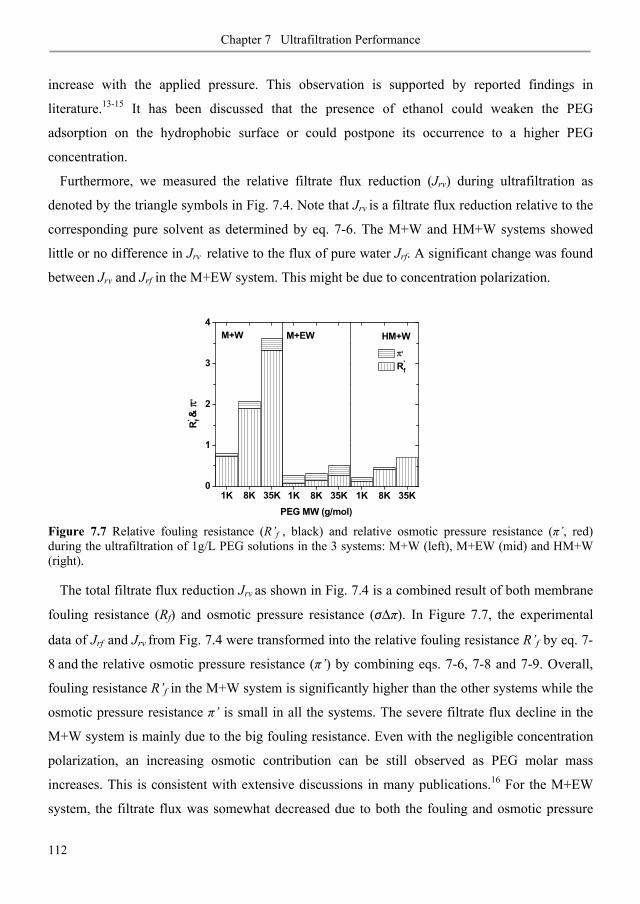
Chapter 7 Ultrafiltration Performance
112
increase with the applied pressure. This observation is supported by reported findings in
literature.13-15 It has been discussed that the presence of ethanol could weaken the PEG
adsorption on the hydrophobic surface or could postpone its occurrence to a higher PEG
concentration.
Furthermore, we measured the relative filtrate flux reduction (Jrv) during ultrafiltration as
denoted by the triangle symbols in Fig. 7.4. Note that Jrv is a filtrate flux reduction relative to the
corresponding pure solvent as determined by eq. 7-6. The M+W and HM+W systems showed
little or no difference in Jrv relative to the flux of pure water Jrf. A significant change was found
between Jrv and Jrf in the M+EW system. This might be due to concentration polarization.
Figure 7.7 Relative fouling resistance (R’f , black) and relative osmotic pressure resistance ( ’, red) during the ultrafiltration of 1g/L PEG solutions in the 3 systems: M+W (left), M+EW (mid) and HM+W (right).
The total filtrate flux reduction Jrv as shown in Fig. 7.4 is a combined result of both membrane
fouling resistance (Rf) and osmotic pressure resistance ( ). In Figure 7.7, the experimental
data of Jrf and Jrv from Fig. 7.4 were transformed into the relative fouling resistance R’f by eq. 7-
8 and the relative osmotic pressure resistance ( ’) by combining eqs. 7-6, 7-8 and 7-9. Overall,
fouling resistance R’f in the M+W system is significantly higher than the other systems while the
osmotic pressure resistance ’ is small in all the systems. The severe filtrate flux decline in the
M+W system is mainly due to the big fouling resistance. Even with the negligible concentration
polarization, an increasing osmotic contribution can be still observed as PEG molar mass
increases. This is consistent with extensive discussions in many publications.16 For the M+EW
system, the filtrate flux was somewhat decreased due to both the fouling and osmotic pressure
1K 8K 35K0
1
2
3
4
R' f &
π'
M+W
1K 8K 35K
PEG MW (g/mol)
M+EW
1K 8K 35K
π'
R'f
HM+W
124

Chapter 7 Ultrafiltration Performance
113
resistance. Since the fouling resistance is low in this system, the ’ became comparable to the R’f
thus causing an observable increase in Jrv relative to Jrf as already shown in Fig. 7.4. For the
HM+W system, the filtrate flux decline is mainly caused by some extent of PEG adsorption.
7.3.2. Ultrafiltration of single PEGs filtrate flux
The rejection characteristics of the nanoporous 1,2-PB membranes were evaluated by
ultrafiltration experiments with a series of single PEG molecules over a large range of solute size
for the three systems at 0.5, 1.0 and 1.5 atm pressures.
Figure 7.8 Flux as a function of the applied pressure in 3 different systems: left. M+W, mid. M+EW, right. HM+W for both filtrate solutions of PEG molecules with various molar mass and pure solvent. Concentration of the single PEG solutions is 1g/L.
Figure 7.8 shows (within experimental uncertainty) a linear dependence of filtration flux on the
applied pressure for each PEG molecule in all the systems. However, a significant flux decline
relative to the pure water flux was observed in the M+W system. As discussed previously, this is
caused by a fast built-up of the adsorption fouling in the M+W system at the outset of filtration,
independent of pressure up to 1.5 bar. We can conclude that at pressures up to 1.5 bar,
concentration polarization has little effect and membrane fouling is independent of the applied
pressure in the three systems.
7.3.3. Ultrafiltration of single PEGs rejection profiles
Figure 7.9 compares the observed rejection data Rejobs versus rs / rp obtained at a constant
pressure of 1 bar for the three systems: M+W, M+EW and HM+W. rs / rp is the ratio of
0.0 0.5 1.0 1.50
1
2
3
4
flux
(x 1
06 m3 m
-2s-1
)
W PEG1K PEG4K PEG8K PEG12k PEG35k
M+W
0.0 0.5 1.0 1.5
EW80:20 PEG1K PEG4K PEG8K PEG12K PEG35K
pressure (bar)
M+EW
0.0 0.5 1.0 1.5
W PEG1K PEG4K PEG8K PEG12K PEG35K
HM+W
125
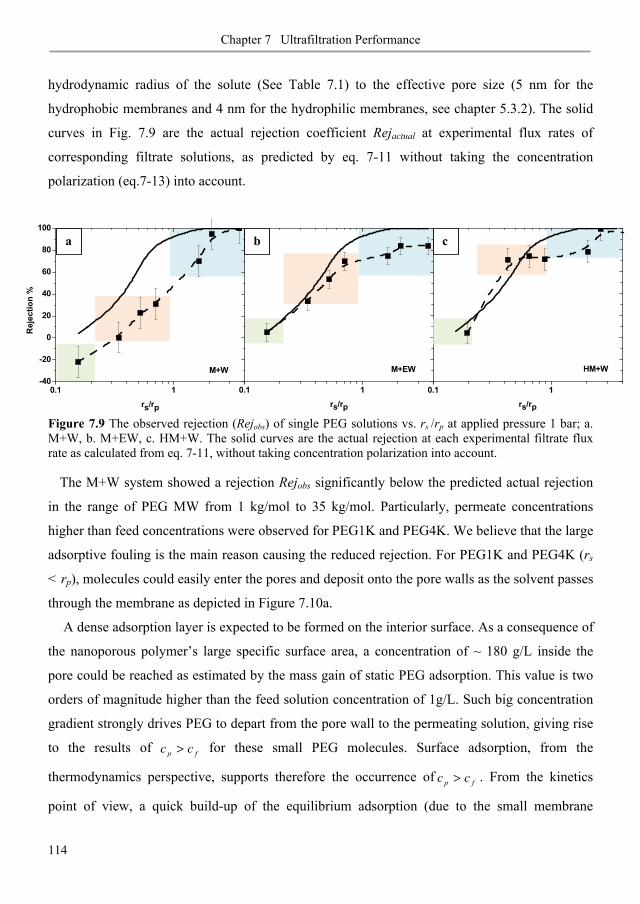
Chapter 7 Ultrafiltration Performance
114
hydrodynamic radius of the solute (See Table 7.1) to the effective pore size (5 nm for the
hydrophobic membranes and 4 nm for the hydrophilic membranes, see chapter 5.3.2). The solid
curves in Fig. 7.9 are the actual rejection coefficient Rejactual at experimental flux rates of
corresponding filtrate solutions, as predicted by eq. 7-11 without taking the concentration
polarization (eq.7-13) into account.
Figure 7.9 The observed rejection (Rejobs) of single PEG solutions vs. rs /rp at applied pressure 1 bar; a. M+W, b. M+EW, c. HM+W. The solid curves are the actual rejection at each experimental filtrate flux rate as calculated from eq. 7-11, without taking concentration polarization into account.
The M+W system showed a rejection Rejobs significantly below the predicted actual rejection
in the range of PEG MW from 1 kg/mol to 35 kg/mol. Particularly, permeate concentrations
higher than feed concentrations were observed for PEG1K and PEG4K. We believe that the large
adsorptive fouling is the main reason causing the reduced rejection. For PEG1K and PEG4K (rs
< rp), molecules could easily enter the pores and deposit onto the pore walls as the solvent passes
through the membrane as depicted in Figure 7.10a.
A dense adsorption layer is expected to be formed on the interior surface. As a consequence of
the nanoporous polymer’s large specific surface area, a concentration of ~ 180 g/L inside the
pore could be reached as estimated by the mass gain of static PEG adsorption. This value is two
orders of magnitude higher than the feed solution concentration of 1g/L. Such big concentration
gradient strongly drives PEG to depart from the pore wall to the permeating solution, giving rise
to the results of p fc c> for these small PEG molecules. Surface adsorption, from the
thermodynamics perspective, supports therefore the occurrence of p fc c> . From the kinetics
point of view, a quick build-up of the equilibrium adsorption (due to the small membrane
a
0.1 1
rs/rp
M+EW
0.1 1
rs/rp
HM+W
0.1 1-40
-20
0
20
40
60
80
100
Rej
ectio
n %
rs/rp
M+W
b c
126

Chapter 7 Ultrafiltration Performance
115
thickness and small pore volume relative to feed volume) is a key factor so that a stable source is
available to provide extra PEG molecules as the filtration solution passes through the pores. For
small molecules, the equilibrium adsorption (no pressure) is comparable to flow-induced
adsorption. The diffusivity of large molecules is low and the rejection is high at the membrane
surface, which would cause a higher concentration on the membrane surface1. Therefore the
phenomenon p fc c> was not observed for molecules larger than PEG4k. More serious
concentration polarization for large molecules e.g. PEG12K and PEG35K resulted in a certain
decrease in rejection as shown in Fig. 7.9.
Figure 7.10 Proposed qualitative models for interpreting the observed rejection behaviors in the three systems a. M+W; b. M+EW; and c. HM+W.
The M+EW system followed much better the calculated actual retention. As revealed by Figs.
7.4 and 7.7, no significant PEG adsorption was found in the M+EW system due to the presence
of high concentration of ethanol. Therefore, the observed rejection of this system more truly
reflects the intrinsic size rejection property of the nanoporous membrane (Figure 7.10b). The
observed rejection of small PEG molecules perfectly fit to the actual rejection while it becomes
slightly below the actual rejection with molar mass increase, which is probably due to increased
concentration polarization.
The HM+W system showed a sharp variation between 1K and 4K. Above 4K, the rejection
profile slowly changed from 80% to 100%. This is due to a big reduction in effective pore size
HM+W Bound water layer
Grafted layer
M+EW Ethanol layer
M+W
PEG
PEG adsorption layer
Cpore vpore
a
b
c
127
Chapter 7 Ultrafiltration Performance
116
(Figure 7.10c) as confirmed by the significant decline of water flux for the fresh membrane (See
chapter 5.3.2).
For all the three systems, the observed rejection is somehow below 100% for large PEG
molecules with rs / rp >> 1, e.g. PEG 56K and PEG100K. The reason is not clear. The filtration
flux for these large molecules is much less than the critical flux as described in literature17,18.
Therefore permeation of these large molecules would not be expected in the present conditions.
Possible defects in the membranes can not be excluded in this case, apparently more in the
M+EW system. In addition, the polydispersity of PEGs with high molecular weights may ease
the filtration for lower MW fraction of PEG molecules.
7.3.4. Ultrafiltration of single PEGs sieving vs. flux rates
In order to have additional insights into the retention characteristics of the nanoporous
membranes, ultrafiltration of single PEGs were conducted under different pressure thus enabling
varying filtrate flux rate. Figure 7.11 presents the observed sieving coefficient vs. the filtrate flux
for experiments performed at 0.5 bar, 1 bar and 1.5 bar. Three different systems, M+W, M+EW,
and HM+W are compared for each PEG molecule. For M+EW system, we can observe a clear
decrease with increasing filtrate flux for all the PEG molecuels. This is due to the reduction in
the contribution of PEG diffusion through the membrane relative to PEG convection. This
behavior has been extensively discussed in many publications4. Usually, in a wide range of
filtrate flux, the sieving coefficient will then pass through a minimum before increasing at high
filtrate flux. The latter behavior mainly arises from concentration polarization effects, but it did
not occur within the limit measurement range in our study. This observation, on the other side,
well supports the results discussed in Figs. 7.7 and 7.9.
For the systems M+W and HM+W, we could not see any clear or significant change tendency
of sieving with increasing flux rate. With the consideration of measurement error, HM+W
system gave more or less the same sieving behavior at the three filtrate flux rates. As we
discussed in Fig. 7.9, a smaller effective pore size give rise to a higher intrinsic retention, thus
the sieving behavior relies less on the filtrate flux, particularly in the limit flux range given in our
study. For M+W system, it is obvious that the nanoporous membranes have no ability to retain
the PEG1K and PEG 4K at feed side. Sieving coefficients slightly increase with flux rate in the
128
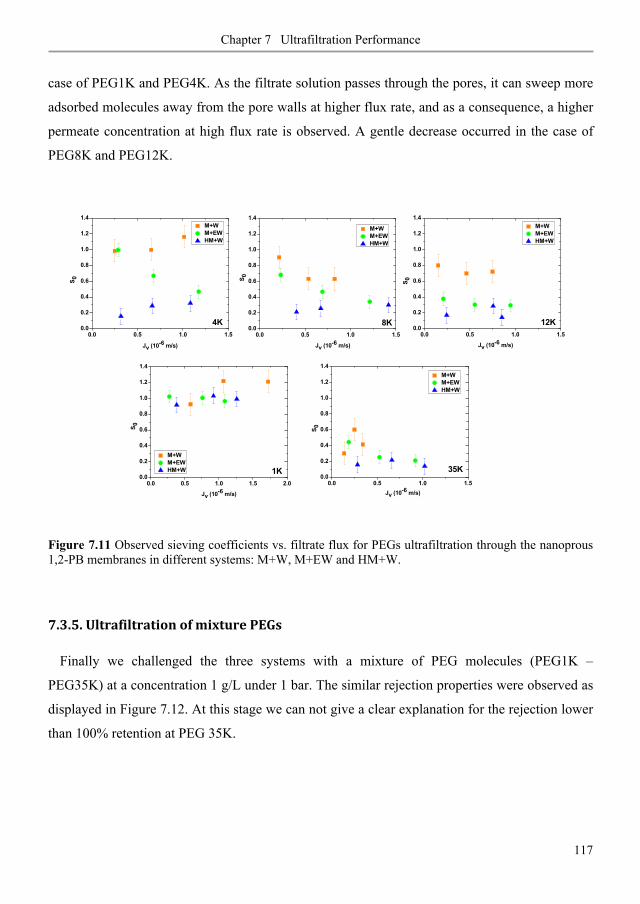
Chapter 7 Ultrafiltration Performance
117
case of PEG1K and PEG4K. As the filtrate solution passes through the pores, it can sweep more
adsorbed molecules away from the pore walls at higher flux rate, and as a consequence, a higher
permeate concentration at high flux rate is observed. A gentle decrease occurred in the case of
PEG8K and PEG12K.
Figure 7.11 Observed sieving coefficients vs. filtrate flux for PEGs ultrafiltration through the nanoprous 1,2-PB membranes in different systems: M+W, M+EW and HM+W.
7.3.5. Ultrafiltration of mixture PEGs
Finally we challenged the three systems with a mixture of PEG molecules (PEG1K –
PEG35K) at a concentration 1 g/L under 1 bar. The similar rejection properties were observed as
displayed in Figure 7.12. At this stage we can not give a clear explanation for the rejection lower
than 100% retention at PEG 35K.
0.0 0.5 1.0 1.5 2.00.0
0.2
0.4
0.6
0.8
1.0
1.2
1.4
1K
M+W M+EW HM+W
S 0
Jv (10-6 m/s)
0.0 0.5 1.0 1.50.0
0.2
0.4
0.6
0.8
1.0
1.2
1.4
4K
Jv (10-6 m/s)
S 0
M+W M+EW HM+W
0.0 0.5 1.0 1.50.0
0.2
0.4
0.6
0.8
1.0
1.2
1.4
Jv (10-6 m/s)
M+W M+EW HM+W
S 0
8K0.0 0.5 1.0 1.5
0.0
0.2
0.4
0.6
0.8
1.0
1.2
1.4
Jv (10-6 m/s)
S 0
M+W M+EW HM+W
12K
0.0 0.5 1.0 1.50.0
0.2
0.4
0.6
0.8
1.0
1.2
1.4
Jv (10-6 m/s)
S 0
M+W M+EW HM+W
35K
129

Chapter 7 Ultrafiltration Performance
118
Figure 7.12 Rejection profiles vs. molecular weight for mixture of PEG ultrafiltration through the nanoporous 1,2-PB membranes in different systems: M+W, M+EW and HM+W.
7.4. Conclusions
Block copolymer templated nanoporous 1,2-polybutadiene membranes with uniform pores of
10 nm in diameter were developed for ultrafiltration applications. A series of PEG molecules
were used to explore the effects of membrane fouling on the flux decline and rejection profiles.
A significant filtrate flux decline occurred through the hydrophobic membrane, mainly due to
adsorptive fouling. The presence of high concentration of ethanol in the filtration solution
resulted in a negligible PEG adsorption under static condition; however some membrane fouling
appeared when pressure was applied. The hydrophilized membrane diminished the membrane
fouling thus effectively suppressing the flux reduction. The effect was insensitive to the pressure
applied (0.5 – 1.5 atm). The observed rejection of PEG was compared with theoretical
predictions based on size effects and hydrodynamic effects alone, as described by the Bungay-
Brenner model. The model satisfactorily described the case of hydrophobic membranes in the
presence of ethanol. In this case, no significant fouling occurred thus maximally reflecting the
intrinsic sieving property of the UF membrane. A significantly reduced rejection relative to
model expectation was found for the hydrophobic membrane in water due to the severe surface
1 10-20
0
20
40
60
80
100
M+W M+EW HM+W
Rej
obs
(%)
MW (kg/mol)
130
Chapter 7 Ultrafiltration Performance
119
adsorption. We may take advantage of the selective adsorption as an alternative separation
mechanism in some applications, for example affinity membrane absorbers in hemodialysis. For
the hydrophilized membrane the molecular weight cut off shifted to lower MW range i.e.
between 1 kg/mol and 4 kg/mol, due to the reduction of pore size. This is very attractive for the
separation of low MW species. It can be concluded that solvent property and surface chemistry
have critical effect on UF performance in both flux and selectivity. It is possible to attain tunable
UF performance for specific applications by use of nanoporous 1,2-PB membranes under
different conditions.
At present, we prepared the free membranes with thickness of 25 μm. Such thick membranes
result in lower permeation rate compared with commercial membranes. Therefore making a
composite membrane with the nanoporous membrane as a thin selective top layer will be a
necessary route to enhance the values of the nanoporous membranes in relevant UF applications.
7.5. References
[1] M. Mulder, Basic principles of membrane technology, 2ed ed., Kluwer Academic, Netherlands 1996.
[2] W. M. Deen, Hindered transport of large molecules in liquid-filled pores. AIChE J. 33 (1987) 1409–1425.
[3] P. M. Bungay, H. Brenner, The motion of a closely fitting sphere in a fluid-filled tube. Int. J. Multiph. Flow 1 (1973) 25–56.
[4] L. J. Zeman, A. L. Zydney, Microfiltration and ultrafiltration: principles and applications, Marcel Dekker, New York, 1996.
[5] G. Belfort, R. H. Davis, A. L. Zydney, The behavior of suspensions and macromolecular solutions in crossflow microfiltration, J. Membr. Sci. 96 (1996) 1–58.
[6] N. Nagata, K. Herouvis, D.M. Dziewulski and G. Belfort, Cross-flow membrane microfiltration of a bacterial fermentation broth, Biotechnol.Bioeng., 44 (1989) 161–181.
[7] Th. F. Hesselink, Adsorption of polyelectrolytes from dilute solution, in G. Parfitt and C.H. Rochester (Eds.), Adsorption from Solution at the Solid / Liquid Interface, Academic Press, New York, NY, 1983, pp. 377– 412.
[8] P. Szewczykowski, Nano-porous materials from diblock copolymers and its membrane application, Ph.D. thesis, Technical University of Denmark, 2009.
[9] S. Lentsch, P. Aimar, J. L. Orozco, Separation albumin-PEG: transmission of PEG through ultrafiltration membranes, Biotechnology and Bioengineering 41(1993) 1039–1047.
131
Chapter 7 Ultrafiltration Performance
120
[10] J. D. Bloustine, Experimental investigations into interactions and collective behavior in protein/polymer mixtures and granular gods, Ph.D. thesis, Brandeis University, Waltham, Massachusetts, 2005.
[11] R. W. Baker, Membrane technology and applications, 2nd ed., John Wiley& Sons, Ltd., Chichester, 2004.
[12] H. Susanto, S. Franzka, and M. Ulbricht, Dextran fouling of polyethersulfone ultrafiltration membranes Causes, extent and consequences, J. Membr. Sci. 296 (2007) 147–155.
[13] R.Shukla, M.Cheryan, Performance of ultrafiltration membranes in ethanol–water solutions: effect of membrane conditioning, J. Membr. Sci. 198 (2002) 75–85.
[14] D. R. Machado, D. Hasson, R. Semiat, Effect of solvent properties on permeate flow through nanofiltration membranes. Part 1: investigation of parameters affecting solvent flux, J. Membr. Sci. 163 (1999) 93–102.
[15] S. K. Zaidi, A. Kumar, Effects of ethanol concentration on flux and gel formation in dead end ultrafiltration of PEG and Dextran, J. Membr. Sci. 237 (2004) 189–197.
[16] G. Jonsson, Selectivity in membrane filtration, Desalination 51 (1984) 61–77.
[17]F. Jin and C. Wu, Observation of the first-order transition in ultrafiltration of flexible linear polymer chains, Physical review letters 96 (2006) 237801.
[18] P.G. de Gennes, Flexible polymers in nanopores, Adv.in Polymer Science 138 (1999) 91-105.
132
Chapter 8 Loading and Release
121
Chapter 8 SDS Loading and Release in Nanoporous 1,2-PB Membranes
As we introduced in chapter 2.5, nanoporous membranes with large surface-volume ratio,
well-controlled pore size offer an attractive route for making capsules that may provide
controlled release of pharmacologic or biologic reactive agents. Our effort to explore the
potential of the nanoporous 1,2-PB membranes as a sustainable-release carrier is the main focus
of this chapter. Amphiphilic molecule, sodium dodecyl sulfate (SDS) is selected as a model
molecule for studying the loading and release in the nanoporous membranes. In addition, surface
modification via SDS physisorption is also an important objective of this work. The infiltration
of SDS to an original hydrophobic nanoporous membrane is examined by gravimetry and
complementarily confirmed by XPS. SDS adsorption isotherm is discussed in terms of the
Langmuir model. Incorporating SDS imparts water wettability to the originally hydrophobic
nanoporous membranes. We will show results on the water wetting kinetics and the release
kinetics of SDS in the presence of excess water or methanol. This part of work has been
published in Langmuir 2010, 26(16), 13457–13465.
The second part of work in this chapter deals with the preliminary anti-biofilm tests. The aim
is to give a preliminary demonstration on the use of SDS-infilled nanoporous films as a
sustainable-release carrier. The SDS-infilled nanoporous membrane was kept in contact with
mediums containing two different bacteria. We attempted to challenge the effectiveness of SDS-
infilled nanoporous membrane in inhibiting bacterial attachment and biofilm formation on its
surface via sustainable releasing SDS.
133
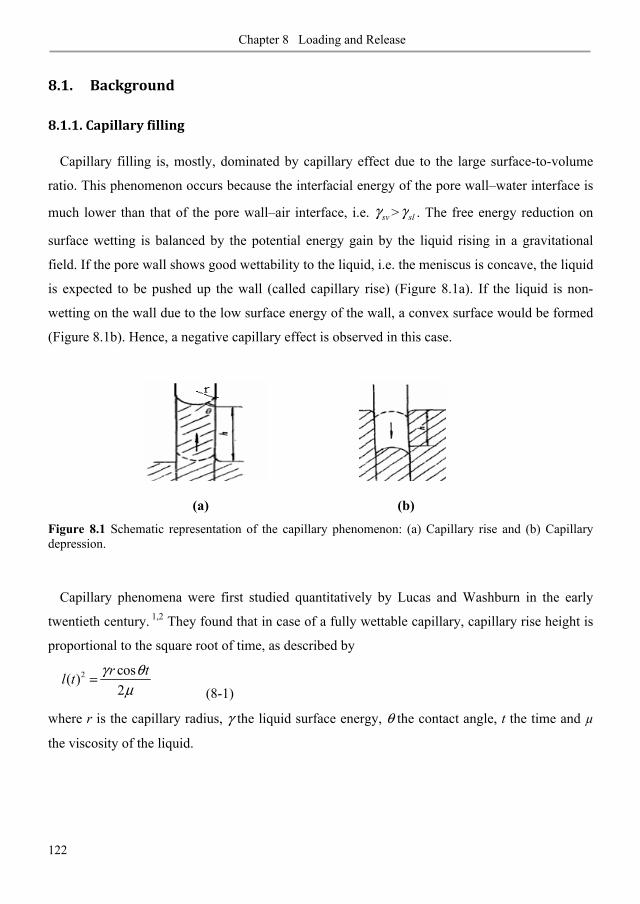
Chapter 8 Loading and Release
122
8.1. Background
8.1.1. Capillary filling
Capillary filling is, mostly, dominated by capillary effect due to the large surface-to-volume
ratio. This phenomenon occurs because the interfacial energy of the pore wall–water interface is
much lower than that of the pore wall–air interface, i.e. svγ > slγ . The free energy reduction on
surface wetting is balanced by the potential energy gain by the liquid rising in a gravitational
field. If the pore wall shows good wettability to the liquid, i.e. the meniscus is concave, the liquid
is expected to be pushed up the wall (called capillary rise) (Figure 8.1a). If the liquid is non-
wetting on the wall due to the low surface energy of the wall, a convex surface would be formed
(Figure 8.1b). Hence, a negative capillary effect is observed in this case.
(a) (b)
Figure 8.1 Schematic representation of the capillary phenomenon: (a) Capillary rise and (b) Capillary depression.
Capillary phenomena were first studied quantitatively by Lucas and Washburn in the early
twentieth century. 1,2 They found that in case of a fully wettable capillary, capillary rise height is
proportional to the square root of time, as described by
2 cos( )2
r tl t γ θμ
= (8-1)
where r is the capillary radius, γ the liquid surface energy, θ the contact angle, t the time and μ
the viscosity of the liquid.
134

Chapter 8 Loading and Release
123
8.1.2. Surfactants
Surfactants are amphiphilic molecules that consists of a non-polar hydrophobic portion,
usually a linear or branched hydrocarbon or fluorocarbon chain containing 8–18 carbon atoms,
which is attached to a polar or ionic portion (hydrophilic).3 As dissolved in aqueous
environment, surfactants with polar heads (that tend to dissolve in water) and non-polar tails
(that tend to dissolve in oil or stick out into air) have the tendency to strongly adsorb and
orientate on interfaces. The adsorption of ionic surfactants on hydrophobic surfaces such as
carbon nanotubes, polymer surfaces, etc. is governed by hydrophobic interaction between the
alkyl chain of the surfactant and the hydrophobic surface.
In addition to the surface adsorption properties of surfactants, they also have the remarkable
ability to self-assemble in aqueous solution. The self-assembled structures called ‘micelles’ in
solution are created to reduce the exposure of the hydrocarbon chains to water. In the micelle, the
surfactant hydrophobic groups are directed towards the interior of the aggregate and the polar
head groups are directed towards the solvent. The driving force behind micellization is the
entropic effect, that is, there is a positively entropic increase in water molecules when the
surfactants associate to form micelles due to hydrophobic effect. These micelles are in dynamic
equilibrium and the rate of exchange between a surfactant molecule and the micelle may vary by
orders of magnitude.
8.1.3. Biofilm
A biofilm is an aggregate of microorganisms in which cells adhere to each other and/or to a
surface. These adherent cells are frequently embedded within a self-produced matrix of
extracellular polymeric substance, which is generally composed of extracellular DNA, proteins,
and polysaccharides. Biofilms may form on living or non-living surfaces and can be prevalent in
natural, industrial and hospital settings.4
In nature, microorganisms usually attach to solid surfaces, especially on the liquid–solid
interface. After attachment, they form microcolonies, produce extracellular polymeric substances,
entrapdebris and other species of cells, and form biofilm.4 Biofilm is very resistant to antibiotics
and some physical treatments and it is also a serious problem for infectious disease. Biofilm is
also a potential hazard in food processes, water treatment, ships and etc.5
135
Chapter 8 Loading and Release
124
Biocides and disinfectants have been the principal weapons used to control unwanted biofilms
such as those that foul cooling water towers, oilfield produced water pipelines, or food
processing plants. 5 These agents work by inhibiting the growth of microorganisms. Furthermore,
in many systems where problematic biofilm fouling occurs, the desired end result is a clean
surface rather than an inactive yet physically intact biofilm. Antimicrobial agents may achieve
this indirectly by stopping growth and allowing the natural detachment process to slowly remove
the biofilm. The anionic surfactant SDS has been reported to exhibit bactericidal activity against
numerous bacteria and effectively detach the inactive biofilm.6 An in-depth discussion of biofilm
and an overview of approaches to detach and inhibit biofilms are out of scope of this thesis.
8.2. Experimental
We used two different polymer films in this study. One is non-porous cross-linked 1,2-
polybutadiene (1,2-PB) film that was made of 1,2-PB homopolymer (weight-average molecular
weight wM = 12.5 kg/mol, polydispersity index PDI=1.05). The 1,2-PB homopolymers were
cross-linked as the same procedure used for block copolymers (chapter 3.2). The cross-linked
1,2-PB films were only used for the contact angle measurements in relation to surface tension
investigation. Nanoporous 1,2-PB film was prepared by solvent casting the 1,2-PB-b-PDMS
(BD14 batch) solution onto a glass petri-dish. The preparation process has been in detail
described in chapter 3.2. The top side of the cast precursor film was exposed to N2 during cross-
linking. Thus, a thin skin-layer is expected to form on the free surface. For comparison, we also
prepared one 1,2-PB-b-PDMS sample by sandwiching between two glass petri-dishes for cross-
linking, thereby eliminating the free surface. Under this condition, non-skin nanoporous film is
formed as a result. The thickness of the nanoporous films is approximately 500 m. They were
cut to square pieces with a mass differing within ± 5% of a target value for the following
experiments. In this study, nanoporous samples used for loading and adsorption isotherm
experiments were prepared from the same batch of cross-linked samples.
136
Chapter 8 Loading and Release
125
8.2.1. SDS loading and release in nanoporous 1,2-PB membranes
Preparation of surfactant solutions. Sodium dodecyl sulfate (purity 98.5%, Sigma-Aldrich),
was used as received. We prepared SDS solutions in de-ionized (DI) water and stirred on a
shaker at room temperature for at least 15 h before use. Molar concentrations in the range 0.5
mM – 50 mM were used for the SDS loading experiments.
Loading of SDS aqueous solutions. In the SDS loading experiment, each piece of nanoporous
1,2-PB film (20 ± 1 mg) was placed in 15 ml of SDS aqueous solution and kept under shaking at
planned time intervals. The solution loading rates for different SDS concentrations were
followed by gravimetry. Each sample was taken out of the solution, gently wiped with a tissue,
immediately weighed in a balance with precision 0.1 mg and placed back to the solution for the
next time interval. At the end of the loading experiment, the outer surface of the sample was
wiped with a tissue and dried under nitrogen flow without further treatment. The mass of the
SDS-loaded film was notified after complete drying.
SDS adsorption isotherm in the nanoporous films. We dipped the nanoporous 1,2-PB films
in methanol for 1 h to completely prewet the surface. Subsequently, the prewetted samples
stayed in the SDS aqueous solutions of different concentrations for 7 days that was tested as an
abundantly sufficient time for equilibrium loading at the tested concentrations. The SDS-loaded
samples were completely dried under nitrogen flow after the loading. The amount of adsorbed
SDS was determined by gravimetry.
SDS release in water and in methanol. We first prepared 30 SDS-loaded samples by
following the procedure described above. Each nanoporous sample was placed in 15 ml of 10
mM SDS aqueous solution for 24 h that was a sufficient time for equilibrium loading at 10 mM.
They were then completely dried under nitrogen flow before starting the release experiment. 22
of the SDS-loaded samples were used for the measurement of SDS release kinetics in water and
the remaining 8 for the release kinetics in methanol, as follows. Each SDS-loaded sample was
immersed in 300 ml of DI water (or methanol) on a shaker for a planned time interval. The
amount of SDS released from each sample was determined by the difference between the dry
masses of the sample before and after release. The kinetics of water uptake into two of the dry
SDS-loaded samples was also monitored gravimetrically.
137
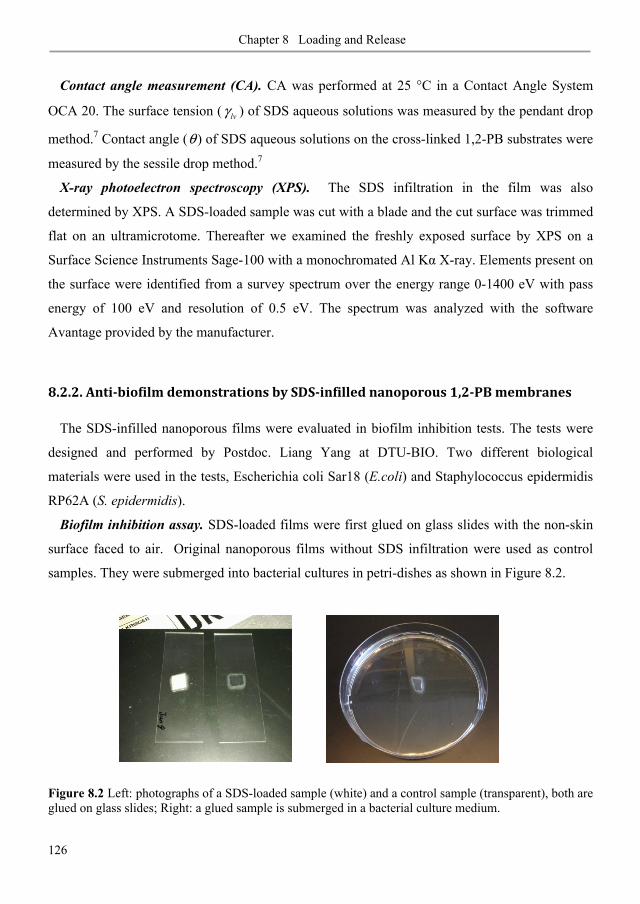
Chapter 8 Loading and Release
126
Contact angle measurement (CA). CA was performed at 25 °C in a Contact Angle System
OCA 20. The surface tension ( lvγ ) of SDS aqueous solutions was measured by the pendant drop
method.7 Contact angle (θ ) of SDS aqueous solutions on the cross-linked 1,2-PB substrates were
measured by the sessile drop method.7
X-ray photoelectron spectroscopy (XPS). The SDS infiltration in the film was also
determined by XPS. A SDS-loaded sample was cut with a blade and the cut surface was trimmed
flat on an ultramicrotome. Thereafter we examined the freshly exposed surface by XPS on a
Surface Science Instruments Sage-100 with a monochromated Al K X-ray. Elements present on
the surface were identified from a survey spectrum over the energy range 0-1400 eV with pass
energy of 100 eV and resolution of 0.5 eV. The spectrum was analyzed with the software
Avantage provided by the manufacturer.
8.2.2. Anti-biofilm demonstrations by SDS-infilled nanoporous 1,2-PB membranes
The SDS-infilled nanoporous films were evaluated in biofilm inhibition tests. The tests were
designed and performed by Postdoc. Liang Yang at DTU-BIO. Two different biological
materials were used in the tests, Escherichia coli Sar18 (E.coli) and Staphylococcus epidermidis
RP62A (S. epidermidis).
Biofilm inhibition assay. SDS-loaded films were first glued on glass slides with the non-skin
surface faced to air. Original nanoporous films without SDS infiltration were used as control
samples. They were submerged into bacterial cultures in petri-dishes as shown in Figure 8.2.
Figure 8.2 Left: photographs of a SDS-loaded sample (white) and a control sample (transparent), both are glued on glass slides; Right: a glued sample is submerged in a bacterial culture medium.
138

Chapter 8 Loading and Release
127
Bacteria were cultivated in AB minimal supplemented with 30 mg glucose l–1 at 37 degree for
24 hours. Thereafter the sample slides were taken out from the petri-dishes and submerged into
distilled water to wash away the unattached bacterial cells. Then the film samples were observed
under Carl Zeiss LSM510 META Confocal Laser scanning Microscopy (CLSM) for biofilms.
The LIVE/DEAD ® Bacterial Viability Kit was used to determine live (appears green) and dead
(appears red) bacterial cells. Images were obtained using a 63x/1.4 objective. Simulated three-
dimensional images and sections were generated using the IMARIS software package (Bitplane
AG).
8.3. Results and discussion
8.3.1. Polymer films
The nanoporous 1,2-PB film was characterized by SAXS and N2 adsorption in previous work.8
The pore diameter was approximately 15 nm and the specific surface area was specA = 278 ± 40
m2/g. The specific volume of the nanoporous sample was specv = 0.79 cm3 per gram of polymer,
as evaluated by methanol uptake.9 Figure 8.3 is a photograph of three types of dry films: cross-
linked non-porous 1,2-PB (left), nanoporous 1,2-PB (middle) and SDS-loaded nanoporous 1,2-
PB films (right). The cross-linked homopolymer 1,2-PB and the native nanoporous 1,2-PB film
are transparent, whereas the SDS-loaded nanoporous sample is translucent, probably due to the
2-d crystalline packing of SDS onto the pore-wall surface.
Figure 8.3 A photograph of a cross-linked homopolymer 1,2-PB film (left) and nanoporous 1,2-PB films before (mid) and after (right) loading with SDS.
139

Chapter 8 Loading and Release
128
Due to our technique limitation we cannot directly probe the interior surface of nanoporous
1,2-PB film, therefore its surface and interface energies were estimated by contact angle
measurements on the surface of non-porous cross-linked 1,2-PB homopolymer substrates.
Figure 8.4a illustrates the trend of surface tension of water lvγ with different SDS
concentrations. The critical micelle concentration (CMC) was determined to be 8.1 mM, similar
to reported vaules.10 Figure 8.4b shows the contact angle θ of solutions with varying SDS
concentration on the cross-linked 1,2-PB substrate. It diminishes with SDS concentration and
shows a slight change above 6 mM. The corresponding interfacial tension lsγ also shown in Fig.
8.4b was calculated according to the Young’s equation cosls sv lvγ γ γ θ= − ⋅ . The value of the
surface tension svγ of cross-linked 1,2-PB film was determined to 24 mN/m by extrapolating to
cosθ = 1 in a plot of cosθ against lvγ . One svγ literature value of 25 mN/m was found for 1,2-
PB.11 As shown in Fig. 8.4b, the contact angle of pure water on the cross-linked 1,2-PB substrate
was above 100°; while 90° (critical angle) can be reached at a SDS concentration of ~ 2.4 mM.
Figure 8.4 (a) Surface tension of water lvγ as a function of SDS concentration; (b) Contact angle θ of SDS aqueous solutions on the cross-linked 1,2-PB substrates versus SDS concentration (circles, right) ; the resultant interface tension lsγ deriving from cosls sv lvγ γ γ θ= − ⋅ (triangles, left).
The behavior of SDS on the non-porous substrate was assumed to be valid for the nanoporous
samples. SDS, as an amphiphilic molecule, tends to adsorb and orient on the interface to reduce
the free energy. The long hydrocarbon chain of SDS in water is likely to attach onto the
hydrophobic substrate via hydrophobic interaction, while the hydrophilic head leans to expose to
aqueous environment.12-14 The driving force for the loading of a liquid in capillary systems is
0 2 4 6 8 10
10
20
30
40
γ ls (m
N/m
)
concentration (mM)
60
70
80
90
100
110
θ ÷°
÷
b
0 5 10 15 20 25 3030
40
50
60
70
γ lv (m
N/m
)
concentration (mM)
a
140

Chapter 8 Loading and Release
129
capillary force, which depends on the liquid/solid interface tension lsγ . Most aqueous solutions
are rejected from the hydrophobic nanoporous 1,2-PB films. However, it is possible to fill
surfactant solutions to the nanopores since the interfacial energy can be reduced by surfactant
adsorption.
For the nanoporous 1,2-PB, however, one end-group |
|-Si -F per chain is expected to remain
after removal of PDMS.15 The surface density of |
|-Si -F was estimated to 0.26 nm-2, or 5.2%
relative to the 1,2-PB repeating units exposed to the surface.16 These groups are expected to
lower the surface energy for the nanoporous samples compared to the pure 1,2-PB cross-linked
substrates. Therefore we expect the critical contact angle of 90° to be reached at a higher
concentration than 2.4 mM, where the capillary rise would start as a consequence.
8.3.2. Loading of SDS aqueous solution: kinetics
We investigated the kinetics of the liquid uptake process for different initial bulk concentration
bc of SDS aqueous solutions in the range 0.5 mM 50 mMbc< ≤ . The loading is defined as the
amount of SDS solution uptaken in the nanoporous film relative to the original mass of the film,
i.e.
( ) /wet PB PBloading m m m= − (8-2)
Here wetm is the wet mass of the nanoporous film measured at a certain time, and its original
mass is 20 1 mgPBm = ± . Note that there was noticeable decrease in the concentration of the SDS
solution surrounding the polymer due to SDS adsorption onto the large specific surface area of
the nanoporous film. For example, for the solutions with initial concentrations 5bc = mM and
8.1bc = mM, the concentrations decreased to 4.4 mM and 6.9 mM, respectively, after 7 days of
loading.
We divided the results of loading as a function of time for a period of 7 days into two panels
depending on bc . Figure 8.5a shows loading profiles for bc around CMC (8.1 mM), referred to
as the CMC zone. Figure 8.5b shows profiles for bc either well below or well above CMC. It is
141

Chapter 8 Loading and Release
130
evident that at low concentrations ( 4bc ≤ mM), nearly no loading of aqueous SDS solutions was
detected within the maximum measurement time.
Figure 8.5 Loading of SDS aqueous solution versus time at varying SDS concentration. (a) loading vs. time at the CMC zone; lines denote empirical fittings to experimental data by double exponential functions (see eq. (8-4)); (b) loading vs. time at high concentrations (above CMC) and low concentrations (≤4 mM); the fitting curve at CMC (8.1 mM) is shown in both panels (a) and (b) in order to ease the comparison; (c) the loading profiles plotted as the square of loading vs. time within the initial 6 hours; (d) comparison of the estimated z(t) from the experimental data given in Fig. 8.5c with the scaling relation (8-2). The non-zero intercept is due to the existence of an induction period in the data of Fig. 8.5c as discussed in the main text. The sample 10 mM-G was cross-linked sandwiched between two glasses; it is expected to miss the skin layer thus its effective outer surface area of A ~ 21.6 cm is bigger than that of the other samples, 0.9 cm2. The solid line is a linear fitting for visual aid.
0 2000 4000 6000 8000 100000.0
0.2
0.4
0.6
0.8
5 mM 6 mM 6.4 mM 7.6 mM 8.1 mMlo
adin
g (w
/w)
time (min)
a
0 2000 4000 6000 8000 100000,0
0,2
0,4
0,6
0,8
0.51 mM 0.81 mM 1 mM 2 mM 4 mM
10 mM 15 mM 20 mM 30 mM 50 mMlo
adin
g (w
/w)
time (min)
b
0 60 120 180 240 300 3600.00
0.05
0.10
0.15
0.20
0.25
0.30 c
5 mM 6 mM 7.6 mM 8.1 mM 10 mM
load
ing2
time (min)0 2 4 6 8 10
0
5
10
15
20
25 d
5 mM 6 mM 7.6 mM 8.1 mM 10 mM 10 mM-G
z(t)
(10-3
cm
)
rcbΓmax-1D½t½ (10-3 cm)
142
Chapter 8 Loading and Release
131
In the CMC zone and above CMC, the loading profiles displayed a typical saturation behavior:
the loading increased with time but the rate of loading gradually decreased with time, and
eventually the loading seemed to reach a plateau value for a given bc . In the CMC zone, there
was a noticeable influence of bc on the loading kinetics and only a slight influence on the plateau
values. At high concentrations (above CMC), loading data for different bc nearly overlapped.
The spontaneous imbibition of a liquid into the pores of a porous medium is driven by the
capillary force, which depends on surface wettability. The fact that no loading was found for low
SDS concentrations ( 4bc ≤ mM) thus indicates that the critical contact angle of o90 may have
not been reached for these solutions at the entrance of the nano-capillaries. This observation
supports the previous argument that the existence of |
|-Si -F on the interior surface of the
nanoporous sample caused a lower surface energy, and therefore loading starts at a concentration
higher than the value 2.4 mM observed for the cross-linked 1,2-PB hompolymer substrate.
Figure 8.5c shows the loading squared as a function of time for the initial 6 hours; after the
very first 15 – 30 s all the data show a good linearity. Such linearity in the short-time limit is
expected from the Lucas-Washburn equation for pure liquids.1,2 However, for the imbibition of
surfactant solutions into hydrophobic capillaries, the Lucas-Washburn equation may not be
applicable.17-20 Consider, for instance, the loading of SDS solution at 5 mM where 24.3 10 N/mlvγ −= × , cos 0.245θ = , and 310 Pa sμ −= ⋅ . A direct use of the Lucas-Washburn
equation that neglects SDS adsorption predicts an imbibition rate about two orders of magnitude
higher than that shown in Figure 8.5d. Alternatively, the linearity between the square of loading
and time may result from a diffusion-controlled dynamics. 17, 18
The imbibition of SDS aqueous solution into hydrophobic capillaries may differ significantly
from that of pure liquids.17-20 As the filling proceeds, the newly formed liquid/solid interface
rapidly adsorbs SDS molecules from the liquid/vapor interface (surface adsorption of SDS is fast
especially in such confined geometries21). This causes a significant decrease of SDS
concentration near the advancing liquid front considering the large specific area of nanoporous
films.18 Consequently, the capillary driving force decreases and even vanishes until the loss of
surfactant at the advancing liquid front is compensated by diffusion transport from deeper liquid
regions. A rigorous theoretical framework for the imbibition of SDS aqueous solution into
143
Chapter 8 Loading and Release
132
hydrophobic capillaries thus should involve the coupling among the dynamic equation of
capillary rising, the adsorption/desorption kinetics and the diffusion equation.18 In the case of
strong depletion near the liquid/vapor interface, the following scaling relation
max
( ) brcz t D t∞≈Γ
(8-3)
has been obtained from mass balance in a quasi-steady state process.17,18 Here, r is the capillary
radius, maxΓ is the monolayer capacity of surfactant molecules at the solid/liquid interface, and
( )z t is the filling depth. Eq. (8-3) shows that ( )z t is proportional to the characteristic diffusion
length ~ D t∞ . In order to estimate ( )z t from the loading data in Fig. 8.5c, we modeled the
nanoporous film as a bundle of capillaries. The amount of SDS aqueous solution loaded in the
nanoporous film is roughly related to ( )z t by
( )PB Aloading m A z tε ρ× ≈ (8-4)
where A denotes the effective surface area of the film (here we excluded the surface with the
skin layer); Aε is the surface porosity 40% ± 5%, and is the liquid density. It is likely that eq.
(8-4) overestimates ( )z t because the amount of SDS adsorbed onto the capillary walls was not
considered. However, this should not violate the scaling relation 0.5( ) ~ ~z t loading t since the
amount of adsorbed SDS should also be proportional to ( )z t .
A reasonable agreement was found between our experimental results shown in Fig. 8.5c and
the scaling relation in eq. (8-3). This is demonstrated in Fig. 8.5d. It is evident that on a plot of
( )z t vs. max( / )brc D t∞Γ , the loading curves for different bc nearly collapsed onto a single
curve with a nearly linear part. The linear part seems to occur after an induction period which is
also noticeable in Fig. 8.5c. However, whether in the induction period ( )z t grows linearly with
time in the same manner as predicted by Tiberg and co-workers18 is not conclusive from our
data. The following parameters were used in preparing Fig. 8.5d: liquid density = 1 g/cm3,
capillary radius 7.5 nmr = , surface porosity A = 0.4, monolayer capacity max = 2.9·10-10
mol/cm2 estimated from the adsorption isotherm study (to be addressed), and the diffusion
coefficient of SDS at 25 C in aqueous solution DSDS = 7.8·10-10 m2/s.22 The effective outer
surface area of the tested film with skin layer is estimated to be 20.9 cm and is significantly
144

Chapter 8 Loading and Release
133
lower than the overall surface area ( 21.6 cm ) due to the presence of skin layer. As a control test,
we also investigated the loading kinetics at 10bc = mM of a film without skin layer (and thus
21.6 cmA ≈ ). The results as shown in Fig. 8.5d (filled squares) nearly collapsed with the results
for films with skin layers, indicating that the loading through the side with skin layer was
negligible.
Empirically, the full-time loading curves in the CMC zone (Fig. 8.5a) and above CMC (Fig.
8.5b) were very well fitted by double exponential functions of the form: 1 2/ /
0 1 2t t t tloading a a e a e− −= − − (8-5)
with five fitting parameters ( 0a , 1a , 1t , 2a and 2t ). In the case of 8.1bc = mM, we got 0 0.74a =
, 21 7.8 10a −= × , 2 0.66a = , 9
1 2.7 10t −= × min, and 2 358t = min, suggesting that eq. (8-5) could
be simplified to a single exponential function, i.e. 0 2 2exp( / )loading a a t t≈ − − . This is
equivalent with a single time-scale (t2) describing the entire loading process. The data fitting by a
single exponential, however, was not satisfactory (statistical R2 < 0.99) for the two lower
concentrations (5.1 mM and 6 mM). The long time-scale t2 from fitting, characterizing the
diffusion controlled dynamics, varied from 3000 min (at 5.1 mM) to about 200 min (at cb 15
mM).
The loading curves for SDS concentrations well above CMC (cb > 15 mM) show substantial
overlap. This approximate kinetic overlap means that (a) the SDS mass transport into the
nanopores, and (b) (sticking to the strong depletion model (8-3)) the concentration gradient of
SDS close to the advancing liquid front, both are roughly independent of SDS concentration in
this concentration range. The concentration gradient at the liquid-vapor interface in the strong
depletion regime is approximately cb /(D t)½.17 In the high concentration range considered here
cb in the gradient expression can be substituted by CMC – a good estimate for the concentration
of free SDS molecules, thus satisfying point (b) above. In the strong depletion zone only free
SDS should be present in solution, as the diffusion coefficient of free SDS molecules is about an
order of magnitude higher than that of free SDS micelles (the diffusion coefficient of spherical
micelles with radius 22 Å 23,24 obtained from the Stokes-Einstein relation is Dmic 1·10-10 m2/s at o25 C ). Point (a) is more intriguing. By the way, requirement (a) is a sufficient condition for
(b). Point (a) would require some mechanism that at this concentration regime kept the
145
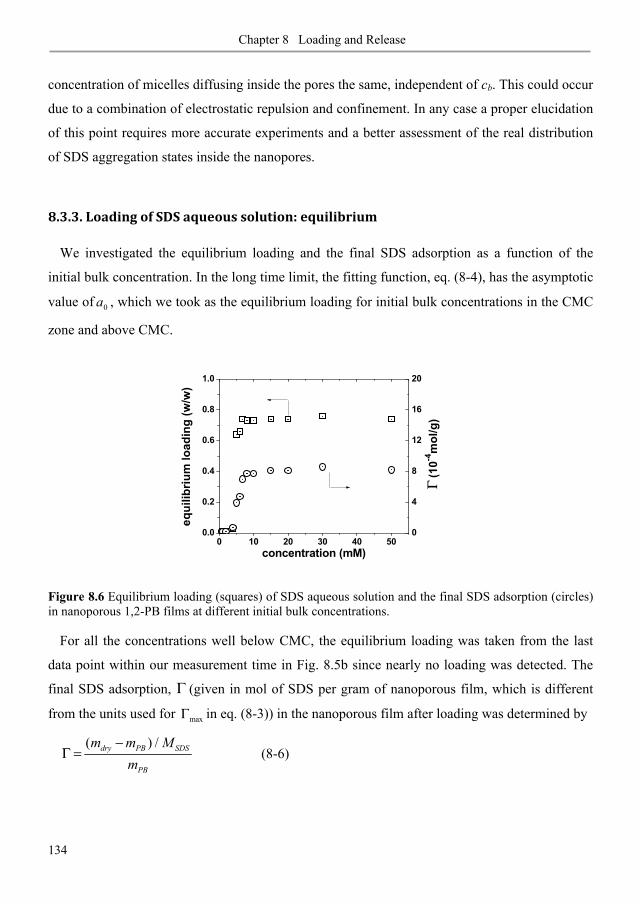
Chapter 8 Loading and Release
134
concentration of micelles diffusing inside the pores the same, independent of cb. This could occur
due to a combination of electrostatic repulsion and confinement. In any case a proper elucidation
of this point requires more accurate experiments and a better assessment of the real distribution
of SDS aggregation states inside the nanopores.
8.3.3. Loading of SDS aqueous solution: equilibrium
We investigated the equilibrium loading and the final SDS adsorption as a function of the
initial bulk concentration. In the long time limit, the fitting function, eq. (8-4), has the asymptotic
value of 0a , which we took as the equilibrium loading for initial bulk concentrations in the CMC
zone and above CMC.
Figure 8.6 Equilibrium loading (squares) of SDS aqueous solution and the final SDS adsorption (circles) in nanoporous 1,2-PB films at different initial bulk concentrations.
For all the concentrations well below CMC, the equilibrium loading was taken from the last
data point within our measurement time in Fig. 8.5b since nearly no loading was detected. The
final SDS adsorption, Γ (given in mol of SDS per gram of nanoporous film, which is different
from the units used for maxΓ in eq. (8-3)) in the nanoporous film after loading was determined by
( ) /dry PB SDS
PB
m m Mm
−Γ = (8-6)
0 10 20 30 40 500.0
0.2
0.4
0.6
0.8
1.0
Γ (1
0-4m
ol/g
)
equi
libriu
m lo
adin
g (w
/w)
concentration (mM)
0
4
8
12
16
20
146
Chapter 8 Loading and Release
135
where drym denotes the mass of the SDS loaded film after complete drying, and
288 g/molSDSM = is the molar mass of SDS. Strictly speaking, the weight gain ( dry PBm m− )
comprises both the adsorbed SDS on the pore walls and the SDS deposited from the aqueous
solution filling the pores before drying. However, due to the large specific surface area in the
nanoporous film, the weight contribution from the solution-deposited SDS is at the most 5% (for
the case of highest SDS concentration used in this study, i.e. the 50 mM solution). It is not
possible to see such a contribution in our data due to a data variability of similar magnitude, as
can be seen in the plateau regions of Figs. 8.5b and 8.6. In other words, had the weight gain due
to SDS deposition from the solution been significant, a plateau in the final SDS adsorption as
that observed in Figure 8.6 would have been absent.
The dependences of the equilibrium loading and the final SDS adsorption on the initial SDS
concentration bc are shown in Fig 8.6. At 4bc ≤ mM, the loading of SDS aqueous solution and
the final SDS adsorption were both practically negligible as discussed earlier. After a sharp
transition in the CMC zone, the equilibrium loading saturated at 6.8bc ≥ mM, indicating that the
interior volume of the nanoporous film was fully loaded with SDS aqueous solutions. Similar,
but slightly more gradual saturation behavior was found for the final SDS surface adsorption.
The maximum adsorption maxΓ was 48.1 10−× mol/g, which agrees well with the maximum
capacity determined by SDS adsorption isotherm to be discussed in the next section. The
maximum solution equilibrium loading can be thought of as consisting of two parts: a liquid part
and a SDS adsorbed on the surface part, therefore:
max maxeff SDSloading v Mρ= + Γ (8-7)
where effv denotes the effective volume accessible to the loaded SDS aqueous solution per
gram of nanoporous film. Inserting loadingmax = 0.76± 0.03 and 4max 8.1 10−Γ = × ± 0.3x10⁻⁴
mol/g and assuming = 1 g/cm3, eq. (8-7) gives effv = 0.53 ± 0.03 cm3/g. The volume occupied
by the SDS layer per gram of the nanoporous film is then 0.27spec effv v− = ± 0.03 cm3/g. Given
the specific surface area of the nanoporous film specA = 278 ± 40 m2/g, we estimated a thickness
of the adsorbed SDS layer of 1.0 ± 0.2 nm, as calculated by
( ) /sds eff specl v v A= − (8-8)
147
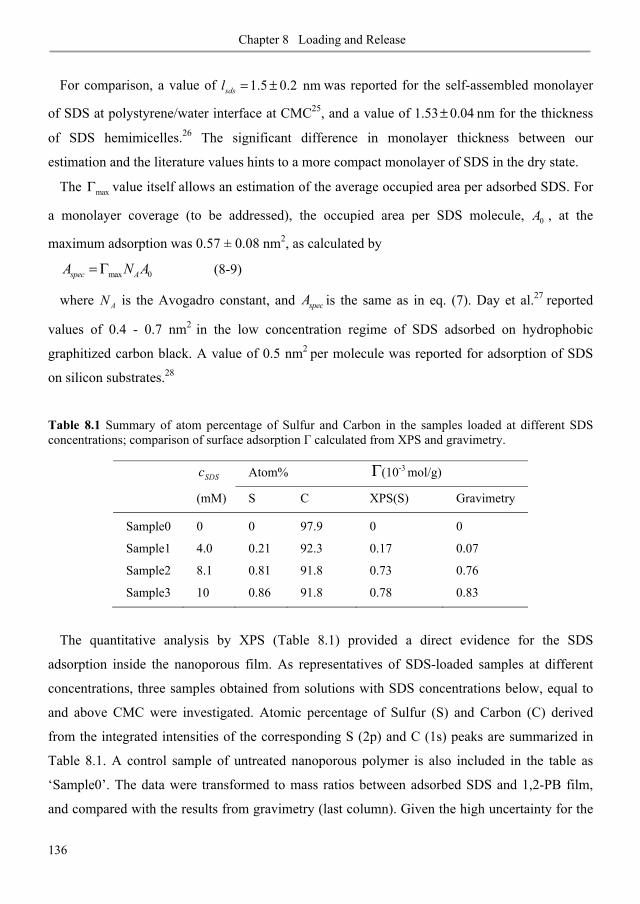
Chapter 8 Loading and Release
136
For comparison, a value of 1.5 0.2 nmsdsl = ± was reported for the self-assembled monolayer
of SDS at polystyrene/water interface at CMC25, and a value of 1.53 0.04± nm for the thickness
of SDS hemimicelles.26 The significant difference in monolayer thickness between our
estimation and the literature values hints to a more compact monolayer of SDS in the dry state.
The maxΓ value itself allows an estimation of the average occupied area per adsorbed SDS. For
a monolayer coverage (to be addressed), the occupied area per SDS molecule, 0A , at the
maximum adsorption was 0.57 ± 0.08 nm2, as calculated by
max 0spec AA N A= Γ (8-9)
where AN is the Avogadro constant, and specA is the same as in eq. (7). Day et al.27 reported
values of 0.4 - 0.7 nm2 in the low concentration regime of SDS adsorbed on hydrophobic
graphitized carbon black. A value of 0.5 nm2 per molecule was reported for adsorption of SDS
on silicon substrates.28
Table 8.1 Summary of atom percentage of Sulfur and Carbon in the samples loaded at different SDS concentrations; comparison of surface adsorption calculated from XPS and gravimetry.
SDSc
(mM)
Atom% Γ(10-3 mol/g)
S C XPS(S) Gravimetry
Sample0
Sample1
Sample2
Sample3
0
4.0
8.1
10
0
0.21
0.81
0.86
97.9
92.3
91.8
91.8
0
0.17
0.73
0.78
0
0.07
0.76
0.83
The quantitative analysis by XPS (Table 8.1) provided a direct evidence for the SDS
adsorption inside the nanoporous film. As representatives of SDS-loaded samples at different
concentrations, three samples obtained from solutions with SDS concentrations below, equal to
and above CMC were investigated. Atomic percentage of Sulfur (S) and Carbon (C) derived
from the integrated intensities of the corresponding S (2p) and C (1s) peaks are summarized in
Table 8.1. A control sample of untreated nanoporous polymer is also included in the table as
‘Sample0’. The data were transformed to mass ratios between adsorbed SDS and 1,2-PB film,
and compared with the results from gravimetry (last column). Given the high uncertainty for the
148
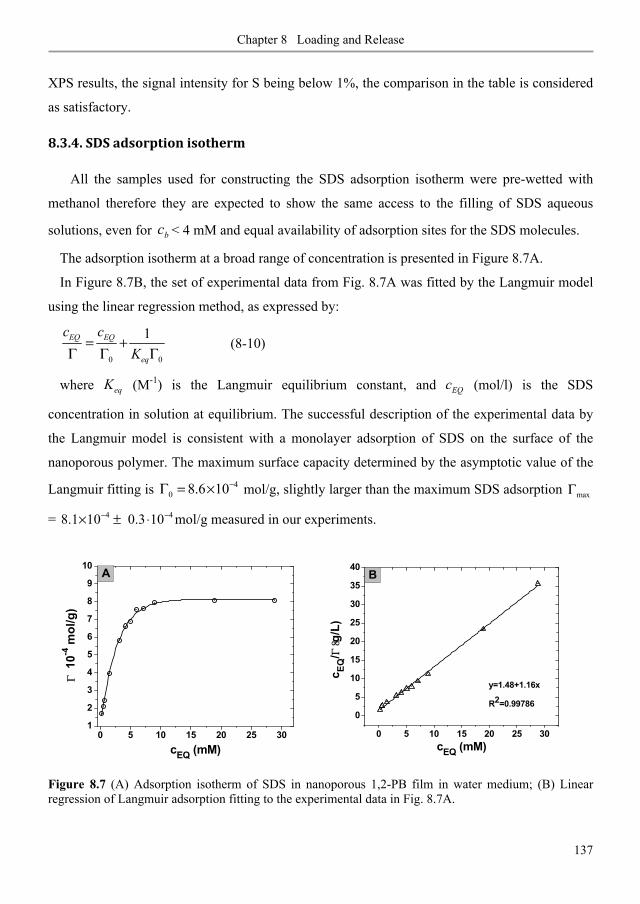
Chapter 8 Loading and Release
137
XPS results, the signal intensity for S being below 1%, the comparison in the table is considered
as satisfactory.
8.3.4. SDS adsorption isotherm
All the samples used for constructing the SDS adsorption isotherm were pre-wetted with
methanol therefore they are expected to show the same access to the filling of SDS aqueous
solutions, even for bc < 4 mM and equal availability of adsorption sites for the SDS molecules.
The adsorption isotherm at a broad range of concentration is presented in Figure 8.7A.
In Figure 8.7B, the set of experimental data from Fig. 8.7A was fitted by the Langmuir model
using the linear regression method, as expressed by:
0 0
1EQ EQ
eq
c cK
= +Γ Γ Γ
(8-10)
where eqK (M-1) is the Langmuir equilibrium constant, and EQc (mol/l) is the SDS
concentration in solution at equilibrium. The successful description of the experimental data by
the Langmuir model is consistent with a monolayer adsorption of SDS on the surface of the
nanoporous polymer. The maximum surface capacity determined by the asymptotic value of the
Langmuir fitting is 40 8.6 10−Γ = × mol/g, slightly larger than the maximum SDS adsorption maxΓ
= 4 48.1 10 0.3 10 − −× ± ⋅ mol/g measured in our experiments.
Figure 8.7 (A) Adsorption isotherm of SDS in nanoporous 1,2-PB film in water medium; (B) Linear regression of Langmuir adsorption fitting to the experimental data in Fig. 8.7A.
0 5 10 15 20 25 301
2
3
4
5
6
7
8
9
10
Γ 10
-4 m
ol/g
)
cEQ (mM)
A
0 5 10 15 20 25 30
0
5
10
15
20
25
30
35
40
y=1.48+1.16x
R2=0.99786
c EQ/Γ
8g/L
)
cEQ (mM)
B
149
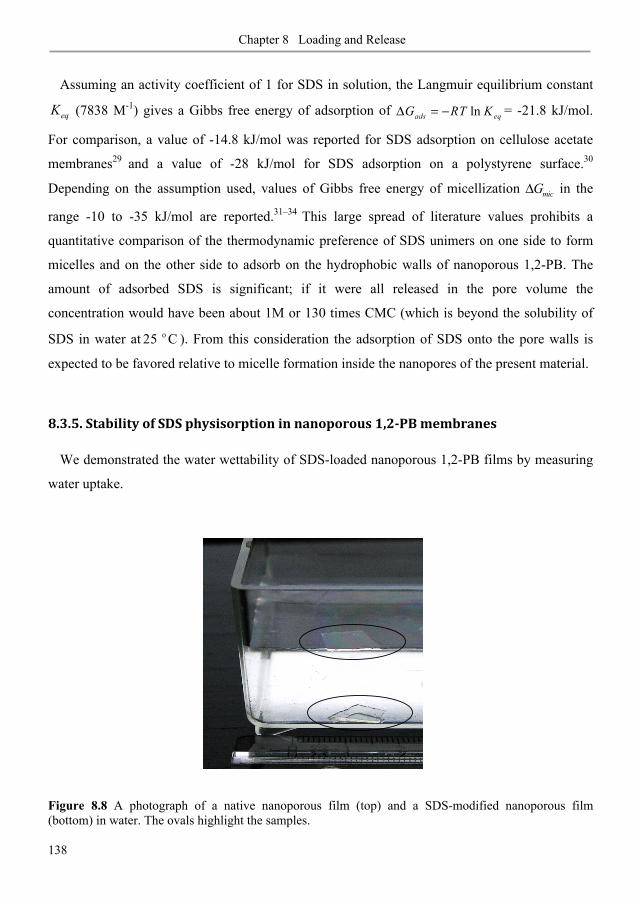
Chapter 8 Loading and Release
138
Assuming an activity coefficient of 1 for SDS in solution, the Langmuir equilibrium constant
eqK (7838 M-1) gives a Gibbs free energy of adsorption of lnads eqG RT KΔ = − = -21.8 kJ/mol.
For comparison, a value of -14.8 kJ/mol was reported for SDS adsorption on cellulose acetate
membranes29 and a value of -28 kJ/mol for SDS adsorption on a polystyrene surface.30
Depending on the assumption used, values of Gibbs free energy of micellization micGΔ in the
range -10 to -35 kJ/mol are reported.31–34 This large spread of literature values prohibits a
quantitative comparison of the thermodynamic preference of SDS unimers on one side to form
micelles and on the other side to adsorb on the hydrophobic walls of nanoporous 1,2-PB. The
amount of adsorbed SDS is significant; if it were all released in the pore volume the
concentration would have been about 1M or 130 times CMC (which is beyond the solubility of
SDS in water at o25 C ). From this consideration the adsorption of SDS onto the pore walls is
expected to be favored relative to micelle formation inside the nanopores of the present material.
8.3.5. Stability of SDS physisorption in nanoporous 1,2-PB membranes
We demonstrated the water wettability of SDS-loaded nanoporous 1,2-PB films by measuring
water uptake.
Figure 8.8 A photograph of a native nanoporous film (top) and a SDS-modified nanoporous film (bottom) in water. The ovals highlight the samples.
150
Chapter 8 Loading and Release
139
A native nanoporous film whose macroscopic density is approximately 0.6 g/cm3, and a SDS-
loaded nanoporous film after maximum loading were dipped in DI water. Figure 8.8 illustrates
that the native sample floated on the surface of water, while the nanoporous 1,2-PB with
incorporated SDS sank into the water. After 24 h, the water uptake of all the SDS-modified
samples after a maximum loading was 0.54 ± 0.03 mg per milligram of tested sample, which is
close to the previously mentioned (see discussion following eq. (8-6)) accessible mass effv =
0.53 ± 0.03 gram of SDS solution per gram of nanoporous sample. The quick water uptake
clearly demonstrates that the hydrophobic nanoporous 1,2-PB films can be rendered hydrophilic
by physisorption of SDS.
Figure 8.9 The solid circles are experimental data of water uptake as a function of square root of immersion time for a nanoporous 1,2-PB film loaded to saturation with SDS and then immersed into excess of deionized water. The solid line is a prediction from the Lucas-Washburn equation (see main text and note35). The dashed line is the linear trend line for the experimental data between 5 and 20 s.
The kinetics of water uptake into one SDS-modified nanoporous polymer is shown in Figure
8.9 by the filled circles. The mass of water relative to the mass of the polymer matrix is plotted
as a function of square root of time. The saturation value is reached in about 30 s; a linear
increase relative to t½ is observed for the 4 data points between 5 and 20 s (segmented line), after
a possible time lag at earlier times (data missing for times shorter than 5 s). The linearity relative
to the square root of time qualitatively agrees with the kinetics of capillary rise predicted by the
Lucas-Washburn equation (L-W).1,2 A quantitative comparison of the uptake results with the
prediction from the L-W equation is questionable due to possible changes of liquid and interface
0
0.1
0.2
0.3
0.4
0.5
0.6
0 5 10 15 20
wat
er u
ptak
e (w
/w)
[time (s)]½
151

Chapter 8 Loading and Release
140
composition in the process of imbibition and to the complex geometry of water access into the
porous samples. However, we compare in Fig. 8.9 the trend slope of the initial experimental data
with the prediction of the L-W equation (solid line) under the simplifying assumptions listed in
note 35. The contact angle (61 ) and the surface tension (34 mN/m) were taken equal to the
plateau values in Figs. 8.4 (a, b); a tortuosity factor of 1.5 was included35, which is characteristic
for the gyroid porosity.36 The slope predicted from the L-W equation under the mentioned
assumptions35 is 25% larger than the experimental observation. It’s interesting that under
reasonable assumptions the simple L-W model gives a rather good estimate of the intermediate
slope for the kinetics of water uptake, despite the complexity of the system.
8.3.6. SDS release from nanoporous 1,2-PB membranes in water and methanol
Finally we present in Figure 8.10 results on the kinetics of SDS release in excess of water or
methanol. SDS release is defined as the mass loss of the SDS-loaded sample over the initial
amount of SDS adsorbed in the sample. The SDS release in water (full symbols) is significantly
slower than the release in methanol. About 70% of the adsorbed SDS was released after 72 h in
excess of water. The release of SDS in excess of methanol (empty symbols) was quantitative
within 40 minutes. The release data in methanol (see the insert) are well fitted by a single
exponential function of the form: ( ) 0% 100·[1 exp( / )]release t τ= − − with the characteristic
time 0τ = 10.4 min (segmented line in Fig. 8.10). The release data in water can be formally fitted
by a double exponential function of the form of eq. (8-5) comprising two characteristic times 1τ
= 51 min. and 2τ = 3900 min (solid line in Fig. 8.10). We conclude this paragraph by a
discussion of the order of magnitude for the time-scales of SDS release in the two solvents.
We firstly observe that the solvent capillary uptake (see Fig. 8.9) is faster than the SDS
desorption (Fig. 8.10), therefore we assume in the following that the solvent uptake does not
delay significantly the SDS release process. Generally the release process comprises SDS
desorption from the surface, formation of micelles, diffusion through the nanopores either as
single molecules or as micelles, and re-adsorption onto the pore walls. A simple uninterrupted
diffusion of a SDS molecule out of a 0.5 mm long nanochannel would take approximately 5
minutes in water and 3 minutes in methanol (the diffusion coefficient of single SDS molecules in
152
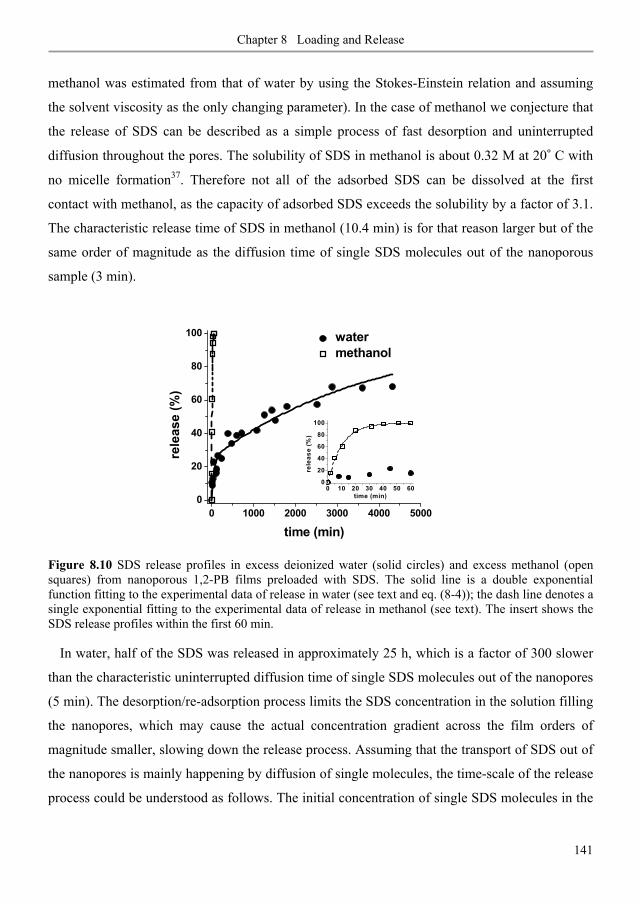
Chapter 8 Loading and Release
141
methanol was estimated from that of water by using the Stokes-Einstein relation and assuming
the solvent viscosity as the only changing parameter). In the case of methanol we conjecture that
the release of SDS can be described as a simple process of fast desorption and uninterrupted
diffusion throughout the pores. The solubility of SDS in methanol is about 0.32 M at 20 C with
no micelle formation37. Therefore not all of the adsorbed SDS can be dissolved at the first
contact with methanol, as the capacity of adsorbed SDS exceeds the solubility by a factor of 3.1.
The characteristic release time of SDS in methanol (10.4 min) is for that reason larger but of the
same order of magnitude as the diffusion time of single SDS molecules out of the nanoporous
sample (3 min).
Figure 8.10 SDS release profiles in excess deionized water (solid circles) and excess methanol (open squares) from nanoporous 1,2-PB films preloaded with SDS. The solid line is a double exponential function fitting to the experimental data of release in water (see text and eq. (8-4)); the dash line denotes a single exponential fitting to the experimental data of release in methanol (see text). The insert shows the SDS release profiles within the first 60 min.
In water, half of the SDS was released in approximately 25 h, which is a factor of 300 slower
than the characteristic uninterrupted diffusion time of single SDS molecules out of the nanopores
(5 min). The desorption/re-adsorption process limits the SDS concentration in the solution filling
the nanopores, which may cause the actual concentration gradient across the film orders of
magnitude smaller, slowing down the release process. Assuming that the transport of SDS out of
the nanopores is mainly happening by diffusion of single molecules, the time-scale of the release
process could be understood as follows. The initial concentration of single SDS molecules in the
0 1000 2000 3000 4000 50000
20
40
60
80
100
0 10 20 30 40 50 600
20
40
60
80
100
rele
ase
(%)
time (min)
water methanol
rele
ase
(%)
time (min)
153
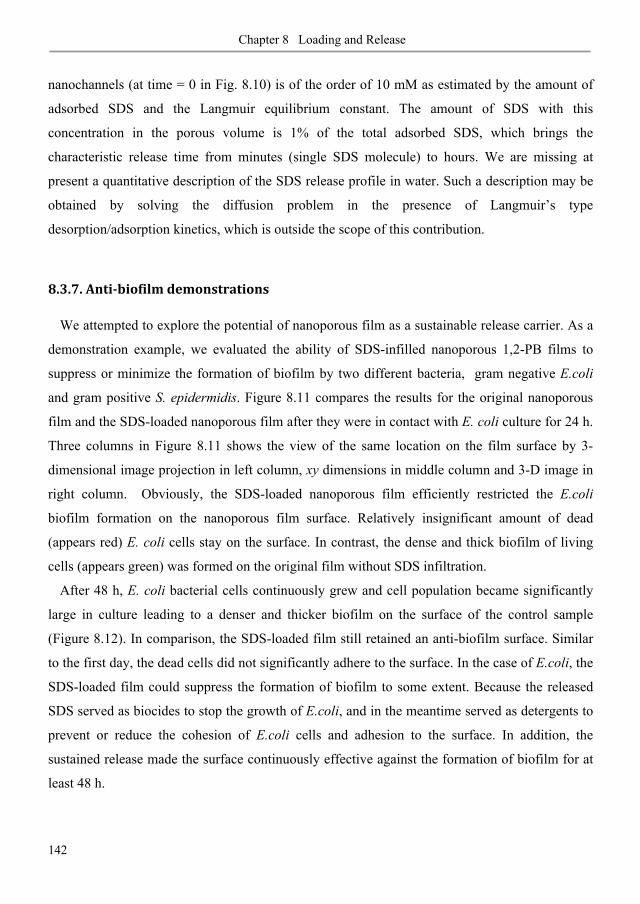
Chapter 8 Loading and Release
142
nanochannels (at time = 0 in Fig. 8.10) is of the order of 10 mM as estimated by the amount of
adsorbed SDS and the Langmuir equilibrium constant. The amount of SDS with this
concentration in the porous volume is 1% of the total adsorbed SDS, which brings the
characteristic release time from minutes (single SDS molecule) to hours. We are missing at
present a quantitative description of the SDS release profile in water. Such a description may be
obtained by solving the diffusion problem in the presence of Langmuir’s type
desorption/adsorption kinetics, which is outside the scope of this contribution.
8.3.7. Anti-biofilm demonstrations
We attempted to explore the potential of nanoporous film as a sustainable release carrier. As a
demonstration example, we evaluated the ability of SDS-infilled nanoporous 1,2-PB films to
suppress or minimize the formation of biofilm by two different bacteria, gram negative E.coli
and gram positive S. epidermidis. Figure 8.11 compares the results for the original nanoporous
film and the SDS-loaded nanoporous film after they were in contact with E. coli culture for 24 h.
Three columns in Figure 8.11 shows the view of the same location on the film surface by 3-
dimensional image projection in left column, xy dimensions in middle column and 3-D image in
right column. Obviously, the SDS-loaded nanoporous film efficiently restricted the E.coli
biofilm formation on the nanoporous film surface. Relatively insignificant amount of dead
(appears red) E. coli cells stay on the surface. In contrast, the dense and thick biofilm of living
cells (appears green) was formed on the original film without SDS infiltration.
After 48 h, E. coli bacterial cells continuously grew and cell population became significantly
large in culture leading to a denser and thicker biofilm on the surface of the control sample
(Figure 8.12). In comparison, the SDS-loaded film still retained an anti-biofilm surface. Similar
to the first day, the dead cells did not significantly adhere to the surface. In the case of E.coli, the
SDS-loaded film could suppress the formation of biofilm to some extent. Because the released
SDS served as biocides to stop the growth of E.coli, and in the meantime served as detergents to
prevent or reduce the cohesion of E.coli cells and adhesion to the surface. In addition, the
sustained release made the surface continuously effective against the formation of biofilm for at
least 48 h.
154
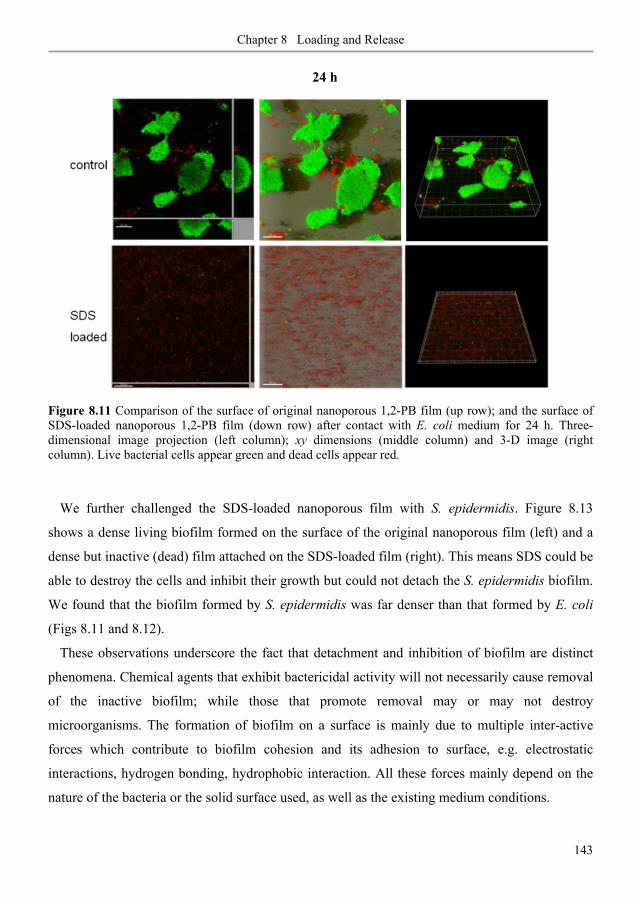
Chapter 8 Loading and Release
143
Figure 8.11 Comparison of the surface of original nanoporous 1,2-PB film (up row); and the surface of SDS-loaded nanoporous 1,2-PB film (down row) after contact with E. coli medium for 24 h. Three-dimensional image projection (left column); xy dimensions (middle column) and 3-D image (right column). Live bacterial cells appear green and dead cells appear red.
We further challenged the SDS-loaded nanoporous film with S. epidermidis. Figure 8.13
shows a dense living biofilm formed on the surface of the original nanoporous film (left) and a
dense but inactive (dead) film attached on the SDS-loaded film (right). This means SDS could be
able to destroy the cells and inhibit their growth but could not detach the S. epidermidis biofilm.
We found that the biofilm formed by S. epidermidis was far denser than that formed by E. coli
(Figs 8.11 and 8.12).
These observations underscore the fact that detachment and inhibition of biofilm are distinct
phenomena. Chemical agents that exhibit bactericidal activity will not necessarily cause removal
of the inactive biofilm; while those that promote removal may or may not destroy
microorganisms. The formation of biofilm on a surface is mainly due to multiple inter-active
forces which contribute to biofilm cohesion and its adhesion to surface, e.g. electrostatic
interactions, hydrogen bonding, hydrophobic interaction. All these forces mainly depend on the
nature of the bacteria or the solid surface used, as well as the existing medium conditions.
24 h
155
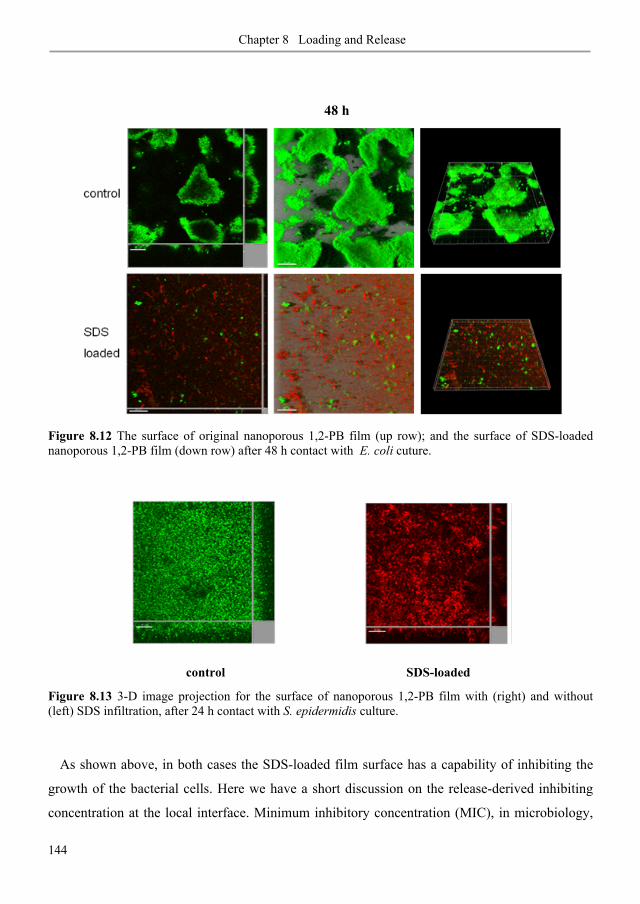
Chapter 8 Loading and Release
144
Figure 8.12 The surface of original nanoporous 1,2-PB film (up row); and the surface of SDS-loaded nanoporous 1,2-PB film (down row) after 48 h contact with E. coli cuture.
Figure 8.13 3-D image projection for the surface of nanoporous 1,2-PB film with (right) and without (left) SDS infiltration, after 24 h contact with S. epidermidis culture.
As shown above, in both cases the SDS-loaded film surface has a capability of inhibiting the
growth of the bacterial cells. Here we have a short discussion on the release-derived inhibiting
concentration at the local interface. Minimum inhibitory concentration (MIC), in microbiology,
control SDS-loaded
48 h
156

Chapter 8 Loading and Release
145
is the lowest concentration of an antimicrobial that will inhibit the visible growth of a
microorganism after incubation. MIC 50 is the SDS concentration known to cause 50% decrease
in the growth rate of suspended e.g. E. coli (MIC50 = 125 μg/ml as tested by Y. Lang). This
means the release of SDS from nanoporous film should achieve a concentration ( MIC50) at the
interface sufficient to destroy bacteria attempting to adhere to the film surface. Using the SDS
release profile in Fig. 8.10, we can estimate the interface concentration of SDS by mass transfer
calculations and compare with MIC50. In water, half of the SDS was released in approximately
25 h, therefore the average release flux JSDS (= 0.1 mg/cm2/h) can be calculated by the average
release rate over the surface area of the film,
JSDS = max50% (8-11)PBmA t
⋅Γ ⋅⋅
where 4max 8.1 10 mol/g−Γ = ⋅ , 20 mgPBm = , t = 25 h, A = 0.9 cm2
To justify that the JSDS as calculated above was sufficient to kill bacteria in the near-surface
zone, a boundary layer model was considered. The boundary layer thickness is a region over
which the concentration drops from the maximum at the surface zone to zero at some distance
way. Using Fick’s law of diffusion where 0( / ) ( ) /SDS SDS s mJ D dC dx D C C δ= − ≈ − − and
substituting the values for DSDS = 7.8·10-10 m2/s, J = JSDS, Cs = MIC50 and C0 = 0, the boundary
layer m was calculated to be 92 μm. This indicates within 5 μm away from the surface, the SDS
concentration is still very close to MIC50; while the size of a bacterium is usually 1~ 2 μm. In
fact, the concentration needed to inhibit bacterial adhesion at dissolved concentrations is usually
less than MIC50. Thus the SDS release rates even lower than 0.1 mg/cm2/h would be still
effective in limiting bacterial adhesion in the case of E. coli.
8.4. Conclusions
Loading kinetics and equilibrium of SDS aqueous solutions into hydrophobic nanoporous 1,2-
PB film of gyroid morphology was investigated. The values of SDS concentration studied
covered two decades, from 16 times below to 6 times above CMC (8.1 mM). A typical loading
experiment consisted of gravimetric measurements of a nanoporous sample at chosen time
157
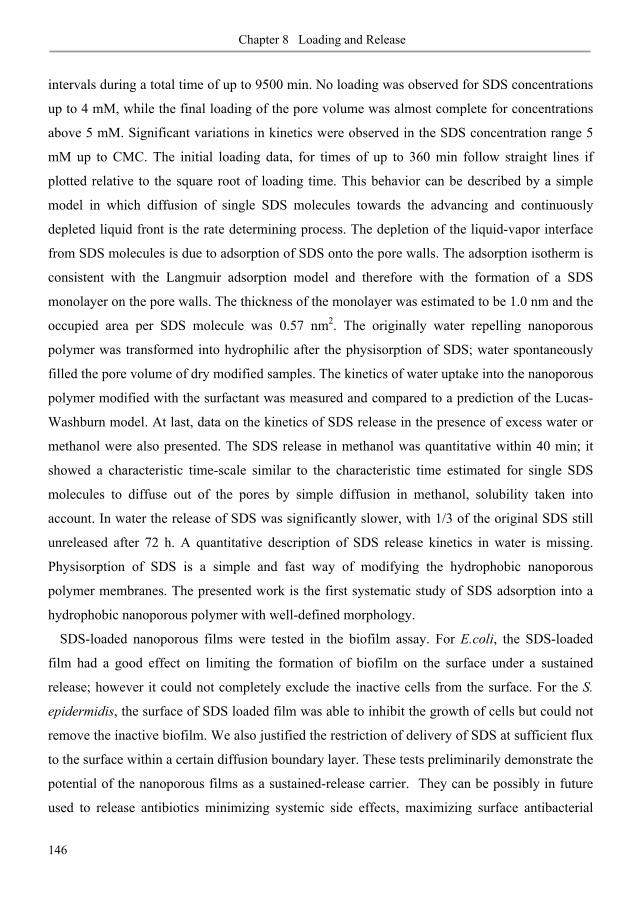
Chapter 8 Loading and Release
146
intervals during a total time of up to 9500 min. No loading was observed for SDS concentrations
up to 4 mM, while the final loading of the pore volume was almost complete for concentrations
above 5 mM. Significant variations in kinetics were observed in the SDS concentration range 5
mM up to CMC. The initial loading data, for times of up to 360 min follow straight lines if
plotted relative to the square root of loading time. This behavior can be described by a simple
model in which diffusion of single SDS molecules towards the advancing and continuously
depleted liquid front is the rate determining process. The depletion of the liquid-vapor interface
from SDS molecules is due to adsorption of SDS onto the pore walls. The adsorption isotherm is
consistent with the Langmuir adsorption model and therefore with the formation of a SDS
monolayer on the pore walls. The thickness of the monolayer was estimated to be 1.0 nm and the
occupied area per SDS molecule was 0.57 nm2. The originally water repelling nanoporous
polymer was transformed into hydrophilic after the physisorption of SDS; water spontaneously
filled the pore volume of dry modified samples. The kinetics of water uptake into the nanoporous
polymer modified with the surfactant was measured and compared to a prediction of the Lucas-
Washburn model. At last, data on the kinetics of SDS release in the presence of excess water or
methanol were also presented. The SDS release in methanol was quantitative within 40 min; it
showed a characteristic time-scale similar to the characteristic time estimated for single SDS
molecules to diffuse out of the pores by simple diffusion in methanol, solubility taken into
account. In water the release of SDS was significantly slower, with 1/3 of the original SDS still
unreleased after 72 h. A quantitative description of SDS release kinetics in water is missing.
Physisorption of SDS is a simple and fast way of modifying the hydrophobic nanoporous
polymer membranes. The presented work is the first systematic study of SDS adsorption into a
hydrophobic nanoporous polymer with well-defined morphology.
SDS-loaded nanoporous films were tested in the biofilm assay. For E.coli, the SDS-loaded
film had a good effect on limiting the formation of biofilm on the surface under a sustained
release; however it could not completely exclude the inactive cells from the surface. For the S.
epidermidis, the surface of SDS loaded film was able to inhibit the growth of cells but could not
remove the inactive biofilm. We also justified the restriction of delivery of SDS at sufficient flux
to the surface within a certain diffusion boundary layer. These tests preliminarily demonstrate the
potential of the nanoporous films as a sustained-release carrier. They can be possibly in future
used to release antibiotics minimizing systemic side effects, maximizing surface antibacterial
158
Chapter 8 Loading and Release
147
properties and prolonging the time over which a device contains sufficient antibiotics to be
effective. A quality in controlled release is also expected to develop for nanoporous 1,2-PB
polymers by rendering a stimuli sensitivity.
8.5. References and notes
[1] Lucas, R. Kolloid Z. 1918, 23, 15-22.
[2] Washburn, E. W. Phys. Rev. 1921, 17, 273-283.
[3] Tadros, T. F. Applied Surfactants: principles and applications, Wiley-VCH, 2005.
[4] Hall-Stoodley, L.; Costerton, J. W. and Stoodley , P. Bacterial Biofilms: from the Natural Environment to Infectious Diseases. Nature Reviews | Microbiology 2004 , 2, 95-108.
[5] Chen, X. and Stewart, P.S. Biofilm Removal Caused by Chemical Treatments. Wat. Res. 2000, 34, 4229–4233.
[6] Haagensen, J. A. J.; Klausen, M.; Ernst, R. K.; Miller, S. I. ; Folkesson, A.; Tolker-Nielsen, T.and Molin, S. Differentiation and Distribution of Colistin- and Sodium Dodecyl Sulfate-Tolerant Cells in Pseudomonas aeruginosa Biofilms. J. Bacteriology 2007, 189, 28–37.
[7] Pashley, R. M.; Karaman, M. E. Applied Colloid and Surface Chemistry, John Wiley & Sons, Ltd. 2004; Chapter 2.
[8] Jakobsen, M. R.; Grydgaard, A Characterization of Nano Cavities in Polymeric Materials, B.Sc. Thesis, Technical University of Denmark, 2006.
[9] Guo, X. F.; Andreasen, W.J.; Vigild, E.M.; Ndoni, S. Macromolecules 2007, 40, 3669-3675.
[10] Turner, S.F.; Clarke,S.M.; Rennie, A.R.; Thirtle, P.N.; Cooke, D.J.; Li, Z.X.; Thomas, R.K. Langmuir 1999, 15, 1017.
[11] Mark, J. E. Polymer Data Handbook, Oxford University Press, 1999.
[12] Paria, S.; Khilar, K. C. Advances in Colloid and Interface Science 2004, 110, 75–95.
[13] Chen, J. H.; Ruckenstein, E. J. Colloid and Interface Sci. 1991, 142, 544–553.
[14] Casford, M. T. L.; Davies, P. B.; Neivandt, D. J. Langmuir 2006, 22, 3105–3111.
[15] Ndoni, S.; Vigild, M.E.; Berg, R.H. J. Am. Chem. Soc. 2003, 125, 13366-13367.
[16] The etching process generates one end-group |
|-Si -F per chain of 1,2-PB in the nanoporous 1,2-PB
film,16 which is expected to expose on the surface after removal of PDMS. The number average molecular weight of block copolymer 1,2-PB-b-PDMS is nM = 14100 g/mol, and the mass fraction of
159
Chapter 8 Loading and Release
148
PDMS is wPDMS = 0.41 (see the chapter 3.2). For 1 gram nanoporous 1,2-PB the number of |
|-Si -F is:
NAv/Mn,PB = 6.02·1023 mol-1/ 8300 g·mol-1 = 7.3·1019 g-1, which corresponds to 0.26 |
|-Si -F per 2nm of
surface area ( specA =278 ±40 m2/g). The number of 1,2-PB repeating units per 2nm surface area is [10-21
(g·nm-3) · 6.02·1023 (mol-1) / 54 (g·mol-1)]2/3 = 5 nm-2. Therefore, the surface density of |
|-Si -F is 5.2%
relative to the surface repeating units of 1,2-PB.
[17] Zhmud, V.B.; Tiberg, F.; Hallstensson, K. Journal of Colloid and Interface Science 2000, 228, 263– 269.
[18] Tiberg, F.; Zhmud, B. Phys. Chem. Chem. Phys. 2000, 2, 5189–5196.
[19] Kilau, H.W.; Pahlman, J. E. Colloids Surf. 1987, 26, 217-242.
[20] Churaev, N. V.; Zorin, Z. M. Colloid Surf. A 1995, 100, 131-138.
[21] Brielles, N.; Chantraine, F.; Viana, M.; Chulia, D.; Branlard, P.; Rubinstenn, G.; Lequeux, F.; Mondain-Monval, O. J. Colloid Interface Sci. 2008, 328, 344-352.
[22] Deng, Z.; Lu, H.; Leaist, D. G. J. Chem. Eng. Data 1996, 41, 214-217.
[23] Almgren, M.; Swarup, S. J. Phys. Chem. 1982, 86, 4212-4216.
[24] Bales, B. L.; Messina, L.; Vidal, A.; Peric, M.; Nascimento, O. R. J. Phys. Chem. B 1998, 102, 10347-10358.
[25] Turner, S.F.; Clarke, S. M.; Rennie, A. R.; Thirtle, P. N.; Cooke, D. J.; Li, Z. X.; Thomas, R. K. Langmuir 1999, 15, 1017-1023.
[26] Burgess, I.; Zamlynny, V.; Szymanski, G.; Lipkowski, J. Langmuir 2001, 17, 3355–3367
[27] Day, R.E.; Greenwood, F.G.; Parfitt, G.D. Proc. 4th Int. Congr. Surf. Activity 1967, 2, 1005.
[28] Luokkala, B.B.; Garoff, S.; Suter, R.M. Phys. Rev. E 2000, 62, 2405.
[29] Singh, K.; Tiwari, A.K. Colloid Journal 2008, 70, 101-104.
[30] Kronberg, B.; Costas, M.; Silveston, R. Pure & Appl. Chem. 1995, 67, 897-902.
[31] Liu, T. Q. Journal of Dispersion Science and Technology 2008, 29, 335–339.
[32] Zana, R. Langmuir 1996, 12, 1208–1211.
[33] Valente, A. J. M.; Burrows, H. D. J. Colloid Interface Sci. 2008, 323, 141–145.
[34] Szymczyk, K.; Janczuk, B. Langmuir 2009, 25, 4377–4383.
[35] The Lucas-Washburn equation1,2 predicts a capillary uptake length l(t) = [(r γ cosθ) t / (2η)]½, where r is the capillary radius, γ the liquid surface energy, θ the contact angle, t the time and η the viscosity of the liquid. By simplifying the capillaries to a bundle of cylinders of radius r, like we did relative to eq. (8-3) in the text, we can convert l(t) into mass of water uptake relative to the mass of the nanoporous
160

Chapter 8 Loading and Release
149
polymer matrix, w(t), which is the vertical axes in Fig.8.8: w(t) = mH2O(t) / mNP = [A·εΑ·l(t)·ρH2O] /[A·h· ·ρNP] where A is the projected flat area of the sample, εΑ the surface porosity, h the height of the sample, ρH2O (ρNP) the density of water (dry nanoporous sample) and the tortuosity factor. The values of the parameters for the solid line in Fig. 8.8 are: εΑ = 0.45; ρH2O = 103 kg/m3; ρNP = 0.6·103 kg/m3; h = 5·10-4 m; = 1.5; r = 6·10-9 m; θ = 61º (see Fig. 8.3 (B)); μ = 10-3 Pa·s; γ = 0.034 N/m. The tortuosity factor of 1.5 is characteristic for the gyroid morphology.33 The pore radius was assumed to be 1.5 nm smaller than that of the unmodified nanoporous polymer, due to the presence of ‘wet’ adsorbed SDS onto the pore walls. The values of the surface tension γ and the contact angle θ for the liquid were taken equal to the respective plateau values in Figs. 8.3 (A,B).
[36] Hamersky, M. W.; Hillmyer, M. A.; Tirrell, M.; Bates, F. S.; Lodge, T. P. Macromolecules 1998, 31, 5363-5370.
[37] Miyata, I.; Takada, A.; Yonese, M.; Kishimoto, H. Bull. Chem. Soc. Jpn. 1990, 63, 3502-3507.
161

Chapter 8 Loading and Release
150
162

Chapter 9 Summary and Suggestions for Future
151
Chapter 9 Summary and Suggestions for Future Work
The overall objective of this Ph.D. project is the development of block copolymer templated
nanoporous polymers for use in membrane applications. Gyroid morphology of the membrane is
designed from synthesis stage to show isotropic percolation with no need for structure pre-
alignment. Narrow pore size distribution is intrinsically determined by microphase separation of
block copolymers at molecular scale. Surface structure of the membrane has been successfully
controlled by using different substrates in the process of membrane fabrication. The original
hydrophobic pore surface has been tailored by UV photo-oxidation or UV-induced thiolene
chemisty thus avoiding the use of pre-wetting solutions on one side and enabling the fouling
minimization on other side. Studying the membrane property of the nanoporous polymers was
thus facilitated by precise control over the (bulk and surface) morphology and pore size, and easy
functionalization of the surface chemistry.
Three relevant membrane applications have been targeted in the project. The first effort
aimed to develop semi-permeable dialysis membranes as diffusion-restricting outer membranes
in amperometric glucose sensors. Chapter 6 consists of two parts. The first part reviewed the
fundamental work on understanding the diffusive transport in nanoporous 1,2-PB membranes in
dialysis in terms of permeability and selectivity. The solute permeation could be altered over a
significant range by changing surface morphology, thickness, and active porosity. From non-skin
membrane to double-skin membrane, the effective diffusion coefficient could be extended over 2
orders of magnitude from 10-6 cm2/s to 10-8 cm2/s. The selectivity of the nanoporous membranes
was investigated relative to a series of antibiotics, proteins and other biomolecules. The solute
transport could be described in terms of size exclusion and hydrodynamic interactions. The
permselectivity can be achieved by size sieving for which size effect is the dominant factor or by
adsorption which captures the passing solutes to give a separation.
The second part of chapter 6 reported the results from sensor tests which assembled the
nanoporous 1,2-PB membrane in multi-layer membrane system for glucose electrode, in
comparison with the standard commercial electrodes. Unfortunately, the reduction in pore size
(10 nm) relative to the reference membrane PET (100 nm) did not cause an effective restriction
163
Chapter 9 Summary and Suggestions for Future
152
in glucose permeability (i.e. effective diffusion coefficient) while the 3 orders of magnitude
increase in porosity led to undesired ultrahigh glucose permeation. Therefore the original
nanoporous membrane does not satisfy this specific application. Actually, we have realized this
confliction from the prediction by theory and experimental data during the fundamental study in
the first part. The high glucose permeability was reflected by a series of glucose diffusion tests,
which could be also predicted by the dependence of Deff on rp. Even for the double-skin
membranes, glucose permeation is still higher than that required in sensors. Adjusting active
porosity was thought to be a simple and effective approach to meet the demand. Unfortunately,
as shown in the results from sensor tests, the hydrophobic membrane became fully permeable to
sample solution after 20 h pre-conditioning so that no flux difference existed between
hydrophobic and UV photo-oxidized membranes. Considering the need of a fast response for
sensor performance, we would not suggest increasing the membrane thickness to reduce the
glucose permeation. Using an additional coating layer on the membrane surface to diminish
surface porosity or on pore wall to reduce both porosity and pore size might be one of possibility
for the future work.
High porosity thus high flux and narrow pore size distribution thus high selectivity are the
advantages of the nanoporous membranes derived from self-assembled block copolymers.
Therefore we should pursue applications that fully take advantage of the merits of this membrane
system rather than restricting or losing their advantageous quality. The hydrophilized non-skin
membranes might be promising for hemodialysis applications where high flux and selectivity,
and anti-fouling are desired.
Beyond diffusive transport property, characterizing the convective transport property is also of
critical importance to understand membrane performance of well-defined nanoporous polymers.
Chapters 7 focused to evaluate the ability of the nanoporous 1,2-PB membranes to reject
dissolved solutes. These rejection experiments are more practically interesting and allow the
potential of the membranes to be evaluated. Membrane fouling was first investigated as a main
problematic issue of affecting the rejection performance. Solutes PEG were used to measure the
membrane-solute interaction and solute-solute interaction under static and dynamic conditions. A
big water flux decline confirms a strong static adsorption of PEG from water solution onto the
original hydrophobic membrane (including within the membrane structure). Changing the
solvent property or tailoring the pore surface chemistry can significantly suppress the fouling in
164
Chapter 9 Summary and Suggestions for Future
153
ultrafiltration and allow understanding intrinsic characteristics of the membranes. Single solutes
PEG and mixed solutes PEG were used to determine the molecular weight cut-off (MWCO)
curves. Tunable rejection properties via distinct separation mechanisms have been realized by
changing the solvent property and surface property. The experimental data collected for the
single PEG solutes was compared with the theory for hindered diffusion without adjustable
parameters. Totally different rejection profiles were observed for the three systems studied,
M+W, M+EW, and HM+W. In M+EW, the presence of ethanol made it possible to behave as
expected by theory. In M+W system, due to significant PEG adsorption onto huge interior
hydrophobic surface, the rejection curve of the nanoporous membrane was unexpectedly
extended from 100% to - 40% . This finding inspired the use of the nanoporous membrane as an
selective absorber to abundantly remove small solutes by internal surface adsorption and on the
other side effectively reject the large solutes by size exclusion. The surface hydrophilization via
binding sulfonated groups on one side diminished the adsorptive fouling on the other side
resulted in a reduction in effective pore size thus enabling a completely new rejection property.
A molecular weight cut-off shifted to the low molecular weights, e.g. between 1 Kg/mol and 4
Kg/mol. The mixed PEG experiments showed similar results. Protein ultrafiltration would be
next step to challenge the ability of nanoporous 1,2-PB membranes in a way close to real
applications.
Demonstrating the ability to reject dissolved solutes is important for establishing the practical
value of these membranes. Equally important to an ultrafiltration membrane is the ability to
produce a high solute flux. At the present stage, 20 ~ 30 μm thick membranes were prepared for
convenience of scientific research. From practical interests, such thickness range has undesired
low hydraulic permeability. Compared to the literature flux values reported for typical
commercial membranes, the membranes fabricated in this work are about 100 times lower. This
is because the commercial phase inversion membranes commonly have a thin selective layer at
nanometer scale. The resistance to flow is inversely proportional to the thickness. If we reduce
the thickness of the nanoporous 1,2-PB membrane to hundreds nanometer scale and integrate it
onto a mechanical support macroporous membrane, a hundreds time increase in flux would be
expected. This increase would make the flux across the bicontinuous structure competitive with
phase inversion membranes.
165
Chapter 9 Summary and Suggestions for Future
154
The last focus in the Ph.D. project has been discussed in chapter 8, which was based on our
interests to develop the nanoporous membrane as a sustainable-release carrier. SDS has been
used as a model molecule to investigate loading of the aqueous solution and the accompanying
physisorption of SDS into the hydrophobic nanoporous films. The loading showed varying
dependence on the SDS concentration. No loading was observed for SDS concentrations below
4.0 mM. At concentrations above 5.0 mM, the initial part of loading showed a linear dependence
on the square root of time, which can be interpreted as diffusion-controlled dynamics. Both the
specific equilibrium loading and the final SDS adsorption reached plateau values at
concentrations above 6.8 mM. The SDS adsorption isotherm can be well described by the
Langmuir model, consistent with a monolayer adsorption onto the pore walls. The SDS-infilled
nanoporous films clearly showed water wettability, in contrast to the original hydrophobic
nanoporous 1,2-PB. The release process of SDS from the nanopores in the presence of excess of
water or methanol showed the very different time scales. The demonstration of anti-biofilm
surface showed a promising result. In the future, different drug release could be studied. More
interestingly, it is to make the nanoporous 1,2-PB polymer as a stimuli sensitive matrix thus
showing a quality of control release response to specific environment.
The present nanoporous 1,2-PB membranes have a shortcoming which must be addressed, that
is, poor mechanical strength. First, the cross-linked films very often split up during the etching
process so that it is difficult to fabricate a large scale of flexible membrane which is more
commercially interesting. Besides, the resulting nanoporous membrane is very fragile, which
brings so much trouble in handling it in different operations. The mechanical strength of the
nanoporous 1,2-PB matrix was so weak that could not withstand high pressure. Therefore more
mechanically robust polymers which do not crack during membrane production and operation
are needed.
One of possibility is to increase the molecular weight of the block copolymer. However, high
molecular weight block copolymer samples do not quickly form a well ordered porous structure
because the rearrangement of the polymer chains is slow. To avoid this, lower molecular weight
samples are very often used during the fabrication of the block copolymers. This results in a low
degree of entanglement which compromises the mechanical integrity of the membranes. PB
block is gel-like at room temperature because its zero-below glass transition. Very often a high
degree of cross-linking is necessarily required to achieve a mechanical stability against solvent;
166
Chapter 9 Summary and Suggestions for Future
155
however this step also leads to an internal stress remaining in the matrix. Finally, we may find a
compromising point by appropriately increasing the molecular weight of precursors and
moderately reducing the cross-linking degree. In addition, using mild UV cross-linking to
replace thermal cross-linking may give a help to reduce internal stress. In addition, as suggested
by Sokol Ndoni from our group, saturation of double bonds by catalytic hydrogenation thus
creating somewhat crystallinity in matrix will be tried to increase the film toughness in near
future. The detailed description is out of scope of this thesis and the principle can be found in
Ref 1.
References
[1] Mahanthappa, M. K.; Lim, L. S.; Hillmyer, M. A. and Bates, F. S. Control of mechanical behavior in polyolefin composites: Integration of glassy, rubbery, and semicrystalline components. Macromolecules 2007, 40, 1585–1593.
167

Chapter 9 Summary and Suggestions for Future
156
168

Appendices
157
Appendices
169
Appendices
158
Appendix A Fabrication Methods
Mechanically robust polymers which do not crack during membrane production and operation
are needed for our research work in practice. No doubt, it is of critical importance for any
membrane applications in reality. We often fabricated nanoporous 1,2-PB films with a thickness
of 500 μm – 1000 μm in previous work for investigating structure characteristics, surface
modifications, etc. However, this Ph.D. project covers more application-oriented research, thus
nanoporous 1,2-PB membranes with a thickness in a few micrometers would be preferred. Due
to high brittleness of the nanoporous 1,2-PB membranes, it took a full year to find an appropriate
method to fabricate thin membranes that can be handled. Here we summarize all the failure
approaches that have been tried in the thesis work. It might be useful information for future
work.
Solvent casting
We started to prepare 100 μm thick films with the conventional method, i.e. solvent casting the
polymer solution (in THF) onto a glass petri-dish. After solvent evaporation, an empty zone was
always formed in the center of solvent cast film, and polymer enriched at the edge of the film,
thus having an uneven distribution in thickness along the radial direction. Different thicknesses
were tried. This phenomenon became more serious in smaller thicknesses. It can be attributed to
‘coffee-ring’ effect as described in detail in Ref 1. The dissolved polymers transferred to the
edge of the petri-dish as pulled by the evaporating flow of solvent. We tried to adjust the solvent
casting formulation in order to minimize the ‘coffee-ring’ effect. For instance, we increased
viscosity of casting solution by making a high ratio of polymer/solvent. We also selected
solvents with low vapor pressure and low volatility, such as toluene, and cyclohexanone. Instead
of glass petri-dish, teflon petri-dish, polyester or PDMS substrate were also used as a substrate
for solvent casting. However, it did not give a significant help.
Regarding the cross-linked films, it is difficult to detach from the petri-dish as the thickness is
less than 50 μm. In addition, as the film thickness reduced to tens of micrometer, the cross-linked
films immediately split up or curled up in contact with the etching solution.
170
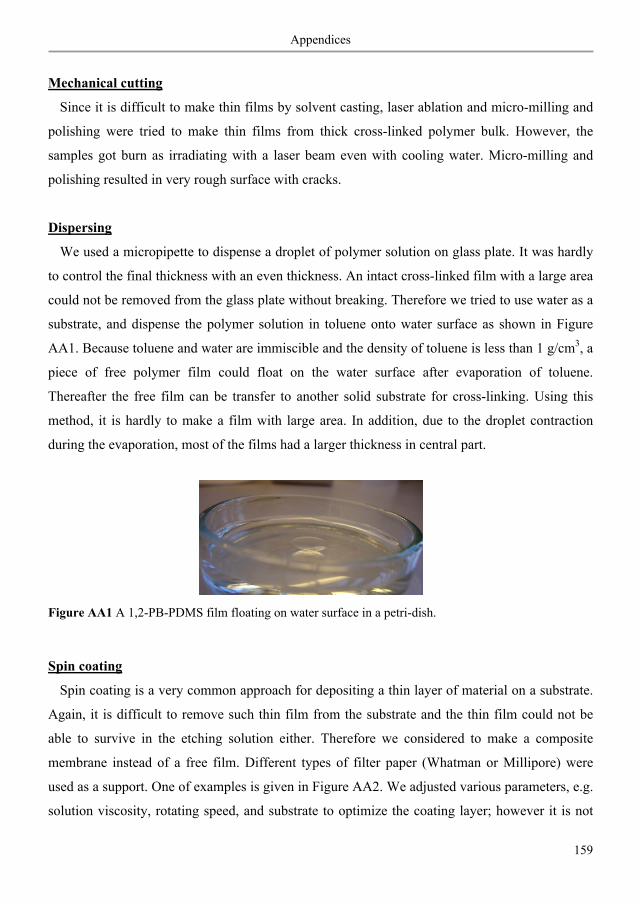
Appendices
159
Mechanical cutting
Since it is difficult to make thin films by solvent casting, laser ablation and micro-milling and
polishing were tried to make thin films from thick cross-linked polymer bulk. However, the
samples got burn as irradiating with a laser beam even with cooling water. Micro-milling and
polishing resulted in very rough surface with cracks.
Dispersing
We used a micropipette to dispense a droplet of polymer solution on glass plate. It was hardly
to control the final thickness with an even thickness. An intact cross-linked film with a large area
could not be removed from the glass plate without breaking. Therefore we tried to use water as a
substrate, and dispense the polymer solution in toluene onto water surface as shown in Figure
AA1. Because toluene and water are immiscible and the density of toluene is less than 1 g/cm3, a
piece of free polymer film could float on the water surface after evaporation of toluene.
Thereafter the free film can be transfer to another solid substrate for cross-linking. Using this
method, it is hardly to make a film with large area. In addition, due to the droplet contraction
during the evaporation, most of the films had a larger thickness in central part.
Figure AA1 A 1,2-PB-PDMS film floating on water surface in a petri-dish.
Spin coating
Spin coating is a very common approach for depositing a thin layer of material on a substrate.
Again, it is difficult to remove such thin film from the substrate and the thin film could not be
able to survive in the etching solution either. Therefore we considered to make a composite
membrane instead of a free film. Different types of filter paper (Whatman or Millipore) were
used as a support. One of examples is given in Figure AA2. We adjusted various parameters, e.g.
solution viscosity, rotating speed, and substrate to optimize the coating layer; however it is not
171
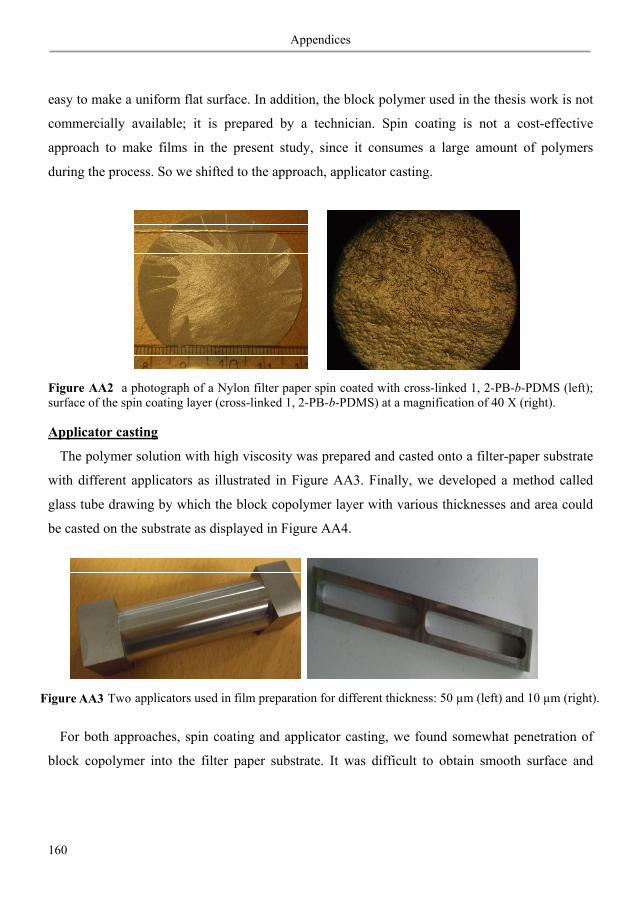
Appendices
160
easy to make a uniform flat surface. In addition, the block polymer used in the thesis work is not
commercially available; it is prepared by a technician. Spin coating is not a cost-effective
approach to make films in the present study, since it consumes a large amount of polymers
during the process. So we shifted to the approach, applicator casting.
Figure AA2 a photograph of a Nylon filter paper spin coated with cross-linked 1, 2-PB-b-PDMS (left); surface of the spin coating layer (cross-linked 1, 2-PB-b-PDMS) at a magnification of 40 X (right).
Applicator casting
The polymer solution with high viscosity was prepared and casted onto a filter-paper substrate
with different applicators as illustrated in Figure AA3. Finally, we developed a method called
glass tube drawing by which the block copolymer layer with various thicknesses and area could
be casted on the substrate as displayed in Figure AA4.
Figure AA3
Two applicators used in film preparation for different thickness: 50 μm (left) and 10 μm (right).
For both approaches, spin coating and applicator casting, we found somewhat penetration of
block copolymer into the filter paper substrate. It was difficult to obtain smooth surface and
172
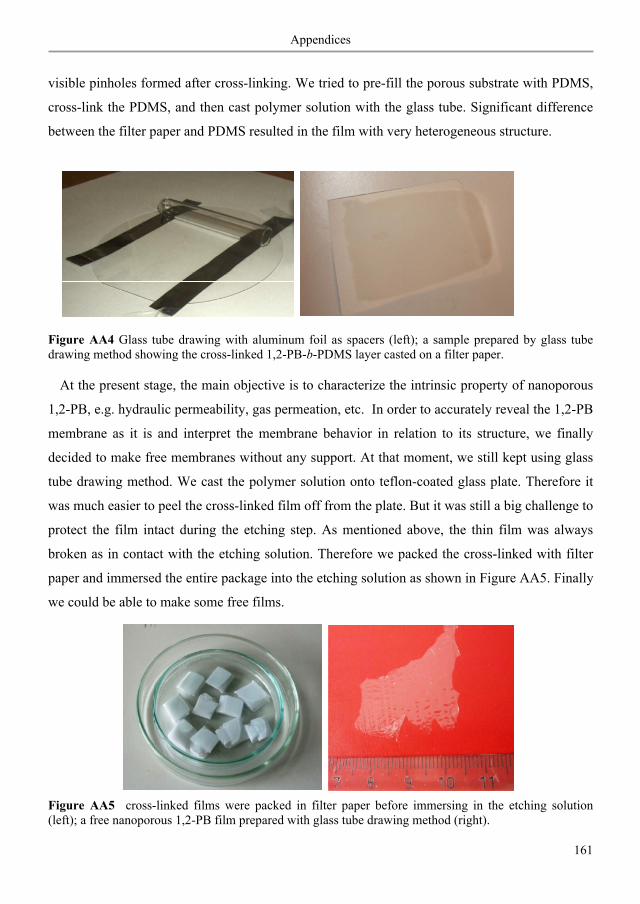
Appendices
161
visible pinholes formed after cross-linking. We tried to pre-fill the porous substrate with PDMS,
cross-link the PDMS, and then cast polymer solution with the glass tube. Significant difference
between the filter paper and PDMS resulted in the film with very heterogeneous structure.
Figure AA4 Glass tube drawing with aluminum foil as spacers (left); a sample prepared by glass tube drawing method showing the cross-linked 1,2-PB-b-PDMS layer casted on a filter paper.
At the present stage, the main objective is to characterize the intrinsic property of nanoporous
1,2-PB, e.g. hydraulic permeability, gas permeation, etc. In order to accurately reveal the 1,2-PB
membrane as it is and interpret the membrane behavior in relation to its structure, we finally
decided to make free membranes without any support. At that moment, we still kept using glass
tube drawing method. We cast the polymer solution onto teflon-coated glass plate. Therefore it
was much easier to peel the cross-linked film off from the plate. But it was still a big challenge to
protect the film intact during the etching step. As mentioned above, the thin film was always
broken as in contact with the etching solution. Therefore we packed the cross-linked with filter
paper and immersed the entire package into the etching solution as shown in Figure AA5. Finally
we could be able to make some free films.
173
Figure AA5 cross-linked films were packed in filter paper before immersing in the etching solution (left); a free nanoporous 1,2-PB film prepared with glass tube drawing method (right).
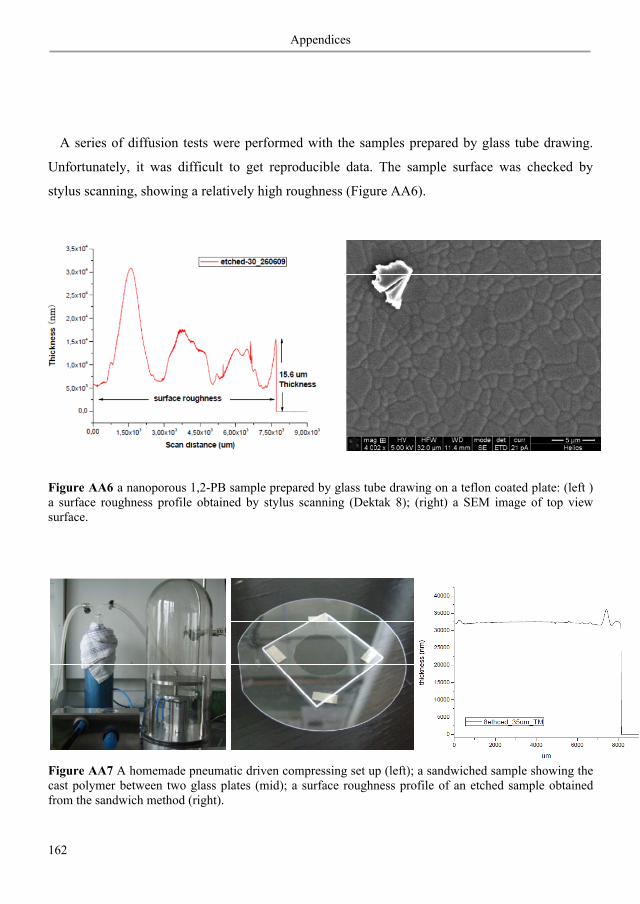
Appendices
162
A series of diffusion tests were performed with the samples prepared by glass tube drawing.
Unfortunately, it was difficult to get reproducible data. The sample surface was checked by
stylus scanning, showing a relatively high roughness (Figure AA6).
Figure AA6 a nanoporous 1,2-PB sample prepared by glass tube drawing on a teflon coated plate: (left ) a surface roughness profile obtained by stylus scanning (Dektak 8); (right) a SEM image of top view surface.
Figure AA7 A homemade pneumatic driven compressing set up (left); a sandwiched sample showing the cast polymer between two glass plates (mid); a surface roughness profile of an etched sample obtained from the sandwich method (right).
174
Appendices
163
Sandwich
To better control the thickness and get a smooth surface, we finally used so-called sandwich
method as described in chapter 3.2. A homemade pneumatic-driven compressing set up was used
to squeeze the cast polymers to a flat sheet as shown in Figure AA7.
It is no problem to detach the cross-linked films from the FDTS-coated plate however it is
rather difficult to remove it from glass plate (see chapter 3.2). All the cross-linked films were
still packed in filter paper during the etching step.
The sandwich method provides a smooth surface with a well-defined surface structure (Fig.
AA7). However there is still a lot of trouble in practice. We certainly need a flexible membrane
with a sufficient mechanical strength. Cracks should be avoided during the membrane fabrication
and operation. Fabrication methods can be diverse; however they will never sort out the problem
which is caused by material itself. In order to thoroughly solve the problem, there may some
opportunities in polymer synthesis, cross-linking step and etching steps which can be taken to
improve the mechanical integrity of the membranes as described in chapter 9.
175
Appendices
164
Appendix B Etching Process
In order to optimize the etching formulations, TBAF concentration 0[ ]TBAF , molar ratio of
TBAF and |
|Si O− − − ( /TBAF Si Om m − ), and etching time t were varied between samples as listed in
Table AB1. The maximum amount of PDMS is determined by mass fraction of PDMS in the
block copolymer precursor, that is, 0.41 as shown in chapter 3.2, Table 3.1. The dry mass of each
sample was compared before and after TBAF etching to give an indication of etching efficiency.
The last column in Table AB1 shows the amount of etched PDMS ( PDMSmΔ ) normalized by the
original mass of the sample 0m . While the work was aimed to develop a proper etching recipe,
more importantly, we attempted to produce a series of nanoporous membranes with different
intrinsic porosity by controlling the etching conditions. Therefore, after the preliminary work as
presented in Table AB1, we kept 0[ ]TBAF (= 0.005 M) and /TBAF Si Om m − (= 1) constant, and
investigated the dependence of etching efficiency on time.
Table AB1 A preliminary study of etching solutions for the non-skin samples with 20 ± 5 μm thickness.
Sample 0m (mg)
0[ ]TBAF (M)
/TBAF Si Om m − (mol/mol)
t (min)
0/PDMSm mΔ (g/g)
BD36-X-1 BD36-X-2 BD36-X-3 BD36-X-4 BD36-X-5 BD36-X-6 BD36-X-7 BD36-X-8
24.3 22.6 21.1 23.8 18.6 18.3 21.9 22.1
0.010 0.005 0.0025 0.0010 0.005 0.005 0.005 0.005
1 1 1 1
1/2 1/3 1/4 1/5
20 20 20 20 120 120 120 120
0.35 0.32 0.05 0.04 0.42 0.41 0.41 0.32
In order to better interpret the etching results, here we first review the knowledge of reaction
kinetics. For a generic reaction xA + yB C with no intermediate steps in its reaction
mechanism (that is, an elementary reaction), the rate is given by
( )[ ] [ ] (AB-1)m nrate k T A B=
176
Appendices
165
where [A] and [B] express the concentration of the species A and B, respectively (usually in
moles per liter); m and n are not the respective stoichiometric coefficients of the balanced
equation; they must be determined experimentally. k is the rate constant of the reaction. The
value of this coefficient k depends on conditions such as temperature, ionic strength, and surface
area of the adsorbent or light irradiation. In our case, the species A and B are TBAF and the
repeating unit of PDMS, |
|Si O− − − . The reaction mechanism in detail was reported in Ref 2.
However, the reaction process is complex and, m and n are unknown. Unlike the direct collision
of two species dissolved in a liquid, in our case it is a contact between a dense block copolymer
film and TBAF solution. Therefore, the apparent reaction rate is a result of (1) permeation of
TBAF solution in the block polymer bulk, including the diffusivity D and solubility S of TBAF
in the bulk; (2) etching reaction; (3) diffusion of the etching solution in the newly formed empty
space during the etching process, as PDMS is partially cleaved and diffuses out. It is interesting
to find out which action is the dominant step in determining the etching kinetics. The point (3)
could be eliminated first since the liquid diffusion in an empty space is definitely faster than in a
dense volume. So we will focus on a comparison between point 1 and point 2. If the reaction rate
is the control step then a linear relationship of [|
|Si O− − − ] vs. t (for zero reaction order) or
|1
|
1
[ Si O ]n−− − − vs. t (for n-th order reaction) would be expected. If the permeation is the control
step, then [|
|Si O− − − ] vs. t½ would occur as a consequent. As we know, the extension of the
diffusion zone scales as (Dt)½ with time. Hence the concentration gradient is approximately
proportional to 0[ ]TBAF /(Dt)½. Within certain time limits, the permeation represents a quasi-
steady process, that is, the amount of reacted TBAF per unit time is equal to that brought to the
solution/polymer interface by permeation.
Figures AB1 (a) and AB1 (b) show the amount of PDMS etched ( PDMSmΔ ) per unit surface
area (A) of the precursor film as function of the etching time. We found a linear dependence
happened to both skin samples and non-skin samples with different thickness. Each sample
reached a plateau where all the PDMS have been reacted. For a better vision, we put all the data
177

Appendices
166
from Figs. AB1 (a) and AB1 (b) in Fig. AB1 (c) and displayed in an expression of 0/PDMSm mΔ
vs. t/l where a transformation has been done as follows.
3
0
0
(AB3-2)
( ~ 1 / )/ ( )
( / ) (AB3-3)
PDMS
PDMSPDMS
PDMS
PDMS
m rate tA
m rate t g cmm lm rate t lm
ρρ
Δ = ⋅ Δ
Δ = ⋅ Δ⋅
Δ = ⋅ Δ
Figure AB 1 Etching degree as a function of time. (a) The etched amount of PDMS per unit surface area of double-skin sample vs. time; (b) The etched amount of PDMS per unit surface area of double-glass sample vs. time; (c) The data shown in Figs (a) and (b) were re-expressed by the etched amount of PDMS relative to the original mass m0 of the precursor as function of time normalized by sample thickness l. (d) Linear fittings of the data presented in the linear region of Fig.(c).
0 100 200 300 400 500 6000
2
4
6
8
10
Δm
PDM
S/A
(mg/
cm2 )
20±5 μm 80±10 μm 220±10 μm
t (min)
Double-skin
0 10 20 30 40 50 60
1
2
3
4
5 Double-glass
40±5 μm 70±5 μm 150±30 μm
Δm
PDM
S/A
(mg/
cm2 )
t (min)
0.0 0.5 1.0 1.5 2.0 2.5 3.0 3.5 4.00.0
0.1
0.2
0.3
0.4
0.5
Δm
PDM
S/m
0 (w
/w)
doubleglass_40±5 um doubleglass_70±5 um doubleglass_150±30um doubleskin_20±5 um doubleskin_80±10 um doubleskin_220±10um
t/l (min.um-1)
0.0 0.2 0.4 0.6 0.8 1.00.0
0.1
0.2
0.3
0.4
Δm
PDM
S/m
0 (w
/w)
double-glass y=0.06+0.69x double-skin y=0.02+0.35x
t/l (min.um-1)
Double-glass vs. double-skin
b a
c d
178
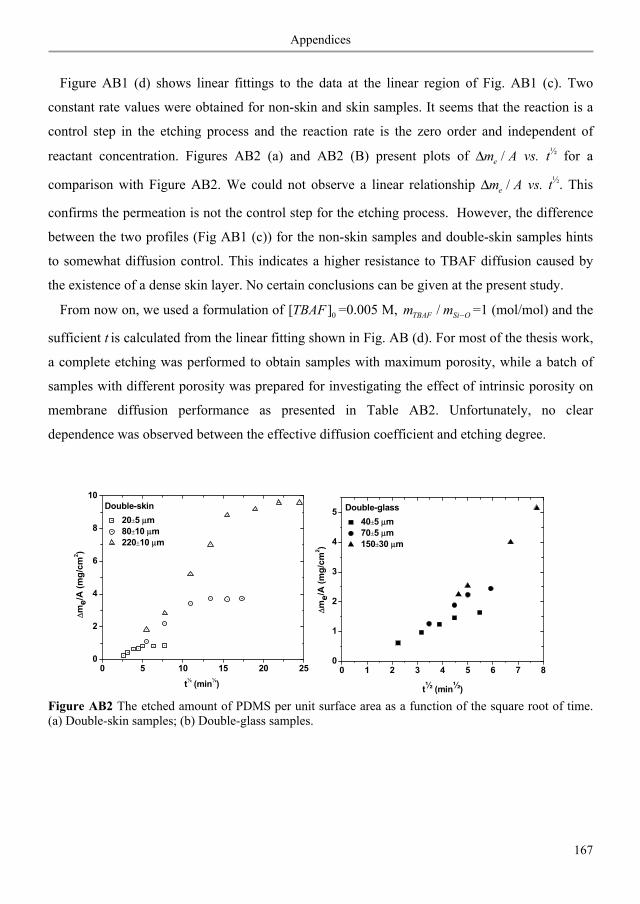
Appendices
167
Figure AB1 (d) shows linear fittings to the data at the linear region of Fig. AB1 (c). Two
constant rate values were obtained for non-skin and skin samples. It seems that the reaction is a
control step in the etching process and the reaction rate is the zero order and independent of
reactant concentration. Figures AB2 (a) and AB2 (B) present plots of /em AΔ vs. t½ for a
comparison with Figure AB2. We could not observe a linear relationship /em AΔ vs. t½. This
confirms the permeation is not the control step for the etching process. However, the difference
between the two profiles (Fig AB1 (c)) for the non-skin samples and double-skin samples hints
to somewhat diffusion control. This indicates a higher resistance to TBAF diffusion caused by
the existence of a dense skin layer. No certain conclusions can be given at the present study.
From now on, we used a formulation of 0[ ]TBAF =0.005 M, /TBAF Si Om m − =1 (mol/mol) and the
sufficient t is calculated from the linear fitting shown in Fig. AB (d). For most of the thesis work,
a complete etching was performed to obtain samples with maximum porosity, while a batch of
samples with different porosity was prepared for investigating the effect of intrinsic porosity on
membrane diffusion performance as presented in Table AB2. Unfortunately, no clear
dependence was observed between the effective diffusion coefficient and etching degree.
Figure AB2 The etched amount of PDMS per unit surface area as a function of the square root of time. (a) Double-skin samples; (b) Double-glass samples.
0 5 10 15 20 250
2
4
6
8
10
t½ (min½)
Δm
e/A
(mg/
cm2 )
20±5 μm 80±10 μm 220±10 μm
Double-skin
0 1 2 3 4 5 6 7 80
1
2
3
4
5 Double-glass 40±5 μm 70±5 μm 150±30 μm
Δm
e/A
(mg/
cm2 )
t½ (min½)
179
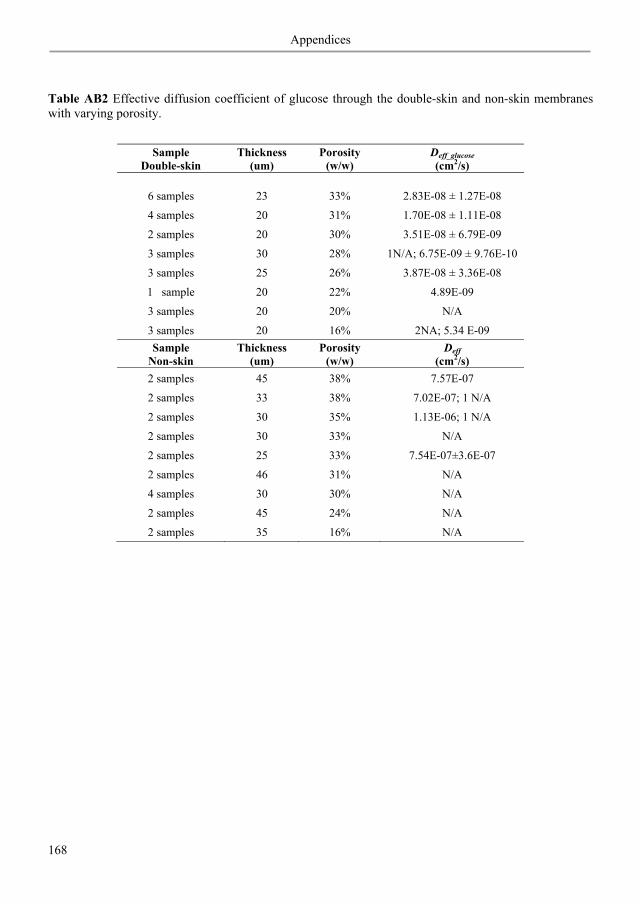
Appendices
168
Table AB2 Effective diffusion coefficient of glucose through the double-skin and non-skin membranes with varying porosity.
Sample Double-skin
Thickness (um)
Porosity (w/w)
Deff_glucose (cm2/s)
6 samples 23 33% 2.83E-08 ± 1.27E-08
4 samples 20 31% 1.70E-08 ± 1.11E-08
2 samples 20 30% 3.51E-08 ± 6.79E-09
3 samples 30 28% 1N/A; 6.75E-09 ± 9.76E-10
3 samples 25 26% 3.87E-08 ± 3.36E-08
1 sample 20 22% 4.89E-09
3 samples 20 20% N/A
3 samples 20 16% 2NA; 5.34 E-09 Sample
Non-skin Thickness
(um) Porosity
(w/w) Deff
(cm2/s) 2 samples 45 38% 7.57E-07
2 samples 33 38% 7.02E-07; 1 N/A
2 samples 30 35% 1.13E-06; 1 N/A
2 samples 30 33% N/A
2 samples 25 33% 7.54E-07±3.6E-07
2 samples 46 31% N/A
4 samples 30 30% N/A
2 samples 45 24% N/A
2 samples 35 16% N/A
180
Appendices
169
Appendix C DSC Results
Water states in nanoporous membranes were checked by DSC measurements. Both hydrophilic
membrane (HM) and hydrophobic membrane (M) were measured. We first give a short review
on experimental conditions and procedures.
Differential Scanning Calorimetry (DSC) measurements were carried out using a TA
instrument DSC 1000 equipped with a cooling unit. A sample was cut into small (2 mm in
diameter) pieces. The original hydrophobic membrane was prewetted with ethanol and replaced
with water; the hydrophilic membrane was only prewetted with water. Thereafter the pieces were
placed in an aluminum pan and extra water was added to the pan. The pan was sealed and the
excess water on the outside of the pan was wiped with a tissue. The experiment started by
heating from -73 ºC to 25 ºC at a rate of 2.5 ºC /min and a number of heating-cooling cycles
were conducted. Nitrogen gas was used as the carrier gas with a flow rate of 50 ml/min.
Procedures
1. Weigh an empty aluminum pan and lid; the aluminum pans and lids were pretreated with
boiling water for 1 h to eliminate the reaction of water with aluminum surface during DSC.
2. Cut a membrane (pre-vacuumed) into tiny pieces (3 mm in diameter); measure the dry mass of
samples to be tested;
3. For HM samples, add droplets of water (the amount of water should be larger the water
content of the samples being tested) into the pan; wait for a few seconds until water sorbs into
the samples. Add more water before sealing. For M samples, add droplets of ethanol to prewet
the samples for 5 min and replace with water before sealing.
4. Seal the pan, use a tissue to dry the excess of water outside of the pan and measure the total
mass (pan+lid+sample+water).
5. After DSC, measure the total mass again.
6. Prick a few holes on the lid and dry the samples in the vacuum oven at room temperature
overnight. Weigh the total mass (pan+lid+sample) after drying.
181
Appendices
170
The DSC data were summarized in the Figure AC1 for a comparison. Figure AC1 (a) shows
the DSC data of the blank sample, i.e. M+W without pre-wetting. No water infiltration to the
hydrophobic sample; bulk water outside the membrane shows phase transition temperature at
around 0 ºC. In Figure AC1 (b) solid line shows the hydrophobic membrane with ethanol
prewetting and there after replacing with water before DSC measurement as described above.
In the case, we expect that water infiltration to M. Besides the free water in M showing the
same phase transition temperature as bulk water (0 ºC), we can also observe an additional peak
around -12 ºC. This can possibly arise from the mixture of water with the remaining ethanol
inside the pore. At the start, the infiltration of water into the ethanol prefilled nanopores is based
on concentration potential. At equilibrium, most of ethanol will be washed out; however, some
ethanol molecules would remain on pore wall to reduce the surface tension of the polymer thus
keeping water inside. A precise ratio of ethanol and water inside the pores is difficult to estimate.
However, it might be also argued that this is due to weak interaction between ethanol or water
molecules and pore wall. It is also possibly due to capillary force that induced a phase transition
shift. In order to get a qualitative indication, we run DSC for a 1:5 (v/v) mixture of ethanol and
water. A phase transition occurred at around - 9 ºC for such liquid mixture. We further checked a
phase diagram for solid-liquid equilibrium of the mixture of ethanol and water as shown in
Figure AC23. Our experimental observation is well consistent with the literature value in Fig.
AC2. In addition, we also found a phase transition around -12 ºC roughly corresponds to a 9:25
(v/v) ethanol/water mixture.
182

Appendices
171
Figure AC1. DSC data of (a) a hydrophobic membrane in water without prewetting; (b) a hydrophobic membrane in water with ethanol prewetting and water replacement (solid line) and a hydrophilic membrane in water (dash line); (c) a 1:5 (v/v) mixture of ethanol and water.
a
b
c
183
Appendices
172
Figure AC2 A phase diagram for solid-liquid equilibrium of the mixture of ethanol and water.
184

Appendices
173
Appendix D Diffusion of PEGs across Nanoporous 1,2-PB Membranes
Diffusion tests of single PEG solutions (1g/L) with different PEG molecular weight (1 kg/mol,
4 kg/mol and 8 kg/mol) were conducted for the original hydrophobic membranes (M) and the
sulfonated hydrophilic membranes (HM) with 25 μm in thickness. The hydrophobic membranes
were prewet with ethanol for half an hour before any measurements. Figure AD1 (a) shows the
PEG concentration on the permeate side as function of time. For the hydrophobic membrane,
PEG 1K permeation is much faster than PEG 4K and PEG 8K. The effective diffusion
coefficient Deff of PEG 1K was calculated from eq. 6-16 (chapter 6) and the lag equation 6-17
(chapter 6) was used to calculate Deff for PEG 4K and PEG 8K. Therefore we obtained Deff_1k =
8.48 e-08 cm2/s; Deff_4k = 1.28e-08 cm2/s; Deff_8k = 1.21e-10 cm2/s. For the hydrophilic
membranes, within the measurement time, only the permeation of PEG 1K could be detected;
little or no permeation for PEG 4K and PEG 8K. This can be explained by the fact that the
reduced effective pore size of HM gave rise to higher size exclusion. A high selectivity was thus
shifted to lower molecular weight range, between PEG 1K and PEG 4K. This observation well
supports the rejection profile obtained in PEG ultrafiltration of HM+W as shown in Figure 7.9
(chapter 7). For PEG 1K, both M and HM show very similar permeation rate.
As shown in Figure AD1 (b), the hindrance diffusivity calculated from experimental data
based on eq. 6-15 (chapter 6) was compared with the theoretic prediction by Bungay & Brenner
Model with the consideration of size effect alone for rigid globular molecules. PEG molecules
exhibits the experimental values lower than the theoretic values (Fig AD (b)). There are two
possible reasons: (1) the adsorption of PEG molecules onto the pore wall as confirmed in Figure
xx (chapter 7); (2) The flexible linear molecules have random variations in molecular shape in
free water without boundary. The limited configurations in a small pore are entropicly
unfavorable for PEG molecules. If without additional energy applied, e.g. pressure-driven flow,
185
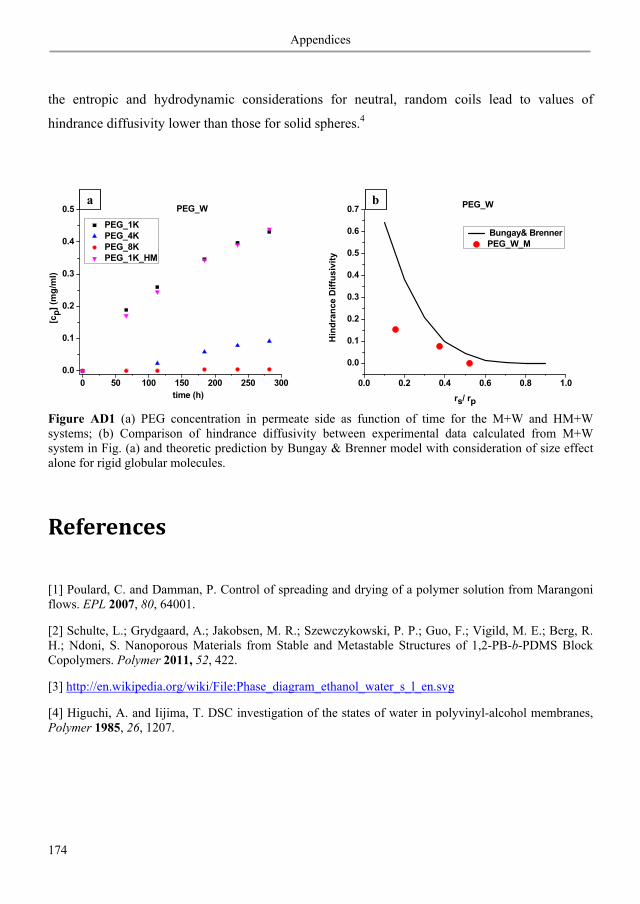
Appendices
174
the entropic and hydrodynamic considerations for neutral, random coils lead to values of
hindrance diffusivity lower than those for solid spheres.4
Figure AD1 (a) PEG concentration in permeate side as function of time for the M+W and HM+W systems; (b) Comparison of hindrance diffusivity between experimental data calculated from M+W system in Fig. (a) and theoretic prediction by Bungay & Brenner model with consideration of size effect alone for rigid globular molecules.
References
[1] Poulard, C. and Damman, P. Control of spreading and drying of a polymer solution from Marangoni flows. EPL 2007, 80, 64001.
[2] Schulte, L.; Grydgaard, A.; Jakobsen, M. R.; Szewczykowski, P. P.; Guo, F.; Vigild, M. E.; Berg, R. H.; Ndoni, S. Nanoporous Materials from Stable and Metastable Structures of 1,2-PB-b-PDMS Block Copolymers. Polymer 2011, 52, 422.
[3] http://en.wikipedia.org/wiki/File:Phase_diagram_ethanol_water_s_l_en.svg
[4] Higuchi, A. and Iijima, T. DSC investigation of the states of water in polyvinyl-alcohol membranes, Polymer 1985, 26, 1207.
0 50 100 150 200 250 3000.0
0.1
0.2
0.3
0.4
0.5
PEG_1K PEG_4K PEG_8K PEG_1K_HM
[cp]
(mg/
ml)
time (h)
PEG_W
0.0 0.2 0.4 0.6 0.8 1.0
0.0
0.1
0.2
0.3
0.4
0.5
0.6
0.7
Hin
dran
ce D
iffus
ivity
rs/ rp
Bungay& Brenner PEG_W_M
PEG_Wa b
186
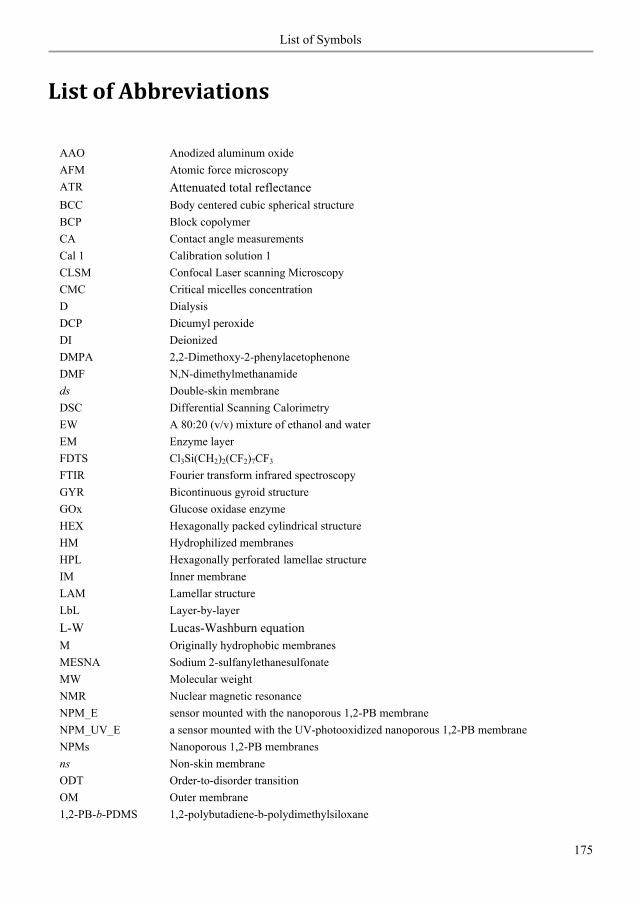
List of Symbols
175
List of Abbreviations
AAO Anodized aluminum oxide AFM Atomic force microscopy ATR Attenuated total reflectance BCC Body centered cubic spherical structure BCP Block copolymer CA Contact angle measurements Cal 1 Calibration solution 1 CLSM CMC
Confocal Laser scanning Microscopy Critical micelles concentration
D Dialysis DCP Dicumyl peroxide DI Deionized DMPA 2,2-Dimethoxy-2-phenylacetophenone DMF N,N-dimethylmethanamide ds Double-skin membrane DSC Differential Scanning Calorimetry EW A 80:20 (v/v) mixture of ethanol and water EM Enzyme layer FDTS Cl3Si(CH2)2(CF2)7CF3 FTIR Fourier transform infrared spectroscopy GYR Bicontinuous gyroid structure GOx Glucose oxidase enzyme HEX Hexagonally packed cylindrical structure HM Hydrophilized membranes HPL Hexagonally perforated lamellae structure IM Inner membrane LAM Lamellar structure LbL Layer-by-layer L-W Lucas-Washburn equation M Originally hydrophobic membranes MESNA Sodium 2-sulfanylethanesulfonate MW NMR
Molecular weight Nuclear magnetic resonance
NPM_E sensor mounted with the nanoporous 1,2-PB membrane NPM_UV_E a sensor mounted with the UV-photooxidized nanoporous 1,2-PB membrane NPMs Nanoporous 1,2-PB membranes ns Non-skin membrane ODT Order-to-disorder transition OM Outer membrane 1,2-PB-b-PDMS 1,2-polybutadiene-b-polydimethylsiloxane
187

List of Symbols
176
PCEMA Poly(2-cinnamoylethyl methacrylate) PB Polybutadiene PDI Polydispersity index PDMS Polydimethylsiloxane PEG Polyethylene glycol PET Polyethylene terephthalate PI Polyisoprene PMMA poly(methyl methacrylate) PPQ Poly (phenylquinoxaline) PPS Poly(4-vinylphenyl-dimethyl-2-propoxysilane) PS Polystyrene PtBA Poly(tert-butyl acrylate) PVC Polyvinyl chloride QC Quality control solutions Ref_E Reference sensor SAXS Small angle X-ray scattering SDS Sodium dodecyl sulfate SEM Scanning electron microscopy SEC Size exclusion chromatography ss Single-skin membrane Std_E Commercial glucose sensor TBAF Tetrabutylamonium fluoride TEM Transmission electron microscopy THF Tetrahydrofuran UF Ultrafiltration upd Updating W Water TM Transmission mode XPS X-ray photoelectron spectroscopy
188
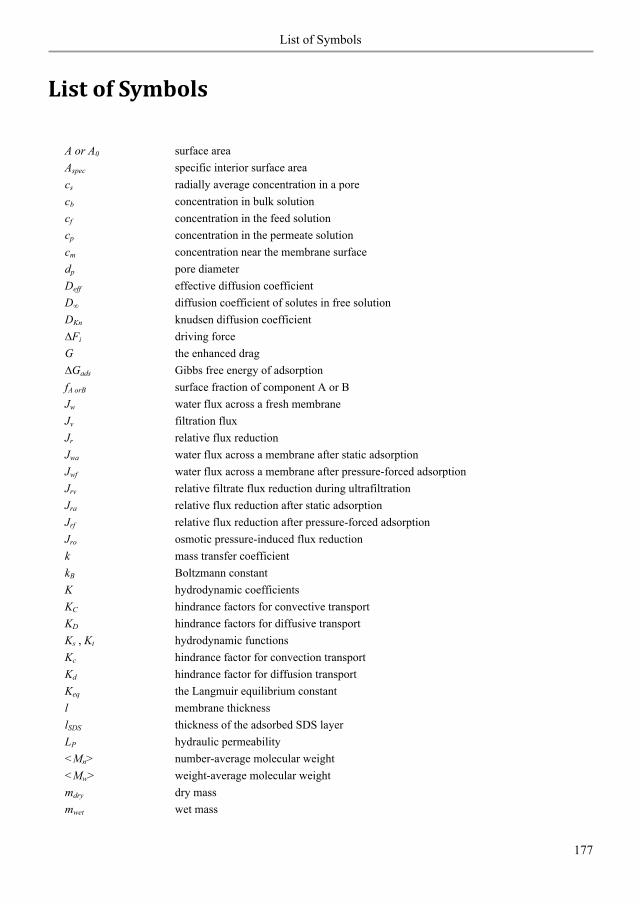
List of Symbols
177
List of Symbols
A or A0 surface area Aspec specific interior surface area cs radially average concentration in a pore cb concentration in bulk solution cf concentration in the feed solution cp concentration in the permeate solution cm concentration near the membrane surface dp pore diameter Deff effective diffusion coefficient D diffusion coefficient of solutes in free solution DKn knudsen diffusion coefficient
Fi driving force G the enhanced drag
Gads Gibbs free energy of adsorption fA orB surface fraction of component A or B Jw water flux across a fresh membrane Jv filtration flux Jr relative flux reduction Jwa water flux across a membrane after static adsorption Jwf water flux across a membrane after pressure-forced adsorption Jrv relative filtrate flux reduction during ultrafiltration Jra relative flux reduction after static adsorption Jrf relative flux reduction after pressure-forced adsorption Jro osmotic pressure-induced flux reduction k mass transfer coefficient kB Boltzmann constant K hydrodynamic coefficients KC hindrance factors for convective transport KD hindrance factors for diffusive transport Ks , Kt hydrodynamic functions Kc hindrance factor for convection transport Kd hindrance factor for diffusion transport Keq the Langmuir equilibrium constant l membrane thickness lSDS thickness of the adsorbed SDS layer LP hydraulic permeability <Mn> number-average molecular weight <Mw> weight-average molecular weight mdry dry mass mwet wet mass
189
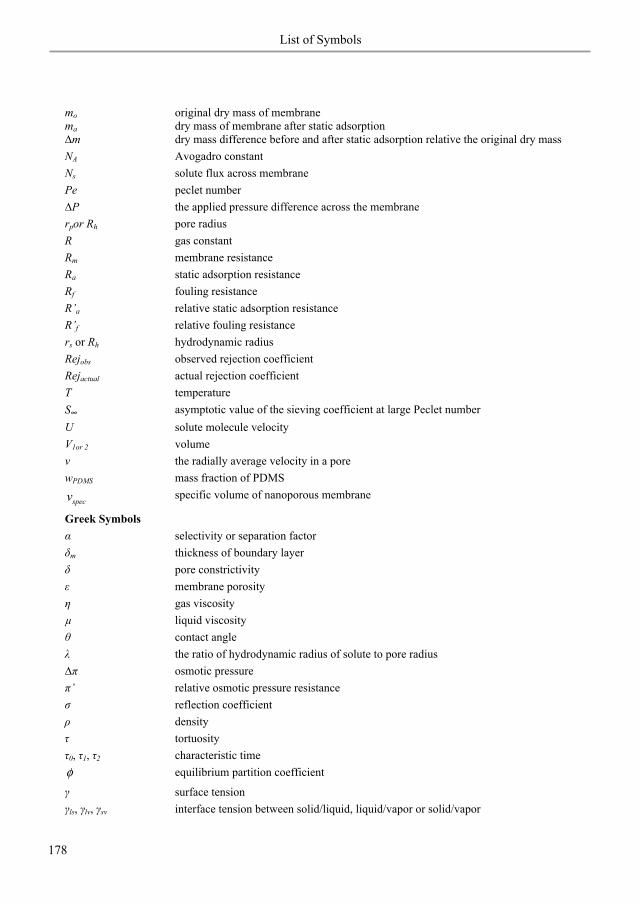
List of Symbols
178
mo original dry mass of membrane ma dry mass of membrane after static adsorption
m dry mass difference before and after static adsorption relative the original dry mass NA Avogadro constant Ns solute flux across membrane Pe peclet number
P the applied pressure difference across the membrane rpor Rh pore radius R gas constant Rm membrane resistance Ra static adsorption resistance Rf fouling resistance R’a relative static adsorption resistance R’f relative fouling resistance rs or Rh hydrodynamic radius Rejobs observed rejection coefficient Rejactual actual rejection coefficient T temperature S asymptotic value of the sieving coefficient at large Peclet number U solute molecule velocity V1or 2 volume v the radially average velocity in a pore wPDMS mass fraction of PDMS
specv specific volume of nanoporous membrane
Greek Symbols selectivity or separation factor m thickness of boundary layer pore constrictivity membrane porosity gas viscosity μ liquid viscosity contact angle the ratio of hydrodynamic radius of solute to pore radius
osmotic pressure ’ relative osmotic pressure resistance reflection coefficient density tortuosity 0, 1, 2 characteristic time
φ equilibrium partition coefficient
surface tension ls, lv, sv interface tension between solid/liquid, liquid/vapor or solid/vapor
190

List of Symbols
179
surface adsorption capacity
191

180
192

The Danish Polymer Centre
Department of Chemical and Biochemical Engineering
Technical University of Denmark
Søltofts Plads
DK-2800 Kgs. Lyngby
Denmark
Phone: +45 4525 2800
Web: www.dpc.kt.dtu.dk
ISBN : 978-87-92481-61-0