Embed Size (px)
Citation preview
Clays and Clay Minerals, Vol. 46, No. 2, 153-160, 1998.
N A N O M O R P H O L O G Y OF KAOLINITES: COMPARATIVE SEM A N D AFM STUDIES
MAREK ZBIK AND ROGER ST.C. SMART
Ian Wark Research Institute, University of South Australia, The Levels, 5095, South Australia
Abstraet--Nanomorphological structure of well-crystallized Georgia and poorly crystallized North Queensland kaolinite particles have been compared using field emission scanning electron microscopy (SEM) and atomic force microscopy (AFM). In general, there is good agreement in information from the 2 very different imaging techniques. AFM gives more detailed information on step and ledge dimensions, microvalleys and crystallographic orientation of irregularities on basal planes and edges of the crystallites. There are major differences in nanomorphology and surface structure between the 2 kaolin samples with the Georgia kaolin showing 200-500-nm, relatively flat basal planes with some cascade-like step growth 50-100 nm wide. The edges, apparently fiat and right-angled in SEM images, appear beveled in AFM images due to artifacts from the aspect ratio of the AFM tip. The North Queensland kaolinite has much more complex surface structure with anhedrai crystallites attached to larger particles, high density of steps and nm-scale irregularities (often crystallographically directed). The additional step edge site contribution from the attached crystallites is estimated as a minimum of 6%, giving a total edge contribution above 30% of the kaolinite total surface area. These structures will generate a substantial pH-dependent charge across the surfaces of the North Queensland kaolinite platelets. An idealized, uniform, pH-independent, negatively charged basal plane cannot be assumed from these structures. There is also some evidence, from both SEM and AFM images, of curvature in the thinner, poorly ordered structures of the North Queensland kaolinite particles.
Key Words--Atomic Force Microscopy, Kaolinite, Morphology, Scanning Electron Microscopy.
I N T R O D U C T I O N
Industrially, kaolins have found major applications in the paper, ceramic, paint, plastic, rubber and crack- ing catalyst industries. The morphology of kaolin has particular importance in paper filling and paper coat ing (Jepson 1984; Bundy and Ishley 1991). In addition to particle size and particle size distribution, particle shape, aspect ratio and aggregate structure have a dominant influence on the theological character o f ka- olin slurries as well as properties like opacity, gloss, printability and, to a lesser extent, brightness. There is ve ry wide variabili ty in kaolin deposits and their mea- sured properties are strongly dependent on weathering processes and degree o f crystallinity. Particle sizes can vary f rom tens of nm to several ~ m with aspect ratios f rom 2 0 - 3 0 (for flat platelets) to close to 1 (for mul- t i layered stacks). The crystall inity index, measured f rom X-ray diffraction (XRD) patterns, is also highly variable be tween well-crystal l ized kaolins (such as Georgia) with values above 0.9 (Hinckley 1962) to ve ry fine, poor ly crystal l ine kaolins (such as North Queensland) with a Hinckley index 0.33 (our est ima- tion).
The ideal ized structure of the kaolinite mineral is that o f a single sheet of hydroxyls octahedrally coor- dinated to a luminium cations l inked to a single sheet of oxygen tetrahedra centred by si l icon atoms. The combined layer has a unit cell thickness o f 0.713 nm (Grim 1968). It is be l ieved that the (001) basal sur- faces o f kaolinite are fiat with the silica basal plane
Copyright �9 1998, The Clay Minerals Society
carrying a constant, pH-independent negat ive charge al ternatively attributed to either i somorphous replace- ment of Si 4+ by AP § (Bolland et al. 1980) or posit ion- ing of the e lectro-negat ive oxygen atoms above the surface (Gerson 1997). Edge sites on the platelets have pH-dependent charge. A heteropolar mode l o f kaolin- ite has determined acidity constants o f pKa~ = 5.0 and
pKa2 = 6.0 for A1OH and S iOH (respectively) edge groups on the kaolinite particles (Braggs et al. 1994).
The cation exchange capacity (CEC) clearly de- pends strongly on the surface charge densities on ka- olinite at different pH as rev iewed recently by Zhou and Gunter (1992), which, in turn, depend strongly on the proport ion of edge (including steps and defects) sites. The surface area o f the edges of a Cornwal l ka- olinite, measured by Ferris and Jepson (1975), was found to comprise 12% of the total surface area o f that kaolinite which corresponded to an aspect ratio o f about 14. Other work, such as Brady et al. (1996) and Zhou and Maur ice (1995), reported f rom their S E M and A F M studies much larger edge contribution of 2 7 - 34% to the kaolinite surface area. These results sup- port our data f rom A F M measurements of the Georg ia KGa-1 and North Queensland kaolinites giving an edge area contribution of 26% for both samples (Zbik and Smart 1997). This suggests that the contribution o f the edge areas assumed in previous studies (Wie- land and S tumm 1992; Zhou and Gunter 1992) may also have been underestimated. This content ion is sup-
153
154 Zbik and Smart Clays and Clay Minerals
ported by Brady at al. 1996 where the aspect ratio of Georgia KGa-1 kaolinite ranges f rom 2 to 10.
The morphology of kaolinite platelets has been studied extensively by electron microscopy since the introduction of these techniques in transmission and scanning modes. Electron micrographs of wel l-crys- tallized kaolinites general ly show hexagonal and pseu- do-hexagonal crystalli tes, often with an elongation parallel to either (010) or (110) planes (Grim 1968). The edges are general ly at right angles but some ex- amples o f bevel led edges are observed. Poorly crys- talline kaolin occurs in smaller and thinner particles than the wel l -crystal l ized mineral (Grim 1968). Dis- ordered kaolinites show crystall i tes with poorly de- ve loped outlines in which it is difficult to assign an hexagonal structure. The edges of the flakes are usu- ally j agged and irregular. Scanning electron micros- copy, using vapor-deposi ted gold to decorate the basal faces, has revealed a mult ipl ici ty of microsteps on ka- olinite platelets (Thompson et al. 1981). A focus of this study was also a direct search for possible micro- or nanomorphologica l differences according to diver- sity in mineral origin and crystallinity. The presence of similar, single-unit cell microsteps has been report- ed on hydrothermal illite by B lum (1994).
In the context of the work described here, it is also important to note that some poorly crystal l ine kaolin- ites, while giving X R D patterns indicating only the presence o f kaolinite, have revealed curved and tu- bular particles as well as hexagonal flake-shaped units (Visconti and Nicot 1959; De Souza Santos et al. 1964). It appears that these particles do not have the halloysite structure and are sufficiently well organized to be classed structurally as kaolinite (De Souza San- tos et al. 1965). Hyde (1993) has investigated alumi- nosil icate layer warping based on modulated kaolinite and imogol i te structures. Where the average ring size of the tetrahedral and octahedral layers exceeds 6, curved hyperbol ic kaolinites can result.
Until the advent of the high-resolut ion field emis- sion scanning electron microscopes, most SEM papers describing kaolinite morphology had relatively poor resolution (practically 100-500 nm) and used electro- conduct ive coatings (10 -30 nm thick). Together with the 2-dimensional nature of the technique, this l imited the information largely to that describing shape and aggregate structure (Gard 1971; Smart and Tovey 1981; Grabowska-Olsezewska et al. 1984). The avail- ability of A F M has now provided a second imaging technique for studies of surface morphology with atomic resolution on ideal surfaces (Hochel la 1995; Smart 1998).
The aims of the work described in this contribution were twofold, namely, to compare directly the infor- mat ion on surface morphology of kaolinites der ived f rom these 2 different techniques using very different bases of observat ion (secondary electron imaging and
force-distance deflection), and to compare the data f rom a well-crystal l ized Georgia and poorly crystal- l ized North Queensland kaolinite. The object ive with both techniques was to achieve nm resolution. The SEM is capable of ---2 nm resolution at high voltage and for the AFM, with more c o m m o n types of sam- pies, a reasonable est imate for the accuracy of clay particle thickness measurements is • nm (Bhim 1994). This comparison has provided some insight into the differences in morphology, surface structure and, hence, reactivi ty be tween the 2 kaolinite forms. We can compare the real surface structures of the 2 kao- linites with the idealized platelet structure and make some estimates of the proportions of basal and edge sites.
E X P E R I M E N T A L
The Georgia kaol in i te-hydr i te PX used in the study was obtained f rom the Clay Minerals Society: a ka- olinite (Kga-1) (Van Olphen and Fripiat 1979). It is a well-ordered, water-processed kaolinite quoted at 97% purity. Ninety percent by weight o f the particles have an equivalent spherical diameter less than 2 txm with a median particle size of 0.7 p~m and a specific surface area of 15.3 • 0.5 m2g ~ (BET nitrogen adsorption). The North Queensland kaolinite was supplied by Com- alco Research Centre (Thomastown, Victoria, Austra- lia).
The SEM studies were carried out using a CamScan FE microscope with a field emission gun operating normally at 20 kV acceleration voltage. The kaolinite particles were coated by gold/pal ladium films to a thickness of 2 -3 nm using a Denton Magnetron Sput- ter Coater system. A Nanoscope II A F M (Digital In- struments Inc.) was used with scan heads A (1 • 1 p,m) and E (14 X 14 txm) and scan rate be tween 5 and 15 Hz, in height and deflection modes. The A F M was calibrated on a gold grid with 5 ~ m pits separated by 5 p~m. The standard pyramidal silicon nitride tip with a solid angle of 70 ~ and a radius of curvature at the end of the tip of --50 nm was mounted on a canti lver of nominal spring constant 0 .06-0.58 N m 1.
For the A F M studies, kaolinite particles were im- mobil ized on an atomically fiat mica surface (freshly cleaved) from a dilute suspension in water. Three drops of ammonia solution were added to disperse the kaolin- ite, the sample was sonicated and al lowed to sediment in a glass cylinder for 24 h. A small amount of suspen- sion from the glass cylinder, (1 or 2 droplets) was placed on the freshly cleaved mica square. The particles were dried by heating to 400 ~ for a few minutes. Particles with weak contact to the mica surface were removed in a stream of dry nitrogen gas. SEM exami- nation showed that the remaining kaolin particles were firmly attached to the mica surface in face or basal plane contact and were suitable for the A F M study. The standard deviation of the A F M measurements is ap-
Vol. 46, No. 2, 1998 Nanomorphology of kaolinites 155
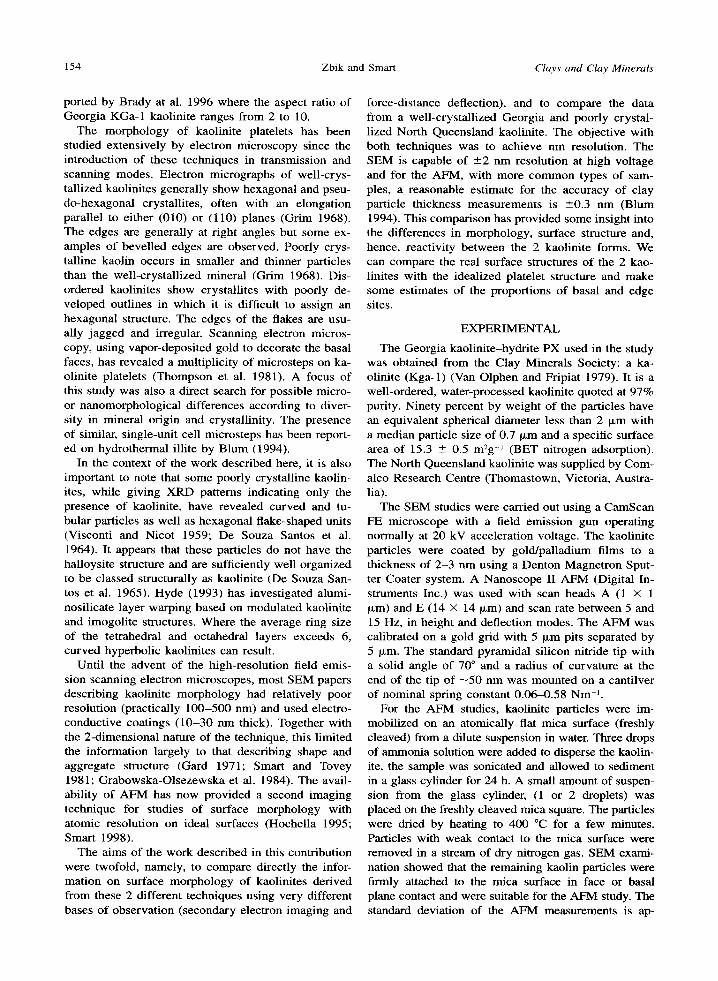
Figure 1. A and B) SEM micrographs of the Georgia ka- olinite showing well-developed euhedral crystals with smooth basal planes and right angles between basal planes (001) and edge planes (110) and (110).
proximately --+0.15 nm due, at least in part, to the un- even nature of the kaolinite particle surfaces and the relatively low aspect ratio of the A F M tip.
R E S U L T S A N D D I S C U S S I O N
SEM micrographs o f the Georgia well-crystal l ized kaolinite (Figure 1) show wel l -developed euhedral, hexagonal to pseudo-hexagonal shaped plates slightly e longated in 1 direct ion as previously reported (Grim 1968). The crystal in Figure 1A measures 300 nm in shorter d imension and 600 nm in longer dimension, has smooth surfaces (to 10 nm resolution in vertical dimensions) and distinct, r ight-angled edges. These edges are clearly defined (Figure 1B) and are thick compared to lateral dimensions, resulting in aspect ra- tios for this and similar crystall i tes with relat ively low values (that is, 4 - 8 ) (Conley 1966; Zbik and Smart 1997). Smal ler crystall i tes (80-150 nm) are observed on larger crystal surfaces but these appear to be simply deposi ted rather than attached or intergrown in this sample. Steps are observed (Figure 1A, top right cor-
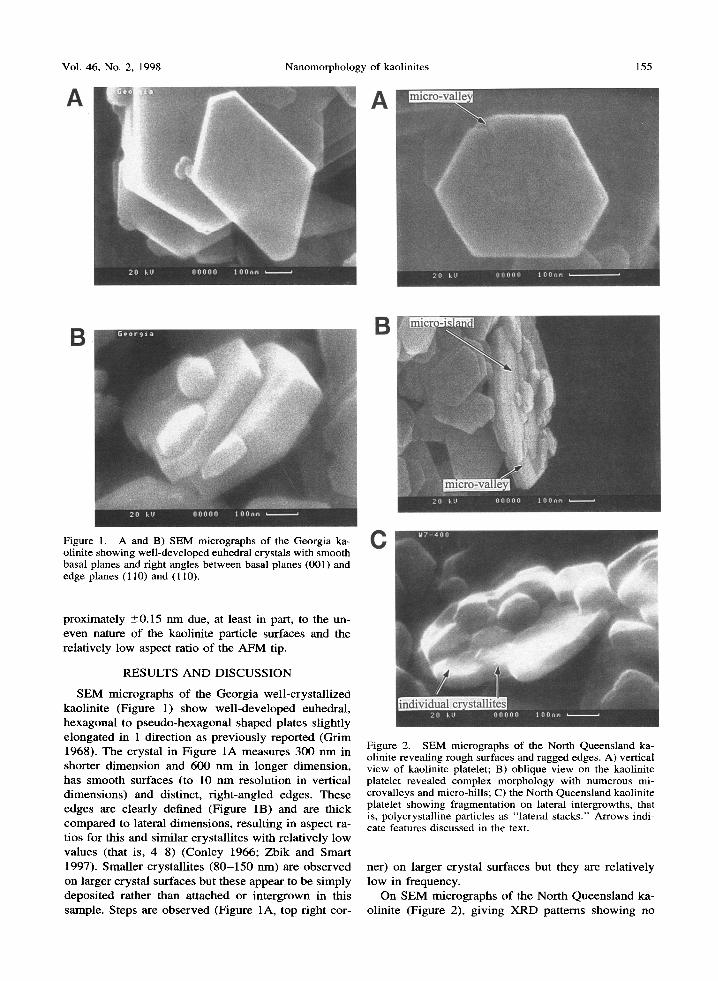
Figure 2. SEM micrographs of the North Queensland ka- olinite revealing rough surfaces and ragged edges. A) vertical view of kaolinite platelet; B) oblique view on the kaolinite platelet revealed complex morphology with numerous mi- crovalleys and micro-hills; C) the North Queensland kaolinite platelet showing fragmentation on lateral intergrowths, that is, polycrystalline particles as "lateral stacks." Arrows indi- cate features discussed in the text.
ner) on larger crystal surfaces but they are relat ively low in frequency.
On S E M micrographs of the North Queensland ka- olinite (Figure 2), g iving X R D patterns showing no
156 Zbik and Smart Clays and Clay Minerals
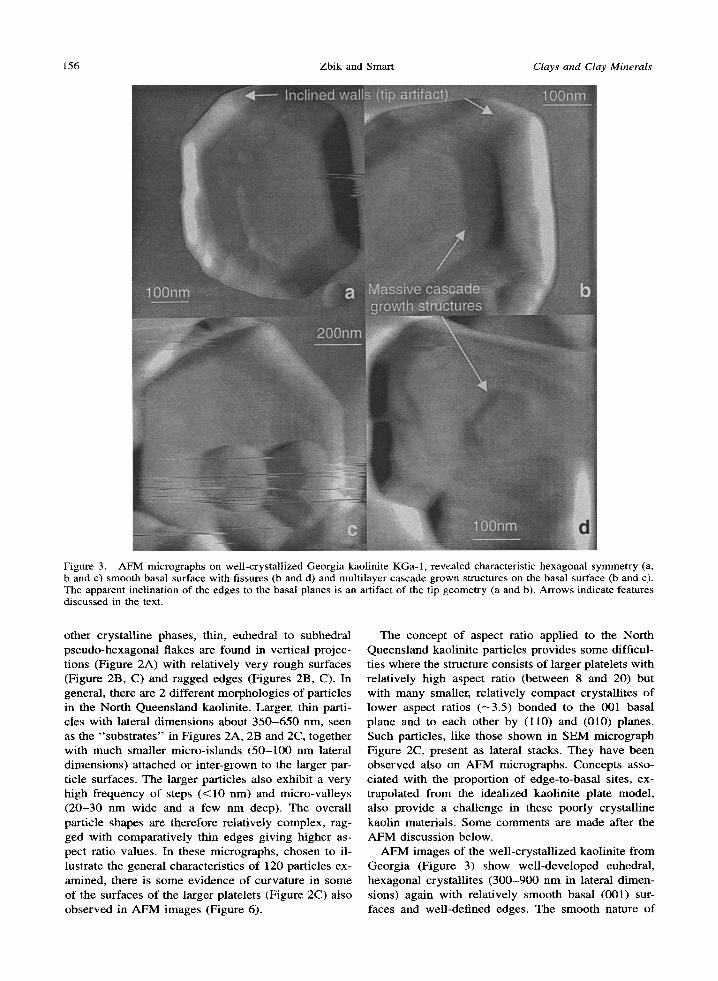
Figure 3. AFM micrographs on well-crystallized Georgia kaolinite KGa-1, revealed characteristic hexagonal symmetry (a, b and c) smooth basal surface with fissures (b and d) and multilayer cascade grown structures on the basal surface (b and c). The apparent inclination of the edges to the basal planes is an artifact of the tip geometry (a and b). Arrows indicate features discussed in the text.
other crystalline phases, thin, euhedral to subhedral pseudo-hexagonal flakes are found in vertical projec- tions (Figure 2A) with relatively very rough surfaces (Figure 2B, C) and ragged edges (Figures 2B, C). In general, there are 2 different morphologies of particles in the North Queensland kaolinite. Larger, thin parti- cles with lateral dimensions about 350-650 nm, seen as the "substrates" in Figures 2A, 2B and 2C, together with much smaller micro-islands (50-100 nm lateral dimensions) attached or inter-grown to the larger par- ticle surfaces. The larger particles also exhibit a very high frequency of steps (<10 nm) and micro-valleys (20-30 nm wide and a few nm deep). The overall particle shapes are therefore relatively complex, rag- ged with comparatively thin edges giving higher as- pect ratio values. In these micrographs, chosen to il- lustrate the general characteristics of 120 particles ex- amined, there is some evidence of curvature in some of the surfaces of the larger platelets (Figure 2C) also observed in AFM images (Figure 6).
The concept of aspect ratio applied to the North Queensland kaolinite particles provides some difficul- ties where the structure consists of larger platelets with relatively high aspect ratio (between 8 and 20) but with many smaller, relatively compact crystallites of lower aspect ratios (--3.5) bonded to the 001 basal plane and to each other by (110) and (010) planes. Such particles, like those shown in SEM micrograph Figure 2C, present as lateral stacks. They have been observed also on AFM micrographs. Concepts asso- ciated with the proportion of edge-to-basal sites, ex- trapolated from the idealized kaolinite plate model, also provide a challenge in these poorly crystalline kaolin materials. Some comments are made after the AFM discussion below.
AFM images of the well-crystallized kaolinite from Georgia (Figure 3) show well-developed euhedral, hexagonal crystallites (300-900 nm in lateral dimen- sions) again with relatively smooth basal (001) sur- faces and well-defined edges. The smooth nature of
Vol. 46, No. 2, 1998 Nanomorphology of kaolinites 157
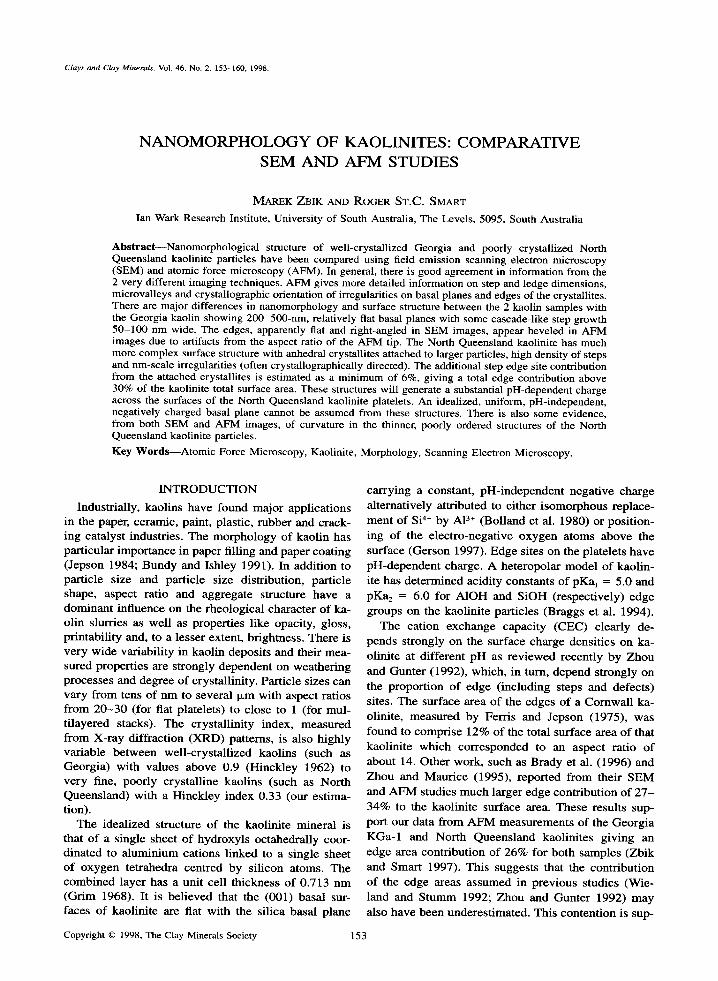
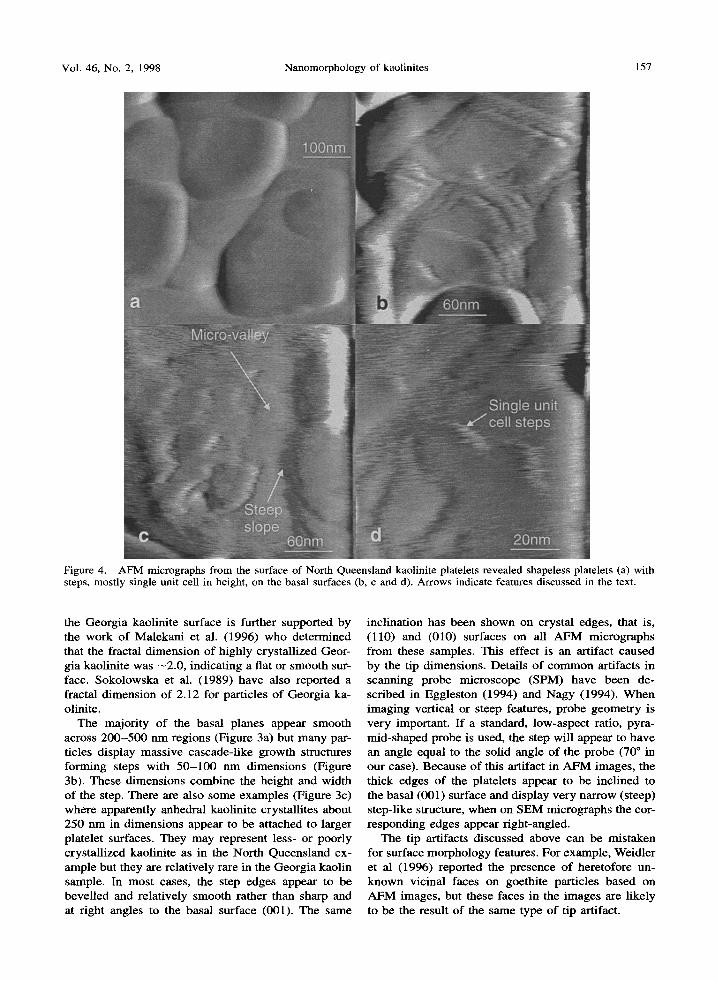
Figure 4. AFM micrographs from the surface of North Queensland kaolinite platelets revealed shapeless platelets (a) with steps, mostly single unit cell in height, on the basal surfaces (b, c and d). Arrows indicate features discussed in the text.
the Georgia kaolinite surface is further supported by the work of Malekani et al. (1996) who determined that the fractal dimension of highly crystallized Geor- gia kaolinite was --2.0, indicating a flat or smooth sur- face. Sokolowska et al. (1989) have also reported a fractal dimension of 2.12 for particles of Georgia ka- olinite.
The majority of the basal planes appear smooth across 200-500 nm regions (Figure 3a) but many par- ticles display massive cascade-like growth structures forming steps with 50-100 nm dimensions (Figure 3b). These dimensions combine the height and width of the step. There are also some examples (Figure 3c) where apparently anhedral kaolinite crystallites about 250 nm in dimensions appear to be attached to larger platelet surfaces. They may represent less- or poorly crystallized kaolinite as in the North Queensland ex- ample but they are relatively rare in the Georgia kaolin sample. In most cases, the step edges appear to be bevelled and relatively smooth rather than sharp and at right angles to the basal surface (001). The same
inclination has been shown on crystal edges, that is, (110) and (010) surfaces on all AFM micrographs from these samples. This effect is an artifact caused by the tip dimensions. Details of common artifacts in scanning probe microscope (SPM) have been de- scribed in Eggleston (1994) and Nagy (1994). When imaging vertical or steep features, probe geometry is very important. If a standard, low-aspect ratio, pyra- mid-shaped probe is used, the step will appear to have an angle equal to the solid angle of the probe (70 ~ in our case). Because of this artifact in AFM images, the thick edges of the platelets appear to be inclined to the basal (001) surface and display very narrow (steep) step-like structure, when on SEM micrographs the cor- responding edges appear right-angled.
The tip artifacts discussed above can be mistaken for surface morphology features. For example, Weidler et al (1996) reported the presence of heretofore un- known vicinal faces on goethite particles based on AFM images, but these faces in the images are likely to be the result of the same type of tip artifact.
158 Zbik and Smart Clays and Clay Minerals
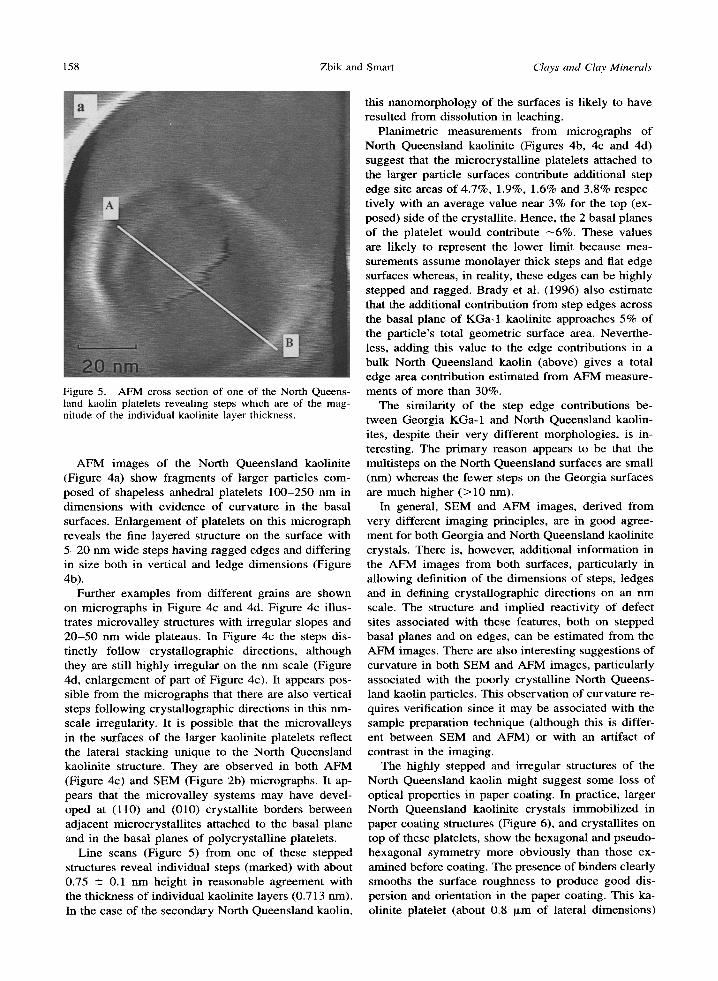
Figure 5. AFM cross section of one of the North Queens- land kaolin platelets revealing steps which are of the mag- nitude of the individual kaolinite layer thickness.
AFM images of the North Queensland kaolinite (Figure 4a) show fragments of larger particles com- posed of shapeless anhedral platelets 100-250 nm in dimensions with evidence of curvature in the basal surfaces. Enlargement of platelets on this micrograph reveals the fine layered structure on the surface with 5-20 nm wide steps having ragged edges and differing in size both in vertical and ledge dimensions (Figure 4b).
Further examples from different grains are shown on micrographs in Figure 4c and 4d. Figure 4c illus- trates microvalley structures with irregular slopes and 20-50 nm wide plateaus. In Figure 4c the steps dis- tinctly follow crystallographic directions, although they are still highly irregular on the nm scale (Figure 4d, enlargement of part of Figure 4c). It appears pos- sible from the micrographs that there are also vertical steps following crystallographic directions in this nm- scale irregularity. It is possible that the microvalleys in the surfaces of the larger kaolinite platelets reflect the lateral stacking unique to the North Queensland kaolinite structure. They are observed in both AFM (Figure 4c) and SEM (Figure 2b) micrographs. It ap- pears that the microvalley systems may have devel- oped at (110) and (010) crystallite borders between adjacent microcrystallites attached to the basal plane and in the basal planes of polycrystalline platelets.
Line scans (Figure 5) from one of these stepped structures reveal individual steps (marked) with about 0.75 -- 0.1 nm height in reasonable agreement with the thickness of individual kaolinite layers (0.713 nm). In the case of the secondary North Queensland kaolin,
this nanomorphology of the surfaces is likely to have resulted from dissolution in leaching.
Planimetric measurements from micrographs of North Queensland kaolinite (Figures 4b, 4c and 4d) suggest that the microcrystalline platelets attached to the larger particle surfaces contribute additional step edge site areas of 4.7%, 1.9%, 1.6% and 3.8% respec- tively with an average value near 3% for the top (ex- posed) side of the crystallite. Hence, the 2 basal planes of the platelet would contribute - 6 % . These values are likely to represent the lower limit because mea- surements assume monolayer thick steps and fiat edge surfaces whereas, in reality, these edges can be highly stepped and ragged. Brady et al. (1996) also estimate that the additional contribution from step edges across the basal plane of KGa-1 kaolinite approaches 5% of the particle's total geometric surface area. Neverthe- less, adding this value to the edge contributions in a bulk North Queensland kaolin (above) gives a total edge area contribution estimated from AFM measure- ments of more than 30%.
The similarity of the step edge contributions be- tween Georgia KGa-1 and North Queensland kaolin- ites, despite their very different morphologies, is in- teresting. The primary reason appears to be that the multisteps on the North Queensland surfaces are small (nm) whereas the fewer steps on the Georgia surfaces are much higher (>10 nm).
In general, SEM and AFM images, derived from very different imaging principles, are in good agree- ment for both Georgia and North Queensland kaolinite crystals. There is, however, additional information in the AFM images from both surfaces, particularly in allowing definition of the dimensions of steps, ledges and in defining crystallographic directions on an nm scale. The structure and implied reactivity of defect sites associated with these features, both on stepped basal planes and on edges, can be estimated from the AFM images. There are also interesting suggestions of curvature in both SEM and AFM images, particularly associated with the poorly crystalline North Queens- land kaolin particles. This observation of curvature re- quires verification since it may be associated with the sample preparation technique (although this is differ- ent between SEM and AFM) or with an artifact of contrast in the imaging.
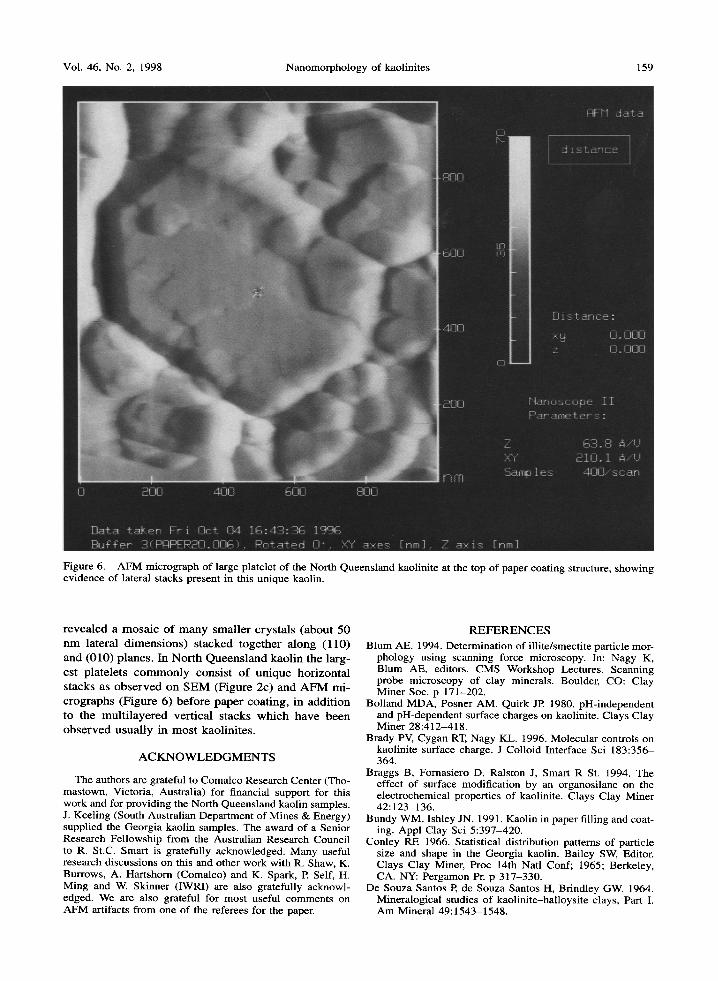
The highly stepped and irregular structures of the North Queensland kaolin might suggest some loss of optical properties in paper coating. In practice, larger North Queensland kaolinite crystals immobilized in paper coating structures (Figure 6), and crystallites on top of these platelets, show the hexagonal and pseudo- hexagonal symmetry more obviously than those ex- amined before coating. The presence of binders clearly smooths the surface roughness to produce good dis- persion and orientation in the paper coating. This ka- olinite platelet (about 0.8 t~m of lateral dimensions)
Vol. 46, No. 2, 1998 Nanomorphology of kaolinites 159
Figure 6. AFM micrograph of large platelet of the North Queensland kaolinite at the top of paper coating structure, showing evidence of lateral stacks present in this unique kaolin.
revealed a mosaic of many smaller crystals (about 50 nm lateral d imens ions) s tacked together along (110) and (010) planes. In Nor th Queens land kaolin the larg- est platelets c o m m o n l y consis t o f unique horizontal stacks as obse rved on S E M (Figure 2c) and A F M mi- crographs (Figure 6) before paper coating, in addit ion to the mul t i layered vertical stacks which have been obse rved usually in mos t kaolinites.
A C K N O W L E D G M E N T S
The authors are grateful to Comalco Research Center (Tho- mastown, Victoria, Australia) for financial support for this work and for providing the North Queensland kaolin samples. J. Keeling (South Australian Department of Mines & Energy) supplied the Georgia kaolin samples. The award of a Senior Research Fellowship from the Australian Research Council to R. St.C. Smart is gratefully acknowledged. Many useful research discussions on this and other work with R. Shaw, K. Burrows, A. Hartshorn (Comalco) and K. Spark, P. Self, H. Ming and W. Skinner (IWRI) are also gratefully acknowl- edged. We are also grateful for most useful comments on AFM artifacts from one of the referees for the paper.
R E F E R E N C E S
Blum AE. 1994. Determination of illite/smectite particle mor- phology using scanning force microscopy. In: Nagy K, Blum AE, editors. CMS Workshop Lectures. Scanning probe microscopy of clay minerals. Boulder, CO: Clay Miner Soc. p 171-202.
Bolland MDA, Posner AM, Quirk JR 1980. pH-independent and pH-dependent surface charges on kaolinite. Clays Clay Miner 28:412-418.
Brady PV, Cygan RT, Nagy KL. 1996. Molecular controls on kaolinite surface charge. J Colloid Interface Sci 183:356- 364.
Braggs B, Fornasiero D, Ralston J, Smart R St. 1994. The effect of surface modification by an organosilane on the electrochemical properties of kaolinite. Clays Clay Miner 42:123-136.
Bundy WM, Ishley JN. 1991. Kaolin in paper filling and coat- ing. Appl Clay Sci 5:397-420.
Conley RE. 1966. Statistical distribution patterns of particle size and shape in the Georgia kaolin. Bailey SW, Editor. Clays Clay Miner, Proc 14th Natl Conf; 1965; Berkeley, CA. NY: Pergamon Pr. p 317-330.
De Souza Santos P, de Souza Santos H, Brindley GW. 1964. Mineralogical studies of kaolinite-halloysite clays, Part I. Am Mineral 49:1543-1548.
160 Zbik and Smart Clays and Clay Minerals
De Souza Santos P, de Souza Santos H, Brindley GW. 1965. Mineralogical studies of kaolinite-halloysite clays, Part II. Am Mineral 50:619-628.
Eggleston C. 1994. High resolution scanning probe microsco- py: Tip-surface interaction, artifacts and applications in mineralogy and geochemistry. In: Nagy K, Blum AIE, ed- itors. CMS Workshop Lectures. Scanning probe microsco- py of clay minerals. Boulder, CO: Clay Miner Soc. p 1- 90.
Ferris AP, Jepson WB. 1975. The exchange capacities of ka- olinite and the preparation of homoionic clays. J Colloid Interface Sci 51:245-259.
Gard JA. 1971. The electron-optical investigation of clays. Mineral Soc Monographs 3. London: Miner Soc. 157 p.
Gerson AR. 1997. The surface modification of kaolinite using water vapour plasma. In: Cisneros G, Cogordan JA, Castro M, Wang C, editors. Computational chemistry and chemi- cal engineering. World Scientific Press. p 227-235.
Grabowska-Olszewska B, Osipov V, Sokolov V. 1984. Atlas of the microstructure of clay soils: Warszawa: PWN (Pub). 414 p.
Grim RE. 1968. Clay mineralogy. New York: McGraw-Hill. 596 p.
Hinckley DN. 1962. Variability in "crystallinity" values among the kaolin deposits of the coastal plains of Georgia and South Carolina. Swineford A, editor. Clays Clay Miner, Proc 1 lth Natl Conf, 1962; Ottawa, Ontario. NY: Perga- mon Pr. p 229-235.
Hochella MF Jr. 1995. Mineral surfaces: Their characterisa- tion and their chemical, physical and reactive nature. In: Vaughan DJ, Pattrick RAD, editors. Mineral surfaces. Min- eral Soc Series 5. London: Chapman and Hall. p 17-60.
Hyde ST. 1993. Hyperbolic and elliptic layer warping in some sheet alumino-silicates. Phys Chem Miner 20:190-220.
Jepson WB. 1984. Kaolins: Their properties and uses. Phil Trans Roy Soc Lond: A311:411-432.
Malekani K, Rice JA, Lin JS. 1996. Comparison of tech- niques for determining the fractal dimensions of clay min- erals. Clays Clay Miner 44:677-685.
Nagy KL. 1994. Application of morphological data obtained using scanning force microscopy to quantification of fi- brous illite growth rates. In: Nagy K, Blum AE, editors. CMS Workshop Lectures. Scanning probe microscopy of clay minerals. Boulder, CO: Clay Miner Soc. p 203-239.
Smart P, Tovey NK. 1981. Electron microscopy of soils and sediments: Examples. Oxford: Clarendon Pr. 177 p.
Smart RStC. 1998. Minerals, ceramics and glasses. In: Rivi- ere JC, Myhra S, editors. Problem-solving methods for sur- faces and interfaces. London and NY: Marcel Dekker.
Sokolowska Z, Stawinski J, Patrykiejew A, Sokolowska S. 1989. A note on fractal analysis of adsorption process by soils and soil minerals. Internat Agrophys 5:1-23.
Thompson DW, Macmillan JJ, Wyatt DA. 1981. Electron mi- croscope studies of the surface microstructures of layer- lattice silicates. J Colloid Interface Sci 82:362-372.
Van Olphen H, Fripiat JJ. 1979. Data handbook for clay ma- terials and other non-metallic minerals. Oxford and New York: Pergamon Pr. 183 p.
Visconti YS, Nicot BNE 1959. Further comment on tubular kaolin crystals. Ceram Brazil 5:2-10.
Weidler PG, Schwinn T, Gaub HE. 1996. Vicinal faces on synthetic goethite observed by atomic force microscopy. Clays Clay Miner 44:437-442.
Wieland E, Stumm W. 1992. Dissolution kinetics of kaolinite in acidic aqueous solutions at 25 ~ Geochim Cosmochim Acta 56:3339-3355.
Zbik M, Smart R. 1997. Atomic force microscopy in the as- pect ratio estimation of the colloidal kaolinite. 1 lth Internat Clay Conf Prog and Abstr; 15-21 June 1997; Ottawa, Can- ada.
Zhou Q, Maurice PA. 1995. SFM morphological character- ization of Kga2 and Kgal-b kaolinites from Georgia. VM Goldschmidt, Editor. Conf Prog and Abstr; Edinburgh. p 102.
Zhou Z, Gunter W. 1992. The nature of the surface charge of kaolinite. Clays Clay Miner 40:365-368.
(Received 13 February 1997; accepted 2 August I997; Ms. 97-016)