Embed Size (px)
Citation preview
NANOFIBROUS NANOCOMPOSITES VIA
ELECTROSPINNING
A THESIS
SUBMITTED TO THE MATERIALS SCIENCE AND NANOTECHNOLOGY
PROGRAM OF GRADUATE SCHOOL OF ENGINEERING AND SCIENCE
OF BILKENT UNIVERSITY
IN PARTIAL FULFILLMENT OF THE REQUIREMENTS
FOR THE DEGREE OF
MASTER OF SCIENCE
By
Ali Ekrem Deniz
August, 2011
ii
I certify that I have read this thesis and that in my opinion it is fully adequate, in
scope and in quality, as a thesis of the degree of Master of Science.
…………………………………
Prof. Dr. Salim Çıracı (Advisor)
I certify that I have read this thesis and that in my opinion it is fully adequate, in
scope and in quality, as a thesis of the degree of Master of Science.
………………………………….
Assist. Prof. Dr. Tamer Uyar (Co-Advisor)
I certify that I have read this thesis and that in my opinion it is fully adequate, in
scope and in quality, as a thesis of the degree of Master of Science.
………………………………….
Assoc. Prof. Dr. Dönüş Tuncel
I certify that I have read this thesis and that in my opinion it is fully adequate, in
scope and in quality, as a thesis of the degree of Master of Science.
………………………………….
Assist. Prof. Dr. Ali Çırpan
Approved for the graduate school of engineering and science:
………………………………….
Prof. Dr. Levent Onural
Director of the graduate school of engineering and science
iii
ABSTRACT
NANOFIBROUS NANOCOMPOSITES VIA
ELECTROSPINNING
Ali Ekrem Deniz
M.S. in Materials Science and Nanotechnology
Supervisor: Asst. Prof. Dr. Tamer Uyar
August, 2011
In recent years, numerous studies have been reported for fabrication of
composite nanofibers from polymeric and inorganic materials by using
electrospinning method. In the first part of this study, TiO2 and ZnO inorganic
nanofibers were produced by electrospinning from their precursors by using
polymeric carrier matrix and their photocatalytic activity of these metal oxide
nanofibers were studied. Moreover, electrospun TiO2 nanofibers were crushed
into short nanofibers (TiO2-SNF) and embedded in electrospun polymeric
nanofiber matrixes such as poly(methyl methacrylate) (PMMA),
polyacrylonitrile (PAN), polyethylene terephthalate (PET), polycarbonate (PC)
and polyvinylidene fluoride (PVDF). Different weight loading of TiO2-SNF
ranging from 2% to 8% (w/w, respect to polymer) incorporated into PVDF
nanofibrous matrix was applied and the structural and morphological changes
along with their photocatalytic activities were also examined.
iv
In the second part, metallic nanoparticles produced by laser ablation
method were incorporated into nanofibrous polymeric matrix by using
electrospinning technique. For example, gold (Au) and silver (Ag) nanoparticles
(NPs) were produced from their metallic sources by laser ablation method
directly in the polymer solutions. The NPs/polymer mixtures were electrospun
and surface plasmon resonance effect of Au-NPs and Ag-NPs on optical
properties of the nanofibers was studied. In addition, germanium nanocrystals
produced by means of laser ablation were mixed with PVDF polymer solution
and consequently electrospun into composite polymeric nanofiber matrix.
Keywords: Electrospinning, nanofibers, TiO2, ZnO, photocatalytic activity, laser
ablation, germanium nanocrystals, gold nanoparticles, silver nanoparticles,
nanocomposites.
v
ÖZET
ELEKTROEĞĠRME ĠLE NANOFĠBRĠL YAPILI
NANOKOMPOZĠTLER
Ali Ekrem Deniz
Malzeme Bilimi ve Nanoteknoloji Programı, Yüksek Lisans
Tez Yöneticisi: Yard. Doç. Dr. Tamer Uyar
Ağustos, 2011
Son yıllarda yapılan birçok çalışmada elektroeğirme tekniği kullanılarak
polimerik ve anorganik malzemelerden kompozit nanofiberler üretildiği
bildirilmektedir. Bu çalışmada, titanyum dioksit (TiO2) ve çinko oksit (ZnO)
anorganik nanofiberler, kimyasal başlangıç maddelerinden polimerik taşıyıcı
matriks kullanılarak üretilmiş ve fotokatalitik aktiviteleri çalışılmıştır. Bundan
başka, TiO2 nanolifleri TiO2 kısa nanoliflerine (TiO2-SNF) parçalanarak
poli(metil metakrilat) (PMMA), poliakrilonitril (PAN), poli(etilen teraftalat)
(PET), polikaprolakton (PC) ve poli(viniliden florür) (PVDF) gibi
elektroeğrilmiş polimerik nanolif matrikslerine yerleştirilmiştir. %2 den %8’e
(ağırlıkça polimere oranla) değişen TiO2-SNF farklı ağırlıklarda PVDF nanolif
matriksine eklenmiştir ve fotokatalitik aktivitelerinin yanında yapısal ve
morfolojik değişiklikler de gözlemlenmiştir.
vi
Ġkinci kısımda ise lazer ablasyon metoduyla üretilen metal nano parçacıklar
polimerik nanolif matrikslerine elektroeğirme tekniği ile yerleştirilmiştir. Buna
örnek olarak, altın (Au) ve gümüş (Ag) nano parçacıklar (NPs) metal
kaynaklarından direk polimer solüsyonlarında lazer ablasyon sayesinde
üretilmiştir. Bu NPs/polimer karışımları elektroeğrilmiş, Au-NPs ve Ag-NPs’nin
yüzey plazmon rezonanslarının, polimerlerin optik özelliklerine etkisi
çalışılmıştır. Buna ek olarak, germanyum nano kristalleri lazer ablasyon
sayesinde üretilmiş, PVDF polimer solüsyonuyla karıştırılmış ve sonuç olarak
kompozit polimer nanolif matriksi elektroeğirme ile elde edilmiştir.
Anahtar Kelimeler: Elektroeğirme, nanolif, TiO2, ZnO, fotokatalitik aktivite,
lazer ablasyon, germanyum nano kristalleri, altın nano parçacık, gümüş nano
parçacık, nanokompozit.

vii
ACKNOWLEDGEMENT
I would like to express my sincere gratitudes to my supervisor Asst. Prof. Dr.
Tamer Uyar for his guidance, support, and patience during the course of this
research. One of the most right decisions in my life is joining the nanotextile
research laboratory and being a member of such a beautiful group. I will never
forget experience that I have benefited from greatly throughout my life.
We had a great atmosphere in the laboratory so I owe a special thank to Aslı
Çelebioğlu, Fatma Kayacı and Zeynep Aytaç for their support, help, and
friendship. It was wonderful to work with them.
I would like to thank Asst. Prof. Dr. Bülend Ortaç and his student Hüseyin Avni
Vural for their collaboration with laser ablation experiments.
Also, I would like to acknowledge State Planning Organization (DPT) of Turkey
for its support to UNAM Institute of Materials Science and Nanotechnology.
Finally, I want to express my gratitude to my family for their endless support,
and understanding.
viii
TABLE OF CONTENTS
ABSTRACT ........................................................................................................ iii
ÖZET .................................................................................................................... v
ACKNOWLEDGEMENT .................................................................................. vii
TABLE OF CONTENTS .................................................................................. viii
LIST OF FIGURES .............................................................................................. x
LIST OF TABLES ............................................................................................ xiv
PART 1 ................................................................................................................. 1
INTRODUCTION ................................................................................................ 1
1.1. Electrospinning .......................................................................................... 1
1.2. Parameters of electrospinning ................................................................... 3
1.3. Electrospun nanofibers and their applications ........................................... 5
PART 2 ............................................................................................................... 10
CHAPTER I. INORGANIC NANOFIBERS ..................................................... 10
2.1. Inorganic nanofibers ................................................................................ 10
2.2. Photocatalytic activity ............................................................................. 11
2.3. Materials .................................................................................................. 13
2.4. Electrospinning unit at UNAM ............................................................... 13
2.5. Fabrication of titanium dioxide (TiO2) nanofibers via electrospinning .. 14
2.6. Characterization techniques..................................................................... 16
2.7. Characterization of TiO2 nanofibers ........................................................ 16
2.8. Photocatalytic activity of TiO2 nanofibers .............................................. 19
2.9. Fabrication of zinc oxide (ZnO) nanofibers via electrospinning ............ 21
2.10. Characterization of ZnO nanofibers .................................................... 22
2.11. Photocatalytic activity of ZnO nanofibers ........................................... 24
ix
CHAPTER II. NANOCOMPOSITE NANOFIBERS ........................................ 26
3.1. Nanocomposite nanofibers ...................................................................... 26
3.2. Materials .................................................................................................. 28
3.3. Electrospun polymeric nanofibrous composites containing TiO2 short
nanofibers (TiO2-SNF) ....................................................................................... 29
3.4. Photocatalytic activity of polyethylene terephthalate (PET) nanofibers
containing TiO2-SNF .......................................................................................... 33
3.5. Polyvinylidene fluoride (PVDF) nanofibers with varying TiO2-SNF
concentrations ..................................................................................................... 34
3.6. Photocatalytic activity of PVDF nanofibers containing TiO2-SNF ........ 43
CHAPTER III. FUNCTIONAL NANOFIBERS CONTAINING
NANOPARTICLES ........................................................................................... 46
4.1. Functional nanofibers .............................................................................. 46
4.2. Materials .................................................................................................. 48
4.3. Fabrication of PVP nanofibers containing Au and Ag nanoparticles by
laser ablation method .......................................................................................... 48
4.4. Characterization of PVP nanofibers containing Au and Ag nanoparticles
by laser ablation method ..................................................................................... 50
4.5. Fabrication of PVDF nanofibers contains Ge nanocrystals (Ge-NCs) by
laser ablation method .......................................................................................... 55
4.6. Characterization of PVDF nanofibrous composites containing Ge-NCs by
laser ablation method .......................................................................................... 57
CHAPTER 4 ....................................................................................................... 60
CONCLUSION .................................................................................................. 60
FUTURE PROSPECTS ..................................................................................... 62
REFERENCES ................................................................................................... 63
LIST OF PUBLICATION .................................................................................. 70
x
LIST OF FIGURES
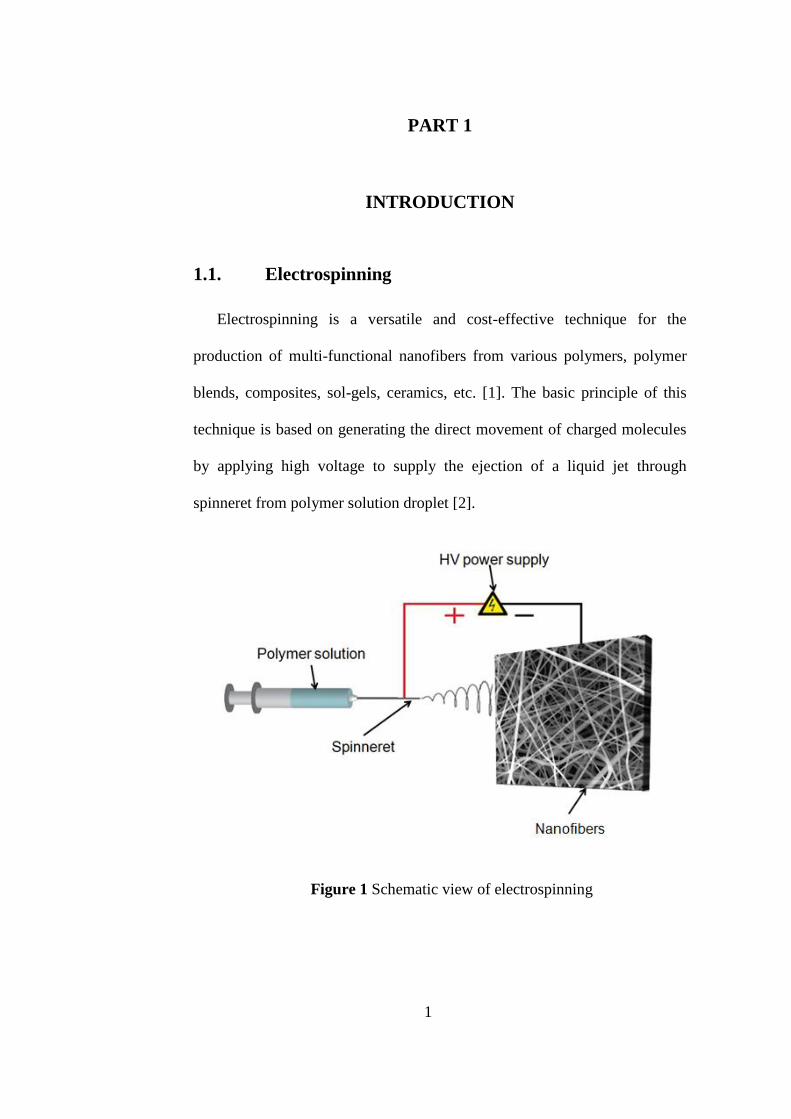
Figure 1 Schematic view of electrospinning ....................................................... 1
Figure 2 (a) Schematic representation of an electrospinning apparatus (r, radius
of the capillary; R, curvature radius of the electrode used) and Taylor cones. (i)
Formation of Taylor cone in an applied electric field. (ii) Taylor cone ejects
fluid jet. (iii) Surface tension causes cone shape to relax [4]. (b) Photograph of a
jet of PEO solution during electrospinning, (c) High-speed photograph of jet
instabilities [5]. These figures were adapted from [4,5] with permission. ........... 2
Figure 3 Representative SEM images of PAN nanofibers obtained from a) 15%,
and b) 20% polymer concentrations. With increasing concentration, the bead
structures are eliminated and bead-free, uniform PAN nanofibers are obtained. 4
Figure 4 General application areas of electrospun nanofibers ............................ 6
Figure 5 Mechanism of metaloxide photocatalysis. Picture is adapted with
permission from [13]. The oxidizing species, OH• radicals are produced by the
reaction between electron-hole pairs and H2O or surface-bound hydroxyl ion. 12
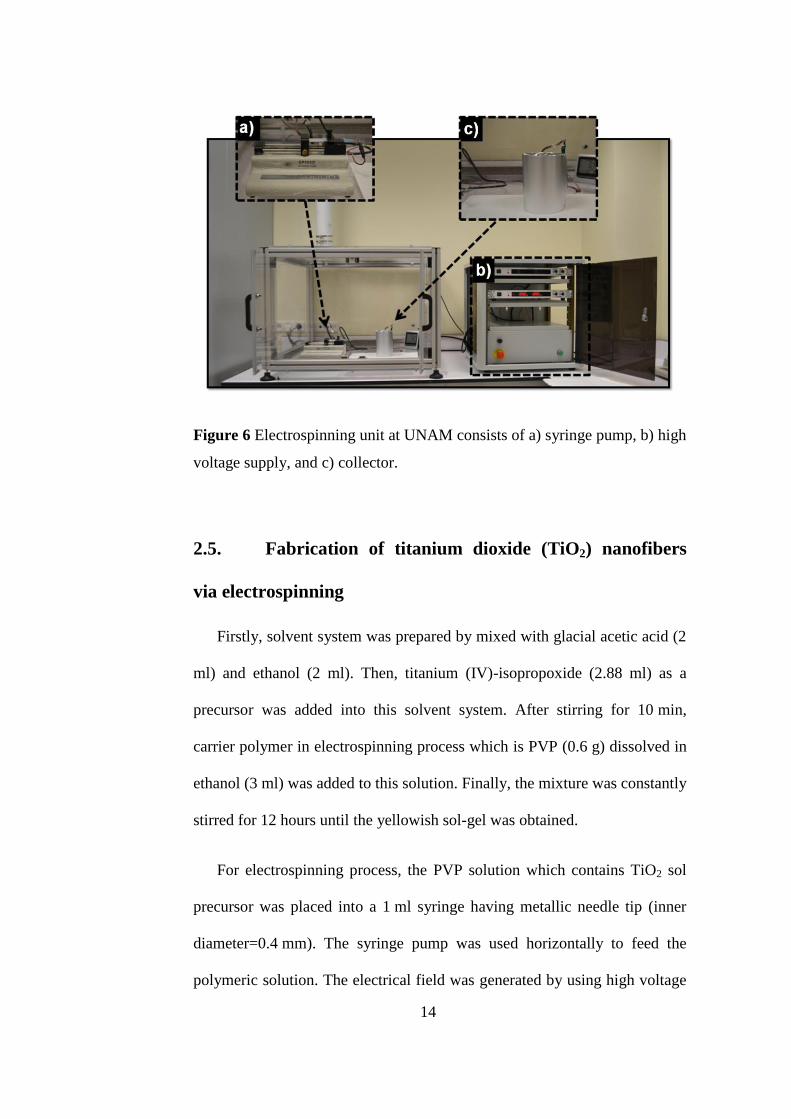
Figure 6 Electrospinning unit at UNAM consists of a) syringe pump, b) high
voltage supply, and c) collector. ......................................................................... 14
Figure 7 Schematic view of electrospun PVP nanofibers containing TiO2 sol
precursor from sol-gel polymer solution by applied voltage = 15 kV, feed rate =
0.5 ml/h, tip-to-collector distance = 10 cm. ....................................................... 15
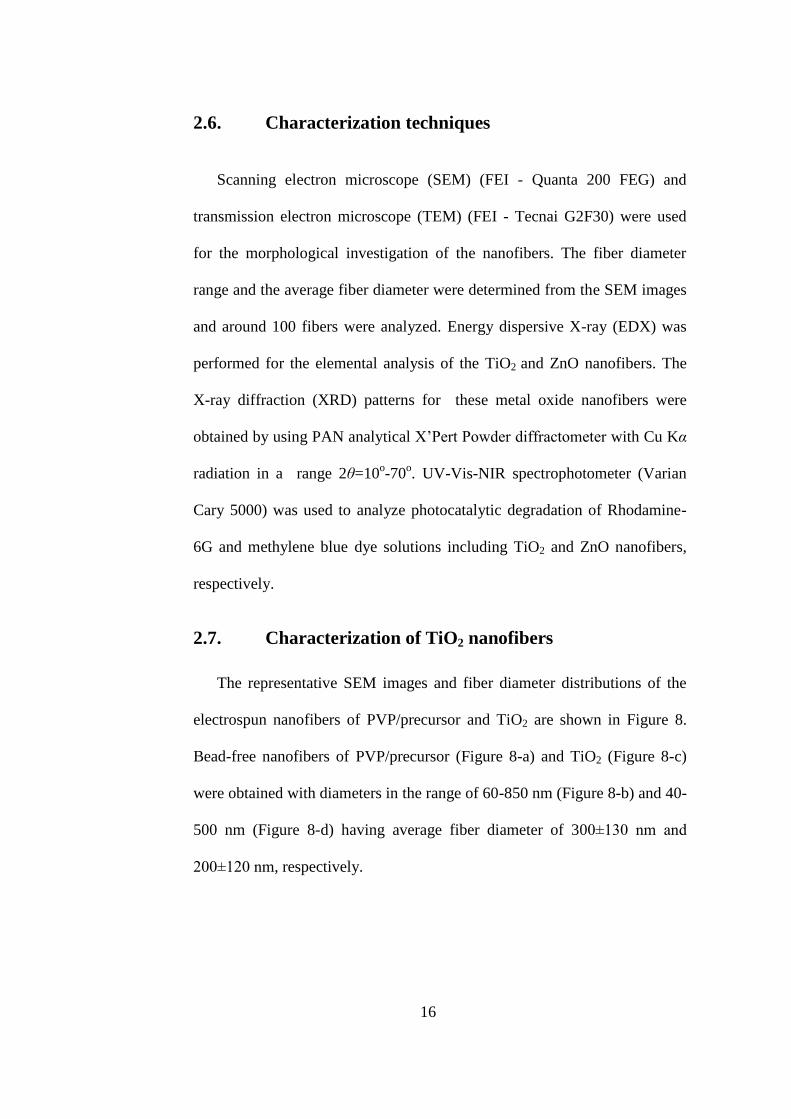
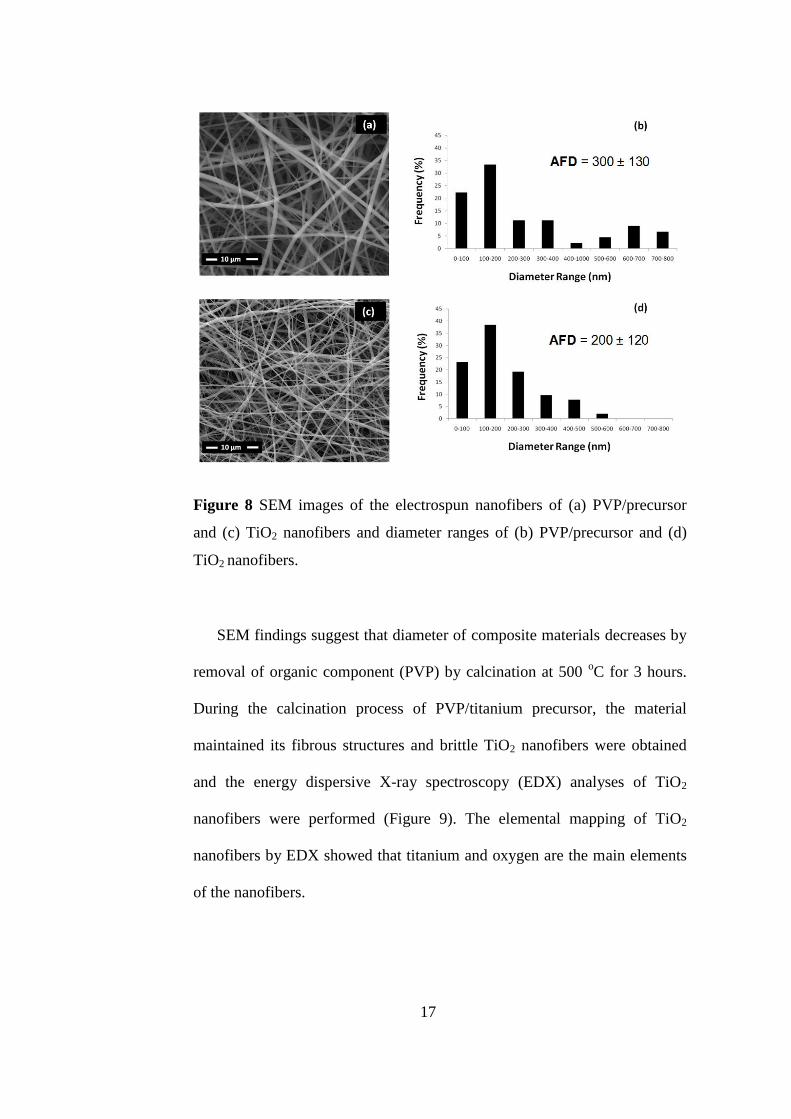
Figure 8 SEM images of the electrospun nanofibers of (a) PVP/precursor and
(c) TiO2 nanofibers and diameter ranges of (b) PVP/precursor and (d) TiO2
nanofibers. .......................................................................................................... 17
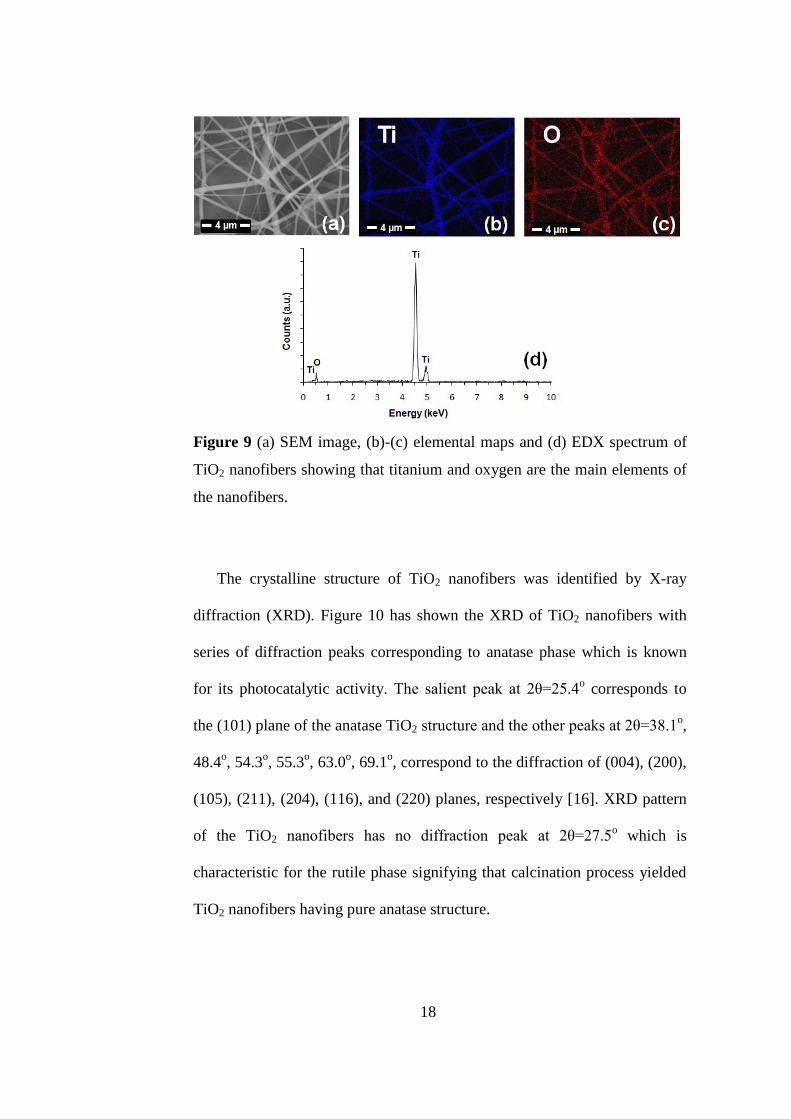
Figure 9 (a) SEM image, (b)-(c) elemental maps and (d) EDX spectrum of TiO2
nanofibers showing that titanium and oxygen are the main elements of the
nanofibers. .......................................................................................................... 18
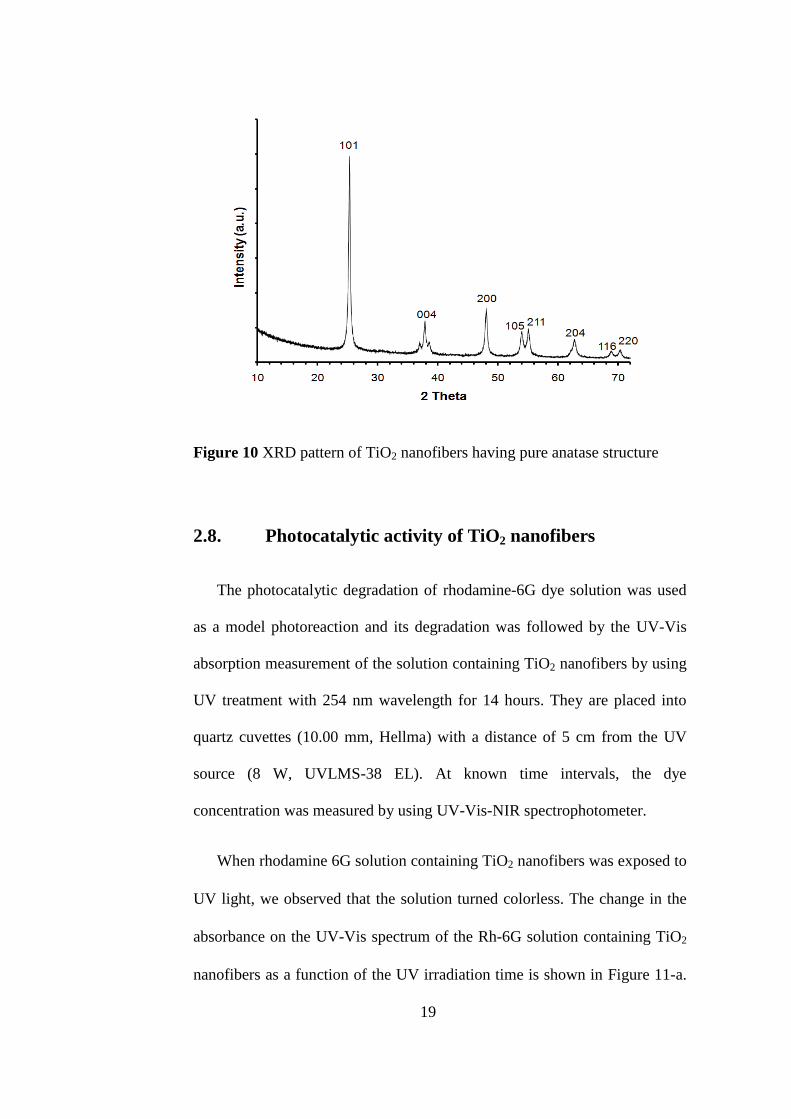
Figure 10 XRD pattern of TiO2 nanofibers having pure anatase structure ....... 19
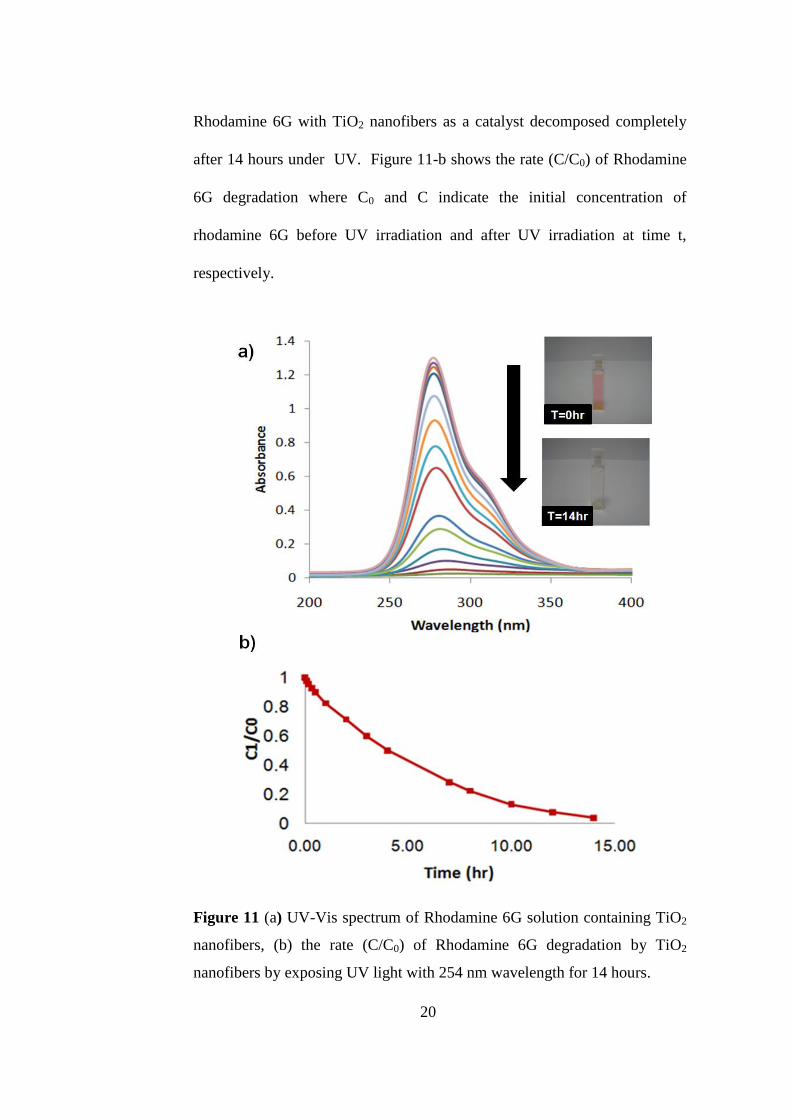
Figure 11 (a) UV-Vis spectrum of Rhodamine 6G solution containing TiO2
nanofibers, (b) the rate (C/C0) of Rhodamine 6G degradation by TiO2 nanofibers
by exposing UV light with 254 nm wavelength for 14 hours. ........................... 20
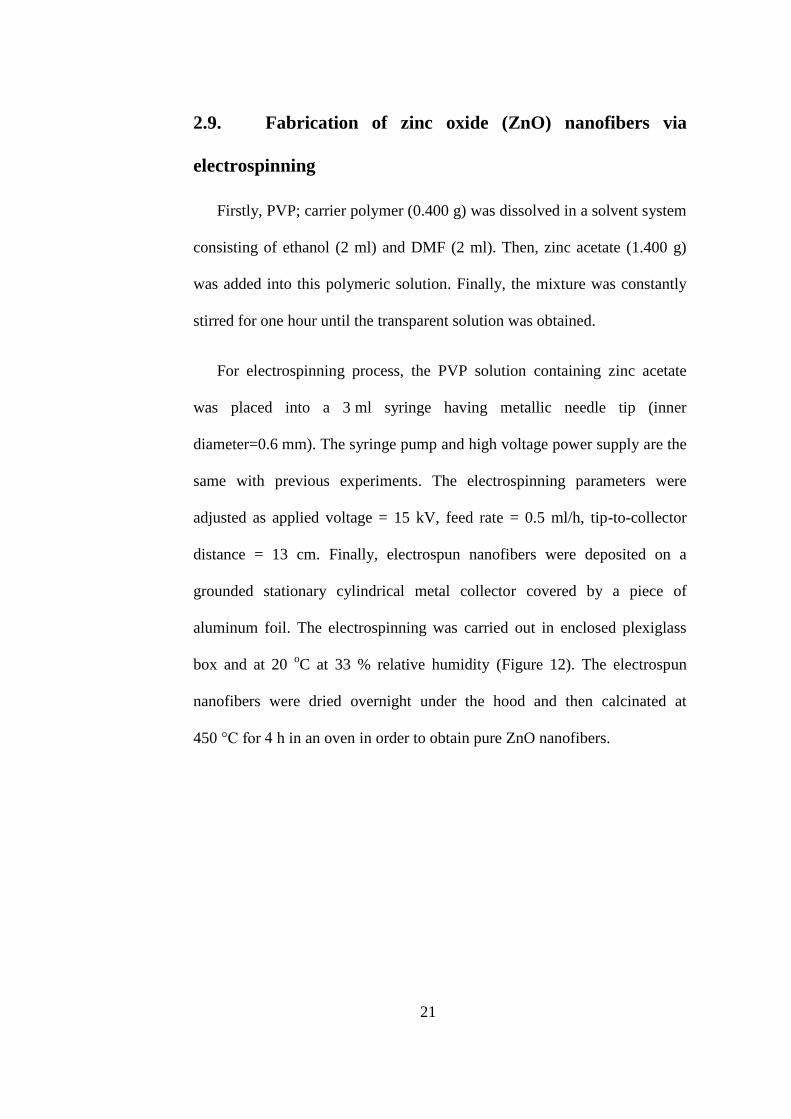
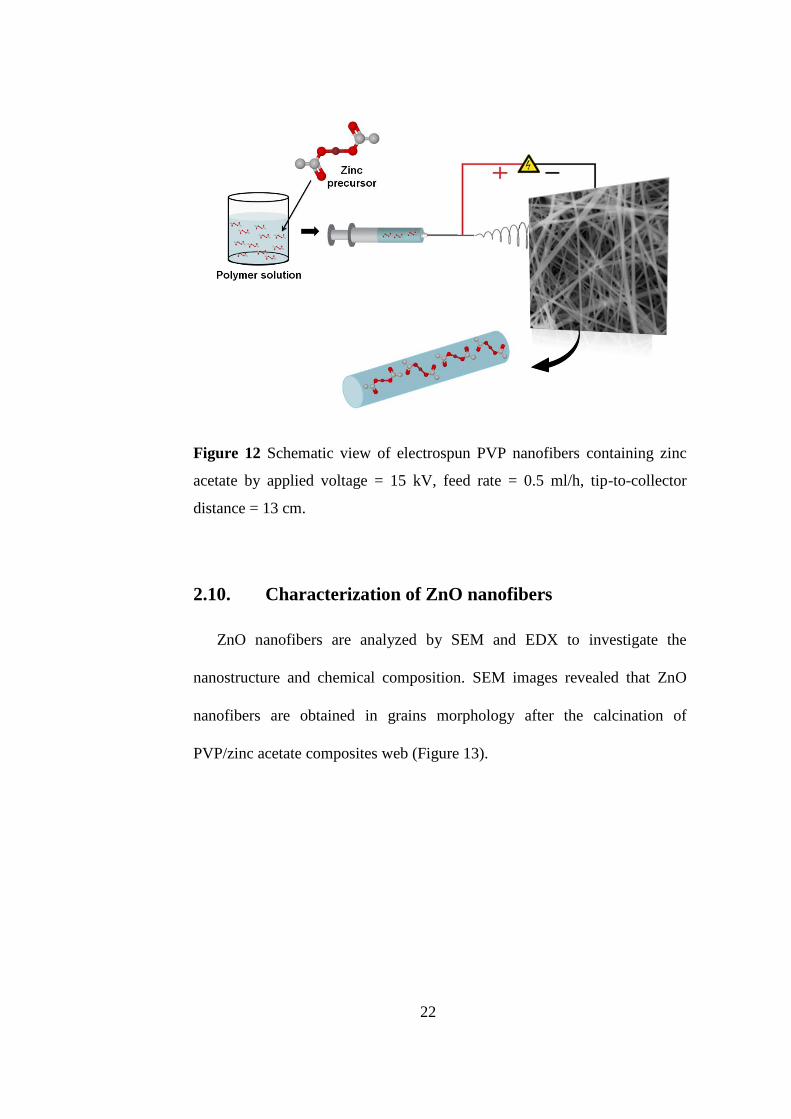
Figure 12 Schematic view of electrospun PVP nanofibers containing zinc
acetate by applied voltage = 15 kV, feed rate = 0.5 ml/h, tip-to-collector distance
= 13 cm. .............................................................................................................. 22
xi
Figure 13 The SEM images of a) PVP nanofibers containing zinc acetate, ZnO
nanofibers after calcination at 450 °C for 4 h. Magnification: b) 15000x, c)
100000x .............................................................................................................. 23
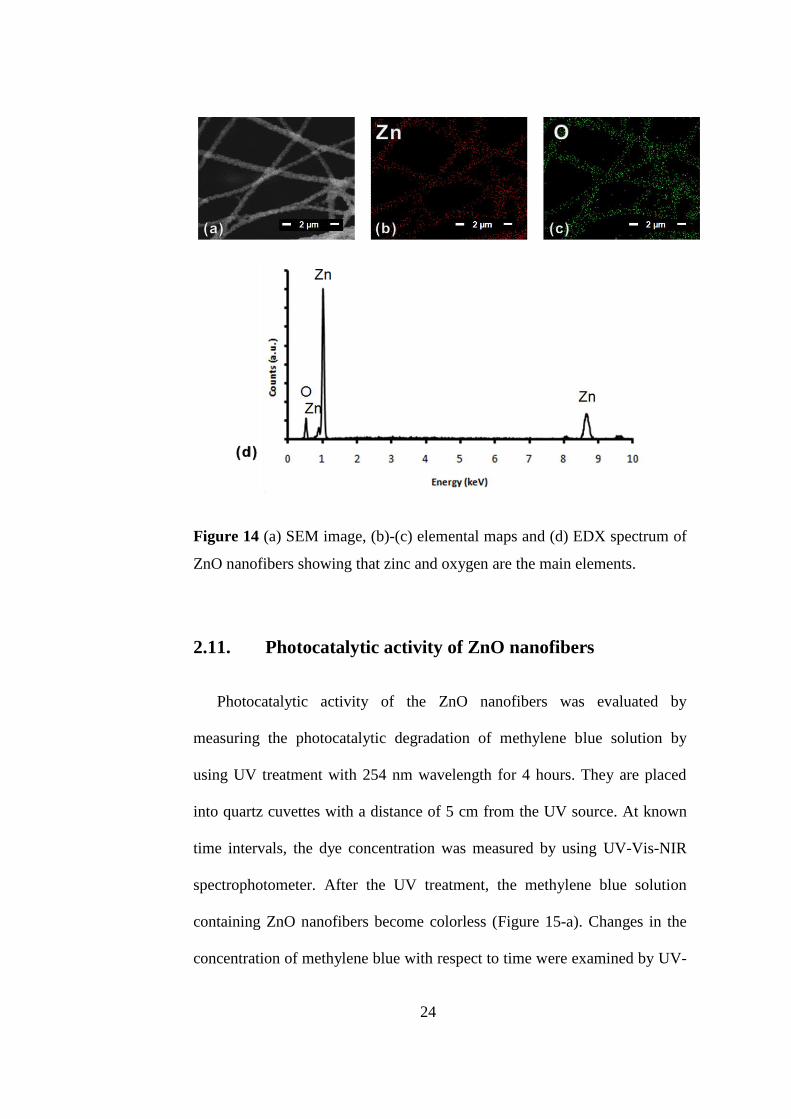
Figure 14 (a) SEM image, (b)-(c) elemental maps and (d) EDX spectrum of
ZnO nanofibers showing that zinc and oxygen are the main elements. ............. 24
Figure 15 (a) UV-Vis spectrum of methylene blue solution containing ZnO
nanofibers, (b) the rate (C/C0) of methylene blue degradation by ZnO nanofibers
by using UV treatment with 254 nm wavelength for 4 hours ............................ 25
Figure 16 Schematic illustration for a mesoporous TiO2 nanofiber and its
photocatalytic reaction mechanisms. Picture is adapted with permission from
[19]. .................................................................................................................... 27
Figure 17 SEM images (a) low-magnification and (b) high magnification of
TiO2 nanofibers ranging 1 micron to several microns in length were obtained by
crushing in an agar mortar .................................................................................. 29
Figure 18 Schematic view of electrospun polymeric nanofibers containing
TiO2-SNF by applied voltage = 15 kV, tip-to-collector distance = 10 cm and
feed rate = 1 ml/h. ............................................................................................... 30
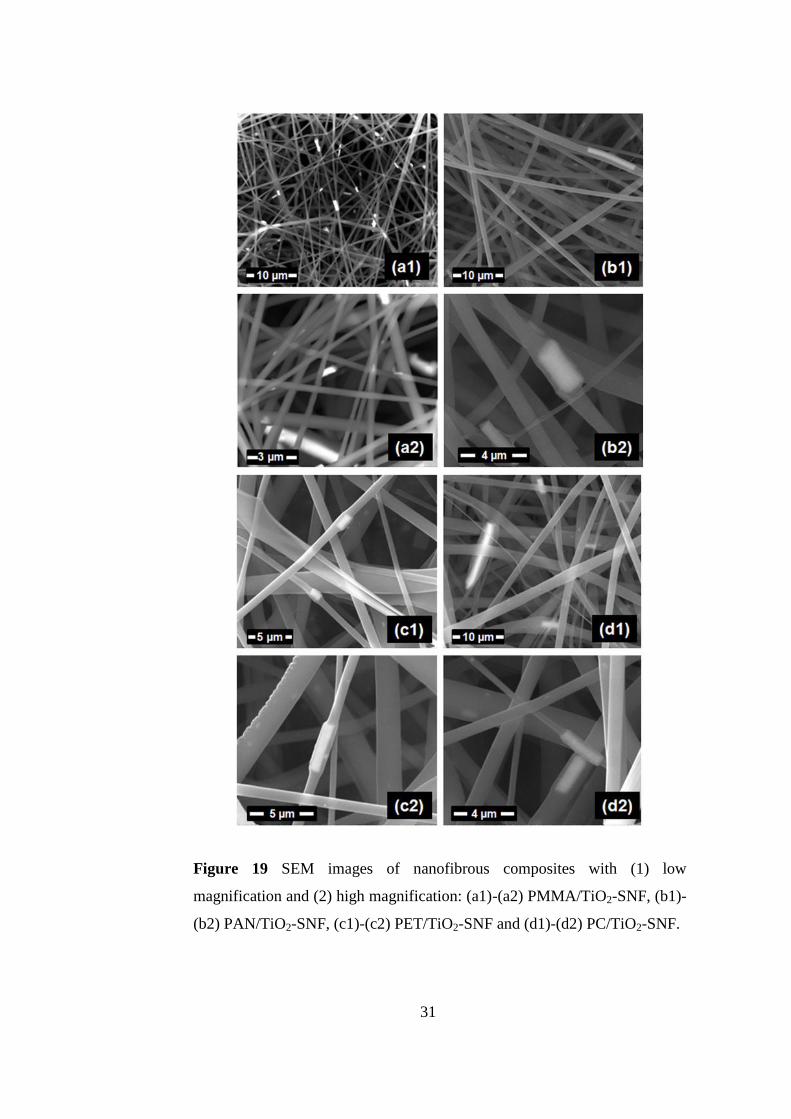
Figure 19 SEM images of nanofibrous composites with (1) low magnification
and (2) high magnification: (a1)-(a2) PMMA/TiO2-SNF, (b1)-(b2) PAN/TiO2-
SNF, (c1)-(c2) PET/TiO2-SNF and (d1)-(d2) PC/TiO2-SNF. ............................ 31
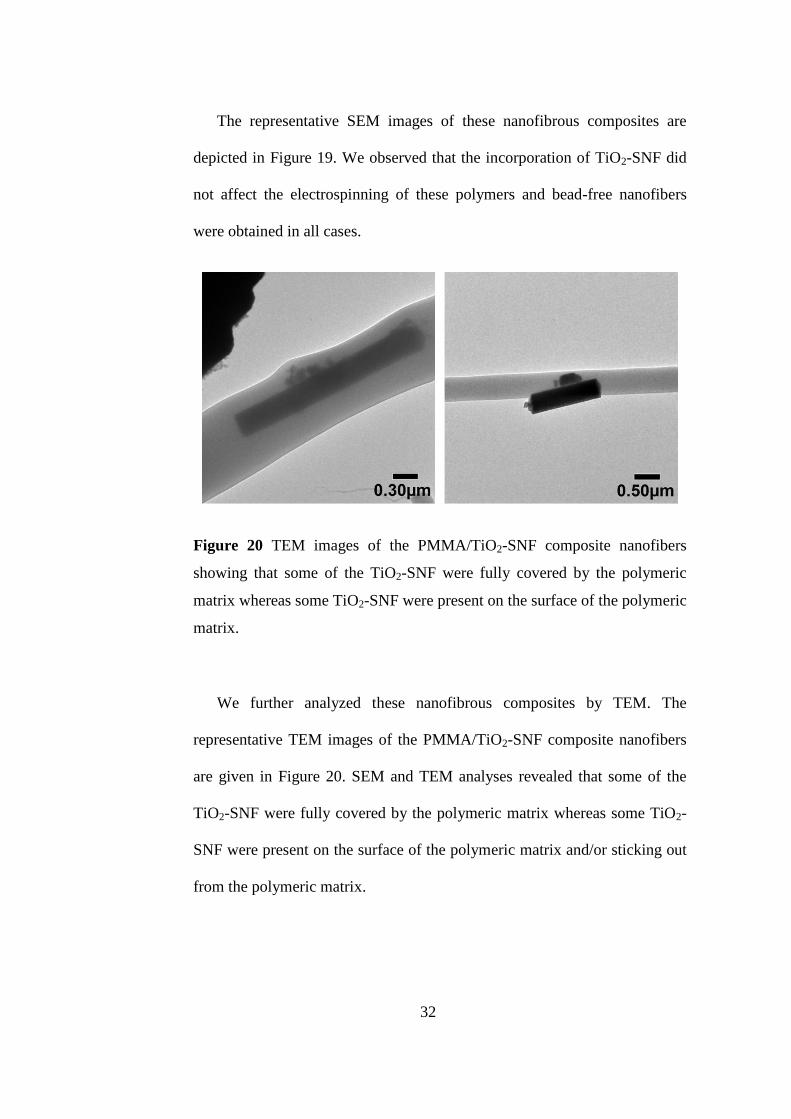
Figure 20 TEM images of the PMMA/TiO2-SNF composite nanofibers showing
that some of the TiO2-SNF were fully covered by the polymeric matrix whereas
some TiO2-SNF were present on the surface of the polymeric matrix............... 32
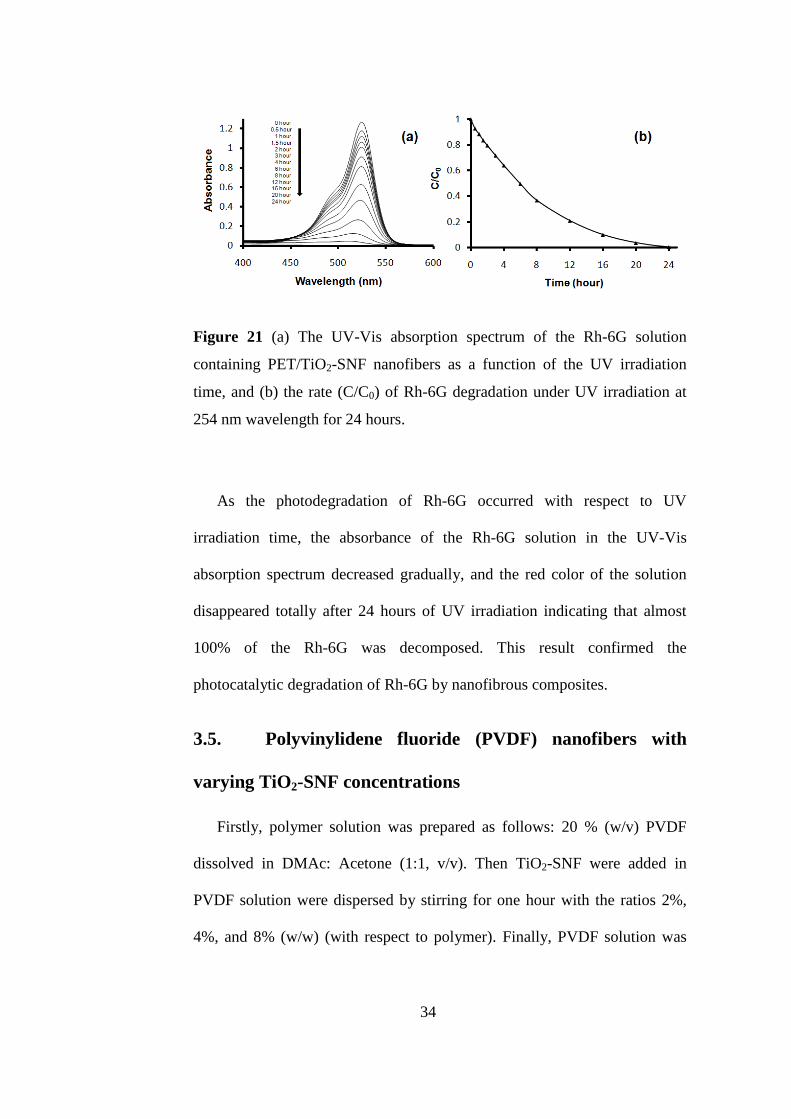
Figure 21 (a) The UV-Vis absorption spectrum of the Rh-6G solution
containing PET/TiO2-SNF nanofibers as a function of the UV irradiation time,
and (b) the rate (C/C0) of Rh-6G degradation under UV irradiation at 254 nm
wavelength for 24 hours. .................................................................................... 34
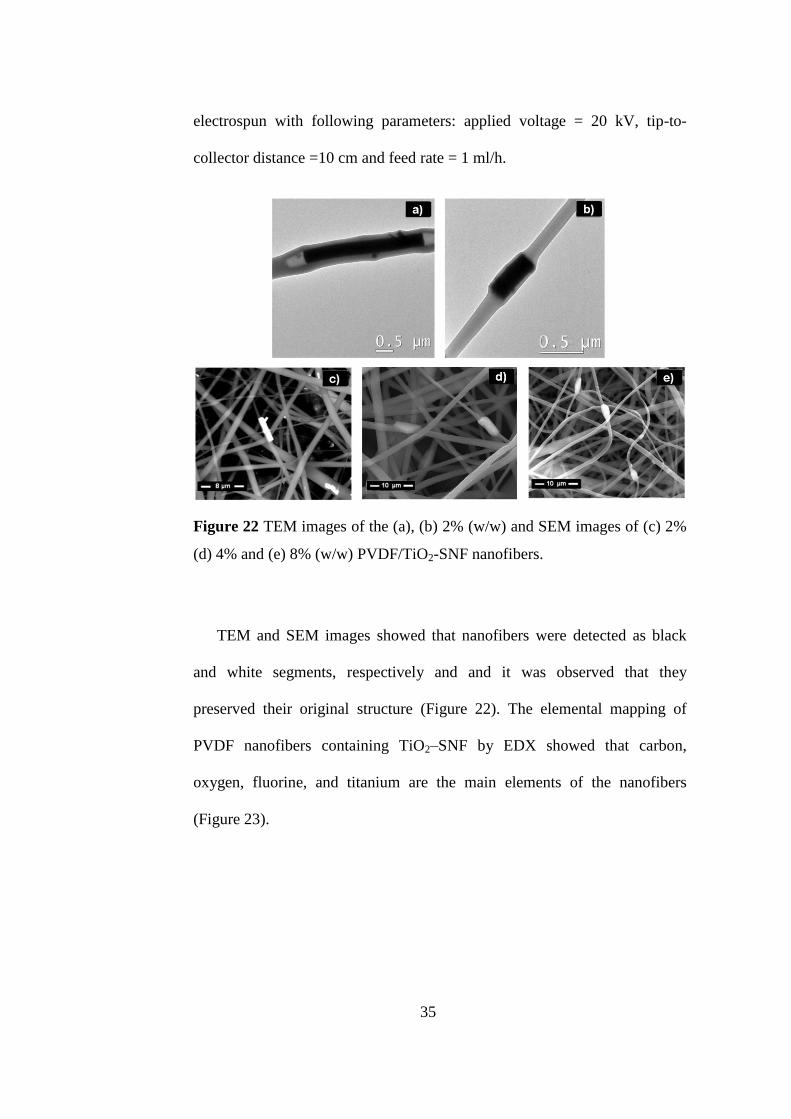
Figure 22 TEM images of the (a), (b) 2% (w/w) and SEM images of (c) 2% (d)
4% and (e) 8% (w/w) PVDF/TiO2-SNF nanofibers ........................................... 35
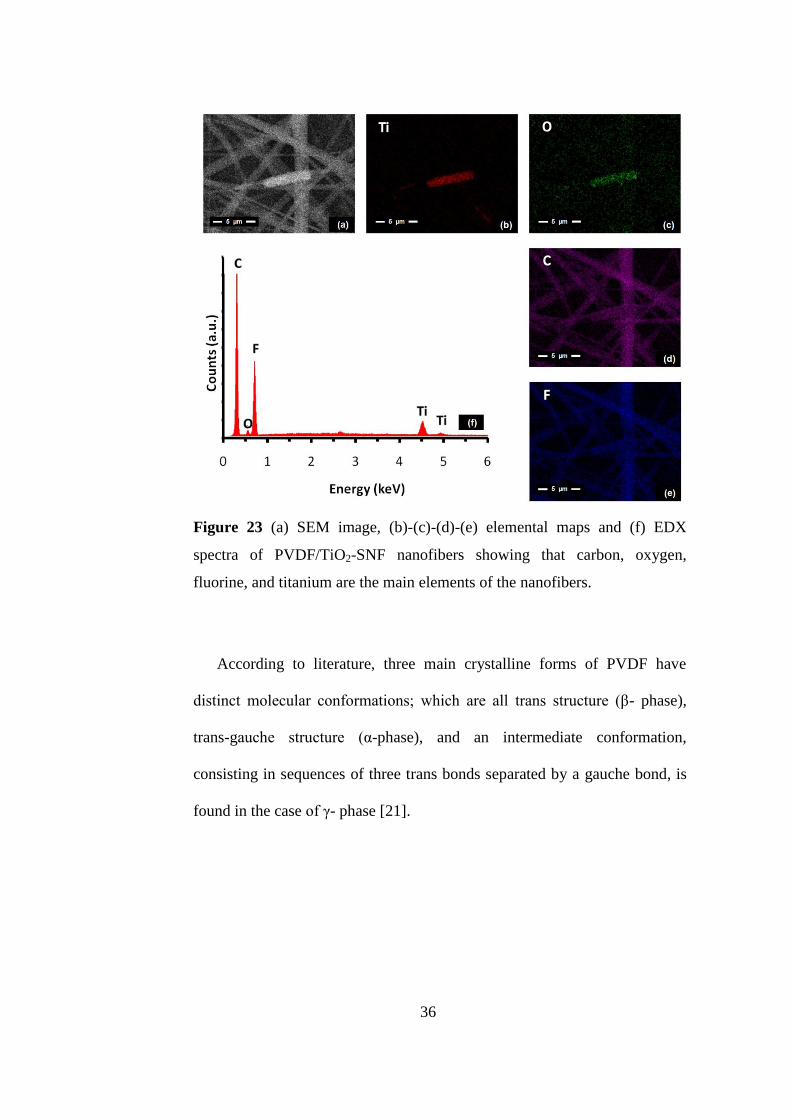
Figure 23 (a) SEM image, (b)-(c)-(d)-(e) elemental maps and (f) EDX spectra
of PVDF/TiO2-SNF nanofibers showing that carbon, oxygen, fluorine, and
titanium are the main elements of the nanofibers. .............................................. 36
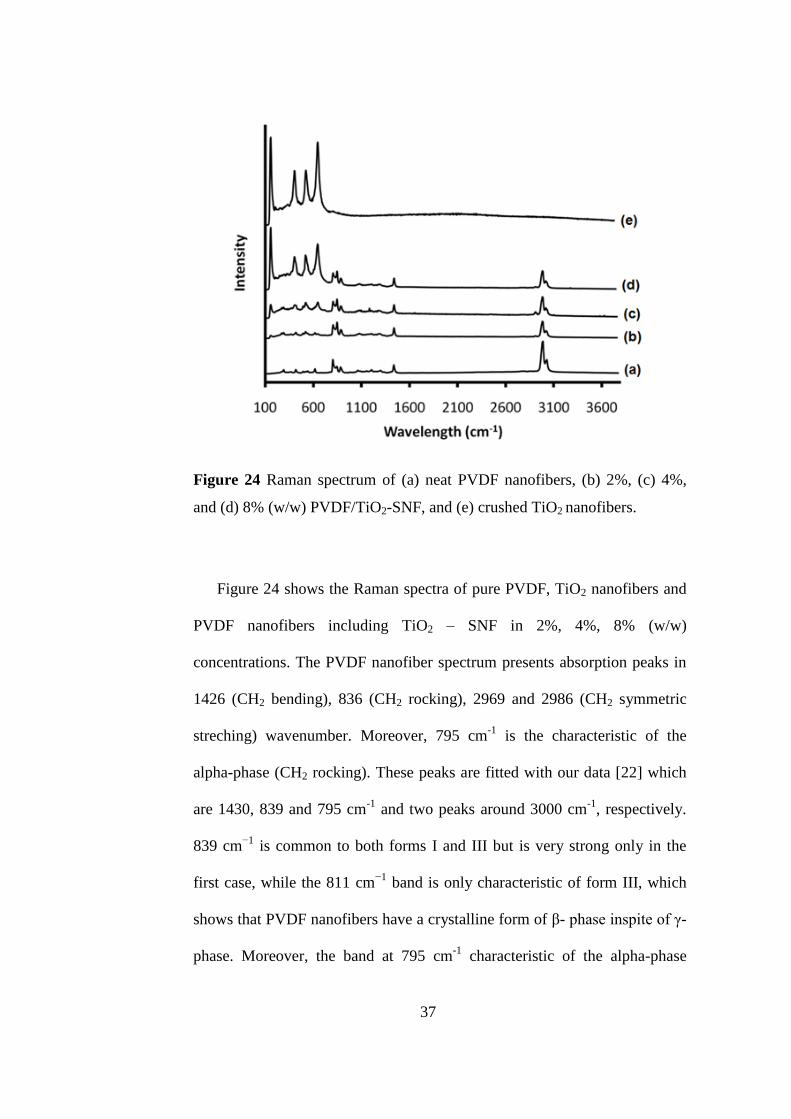
Figure 24 Raman spectrum of (a) neat PVDF nanofibers, (b) 2%, (c) 4%, and
(d) 8% (w/w) PVDF/TiO2-SNF, and (e) crushed TiO2 nanofibers. .................... 37
xii
Figure 25 XRD patterns of (a) neat PVDF nanofibers, (b) 2%, (c) 4%, and (d)
8% (w/w) PVDF/TiO2-SNF, and (e) crushed TiO2 nanofibers show characteristic
peak at 25.3o, 38.6
o, 48.1
o and 55.0
o corrresponds to anatase type of TiO2 and its
intensity increase distinctly as its amount is increased at the sample. ............... 39
Figure 26 Thermal gravimetric analysis of (a) neat PVDF, (b) 2%, (c) 4%, and
(d) 8% (w/w) PVDF/TiO2-SNF nanofibers decompose at around 350 °C that is
lower than pure PVDF because of the catalytic property of the TiO2 nanofibers.
............................................................................................................................ 40
Figure 27 DSC thermograms of (a) 2%, (b) 4%, and (c) 8% (w/w) PVDF/TiO2-
SNF and (d) neat PVDF nanofibers showing that PVDF nanofibers and
composites have a melting peak around 166 °C ................................................. 41
Figure 28 The UV-Vis absorption spectrum of the Rh-6G solution containing
PVDF/TiO2-SNF composite nanofibers including TiO2-SNF a) 2%, (b) 4%, and
(c) 8% (w/w) as a function of the UV irradiation time, and (d) the rate (C/C0) of
Rh-6G degradation by PVDF/TiO2-SNF composite nanofibers including TiO2-
SNF i) 2%, (ii) 4%, and (iii) 8% (w/w) .............................................................. 44
Figure 29 SEM images of the (a) 2%, (b) 4%, and (c) 8% (w/w) PVDF/TiO2-
SNF composite nanofibers after UV-Treatment in fiber morphology. .............. 45
Figure 30 Schematic view of (a) formation nanoparticles in polymer solutions
by laser ablation method by Bülend Ortaç research group, and (b)
electrospinning process of them. ........................................................................ 49
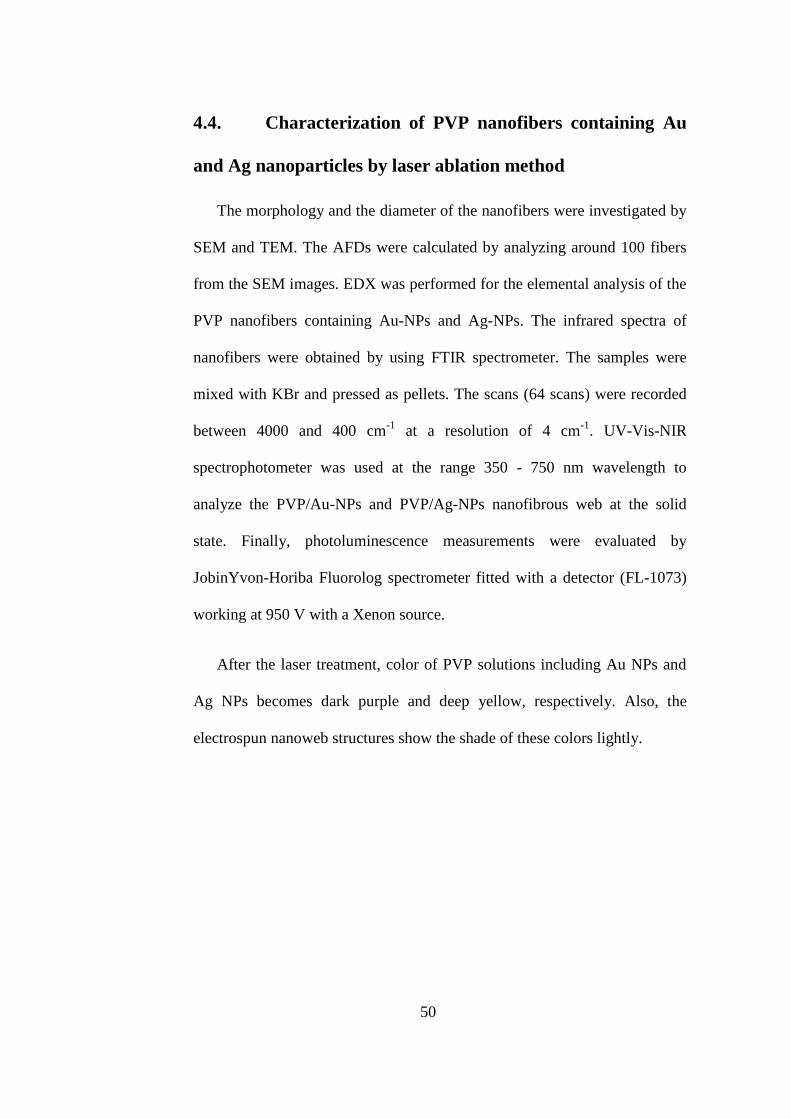
Figure 31 The representative (a), (b) SEM images of PVP/Au-NPs; (c), (d) Sem
images of PVP/Ag-NPs nanofibers. Magnification: 5000x, 30000x ................. 51
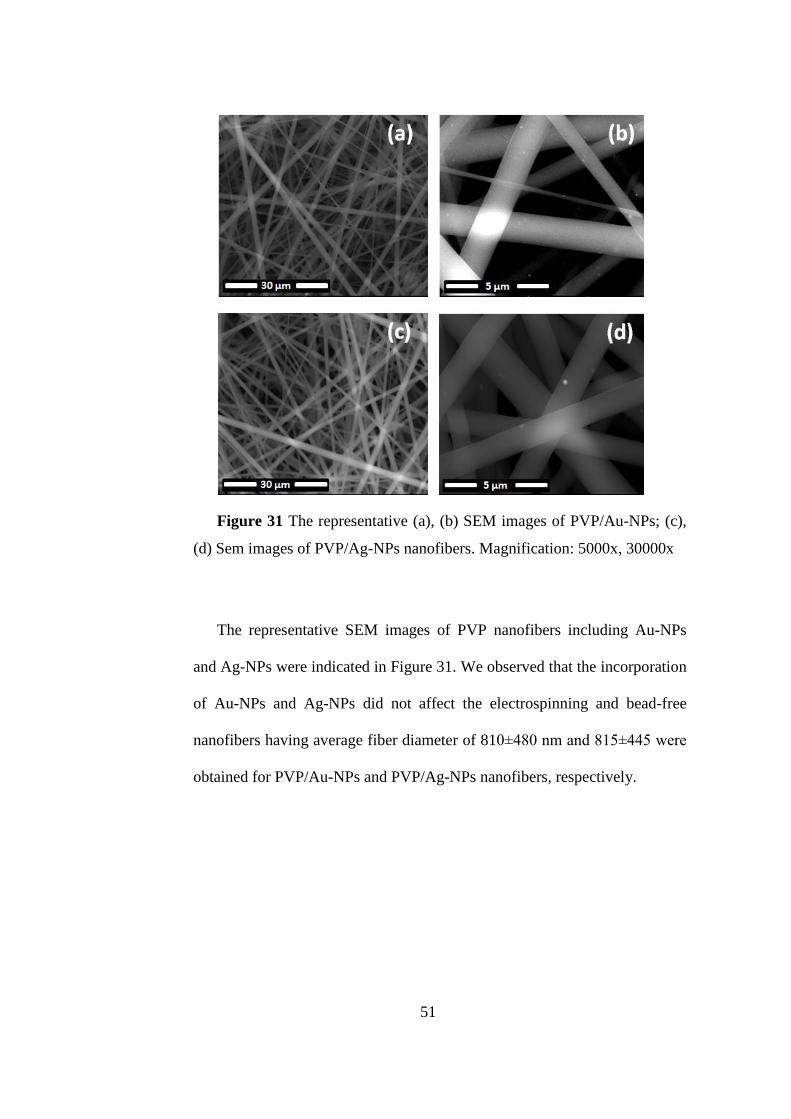
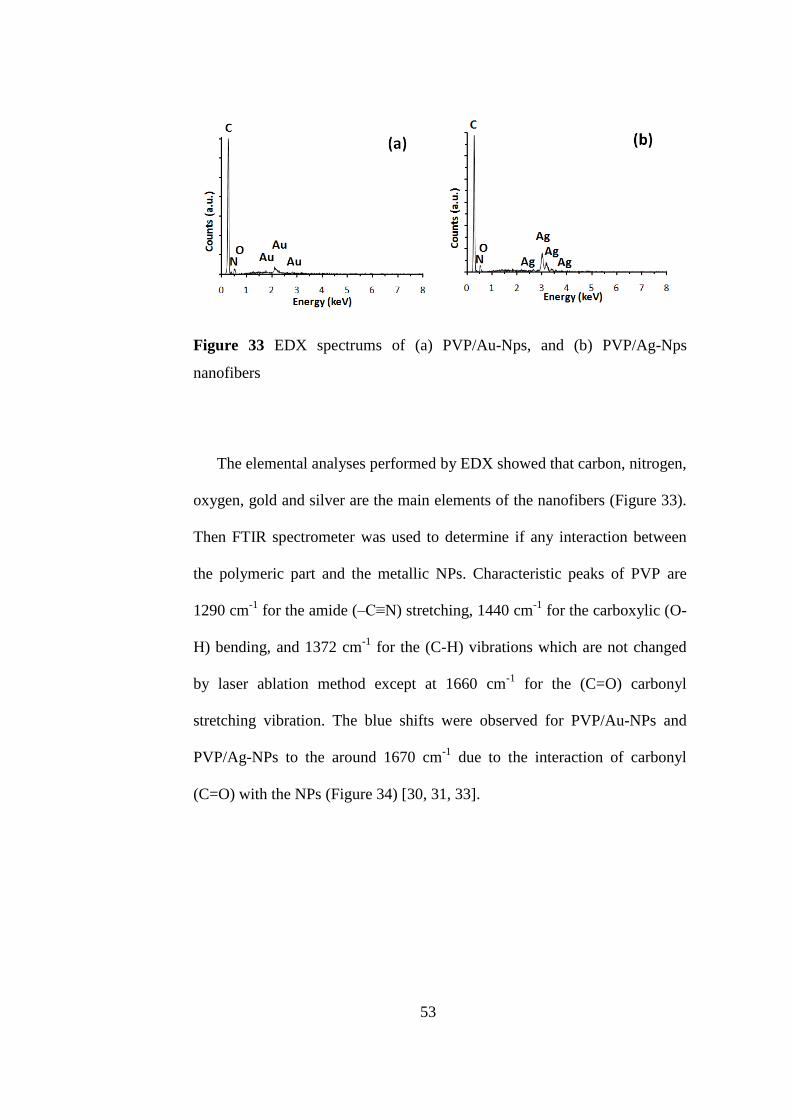
Figure 32 TEM images of (a) PVP/Au-Nps, and (b) PVP/Ag-Nps nanofibers . 52
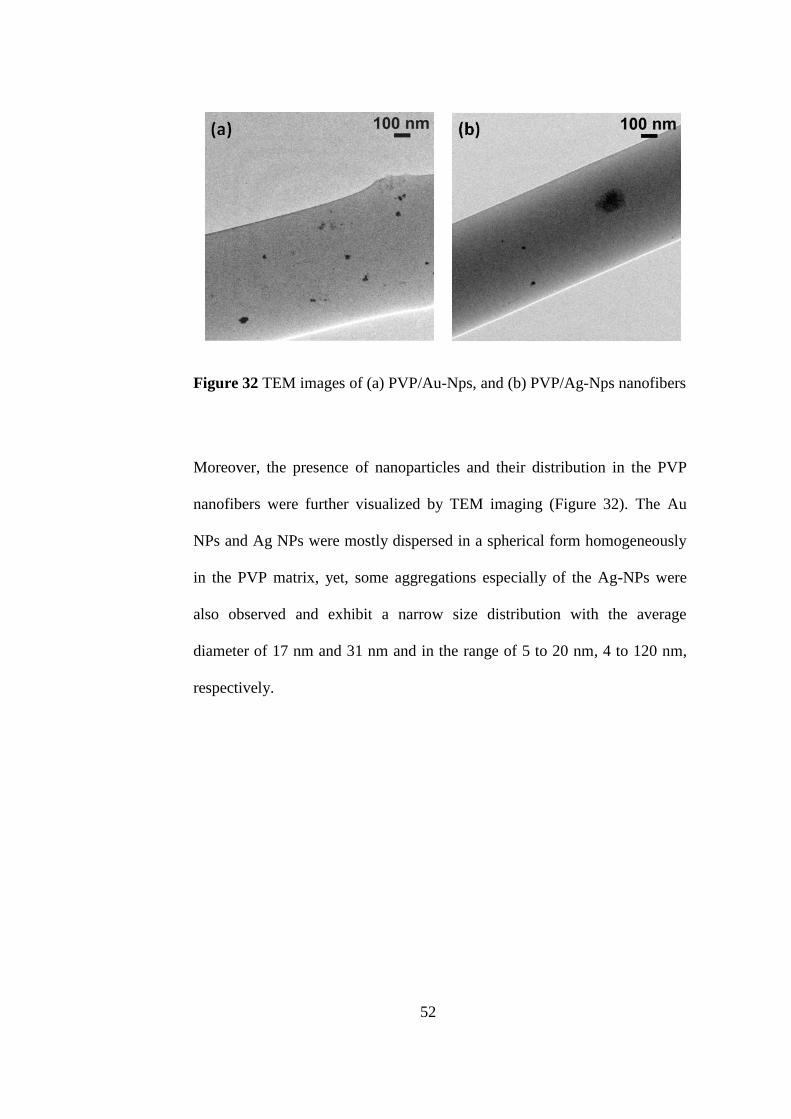
Figure 33 EDX spectrums of (a) PVP/Au-Nps, and (b) PVP/Ag-Nps nanofibers
............................................................................................................................ 53
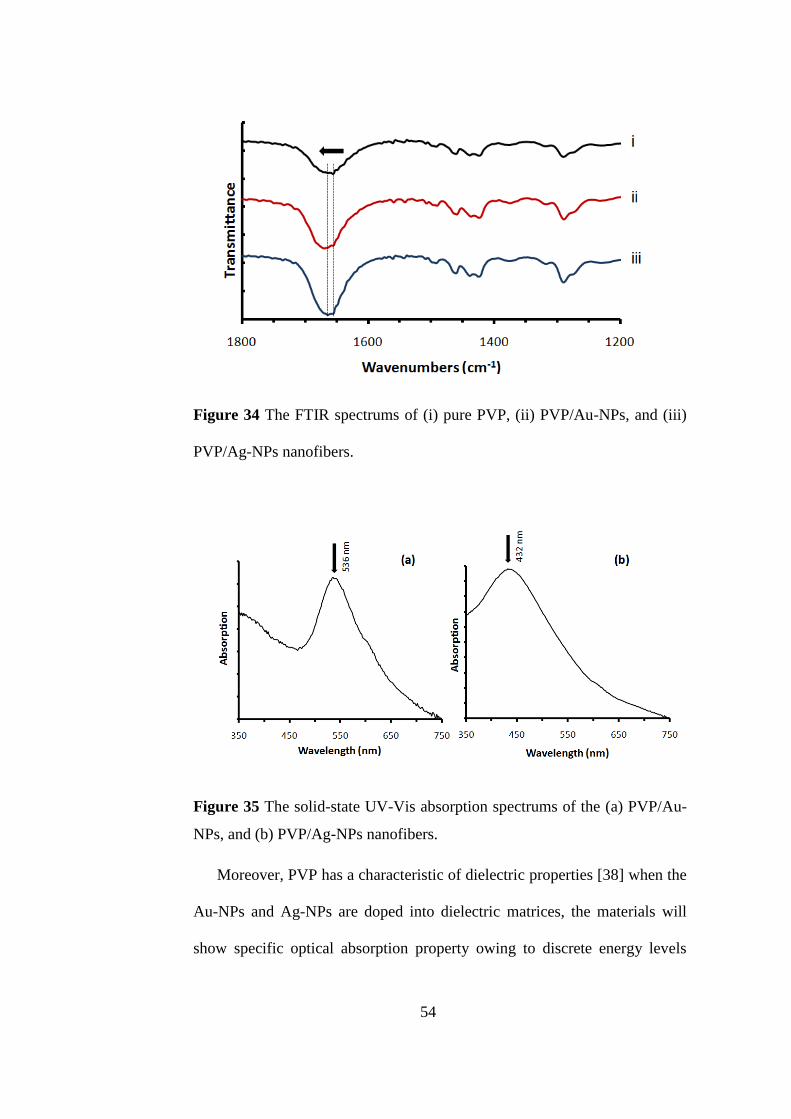
Figure 34 The FTIR spectrums of (i) pure PVP, (ii) PVP/Au-NPs, and (iii)
PVP/Ag-NPs nanofibers. .................................................................................... 54
Figure 35 The solid-state UV-Vis absorption spectrums of the (a) PVP/Au-NPs,
and (b) PVP/Ag-NPs nanofibers. ....................................................................... 54
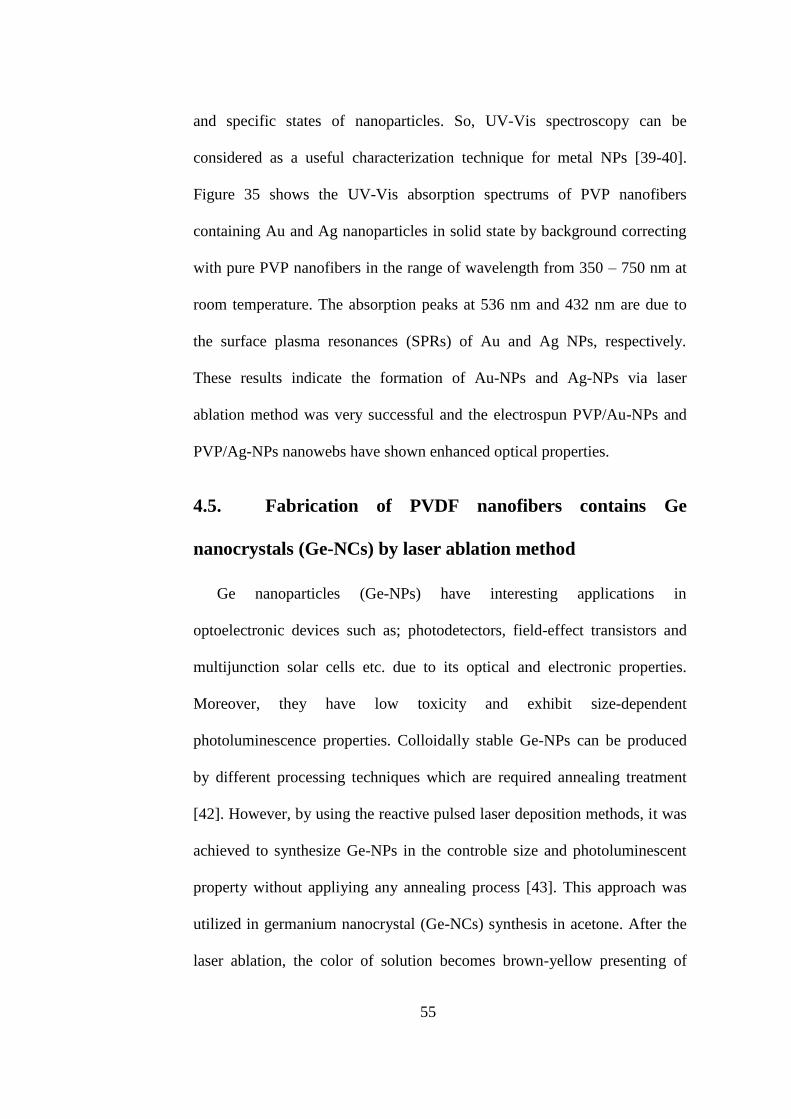
Figure 36 Schematic view of electrospun PVDF nanofibers containing Ge-NCs
............................................................................................................................ 56
Figure 37 (a) SEM image, (b) The fiber diameter distribution histogram, (c)
EDX spectrum, and (d) TEM image of PVDF/Ge-NCs composite nanofibers. 57
xiii
Figure 38 (a) UV-Vis absorption spectrums of Ge-NCs in acetone (black solid
line) and Ge-NCs/PVDF nanofibers (red dashed line) and (b) PL spectra of Ge-
NCs in acetone (black solid line) and Ge-NCs/PVDF nanofibers (red dashed
line) ..................................................................................................................... 58

xiv
LIST OF TABLES
Table 1 Thermal properties and crystallinity of PVDF/TiO2-SNF composite
nanofibers with different TiO2-SNF contents..................................................... 42
1
PART 1
INTRODUCTION
1.1. Electrospinning
Electrospinning is a versatile and cost-effective technique for the
production of multi-functional nanofibers from various polymers, polymer
blends, composites, sol-gels, ceramics, etc. [1]. The basic principle of this
technique is based on generating the direct movement of charged molecules
by applying high voltage to supply the ejection of a liquid jet through
spinneret from polymer solution droplet [2].
Figure 1 Schematic view of electrospinning
2
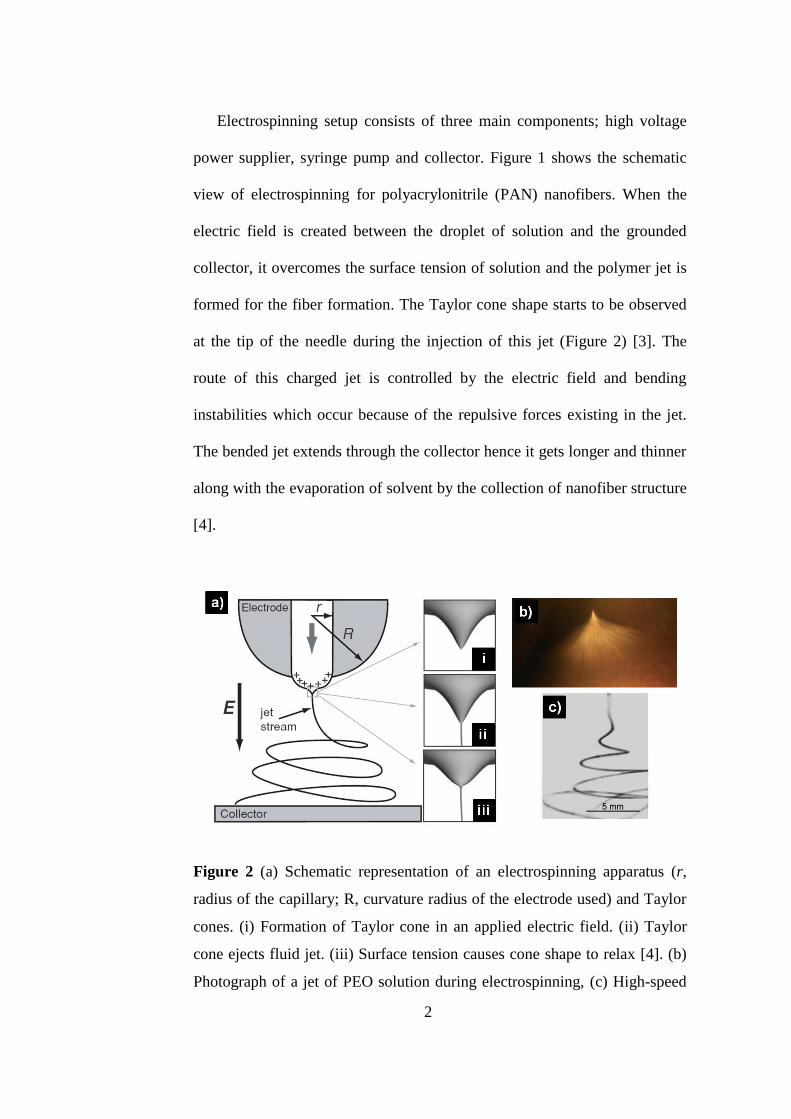
Electrospinning setup consists of three main components; high voltage
power supplier, syringe pump and collector. Figure 1 shows the schematic
view of electrospinning for polyacrylonitrile (PAN) nanofibers. When the
electric field is created between the droplet of solution and the grounded
collector, it overcomes the surface tension of solution and the polymer jet is
formed for the fiber formation. The Taylor cone shape starts to be observed
at the tip of the needle during the injection of this jet (Figure 2) [3]. The
route of this charged jet is controlled by the electric field and bending
instabilities which occur because of the repulsive forces existing in the jet.
The bended jet extends through the collector hence it gets longer and thinner
along with the evaporation of solvent by the collection of nanofiber structure
[4].
Figure 2 (a) Schematic representation of an electrospinning apparatus (r,
radius of the capillary; R, curvature radius of the electrode used) and Taylor
cones. (i) Formation of Taylor cone in an applied electric field. (ii) Taylor
cone ejects fluid jet. (iii) Surface tension causes cone shape to relax [4]. (b)
Photograph of a jet of PEO solution during electrospinning, (c) High-speed
3
photograph of jet instabilities [5]. These figures were adapted from [4,5]
with permission.
1.2. Parameters of electrospinning
In electrospinning process, the morphology and uniformity of nanofibers
are determined by considering a number of parameters which are
investigated under two main parts: a) polymer/solution properties such as
molecular weight, molecular weight distribution, viscosity, conductivity,
dielectric constant, surface tension; and b) set-up parameters such as the
electric field, the flow rate of solution, tip-to-collector distance. Moreover,
the ambient parameters (temperature, humidity and air velocity in the
chamber) may affect the formation of nanofibers.
The polymer/solution properties have the most important influence on
the electrospinning process. For instance, the molecular weight of polymer
type and the concentration of polymer solution should be high enough to
provide the viscosity that is required for the curicial point of electrospinning;
chain entanglement. It supplies the resistance also continuity of jet not to
break into droplets and so prevents the bead formation during the process.
4
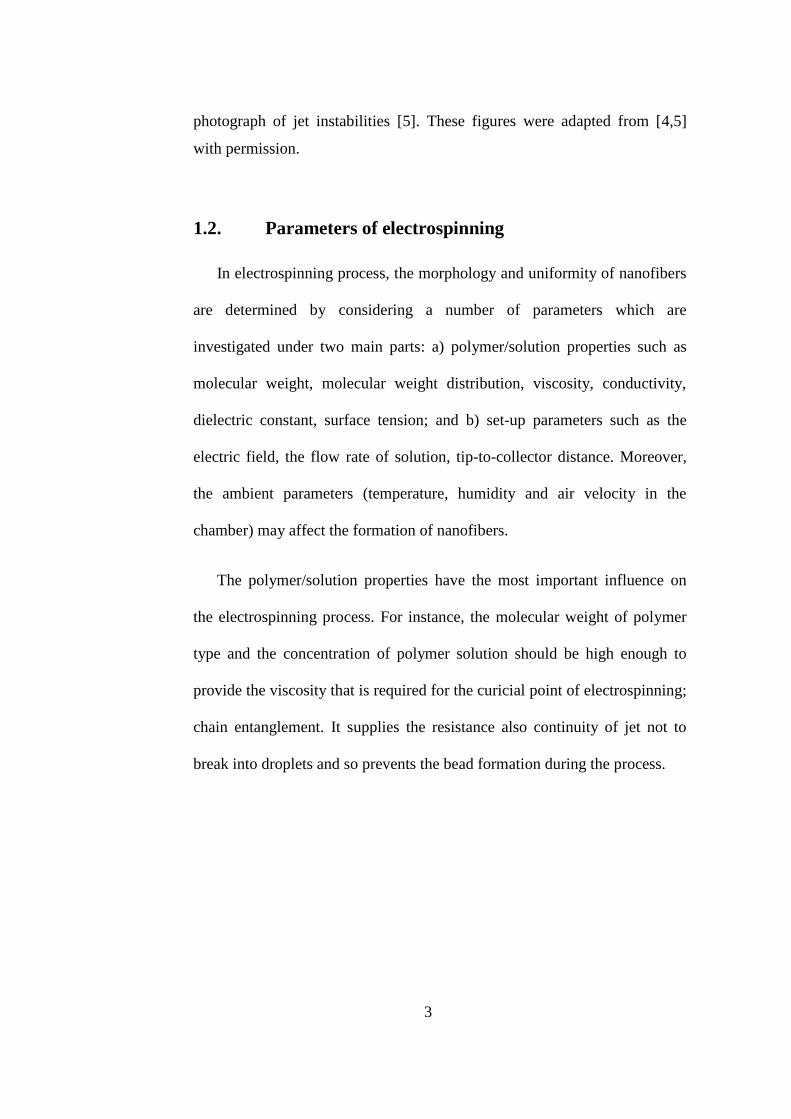
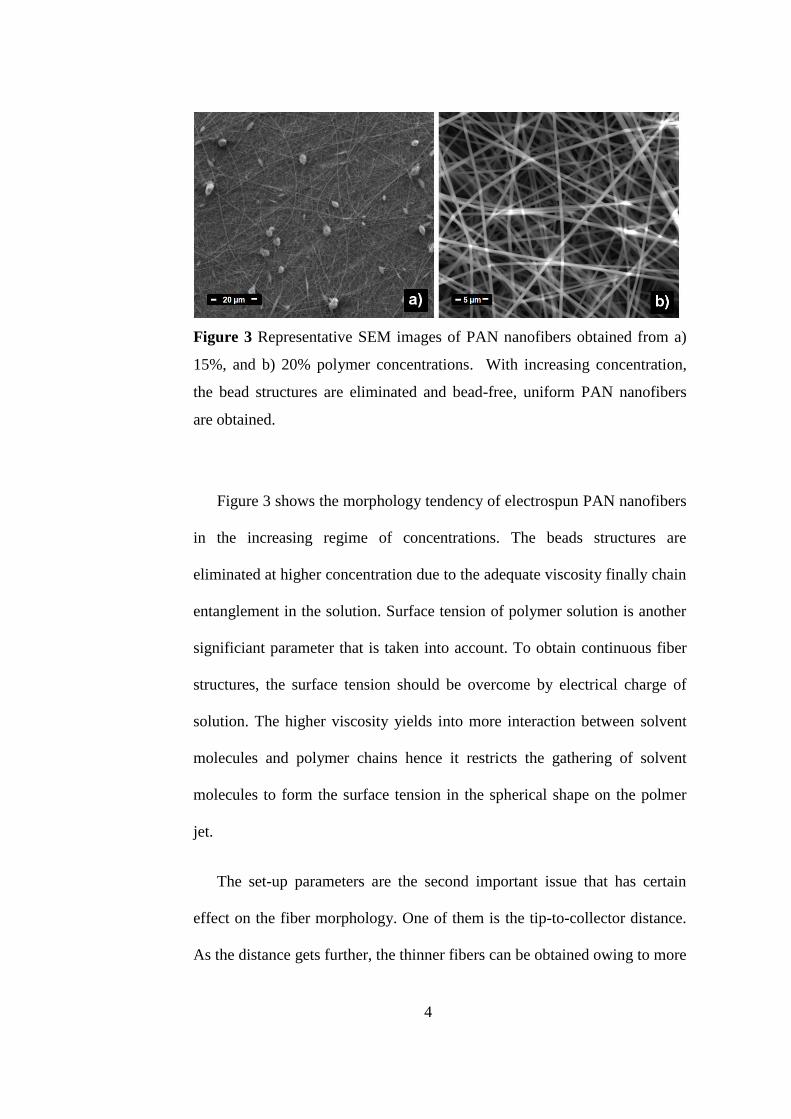
Figure 3 Representative SEM images of PAN nanofibers obtained from a)
15%, and b) 20% polymer concentrations. With increasing concentration,
the bead structures are eliminated and bead-free, uniform PAN nanofibers
are obtained.
Figure 3 shows the morphology tendency of electrospun PAN nanofibers
in the increasing regime of concentrations. The beads structures are
eliminated at higher concentration due to the adequate viscosity finally chain
entanglement in the solution. Surface tension of polymer solution is another
significiant parameter that is taken into account. To obtain continuous fiber
structures, the surface tension should be overcome by electrical charge of
solution. The higher viscosity yields into more interaction between solvent
molecules and polymer chains hence it restricts the gathering of solvent
molecules to form the surface tension in the spherical shape on the polmer
jet.
The set-up parameters are the second important issue that has certain
effect on the fiber morphology. One of them is the tip-to-collector distance.
As the distance gets further, the thinner fibers can be obtained owing to more
5
stretching time during the collecting of nanofibers. Otherwise, the closer
distance between needle and collector causes coarse fiber formation or
collapsing problem with the insufficient solvent evaporation. The other most
decisive parameter of electrospinning process is applied voltage. The
increasing voltage leads to decreasing at fiber diameter because fibers are
exposed to more stretching under high electrical field. However, in the case
of higher voltage, the fiber diameter indicates increasing because of the
higher amount of pumped polymer solution [1, 2, 6].
1.3. Electrospun nanofibers and their applications
The electrospinning process can be carried with any soluble synthetic or
natural polymer type having enough molecular weight. Electrospun
nanofibers are easily obtained from synthetic polymer types like; nylon,
polyesters, polyurethane etc. and also from natural polymers such as;
collagen, silk, chitosan, alginate, cellulose etc. [3]. Moreover, metal oxide
nanofibers are acquired by using suitable precursors in the polymer matrix.
Nanofibers are not only produced from unique structures. To attain from the
multifunctional properties of composite materials, they can also be
performed so as to be in blend form or can be combined with additives such
as; nanoparticles, drugs and different kinds of chemical components [1].
Nowadays, nanofibers have received considerable attention of materials
science due to their exclusive properties that can be implemented in specific
areas such as catalysis, filtration, nanocomposites, nanofibrous structures,
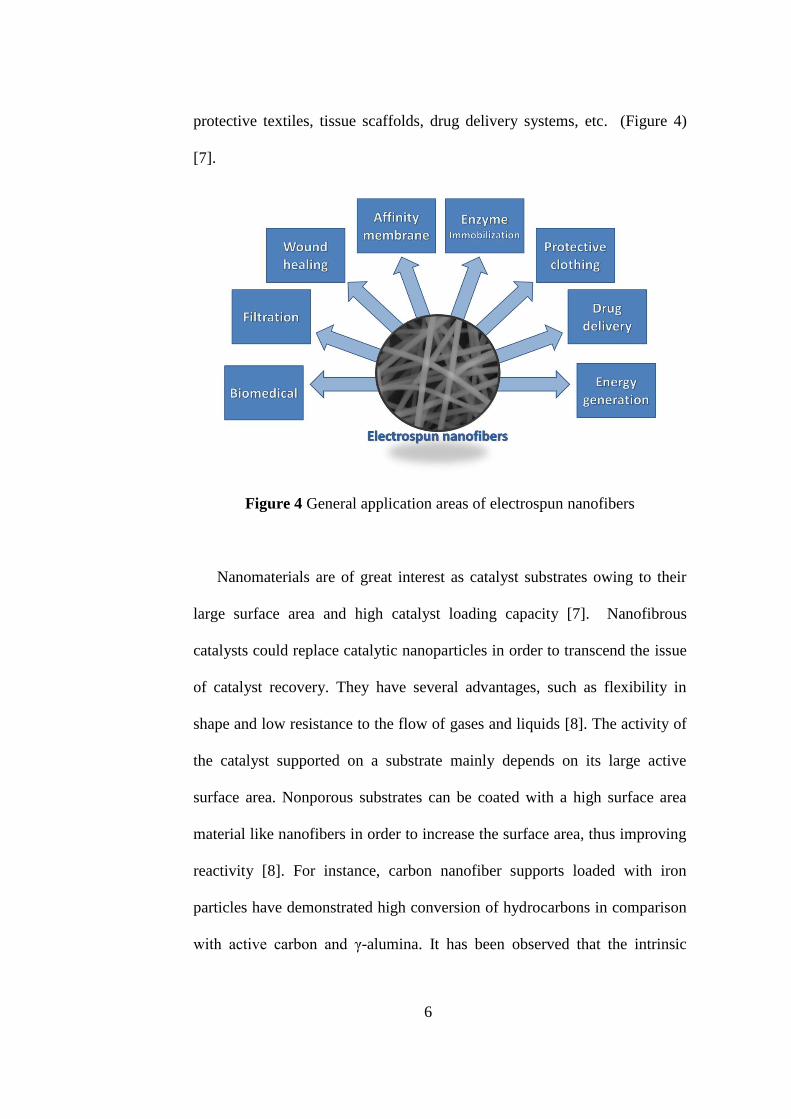
6
protective textiles, tissue scaffolds, drug delivery systems, etc. (Figure 4)
[7].
Figure 4 General application areas of electrospun nanofibers
Nanomaterials are of great interest as catalyst substrates owing to their
large surface area and high catalyst loading capacity [7]. Nanofibrous
catalysts could replace catalytic nanoparticles in order to transcend the issue
of catalyst recovery. They have several advantages, such as flexibility in
shape and low resistance to the flow of gases and liquids [8]. The activity of
the catalyst supported on a substrate mainly depends on its large active
surface area. Nonporous substrates can be coated with a high surface area
material like nanofibers in order to increase the surface area, thus improving
reactivity [8]. For instance, carbon nanofiber supports loaded with iron
particles have demonstrated high conversion of hydrocarbons in comparison
with active carbon and γ-alumina. It has been observed that the intrinsic
7
catalyst effect is more evident when loaded in smaller diameter fibers such
as nanofibers [7].
Filtration is another area where nanofibers have been implemented.
Polymeric nanofibers have been utilized in air filtration applications for
more than a decade [8]. The small fiber diameters cause slip flows at fiber
surfaces, causing an increase in the interception and inertial impaction
efficiencies of these composite filter media. The enhanced filtration
efficiency at the same pressure drop becomes feasible with fibers having
diameters less than 0.5 micron. The implementation of nanofiber networks
as a filtering medium holds promising potential. Keeping in mind that the
essential features of protective clothing are high atmospheric moisture
transport, increased fabric breathability, and enhanced toxic chemical
resistance, electrospun nanofiber membranes stand as good candidates for
these applications. The highly porous electrospun membrane surfaces aid in
moisture vapor transport [7].
Moreover, tissue scaffolds and drug delivery are other well-known
application areas of nanofibers. Nanofibers with high surface area and
porosity have enormous potential for applications in engineering
mechanically stable and biologically functional tissue scaffolds. The tissue
scaffolding material must be selected carefully to ascertain its
biocompatibility with the body cells. The biocompatibility depends on the
surface chemistry of the scaffolds, which is dictated by the material
properties [9]. The high surface to volume ratio of the nanofiber provides
8
more space for the cell attachment than the regular fibers. The dimensions of
these engineered scaffolds were in the comparable scale with those of the
natural extra cellular matrix. Electrospun biodegradable polymers are
considered as suitable scaffolds for tissue engineering, with their big pore
diameter and volume. The high porosity of the electrospun nanofiber
scaffolds provides enough space for the cell accommodation and an easy
passage for the nutrients and metabolic waste excretion. Mechanical
properties like elasticity modulus and strain at failure are important for the
application of electrospun nanofibers as tissue scaffolds [7, 9]. Moreover,
nanofiber mats with their unique functional characteristics find application
as drug carriers for the drug delivery system. Controlled delivery of drugs at
a defined rate over a span of treatment is possible with biocompatible
delivery matrices of either biodegradable or nonbiodegradable polymers
[10].
In addition, electrospun nanofiber membranes also stand as potential
candidates for protective clothing applications, because of their light weight,
large surface area, high porosity, great filtration efficiency, effective
resistance to penetration of harmful chemical agents in aerosol form and
their ability to neutralize the chemical agents without impedance of the air
and humidity permeability. Many methods for modification of nanofiber
surfaces have been tried in order to achieve improvement in protection
against toxins and one of the protection methods that has been used includes
chemical surface modification and attachment of reactive moieties such as
oximes, cyclodextrins, and chloramines [3].
9
Polymeric conductive membranes have enormous potential for
applications such as, photovoltaic devices, electrostatic dissipation,
corrosion protection, electromagnetic interference shielding, fabrication of
electronic devices and sensors. Conductive membranes comprised of
nanofibers can also be implemented for use as porous electrodes in
developing high performance batteries and polymer electrolyte membrane
fuel cells, due to their high porosity and inherent large surface area.
Conductive nanofibers offer valuable properties of polymer batteries, for
instance, reduced electrolyte leakage, high dimension flexibility, and high
energy density per unit mass [3].
As is evident from the aforementioned brief discussion on the
applications of nanofibers, the potential of nanostructured materials in
advanced applications is highly promising (Figure 4). Researchers are
constantly making efforts to exploit the high surface area and porosity
properties to develop sophisticated state of art materials.
10
PART 2
CHAPTER I. INORGANIC NANOFIBERS
2.1. Inorganic nanofibers
Inorganic nanomaterials exhibit extraordinary chemical and physical
features such as magnetic, electrical, optical and catalytic properties. There
are numerous methods including; deposition, ball milling technique,
synthesis in reversed micelles, Langmuir–Blodgett film, and self-assembled
monolayers. In additon to these methods, combining the sol-gel processing
and electrospinning technique enables us to produce inorganic nanofibers in
a very practical manner. That method can be summarized with three steps;
Firstly, a sol with suitable inorganic precursor and polymer system were
prepared. Secondly, electrospinning procedure was applied with suitable
parameters. Finally, inorganic nanofibers were obtained by calcinating the
polymeric carrier matrix. For instance, titanium dioxide (TiO2), silicon
dioxide (SiO2), zinc oxide (ZnO), aluminum oxide (Al2O3) and zirconium
dioxide (ZrO2) are the most commonly known metal oxide nanofiber types
obtained by this method. Due to their high specific surface area, more active
sites, abundant inner spaces and heterogenous interfaces, inorganic
nanofibers show superiority according to their bulk form in terms of
electrical, optical and catalytic properties. Especially TiO2 nanofibers can be
more efficiently employed as photoanodes for dye-sentisized solar cells,
11
anode material for lithium-ion batteries and photocatalysts for filtration
membranes [11, 12, 43].
2.2. Photocatalytic activity
The acceleration of photoreaction with the help of catalyst is called as
photocatalysis. During the reaction, a substrate absorbs light and creates
electron hole pairs that have ability to generate free radicals. The materials
having photocatalytic property can be used for the destruction of organic
pollutants in the water. Over the years, a large number of metal oxides have
been utilized as photocatalysts for this purpose. The most commonly studied
ones are TiO2 and ZnO because of their high photosensitivity, nontoxic
nature and large band gap. Due to their properties, both of them have the
availability to be used for the detoxification of water from organic
pollutants. When aqueous solution of TiO2 is irradiated with photons whose
energy is equal to or greater than its band gap energy (Eg = 3.2 eV) i.e., with
λ < 380 nm, electron-hole pairs are developed (Figure 5).
TiO2 + hv TiO2 (e- + h
+)
Then, the hole produced by UV-light reacts with H2O or surface-bound
hydroxyl ion to produce OH• radicals which is the most oxidizing species in
this process.
TiO2 (h+) + H2O HO• + H
+
TiO2 (h+) + OH
- HO•
12
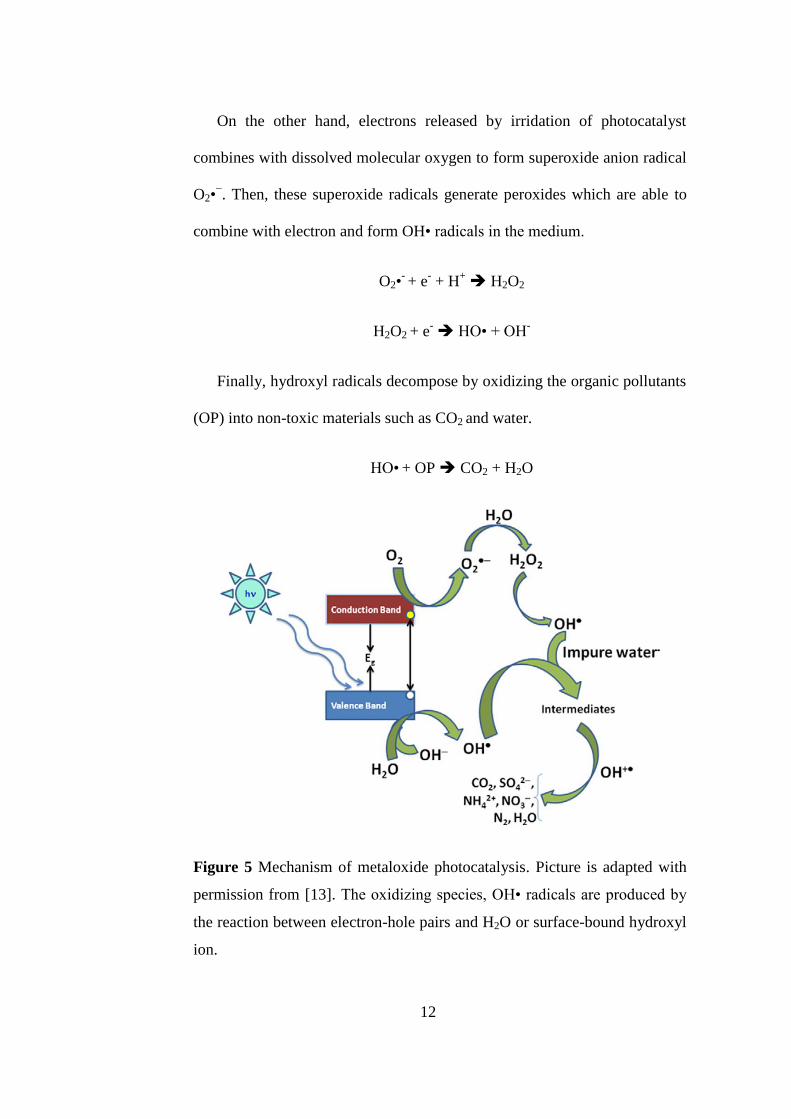
On the other hand, electrons released by irridation of photocatalyst
combines with dissolved molecular oxygen to form superoxide anion radical
O2•−. Then, these superoxide radicals generate peroxides which are able to
combine with electron and form OH• radicals in the medium.
O2•- + e
- + H
+ H2O2
H2O2 + e- HO• + OH
-
Finally, hydroxyl radicals decompose by oxidizing the organic pollutants
(OP) into non-toxic materials such as CO2 and water.
HO• + OP CO2 + H2O
Figure 5 Mechanism of metaloxide photocatalysis. Picture is adapted with
permission from [13]. The oxidizing species, OH• radicals are produced by
the reaction between electron-hole pairs and H2O or surface-bound hydroxyl
ion.
13
ZnO is also considered as a suitable photocatalytic agent due to its
similar mechanism and bandgap energy with TiO2. Moreover, it is one-up
owing to its low cost, absorption ability of larger fraction at UV spectrum
and avaibility to be used in commercial range in higher efficiency especially
for herbicides and pesticides [10-12].
2.3. Materials
Titanium (IV)-isopropoxide (97%, Aldrich), zinc acetate dihydrate
(reagent grade, Aldrich), glacial acetic acid (% 100, Merck), ethanol (≥
99.8%, Sigma-Aldrich), dimethylformamide (DMF) (Riedel, Pestenal),
polyvinylpyrrolidone (PVP, Mw~1300000, Aldrich) were used as-received
without any further purification.
2.4. Electrospinning unit at UNAM
Electrospinning unit at UNAM consists of syringe pump, high voltage
supply, and a collector (Figure 6). Syringe pump (Model: SP 101IZ, WPI) is
situated horizontally, and electric field was comprised by the high voltage
power supply (Matsusada Precision, AU Series, Japan). Mostly, electrospun
nanofibers were deposited on a grounded stationary cylindrical metal
collector covered by a piece of aluminum foil. The electrospinning was
carried out in enclosed Plexiglas box. That box is suctioned by portative
hood for protection from hazardous solvents. Inside temperature and relative
humidity are monitored by scientific wireless thermo-hygrometer
(Honeywell, TM0005-X).
14
Figure 6 Electrospinning unit at UNAM consists of a) syringe pump, b) high
voltage supply, and c) collector.
2.5. Fabrication of titanium dioxide (TiO2) nanofibers
via electrospinning
Firstly, solvent system was prepared by mixed with glacial acetic acid (2
ml) and ethanol (2 ml). Then, titanium (IV)-isopropoxide (2.88 ml) as a
precursor was added into this solvent system. After stirring for 10 min,
carrier polymer in electrospinning process which is PVP (0.6 g) dissolved in
ethanol (3 ml) was added to this solution. Finally, the mixture was constantly
stirred for 12 hours until the yellowish sol-gel was obtained.
For electrospinning process, the PVP solution which contains TiO2 sol
precursor was placed into a 1 ml syringe having metallic needle tip (inner
diameter=0.4 mm). The syringe pump was used horizontally to feed the
polymeric solution. The electrical field was generated by using high voltage
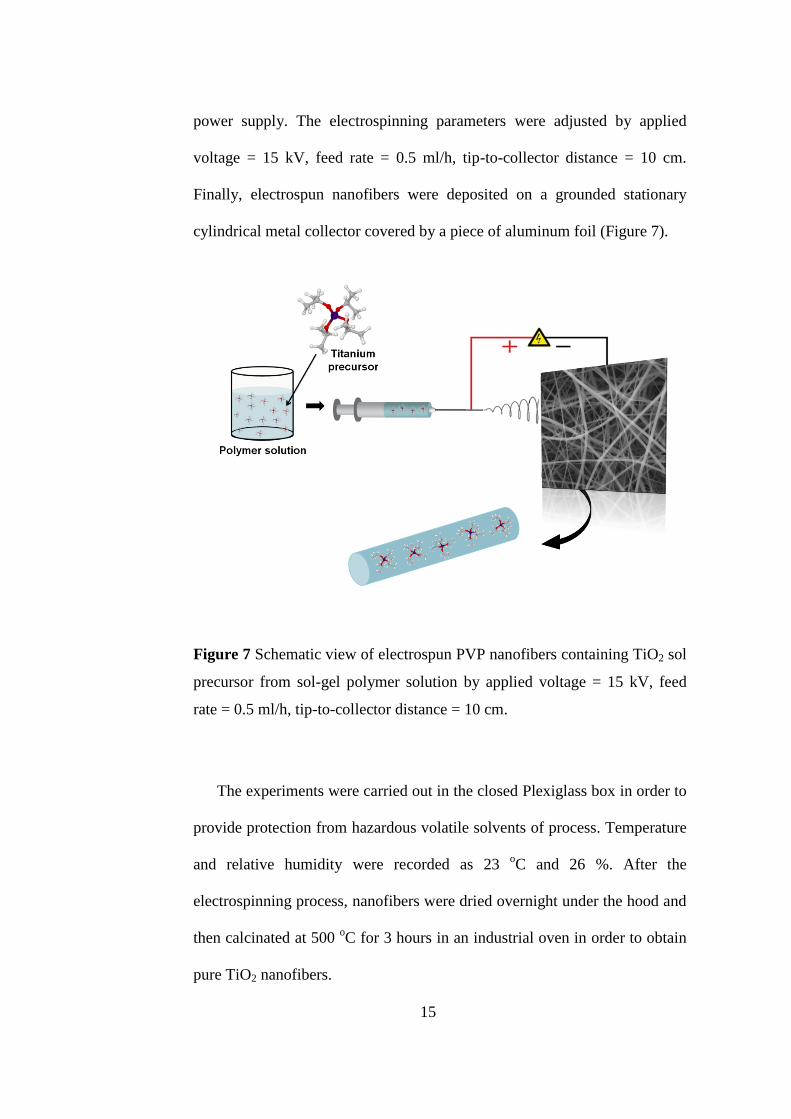
15
power supply. The electrospinning parameters were adjusted by applied
voltage = 15 kV, feed rate = 0.5 ml/h, tip-to-collector distance = 10 cm.
Finally, electrospun nanofibers were deposited on a grounded stationary
cylindrical metal collector covered by a piece of aluminum foil (Figure 7).
Figure 7 Schematic view of electrospun PVP nanofibers containing TiO2 sol
precursor from sol-gel polymer solution by applied voltage = 15 kV, feed
rate = 0.5 ml/h, tip-to-collector distance = 10 cm.
The experiments were carried out in the closed Plexiglass box in order to
provide protection from hazardous volatile solvents of process. Temperature
and relative humidity were recorded as 23 oC and 26 %. After the
electrospinning process, nanofibers were dried overnight under the hood and
then calcinated at 500 oC for 3 hours in an industrial oven in order to obtain
pure TiO2 nanofibers.
16
2.6. Characterization techniques
Scanning electron microscope (SEM) (FEI - Quanta 200 FEG) and
transmission electron microscope (TEM) (FEI - Tecnai G2F30) were used
for the morphological investigation of the nanofibers. The fiber diameter
range and the average fiber diameter were determined from the SEM images
and around 100 fibers were analyzed. Energy dispersive X-ray (EDX) was
performed for the elemental analysis of the TiO2 and ZnO nanofibers. The
X-ray diffraction (XRD) patterns for these metal oxide nanofibers were
obtained by using PAN analytical X’Pert Powder diffractometer with Cu Kα
radiation in a range 2θ=10o-70
o. UV-Vis-NIR spectrophotometer (Varian
Cary 5000) was used to analyze photocatalytic degradation of Rhodamine-
6G and methylene blue dye solutions including TiO2 and ZnO nanofibers,
respectively.
2.7. Characterization of TiO2 nanofibers
The representative SEM images and fiber diameter distributions of the
electrospun nanofibers of PVP/precursor and TiO2 are shown in Figure 8.
Bead-free nanofibers of PVP/precursor (Figure 8-a) and TiO2 (Figure 8-c)
were obtained with diameters in the range of 60-850 nm (Figure 8-b) and 40-
500 nm (Figure 8-d) having average fiber diameter of 300±130 nm and
200±120 nm, respectively.
17
Figure 8 SEM images of the electrospun nanofibers of (a) PVP/precursor
and (c) TiO2 nanofibers and diameter ranges of (b) PVP/precursor and (d)
TiO2 nanofibers.
SEM findings suggest that diameter of composite materials decreases by
removal of organic component (PVP) by calcination at 500 oC for 3 hours.
During the calcination process of PVP/titanium precursor, the material
maintained its fibrous structures and brittle TiO2 nanofibers were obtained
and the energy dispersive X-ray spectroscopy (EDX) analyses of TiO2
nanofibers were performed (Figure 9). The elemental mapping of TiO2
nanofibers by EDX showed that titanium and oxygen are the main elements
of the nanofibers.
18
Figure 9 (a) SEM image, (b)-(c) elemental maps and (d) EDX spectrum of
TiO2 nanofibers showing that titanium and oxygen are the main elements of
the nanofibers.
The crystalline structure of TiO2 nanofibers was identified by X-ray
diffraction (XRD). Figure 10 has shown the XRD of TiO2 nanofibers with
series of diffraction peaks corresponding to anatase phase which is known
for its photocatalytic activity. The salient peak at 2θ=25.4o corresponds to
the (101) plane of the anatase TiO2 structure and the other peaks at 2θ=38.1o,
48.4o, 54.3
o, 55.3
o, 63.0
o, 69.1
o, correspond to the diffraction of (004), (200),
(105), (211), (204), (116), and (220) planes, respectively [16]. XRD pattern
of the TiO2 nanofibers has no diffraction peak at 2θ=27.5o which is
characteristic for the rutile phase signifying that calcination process yielded
TiO2 nanofibers having pure anatase structure.
19
Figure 10 XRD pattern of TiO2 nanofibers having pure anatase structure
2.8. Photocatalytic activity of TiO2 nanofibers
The photocatalytic degradation of rhodamine-6G dye solution was used
as a model photoreaction and its degradation was followed by the UV-Vis
absorption measurement of the solution containing TiO2 nanofibers by using
UV treatment with 254 nm wavelength for 14 hours. They are placed into
quartz cuvettes (10.00 mm, Hellma) with a distance of 5 cm from the UV
source (8 W, UVLMS-38 EL). At known time intervals, the dye
concentration was measured by using UV-Vis-NIR spectrophotometer.
When rhodamine 6G solution containing TiO2 nanofibers was exposed to
UV light, we observed that the solution turned colorless. The change in the
absorbance on the UV-Vis spectrum of the Rh-6G solution containing TiO2
nanofibers as a function of the UV irradiation time is shown in Figure 11-a.
20
Rhodamine 6G with TiO2 nanofibers as a catalyst decomposed completely
after 14 hours under UV. Figure 11-b shows the rate (C/C0) of Rhodamine
6G degradation where C0 and C indicate the initial concentration of
rhodamine 6G before UV irradiation and after UV irradiation at time t,
respectively.
Figure 11 (a) UV-Vis spectrum of Rhodamine 6G solution containing TiO2
nanofibers, (b) the rate (C/C0) of Rhodamine 6G degradation by TiO2
nanofibers by exposing UV light with 254 nm wavelength for 14 hours.
21
2.9. Fabrication of zinc oxide (ZnO) nanofibers via
electrospinning
Firstly, PVP; carrier polymer (0.400 g) was dissolved in a solvent system
consisting of ethanol (2 ml) and DMF (2 ml). Then, zinc acetate (1.400 g)
was added into this polymeric solution. Finally, the mixture was constantly
stirred for one hour until the transparent solution was obtained.
For electrospinning process, the PVP solution containing zinc acetate
was placed into a 3 ml syringe having metallic needle tip (inner
diameter=0.6 mm). The syringe pump and high voltage power supply are the
same with previous experiments. The electrospinning parameters were
adjusted as applied voltage = 15 kV, feed rate = 0.5 ml/h, tip-to-collector
distance = 13 cm. Finally, electrospun nanofibers were deposited on a
grounded stationary cylindrical metal collector covered by a piece of
aluminum foil. The electrospinning was carried out in enclosed plexiglass
box and at 20 oC at 33 % relative humidity (Figure 12). The electrospun
nanofibers were dried overnight under the hood and then calcinated at
450 °C for 4 h in an oven in order to obtain pure ZnO nanofibers.
22
Figure 12 Schematic view of electrospun PVP nanofibers containing zinc
acetate by applied voltage = 15 kV, feed rate = 0.5 ml/h, tip-to-collector
distance = 13 cm.
2.10. Characterization of ZnO nanofibers
ZnO nanofibers are analyzed by SEM and EDX to investigate the
nanostructure and chemical composition. SEM images revealed that ZnO
nanofibers are obtained in grains morphology after the calcination of
PVP/zinc acetate composites web (Figure 13).
23
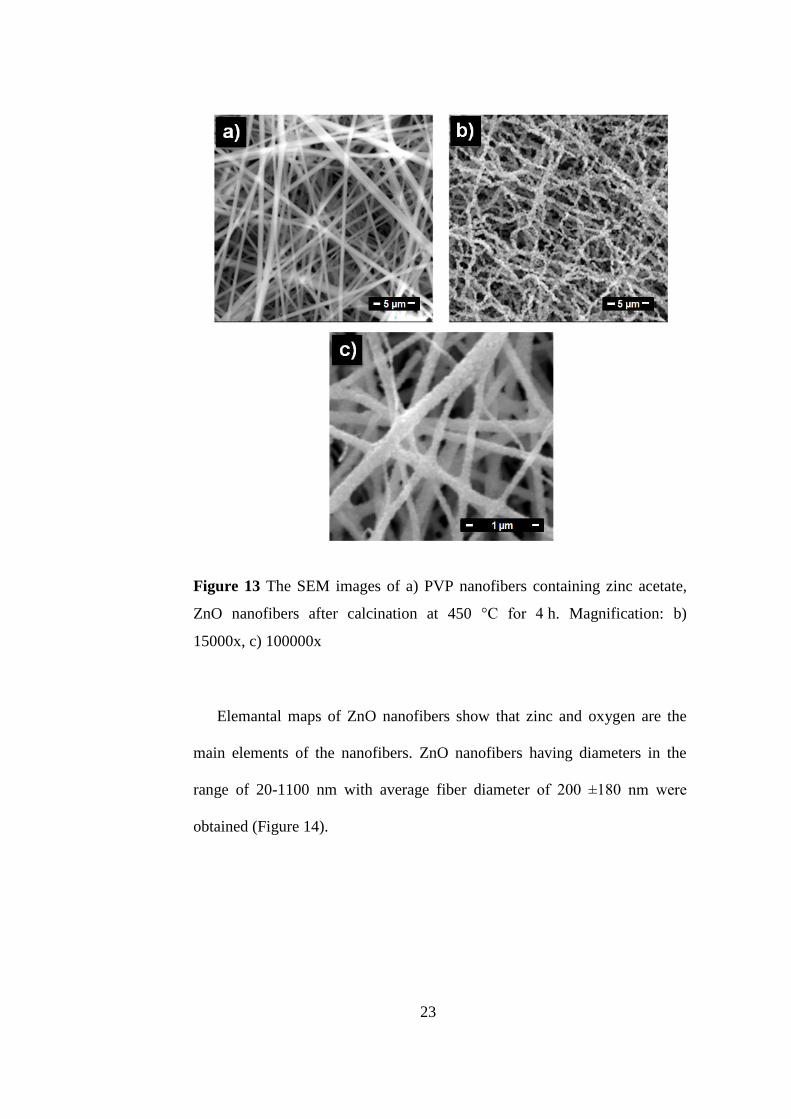
Figure 13 The SEM images of a) PVP nanofibers containing zinc acetate,
ZnO nanofibers after calcination at 450 °C for 4 h. Magnification: b)
15000x, c) 100000x
Elemantal maps of ZnO nanofibers show that zinc and oxygen are the
main elements of the nanofibers. ZnO nanofibers having diameters in the
range of 20-1100 nm with average fiber diameter of 200 ±180 nm were
obtained (Figure 14).
24
Figure 14 (a) SEM image, (b)-(c) elemental maps and (d) EDX spectrum of
ZnO nanofibers showing that zinc and oxygen are the main elements.
2.11. Photocatalytic activity of ZnO nanofibers
Photocatalytic activity of the ZnO nanofibers was evaluated by
measuring the photocatalytic degradation of methylene blue solution by
using UV treatment with 254 nm wavelength for 4 hours. They are placed
into quartz cuvettes with a distance of 5 cm from the UV source. At known
time intervals, the dye concentration was measured by using UV-Vis-NIR
spectrophotometer. After the UV treatment, the methylene blue solution
containing ZnO nanofibers become colorless (Figure 15-a). Changes in the
concentration of methylene blue with respect to time were examined by UV-
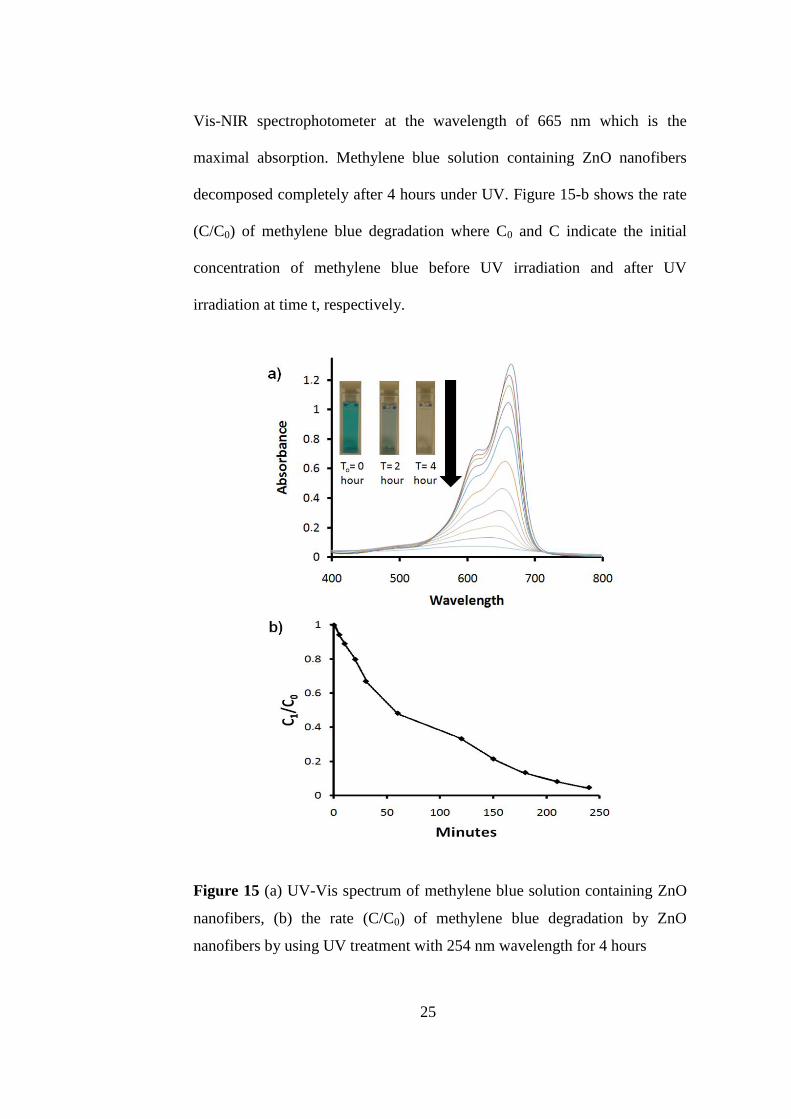
25
Vis-NIR spectrophotometer at the wavelength of 665 nm which is the
maximal absorption. Methylene blue solution containing ZnO nanofibers
decomposed completely after 4 hours under UV. Figure 15-b shows the rate
(C/C0) of methylene blue degradation where C0 and C indicate the initial
concentration of methylene blue before UV irradiation and after UV
irradiation at time t, respectively.
Figure 15 (a) UV-Vis spectrum of methylene blue solution containing ZnO
nanofibers, (b) the rate (C/C0) of methylene blue degradation by ZnO
nanofibers by using UV treatment with 254 nm wavelength for 4 hours
26
CHAPTER II. NANOCOMPOSITE NANOFIBERS
3.1. Nanocomposite nanofibers
Composites are prominent materials with their multifunctional properties
originated from the combination of two or more constituent materials with
their distinct physical and/or chemical features. These composite structures
generally have advantages in terms of mechanical, thermal, electrical,
optical, electrochemical and catalytic properties [45]. In the case of
nanocomposite production, the mentioned properties are significantly
improved due to the expectional high surface to volume ratio. Polymeric
matrix supplies the enchancement at the performance of composite materials
by capitalizing the properties of nanofillers so they are generally considered
as an excellent carrier for nanocomposite materials. However, to attain the
high performance composites, the good dispersion of nanofillers is required
in the polymeric media [46]. From this point of view, electrospun nanofibers
can be accepted as a great candidate to constitute carrier matrix that supplies
the homogenous dispersion of nanofillers. For instance, TiO2 nanoparticles
were incorporated into PVP nanofiber matrices via coupling sol–gel method
and electrospinning technique to achieve the production of photoluminescent
(PL), electroluminescent (EL) and non-linear optical devices [47]. On the
other hand, TiO2 can be produced in the form of both nanoparticles and
nanofiber but it was investigated that TiO2 nanofibers show higher
photocatalytic activity when it is compared to nanoparticle types so the
adding type of TiO2 was determined as short nanofibers because of the
27
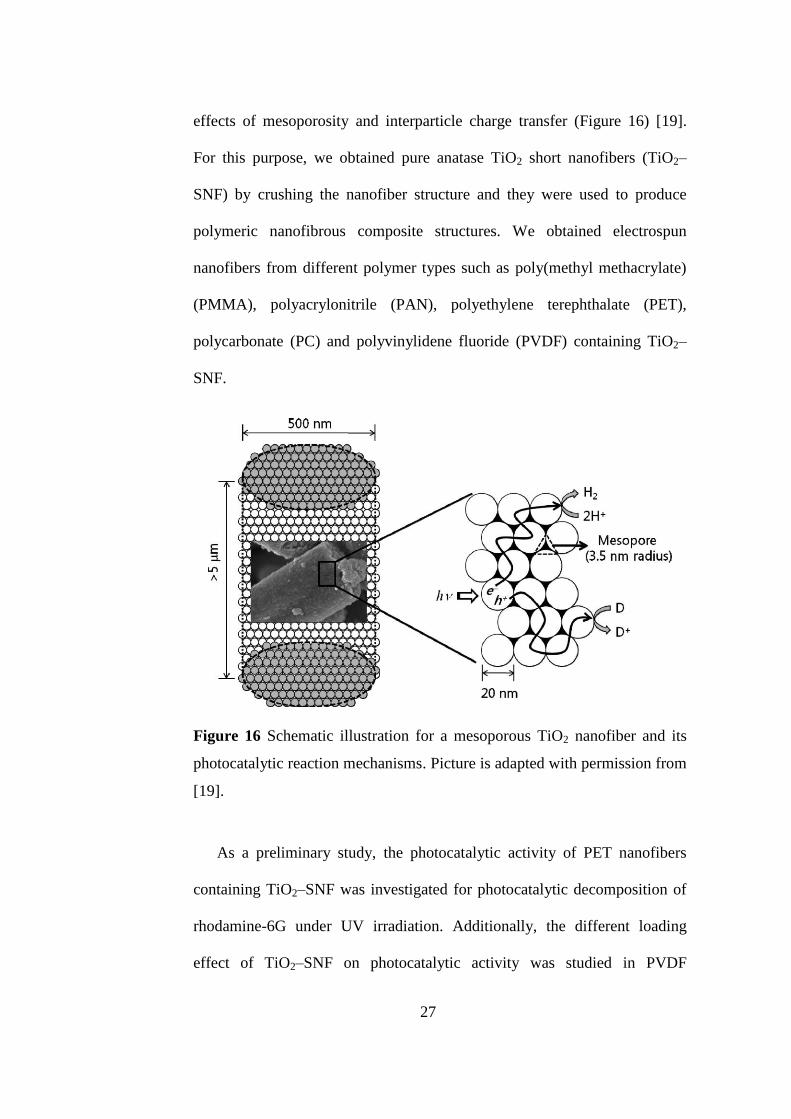
effects of mesoporosity and interparticle charge transfer (Figure 16) [19].
For this purpose, we obtained pure anatase TiO2 short nanofibers (TiO2–
SNF) by crushing the nanofiber structure and they were used to produce
polymeric nanofibrous composite structures. We obtained electrospun
nanofibers from different polymer types such as poly(methyl methacrylate)
(PMMA), polyacrylonitrile (PAN), polyethylene terephthalate (PET),
polycarbonate (PC) and polyvinylidene fluoride (PVDF) containing TiO2–
SNF.
Figure 16 Schematic illustration for a mesoporous TiO2 nanofiber and its
photocatalytic reaction mechanisms. Picture is adapted with permission from
[19].
As a preliminary study, the photocatalytic activity of PET nanofibers
containing TiO2–SNF was investigated for photocatalytic decomposition of
rhodamine-6G under UV irradiation. Additionally, the different loading
effect of TiO2–SNF on photocatalytic activity was studied in PVDF
28
nanofiber matrix which has the unique properties of nanofiber/nanoweb
systems. These examples are the very first reports showing that short metal
oxide nanofibers can be incorporated into polymeric nanofibers via
electrospinning. Such nanofibrous composite structures can be obtained from
different polymer types and will be applicable in various areas depending on
the polymer type and the function of metal oxides.
3.2. Materials
Titanium (IV)-isopropoxide (97%, Aldrich), glacial acetic acid (% 100,
Merck), ethanol (≥ 99.8%, Sigma-Aldrich), dimethylformamide (DMF)
(Riedel, Pestenal), tetrahydrofuran (THF) (≥ % 99.5, Sigma),
dichloromethane (DCM) (≥ %99, Sigma), trifluoroacetic acid (TFA) (% 99,
Sigma-Aldrich), polyvinylpyrrolidone (PVP, Mw~1300000, Aldrich),
poly(methyl methacrylate) (PMMA) (Mw~350000, Aldrich),
polyacrylonitrile (PAN) (donated by AKSA Co., Turkey), polyethylene
terephthalate (PET) (donated by Korteks Co., Turkey), polycarbonate (PC)
(Mw~64000, Aldrich), polyvinylidene fluoride (PVDF) (Kynar 761, donated
by Elf Atochem North America Inc.) were used as-received without any
further purification. The water was used from Millipore Milli-Q Ultrapure
Water System.
29
3.3. Electrospun polymeric nanofibrous composites
containing TiO2 short nanofibers (TiO2-SNF)
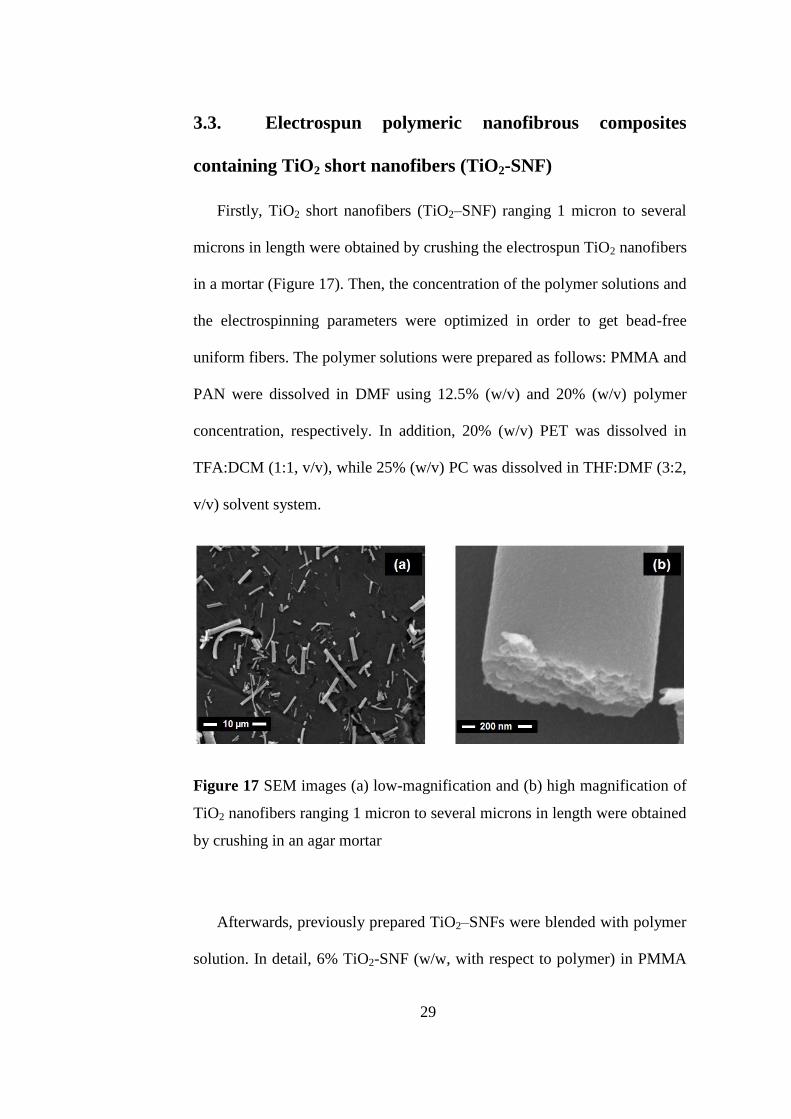
Firstly, TiO2 short nanofibers (TiO2–SNF) ranging 1 micron to several
microns in length were obtained by crushing the electrospun TiO2 nanofibers
in a mortar (Figure 17). Then, the concentration of the polymer solutions and
the electrospinning parameters were optimized in order to get bead-free
uniform fibers. The polymer solutions were prepared as follows: PMMA and
PAN were dissolved in DMF using 12.5% (w/v) and 20% (w/v) polymer
concentration, respectively. In addition, 20% (w/v) PET was dissolved in
TFA:DCM (1:1, v/v), while 25% (w/v) PC was dissolved in THF:DMF (3:2,
v/v) solvent system.
Figure 17 SEM images (a) low-magnification and (b) high magnification of
TiO2 nanofibers ranging 1 micron to several microns in length were obtained
by crushing in an agar mortar
Afterwards, previously prepared TiO2–SNFs were blended with polymer
solution. In detail, 6% TiO2-SNF (w/w, with respect to polymer) in PMMA
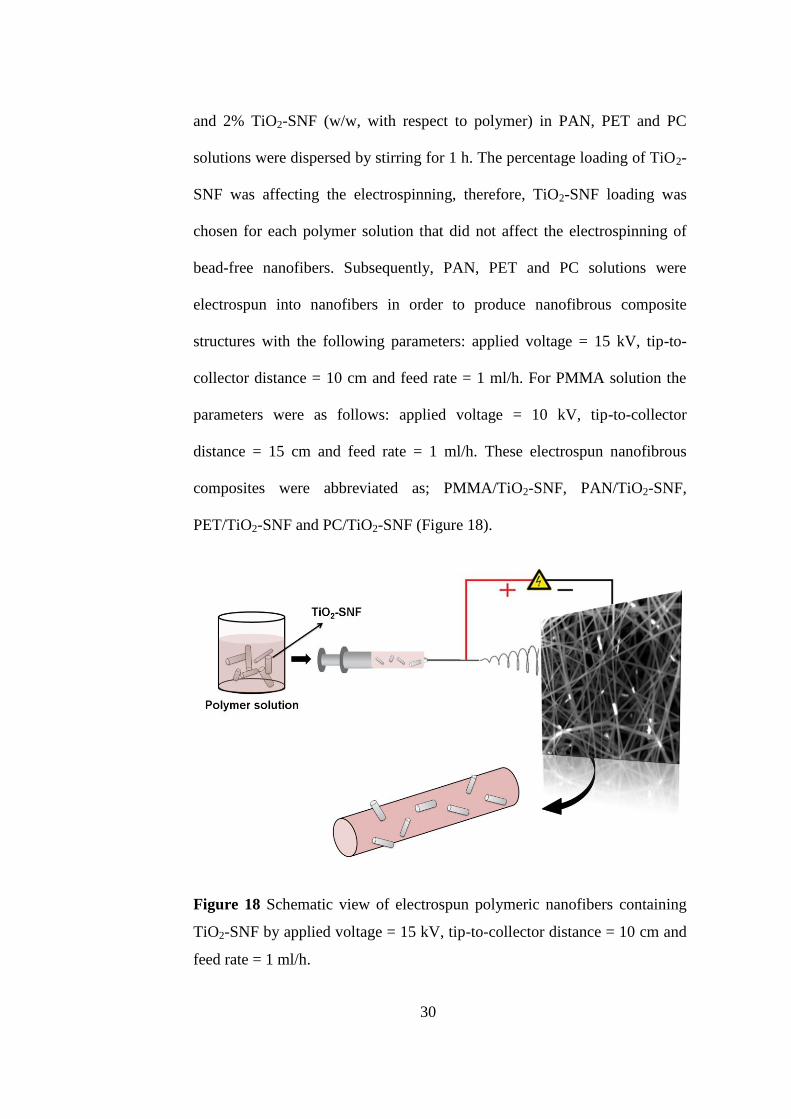
30
and 2% TiO2-SNF (w/w, with respect to polymer) in PAN, PET and PC
solutions were dispersed by stirring for 1 h. The percentage loading of TiO2-
SNF was affecting the electrospinning, therefore, TiO2-SNF loading was
chosen for each polymer solution that did not affect the electrospinning of
bead-free nanofibers. Subsequently, PAN, PET and PC solutions were
electrospun into nanofibers in order to produce nanofibrous composite
structures with the following parameters: applied voltage = 15 kV, tip-to-
collector distance = 10 cm and feed rate = 1 ml/h. For PMMA solution the
parameters were as follows: applied voltage = 10 kV, tip-to-collector
distance = 15 cm and feed rate = 1 ml/h. These electrospun nanofibrous
composites were abbreviated as; PMMA/TiO2-SNF, PAN/TiO2-SNF,
PET/TiO2-SNF and PC/TiO2-SNF (Figure 18).
Figure 18 Schematic view of electrospun polymeric nanofibers containing
TiO2-SNF by applied voltage = 15 kV, tip-to-collector distance = 10 cm and
feed rate = 1 ml/h.
31
Figure 19 SEM images of nanofibrous composites with (1) low
magnification and (2) high magnification: (a1)-(a2) PMMA/TiO2-SNF, (b1)-
(b2) PAN/TiO2-SNF, (c1)-(c2) PET/TiO2-SNF and (d1)-(d2) PC/TiO2-SNF.
32
The representative SEM images of these nanofibrous composites are
depicted in Figure 19. We observed that the incorporation of TiO2-SNF did
not affect the electrospinning of these polymers and bead-free nanofibers
were obtained in all cases.
Figure 20 TEM images of the PMMA/TiO2-SNF composite nanofibers
showing that some of the TiO2-SNF were fully covered by the polymeric
matrix whereas some TiO2-SNF were present on the surface of the polymeric
matrix.
We further analyzed these nanofibrous composites by TEM. The
representative TEM images of the PMMA/TiO2-SNF composite nanofibers
are given in Figure 20. SEM and TEM analyses revealed that some of the
TiO2-SNF were fully covered by the polymeric matrix whereas some TiO2-
SNF were present on the surface of the polymeric matrix and/or sticking out
from the polymeric matrix.
33
3.4. Photocatalytic activity of polyethylene terephthalate
(PET) nanofibers containing TiO2-SNF
As mentioned above, TiO2-SNF have anatase structure which is known
for its photocatalytic activity. As a preliminary study, we also investigated
the photocatalytic activity of PET/TiO2-SNF nanofibers. The photocatalytic
activity was analyzed by photodegradation of rhodamine-6G (2x10⁻⁵
M) in
aqueous medium. PET nanofibers containing crushed TiO2 nanofibers (2 mg,
1.0 cm x 1.0 cm) were put into quartz cuvette filled with rhodamine-6G
solution. The cuvette was placed with a distance of 5 cm from the UV source
and kept under UV irradiation at 254 nm wavelength. At known time
intervals, the dye concentration was measured by using UV-Vis-NIR
spectrophotometer. The change in the absorbance on the UV-Vis absorption
spectrum of the Rh-6G solution containing PET/TiO2-SNF nanofibers as a
function of the UV irradiation time is shown in Figure 21. This figure also
shows the rate (C/C0) of Rh-6G degradation where C0 and C indicate the
initial concentration of Rh-6G before UV irradiation and after UV irradiation
at time t, respectively.
34
Figure 21 (a) The UV-Vis absorption spectrum of the Rh-6G solution
containing PET/TiO2-SNF nanofibers as a function of the UV irradiation
time, and (b) the rate (C/C0) of Rh-6G degradation under UV irradiation at
254 nm wavelength for 24 hours.
As the photodegradation of Rh-6G occurred with respect to UV
irradiation time, the absorbance of the Rh-6G solution in the UV-Vis
absorption spectrum decreased gradually, and the red color of the solution
disappeared totally after 24 hours of UV irradiation indicating that almost
100% of the Rh-6G was decomposed. This result confirmed the
photocatalytic degradation of Rh-6G by nanofibrous composites.
3.5. Polyvinylidene fluoride (PVDF) nanofibers with
varying TiO2-SNF concentrations
Firstly, polymer solution was prepared as follows: 20 % (w/v) PVDF
dissolved in DMAc: Acetone (1:1, v/v). Then TiO2-SNF were added in
PVDF solution were dispersed by stirring for one hour with the ratios 2%,
4%, and 8% (w/w) (with respect to polymer). Finally, PVDF solution was
35
electrospun with following parameters: applied voltage = 20 kV, tip-to-
collector distance =10 cm and feed rate = 1 ml/h.
Figure 22 TEM images of the (a), (b) 2% (w/w) and SEM images of (c) 2%
(d) 4% and (e) 8% (w/w) PVDF/TiO2-SNF nanofibers.
TEM and SEM images showed that nanofibers were detected as black
and white segments, respectively and and it was observed that they
preserved their original structure (Figure 22). The elemental mapping of
PVDF nanofibers containing TiO2–SNF by EDX showed that carbon,
oxygen, fluorine, and titanium are the main elements of the nanofibers
(Figure 23).
36
Figure 23 (a) SEM image, (b)-(c)-(d)-(e) elemental maps and (f) EDX
spectra of PVDF/TiO2-SNF nanofibers showing that carbon, oxygen,
fluorine, and titanium are the main elements of the nanofibers.
According to literature, three main crystalline forms of PVDF have
distinct molecular conformations; which are all trans structure (β- phase),
trans-gauche structure (α-phase), and an intermediate conformation,
consisting in sequences of three trans bonds separated by a gauche bond, is
found in the case of γ- phase [21].
37
Figure 24 Raman spectrum of (a) neat PVDF nanofibers, (b) 2%, (c) 4%,
and (d) 8% (w/w) PVDF/TiO2-SNF, and (e) crushed TiO2 nanofibers.
Figure 24 shows the Raman spectra of pure PVDF, TiO2 nanofibers and
PVDF nanofibers including TiO2 – SNF in 2%, 4%, 8% (w/w)
concentrations. The PVDF nanofiber spectrum presents absorption peaks in
1426 (CH2 bending), 836 (CH2 rocking), 2969 and 2986 (CH2 symmetric
streching) wavenumber. Moreover, 795 cm-1
is the characteristic of the
alpha-phase (CH2 rocking). These peaks are fitted with our data [22] which
are 1430, 839 and 795 cm-1
and two peaks around 3000 cm-1
, respectively.
839 cm−1
is common to both forms I and III but is very strong only in the
first case, while the 811 cm−1
band is only characteristic of form III, which
shows that PVDF nanofibers have a crystalline form of β- phase inspite of γ-
phase. Moreover, the band at 795 cm-1
characteristic of the alpha-phase
38
(form 2) and assigned to CH2 rocking [23]. Raman indicates the crystalline
forms of PVDF which is mixture of α-phase and β- phase.
On the other hand, The TiO2 nanofibers spectrum shows absorptions in
the 151, 401, 516 and 639 cm-1
wavenumbers. According to literature [24]
anatase TiO2 has the Raman lines at 151, 409, 515 and 633 cm−1
can be
assigned as the Eg, B1g, A1g or B1g, showing excellent agreement with the
literature. Moreover, it is clearly observed that while TiO2-SNF was added
occurred ascendings in the absorption spectrum in the 151, 409, 515 and 633
cm−1
, however the band at 795 cm-1
characteristic of the alpha-phase (form
2) and assigned to CH2 rocking appears regardless the amount of TiO2-SNF.
[22] On the other hand, band at 840 cm− 1
that designates the polar β-phase
of the polymer decreases. This conformational change of the polymer has
also been observed for other PVDF/TiO2-SNF nanocomposite nanofibers
which obviously says that β → α transition in all membranes regardless the
amount of TiO2-SNF.
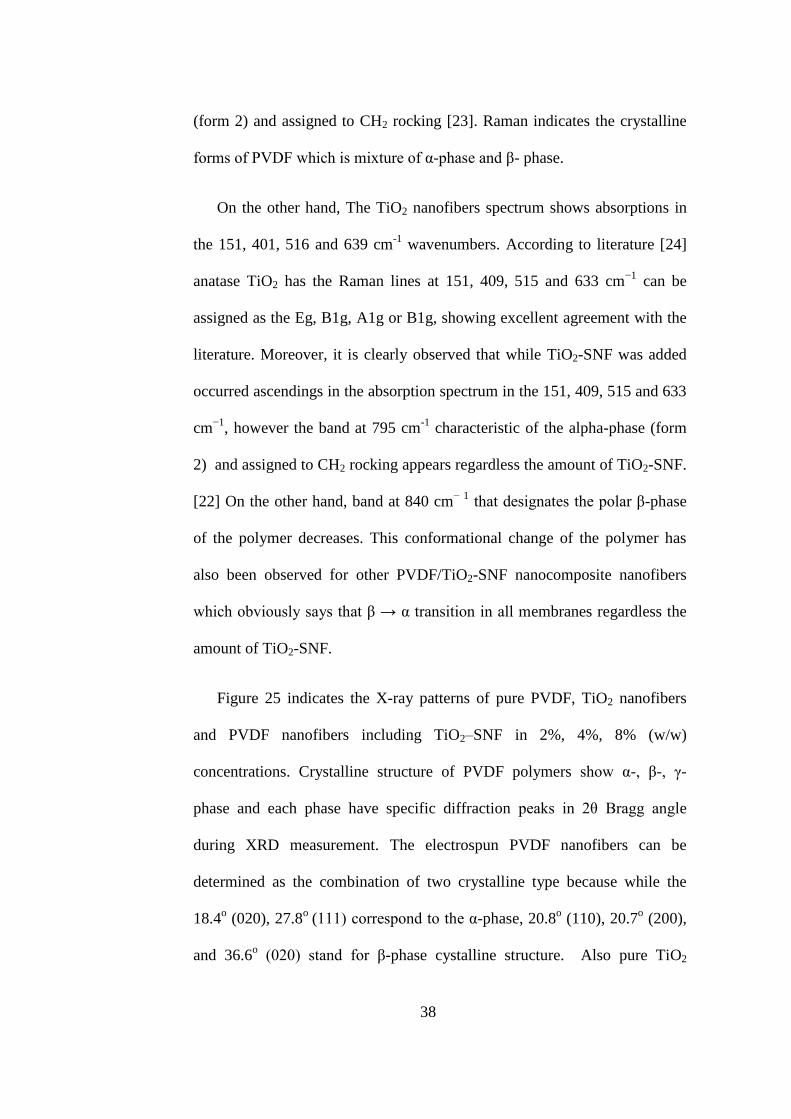
Figure 25 indicates the X-ray patterns of pure PVDF, TiO2 nanofibers
and PVDF nanofibers including TiO2–SNF in 2%, 4%, 8% (w/w)
concentrations. Crystalline structure of PVDF polymers show α-, β-, γ-
phase and each phase have specific diffraction peaks in 2θ Bragg angle
during XRD measurement. The electrospun PVDF nanofibers can be
determined as the combination of two crystalline type because while the
18.4o (020), 27.8
o (111) correspond to the α-phase, 20.8
o (110), 20.7
o (200),
and 36.6o (020) stand for β-phase cystalline structure. Also pure TiO2
39
nanofibers show characteristic peak at 25.3o, 38.6
o, 48.1
o and 55.0
o
corrresponds to anatase type of TiO2 and its intensity increase distinctly as its
amount is increased at the sample. To the contrary, the specific peak of
PVDF show decline in intensity because of more dominant crystalline
structure of TiO2-SNF additive.
Figure 25 XRD patterns of (a) neat PVDF nanofibers, (b) 2%, (c) 4%, and
(d) 8% (w/w) PVDF/TiO2-SNF, and (e) crushed TiO2 nanofibers show
characteristic peak at 25.3o, 38.6
o, 48.1
o and 55.0
o corrresponds to anatase
type of TiO2 and its intensity increase distinctly as its amount is increased at
the sample.
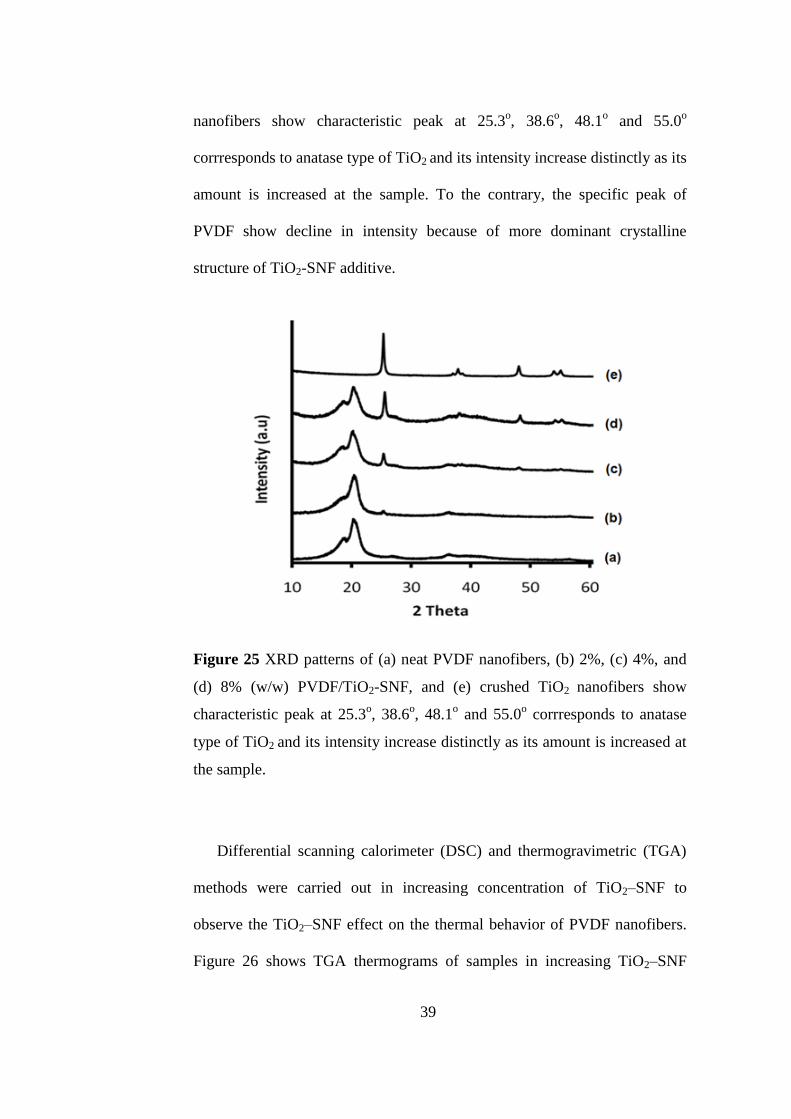
Differential scanning calorimeter (DSC) and thermogravimetric (TGA)
methods were carried out in increasing concentration of TiO2–SNF to
observe the TiO2–SNF effect on the thermal behavior of PVDF nanofibers.
Figure 26 shows TGA thermograms of samples in increasing TiO2–SNF
40
content. For pure PVDF nanofibers, strong one-step degradation was
observed above 450 °C. On the other hand, composite PVDF nanofibers
indicate decomposition behavior at around 350 °C that is lower than pure
PVDF. This can be originated from the catalytic property of the TiO2
causing oxidative and earlier decomposition of samples during the process
[20].
Figure 26 Thermal gravimetric analysis of (a) neat PVDF, (b) 2%, (c) 4%,
and (d) 8% (w/w) PVDF/TiO2-SNF nanofibers decompose at around 350 °C
that is lower than pure PVDF because of the catalytic property of the TiO2
nanofibers.
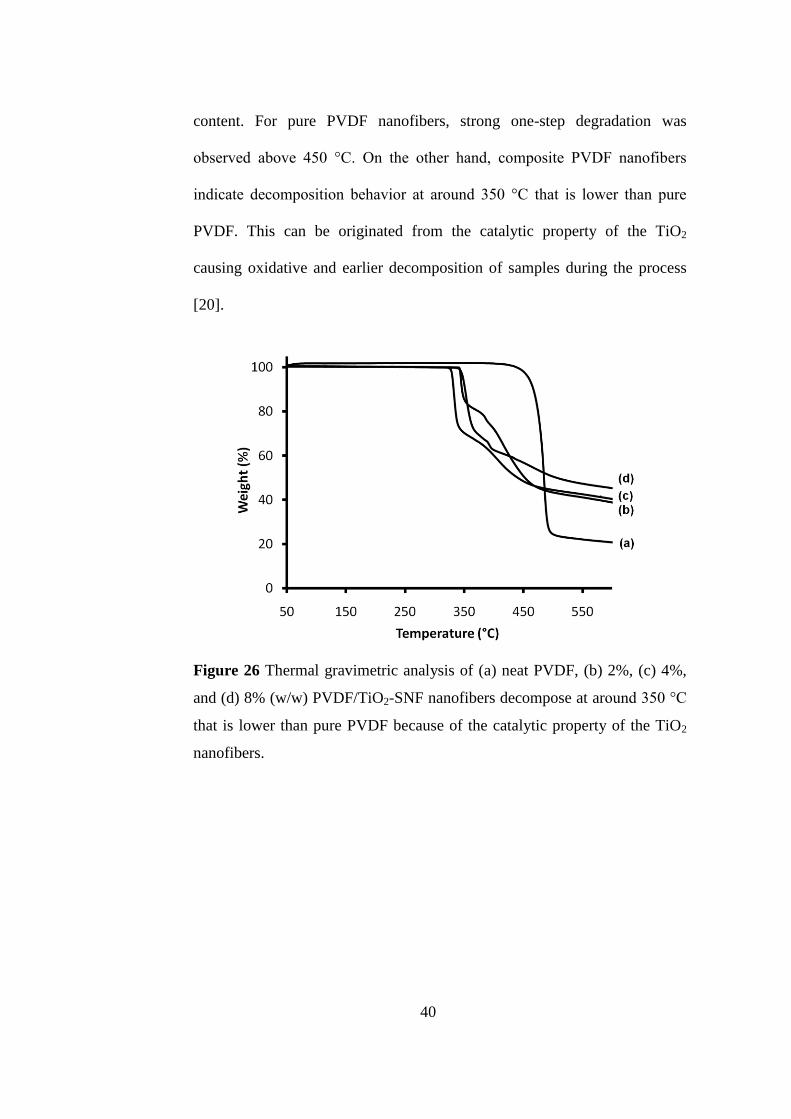
41
Figure 27 DSC thermograms of (a) 2%, (b) 4%, and (c) 8% (w/w)
PVDF/TiO2-SNF and (d) neat PVDF nanofibers showing that PVDF
nanofibers and composites have a melting peak around 166 °C
Figure 27 shows the graph of heat flow versus temperature for PVDF
nanofibers and PVDF/ TiO2–SNF composites samples. It is observed that
PVDF nanofibers and composites show an endothermic melting peak around
166 °C, this behavior is characteristic of the PVDF alpha phase [20]. It
slightly changes depending on the concentration of TiO2-SNF.
42
Sample Melting temperature (oC)
Melting enthalpy (J/g)
Crystallinity (%)
XRD DSC
Pure PVDF 166.3 78.8 74.1 75.2 PVDF + 2% TiO2 - SNF 166.7 86.9 81.5 82.9 PVDF + 4% TiO2 - SNF 166.2 79.7 74.3 76.1
PVDF + 8% TiO2 - SNF 165.4 75.2 70.2 71.8
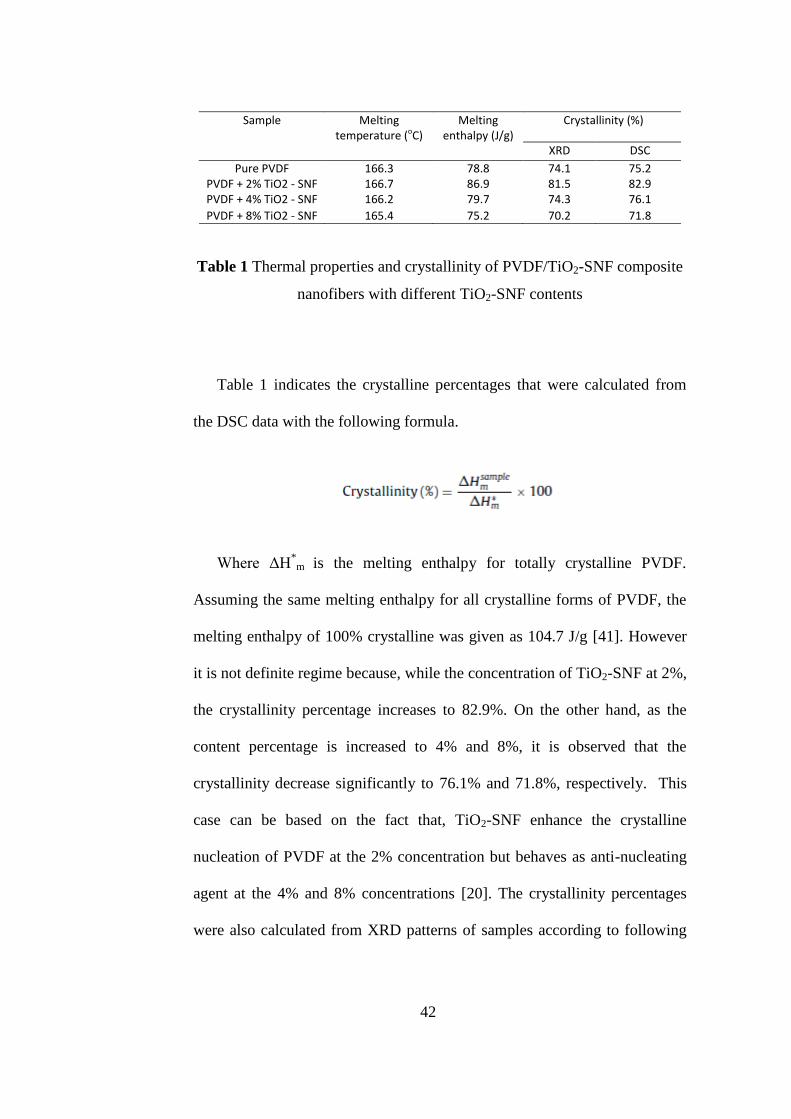
Table 1 Thermal properties and crystallinity of PVDF/TiO2-SNF composite
nanofibers with different TiO2-SNF contents
Table 1 indicates the crystalline percentages that were calculated from
the DSC data with the following formula.
Where ΔH*m is the melting enthalpy for totally crystalline PVDF.
Assuming the same melting enthalpy for all crystalline forms of PVDF, the
melting enthalpy of 100% crystalline was given as 104.7 J/g [41]. However
it is not definite regime because, while the concentration of TiO2-SNF at 2%,
the crystallinity percentage increases to 82.9%. On the other hand, as the
content percentage is increased to 4% and 8%, it is observed that the
crystallinity decrease significantly to 76.1% and 71.8%, respectively. This
case can be based on the fact that, TiO2-SNF enhance the crystalline
nucleation of PVDF at the 2% concentration but behaves as anti-nucleating
agent at the 4% and 8% concentrations [20]. The crystallinity percentages
were also calculated from XRD patterns of samples according to following
43
formula and as it is observed from table 1 results are correlated with DSC
calculations.
Where Ac is the area of the crystalline phase and Aa is the area of
amorphous phase.
3.6. Photocatalytic activity of PVDF nanofibers
containing TiO2-SNF
The photocatalytic activity test was carried out by observing the
photodegradation of rhodamine-6G (Rh-6G) (2x10⁻⁵
M) dye in aqueous
medium. PVDF/TiO2-SNF composite nanofibers (2 mg, 1.0 cm x 1.0 cm)
containing the 2-4-8 % TiO2-SNF (w/w, with respect to polymer) were put
into quartz cuvettes filled with rhodamine-6G solution. Then these cuvettes
were exposed UV irradiation at 254 nm wavelength by placing at a distance
of 5 cm from the UV source and the dye concentrations were determined by
measuring absorbance of samples with UV-Vis-NIR spectrophotometer in a
known time intervals.
44
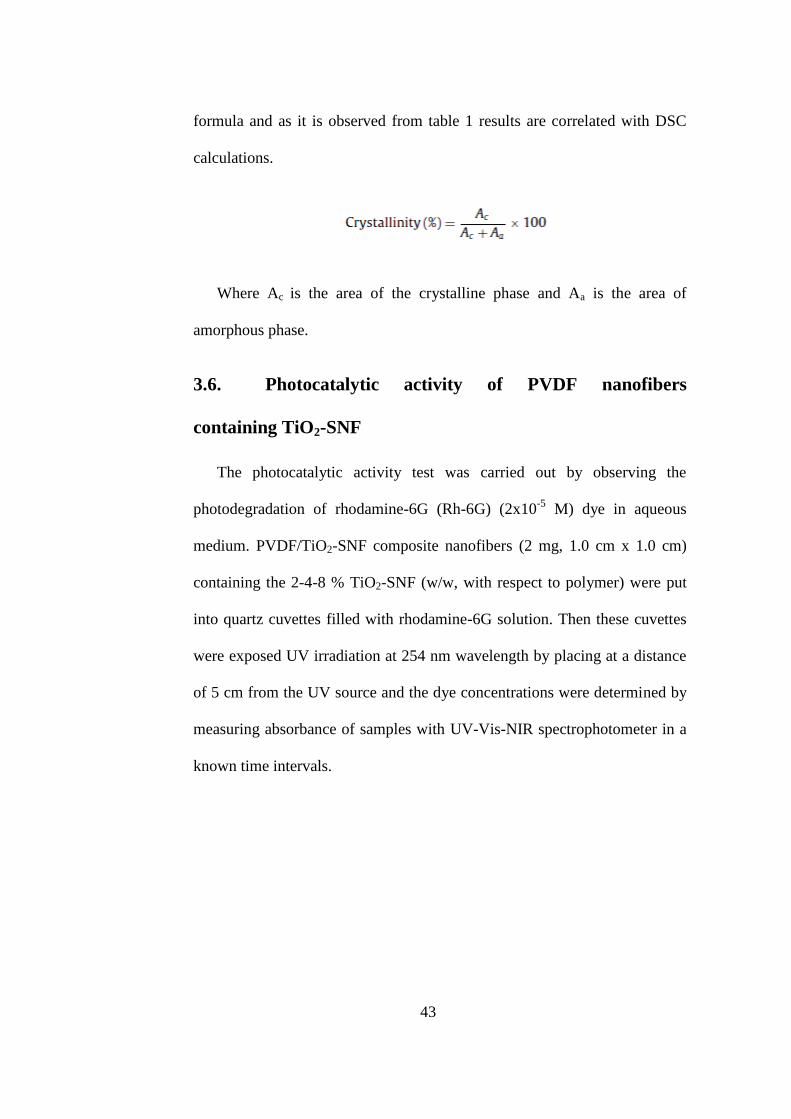
Figure 28 The UV-Vis absorption spectrum of the Rh-6G solution
containing PVDF/TiO2-SNF composite nanofibers including TiO2-SNF a)
2%, (b) 4%, and (c) 8% (w/w) as a function of the UV irradiation time, and
(d) the rate (C/C0) of Rh-6G degradation by PVDF/TiO2-SNF composite
nanofibers including TiO2-SNF i) 2%, (ii) 4%, and (iii) 8% (w/w)
As it is observed from graphs, absorbance values are decreased gradually
and the pink color of the solutions disappear totally after 36 hours for 2%, 12
hours for 4% and 8% concentrations. So we can say that, as the content of
TiO2-SNF increases the photocatalytic activity of composite materials
increases too. However, there is not a distinct difference between 4% and
8% concentrations. Figure 28 indicates the rate (C/C0) of Rh-6G degradation
where C0 and C indicate the initial concentration of Rh-6G before UV
irradiation and after UV irradiation at time t, respectively. This result also
proves the content ratio effect on the degradation rate of dye agent in the
45
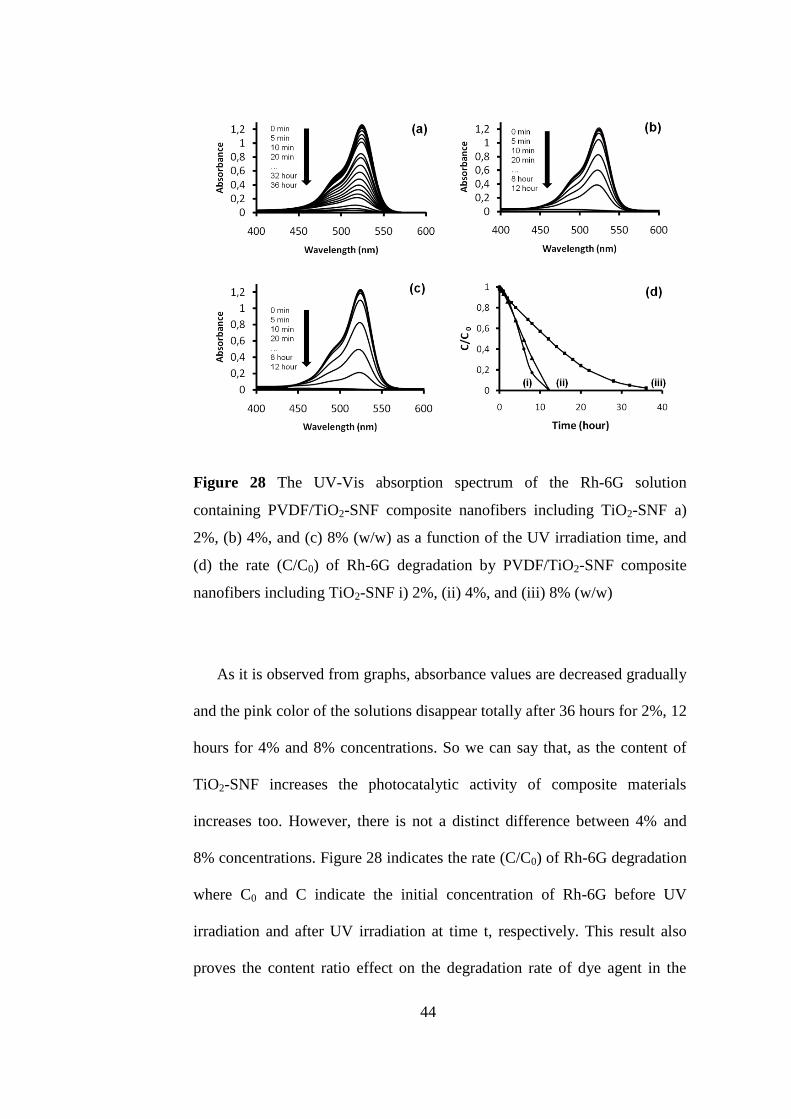
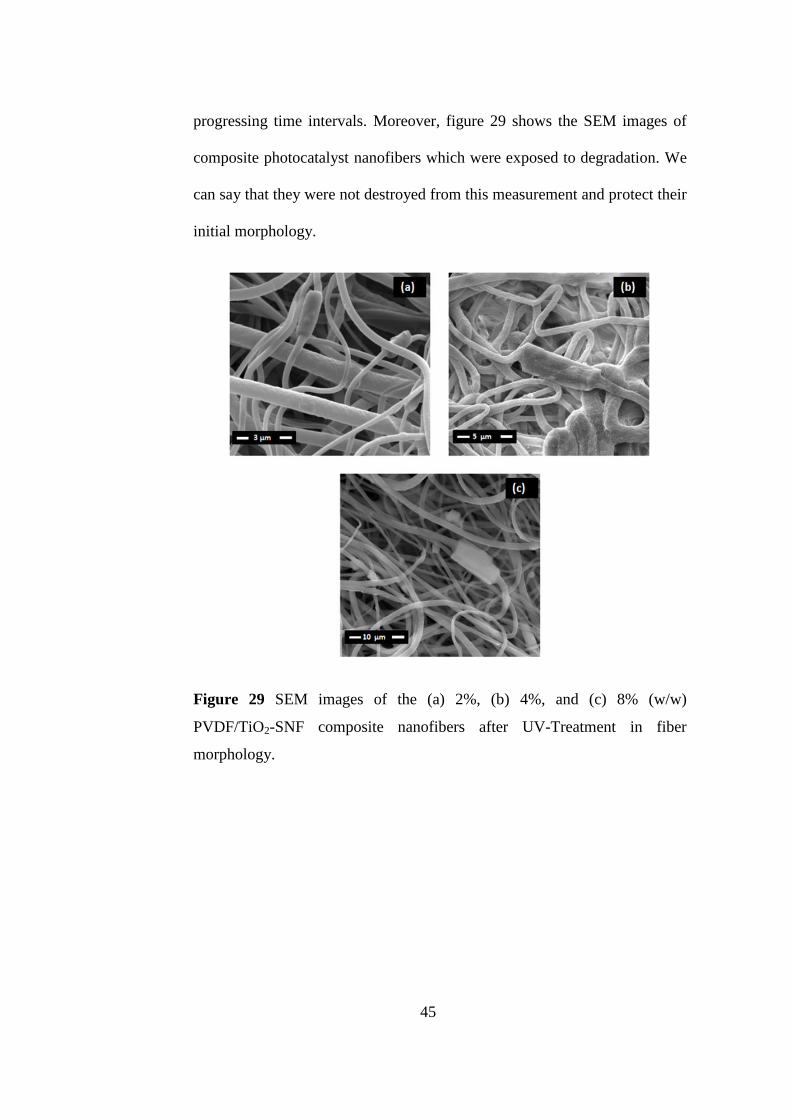
progressing time intervals. Moreover, figure 29 shows the SEM images of
composite photocatalyst nanofibers which were exposed to degradation. We
can say that they were not destroyed from this measurement and protect their
initial morphology.
Figure 29 SEM images of the (a) 2%, (b) 4%, and (c) 8% (w/w)
PVDF/TiO2-SNF composite nanofibers after UV-Treatment in fiber
morphology.
46
CHAPTER III. FUNCTIONAL NANOFIBERS CONTAINING
NANOPARTICLES
4.1. Functional nanofibers
In the last decade, the electrospinning of functional nanofibers has
received great deal of attention since the electrospun nanofibers and their
nanowebs have distinct characteristic such as very high surface area to
volume ratio [4, 25]. In addition, it is rather easy to improve the functionality
of the electrospun nanofibers by incorporating functional additives such as
nanoparticles (NPs) [26-29]. NPs have unique optical, electronic, magnetic,
and catalytic properties; hence, the incorporation of NPs into electrospun
nanofibers is quite attractive for the development of functional nanofibrous
composites having promising physical, chemical, optical, and catalytical
properties [26-29]. The very interesting properties and the multifunctionality
nature of these nanofibers are therefore quite applicable in many areas
including biotechnology, sensors, photonics, optoelectronics, energy, etc.
[25-31].
Two different approaches are mainly applied for the electrospinning of
polymeric nanofibers containing NPs [27, 32]. In most cases, NPs are first
obtained by chemical and/or thermal treatment, and these NPs are dispersed
in polymer solutions and then electrospun, yet, non-homogenous dispersion
of the NPs in the polymer matrix and their aggregation is always a problem,
therefore, certain precautions should be taken for obtaining uniform
composite structures [32]. The other common approach is dissolving
47
metallic precursor together with the polymer and then electrospun into
nanofibers, yet again, the reducing agents are used to obtain metal ions in the
form of NPs [27]. These two approaches mentioned above involve several
optimized processes for each material and require the use of reducing agents
and stabilizer or protecting agent which are usually toxic chemicals. In this
chapter, we describe for the first time the use of a laser ablation and
electrospinning together for the fabrication of polymer/metal nanoparticle
nanofibrous composites. Compared to other methods, laser ablation carried
out directly in a polymer solution has a number of advantages such as
chemical safety, clean process, less time consumption, and applicability for
the production of various NPs [29, 30]. Here we report, direct synthesis of
gold (Au-NPs) and silver nanoparticles (Ag-NPs) obtained in the
poly(vinylpyrolidone) (PVP) polymer solution by using laser ablation which
are further electrospun to form uniform composite nanofibers.
PVP was chosen for a couple of reasons; (i) the electrospinning of the
PVP nanofibers is very easy, and PVP has been shown to be a good fibrous
matrix for incorporation of metal NPs. (ii) PVP is a water soluble polymer
having a hydrophilic nature and it is widely used as a stabilizer and capping
agent for nanoparticles and therefore protect the NPs from agglomeration in
the medium. [35-37].
48
4.2. Materials
Silver, gold, and germanium nanoparticles were prepared by Bülend
Ortaç research group via laser ablation method at UNAM.
Polyvinylpyrrolidone (PVP, Mw~1300000, Aldrich), poly(vinylidene
fluoride) (PVDF) (Kynar 761, donated by Elf Atochem North America Inc.)
dimethylacetamide (DMAc) (>99%, Sigma-Aldrich) ethanol (%99, Aldrich),
and acetone (>99%, Sigma-Aldrich), were purchased commercially. The
water was used from Millipore Milli-Q Ultrapure Water System. The
materials were used without any purification.
4.3. Fabrication of PVP nanofibers containing Au and
Ag nanoparticles by laser ablation method
PVP was dissolved in ethanol:water (1:1, v/v) solvent system at 15 %
(w/v) polymer concentration then gold and silver nanoparticles were
generated by laser ablation method in this polymeric media. The PVP
solutions containing Au-NPs (PVP/Au-NPs) and Ag-NPs (PVP/Ag-NPs)
were electrospun with the following parameters: applied voltage = 15 kV,
tip-to-collector distance =12 cm and feed rate = 0.5 ml/h. Electrospun
nanofibers were deposited on a grounded stationary cylindrical metal
collector covered by a piece of aluminum foil. The electrospinning apparatus
was enclosed in Plexiglas box and the electrospinning was carried out at 23
oC at 20 % relative humidity (Figure 30). For comparison, the
electrospinning of 15 % (w/v) PVP in ethanol:water (1:1, v/v) was also
49
performed under the same conditions without subjected to laser ablation of
NPs.
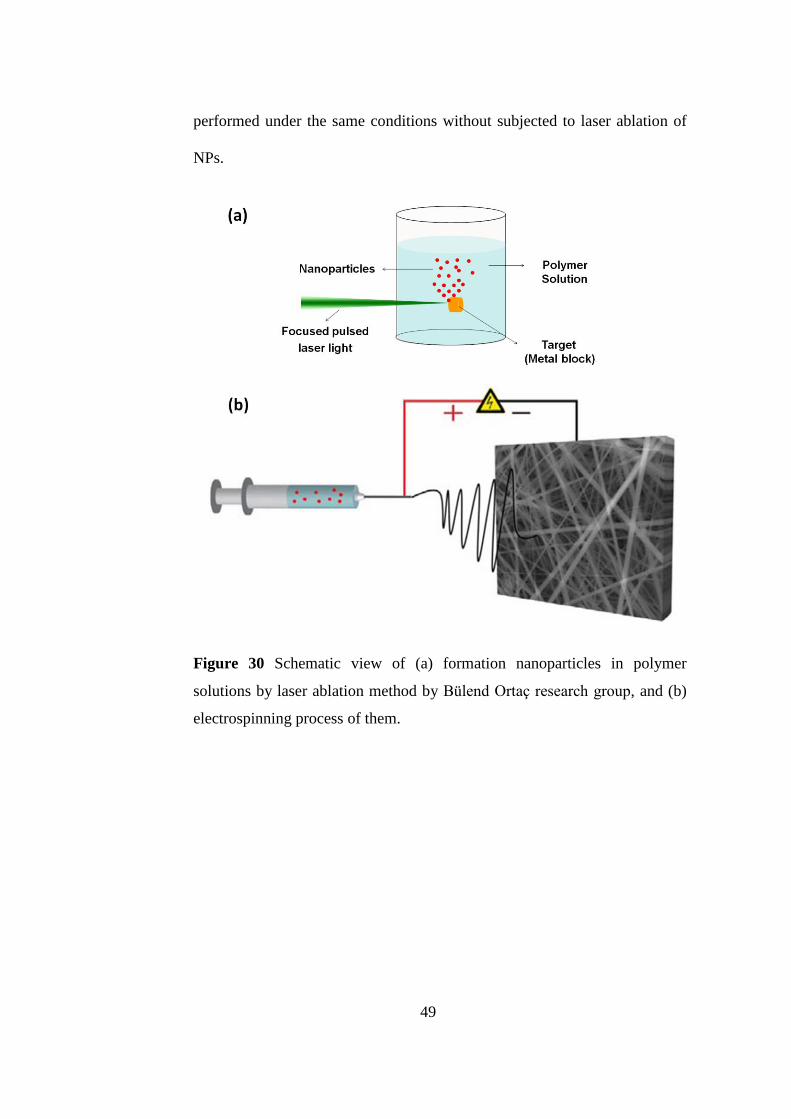
Figure 30 Schematic view of (a) formation nanoparticles in polymer
solutions by laser ablation method by Bülend Ortaç research group, and (b)
electrospinning process of them.
50
4.4. Characterization of PVP nanofibers containing Au
and Ag nanoparticles by laser ablation method
The morphology and the diameter of the nanofibers were investigated by
SEM and TEM. The AFDs were calculated by analyzing around 100 fibers
from the SEM images. EDX was performed for the elemental analysis of the
PVP nanofibers containing Au-NPs and Ag-NPs. The infrared spectra of
nanofibers were obtained by using FTIR spectrometer. The samples were
mixed with KBr and pressed as pellets. The scans (64 scans) were recorded
between 4000 and 400 cm-1
at a resolution of 4 cm-1
. UV-Vis-NIR
spectrophotometer was used at the range 350 - 750 nm wavelength to
analyze the PVP/Au-NPs and PVP/Ag-NPs nanofibrous web at the solid
state. Finally, photoluminescence measurements were evaluated by
JobinYvon-Horiba Fluorolog spectrometer fitted with a detector (FL-1073)
working at 950 V with a Xenon source.
After the laser treatment, color of PVP solutions including Au NPs and
Ag NPs becomes dark purple and deep yellow, respectively. Also, the
electrospun nanoweb structures show the shade of these colors lightly.
51
Figure 31 The representative (a), (b) SEM images of PVP/Au-NPs; (c),
(d) Sem images of PVP/Ag-NPs nanofibers. Magnification: 5000x, 30000x
The representative SEM images of PVP nanofibers including Au-NPs
and Ag-NPs were indicated in Figure 31. We observed that the incorporation
of Au-NPs and Ag-NPs did not affect the electrospinning and bead-free
nanofibers having average fiber diameter of 810±480 nm and 815±445 were
obtained for PVP/Au-NPs and PVP/Ag-NPs nanofibers, respectively.
52
Figure 32 TEM images of (a) PVP/Au-Nps, and (b) PVP/Ag-Nps nanofibers
Moreover, the presence of nanoparticles and their distribution in the PVP
nanofibers were further visualized by TEM imaging (Figure 32). The Au
NPs and Ag NPs were mostly dispersed in a spherical form homogeneously
in the PVP matrix, yet, some aggregations especially of the Ag-NPs were
also observed and exhibit a narrow size distribution with the average
diameter of 17 nm and 31 nm and in the range of 5 to 20 nm, 4 to 120 nm,
respectively.
53
Figure 33 EDX spectrums of (a) PVP/Au-Nps, and (b) PVP/Ag-Nps
nanofibers
The elemental analyses performed by EDX showed that carbon, nitrogen,
oxygen, gold and silver are the main elements of the nanofibers (Figure 33).
Then FTIR spectrometer was used to determine if any interaction between
the polymeric part and the metallic NPs. Characteristic peaks of PVP are
1290 cm-1
for the amide (–C≡N) stretching, 1440 cm-1
for the carboxylic (O-
H) bending, and 1372 cm-1
for the (C-H) vibrations which are not changed
by laser ablation method except at 1660 cm-1
for the (C=O) carbonyl
stretching vibration. The blue shifts were observed for PVP/Au-NPs and
PVP/Ag-NPs to the around 1670 cm-1
due to the interaction of carbonyl
(C=O) with the NPs (Figure 34) [30, 31, 33].
54
Figure 34 The FTIR spectrums of (i) pure PVP, (ii) PVP/Au-NPs, and (iii)
PVP/Ag-NPs nanofibers.
Figure 35 The solid-state UV-Vis absorption spectrums of the (a) PVP/Au-
NPs, and (b) PVP/Ag-NPs nanofibers.
Moreover, PVP has a characteristic of dielectric properties [38] when the
Au-NPs and Ag-NPs are doped into dielectric matrices, the materials will
show specific optical absorption property owing to discrete energy levels
55
and specific states of nanoparticles. So, UV-Vis spectroscopy can be
considered as a useful characterization technique for metal NPs [39-40].
Figure 35 shows the UV-Vis absorption spectrums of PVP nanofibers
containing Au and Ag nanoparticles in solid state by background correcting
with pure PVP nanofibers in the range of wavelength from 350 – 750 nm at
room temperature. The absorption peaks at 536 nm and 432 nm are due to
the surface plasma resonances (SPRs) of Au and Ag NPs, respectively.
These results indicate the formation of Au-NPs and Ag-NPs via laser
ablation method was very successful and the electrospun PVP/Au-NPs and
PVP/Ag-NPs nanowebs have shown enhanced optical properties.
4.5. Fabrication of PVDF nanofibers contains Ge
nanocrystals (Ge-NCs) by laser ablation method
Ge nanoparticles (Ge-NPs) have interesting applications in
optoelectronic devices such as; photodetectors, field-effect transistors and
multijunction solar cells etc. due to its optical and electronic properties.
Moreover, they have low toxicity and exhibit size-dependent
photoluminescence properties. Colloidally stable Ge-NPs can be produced
by different processing techniques which are required annealing treatment
[42]. However, by using the reactive pulsed laser deposition methods, it was
achieved to synthesize Ge-NPs in the controble size and photoluminescent
property without appliying any annealing process [43]. This approach was
utilized in germanium nanocrystal (Ge-NCs) synthesis in acetone. After the
laser ablation, the color of solution becomes brown-yellow presenting of
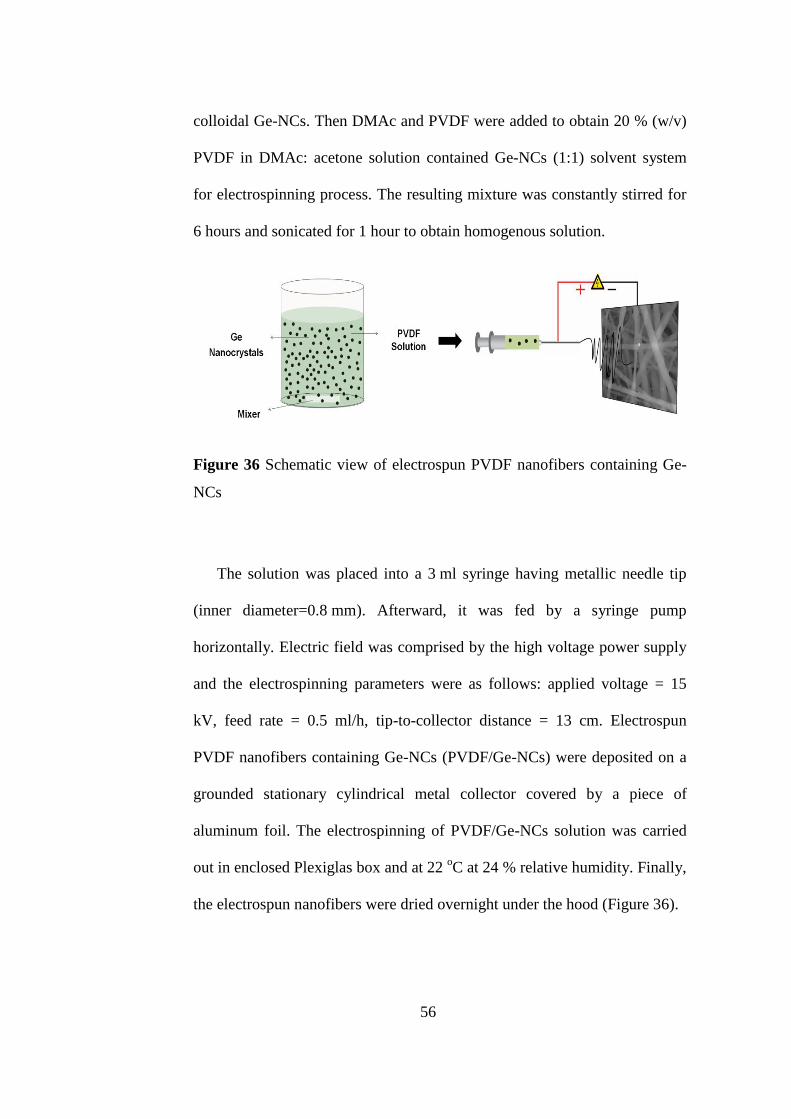
56
colloidal Ge-NCs. Then DMAc and PVDF were added to obtain 20 % (w/v)
PVDF in DMAc: acetone solution contained Ge-NCs (1:1) solvent system
for electrospinning process. The resulting mixture was constantly stirred for
6 hours and sonicated for 1 hour to obtain homogenous solution.
Figure 36 Schematic view of electrospun PVDF nanofibers containing Ge-
NCs
The solution was placed into a 3 ml syringe having metallic needle tip
(inner diameter=0.8 mm). Afterward, it was fed by a syringe pump
horizontally. Electric field was comprised by the high voltage power supply
and the electrospinning parameters were as follows: applied voltage = 15
kV, feed rate = 0.5 ml/h, tip-to-collector distance = 13 cm. Electrospun
PVDF nanofibers containing Ge-NCs (PVDF/Ge-NCs) were deposited on a
grounded stationary cylindrical metal collector covered by a piece of
aluminum foil. The electrospinning of PVDF/Ge-NCs solution was carried
out in enclosed Plexiglas box and at 22 oC at 24 % relative humidity. Finally,
the electrospun nanofibers were dried overnight under the hood (Figure 36).
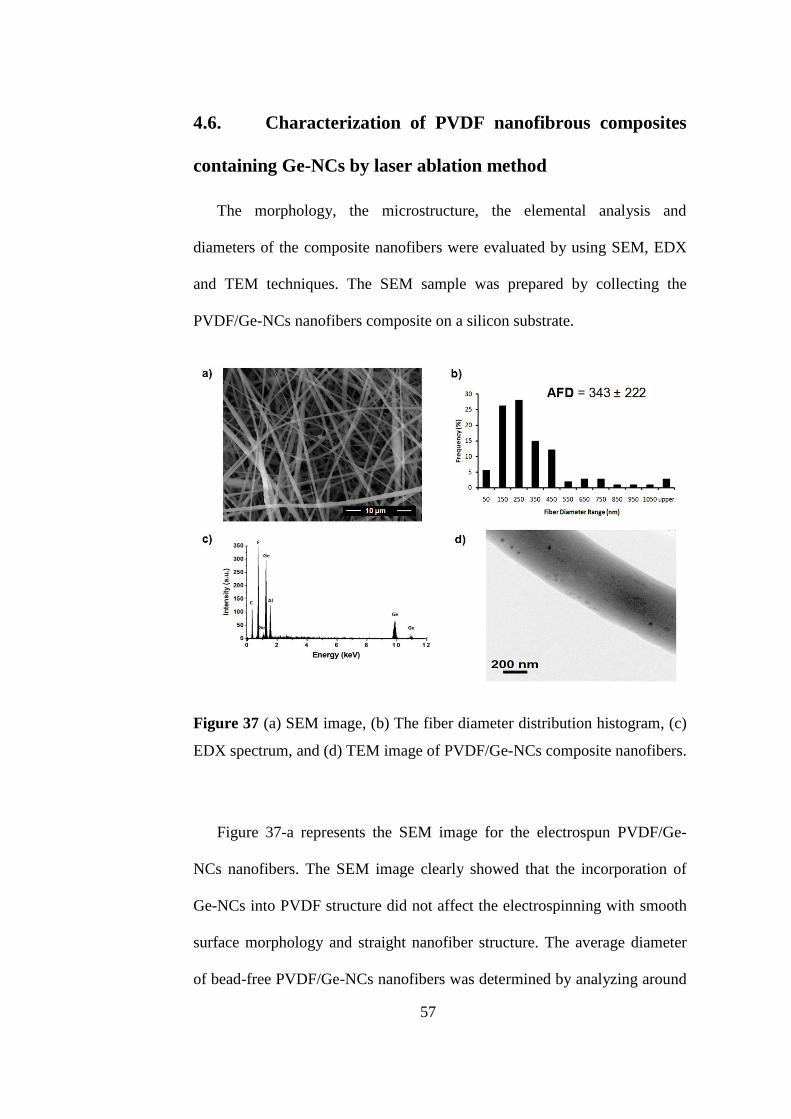
57
4.6. Characterization of PVDF nanofibrous composites
containing Ge-NCs by laser ablation method
The morphology, the microstructure, the elemental analysis and
diameters of the composite nanofibers were evaluated by using SEM, EDX
and TEM techniques. The SEM sample was prepared by collecting the
PVDF/Ge-NCs nanofibers composite on a silicon substrate.
Figure 37 (a) SEM image, (b) The fiber diameter distribution histogram, (c)
EDX spectrum, and (d) TEM image of PVDF/Ge-NCs composite nanofibers.
Figure 37-a represents the SEM image for the electrospun PVDF/Ge-
NCs nanofibers. The SEM image clearly showed that the incorporation of
Ge-NCs into PVDF structure did not affect the electrospinning with smooth
surface morphology and straight nanofiber structure. The average diameter
of bead-free PVDF/Ge-NCs nanofibers was determined by analyzing around
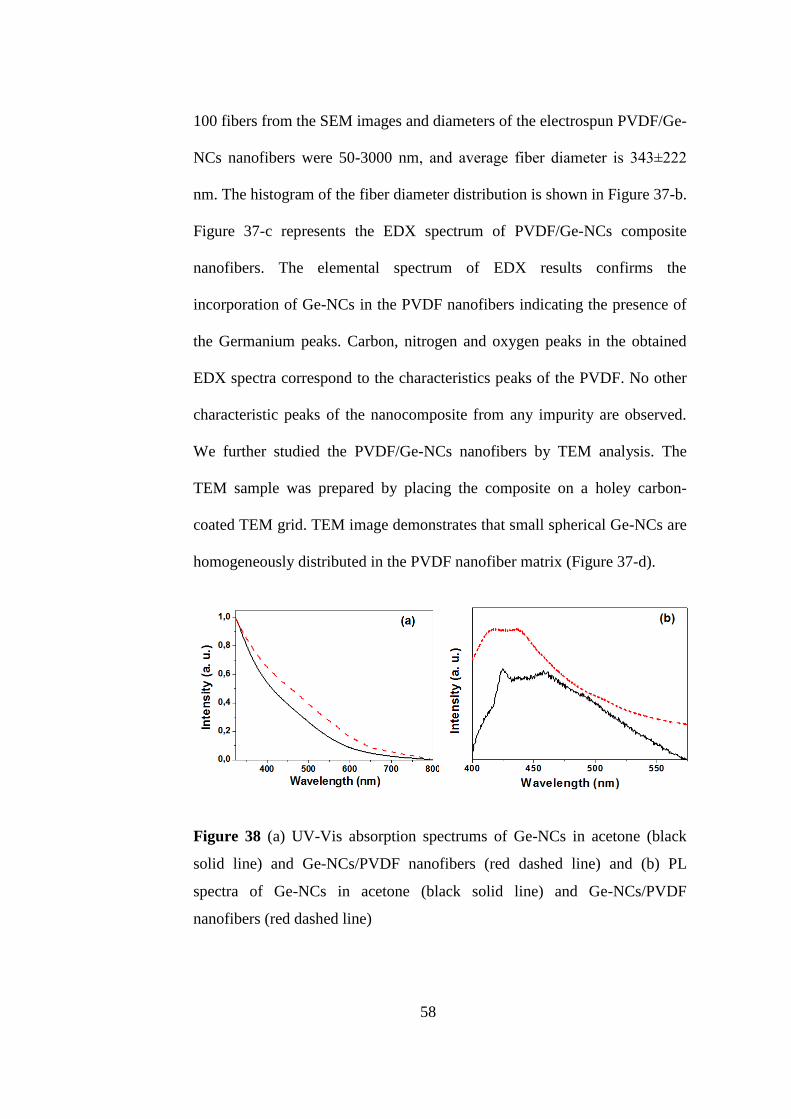
58
100 fibers from the SEM images and diameters of the electrospun PVDF/Ge-
NCs nanofibers were 50-3000 nm, and average fiber diameter is 343±222
nm. The histogram of the fiber diameter distribution is shown in Figure 37-b.
Figure 37-c represents the EDX spectrum of PVDF/Ge-NCs composite
nanofibers. The elemental spectrum of EDX results confirms the
incorporation of Ge-NCs in the PVDF nanofibers indicating the presence of
the Germanium peaks. Carbon, nitrogen and oxygen peaks in the obtained
EDX spectra correspond to the characteristics peaks of the PVDF. No other
characteristic peaks of the nanocomposite from any impurity are observed.
We further studied the PVDF/Ge-NCs nanofibers by TEM analysis. The
TEM sample was prepared by placing the composite on a holey carbon-
coated TEM grid. TEM image demonstrates that small spherical Ge-NCs are
homogeneously distributed in the PVDF nanofiber matrix (Figure 37-d).
Figure 38 (a) UV-Vis absorption spectrums of Ge-NCs in acetone (black
solid line) and Ge-NCs/PVDF nanofibers (red dashed line) and (b) PL
spectra of Ge-NCs in acetone (black solid line) and Ge-NCs/PVDF
nanofibers (red dashed line)
59
Moreover, UV-Vis absorption and photoluminesce measurements of Ge-NCs in
acetone (black solid line) and Ge-NCs/PVDF nanofibers (red dashed line) were
carried out (Figure 38). As it is observed from the graphs, the optical properties
of Ge-NCs are supplied in the solid-state PVDF nanofibers with the approximate
characteristic values.
60
CHAPTER 4
CONCLUSION
In this thesis, we focus on three different studies. In the first part, we
obtained inorganic nanofibers (TiO2 and ZnO) from their precursor solutions
by using polymeric materials as a carrier matrix then photocatalytic activity
of these inorganic nanofibers was studied. In the second part, we report the
production of polymeric nanofibrous composites containing anatase TiO2–
SNF via electrospinning technique. We have shown that nanofibrous
composites containing TiO2–SNF from different polymers such as PMMA,
PAN, PET, PC, and PVDF can easily be obtained via electrospinning. The
SEM and TEM studies revealed that some TiO2–SNF were fully inside the
polymeric matrix whereas some TiO2–SNF were partially covered and
sticked on the fiber surface. The photocatalytic activity of these nanofibrous
composites containing TiO2–SNF was evaluated by the photocatalytic
decomposition of rhodamine-6G under UV irradiation. Our preliminary
results indicated that these nanofibrous composites have photocatalytic
activity and could be useful for treatment of organic pollutants. In the last
part, we report novel synthesis method of PVP nanofibers incorporating
silver and gold nanoparticles. Composite nanofibers are produced by
combination of laser ablation and electrospinning techniques. The presence
of Ag-NPs and Au-NPs in the PVP nanofibers was confirmed by SEM, TEM
61
and EDX analyses. The FTIR study suggested the presence of molecular
interactions between PVP matrix and the NPs in the nanofibrous composites.
The UV-Vis absorption and photoluminescence measurements confirmed the
enhancement of the optical properties of the PVP/Ag-NPs and PVP/Au-NPs
nanofibers in the solid state due to the surface plasma resonance effect of
NPs. On top of that, we demonstrated the synthesis of stable colloidal Ge-
NCs by pulsed laser ablation method in acetone to fabricate PVDF
nanofibers containing highly pure Ge-NCs.
As a conclusion, we have shown two facile routes to produce
multifunctional nanofibrous nanocomposites. The first one is based on
merging of inorganic short nanofibers (SNF) into polymeric nanofiber
matrix. The second route combines laser ablation and electrospinning to
fabricate polymer/nanoparticle nanofibrous composites. Hence, we have
demonstrated that; different type of NPs or inorganic SNF can be
incorporated into the polymeric nanofiber matrix to develop multifunctional
nanocomposites for certain applications.
62
FUTURE PROSPECTS
In addition to our present study, our nanocomposite materials can be
enhanced and so their application opportunities may be extended by
applying more advanced process types or by using various chemical
components. For instance, coaxial electrospinning method enables the
production of hollow and core-shell nanofiber structures hence the surface
area of materials can be improved enormously or the polymers/inorganic
agents which are difficult to process can be co-electrospun due to this
technique. We have achieved the fabrication of nanocomposites by
combining polymeric matrix with nanoparticles in the same way; inorganic
nanofibers may be an alternative matrix structure for the nanoparticles that
are obtained by laser ablation method. This can provides the improvement in
the optical and catalytical properties of ultimate nanocomposites owing to
synergic effect of more than one inorganic component. Moreover, we have
observed in our study that, the short inorganic nanofibers can be fully or
partially covered by polymeric matrix. To enhance the photocatalytic
property, two different polymer types can be used during the electrospinning
and one of them can be removed chemically so as to attain porous surface
that will supply the utilization from the inner inorganic short nanofibers.
These all approaches can lead the production of more functional
nanocomposites in company with more extended application areas.
63
REFERENCES
1. Ramakrishna, S., et al., An Introduction to Electrospinning and
Nanofibers. World Scientific Publishing, 2005.
2. Li, D., and Y. Xia., Electrospinning of Nanofibers: Reinventing
the Wheel?. Advanced Materials, 2004. 16(14): p. 1151-1170.
3. Bhardwaj, N., and S. C. Kundu, Electrospinning: A fascinating
fiber fabrication technique. Biotechnology Advances, 2010. 28(3): p. 325-
347.
4. Burger, C., et al., Nanofibrous Materials and Their applications.
Annual Review of Materials Science, 2006. 36: p. 333–368.
5. Shin, Y. M., et al., Experimental characterization of
electrospinning: the electrically forced jet and instabilities. Polymer, 2011.
42: p. 9955-9967.
6. Greiner, A., et al., Electrospinning: A Fascinating Method for the
Preparation of Ultrathin Fibers. Angewandte Chemie, 2007. 46: p. 5670 –
5703.
7. Subbiah, T., et al., Electrospinning of nanofibers. Journal of
Applied Polymer Science, 2005. 96(2): p. 557-569.
8. Yu, M-M., et al., Catalytic fibers and cloths. Applied Catalysis
A: General, 2001. 231(1-2): p. 1-16.
64
9. Li, W-J., et al., Electrospun nanofibrous structure: A novel
scaffold for tissue engineering. Journal of Biomedical Materials Research,
2002. 60(4): p. 613-621.
10. Kenawy, E-R., et al., Release of tetracycline hydrochloride from
electrospun poly(ethylene-co-vinylacetate), poly(lactic acid), and a blend.
Journal of Controlled Release, 2002. 81(1-2): p. 57-64.
11. Shao, C., et al., Electrospun nanofibers of NiO/ZnO composite.
Inorganic Chemistry Communications, 2004. 7(5): p. 625-627.
12. Guan, H., et al., A novel method for making CuO superfine fibres
via an electrospinning technique. Inorganic Chemistry Communications,
2003. 6(11): p. 1409-1411.
13. Shinde, S. S., et al., Zinc oxide mediated heterogeneous
photocatalytic degradation of organic species under solar radiation. Journal
of Photochemistry and Photobiology B:Biology, 2011. 104: p. 425-433.
14. Barka, N., et al., Factors influencing the photocatalytic
degradation of Rhodamine B by TiO2-coated non-woven paper. Journal of
Photochemistry and Photobiology A: Chemistry, 2008. 195(2-3): p. 346–
351.
15. Pirkanniemi, K., Heterogeneous water phase catalysis as an
environmental application: a review. Chemosphere, 2002. 48(10): p. 1047–
1060.
65
16. Mu, J., et al., High Photocatalytic Activity of ZnO-Carbon
Nanofiber Heteroarchitectures. ACS Applied Materials & Interfaces, 2011.
3(2): p. 590-596.
17. Khanna, P. K., et al., Synthesis of nano-particles of anatase-TiO2
and preparation of its optically transparent film in PVA. Materials Letters,
2007. 61(25): p. 4725-4730.
18. Huang, Z., et al., A review on polymer nanofibers by
electrospinning and their applications in nanocomposites. Composites
Science and Technology, 2003. 63(15): p. 2223–2253.
19. Choi, S. K., et al., Photocatalytic Comparison of TiO2
Nanoparticles and Electrospun TiO2 Nanofibers: Effects of Mesoporosity
and Interparticle Charge Transfer. The Journal of Physical Chemistry C,
2010. 114(39): p. 16475–16480.
20. Li, W., et al., Preparation and investigation of
PVDF/PMMA/TiO2 composite film. Journal of Materials Science, 2009. 44:
p. 2977-2984.
21. Campos, C., et al., Preparation and characterization of
PVDF/CaCO3 composites. Materials Science and Engineering : B, 2007.
136(2-3): p. 123-128.
22. Boccaccio, T., et al., Characterization of PVDF membranes by
vibrational spectroscopy. Journal of Membrane Science, 2002. 210: p. 315-
329
66
23. Simoes, R. D., et al., Structural characterization of blends
containing both PVDF and natural rubber latex. Journal of Raman
Spectroscopy, 2005. 36: p. 1118-1124.
24. Zhang, W. F., et al., Raman scattering study on anatase TiO2
nanocrystals. Journal of Physics D: Applied Physics, 2000. 33: p. 912-916.
25. Ramakrishna, S., et al., Electrospun nanofibers: solving global
issues. Materials Today, 2006. 9(3): p. 40–50.
26. Wang, W., et al., Au-Doped Polyacrylonitrile–Polyaniline Core–
Shell Electrospun Nanofibers Having High Field-Effect Mobilities. Small,
2011. 7(5): p. 597–600.
27. Wang, Y., et al., Preparation of silver nanoparticles dispersed in
polyacrylonitrile nanofiber film spun by electrospinning. Materials Letters,
2005. 59(24–25): p. 3046–3049.
28. Hwang, S. H., et al., SnO2 nanoparticle embedded TiO2
nanofibers — Highly efficient photocatalyst for the degradation of
rhodamine B. Catalysis Communications, 2011. 12(11): p. 1037–1041.
29. Lee, K-P., et al., Fabrication and Properties of
Poly(vinylidenefluoride)/PbS/Au Heterogeneous Nanostructures. Journal of
Nanoscience and Nanotechnology, 2009. 9(1): p. 115–122.
67
30. Dong, Z., et al., Electrospinning materials for energy-related
applications and devices. Journal of Power Sources, 2011. 196(11): p. 4886–
4904.
31. Teo, W-E., et al., Electrospun nanofibers as a platform for
multifunctional, hierarchically organized nanocomposite. Composites
Science and Technology, 2009. 69(11-12): p. 1804–1817.
32. He, D., et al., Large-Scale Synthesis of Flexible Free-Standing
SERS Substrates with High Sensitivity: Electrospun PVA Nanofibers
Embedded with Controlled Alignment of Silver Nanoparticles. ACS Nano,
2009. 3(12): p. 3993–4002.
33. Amendola, V,. et al., Laser ablation synthesis in solution and size
manipulation of noble metal nanoparticles. Physical Chemistry Chemical
Physics, 2009. 11(20): p. 3805–3821.
34. Zhang, J., et al., Nickel and cobalt nanoparticles produced by
laser ablation of solids in organic solution. Materials Letters, 2008. 62(10–
11): p. 1521–1524.
35. Akamatsu, K., et al., Preparation and characterization of
polymer thin films containing silver and silver sulfide nanoparticles. Thin
Solid Films, 2000. 359(1); p. 55-60.
36. Zheng, M., et al., Optical properties of silver-dispersed PVP thin
film. Materials Research Bulletin, 2001. 36(5-6); p. 853-859.
68
37. Saeed, M., et al., Synthesis and Characterization of
Silver/polyvinilpirrolidone (Ag/PVP) Nanoparticles using gamma irridation
techniques. African Physical Review, 2010. 4(06); p. 31-41.
38. Reddy, Ch.V. S., et al., Dielectric spectroscopy studies on (PVP
+ PVA) polyblend film. Microelectronic Engineering, 2006. 83(2); p. 281-
285.
39. He, T., et al., Nonlinear optical response of Au and Ag
nanoparticles doped polyvinylpyrrolidone thin films. Physics Letters A,
2009. 373(5): p. 592-595.
40. Wang, Y., et al., Fabrication of Au / PVP Nanofiber composites
by electrospinning. Journal of Applied Polymer Science, 2007. 105(6): p.
3618-3622.
41. Nasır, M., et al., Control of Diameter, Morphology, and Structure
of PVDF Nanofiber Fabricated by Electrospray Deposition. Journal of
Polymer Science: Part B: Polymer Physics, 2006. 44: p. 779-786.
42. Vaughn II, D. D. et al., Colloidal Synthesis of Air-Stable
Crystalline Germanium Nanoparticles with Tunable Sizes and Shapes.
Chemistry of Materials, 2010. 22: p. 6103-6108.
43. Riabinina, D., et al., A novel approach to the synthesis of
photoluminescent germanium nanoparticles by reactive laser ablation.
Nanotechnology, 2006. 17: p. 2152-2155.
69
44. Chen, H., et al., Fabrication of Hierarchically Porous Nanofibers
by a General Microemulsion Electrospinning Approach. Small, 2011. 7(13):
p. 1779-1783.
45. Krishnamoorti, R., et al., Polymer Nanocomposites. Journal of
Polymer Science: Part B: Polymer Physics, 2007. 45: p. 3252-3256.
46. Mai, Y., et al., Polymer Nanocomposites. Woodhead Publishing
in Materials, 2006.
47. Wang, C., et al., Preparation of one-dimensional TiO2
nanoparticles within polymer fiber matrices by electrospinning. Materials
Letters, 2007. 61(29): p. 5125-5128.
70
LIST OF PUBLICATION
1. Deniz, A.E., Vural, H.A., Ortac, B., and Uyar, T., Gold
nanoparticle/polymer nanofibrous composites by laser ablation and
electrospinning. Materials Letters, 2011. 65: p. 2941-2943.
2. Deniz, A.E., Celebioglu, A., Kayaci, F. and Uyar, T., Electrospun
polymeric nanofibrous composites containing TiO2 short nanofibers”
Materials Chemistry and Physics, 2011. 129: p. 701-704.
3. Ortac, B., Deniz, A.E., Vural, H.A., and Uyar, T., Electrospun
germanium nanocrystals/polymer nanofibrous composite web and its optical
properties. (submitted for publication).