Embed Size (px)
Citation preview
Np
JD
a
ARRAA
KLCLNF
1
pidaftegds[oApacaLo
0d
Journal of Power Sources 209 (2012) 7– 14
Contents lists available at SciVerse ScienceDirect
Journal of Power Sources
jo ur nal homep age: www.elsev ier .com/ locate / jpowsour
ano-layered LiFePO4 particles converted from nano-layered ferroushenylphosphonate templates
in Chen, Liuming Yan ∗, Baohua Yueepartment of Chemistry, College of Sciences, Shanghai University, 99 Shangda Road, Shanghai 200444, China
r t i c l e i n f o
rticle history:eceived 1 September 2011eceived in revised form 18 February 2012ccepted 20 February 2012vailable online 28 February 2012
eywords:
a b s t r a c t
A new type of nano-structured LiFePO4 particles were prepared exhibiting enhanced apparent lithium iondiffusion dynamics. The nano-structured LiFePO4 particles possess nano-layered morphology and wereconverted hydrothermally from the nano-layered templates composed of mainly ferrous metaphosphateand graphitic carbon. And the nano-layered templates were prepared by pyrolysis conversion of thenano-layered ferrous phenylphosphonate templates, or the raw nano-layered templates. Though thenano-layered LiFePO4 particles possess characteristics of nanostructured LiFePO4, the overall dimensions
−3
ithium ion batteryathode materialsithium ferrous phosphateano-layered particleserrous phosphonateare still in micro-size and the tap density is about 1.36 g cm comparable to the micro-sized LiFePO4
particles. The apparent lithium ion diffusion coefficients are 1.5 × 10⁻¹¹ and 3.1 × 10⁻¹³ cm2 s−1 evaluatedusing the cyclic voltammetry and electrical impedance spectroscopy, respectively. In addition, the organicmoiety from the raw nano-layered templates was converted into tiny carbon particles with abundance ofordered graphitic structure well dispersed in the nano-layered LiFePO4 particles; and the nano-layeredLiFePO4 particles possess an electronic conductivity as high as 3.28 mS cm−1.
. Introduction
Lithium ion batteries have achieved great success as compactower sources in the field of portable electronic and electric devices
ncluding mobile phones, digital music players, digital cameras,igital video cameras, game boxes, laptop and palmtop computers,nd electric tools. However, their applications as power sourcesor high-power equipments such as electric bikes, hybrid elec-ric vehicles (HEVs), plug-in hybrid electric vehicles (PHEVs), purelectric vehicles (EVs), and electric storages for renewable ener-ies including wind energy and solar energy were proved to beifficult owing to the high cost, safety concerns, limited effectiveervice life, low energy and power density, and long charging time1–9]. It is believed that these obstacles could at least be partlyvercome if cheap and efficient cathode materials were developed.mong the many potential cathode materials, lithium iron phos-hate (LiFePO4) has attracted great research interests and practicalpplications owing to its low cost, excellent thermal and chemi-al stability, promising safety criteria, environmental compatibility,nd long service life compared to the oxide complexes based on
iCoO2, LiMnO2, LiNiO2, or V6O13 [10–16]. However, disadvantagesf LiFePO4 were yet to be overcome including the poor electronic∗ Corresponding author. Tel.: +86 21 66132405; fax: +86 21 66132405.E-mail address: [email protected] (L. Yan).
378-7753/$ – see front matter © 2012 Elsevier B.V. All rights reserved.oi:10.1016/j.jpowsour.2012.02.072
© 2012 Elsevier B.V. All rights reserved.
conductivity and slow lithium ion diffusion dynamics thus limitingthe rate capability of the batteries [17,18].
Improved electronic conductivity could be achieved by theaddition of conductive carbon using various methods includingdirect addition or pyrolysis conversion of various carbon precur-sors during or after the synthesis of the cathode materials; andthe conductive carbon could be coated around or composited intothe LiFePO4 particles [18–25]. The improvement of lithium iondiffusion dynamics of the LiFePO4 particles could be achievedby shortening the diffusion distance in solid [26,27] through thededicated control of particle size, shape, and morphology. Forexample, the lithium ion diffusion dynamics of LiFePO4 was greatlyimproved if nanosized LiFePO4 particles were synthesized owing tothe shortened diffusion distance in solid [28–30]. Shortened diffu-sion distance could also be achieved if nanowires or nano-plateletsof LiFePO4 were synthesized [27,31–34]. The disadvantages fromvarious nanosized LiFePO4 particles include the reduction of tapdensity thus limiting the energy density and the degradation ofcharge–discharge cycling characteristics [35]. In order to shortenthe diffusion distance in solid without significant loss of tap den-sity; hollow or porous, especially hierarchically porous LiFePO4particles were synthesized [34,36–38].
In this work, a novel concept of nano-layered morphol-
ogy of LiFePO4 particles, allowing the fast transport of lithiumions between the nano-layers but keeping the overall particlesizes still at microscale, was developed. The major advantage ofthis concept is the significant improvement of the lithium ion
8 Power
dcnfmvtlmlcelftpmotmpiecev
2
2
cbpdCb((2RevZcpfmD
2
srtpg
paiawn
J. Chen et al. / Journal of
iffusion dynamics in the electrode without loss of tap density andycling characteristics. The preparation of LiFePO4 particles withano-layered morphology includes three steps: the synthesis of
errous phenylphosphonate particles (Fe(II)PP) with nano-layeredorphology (the raw nano-layered templates), the pyrolysis con-
ersion of the raw nano-layered templates Fe(II)PP into the finalemplates, and the hydrothermal conversion of the final nano-ayered templates into nano-layered LiFePO4 particles. Similar to
any other metal phosphonates, Fe(II)PP particles possess nano-ayered morphology by nature [39–42]. In addition, the majoromposition of the raw nano-layered templates of Fe(II)PP isffectively converted into ferrous metaphosphate of the final nano-ayered templates during the pyrolysis conversion step; and theerrous metaphosphate is further converted into LiFePO4 duringhe hydrothermal conversion step. Dissimilar to the general tem-lates widely used in the synthesis of various nanomaterials, theain constituents of the final nano-layered templates become part
f the final product, and the morphological characteristics of theemplates were kept in the final product. Furthermore, the phenyl
oiety of Fe(II)PP was converted into graphitic carbon during theyrolysis conversion resulting in improved electronic conductiv-
ty of the LiFePO4 particles. On the other hand, only inter-particlelectronic conductivity is improved if carbonaceous materials wereoated around the LiFePO4 particles. Finally, the morphology andlectrochemical characteristics of the LiFePO4 were studied usingarious experimental methods.
. Experimental
.1. Materials
All the chemicals were used as received without further purifi-ation. The dissolved oxygen in deionized water was eliminatedy boiling before use. Phenylphosphonic acid (PPoA, 98%) wasurchased from Jiaxing Alpharm Fine Chemical Co., Ltd.; lithiumihydrogen phosphate (LiH2PO4, 99.9%, battery grade) was fromhina Lithium Industrial Co., Ltd. at Shanghai; sodium dodecyl-enzene sulfonate (SDBS, 88.0%, AR), ferrous sulfate heptahydrateFeSO4·7H2O, AR), l-ascorbic acid (VC, 99.7%, AR), absolute alcohol99.7%, AR), hydrazine hydrate (N2H4·H2O, 85%, AR), and N-methyl--pyrrolidone (NMP, 98.0%, CP) were from Sinopharm Chemicaleagent Co., Ltd.; urea (AR) was from Aladdin Co., Ltd.; the LB-313lectrolyte solution composed of 1 mol dm−3 LiPF6 in mixture sol-ent of EC, DMC, and EMC in a volume ratio of 1:1:1 was fromhangjiagang Guotai-Huarong New Chemical Materials Co., Ltd.;onductive acetylene carbon black was from Timical (Switzerland);oly(vinylidene fluoride) (PVDF) was from Du Pont (USA); lithiumoil was from China Energy Lithium Co., Ltd. at Tianjin; and alu-
inum foil was from Shanghai Dole Science and Technologyevelopment Co., Ltd.
.2. Preparation of the nano-layered templates
The nano-layered templates were prepared in two steps: theynthesis of the raw nano-layered templates composed of fer-ous phenylphosphonate (Fe(II)PP), and the pyrolysis conversion ofhe raw nano-layered templates into the final nano-layered tem-lates mainly composed of ferrous metaphosphate, Fe(PO3)2, andraphitic carbon.
In the first synthesis step, the Fe(II)PP raw nano-layered tem-lates were synthesized from aqueous solutions of FeSO4·7H2Ond PPoA. Urea was added as latent alkali to gradually neutral-
ze the PPoA at decomposition; VC or hydrazine hydrate wasdded as reducing agent to protect Fe2+ from oxidation; and SDBSas added as surfactant to prevent the agglomeration of the rawano-layered templates [43]. The molar ratio of reagents was:Sources 209 (2012) 7– 14
PPoA:FeSO4·7H2O:urea:VC = 12:4.8:5:0.48 [40,41]. In a typical syn-thesis step, 60 mmol of PPoA and 25 mmol of urea were dissolvedin 60 ml of deionized water at room temperature in a flask understirring; and 24 mmol of FeSO4·7H2O and 2.4 mmol of VC were dis-solved in another flask in 30 ml of deionized water under stirring.And then, the first solution was added dropwise to the second solu-tion to give a transparent solution. In addition, 12.5 ml aqueoussolution of SDBS (1.1%) was added into the transparent solution.Finally, the resulting mixture solution was heated on a silicone oilbath at 105 ◦C for one week under the protection of a nitrogenatmosphere. During this period, white Fe(II)PP particles precip-itated gradually and grew into the raw nano-layered templates.After being cooled down to room temperature, the solid productwas collected by filtration, washed for 3 times with deionized waterand 3 times with absolute alcohol, and finally dried at 70 ◦C in avacuum oven for 24 h.
In the pyrolysis conversion process, the raw nano-layered tem-plates were pyrolyzed and converted into ferrous metaphosphateand graphitic carbon. Firstly, the white raw nano-layered templateswere loaded into an alumina boat and put in a tubular furnace pro-tected in a high-purity Ar atmosphere. And then, the temperaturewas elevated to 700 ◦C at rate of 10 ◦C min−1 and was kept at 700 ◦Cfor 6 h. Finally, the furnace was cooled down in about 12 h and thefinal black nano-layered templates were obtained.
2.3. Preparation of the nano-layered LiFePO4 particles
The final nano-layered LiFePO4 particles were prepared througha hydrothermal conversion process. In a typical hydrothermal con-version process, 18 mmol of LiH2PO4 and 21.6 mmol of urea weredissolved in 20 ml of deionized water. The urea, a latent base to neu-tralize LiH2PO4 and to raise the pH at decomposition, was slightlyexcess compared to LiH2PO4 [44]. Next, 18 mmol of FeSO4·7H2Oand 1.8 mmol of VC which was a reducing agent to protect Fe2+
from oxidation were dissolved in 30 ml of deionized water in a flask,and the mixture solution of LiH2PO4 and urea was added drop-wise to this solution resulting a light green transparent solution.Thirdly, the nano-layered templates were added and the mixturewas stirred for 30 min. Finally, the mixture was transferred into a100 ml Teflon-lined stainless steel autoclave and sealed and heatedat 180 ◦C for 3 days. After being cooled down to room temperature,the solid product was collected by filtration, washed for 3 timeswith deionized water and 3 times with absolute alcohol, and driedin a vacuum oven at 70 ◦C for 24 h.
2.4. Structural identification and morphological characterization
The SEM, XRD, and FTIR and Raman spectroscopy were usedto characterize the morphological and structural characteristics ofthe intermediate and final products. The SEM observations wereconducted using a JMS-6700F high resolution scanning electronmicroscope (HRSEM, JEOL, Japan) with all the samples pretreated bycoating a layer of platinum. The powder X-ray diffraction patternswere collected using a DLMAX-2550 X-ray diffractometer (XRD,Rigaku, Japan) equipped with a rotating scintillation counter andCu K�1 sealed tube (� = 1.5406 A) over range of 3–80◦ 2� with astep size of 0.02◦ and scan rate of 4◦/min. The FTIR spectra wererecorded between 400 cm−1 and 4000 cm−1 using an Avatar 370FTIR spectrometer (Nicolet, USA), and the Raman spectra were col-lected between 100 cm−1 and 2000 cm−1 using an InVia Raman
Microscope (Renishaw plc., UK) equipped with an argon 514 nmlaser.The chemical compositions (Li, Fe, and P) of all the sam-ples were analyzed using an inductively coupled plasma optical
Power Sources 209 (2012) 7– 14 9
eU
2p
l(omr
tcL(2hbfpoodtliseLs0tb(o
3
3
atpratnmnc
Fctolpcntst
J. Chen et al. / Journal of
mission spectrometer (ICP-OES, Thermo-Fisher Scientific Co.,SA).
.5. Characterization of the electric and electrochemicalerformances
In order to evaluate the electronic conductivity, the nano-ayered LiFePO4 particles were firstly pressed into circular slabs� 13 mm × 1 mm) at a pressure of 20 MPa without the additionf any adhesives. And the resistance was evaluated using a multi-eter with the slabs pressed between two platinum electrodes at
oom temperature.Electrochemical measurements were carried out in CR2016-
ype coin cells filled with LB-313 electrolyte solution. The coinells were assembled with Celgard 2500 membrane as separator,iFePO4 cathode sheet, and pure lithium foil as counter electrode� 14 mm × 0.33 mm). The LiFePO4 cathode sheet (30 �m thick and
mg cm−2 active material in average) was prepared by coating aomogeneous blend of nano-layered LiFePO4 particles, acetylenelack, and binder at a weight ratio of 80:10:10 on an aluminumoil. Although the cathode loading and thickness are far from theractical battery applications, these values are comparable to manyther researches that report such values [18,34,45–48]. Since thenly purpose to assemble test cells is to evaluate the Li+ diffusionynamics and characterize the charge–discharge performances ofhe nano-layered LiFePO4 particles, it is believed that the smalloading and thin thickness are acceptable in such study. The binders a solution of 20 mg ml−1 PVDF in NMP. The electrical impedancepectroscopy was evaluated from 0.01 to 100 kHz using a CHI660Blectrochemical workstation (Shanghai Chenhua instruments Co.,td., China). The cyclic voltammetry (CV) was scanned using theame electrochemical workstation at scan rates of 0.1, 0.25, 0.45,.7, and 1.0 mV s−1 in voltage range of 2.7–4.5 V vs. the Li/Li+ elec-rode. The Galvanostatic charge–discharge testing was conductedetween 0.03 C and 0.9 C using a LANDMon battery test systemWuhan Kingnuo Electronics Co., Ltd., China) in the voltage rangef 2.5–4.5 V vs. the Li/Li+ electrode.
. Results and discussions
.1. Morphology
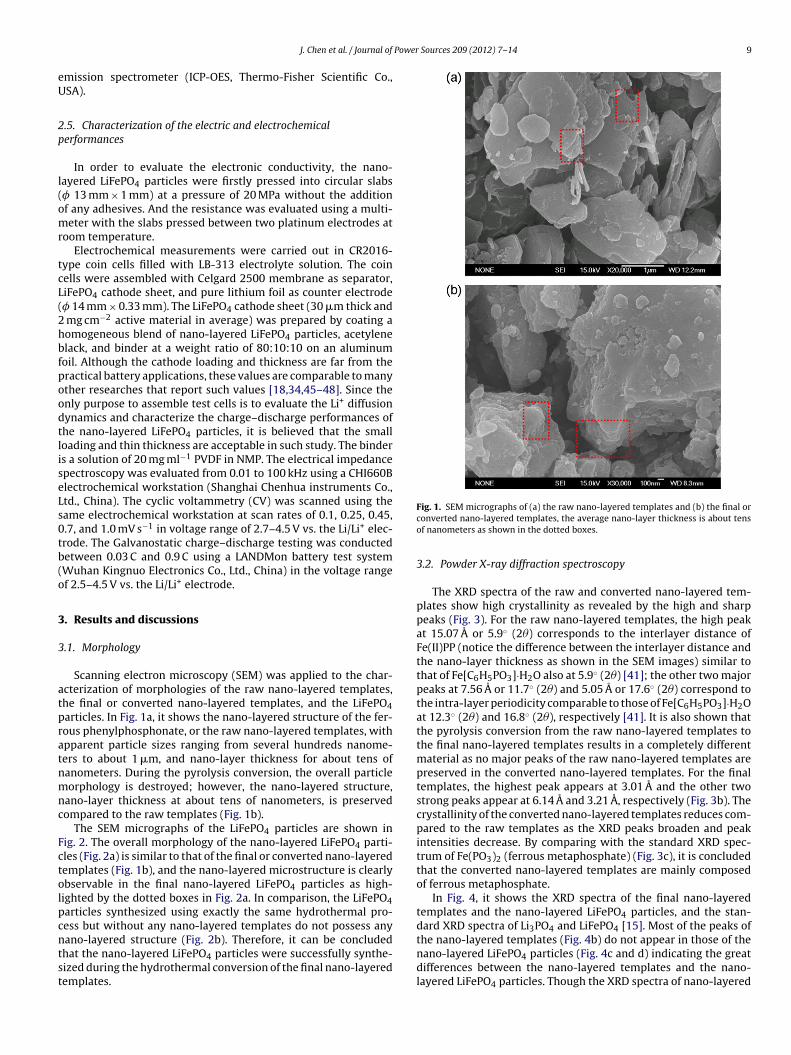
Scanning electron microscopy (SEM) was applied to the char-cterization of morphologies of the raw nano-layered templates,he final or converted nano-layered templates, and the LiFePO4articles. In Fig. 1a, it shows the nano-layered structure of the fer-ous phenylphosphonate, or the raw nano-layered templates, withpparent particle sizes ranging from several hundreds nanome-ers to about 1 �m, and nano-layer thickness for about tens ofanometers. During the pyrolysis conversion, the overall particleorphology is destroyed; however, the nano-layered structure,
ano-layer thickness at about tens of nanometers, is preservedompared to the raw templates (Fig. 1b).
The SEM micrographs of the LiFePO4 particles are shown inig. 2. The overall morphology of the nano-layered LiFePO4 parti-les (Fig. 2a) is similar to that of the final or converted nano-layeredemplates (Fig. 1b), and the nano-layered microstructure is clearlybservable in the final nano-layered LiFePO4 particles as high-ighted by the dotted boxes in Fig. 2a. In comparison, the LiFePO4articles synthesized using exactly the same hydrothermal pro-
ess but without any nano-layered templates do not possess anyano-layered structure (Fig. 2b). Therefore, it can be concludedhat the nano-layered LiFePO4 particles were successfully synthe-ized during the hydrothermal conversion of the final nano-layeredemplates.Fig. 1. SEM micrographs of (a) the raw nano-layered templates and (b) the final orconverted nano-layered templates, the average nano-layer thickness is about tensof nanometers as shown in the dotted boxes.
3.2. Powder X-ray diffraction spectroscopy
The XRD spectra of the raw and converted nano-layered tem-plates show high crystallinity as revealed by the high and sharppeaks (Fig. 3). For the raw nano-layered templates, the high peakat 15.07 A or 5.9◦ (2�) corresponds to the interlayer distance ofFe(II)PP (notice the difference between the interlayer distance andthe nano-layer thickness as shown in the SEM images) similar tothat of Fe[C6H5PO3]·H2O also at 5.9◦ (2�) [41]; the other two majorpeaks at 7.56 A or 11.7◦ (2�) and 5.05 A or 17.6◦ (2�) correspond tothe intra-layer periodicity comparable to those of Fe[C6H5PO3]·H2Oat 12.3◦ (2�) and 16.8◦ (2�), respectively [41]. It is also shown thatthe pyrolysis conversion from the raw nano-layered templates tothe final nano-layered templates results in a completely differentmaterial as no major peaks of the raw nano-layered templates arepreserved in the converted nano-layered templates. For the finaltemplates, the highest peak appears at 3.01 A and the other twostrong peaks appear at 6.14 A and 3.21 A, respectively (Fig. 3b). Thecrystallinity of the converted nano-layered templates reduces com-pared to the raw templates as the XRD peaks broaden and peakintensities decrease. By comparing with the standard XRD spec-trum of Fe(PO3)2 (ferrous metaphosphate) (Fig. 3c), it is concludedthat the converted nano-layered templates are mainly composedof ferrous metaphosphate.
In Fig. 4, it shows the XRD spectra of the final nano-layeredtemplates and the nano-layered LiFePO4 particles, and the stan-dard XRD spectra of Li3PO4 and LiFePO4 [15]. Most of the peaks of
the nano-layered templates (Fig. 4b) do not appear in those of thenano-layered LiFePO4 particles (Fig. 4c and d) indicating the greatdifferences between the nano-layered templates and the nano-layered LiFePO4 particles. Though the XRD spectra of nano-layered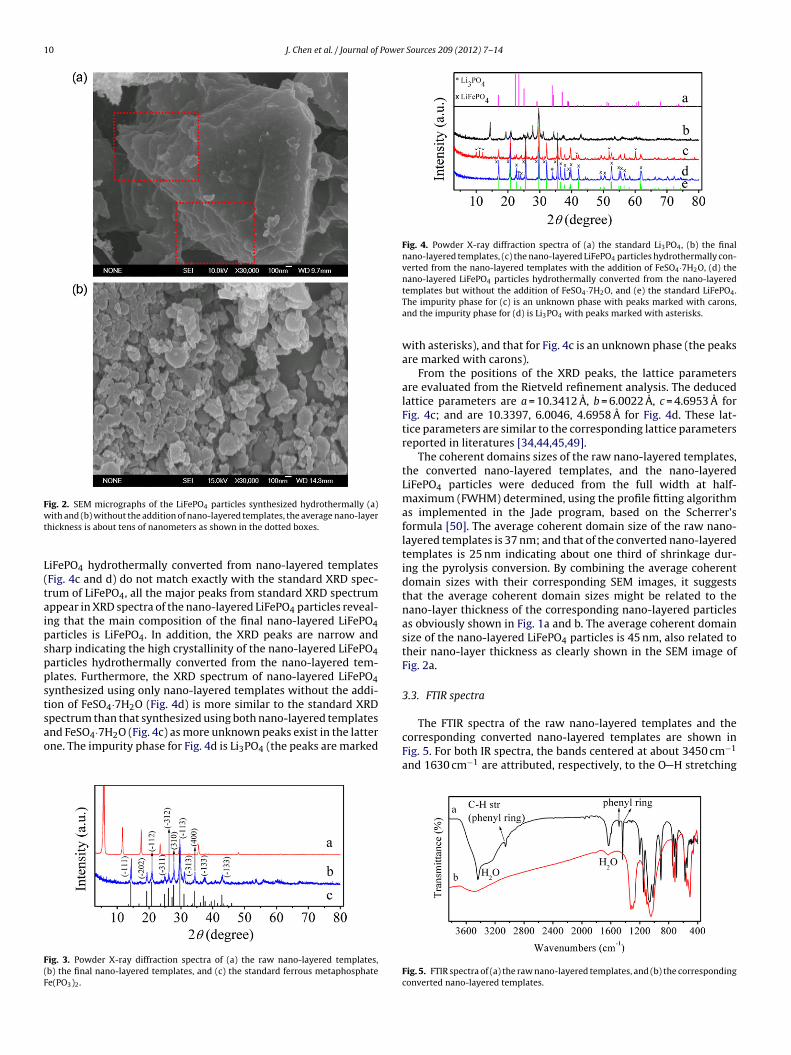
10 J. Chen et al. / Journal of Power Sources 209 (2012) 7– 14
Fig. 2. SEM micrographs of the LiFePO4 particles synthesized hydrothermally (a)wt
L(taipsppstsao
F(F
Fig. 4. Powder X-ray diffraction spectra of (a) the standard Li3PO4, (b) the finalnano-layered templates, (c) the nano-layered LiFePO4 particles hydrothermally con-verted from the nano-layered templates with the addition of FeSO4·7H2O, (d) thenano-layered LiFePO4 particles hydrothermally converted from the nano-layered
ith and (b) without the addition of nano-layered templates, the average nano-layerhickness is about tens of nanometers as shown in the dotted boxes.
iFePO4 hydrothermally converted from nano-layered templatesFig. 4c and d) do not match exactly with the standard XRD spec-rum of LiFePO4, all the major peaks from standard XRD spectrumppear in XRD spectra of the nano-layered LiFePO4 particles reveal-ng that the main composition of the final nano-layered LiFePO4articles is LiFePO4. In addition, the XRD peaks are narrow andharp indicating the high crystallinity of the nano-layered LiFePO4articles hydrothermally converted from the nano-layered tem-lates. Furthermore, the XRD spectrum of nano-layered LiFePO4ynthesized using only nano-layered templates without the addi-ion of FeSO4·7H2O (Fig. 4d) is more similar to the standard XRDpectrum than that synthesized using both nano-layered templates
nd FeSO4·7H2O (Fig. 4c) as more unknown peaks exist in the latterne. The impurity phase for Fig. 4d is Li3PO4 (the peaks are markedig. 3. Powder X-ray diffraction spectra of (a) the raw nano-layered templates,b) the final nano-layered templates, and (c) the standard ferrous metaphosphatee(PO3)2.
templates but without the addition of FeSO4·7H2O, and (e) the standard LiFePO4.The impurity phase for (c) is an unknown phase with peaks marked with carons,and the impurity phase for (d) is Li3PO4 with peaks marked with asterisks.
with asterisks), and that for Fig. 4c is an unknown phase (the peaksare marked with carons).
From the positions of the XRD peaks, the lattice parametersare evaluated from the Rietveld refinement analysis. The deducedlattice parameters are a = 10.3412 A, b = 6.0022 A, c = 4.6953 A forFig. 4c; and are 10.3397, 6.0046, 4.6958 A for Fig. 4d. These lat-tice parameters are similar to the corresponding lattice parametersreported in literatures [34,44,45,49].
The coherent domains sizes of the raw nano-layered templates,the converted nano-layered templates, and the nano-layeredLiFePO4 particles were deduced from the full width at half-maximum (FWHM) determined, using the profile fitting algorithmas implemented in the Jade program, based on the Scherrer’sformula [50]. The average coherent domain size of the raw nano-layered templates is 37 nm; and that of the converted nano-layeredtemplates is 25 nm indicating about one third of shrinkage dur-ing the pyrolysis conversion. By combining the average coherentdomain sizes with their corresponding SEM images, it suggeststhat the average coherent domain sizes might be related to thenano-layer thickness of the corresponding nano-layered particlesas obviously shown in Fig. 1a and b. The average coherent domainsize of the nano-layered LiFePO4 particles is 45 nm, also related totheir nano-layer thickness as clearly shown in the SEM image ofFig. 2a.
3.3. FTIR spectra
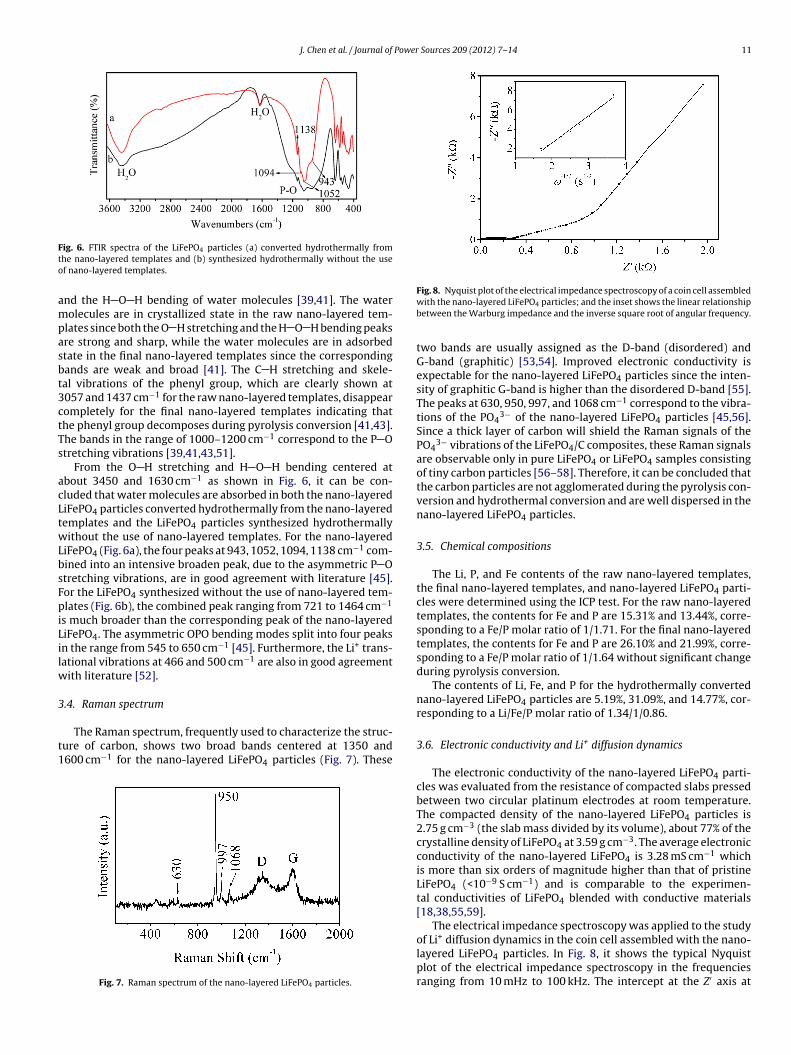
The FTIR spectra of the raw nano-layered templates and thecorresponding converted nano-layered templates are shown inFig. 5. For both IR spectra, the bands centered at about 3450 cm−1
and 1630 cm−1 are attributed, respectively, to the O H stretching
Fig. 5. FTIR spectra of (a) the raw nano-layered templates, and (b) the correspondingconverted nano-layered templates.
J. Chen et al. / Journal of Power Sources 209 (2012) 7– 14 11
Fto
ampasbt3ctTs
acLtwLbsFpiLilw
3
t1
ig. 6. FTIR spectra of the LiFePO4 particles (a) converted hydrothermally fromhe nano-layered templates and (b) synthesized hydrothermally without the usef nano-layered templates.
nd the H O H bending of water molecules [39,41]. The waterolecules are in crystallized state in the raw nano-layered tem-
lates since both the O H stretching and the H O H bending peaksre strong and sharp, while the water molecules are in adsorbedtate in the final nano-layered templates since the correspondingands are weak and broad [41]. The C H stretching and skele-al vibrations of the phenyl group, which are clearly shown at057 and 1437 cm−1 for the raw nano-layered templates, disappearompletely for the final nano-layered templates indicating thathe phenyl group decomposes during pyrolysis conversion [41,43].he bands in the range of 1000–1200 cm−1 correspond to the P Otretching vibrations [39,41,43,51].
From the O H stretching and H O H bending centered atbout 3450 and 1630 cm−1 as shown in Fig. 6, it can be con-luded that water molecules are absorbed in both the nano-layerediFePO4 particles converted hydrothermally from the nano-layeredemplates and the LiFePO4 particles synthesized hydrothermallyithout the use of nano-layered templates. For the nano-layered
iFePO4 (Fig. 6a), the four peaks at 943, 1052, 1094, 1138 cm−1 com-ined into an intensive broaden peak, due to the asymmetric P Otretching vibrations, are in good agreement with literature [45].or the LiFePO4 synthesized without the use of nano-layered tem-lates (Fig. 6b), the combined peak ranging from 721 to 1464 cm−1
s much broader than the corresponding peak of the nano-layerediFePO4. The asymmetric OPO bending modes split into four peaksn the range from 545 to 650 cm−1 [45]. Furthermore, the Li+ trans-ational vibrations at 466 and 500 cm−1 are also in good agreement
ith literature [52].
.4. Raman spectrum
The Raman spectrum, frequently used to characterize the struc-ure of carbon, shows two broad bands centered at 1350 and600 cm−1 for the nano-layered LiFePO4 particles (Fig. 7). These
Fig. 7. Raman spectrum of the nano-layered LiFePO4 particles.
Fig. 8. Nyquist plot of the electrical impedance spectroscopy of a coin cell assembledwith the nano-layered LiFePO4 particles; and the inset shows the linear relationshipbetween the Warburg impedance and the inverse square root of angular frequency.
two bands are usually assigned as the D-band (disordered) andG-band (graphitic) [53,54]. Improved electronic conductivity isexpectable for the nano-layered LiFePO4 particles since the inten-sity of graphitic G-band is higher than the disordered D-band [55].The peaks at 630, 950, 997, and 1068 cm−1 correspond to the vibra-tions of the PO4
3− of the nano-layered LiFePO4 particles [45,56].Since a thick layer of carbon will shield the Raman signals of thePO4
3− vibrations of the LiFePO4/C composites, these Raman signalsare observable only in pure LiFePO4 or LiFePO4 samples consistingof tiny carbon particles [56–58]. Therefore, it can be concluded thatthe carbon particles are not agglomerated during the pyrolysis con-version and hydrothermal conversion and are well dispersed in thenano-layered LiFePO4 particles.
3.5. Chemical compositions
The Li, P, and Fe contents of the raw nano-layered templates,the final nano-layered templates, and nano-layered LiFePO4 parti-cles were determined using the ICP test. For the raw nano-layeredtemplates, the contents for Fe and P are 15.31% and 13.44%, corre-sponding to a Fe/P molar ratio of 1/1.71. For the final nano-layeredtemplates, the contents for Fe and P are 26.10% and 21.99%, corre-sponding to a Fe/P molar ratio of 1/1.64 without significant changeduring pyrolysis conversion.
The contents of Li, Fe, and P for the hydrothermally convertednano-layered LiFePO4 particles are 5.19%, 31.09%, and 14.77%, cor-responding to a Li/Fe/P molar ratio of 1.34/1/0.86.
3.6. Electronic conductivity and Li+ diffusion dynamics
The electronic conductivity of the nano-layered LiFePO4 parti-cles was evaluated from the resistance of compacted slabs pressedbetween two circular platinum electrodes at room temperature.The compacted density of the nano-layered LiFePO4 particles is2.75 g cm−3 (the slab mass divided by its volume), about 77% of thecrystalline density of LiFePO4 at 3.59 g cm−3. The average electronicconductivity of the nano-layered LiFePO4 is 3.28 mS cm−1 whichis more than six orders of magnitude higher than that of pristineLiFePO4 (<10−9 S cm−1) and is comparable to the experimen-tal conductivities of LiFePO4 blended with conductive materials[18,38,55,59].
The electrical impedance spectroscopy was applied to the study+
of Li diffusion dynamics in the coin cell assembled with the nano-layered LiFePO4 particles. In Fig. 8, it shows the typical Nyquistplot of the electrical impedance spectroscopy in the frequenciesranging from 10 mHz to 100 kHz. The intercept at the Z′ axis at
12 J. Chen et al. / Journal of Power Sources 209 (2012) 7– 14
Flr
hTctrpf
D
wctdaa
−
fStsopa3
vtssaroicipc
pstu
I
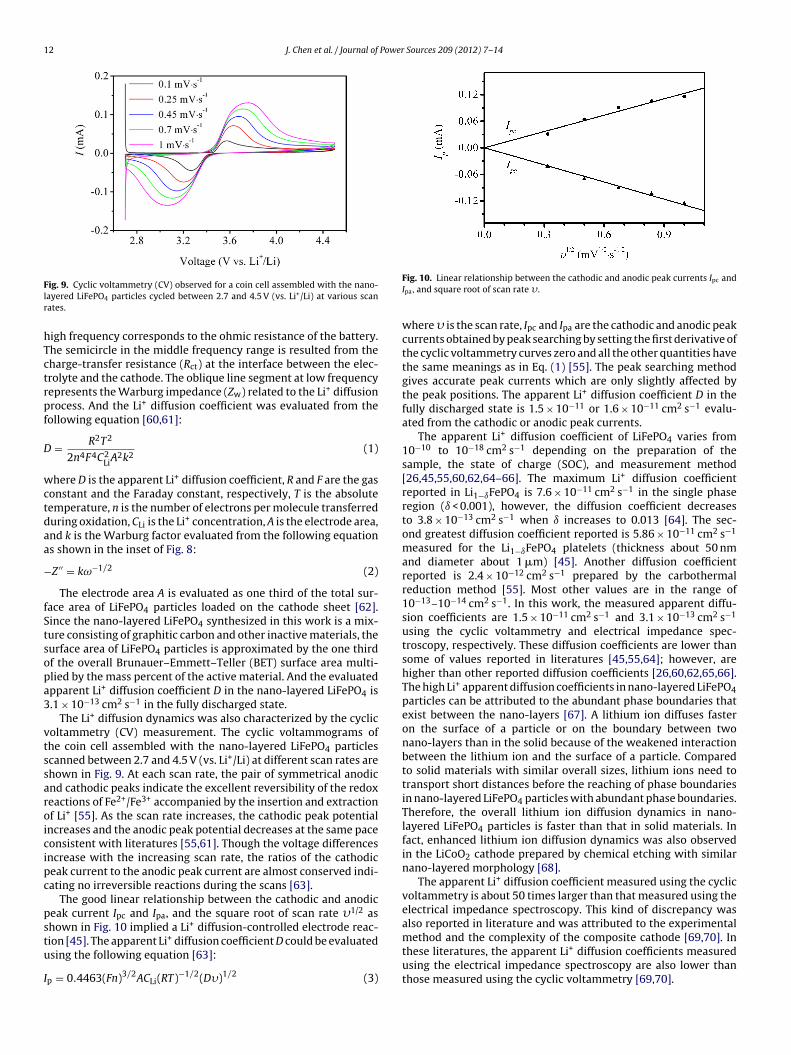
ig. 9. Cyclic voltammetry (CV) observed for a coin cell assembled with the nano-ayered LiFePO4 particles cycled between 2.7 and 4.5 V (vs. Li+/Li) at various scanates.
igh frequency corresponds to the ohmic resistance of the battery.he semicircle in the middle frequency range is resulted from theharge-transfer resistance (Rct) at the interface between the elec-rolyte and the cathode. The oblique line segment at low frequencyepresents the Warburg impedance (Zw) related to the Li+ diffusionrocess. And the Li+ diffusion coefficient was evaluated from theollowing equation [60,61]:
= R2T2
2n4F4C2LiA
2k2(1)
here D is the apparent Li+ diffusion coefficient, R and F are the gasonstant and the Faraday constant, respectively, T is the absoluteemperature, n is the number of electrons per molecule transferreduring oxidation, CLi is the Li+ concentration, A is the electrode area,nd k is the Warburg factor evaluated from the following equations shown in the inset of Fig. 8:
Z ′′ = kω−1/2 (2)
The electrode area A is evaluated as one third of the total sur-ace area of LiFePO4 particles loaded on the cathode sheet [62].ince the nano-layered LiFePO4 synthesized in this work is a mix-ure consisting of graphitic carbon and other inactive materials, theurface area of LiFePO4 particles is approximated by the one thirdf the overall Brunauer–Emmett–Teller (BET) surface area multi-lied by the mass percent of the active material. And the evaluatedpparent Li+ diffusion coefficient D in the nano-layered LiFePO4 is.1 × 10−13 cm2 s−1 in the fully discharged state.
The Li+ diffusion dynamics was also characterized by the cyclicoltammetry (CV) measurement. The cyclic voltammograms ofhe coin cell assembled with the nano-layered LiFePO4 particlescanned between 2.7 and 4.5 V (vs. Li+/Li) at different scan rates arehown in Fig. 9. At each scan rate, the pair of symmetrical anodicnd cathodic peaks indicate the excellent reversibility of the redoxeactions of Fe2+/Fe3+ accompanied by the insertion and extractionf Li+ [55]. As the scan rate increases, the cathodic peak potentialncreases and the anodic peak potential decreases at the same paceonsistent with literatures [55,61]. Though the voltage differencesncrease with the increasing scan rate, the ratios of the cathodiceak current to the anodic peak current are almost conserved indi-ating no irreversible reactions during the scans [63].
The good linear relationship between the cathodic and anodiceak current Ipc and Ipa, and the square root of scan rate �1/2 ashown in Fig. 10 implied a Li+ diffusion-controlled electrode reac-
ion [45]. The apparent Li+ diffusion coefficient D could be evaluatedsing the following equation [63]:p = 0.4463(Fn)3/2ACLi(RT)−1/2(D�)1/2 (3)
Fig. 10. Linear relationship between the cathodic and anodic peak currents Ipc andIpa, and square root of scan rate �.
where � is the scan rate, Ipc and Ipa are the cathodic and anodic peakcurrents obtained by peak searching by setting the first derivative ofthe cyclic voltammetry curves zero and all the other quantities havethe same meanings as in Eq. (1) [55]. The peak searching methodgives accurate peak currents which are only slightly affected bythe peak positions. The apparent Li+ diffusion coefficient D in thefully discharged state is 1.5 × 10⁻¹¹ or 1.6 × 10⁻¹¹ cm2 s−1 evalu-ated from the cathodic or anodic peak currents.
The apparent Li+ diffusion coefficient of LiFePO4 varies from10−10 to 10−18 cm2 s−1 depending on the preparation of thesample, the state of charge (SOC), and measurement method[26,45,55,60,62,64–66]. The maximum Li+ diffusion coefficientreported in Li1−ıFePO4 is 7.6 × 10⁻¹¹ cm2 s−1 in the single phaseregion (ı < 0.001), however, the diffusion coefficient decreasesto 3.8 × 10⁻¹³ cm2 s−1 when ı increases to 0.013 [64]. The sec-ond greatest diffusion coefficient reported is 5.86 × 10⁻¹¹ cm2 s−1
measured for the Li1−ıFePO4 platelets (thickness about 50 nmand diameter about 1 �m) [45]. Another diffusion coefficientreported is 2.4 × 10⁻¹² cm2 s−1 prepared by the carbothermalreduction method [55]. Most other values are in the range of10−13–10−14 cm2 s−1. In this work, the measured apparent diffu-sion coefficients are 1.5 × 10⁻¹¹ cm2 s−1 and 3.1 × 10⁻¹³ cm2 s−1
using the cyclic voltammetry and electrical impedance spec-troscopy, respectively. These diffusion coefficients are lower thansome of values reported in literatures [45,55,64]; however, arehigher than other reported diffusion coefficients [26,60,62,65,66].The high Li+ apparent diffusion coefficients in nano-layered LiFePO4particles can be attributed to the abundant phase boundaries thatexist between the nano-layers [67]. A lithium ion diffuses fasteron the surface of a particle or on the boundary between twonano-layers than in the solid because of the weakened interactionbetween the lithium ion and the surface of a particle. Comparedto solid materials with similar overall sizes, lithium ions need totransport short distances before the reaching of phase boundariesin nano-layered LiFePO4 particles with abundant phase boundaries.Therefore, the overall lithium ion diffusion dynamics in nano-layered LiFePO4 particles is faster than that in solid materials. Infact, enhanced lithium ion diffusion dynamics was also observedin the LiCoO2 cathode prepared by chemical etching with similarnano-layered morphology [68].
The apparent Li+ diffusion coefficient measured using the cyclicvoltammetry is about 50 times larger than that measured using theelectrical impedance spectroscopy. This kind of discrepancy wasalso reported in literature and was attributed to the experimental
method and the complexity of the composite cathode [69,70]. Inthese literatures, the apparent Li+ diffusion coefficients measuredusing the electrical impedance spectroscopy are also lower thanthose measured using the cyclic voltammetry [69,70].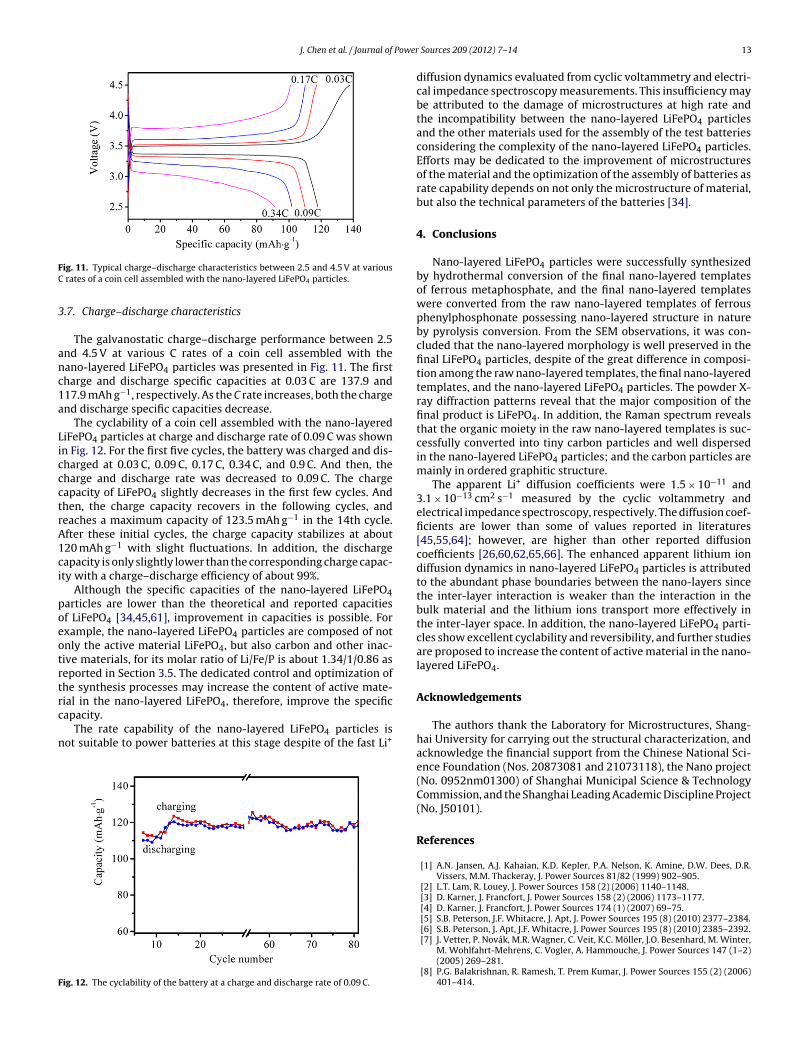
J. Chen et al. / Journal of Power
FC
3
anc1a
LiccctrA1ci
poeotrtrc
n
F
ig. 11. Typical charge–discharge characteristics between 2.5 and 4.5 V at various rates of a coin cell assembled with the nano-layered LiFePO4 particles.
.7. Charge–discharge characteristics
The galvanostatic charge–discharge performance between 2.5nd 4.5 V at various C rates of a coin cell assembled with theano-layered LiFePO4 particles was presented in Fig. 11. The firstharge and discharge specific capacities at 0.03 C are 137.9 and17.9 mAh g−1, respectively. As the C rate increases, both the chargend discharge specific capacities decrease.
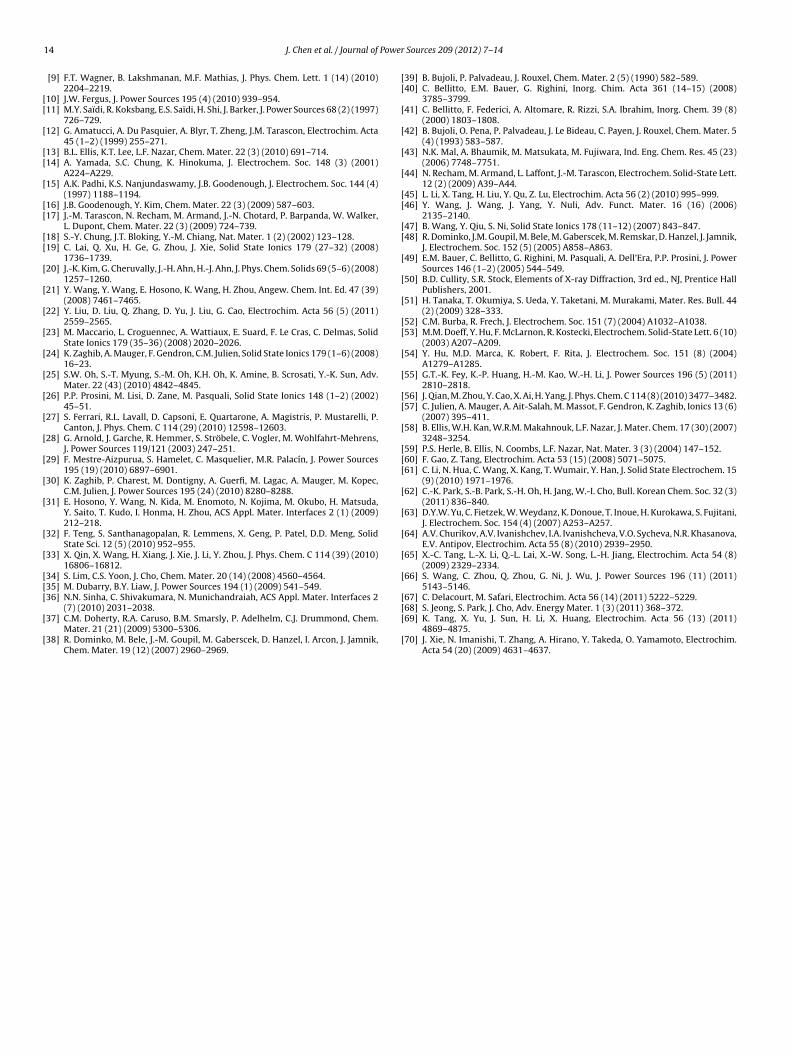
The cyclability of a coin cell assembled with the nano-layerediFePO4 particles at charge and discharge rate of 0.09 C was shownn Fig. 12. For the first five cycles, the battery was charged and dis-harged at 0.03 C, 0.09 C, 0.17 C, 0.34 C, and 0.9 C. And then, theharge and discharge rate was decreased to 0.09 C. The chargeapacity of LiFePO4 slightly decreases in the first few cycles. Andhen, the charge capacity recovers in the following cycles, andeaches a maximum capacity of 123.5 mAh g−1 in the 14th cycle.fter these initial cycles, the charge capacity stabilizes at about20 mAh g−1 with slight fluctuations. In addition, the dischargeapacity is only slightly lower than the corresponding charge capac-ty with a charge–discharge efficiency of about 99%.
Although the specific capacities of the nano-layered LiFePO4articles are lower than the theoretical and reported capacitiesf LiFePO4 [34,45,61], improvement in capacities is possible. Forxample, the nano-layered LiFePO4 particles are composed of notnly the active material LiFePO4, but also carbon and other inac-ive materials, for its molar ratio of Li/Fe/P is about 1.34/1/0.86 aseported in Section 3.5. The dedicated control and optimization ofhe synthesis processes may increase the content of active mate-ial in the nano-layered LiFePO , therefore, improve the specific
4apacity.The rate capability of the nano-layered LiFePO4 particles isot suitable to power batteries at this stage despite of the fast Li+
ig. 12. The cyclability of the battery at a charge and discharge rate of 0.09 C.
Sources 209 (2012) 7– 14 13
diffusion dynamics evaluated from cyclic voltammetry and electri-cal impedance spectroscopy measurements. This insufficiency maybe attributed to the damage of microstructures at high rate andthe incompatibility between the nano-layered LiFePO4 particlesand the other materials used for the assembly of the test batteriesconsidering the complexity of the nano-layered LiFePO4 particles.Efforts may be dedicated to the improvement of microstructuresof the material and the optimization of the assembly of batteries asrate capability depends on not only the microstructure of material,but also the technical parameters of the batteries [34].
4. Conclusions
Nano-layered LiFePO4 particles were successfully synthesizedby hydrothermal conversion of the final nano-layered templatesof ferrous metaphosphate, and the final nano-layered templateswere converted from the raw nano-layered templates of ferrousphenylphosphonate possessing nano-layered structure in natureby pyrolysis conversion. From the SEM observations, it was con-cluded that the nano-layered morphology is well preserved in thefinal LiFePO4 particles, despite of the great difference in composi-tion among the raw nano-layered templates, the final nano-layeredtemplates, and the nano-layered LiFePO4 particles. The powder X-ray diffraction patterns reveal that the major composition of thefinal product is LiFePO4. In addition, the Raman spectrum revealsthat the organic moiety in the raw nano-layered templates is suc-cessfully converted into tiny carbon particles and well dispersedin the nano-layered LiFePO4 particles; and the carbon particles aremainly in ordered graphitic structure.
The apparent Li+ diffusion coefficients were 1.5 × 10⁻¹¹ and3.1 × 10−13 cm2 s−1 measured by the cyclic voltammetry andelectrical impedance spectroscopy, respectively. The diffusion coef-ficients are lower than some of values reported in literatures[45,55,64]; however, are higher than other reported diffusioncoefficients [26,60,62,65,66]. The enhanced apparent lithium iondiffusion dynamics in nano-layered LiFePO4 particles is attributedto the abundant phase boundaries between the nano-layers sincethe inter-layer interaction is weaker than the interaction in thebulk material and the lithium ions transport more effectively inthe inter-layer space. In addition, the nano-layered LiFePO4 parti-cles show excellent cyclability and reversibility, and further studiesare proposed to increase the content of active material in the nano-layered LiFePO4.
Acknowledgements
The authors thank the Laboratory for Microstructures, Shang-hai University for carrying out the structural characterization, andacknowledge the financial support from the Chinese National Sci-ence Foundation (Nos. 20873081 and 21073118), the Nano project(No. 0952nm01300) of Shanghai Municipal Science & TechnologyCommission, and the Shanghai Leading Academic Discipline Project(No. J50101).
References
[1] A.N. Jansen, A.J. Kahaian, K.D. Kepler, P.A. Nelson, K. Amine, D.W. Dees, D.R.Vissers, M.M. Thackeray, J. Power Sources 81/82 (1999) 902–905.
[2] L.T. Lam, R. Louey, J. Power Sources 158 (2) (2006) 1140–1148.[3] D. Karner, J. Francfort, J. Power Sources 158 (2) (2006) 1173–1177.[4] D. Karner, J. Francfort, J. Power Sources 174 (1) (2007) 69–75.[5] S.B. Peterson, J.F. Whitacre, J. Apt, J. Power Sources 195 (8) (2010) 2377–2384.[6] S.B. Peterson, J. Apt, J.F. Whitacre, J. Power Sources 195 (8) (2010) 2385–2392.
[7] J. Vetter, P. Novák, M.R. Wagner, C. Veit, K.C. Möller, J.O. Besenhard, M. Winter,M. Wohlfahrt-Mehrens, C. Vogler, A. Hammouche, J. Power Sources 147 (1–2)(2005) 269–281.
[8] P.G. Balakrishnan, R. Ramesh, T. Prem Kumar, J. Power Sources 155 (2) (2006)401–414.
1 Power
[[
[
[[
[
[[
[[
[
[
[
[
[
[
[
[
[
[
[
[
[
[
[[[
[
[
[[
[
[
[
[
[[
[[
[
[
[
[[
[
[
[[
[
[[[
[
[
[
[
[
[
4 J. Chen et al. / Journal of
[9] F.T. Wagner, B. Lakshmanan, M.F. Mathias, J. Phys. Chem. Lett. 1 (14) (2010)2204–2219.
10] J.W. Fergus, J. Power Sources 195 (4) (2010) 939–954.11] M.Y. Saïdi, R. Koksbang, E.S. Saïdi, H. Shi, J. Barker, J. Power Sources 68 (2) (1997)
726–729.12] G. Amatucci, A. Du Pasquier, A. Blyr, T. Zheng, J.M. Tarascon, Electrochim. Acta
45 (1–2) (1999) 255–271.13] B.L. Ellis, K.T. Lee, L.F. Nazar, Chem. Mater. 22 (3) (2010) 691–714.14] A. Yamada, S.C. Chung, K. Hinokuma, J. Electrochem. Soc. 148 (3) (2001)
A224–A229.15] A.K. Padhi, K.S. Nanjundaswamy, J.B. Goodenough, J. Electrochem. Soc. 144 (4)
(1997) 1188–1194.16] J.B. Goodenough, Y. Kim, Chem. Mater. 22 (3) (2009) 587–603.17] J.-M. Tarascon, N. Recham, M. Armand, J.-N. Chotard, P. Barpanda, W. Walker,
L. Dupont, Chem. Mater. 22 (3) (2009) 724–739.18] S.-Y. Chung, J.T. Bloking, Y.-M. Chiang, Nat. Mater. 1 (2) (2002) 123–128.19] C. Lai, Q. Xu, H. Ge, G. Zhou, J. Xie, Solid State Ionics 179 (27–32) (2008)
1736–1739.20] J.-K. Kim, G. Cheruvally, J.-H. Ahn, H.-J. Ahn, J. Phys. Chem. Solids 69 (5–6) (2008)
1257–1260.21] Y. Wang, Y. Wang, E. Hosono, K. Wang, H. Zhou, Angew. Chem. Int. Ed. 47 (39)
(2008) 7461–7465.22] Y. Liu, D. Liu, Q. Zhang, D. Yu, J. Liu, G. Cao, Electrochim. Acta 56 (5) (2011)
2559–2565.23] M. Maccario, L. Croguennec, A. Wattiaux, E. Suard, F. Le Cras, C. Delmas, Solid
State Ionics 179 (35–36) (2008) 2020–2026.24] K. Zaghib, A. Mauger, F. Gendron, C.M. Julien, Solid State Ionics 179 (1–6) (2008)
16–23.25] S.W. Oh, S.-T. Myung, S.-M. Oh, K.H. Oh, K. Amine, B. Scrosati, Y.-K. Sun, Adv.
Mater. 22 (43) (2010) 4842–4845.26] P.P. Prosini, M. Lisi, D. Zane, M. Pasquali, Solid State Ionics 148 (1–2) (2002)
45–51.27] S. Ferrari, R.L. Lavall, D. Capsoni, E. Quartarone, A. Magistris, P. Mustarelli, P.
Canton, J. Phys. Chem. C 114 (29) (2010) 12598–12603.28] G. Arnold, J. Garche, R. Hemmer, S. Ströbele, C. Vogler, M. Wohlfahrt-Mehrens,
J. Power Sources 119/121 (2003) 247–251.29] F. Mestre-Aizpurua, S. Hamelet, C. Masquelier, M.R. Palacín, J. Power Sources
195 (19) (2010) 6897–6901.30] K. Zaghib, P. Charest, M. Dontigny, A. Guerfi, M. Lagac, A. Mauger, M. Kopec,
C.M. Julien, J. Power Sources 195 (24) (2010) 8280–8288.31] E. Hosono, Y. Wang, N. Kida, M. Enomoto, N. Kojima, M. Okubo, H. Matsuda,
Y. Saito, T. Kudo, I. Honma, H. Zhou, ACS Appl. Mater. Interfaces 2 (1) (2009)212–218.
32] F. Teng, S. Santhanagopalan, R. Lemmens, X. Geng, P. Patel, D.D. Meng, SolidState Sci. 12 (5) (2010) 952–955.
33] X. Qin, X. Wang, H. Xiang, J. Xie, J. Li, Y. Zhou, J. Phys. Chem. C 114 (39) (2010)16806–16812.
34] S. Lim, C.S. Yoon, J. Cho, Chem. Mater. 20 (14) (2008) 4560–4564.35] M. Dubarry, B.Y. Liaw, J. Power Sources 194 (1) (2009) 541–549.36] N.N. Sinha, C. Shivakumara, N. Munichandraiah, ACS Appl. Mater. Interfaces 2
(7) (2010) 2031–2038.37] C.M. Doherty, R.A. Caruso, B.M. Smarsly, P. Adelhelm, C.J. Drummond, Chem.
Mater. 21 (21) (2009) 5300–5306.38] R. Dominko, M. Bele, J.-M. Goupil, M. Gaberscek, D. Hanzel, I. Arcon, J. Jamnik,
Chem. Mater. 19 (12) (2007) 2960–2969.
[[
[
Sources 209 (2012) 7– 14
39] B. Bujoli, P. Palvadeau, J. Rouxel, Chem. Mater. 2 (5) (1990) 582–589.40] C. Bellitto, E.M. Bauer, G. Righini, Inorg. Chim. Acta 361 (14–15) (2008)
3785–3799.41] C. Bellitto, F. Federici, A. Altomare, R. Rizzi, S.A. Ibrahim, Inorg. Chem. 39 (8)
(2000) 1803–1808.42] B. Bujoli, O. Pena, P. Palvadeau, J. Le Bideau, C. Payen, J. Rouxel, Chem. Mater. 5
(4) (1993) 583–587.43] N.K. Mal, A. Bhaumik, M. Matsukata, M. Fujiwara, Ind. Eng. Chem. Res. 45 (23)
(2006) 7748–7751.44] N. Recham, M. Armand, L. Laffont, J.-M. Tarascon, Electrochem. Solid-State Lett.
12 (2) (2009) A39–A44.45] L. Li, X. Tang, H. Liu, Y. Qu, Z. Lu, Electrochim. Acta 56 (2) (2010) 995–999.46] Y. Wang, J. Wang, J. Yang, Y. Nuli, Adv. Funct. Mater. 16 (16) (2006)
2135–2140.47] B. Wang, Y. Qiu, S. Ni, Solid State Ionics 178 (11–12) (2007) 843–847.48] R. Dominko, J.M. Goupil, M. Bele, M. Gaberscek, M. Remskar, D. Hanzel, J. Jamnik,
J. Electrochem. Soc. 152 (5) (2005) A858–A863.49] E.M. Bauer, C. Bellitto, G. Righini, M. Pasquali, A. Dell’Era, P.P. Prosini, J. Power
Sources 146 (1–2) (2005) 544–549.50] B.D. Cullity, S.R. Stock, Elements of X-ray Diffraction, 3rd ed., NJ, Prentice Hall
Publishers, 2001.51] H. Tanaka, T. Okumiya, S. Ueda, Y. Taketani, M. Murakami, Mater. Res. Bull. 44
(2) (2009) 328–333.52] C.M. Burba, R. Frech, J. Electrochem. Soc. 151 (7) (2004) A1032–A1038.53] M.M. Doeff, Y. Hu, F. McLarnon, R. Kostecki, Electrochem. Solid-State Lett. 6 (10)
(2003) A207–A209.54] Y. Hu, M.D. Marca, K. Robert, F. Rita, J. Electrochem. Soc. 151 (8) (2004)
A1279–A1285.55] G.T.-K. Fey, K.-P. Huang, H.-M. Kao, W.-H. Li, J. Power Sources 196 (5) (2011)
2810–2818.56] J. Qian, M. Zhou, Y. Cao, X. Ai, H. Yang, J. Phys. Chem. C 114 (8) (2010) 3477–3482.57] C. Julien, A. Mauger, A. Ait-Salah, M. Massot, F. Gendron, K. Zaghib, Ionics 13 (6)
(2007) 395–411.58] B. Ellis, W.H. Kan, W.R.M. Makahnouk, L.F. Nazar, J. Mater. Chem. 17 (30) (2007)
3248–3254.59] P.S. Herle, B. Ellis, N. Coombs, L.F. Nazar, Nat. Mater. 3 (3) (2004) 147–152.60] F. Gao, Z. Tang, Electrochim. Acta 53 (15) (2008) 5071–5075.61] C. Li, N. Hua, C. Wang, X. Kang, T. Wumair, Y. Han, J. Solid State Electrochem. 15
(9) (2010) 1971–1976.62] C.-K. Park, S.-B. Park, S.-H. Oh, H. Jang, W.-I. Cho, Bull. Korean Chem. Soc. 32 (3)
(2011) 836–840.63] D.Y.W. Yu, C. Fietzek, W. Weydanz, K. Donoue, T. Inoue, H. Kurokawa, S. Fujitani,
J. Electrochem. Soc. 154 (4) (2007) A253–A257.64] A.V. Churikov, A.V. Ivanishchev, I.A. Ivanishcheva, V.O. Sycheva, N.R. Khasanova,
E.V. Antipov, Electrochim. Acta 55 (8) (2010) 2939–2950.65] X.-C. Tang, L.-X. Li, Q.-L. Lai, X.-W. Song, L.-H. Jiang, Electrochim. Acta 54 (8)
(2009) 2329–2334.66] S. Wang, C. Zhou, Q. Zhou, G. Ni, J. Wu, J. Power Sources 196 (11) (2011)
5143–5146.67] C. Delacourt, M. Safari, Electrochim. Acta 56 (14) (2011) 5222–5229.
68] S. Jeong, S. Park, J. Cho, Adv. Energy Mater. 1 (3) (2011) 368–372.69] K. Tang, X. Yu, J. Sun, H. Li, X. Huang, Electrochim. Acta 56 (13) (2011)4869–4875.70] J. Xie, N. Imanishi, T. Zhang, A. Hirano, Y. Takeda, O. Yamamoto, Electrochim.
Acta 54 (20) (2009) 4631–4637.