Embed Size (px)
Citation preview

1
NANI Calculator Toolbox Version 3 Documentation
Bongghi Hong and Dennis P. Swaney June 26, 2013
Table of Contents 1. Introduction.................................................................................................................................................................................... 2 2. Input watershed map................................................................................................................................................................ 3 3. Updates on NANI GIS tools..................................................................................................................................................... 4 3.1. Setting up NANI GIS tools.................................................................................................................................. 4 3.2. Calculating county proportions...................................................................................................................... 6 3.3. Calculating grid proportions............................................................................................................................. 7 4. NANI extraction tools.............................................................................................................................................................. ... 8 4.1. Extracting crop data.............................................................................................................................................. 8 4.2. Extracting livestock data.................................................................................................................................... 10 4.3. Extracting Census data........................................................................................................................................ 11 4.4. Extracting fertilizer data..................................................................................................................................... 12 4.5. Extracting N deposition...................................................................................................................................... 12 5. NANI accounting tool................................................................................................................................................................. 13 5.1. N in net food and feed imports...................................................................................................................... 14 5.1.1. Crop N production........................................................................................................................... 14 5.1.2. Livestock N consumption............................................................................................................. 14 5.1.3. Livestock N production................................................................................................................. 15 5.1.4. Human N consumption................................................................................................................. 16 5.2. Agricultural N fixation.......................................................................................................................................... 17 5.3. Fertilizer N application........................................................................................................................................ 18 5.4. Atmospheric N deposition................................................................................................................................ 19 5.5. N in non-food crop export................................................................................................................................. 20 5.6. NANI...............................................................................................................................................................................20 6. New additions to NANI accounting tool.......................................................................................................................... 21 6.1. Calculating NANI all at once............................................................................................................................. 21 6.2. Tabulating NANI variables................................................................................................................................. 21 6.3. Tabulating NANI parameters........................................................................................................................... 22 7. NANI function................................................................................................................................................................................. 23 A. Appendix........................................................................................................................................................................................... 25 A.1. Distributing map data.......................................................................................................................................... 25 A.2. Excel VBA-based “Calculate Map Proportions” tool.......................................................................... 26 B. References....................................................................................................................................................................................... 30

2
1. Introduction
This document describes calculation of NANI (Net Anthropogenic Nitrogen Inputs) as reported in Hong et al. (2013) and provides a step-by-step guide to running version 3 of NANI calculator toolbox. New features added to version 3 of the toolbox are also discussed. Detailed description of NANI and its application are given in Howarth et al. (1996, 2006, 2012) and Swaney et al. (2012). Introduction to NANI calculator toolbox and documentation of version 1 and 2 of NANI toolbox can be found in Hong et al. (2011, 2012) and on the web (http://www.eeb.cornell.edu/biogeo/nanc/nani/nani.htm and http://www.balticnest.org/balticnest/research/publications/).
Briefly, NANI estimates the human-controlled nitrogen inputs to a watershed and has been shown to be a good predictor of riverine nitrogen export across watersheds of the U.S., Europe, and Asia on a large scale, multiyear average basis. It is typically calculated as the sum of four major components: atmospheric N deposition, fertilizer N application, agricultural N fixation, and N in net food and feed imports. The net food and feed imports in turn are composed of crop and livestock N production, representing negative fluxes removing N from watersheds, and livestock and human N consumption, positive fluxes adding N to watersheds. NANI is detailed enough to incorporate available data on individual crops, livestock, and people into a mass balance approach (Figure 1.1), but simple enough to be calculated with a relatively small set of parameters that are estimated from existing literature. Since its first introduction, alternative methods for calculating NANI have been proposed by numerous researchers. The NANI calculator toolbox attempts to incorporate various NANI calculations proposed in the earlier literature so that any large-scale assessment may be evaluated without regional discrepancies in methods, assumptions, or data sources. Alternative NANI calculations may be selected by the user and tested through a sensitivity analysis. Howarth et al. (2006) describe calculations of NANI and its components for the 16 northeastern U.S. watersheds and discuss their underlying assumptions. NANI calculation by the version 1 of NANI toolbox, applied at the national scale as reported in Hong et al. (2011), was very close to that in Howarth et al. (2006), and produced comparable NANI values for the 16 northeastern U.S. watersheds. The second version of the toolbox was developed for application in catchments of the transnational Baltic Sea drainage basin (Hong et al., 2012), where substantial differences in agricultural practices and dietary preferences are exhibited among the European countries whose watersheds comprise the basin, as well as variations and gaps in the data collected by different countries. The changes made in the toolbox (allowing spatial variation of NANI parameters, distributing regional data into smaller spatial units, and accepting auxiliary data sets) did not affect the NANI calculation for the U.S. Hong et al. (2013) describe additional changes in the NANI calculation for the U.S. watersheds (referred to as version 3, or “v3”) incorporating most of the earlier considerations and suggestions from the previous studies. A number of updates and new features were added to the toolbox as well, including porting the NANI GIS tools to ArcGIS Python (ArcPy) and developing a functional form of the NANI toolbox called “NANI function” for repeated calculations of NANI with varying parameters, useful for sensitivity or Monte Carlo analysis. These new features are described below, as well as step-by-step walkthrough of the NANI calculation for the U.S. watersheds as reported in Hong et al. (2013).

3
Figure 1.1. Overview of NANI and its components (from Hong et al. 2011).
2. Input watershed map The NANI calculator toolbox calculates NANI and its components from a map of watershed(s) that can be read by ESRI’s ArcGIS software. In this study, we used a total of 106 U.S. watersheds (Figure 2.1), including:
Figure 2.1. Map of 106 U.S. watersheds used in this study (revised from Hong et al. 2013).

4
16 northeastern US watersheds (Howarth et al. 2006)
12 southeastern US watersheds (Schaefer and Alber 2007)
18 Lake Michigan watersheds (Han and Allan 2008)
18 Western US watersheds (Schaefer et al. 2009)
42 Mississippi watersheds (Goolsby et al. 1999) Note that some Mississippi watersheds are nested (for example, the “Cedar R at Cedar Falls” watershed is part of the “Iowa R at Wapello” watershed). For the nested watersheds, each polygon used in this study represents the net area, instead of the whole watershed area. After running the toolbox, watershed-level NANI and its components were calculated manually. 3. Updates on NANI GIS tools The NANI GIS tools calculate the proportions of various regions (political or gridded) in which data are collected that fall into areas of interest such as watersheds. In versions 1 and 2 of the toolbox, the NANI GIS tools were implemented in ArcGIS using VBA (Visual Basic for Applications). Starting from ArcGIS 10, installation of VBA requires a license code, and ArcGIS 10 will be the last version with VBA support. As an alternative, we ported the NANI GIS tools to ArcGIS Python (ArcPy). In the following sections we show how to set up the new NANI GIS tools within ArcGIS, and provide walkthrough for running “Calculate Map Proportions” tool for calculating county and grid proportions falling into each of the 106 U.S. watersheds. Another NANI GIS tool, “Distribute Map Data,” which was implemented in the NANI toolbox, version 2 (applied to Baltic Sea catchments) to distribute regional data into smaller spatial units, was not used in this study, but its use is demonstrated in Appendix A. We also developed an Excel VBA version of the same procedure, which requires using a GIS software but not ArcGIS VBA. This procedure allows land use-based allocation of data, instead of area-based; see Hong et al. (2013) for detailed discussion. We describe this procedure in Appendix B. 3.1. Setting up NANI GIS tools To set up the NANI GIS tools running as ArcPy scripts, download the compressed file “NANI_GIS_Tools.zip” and unzip it. Start ArcGIS, open ArcToolbox panel, right-click on “ArcToolbox,” and select “Add Toolbox...” (Figure 3.1.1). Locate the toolbox file “NANI GIS Tools.tbx” from the unzipped folder, and a new toolbox “NANI GIS Tools” will be added to the ArcToolbox panel (Figure 3.1.2). Double-clicking “Calculate Map Proportions” and “Distribute Map Data” will open the user interface for the corresponding tools (Section 3.2 and Appendix A, respectively).
5
Figure 3.1.1. Adding NANI GIS tools to ArcToolbox.
Figure 3.1.2. NANI GIS tools added to ArcToolbox.
6
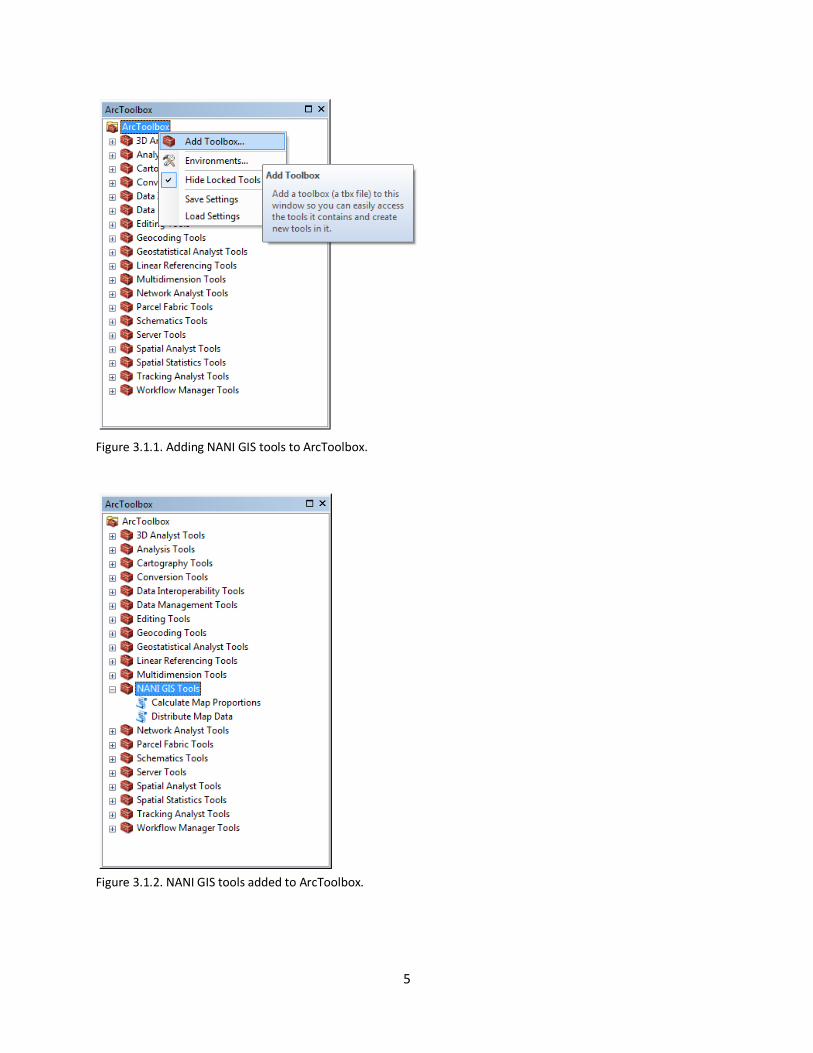
3.2. Calculating county proportions The “Calculate Map Proportions” tool (Figure 3.2.1) can be used to calculate the proportions of the U.S. counties falling into each of the 106 watersheds. The input maps needed for this analysis are the watershed map “US_Counties.shp” and the U.S. county map “US_Watersheds_V3.shp” available on the toolbox webpage. The “Calculate Map Proportions” tool (Section 3.1) can be opened and specified as shown below:
Figure 3.2.1. Calculating county proportions.
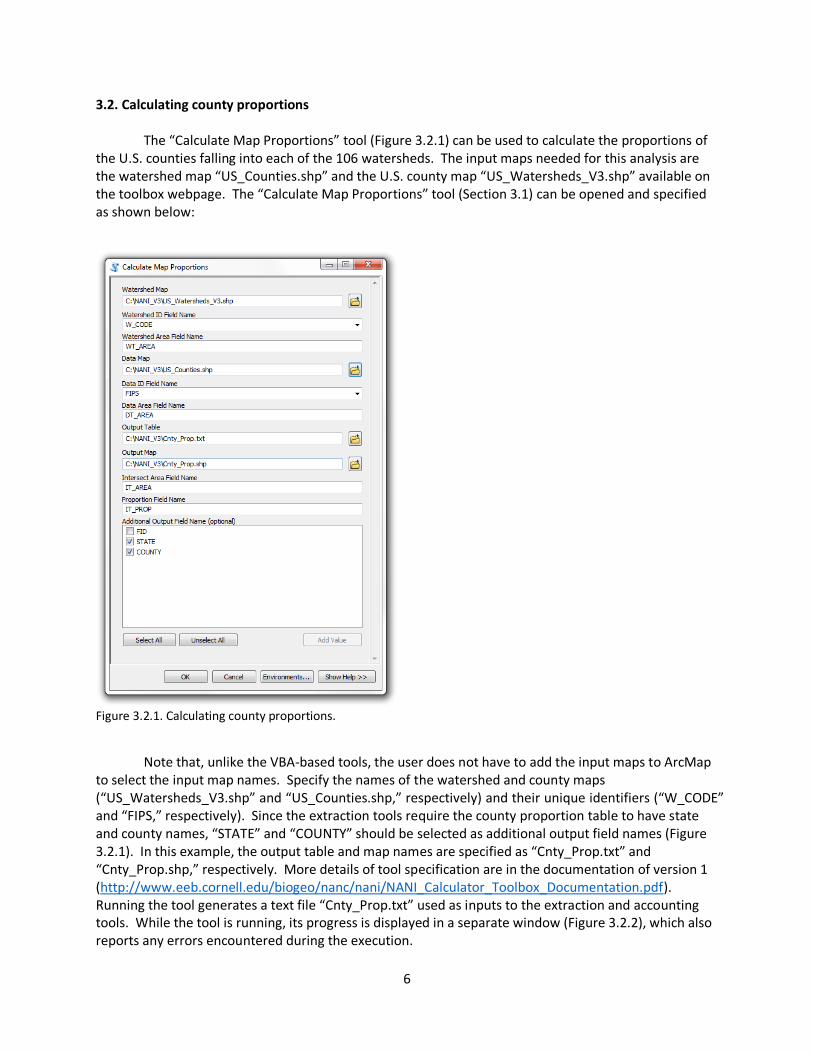
Note that, unlike the VBA-based tools, the user does not have to add the input maps to ArcMap to select the input map names. Specify the names of the watershed and county maps (“US_Watersheds_V3.shp” and “US_Counties.shp,” respectively) and their unique identifiers (“W_CODE” and “FIPS,” respectively). Since the extraction tools require the county proportion table to have state and county names, “STATE” and “COUNTY” should be selected as additional output field names (Figure 3.2.1). In this example, the output table and map names are specified as “Cnty_Prop.txt” and “Cnty_Prop.shp,” respectively. More details of tool specification are in the documentation of version 1 (http://www.eeb.cornell.edu/biogeo/nanc/nani/NANI_Calculator_Toolbox_Documentation.pdf). Running the tool generates a text file “Cnty_Prop.txt” used as inputs to the extraction and accounting tools. While the tool is running, its progress is displayed in a separate window (Figure 3.2.2), which also reports any errors encountered during the execution.

7
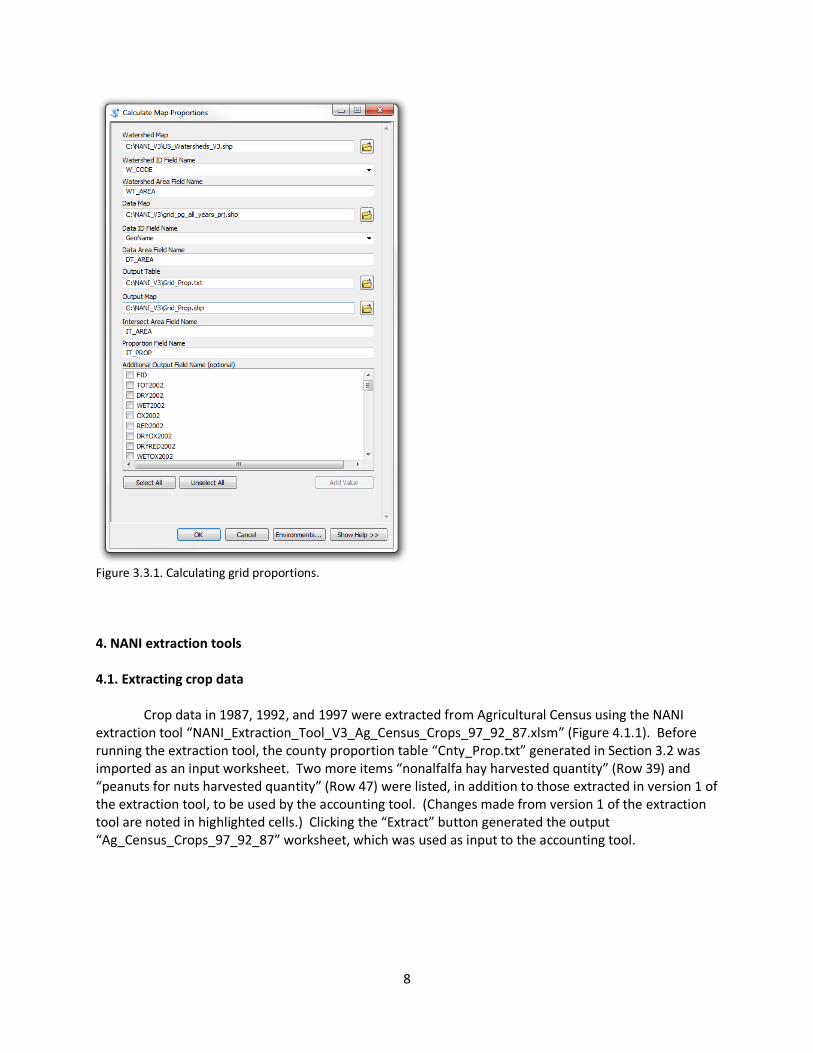
Figure 3.2.2. Tool execution progress window for “Calculate Map Proportions” tool. 3.3. Calculating grid proportions The proportions of CMAQ (Community Multiscale Air Quality) grid cells falling into each of the 106 watersheds were calculated using the “Calculate Map Proportions” tool (Figure 3.3.1). The input maps needed for this analysis are the watershed map “US_Counties.shp” and the CMAQ grid map “grid_pg_all_years_prj.shp” available on the toolbox webpage. The “Calculate Map Proportions” tool (Section 3.1) was opened and specified as shown in Figure 3.3.1. Running the tool generates a text file “Grid_Prop.txt” used as inputs to the extraction and accounting tools.
8
Figure 3.3.1. Calculating grid proportions. 4. NANI extraction tools 4.1. Extracting crop data Crop data in 1987, 1992, and 1997 were extracted from Agricultural Census using the NANI extraction tool “NANI_Extraction_Tool_V3_Ag_Census_Crops_97_92_87.xlsm” (Figure 4.1.1). Before running the extraction tool, the county proportion table “Cnty_Prop.txt” generated in Section 3.2 was imported as an input worksheet. Two more items “nonalfalfa hay harvested quantity” (Row 39) and “peanuts for nuts harvested quantity” (Row 47) were listed, in addition to those extracted in version 1 of the extraction tool, to be used by the accounting tool. (Changes made from version 1 of the extraction tool are noted in highlighted cells.) Clicking the “Extract” button generated the output “Ag_Census_Crops_97_92_87” worksheet, which was used as input to the accounting tool.

9
Figure 4.1.1. Extracting crop data in 1987, 1992, and 1997. Crop data in 2002 and 2007 were extracted from Agricultural Census using the NANI extraction tool “NANI_Extraction_Tool_V3_Ag_Census_Crops_07_02.xlsm” (Figure 4.1.2). Before running the extraction tool, the county proportion table “Cnty_Prop.txt” generated in Section 3.2 was imported as an input worksheet. Two more items “nonalfalfa hay harvested quantity” (Row 39) and “peanuts for nuts harvested quantity” (Row 47) were listed, in addition to those extracted in version 1 of the extraction tool, to be used by the accounting tool. (Changes made from version 1 of the extraction tool are noted in highlighted cells.) Clicking the “Extract” button generated the output “Ag_Census_Crops_07_02” worksheet, which was used as input to the accounting tool.
Figure 4.1.2. Extracting crop data in 2002 and 2007.

10
4.2. Extracting livestock data Livestock data in 1987, 1992, and 1997 were extracted from Agricultural Census using the NANI extraction tool “NANI_Extraction_Tool_V3_Ag_Census_Animals_97_92_87.xlsm” (Figure 4.2.1). Before running the extraction tool, the county proportion table “Cnty_Prop.txt” generated in Section 3.2 was imported as an input worksheet. Two more items “expected beef and dairy calves” (Row 63) and “estimated beef and dairy calves” (Row 64) were listed, in addition to those extracted in version 1 of the extraction tool, to be used by the accounting tool. (Changes made from version 1 of the extraction tool are noted in highlighted cells.) Clicking the “Extract” button generated the output “Ag_Census_Animals_97_92_87” worksheet, which was used as input to the accounting tool.
Figure 4.2.1. Extracting livestock data in 1987, 1992, and 1997. Livestock data in 2002 and 2007 were extracted from Agricultural Census using the NANI extraction tool “NANI_Extraction_Tool_V3_Ag_Census_Animals_07_02.xlsm” (Figure 4.2.2). Before running the extraction tool, the county proportion table “Cnty_Prop.txt” generated in Section 3.2 was imported as an input worksheet. Two more items “expected beef and dairy calves” (Row 63) and “estimated beef and dairy calves” (Row 64) were listed, in addition to those extracted in version 1 of the extraction tool, to be used by the accounting tool. (Changes made from version 1 of the extraction tool are noted in highlighted cells.) Clicking the “Extract” button generated the output “Ag_Census_Animals_07_02” worksheet, which was used as input to the accounting tool.

11
Figure 4.2.2. Extracting livestock data in 2002 and 2007. 4.3. Extracting Census data Population in 1990 and 2000 was extracted from Census using the NANI extraction tool “NANI_Extraction_Tool_V3_Census.xlsm” (Figure 4.3.1). Before running the extraction tool, the county proportion table “Cnty_Prop.txt” generated in Section 3.2 was imported as an input worksheet. There was no change in the list of extraction items from version 1 of the extraction tool. Clicking the “Extract” button generated the output “Census” worksheet, which was used as input to the accounting tool.
Figure 4.3.1. Extracting Census data in 1990 and 2000.

12
4.4. Extracting fertilizer data Fertilizer data were extracted from USGS nutrient input estimates (previously obtained from Ruddy et al. 2006; now available at Gronberg and Spahr 2012) using the NANI extraction tool “NANI_Extraction_Tool_V3_USGS.xlsm” (Figure 4.4.1). Before running the extraction tool, the county proportion table “Cnty_Prop.txt” generated in Section 3.2 was imported as an input worksheet. There was no change in the list of extraction items from version 1 of the extraction tool. Clicking the “Extract” button generated the output “USGS” worksheet, which was used as input to the accounting tool.
Figure 4.4.1. Extracting fertilizer data from USGS nutrient input estimates.
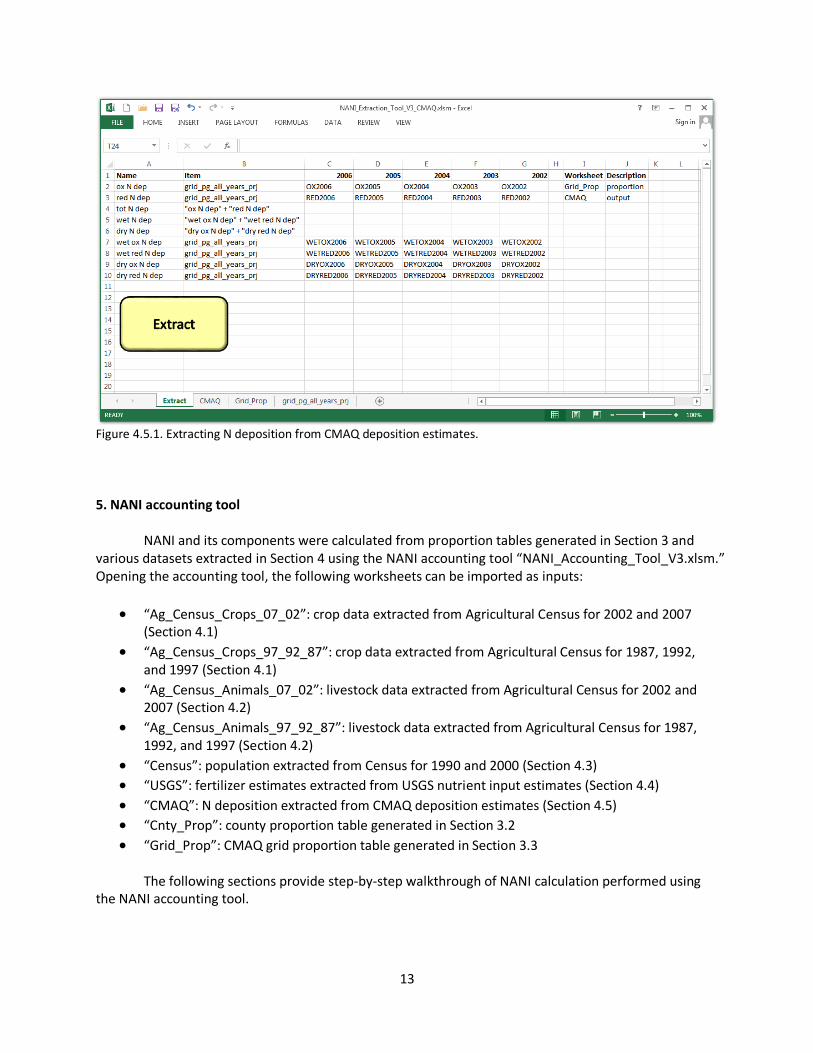
4.5. Extracting N deposition N deposition was extracted from CMAQ deposition estimates (Schwede et al. 2009) using the NANI extraction tool “NANI_Extraction_Tool_V3_CMAQ.xlsm” (Figure 4.5.1). Before running the extraction tool, the grid proportion table “Grid_Prop.txt” generated in Section 3.3 was imported as an input worksheet. There was no change in the list of extraction items from version 1 of the extraction tool. Clicking the “Extract” button generated the output “CMAQ” worksheet, which was used as input to the accounting tool.
13
Figure 4.5.1. Extracting N deposition from CMAQ deposition estimates.
5. NANI accounting tool NANI and its components were calculated from proportion tables generated in Section 3 and various datasets extracted in Section 4 using the NANI accounting tool “NANI_Accounting_Tool_V3.xlsm.” Opening the accounting tool, the following worksheets can be imported as inputs:
“Ag_Census_Crops_07_02”: crop data extracted from Agricultural Census for 2002 and 2007 (Section 4.1)
“Ag_Census_Crops_97_92_87”: crop data extracted from Agricultural Census for 1987, 1992, and 1997 (Section 4.1)
“Ag_Census_Animals_07_02”: livestock data extracted from Agricultural Census for 2002 and 2007 (Section 4.2)
“Ag_Census_Animals_97_92_87”: livestock data extracted from Agricultural Census for 1987, 1992, and 1997 (Section 4.2)
“Census”: population extracted from Census for 1990 and 2000 (Section 4.3)
“USGS”: fertilizer estimates extracted from USGS nutrient input estimates (Section 4.4)
“CMAQ”: N deposition extracted from CMAQ deposition estimates (Section 4.5)
“Cnty_Prop”: county proportion table generated in Section 3.2
“Grid_Prop”: CMAQ grid proportion table generated in Section 3.3 The following sections provide step-by-step walkthrough of NANI calculation performed using the NANI accounting tool.

14
5.1. N in net food and feed imports 5.1.1. Crop N production Crop N production was calculated in the “Crops” worksheet of the NANI accounting tool (Figure 5.1.1.1). Changes made in the crop calculation from version 1 include: (1) corn protein content (9.5% protein = 1.5% N) following David et al. (2010), (2) 50% loss of pasture production assumed following the “take half-leave half rule” (NRCS guideline for pasture management at http://www.nrcs.usda.gov/), and (3) addition of peanuts as a crop of regional importance. Details of these changes are discussed in Hong et al. (2013) and noted in highlighted cells of the “Crops” worksheet (Figure 5.1.1.1). Clicking the “Crops” button generated the output crop N production from Column O of the “Crops” worksheet.
Figure 5.1.1.1. Calculating crop N production.
5.1.2. Livestock N consumption Livestock N consumption was calculated in the “Animals” worksheet of the NANI accounting tool (Figure 5.1.2.1). In version 3 of the calculation, the livestock list from Han and Allan (2008) was used instead of that from Boyer et al. (2002), as noted in the highlighted cells of the “Animals” worksheet. Han and Allan (2008) did not include “goat,” so its parameters were estimated from Boyer et al. (2002). Clicking the “Animals” button generated the output livestock N consumption from Column O of the “Animals” worksheet. Although livestock N production is also reported in this worksheet based on the difference method, in version 3 the livestock N production is estimated based on the animal products in the “Animal_N_Prd” worksheet (Section 5.1.3; see Hong et al. 2013 for detailed discussion).

15
Figure 5.1.2.1. Calculating livestock N consumption.
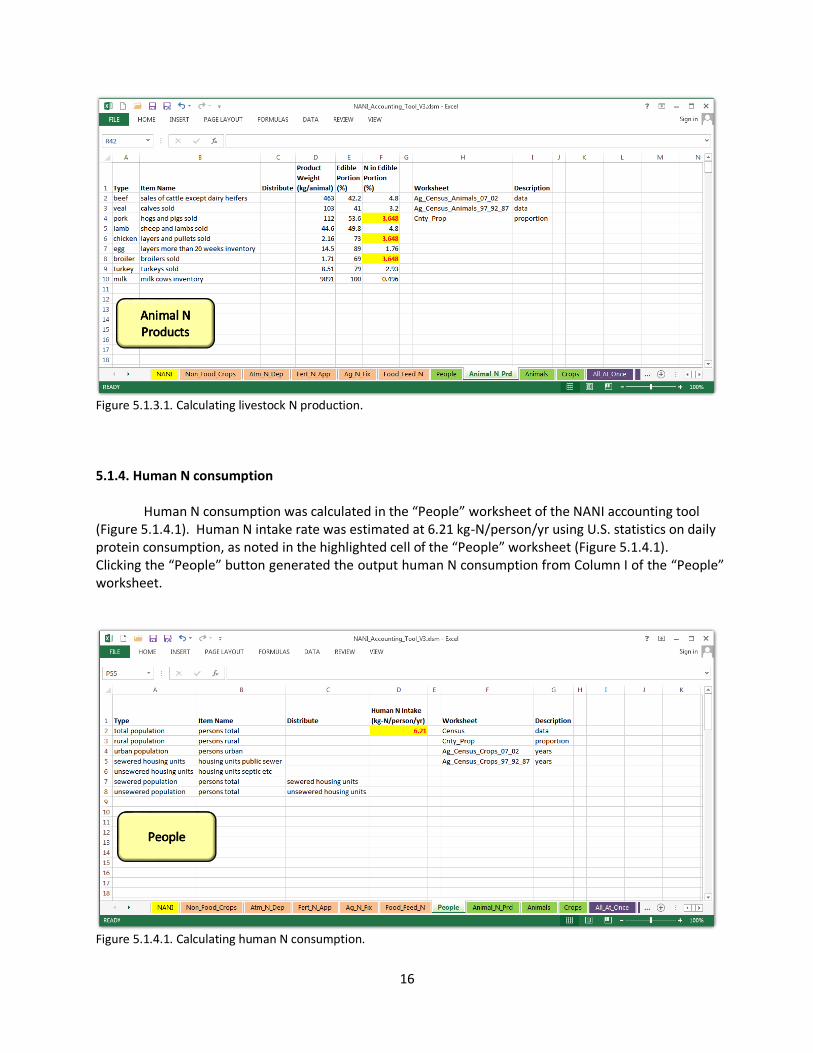
5.1.3. Livestock N production In version 3 of the calculation, livestock N production was calculated in the “Animal_N_Prd” worksheet of the NANI accounting tool (Figure 5.1.3.1) by taking the product-based approach instead of the difference method, considering its potential utility in future scenario analyses (e.g., dietary scenarios related to egg and milk consumption) (Hong et al. 2013). N in the edible portion of pigs and chickens was estimated from Heinz and Hautzinger (2007), and those from all other products were from Han et al. (2009). Changes made in the livestock calculation from version 1 are noted in highlighted cells of the “Animal_N_Prd” worksheet (Figure 5.1.3.1). Clicking the “Animal N Products” button generated the output livestock N production from Column K of the “Animal_N_Prd” worksheet.
16
Figure 5.1.3.1. Calculating livestock N production.
5.1.4. Human N consumption Human N consumption was calculated in the “People” worksheet of the NANI accounting tool (Figure 5.1.4.1). Human N intake rate was estimated at 6.21 kg-N/person/yr using U.S. statistics on daily protein consumption, as noted in the highlighted cell of the “People” worksheet (Figure 5.1.4.1). Clicking the “People” button generated the output human N consumption from Column I of the “People” worksheet.
Figure 5.1.4.1. Calculating human N consumption.

17
The N in net food and feed imports was calculated in the “Food_Feed_N” worksheet of the NANI accounting tool (Figure 5.1.4.2) as human N consumption (Section 5.1.4) + livestock N consumption (Section 5.1.2) – livestock N production (Section 5.1.3) – crop N production (Section 5.1.1). The crop N production may be further disaggregated into crop N production for human food and crop N production for livestock feed, each of which is reported as output in the “Crop” worksheet (Figure 5.1.1.1). Since version 3 NANI calculation uses livestock N production based on products, the worksheet name containing relevant information (“Animal_N_Prd”) is specified in the “Food_Feed_N” worksheet, as noted in the highlighted cell (Figure 5.1.4.2). Clicking the “Net Food and Feed Imports” button generated the output N in net food and feed imports from Column I of the “Food_Feed_N” worksheet.
Figure 5.1.4.2. Calculating N in net food and feed imports.
5.2. Agricultural N fixation Version 3 of the NANI calculation uses yield-based agricultural N fixation (Han and Allan 2008) instead of area-based (Boyer et al. 2002). The yield-based approach, as described in detail in Meisinger and Randall (1991), estimates crop N fixation as the product of yield (estimated from harvested quantities) and the percentage of this N that can be attributed to fixation:
bpND
cHF 1100100100
(5.2.1)
where: F = crop N fixation (kg-N) H = harvested quantities as reported in Agricultural Census c = conversion factor to kg D = percent dry matter N = percent N in dry matter p = percent of harvested N that can be attributed to fixation b = nonharvested N as the fraction of harvested N

18
When the yield-based approach is applied (as noted in the highlighted cells of the “Ag_N_Fix” worksheet for soybeans, alfalfa hay, nonalfalfa hay, and peanuts; Figure 5.6.1), item names for the corresponding harvested quantities (“H” in Equation 5.2.1) are specified in Column B, conversion factors to kilograms (“c” in Equation 5.2.1) in Column E, and the rest of coefficients in Column F. Nonalfalfa hay areas were assumed to have 25% leguminous plants such as clovers (NRCS 2007; Campbell and Collar 1993), and this fraction is also incorporated in Column F (Cell F4). Detailed discussion on the yield-based approach and its parameter estimation can be found in Hong et al. (2013). When the area-based approach is applied (for cropland pasture and snap beans, since the Agricultural Census does not report harvested quantities for them), item names for crop areas are specified in Column B, conversion factors to square kilometers in Column E, and area-based fixation rates (kg-N/km2/yr) in Column F. Clicking the “Agricultural N Fixation” button generated the output agricultural N fixation from Column K of the “Ag_N_Fix” worksheet.
Figure 5.2.1. Calculating agricultural N fixation.
5.3. Fertilizer N application Fertilizer N application was calculated in the “Fert_N_App” worksheet of the NANI accounting tool (Figure 5.3.1). There was no change in the “Fert_N_App” worksheet from version 1 of the accounting tool. Clicking the “Fertilizer N Application” button generated the output fertilizer N application from Column J of the “Fert_N_App” worksheet.

19
Figure 5.3.1. Calculating fertilizer N application.
5.4. Atmospheric N deposition Atmospheric (oxidized) N deposition was calculated in the “Atm_N_Dep” worksheet of the NANI accounting tool (Figure 5.4.1). There was no change in the “Atm_N_Dep” worksheet from version 1 of the accounting tool. Clicking the “Atmospheric N Deposition” button generated the output atmospheric N deposition from Column J of the “Atm_N_Dep” worksheet.
Figure 5.4.1. Calculating atmospheric N deposition.

20
5.5. N in non-food crop export N in non-food crop export was calculated in the “Non_Food_Crops” worksheet of the NANI accounting tool (Figure 5.5.1). There was no change in the “Non_Food_Crops” worksheet from version 1 of the accounting tool. Clicking the “Non Food Crops” button generated the output non-food crop N export from Column N of the “Non_Food_Crops” worksheet.
Figure 5.5.1. Calculating N in non-food crop export.
5.6. NANI NANI was calculated in the “NANI” worksheet of the NANI accounting tool (Figure 5.6.1) as atmospheric (oxidized) N deposition (Section 5.4) + fertilizer N application (Section 5.3) + agricultural N fixation (Section 5.2) + N in net food and feed imports (Section 5.1) – N in non-food crop export (Section 5.5). There was no change in the “NANI” worksheet from version 1 of the accounting tool. Clicking the “NANI” button generated the output NANI from Column I of the “NANI” worksheet.
Figure 5.6.1. Calculating NANI.

21
6. New additions to NANI accounting tool 6.1. Calculating NANI all at once In version 3 of the NANI calculator toolbox, a new worksheet “All_At_Once” is added (Figure 6.1.1), where NANI and its components can be calculated all at once by clicking “NANI All At Once” button. The user should provide the name of the worksheet in which NANI is calculated (“NANI” shown in Figure 5.6.1), and all other worksheets needed for NANI calculation are located by the toolbox. For example, the “Crops” worksheet name is specified in the “Food_Feed_N” worksheet (Figure 5.1.4.2), which in turn is specified in the “NANI” worksheet (Figure 5.6.1).
Figure 6.1.1. Calculating NANI and its components all at once.
6.2. Tabulating NANI variables NANI calculator toolbox produces many outputs, not all of which are used for NANI calculation. It can be time-consuming for the user to locate the desired outputs reported in various worksheets of the toolbox and rearrange them in a format convenient for the user. The “NANI_Var” worksheet of the NANI calculator toolbox can be used to extract the NANI-related outputs and organize them in a tabular format (Figure 6.2.1). Specify in Column C whether each variable should be reported or not, and provide in Cell E2 the name of the worksheet where NANI is calculated (“NANI” shown in Figure 5.6.1); all other worksheets needed for NANI calculation are located by the toolbox. For example, the “Crops” worksheet name is specified in the “Food_Feed_N” worksheet (Figure 5.1.4.2), which in turn is specified in the “NANI” worksheet (Figure 5.6.1). If a tabular format is desired, specify “output format” as “Column.” Specifying the output format as “Row” produces individual output values reported in each row. (The “Row” formatted output is used as input to the NANI function, as described in Section 7.) If it is desired to disaggregate the output variables into types (e.g., N production by each crop), specify “disaggregate by types” as “Yes.” Clicking the “Report NANI Variables” button produces the output NANI variables from Column H of the “NANI_Var” worksheet.

22
Figure 6.2.1. Tabulating NANI variables. 6.3. Tabulating NANI parameters As with tabulating NANI-related variables (Section 6.2), NANI parameters can be tabulated in the “NANI_Par” worksheet of the NANI calculator toolbox (Figure 6.3.1). Again, specify in Column C whether each parameter should be reported or not, and provide in Cell E2 the name of the worksheet where NANI is calculated (“NANI” shown in Figure 5.6.1). If a tabular format is desired, specify “output format” as “Column.” Specifying the output format as “Row” produces individual parameter values reported in each row. (The “Row” formatted output is used as input to the NANI function, as described in Section 7.) If it is desired to report constant parameters (i.e., with no spatial variation across watersheds) for each watershed, specify “repeat constant parameter in row format” as “Yes.” If it is specified as “No,” spatially constant parameters will be reported only once representing all watersheds. Clicking the “Report NANI Parameters” button produces the output NANI parameters from Column H of the “NANI_Par” worksheet.

23
Figure 6.3.1. Tabulating NANI parameters.
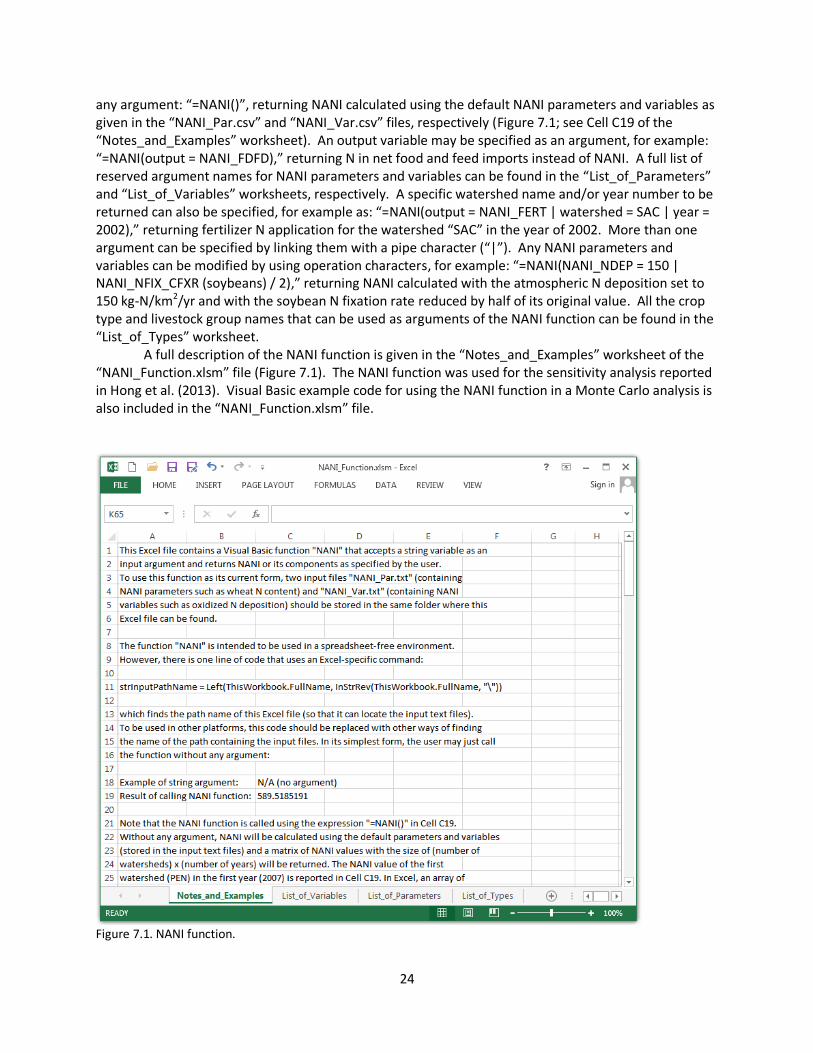
7. NANI function A functional form of the NANI calculator toolbox, referred to as the “NANI function,” was developed and added to the toolbox package (Figure 7.1). The NANI function is useful for a sensitivity or Monte Carlo analysis that involves running the calculation many times with different parameter sets. Unlike the NANI calculator toolbox that includes all the original databases in its package, the NANI function calculates NANI from watershed-based input variables that need to be generated by the toolbox. Different NANI parameters and variables can be specified for each watershed and for each year. The NANI function has smaller package size (less than 2 MB in this study as opposed to > 1 GB) and allows the user to perform repeated NANI calculations quickly. On the other hand, it lacks the flexibility of the NANI calculator toolbox, e.g., changing the list of crops used for the calculation of crop N production. The NANI function, implemented as a Visual Basic function in an Excel file “NANI_Function.xlsm,” takes two input files, “NANI_Par.csv” that contains a list of NANI parameters (e.g., corn N content) and “NANI_Var.csv” that contains NANI variables (e.g., fattened cattle density). These files can be created by exporting the outputs generated in the “NANI_Par” (Figure 6.3.1) and “NANI_Var” (Figure 6.2.1) worksheets of the NANI calculator toolbox, respectively, as comma-delimited text files. After clicking the “Report NANI Parameters” and “Report NANI Variables” buttons, respectively, save the outputs in Columns H to L as csv files. These files should be stored in the same folder where the Excel file “NANI_Function.xlsm” is located. The NANI function accepts a string variable as an input argument and returns NANI or its components as specified by the user. In its simplest form, the user may just call the function without
24
any argument: “=NANI()”, returning NANI calculated using the default NANI parameters and variables as given in the “NANI_Par.csv” and “NANI_Var.csv” files, respectively (Figure 7.1; see Cell C19 of the “Notes_and_Examples” worksheet). An output variable may be specified as an argument, for example: “=NANI(output = NANI_FDFD),” returning N in net food and feed imports instead of NANI. A full list of reserved argument names for NANI parameters and variables can be found in the “List_of_Parameters” and “List_of_Variables” worksheets, respectively. A specific watershed name and/or year number to be returned can also be specified, for example as: “=NANI(output = NANI_FERT | watershed = SAC | year = 2002),” returning fertilizer N application for the watershed “SAC” in the year of 2002. More than one argument can be specified by linking them with a pipe character (“|”). Any NANI parameters and variables can be modified by using operation characters, for example: “=NANI(NANI_NDEP = 150 | NANI_NFIX_CFXR (soybeans) / 2),” returning NANI calculated with the atmospheric N deposition set to 150 kg-N/km2/yr and with the soybean N fixation rate reduced by half of its original value. All the crop type and livestock group names that can be used as arguments of the NANI function can be found in the “List_of_Types” worksheet. A full description of the NANI function is given in the “Notes_and_Examples” worksheet of the “NANI_Function.xlsm” file (Figure 7.1). The NANI function was used for the sensitivity analysis reported in Hong et al. (2013). Visual Basic example code for using the NANI function in a Monte Carlo analysis is also included in the “NANI_Function.xlsm” file.
Figure 7.1. NANI function.

25
A. Appendix A.1. Distributing map data This section describes the use of the NANI GIS tool “Distribute Map Data,” implemented as an ArcPy script, that was previously an ArcGIS VBA-based tool in version 2 of the NANI calculator toolbox (Hong et al. 2012). We ported the NANI GIS tools to ArcPy because ArcGIS 10 will be the last version with VBA support. Even though the “Distribute Map Data” tool is not used in version 3 of the calculation of NANI for the U.S. watersheds, we demonstrate its use for distributing country-based crop production data into extended ISPRA grid cells of corresponding countries. Interested readers may refer to Section 5.3.5 and Figure 5.3.5.B of the documentation of NANI calculator toolbox version 2 for more detailed information (http://www.balticnest.org/download/18.2beb0a011325eb5811a8000153756) and comparing the ArcPy-based user interface (Figure A.1.1) with that of VBA-based tool.
Figure A.1.1. Distributing map data.

26
Here, the NANI GIS tool “Distribute Map Data” (Section 3.1) is opened, and the data sum table “CNTR_SUM_BL_RU_Added_Rev_05.csv” (containing country-based crop production values in 1000 tonnes), the country map “11_For_Crop_Distribution_Final_02.shp” for the counties around the Baltic sea catchments, and the extended ISPRA grid “Extended_Crop_Rev_02.shp” (containing areas of the crops listed in the data sum table) are specified as inputs. All the optional additional field names are selected, except for “Shape_Leng” and “Shape_Area.” Running the tool generates an output shapefile “Crop_Dist.shp” that can subsequently be used as input to other NANI tools. Figure A.1.2 below shows the tool execution progress window for the “Distribute Map Data” tool.
Figure A.1.2. Tool execution progress window for “Distribute Map Data” tool. A.2. Excel VBA-based “Calculate Map Proportions” tool The Excel VBA-based “Calculate Map Proportions” tool was developed as an alternative to the corresponding tool based on ArcGIS VBA. Since this procedure requires the user to manually process the input maps using a GIS software, running ArcPy-based NANI GIS tools (Section 3) is generally an easier and more straightforward alternative. However, the Excel VBA-based tool is more flexible in that it provides the user an option of generating a proportion table based on land use, instead of simple areas.
27
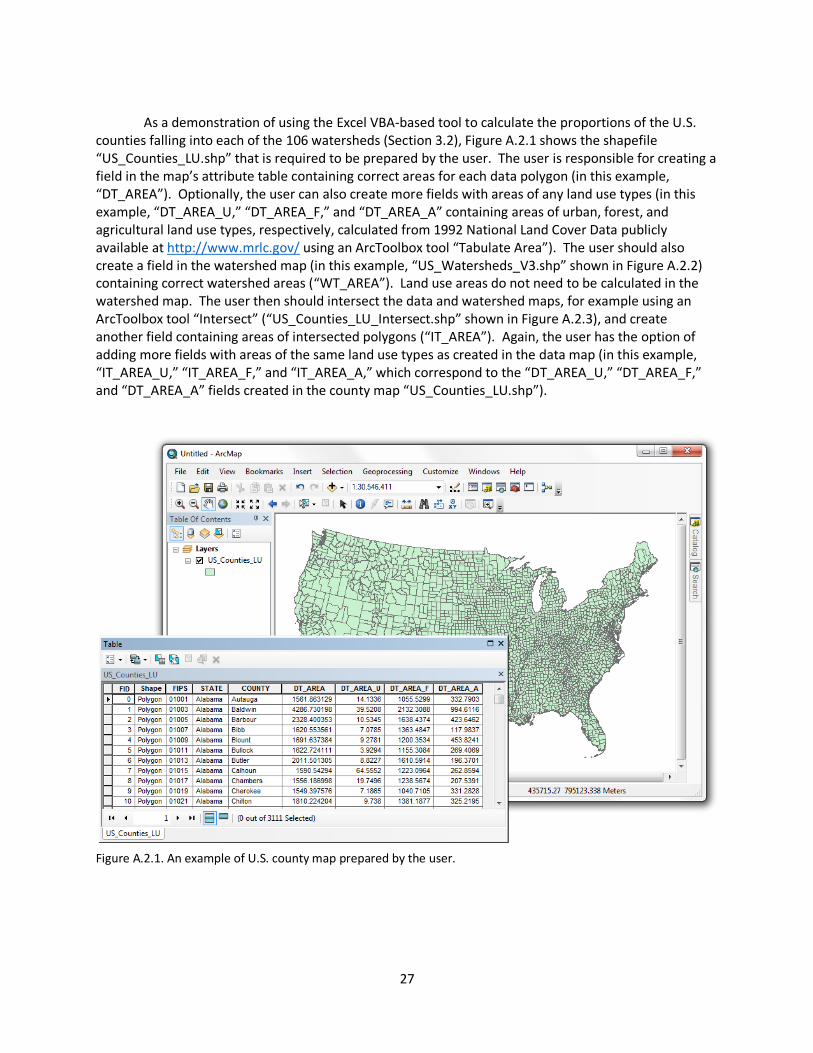
As a demonstration of using the Excel VBA-based tool to calculate the proportions of the U.S. counties falling into each of the 106 watersheds (Section 3.2), Figure A.2.1 shows the shapefile “US_Counties_LU.shp” that is required to be prepared by the user. The user is responsible for creating a field in the map’s attribute table containing correct areas for each data polygon (in this example, “DT_AREA”). Optionally, the user can also create more fields with areas of any land use types (in this example, “DT_AREA_U,” “DT_AREA_F,” and “DT_AREA_A” containing areas of urban, forest, and agricultural land use types, respectively, calculated from 1992 National Land Cover Data publicly available at http://www.mrlc.gov/ using an ArcToolbox tool “Tabulate Area”). The user should also create a field in the watershed map (in this example, “US_Watersheds_V3.shp” shown in Figure A.2.2) containing correct watershed areas (“WT_AREA”). Land use areas do not need to be calculated in the watershed map. The user then should intersect the data and watershed maps, for example using an ArcToolbox tool “Intersect” (“US_Counties_LU_Intersect.shp” shown in Figure A.2.3), and create another field containing areas of intersected polygons (“IT_AREA”). Again, the user has the option of adding more fields with areas of the same land use types as created in the data map (in this example, “IT_AREA_U,” “IT_AREA_F,” and “IT_AREA_A,” which correspond to the “DT_AREA_U,” “DT_AREA_F,” and “DT_AREA_A” fields created in the county map “US_Counties_LU.shp”).
Figure A.2.1. An example of U.S. county map prepared by the user.

28
Figure A.2.2. An example of watershed map prepared by the user.
Figure A.2.3. An example of intersect map prepared by the user.

29
After these maps are prepared, add their attribute tables (dbf files) to the Excel proportion tool “NANI_GIS_Tool_Excel_Version.xlsm.” The specification of “Map_Prop” tab shown in Figure A.2.4 below corresponds to that of ArcGIS-based tool (Figure 3.2.1), except for the additional (optional) inputs specifying the columns containing the land use areas that can be used when land use-based allocation of data is desired. In this example, “data distribution weight” and “intersect distribution weight” are specified as “DT_AREA_A” and “IT_AREA_A,” respectively, to generate a proportion table based on agricultural land use (“Cnty_Prop_Ag.txt” included in the toolbox package), instead of simple areas. Likewise, specifying them as “DT_AREA_U” and “IT_AREA_U,” respectively, generates a proportion table based on urban use (“Cnty_Prop_Urban.txt”). These proportion tables can be imported into the extraction and accounting tools and used just like the simple area-based proportion tables. Note that when these optional inputs are left blank, the proportion table generated by running this tool (“Cnty_Prop.txt”) is the same as that created from ArcPy-based “Calculate Map Proportions” tool discussed in Section 3.2 (Figure 3.2.1).
Figure A.2.4. Excel VBA-based “Calculate Map Proportions” tool.

30
B. References Boyer, E. W.; Goodale, C. L.; Jaworsk, N. A.; Howarth, R. W. Anthropogenic nitrogen sources and relationships to riverine nitrogen export in the northeastern U.S.A. Biogeochemistry 2002, 57 (1), 137− 169. Campbell, M.; Collar, C. Non alfalfa hay and forage overview - what is being grown and why; 23rd California Alfalfa Symposium; University of California Cooperative Extension, 1993. David, M. B.; Drinkwater, L. E.; McIsaac, G. F. Sources of nitrate yields in the Mississippi River Basin. J. Environ. Qual. 2010, 39 (5), 1657−1667. Goolsby, D. A.; Battaglin,W. A.; Lawrence, G. B.; Artz, R. S.; Aulenbach, B. T.; Hooper, R. P.; Keeney, D. R.; Stensland, G. J. Flux and sources of nutrients in the Mississippi−Atchafalaya River Basin; NOAA Coastal Ocean Program Decision Analysis Series No. 17; NOAA Coastal Ocean Office: Silver Spring, MD, 1999; pp 130. Gronberg, J. M.; Spahr, N. E. County-level estimates of nitrogen and phosphorus from commercial fertilizer for the Conterminous United States, 1987–2006; U.S. Geological Survey Scientific Investigations Report 2012−5207; U.S. Geological Survey: Reston, VA, 2012; pp 20. Han, H.; Allan, D. Estimation of nitrogen inputs to catchments: comparison of methods and consequences for riverine export prediction. Biogeochemistry 2008, 91, 177−199. Han, H.; Allan, J. D.; Scavia, D. Influence of climate and human activities on the relationship between watershed nitrogen input and river export. Environ. Sci. Technol. 2009, 43, 1916−1922. Heinz, G.; Hautzinger, P. Meat processing technology for small- to medium-scale producers; FAO RAP Publication No. 2007/20; Food and Agriculture Organization of the United Nations, Bangkok, 2007; pp 455. Hong, B.; Swaney, D. P.; Howarth, R. W. A toolbox for calculating net anthropogenic nitrogen inputs (NANI). Environ. Model. Software 2011, 26, 623−633. Hong, B.; Swaney, D. P.; M rth, C.-M.; Smedberg, E.; Eriksson Hagg, H.; Humborg, C.; Howarth, R. W.; Bouraoui, F. Evaluating regional variation of net anthropogenic nitrogen and phosphorus inputs (NANI/NAPI), major drivers, nutrient retention pattern and management implications in the multinational areas of Baltic Sea basin. Ecol. Model. 2012, 227, 117−135. Hong, B.; Swaney, D. P.; Howarth, R. W. Estimating net anthropogenic nitrogen inputs to U.S. watersheds: comparison of methodologies. Environ. Sci. Technol. 2013, 47, 5199−5207. Howarth, R. W.; Billen, G.; Swaney, D.; Townsend, A.; Jaworski, N.; Lajtha, K.; Downing, J. A.; Elmgren, R.; Caraco, N.; Jordan, T. Regional nitrogen budgets and riverine N & P fluxes for the drainages to the North Atlantic Ocean: natural and human influences. Biogeochemistry 1996, 35 (1), 75−139.

31
Howarth, R. W.; Swaney, D. P.; Boyer, E. W.; Marino, R.; Jaworski, N.; Goodale, C. The influence of climate on average nitrogen export from large watersheds in the Northeastern United States. Biogeochemistry 2006, 79 (1−2), 163−186. Howarth, R. W.; Swaney, D. P.; Billen, G.; Garnier, J.; Hong, B.; Humborg, C.; Johnes, P.; M rth, C.-M.; Marino, R. Nitrogen fluxes from the landscape are controlled by net anthropogenic nitrogen inputs and by climate. Front. Ecol. Environ. 2012, 10 (1), 37−43. Meisinger, J. J.; Randall, G. W. Estimating nitrogen budgets for soil-crop systems. In Managing Nitrogen for Groundwater Quality and Farm Profitability; Follett, R. F., Keeney, D. R., Cruse, R. M., Eds.; Soil Science Society of America: Madison, WI, 1991; pp 40. Natural Resources Conservation Service (NRCS). Profitable grazing-based dairy systems; Range and Pasture Technical Note No. 1; USDA Natural Resources Conservation Service, 2007; pp 34. Ruddy, B. C.; Lorenz, D. L.; Mueller, D. K. County-level estimates of nutrient inputs to the land surface of the conterminous United States, 1982−2001; U.S. Geological Survey Scientific Investigations Report 2006−5012; U.S. Geological Survey: Reston, VA, 2006; pp 17. Schaefer, S. C.; Alber, M. Temperature controls a latitudinal gradient in the proportion of watershed nitrogen exported to coastal ecosystems. Biogeochemistry 2007, 85 (3), 333−346. Schaefer, S. C.; Hollibaugh, J. T.; Alber, M. A. Watershed nitrogen input and riverine export on the west coast of the US. Biogeochemistry 2009, 93, 219−233. Schwede, D. B.; Dennis, R. L.; Bitz, M. A. The Watershed Deposition Tool: a tool for incorporating atmospheric deposition in watershed analyses. J. Am. Water Resour. Assoc. 2009, 45, 973−985. Swaney, D. P.; Hong, B.; Ti, C.; Howarth, R. W.; Humborg, C. Net anthropogenic nitrogen inputs to watersheds and riverine N export to coastal waters: a brief overview. Curr. Opin. Environ. Sustainability 2012, 4, 203−211.