Embed Size (px)
Citation preview
Republic of Namibia
Namibia’s 5th NatioNal DevelopmeNt plaN (NDp5)

iii Working Together Towards Prosperity
The Fifth National Development Plan (NDP5) is the 5th NDP in the
series of a total of seven (7) National Developmnet Plans that are to
implement and achieve the objectives and aspirations of Namibia's
long term vision (Vision 2030). In sequence, NDP5 will be the third
five year implementation vehicle towards VISION 2030. NDP5 will be
implemented from the financial year 2017/18 up until 2021/22.
5th NatioNal DevelopmeNt plaN (NDp5)
iv Namibia’s 5th National Development Plan
table oF CoNteNt
NDp5 struCture ............................................................................................................................................................. vi
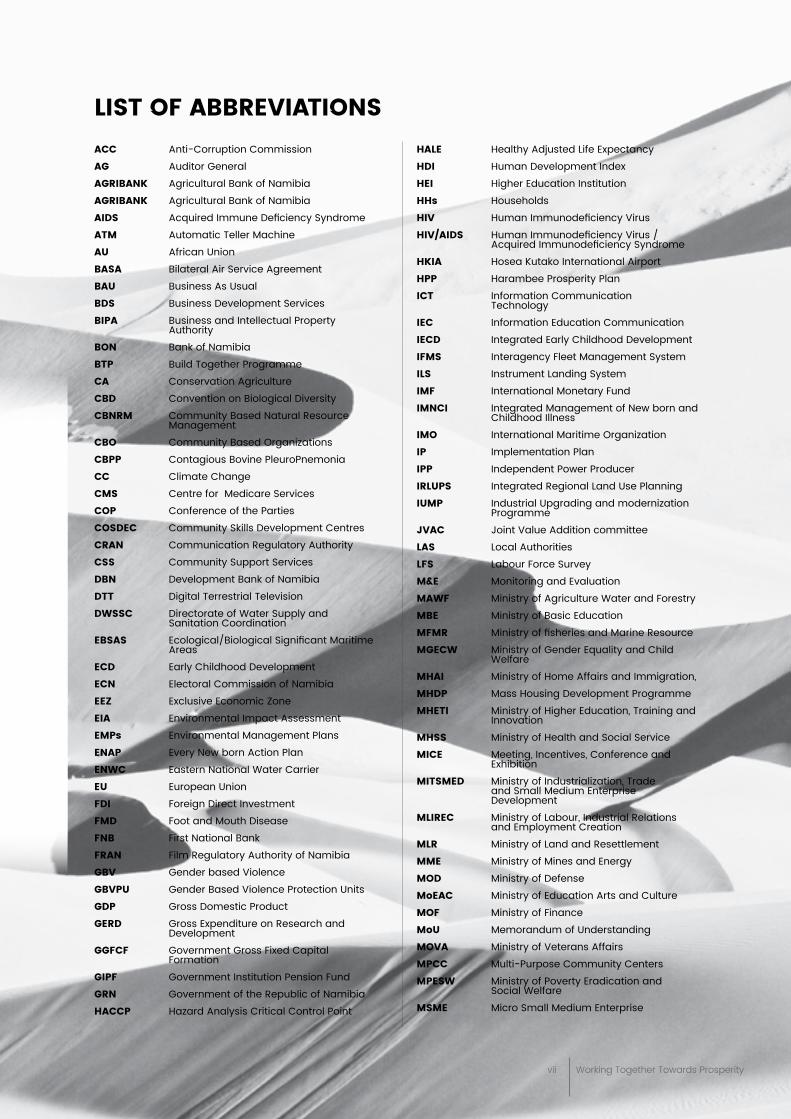
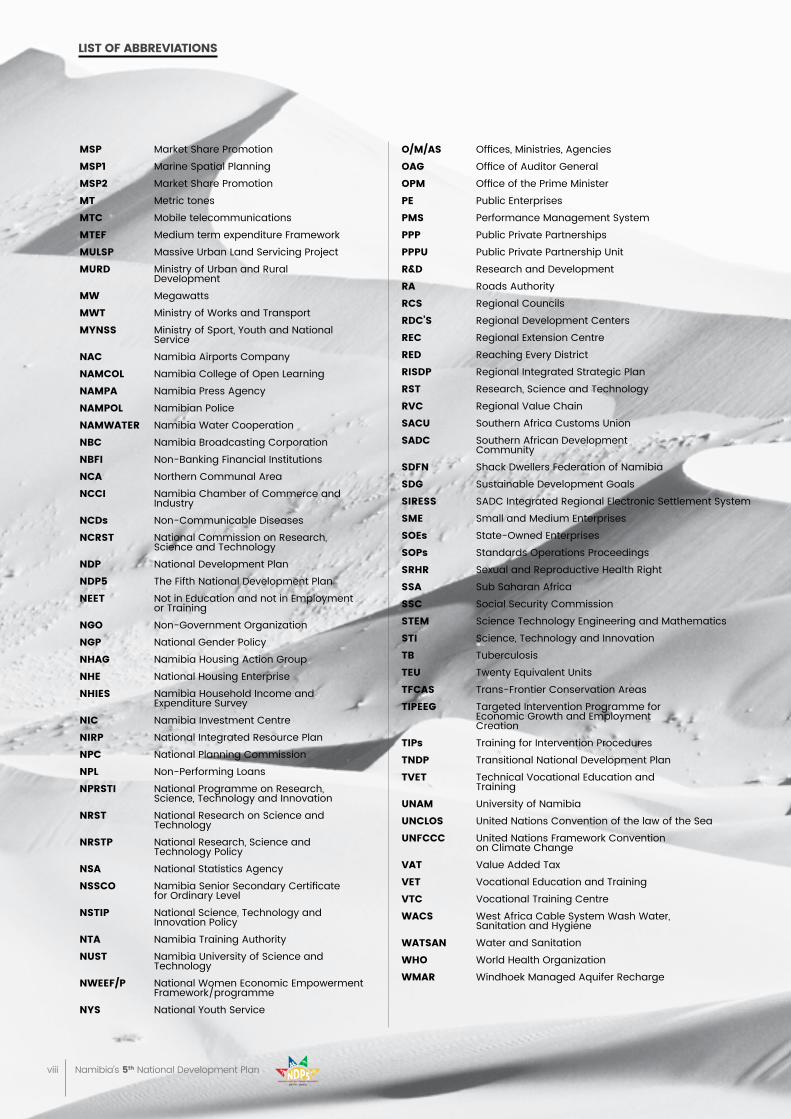
list oF abbreviatioNs ................................................................................................................................................ vii
ForeWorD ...........................................................................................................................................................................ix
iNtroDuCtioN ...................................................................................................................................................................xi
eXeCutive summarY ................................................................................................................................................... xiii
Chapter 1: Namibia oN the move ............................................................................................................................. 1 1. The Country Context .................................................................................................................................................................1 2. Overall Economic Performance .........................................................................................................................................2 2.1 Performance of Industries .........................................................................................................................................2 2.2 Fiscal Position ...................................................................................................................................................................3 2.3 Trade Balance ..................................................................................................................................................................3 2.4 Transforming Challenges into Opportunities ..................................................................................................3 2.5 Macroeconomic Outlook ........................................................................................................................................... 4 3. NDP5 Vision, Goals and Objectives ................................................................................................................................. 5 3.1 Value Addition ................................................................................................................................................................. 6 3.2 Structural Transformation ......................................................................................................................................... 6 3.3 The Four Pillars of NDP5 ...............................................................................................................................................7 4. A Coordinated and Inclusive Strategy ...........................................................................................................................7 5. Game Changers ........................................................................................................................................................................7 5.1 Increase investment in Infrastructure development .................................................................................. 8 5.2 Increase productivity in agriculture, especially for smallholder farmers ....................................... 8 5.3 Invest in quality technical skills development ............................................................................................... 9 5.4 Improve value addition in natural resources ................................................................................................. 9 5.5 Achieve industrial development through Local Procurement .............................................................10
Chapter 2: eCoNomiC progressioN ..................................................................................................................... 13Achieve Inclusive, Sustainable and Equitable Economic Growth .................................................................................. 13 2.1 Moving Forward: Namibia 2017-2022 ................................................................................................................15 2.2 Structural transformation through value added industrialization .....................................................16 2.2.1 Enterprise development .............................................................................................................................16 2.2.2 Manufacturing Sector ..................................................................................................................................18 2.2.3 Agriculture Sector and Food Security ................................................................................................20 2.2.4 Rural Economic Development ................................................................................................................22 2.2.5 Blue Economy ..................................................................................................................................................24 2.2.6 Fishery .................................................................................................................................................................26 2.2.7 Mining ..................................................................................................................................................................28 2.2.8 Tourism ...............................................................................................................................................................30 2.2.9 Research and Innovation .........................................................................................................................32 2.3 Expansion and modernization of physical infrastructure ......................................................................34 2.3.1 Energy ..................................................................................................................................................................34 2.3.2 Water ...................................................................................................................................................................36

v Working Together Towards Prosperity
2.3.3 Transport and Logistics .............................................................................................................................38 2.3.4 Information & Communication Technology (ICT) .......................................................................41 2.4 Strengthened Export Capacity and Greater Regional Integration....................................................43 2.5 Supportive financial infrastructure for greater inclusion .......................................................................45
Chapter 3: soCial traNsFormatioN ..................................................................................................................49Build Capable and Health Human Resources .........................................................................................................................49 3.1 Harnessing the Demographic Dividends .........................................................................................................51 3.2 Human Capital Development ...............................................................................................................................52 3. 2.1 Social Protection ............................................................................................................................................52 3.2.2 Early Childhood Development (ECD) ................................................................................................55 3.2.3 Basic Education..............................................................................................................................................57 3.2.4 Technical, Vocational Education and Training (TVET) .............................................................59 3.2.5 Higher Education ............................................................................................................................................61 3.2.5 Health and Nutrition .....................................................................................................................................63
3.3 Social Development ...................................................................................................................................................65 3.3.1 Gender Equality ..............................................................................................................................................65 3.3.2 Housing and Land .........................................................................................................................................67 3.3.3 Sanitation ..........................................................................................................................................................69 3.3.4 Youth Empowerment. ................................................................................................................................... 71 3.3.5 Empowering People and Communities through Sports .......................................................... 73 3.3.6 Arts and Culture ............................................................................................................................................75 3.3.7 Integrate marginalized communities into mainstream economy .................................... 77
Chapter 4: eNviroNmeNtal sustaiNabilitY .....................................................................................................81Ensure Sustainable Environment and Enhance Resilience...............................................................................................81 4.1 Conservation and Sustainable Use of Natural Resources ....................................................................83 4.2 Environmental Management and Climate Change .................................................................................85
Chapter 5: gooD goverNaNCe .............................................................................................................................. 89Promote Good Governance through Effective Institutions...............................................................................................89 5.1 Peace, Security and Rule of Law ...........................................................................................................................91 5.2 Accountability and Transparency ......................................................................................................................93 5.3 Public Service Performance and Service Delivery .....................................................................................95 5.4 Statistical Development ...........................................................................................................................................97
Chapter 6: iNvestmeNt, implemeNtatioN & reportiNg ............................................................................. 99 6.1 Introduction.....................................................................................................................................................................99 6.2. Financing ........................................................................................................................................................................ 100 6.3 Implementation .......................................................................................................................................................... 100 6.4. Monitoring and Progress Reporting .....................................................................................................................101 6.5. Evaluation ........................................................................................................................................................................ 103
appeNDiX ....................................................................................................................................................................... 104
vi Namibia’s 5th National Development Plan
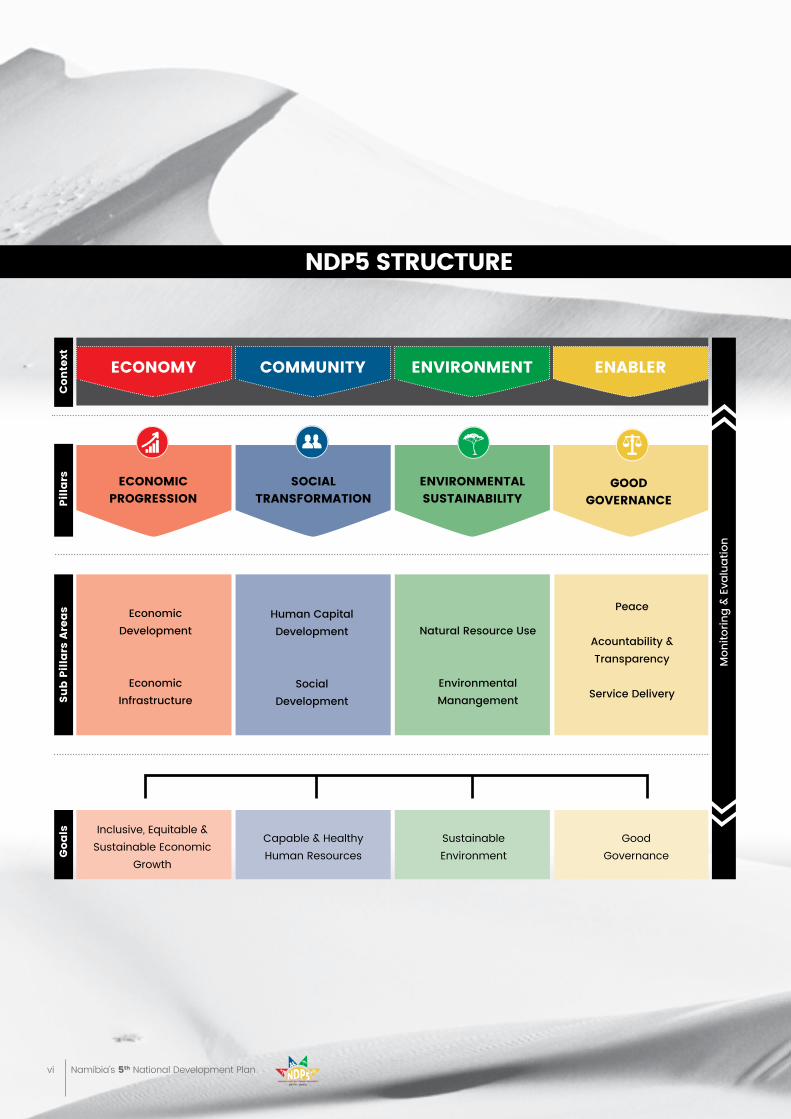
NDp5 struCture
eCoNomY CommuNitY eNviroNmeNt eNabler
eCoNomiC progressioN
soCial traNsFormatioN
eNviroNmeNtal sustaiNabilitY
gooD goverNaNCe
Economic Development
Economic Infrastructure
Mon
itorin
g &
Eval
uatio
n
Human Capital Development
Social Development
Natural Resource Use
Environmental Manangement
Peace
Acountability &Transparency
Service Delivery
Inclusive, Equitable & Sustainable Economic
Growth
Capable & Healthy Human Resources
Sustainable Environment
Good Governanceg
oals
sub
pilla
rs a
reas
pilla
rsC
onte
xt
vii Working Together Towards Prosperity
aCC Anti-Corruption Commissionag Auditor GeneralagribaNK Agricultural Bank of Namibia agribaNK Agricultural Bank of NamibiaaiDs Acquired Immune Deficiency Syndromeatm Automatic Teller Machineau African Unionbasa Bilateral Air Service Agreementbau Business As Usual bDs Business Development Servicesbipa Business and Intellectual Property AuthorityboN Bank of Namibiabtp Build Together ProgrammeCa Conservation AgricultureCbD Convention on Biological DiversityCbNrm Community Based Natural Resource ManagementCbo Community Based OrganizationsCbpp Contagious Bovine PleuroPnemoniaCC Climate ChangeCms Centre for Medicare ServicesCop Conference of the PartiesCosDeC Community Skills Development CentresCraN Communication Regulatory AuthorityCss Community Support ServicesDbN Development Bank of NamibiaDtt Digital Terrestrial TelevisionDWssC Directorate of Water Supply and Sanitation Coordinationebsas Ecological/Biological Significant Maritime AreaseCD Early Childhood DevelopmenteCN Electoral Commission of NamibiaeeZ Exclusive Economic Zoneeia Environmental Impact Assessmentemps Environmental Management PlanseNap Every New born Action PlaneNWC Eastern National Water Carriereu European UnionFDi Foreign Direct InvestmentFmD Foot and Mouth DiseaseFNb First National BankFraN Film Regulatory Authority of Namibiagbv Gender based Violencegbvpu Gender Based Violence Protection UnitsgDp Gross Domestic ProductgerD Gross Expenditure on Research and DevelopmentggFCF Government Gross Fixed Capital FormationgipF Government Institution Pension FundgrN Government of the Republic of NamibiahaCCp Hazard Analysis Critical Control Point
list oF abbreviatioNs hale Healthy Adjusted Life ExpectancyhDi Human Development Indexhei Higher Education Institutionhhs Householdshiv Human Immunodeficiency Virushiv/aiDs Human Immunodeficiency Virus / Acquired Immunodeficiency Syndrome hKia Hosea Kutako International Airporthpp Harambee Prosperity PlaniCt Information Communication TechnologyieC Information Education CommunicationieCD Integrated Early Childhood DevelopmentiFms Interagency Fleet Management Systemils Instrument Landing SystemimF International Monetary FundimNCi Integrated Management of New born and Childhood Illnessimo International Maritime Organizationip Implementation Planipp Independent Power Producerirlups Integrated Regional Land Use Planningiump Industrial Upgrading and modernization ProgrammeJvaC Joint Value Addition committeelas Local Authorities lFs Labour Force Surveym&e Monitoring and EvaluationmaWF Ministry of Agriculture Water and Forestrymbe Ministry of Basic EducationmFmr Ministry of fisheries and Marine ResourcemgeCW Ministry of Gender Equality and Child Welfaremhai Ministry of Home Affairs and Immigration,mhDp Mass Housing Development Programmemheti Ministry of Higher Education, Training and Innovationmhss Ministry of Health and Social ServicemiCe Meeting, Incentives, Conference and ExhibitionmitsmeD Ministry of Industrialization, Trade and Small Medium Enterprise Development mlireC Ministry of Labour, Industrial Relations and Employment Creationmlr Ministry of Land and Resettlementmme Ministry of Mines and EnergymoD Ministry of DefensemoeaC Ministry of Education Arts and CulturemoF Ministry of Financemou Memorandum of Understandingmova Ministry of Veterans AffairsmpCC Multi-Purpose Community CentersmpesW Ministry of Poverty Eradication and Social Welfaremsme Micro Small Medium Enterprise
viii Namibia’s 5th National Development Plan
list oF abbreviatioNs
msp Market Share Promotionmsp1 Marine Spatial Planningmsp2 Market Share Promotionmt Metric tonesmtC Mobile telecommunicationsmteF Medium term expenditure Frameworkmulsp Massive Urban Land Servicing ProjectmurD Ministry of Urban and Rural DevelopmentmW MegawattsmWt Ministry of Works and TransportmYNss Ministry of Sport, Youth and National ServiceNaC Namibia Airports CompanyNamCol Namibia College of Open LearningNampa Namibia Press AgencyNampol Namibian PoliceNamWater Namibia Water CooperationNbC Namibia Broadcasting CorporationNbFi Non-Banking Financial InstitutionsNCa Northern Communal AreaNCCi Namibia Chamber of Commerce and IndustryNCDs Non-Communicable DiseasesNCrst National Commission on Research, Science and TechnologyNDp National Development PlanNDp5 The Fifth National Development PlanNeet Not in Education and not in Employment or TrainingNgo Non-Government OrganizationNgp National Gender PolicyNhag Namibia Housing Action Group Nhe National Housing EnterpriseNhies Namibia Household Income and Expenditure SurveyNiC Namibia Investment CentreNirp National Integrated Resource PlanNpC National Planning CommissionNpl Non-Performing LoansNprsti National Programme on Research, Science, Technology and InnovationNrst National Research on Science and TechnologyNrstp National Research, Science and Technology PolicyNsa National Statistics AgencyNssCo Namibia Senior Secondary Certificate for Ordinary LevelNstip National Science, Technology and Innovation PolicyNta Namibia Training AuthorityNust Namibia University of Science and TechnologyNWeeF/p National Women Economic Empowerment Framework/programmeNYs National Youth Service
o/m/as Offices, Ministries, Agenciesoag Office of Auditor Generalopm Office of the Prime Ministerpe Public Enterprisespms Performance Management Systemppp Public Private Partnershipspppu Public Private Partnership Unitr&D Research and Developmentra Roads AuthorityrCs Regional CouncilsrDC’s Regional Development CentersreC Regional Extension Centre reD Reaching Every DistrictrisDp Regional Integrated Strategic Planrst Research, Science and TechnologyrvC Regional Value ChainsaCu Southern Africa Customs UnionsaDC Southern African Development CommunitysDFN Shack Dwellers Federation of NamibiasDg Sustainable Development Goalssiress SADC Integrated Regional Electronic Settlement Systemsme Small and Medium Enterprisessoes State-Owned Enterprisessops Standards Operations Proceedingssrhr Sexual and Reproductive Health Rightssa Sub Saharan AfricassC Social Security Commissionstem Science Technology Engineering and Mathematicssti Science, Technology and Innovationtb Tuberculosisteu Twenty Equivalent UnitstFCas Trans-Frontier Conservation Areastipeeg Targeted Intervention Programme for Economic Growth and Employment Creation tips Training for Intervention ProcedurestNDp Transitional National Development Plantvet Technical Vocational Education and TraininguNam University of NamibiauNClos United Nations Convention of the law of the SeauNFCCC United Nations Framework Convention on Climate Changevat Value Added Taxvet Vocational Education and TrainingvtC Vocational Training CentreWaCs West Africa Cable System Wash Water, Sanitation and Hygiene WatsaN Water and SanitationWho World Health OrganizationWmar Windhoek Managed Aquifer Recharge
ix Working Together Towards Prosperity
Dr. hage g. geiNgob
President of The Republic
of Namibia
ForeWorDThe Namibian House is founded on the principles of unity, liberty and justice. In the Namibian House, we strive for unity of purpose that lifts the standard of living of the Namibian people, including our men and women, our elderly, our youth, our girls and boys, and, our people living with disability. No one shall be left behind and no one is less important than another. Our unity as a people has served us well in the past and I am hopeful that it will serve us even better in the future as we embark on the second phase of our struggle to bring prosperity to all.
Our political independence will be unsustainable if we do not also achieve economic independence. Our political independence was not easy to achieve, and our economic independence will be similarly challenging to attain. However, it is critical that we pursue our economic prosperity with vigor and speed, for economic instability has the potential to undo the earlier gains of political independence.
A precondition of economic liberty is justice and rule of law. We shall uphold our constitution so that our actions in pursuing our national objectives are within the precepts of the law. Namibia will avoid corrupt practices in business and in governance. No individual’s interest will be greater than the interest of the nation. We shall build a caring nation, not a country where “a winner takes all.” We shall cultivate a sense of caring for the less fortunate in our society. Unity, liberty and justice will bring peace, and peace will contribute to prosperity for our people. Prosperity will bring fulfilment and contentment.
We are aware of the challenges ahead in the implementation of our fifth national development plan. The Namibian economy is currently facing headwinds stemming from a global environment where prospects of growth are constrained by low commodity prices, political instability in some parts of the world and low demand in some major economies. This situation at home is exacerbated by capacity constraints in production, especially in the manufacturing of goods, prolonged droughts and lack of high-demand, technical or otherwise advanced skills. As bleak as the situation may look, I would like to remind ourselves of a quote from David Osborne “it is not the mighty nor the swift that survives, but those who adapt to the current situation.”
Namibia is faced with the challenge of high levels of poverty and inequality amongst plenty. This situation constrains economic growth and reinforces itself through high levels of unemployment. Namibia has to overcome both poverty and the upper-middle
x Namibia’s 5th National Development Plan
income trap if it is to realize its ambitions. A key to unlock the opportunities inherent in our natural resources and our people is to develop our human capital by investing in training, health and education. Therefore, the Namibian Government will continue to invest in education and health sectors. However, a high allocation to these sectors is not enough. Investment needs to be strategic and results-oriented. In many instances, a change of attitude is needed to improve outcomes. Doing the same thing the same way guarantees the same results. It is therefore imperative that we identify “game changers” to disrupt nonproductive approaches and shed light on new ways of moving forward. Namibia does not need to go to the moon or land on distant stars or planets just yet; however, we can adopt some new technologies which suit our circumstances and can improve our way of living.
In accordance with Vision 2030, our vision is that Namibia becomes a developed country. This should be realized through economic transformation and industrialization. This ambition is central to NDP5. In a competitive world, the Namibian economy has to be high performing, competitive and productive. During NDP5, priority attention should be given to address energy and water shortages as these are vital inputs in the production process.
As stated in Harambee Prosperity Plan, the rationale for Harambe Prosperity Plan is not to change the direction but simply to compliment the national development plans and Vision 2030. The HPP is a focused and targeted approach to achieve high and speed impact in the defined priority areas. The vision of achieving the status of a developed and industrialized country still remains our ultimate goal, however our surrounding environment is dynamic, thus from time to time we encounter unpredicted challenges on our way towards our Vision, and hence
we need to devise some short to medium term strategies to put us on the course.
Namibia is a child of international solidarity and a proud member of the international community, a friend to all and enemy to none. We will pursue our economic diplomacy with our fellow members of the international community. We will choose dialogue over war. The Southern African Development Community (SADC) will be Namibia’s platform for African Unity and Namibia’s economic transformation. Namibia has now joined the African Union Peer Review mechanism.
In implementing Namibia’s national agenda, Namibia will contribute to the realization of the Global Sustainable Development Goals, Africa Union Agenda 2063, and SADC’s Regional Integrated Strategic Development Plan (RISDP). During NDP5 Namibia will transform itself into a SADC Logistical Hub by investing in Trans-Kalahari, Trans -Kunene, and Trans-Zambezi Transport Corridors.
We have adopted a consultative planning process in Namibia. Hence, our plans and priorities are the result of consensus. Therefore, in the spirit of Harambee, I appeal to all stakeholders: development partners, academia, O/M/As, private sector and communities to hold hands and contribute to the realization of our national objectives.
This plan and all other national plans belong to all of us. Therefore:
One Goal, One Namibia, One Nation
Dr. hage g. geingobpresident of the republic of Namibiamay 2017
ForeWorD
xi Working Together Towards Prosperity
tom K. alWeeNDo mp:
Minister of Economic Planning and
Director-General
iNtroDuCtioNIt is my pleasure to present Namibia’s Fifth National Development Plan (NDP5), our nation’s blueprint for national development between 2017-2022. It outlines a development strategy that aims to improve the living conditions of every Namibian. The NDP5 like other medium term national development plans is to chart a course toward the cumulative targets outlined in Vision 2030. The Fifth National Development Plan consists of the policy document as well as the Implementation Plan (IP).
NDP5 builds on the successes and achievements of the four previous five-year plans from the Transitional National Development Plan (TNDP) to the Fourth National Development Plan. It also recognizes the challenges experienced during the implementation of the previous plans. The current plan is informed by the global, continental, regional and national development frameworks. These include the Global Sustainable Development Goals (Agenda 2030), African Union Agenda 2063, Southern African Development Community (SADC), Regional Integrated Strategic Plan (RISDP), Vision 2030, Harambee Prosperity Plan (HPP) and the SWAPO Party Manifesto.
The principle of sustainable development permeates NDP5. As such, the plan frames the achievement of progress within a framework of ensuring the ability of future generations to thrive. In the same spirit, NDP5 has four key goals, namely;
• Achieve Inclusive, Sustainable and Equitable Economic Growth,
• Build Capable and Healthy Human Resources;
• Ensure Sustainable Environment and Enhance Resilience; and
• Promote Good Governance through Effective Institutions
During NDP4 period the economy grew on average by 4.6% on account of large investment in extractive sectors and accelerated government expenditure which boosted the construction sector and supported social sectors. As a result the country experienced declines in poverty levels from 28% in 2009/2010 to 18% in 2015/2016. However the growth in employment opportunities fell short of the new entrants in the labour market.
The labour market could not absorb the new entrants mainly because the economy could not create innovative industries as the economy relied on the traditional industries which are already saturated. The economy hence experienced a cycle of low skills – fewer employment opportunities. Moving forward the country needs to break the cycle by investing more in education especially in technical vocational training while higher education is oriented
xii Namibia’s 5th National Development Plan
towards obtaining critical mass in science related subjects.
Namibia like most of the countries in Southern Africa is affected by the scourge of HIV/AIDs and other related health problems. As a country, we have done well with regard to anti-retroviral drugs distribution and population coverage hence lessened the negative impact that HIV/AIDS could have had on the economy through affecting the productivity of the work force. During NDP5 Namibia will accelerate the development of human capabilities in the health sector and address the shortage of health infrastructure facilities.
As a country faced with many socio-economic challenges and thus anxious to grow the economy at a faster rate, our environmental objective will be twofold: firstly to ensure that as a country we obtain maximum benefits from our natural resource use and to preserve the environment and employ environmental friendly strategies.
Namibia has gained a good reputation in the world with regard to its governance. However, the governance machinery still needs to be lubricated further to enhance service delivery for the betterment of the Namibian people. During NDP5, the country will strengthen its institutions for effective service delivery.
This stems from the recognition that development is for the people- and thus citizen engagement will be a cornerstone for service delivery.
Policies are as good as the process for their development. NDP5 was developed through extensive consultations with stakeholders, including community members at the local, regional and national level, members of civil society at large, the private sector and input from Namibia’s development partners. In the spirit of Harambee, NDP5 embraces the concept of partnership in the pursuit of national development goals. The old adage finds its meaning in NDP5, that “If you want to go fast, go alone, but if you want to go far, go with the people”. Hence the theme for NDP5 is “Working Together Towards Prosperity.”
A well written plan does not guarantee success. The finalization of this policy document just signals the start of the work. The ownership, enthusiasm and speed by which stakeholders will implement the strategies in this plan will determine the success of NDP5. It is therefore my humble appeal that we all embrace the plan and implement it towards prosperity.
tom K. alWeeNDo mp: MINISTER OF ECONOMIC PLANNING AND DIRECTOR-GENERAL
iNtroDuCtioN
xiii Working Together Towards Prosperity
eXeCutive summarYThe Republic of Namibia is an upper-middle-income developing country with rich natural resources, political and macroeconomic stability, a free press and an economy that has grown on average by 4.6% per year between 2012 and 2016.
In its 27-year history, Namibia has distinguished herself as a leader in environmental protection. Namibia is the first nation in the world to incorporate environmental protection into its constitution. The country has protected almost the entire Namib Desert, the world’s oldest desert, from environmental damage. Namibia has also protected its entire 1571 km long coastline as a national park. This far-sighted commitment to sustainable development has protected the natural environment of Namibia, including its marine life, coastal ecosystems and its extraordinary wildlife which include elephants, cheetahs, rhino and lions. Together with the country’s reputation for stability and safety, this has contributed to Namibia’s growing reputation as an eco-tourist destination which attracts visitors from all over the world.
In spite of so many positive indicators, Namibia faces significant challenges. While the economy has grown substantially, this has not reduced unemployment. As a result, in terms of income equality, Namibia is amongst the most unequal nations in the world. Twenty-eight percent of the labour force is unemployed. In 2016, nearly 18% of the population lived in poverty. Moreover, a large proportion of the population is vulnerable to communicable and noncommunicable diseases. The prevalence of HIV is particularly high at 16.9% in 2014 from 19% in 2012.
A lack of industrialization and infrastructure has contributed to Namibia’s economic imbalance. In the year 2014, 31% of Namibian work force worked in agriculture which contributed only 3.9% of the GDP. While drought and declines in prices on the global market are partly responsible for agriculture’s relatively small contribution to Namibia’s GDP, a lack of modernisation in farming techniques and a lack of infrastructure in business development have made
the agriculture sector less efficient, less robust and less profitable than it might otherwise be. Due largely to inefficiencies and a lack of infrastructure and modernization, Namibia has an unfavorable trade balance with an average trade deficit of N$25.3 billion over NDP4.
By modernizing and industrializing the major sectors of agriculture, fisheries, manufacturing, mining, tourism and by providing training opportunities so that workers can upgrade their skills, Namibia will create decent jobs for its citizens in a diverse range of industries. This is indeed the formula for the nation’s long-term economic success.
It is the purpose of NDP5 to set out a roadmap for achieving this rapid industrialization while adhering to the four integrated pillars of sustainable development:
• economic progression
• social transformation
• environmental sustainability
• good governance
Moreover, Namibia recognizes that development should not be a top-down but a bottom-up exercise.To this end, Namibia embraces the principle of partnerships for success which is a cornerstone of Vision 2030. In addition to governmental plans that require cooperation and coordination between governmental ministries, Namibia actively encourages the involvement of partners in the private sector, in the civic organizations, in community-based organizations and in the international community to help achieve the aims articulated in this document.
economic progression: The goal for this pillar is to achieve inclusive, sustainable and equitable growth for the Namibian society. The Namibian economy aspires to change from an input-dependent economy into a knowledge based economy. This is to be achieved by addressing four mutually supportive initiatives of: 1) structural transformation through value addition; 2) expansion and modernization of physical infrastructure; 3) strengthen export capacity
1
xiv Namibia’s 5th National Development Plan
and greater regional integration; and; 4) supportive financial infrastructure for greater inclusion. The condition for addressing and achieving results in this area is first and foremost to ensure macroeconomic stability.
The desired outcome(s) for structural transformation is to diversify the economy from reliance on primary industries towards greater contribution of secondary and tertiary (less government services) industries to GDP. This will increase economic activities, create more employment opportunities and facilitate distribution of income. Expansion and modernization of infrastructure will create an enabling environment for economic growth, facilitation of trade and innovation. In order to achieve the afore-mentioned outcomes, the economy needs a supportive financial infrastructure or architecture which is not only effective and resilient but inclusive to the majority of citizens to unlock the potentials for entrepreneurship and production of goods and services.
social transformation: The Goal for this pillar is to build capable and health human resources. Quality human capital is crucial to optimizing productivity and associated socioeconomic benefits to citizens. At this particular point in time, the Namibian population is undergoing a demographic transition where the age structure is changing from dominantly children to one dominated by working age population. There is potential for demographic dividend for Namibia, therefore the country should choose to accelerate demographic transition through investment in youth, education and health complimented with sound economic reforms and good governance. The expected outcome is improvement in Human development index .
environmental sustainability: The Goal for this pillar is to ensure sustainable environment3. Namibia is endowed with abundant natural resources such as wildlife, fisheries, forestry, minerals as well as a
solar and wind regime that is suitable for renewable energy. Natural resources-based sectors are among the largest contributors to GDP and they employ more than 30% of the country’s work force. Namibia’s environmental objectives are: sustainable management and utilization of natural resources and sustainable management of the environment.
good governance: The goal for this pillar is to promote good governance through effective institutions. Good governance, responsive institutions and an engaged citizenry are the bedrock of democracy and sustainable development. Namibia’s economic, social and environmental future rests on its ability to put people at the centre of decision making. During NDP5 Namibia wants to continue to be safe, secure, peaceful and upholding the rule of law; to be the most transparent and accountable nation in Africa; and to improve service delivery to the satisfaction of its citizen.
implementation, monitoring and evaluation Framework: This chapter outlines the funding, implementation, monitoring, evaluation and reporting framework for NDP5. The Government of Namibia is committed to effective service delivery to its people. To accomplish this there is a need to adopt and strengthen prudent and accountable practices that are result driven and performance-oriented for the benefit of all Namibians. NDP5 implementation plan will have sufficient intermediate indicators which will deliver quick feedback on results that can be continually improved through decision making and social learning leading to social and economic progress.
Mid-year and Annual Reports on the monitoring and evaluation of NDP5 will be submitted to Cabinet every year. In addition a midterm and terminal evaluation reports will be conducted half way and after the completion of NDP5 respectively.
2 the human Development index (hDi) is a composite statistic of life expectancy, education, and per capita income indicators, which are used to rank countries into four tiers of human development. A country scores higher HDI when the lifespan is higher, the education level is higher, and the GDP per capita is higher.3 Environmental Sustainability entails: 1) For renewable resources, the rate of harvest should not exceed the rate of regeneration (sustainable yield); 2) (For pollution The rates of waste generation from projects should not exceed the assimilative capacity of the environment (sustainable waste disposal); and 3) For nonrenewable resources the depletion of the nonrenewable resources should require comparable development of renewable substitutes for that resource.
eXeCutive summarY
1 Working Together Towards Prosperity
4 Human Development Report, 2016
Chapter 1: Namibia oN the moveby the year 2030, with all of us working together, we should be an industrial nation enjoying prosperity, harmony, peace and political stability.
~ Sam Nujoma, Founding President of The Republic of Namibia
1. the Country Context
Namibia, an independent nation established in 1990, is one of Africa’s most remarkable success stories. Led by a democratically-elected and stable government, the Namibian Republic is an upper middle-income developing country with splendid natural resources, solid infrastructure, spell-binding landscapes, a free press and an economy that has grown on average by 4.6% per annum over 2012-2016 period. It has the advantage of being one of the least densely populated countries on the planet: Its small population of 2.3 million people enjoys a vast territory approximately the size of Nigeria with the population of 173.6 million people.
As a result of sound governance and stable macroeconomic management, Namibia has experienced rapid socio-economic development. Namibia has achieved the level of “medium human development” and ranks 125th on the Human Development Index out of 188 countries. Government policies and efforts towards human development have improved Namibia’s standing on the Human Development Index (HDI) from 0.556 in 2000 to 0.640 in 2015. Life expectancy is at 65 years from birth and expected years of schooling is 11.7 . In the 2015, Gender Development Index, Namibia ranked among the top tier of countries with a high score of 0.986 (out of a possible 1.0.) This strong performance is largely attributable to the share of parliamentary seats held by women; female attainment in secondary and higher education; and labour market participation rates of women.
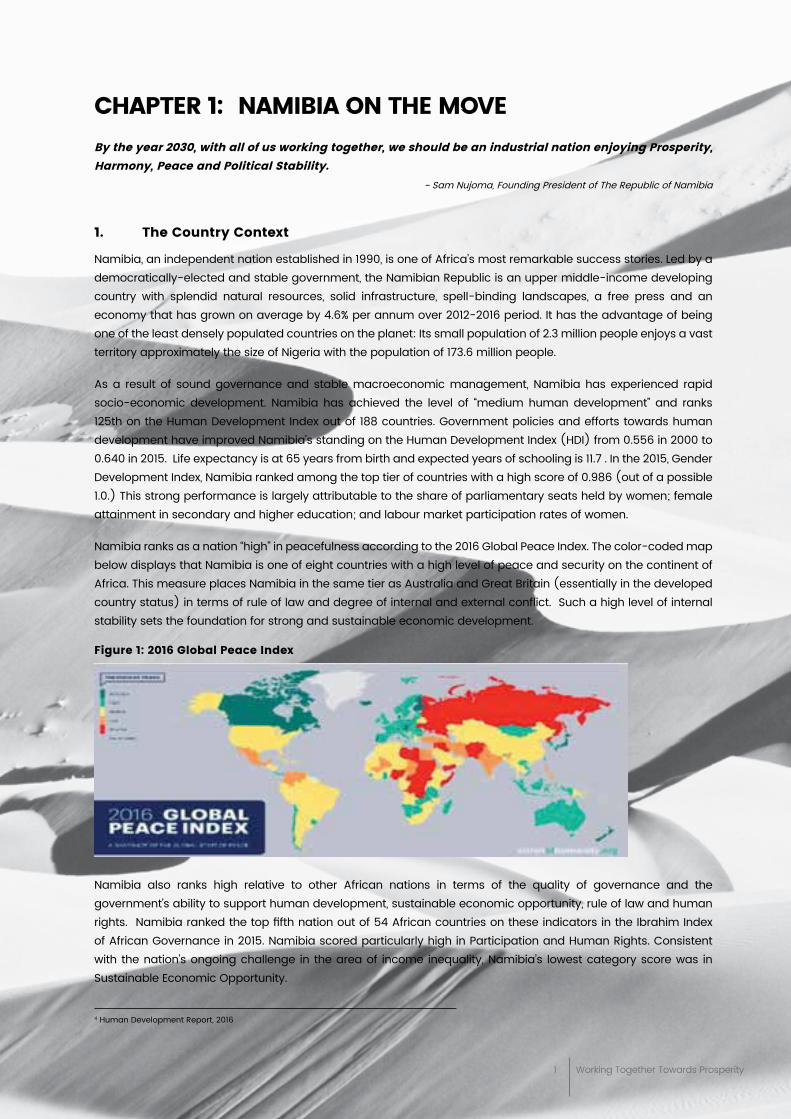
Namibia ranks as a nation “high” in peacefulness according to the 2016 Global Peace Index. The color-coded map below displays that Namibia is one of eight countries with a high level of peace and security on the continent of Africa. This measure places Namibia in the same tier as Australia and Great Britain (essentially in the developed country status) in terms of rule of law and degree of internal and external conflict. Such a high level of internal stability sets the foundation for strong and sustainable economic development.
Figure 1: 2016 global peace index
Namibia also ranks high relative to other African nations in terms of the quality of governance and the government’s ability to support human development, sustainable economic opportunity, rule of law and human rights. Namibia ranked the top fifth nation out of 54 African countries on these indicators in the Ibrahim Index of African Governance in 2015. Namibia scored particularly high in Participation and Human Rights. Consistent with the nation’s ongoing challenge in the area of income inequality, Namibia’s lowest category score was in Sustainable Economic Opportunity.
2 Namibia’s 5th National Development Plan
2. overall economic performance
Throughout NDP4, Namibia enjoyed strong and sustained average economic growth of 4.6% per year, if it were not for 2016; the average economic growth could have been higher than 5%. The GDP per capita increased from N$42 311 to N$47 358 a 3.7% average increase per annum over four years of NDP4 implementation compared to 2% during NDP3. This growth has been primarily driven by large investments in the extractive sector, favorable export prices and high government spending.
However, this economic growth has not reduced unemployment or ameliorated social and economic inequalities to the desired levels. According to the preliminary Namibia Household Income and Expenditure Survey 2015/16, poverty in Namibia fell from 28.7% in 2009/10 to 18% in 2015/16. This is partly because the economy depends heavily on the mining sector which does not demand a large number of unskilled laborers. As a result, the majority of Namibia’s workers who lack advanced skills or education must rely on subsistence agriculture for their livelihood. In the year 2014, 31% of Namibian work force worked in agriculture sector which contributed only 3.9% of the GDP. While drought and declines in prices on the global market are partly responsible for agriculture’s relatively small contribution to Namibia’s GDP, a lack of modernization in farming techniques and a lack of infrastructure in business development have made the agriculture sector efficient, less robust and less profitable than it would otherwise be.
The relatively low job growth compared to the growth rate of the labour force has made Namibia one of the most unequal countries in the world, with a Gini coefficient of 0.57. These social and economic inequalities pose a threat to the nation’s macroeconomic and fiscal stability. It is therefore essential for Namibia to address the skill deficits in its labor force so that more Namibians can obtain a living wage. Methods to achieve this goal include improving the quality of the educational system, including adult education and training opportunities. At the same time, Namibia will endeavor to upgrade and diversify its range of productive industries.
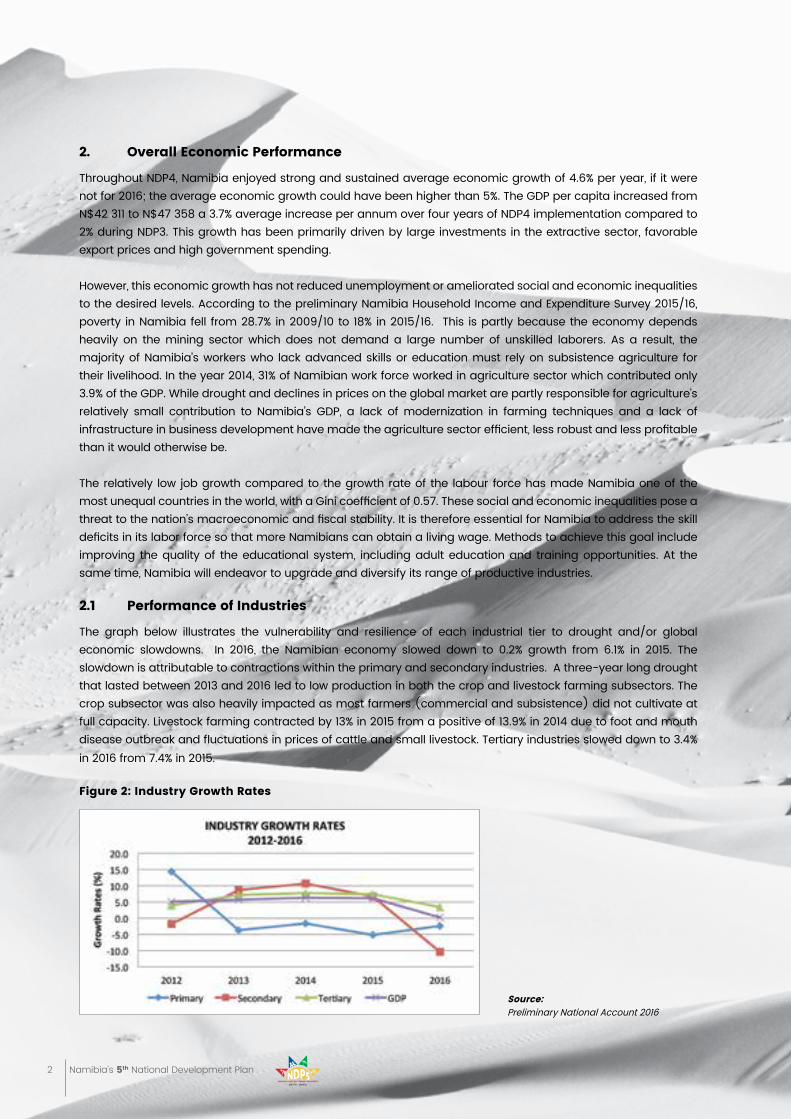
2.1 performance of industries
The graph below illustrates the vulnerability and resilience of each industrial tier to drought and/or global economic slowdowns. In 2016, the Namibian economy slowed down to 0.2% growth from 6.1% in 2015. The slowdown is attributable to contractions within the primary and secondary industries. A three-year long drought that lasted between 2013 and 2016 led to low production in both the crop and livestock farming subsectors. The crop subsector was also heavily impacted as most farmers (commercial and subsistence) did not cultivate at full capacity. Livestock farming contracted by 13% in 2015 from a positive of 13.9% in 2014 due to foot and mouth disease outbreak and fluctuations in prices of cattle and small livestock. Tertiary industries slowed down to 3.4% in 2016 from 7.4% in 2015.
Figure 2: industry growth rates
source: Preliminary National Account 2016
3 Working Together Towards Prosperity
2.2 Fiscal position
In response to the global economic slowdown, the Namibian government increased expenditures to stimulate economic growth. The public debt stock averaged 28% between 2012/13 and 2015/16, reached a high of 40.1% of GDP in the 2015/16 financial year. Given the decline in revenue collection, the level of expenditure and public debt stock is drifting towards unsustainable levels, while the high unemployment rate amidst continuous drought puts even more pressure on government spending.
2.3 trade balance
As a small yet open economy, Namibia continues to be a net importer of goods. Thus, the country has an unfavorable trade balance, recording an average Trade deficit of N$25.6 billion over the last past years.
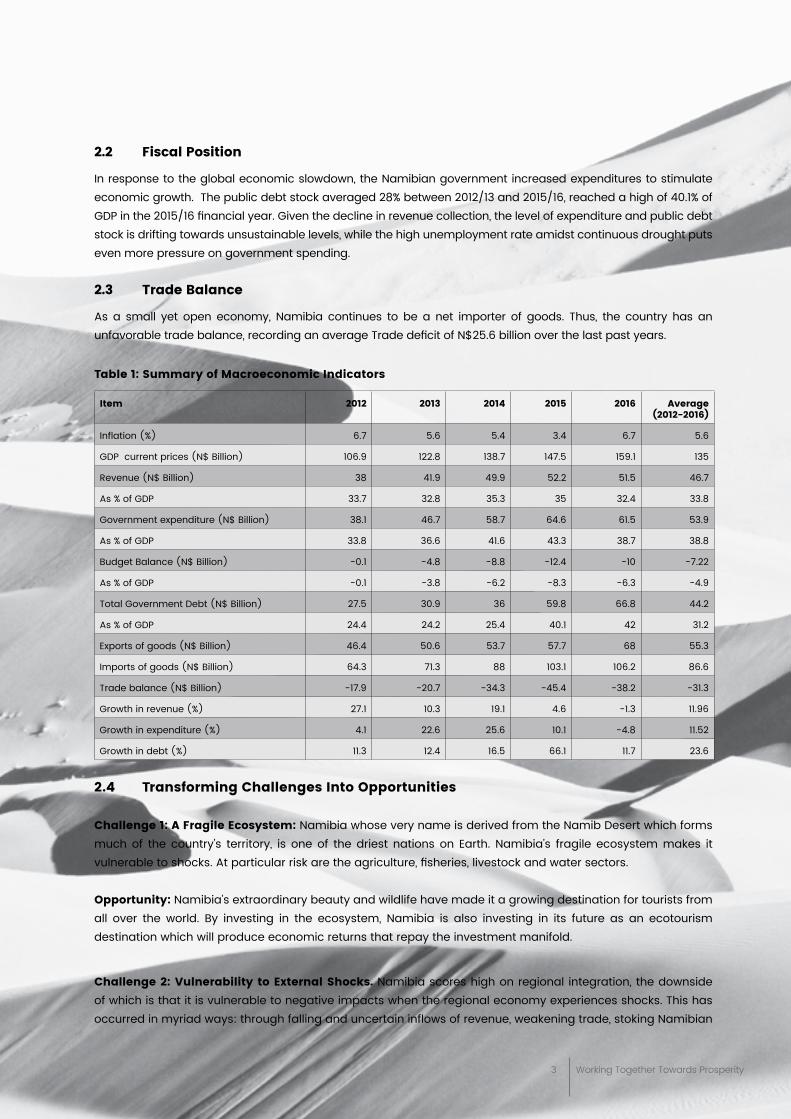
table 1: summary of macroeconomic indicators
item 2012 2013 2014 2015 2016 average (2012-2016)
Inflation (%) 6.7 5.6 5.4 3.4 6.7 5.6
GDP current prices (N$ Billion) 106.9 122.8 138.7 147.5 159.1 135
Revenue (N$ Billion) 38 41.9 49.9 52.2 51.5 46.7
As % of GDP 33.7 32.8 35.3 35 32.4 33.8
Government expenditure (N$ Billion) 38.1 46.7 58.7 64.6 61.5 53.9
As % of GDP 33.8 36.6 41.6 43.3 38.7 38.8
Budget Balance (N$ Billion) -0.1 -4.8 -8.8 -12.4 -10 -7.22
As % of GDP -0.1 -3.8 -6.2 -8.3 -6.3 -4.9
Total Government Debt (N$ Billion) 27.5 30.9 36 59.8 66.8 44.2
As % of GDP 24.4 24.2 25.4 40.1 42 31.2
Exports of goods (N$ Billion) 46.4 50.6 53.7 57.7 68 55.3
Imports of goods (N$ Billion) 64.3 71.3 88 103.1 106.2 86.6
Trade balance (N$ Billion) -17.9 -20.7 -34.3 -45.4 -38.2 -31.3
Growth in revenue (%) 27.1 10.3 19.1 4.6 -1.3 11.96
Growth in expenditure (%) 4.1 22.6 25.6 10.1 -4.8 11.52
Growth in debt (%) 11.3 12.4 16.5 66.1 11.7 23.6
2.4 transforming Challenges into opportunities
Challenge 1: a Fragile ecosystem: Namibia whose very name is derived from the Namib Desert which forms much of the country’s territory, is one of the driest nations on Earth. Namibia’s fragile ecosystem makes it vulnerable to shocks. At particular risk are the agriculture, fisheries, livestock and water sectors.
opportunity: Namibia’s extraordinary beauty and wildlife have made it a growing destination for tourists from all over the world. By investing in the ecosystem, Namibia is also investing in its future as an ecotourism destination which will produce economic returns that repay the investment manifold.
Challenge 2: vulnerability to external shocks. Namibia scores high on regional integration, the downside of which is that it is vulnerable to negative impacts when the regional economy experiences shocks. This has occurred in myriad ways: through falling and uncertain inflows of revenue, weakening trade, stoking Namibian
4 Namibia’s 5th National Development Plan
inflation and exacerbating the fiscal deficit. The result of this vulnerability is persistent current account deficit, presently above 5% of GDP, threatening the stability of the external account.
opportunity: By modernizing its infrastructure and industries, Namibia will become less vulnerable to external shocks and will play more fully as an economic participant in the global economy.
Challenge3:TradeDeficit:The high import bill puts added pressure on international reserves, lowering the import cover to below the required minimum of three-month minimum in recent periods. Together with other economic fundamentals, this has lowered the credit ratings of the country.
opportunity: By encouraging the development of manufacturing and mining, including artisanal crafts that leverage natural resources, Namibia can turn around its export deficit.
Challenge 4: income inequality and Widespread poverty: Namibia contends with poverty, inequality and unemployment which are mutually reinforcing phenomena. A major issue is the lack of technical skills in the labour force.
opportunity: Value added industrialization will help diversify the economy. Investment in education and training will produce a labor force to carry out well-paid 21st century jobs.
2.5 macroeconomic outlook
During the NDP5, the real Gross Domestic Product (GDP) is projected to expand between 4-5% per annum, while the GDP per capita is expected to reach N$56,000 (US$4,300) by 2022. GDP growth is projected to be driven by the private sector. Furthermore, taking into account the interventions that NDP5 aims to implement, the economy is projected to create about 200,000 jobs over the entire NDP5 period. The secondary industry is projected to contribute about a third of the total employment, while 12% of the total jobs are projected to come from the construction sector. Primary industries on the other hand is estimated to contribute about 56% of the total employment of which agriculture will still be a single largest employer at 30% of the total employment. The unemployment rate is projected to remain high until 2021/22, and thereafter drops to below 20% as the NDP5 initiatives takes full effect.
As a result of the expected continued government fiscal consolidation, the economic structural change is expected to adjust slightly during NDP5. Primary and secondary industries are estimated to increase their contribution share at the expense of tertiary industries. However, at the end of NDP5, conditions to propel growth in the secondary and tertiary industries (excluding government services) are expected to be in place and as such, a rapid structural change is expected.
In terms of the trade outlook, the balance of payment is expected to improve over the NDP5 period, on account of increased mining exports. Furthermore, imports are projected to decrease as a result of the local procurement initiative proposed by the NDP5.
5 At the exchange rate of NAD13 to US$1
5 Working Together Towards Prosperity
On the fiscal front, a nearly-balanced budget is projected towards the end of NDP5. This is mainly at the back of the improved revenue collection, (total revenue including grants) resulting from implementation strategic initiatives suggested by the Policy document. Further, Government Gross Fixed Capital Formation (GGFCF) is estimated to grow on average around 2.0% per annum thereby providing further impetus into the government revenue stream.
Value addition to minerals and agricultural products is expected to be a major factor for economic growth. The projected improved productivity in agriculture especially in communal farming, will not only increase production but also ensure food security. Moreover, Foreign Direct Investment (FDI) is also projected to grow gradually resulting from the strategic initiatives proposed by the policy document including the effects of 2016 Investment Conference and adoption of the economic diplomacy policy. Lastly, investment in economic infrastructure such as water, energy and transport (in particular railway infrastructure) is expected to support all drivers of economic growth.
3. NDp5 vision, goals and objectives
As an upper-middle income country , Namibia aims to graduate to “high income country” status. The difficulties in doing so are captured in the economic phenomenon known as the “middle income trap.” According to this economic scenario, a middle-income nation like Namibia risks stalling economically if it is unable to compete against advanced economies with high levels of innovation and value-adding activities, and at the same time, is unable to compete with less developed economies that offer relatively cheaper labour.
The remedies for avoiding the middle income trap are diverse, but chief among them are building a pro-business infrastructure and the development of more sophisticated industries, including more robust avenues for Research and Development.
The present NDP is therefore focused on structural transformation and modernization. Over the next five years (2017-2022), Namibia will focus on attaining four high level goals:
• Achieve an Inclusive, Sustainable and Equitable Economic Growth,
• Build Capable and Healthy Human Resources;
• Ensure Sustainable Environment and Enhance Resilience; and
• Promote Good Governance through Effective Institutions
The first goal entails growing the economy, creating employment, and reducing poverty and inequality while the second goal aims at creating a skilled and healthy work force. The third goal strives to ensure that both the current and future generation enjoys the benefits of the country’s natural resources sustainably. The fourth goal recognizes the pivotal role of creating a conducive environment for development and adherence to the rule of law.
6 In 2009, Namibia was classified as an upper middle income country with a per capita income of USD 5210.
6 Namibia’s 5th National Development Plan
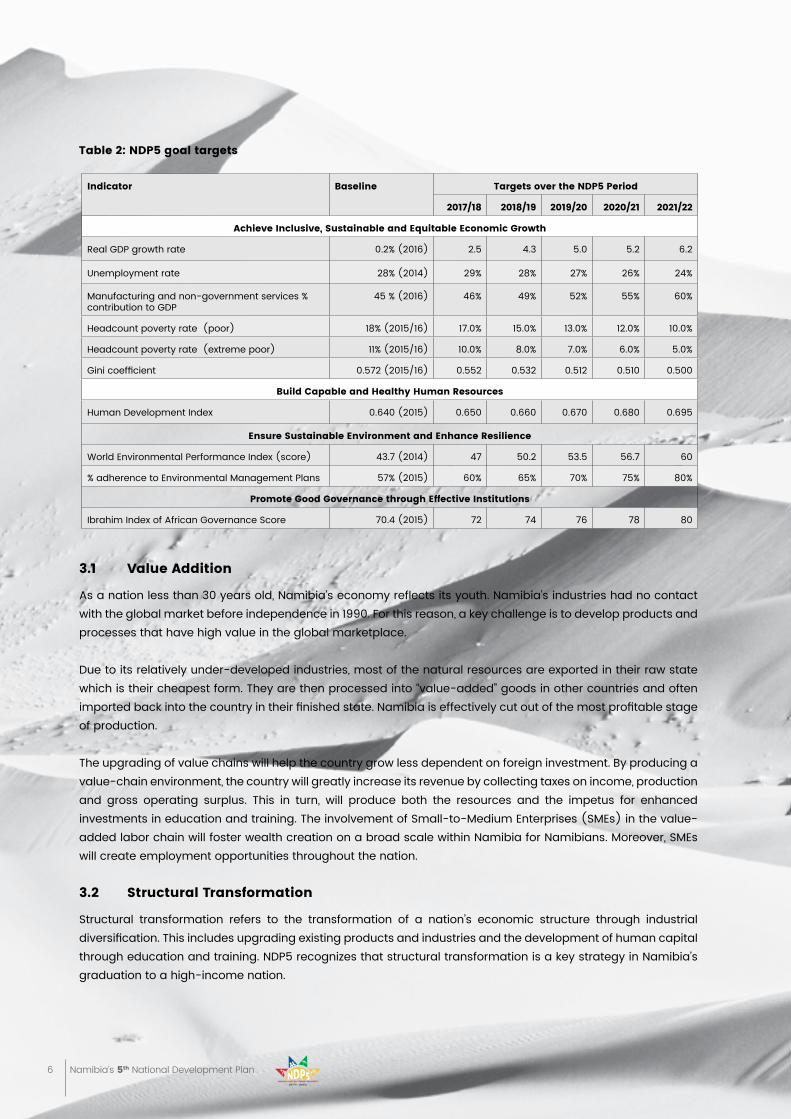
indicator baseline targets over the NDp5 period
2017/18 2018/19 2019/20 2020/21 2021/22
achieve inclusive, sustainable and equitable economic growth
Real GDP growth rate 0.2% (2016) 2.5 4.3 5.0 5.2 6.2
Unemployment rate 28% (2014) 29% 28% 27% 26% 24%
Manufacturing and non-government services % contribution to GDP
45 % (2016) 46% 49% 52% 55% 60%
Headcount poverty rate (poor) 18% (2015/16) 17.0% 15.0% 13.0% 12.0% 10.0%
Headcount poverty rate (extreme poor) 11% (2015/16) 10.0% 8.0% 7.0% 6.0% 5.0%
Gini coefficient 0.572 (2015/16) 0.552 0.532 0.512 0.510 0.500
build Capable and healthy human resources
Human Development Index 0.640 (2015) 0.650 0.660 0.670 0.680 0.695
ensure sustainable environment and enhance resilience
World Environmental Performance Index (score) 43.7 (2014) 47 50.2 53.5 56.7 60
% adherence to Environmental Management Plans 57% (2015) 60% 65% 70% 75% 80%
promote good governance through effective institutions
Ibrahim Index of African Governance Score 70.4 (2015) 72 74 76 78 80
table 2: NDp5 goal targets
3.1 value addition
As a nation less than 30 years old, Namibia’s economy reflects its youth. Namibia’s industries had no contact with the global market before independence in 1990. For this reason, a key challenge is to develop products and processes that have high value in the global marketplace.
Due to its relatively under-developed industries, most of the natural resources are exported in their raw state which is their cheapest form. They are then processed into “value-added” goods in other countries and often imported back into the country in their finished state. Namibia is effectively cut out of the most profitable stage of production.
The upgrading of value chains will help the country grow less dependent on foreign investment. By producing a value-chain environment, the country will greatly increase its revenue by collecting taxes on income, production and gross operating surplus. This in turn, will produce both the resources and the impetus for enhanced investments in education and training. The involvement of Small-to-Medium Enterprises (SMEs) in the value-added labor chain will foster wealth creation on a broad scale within Namibia for Namibians. Moreover, SMEs will create employment opportunities throughout the nation.
3.2 structural transformation
Structural transformation refers to the transformation of a nation’s economic structure through industrial diversification. This includes upgrading existing products and industries and the development of human capital through education and training. NDP5 recognizes that structural transformation is a key strategy in Namibia’s graduation to a high-income nation.
7 Working Together Towards Prosperity
Improved systems of governance will facilitate the collaboration of many sectors in achieving structural transformation. Special attention will be paid to the implementation and monitoring of inclusive economic growth through the provision of high quality government services including water, sewage, electricity generation, transport, housing and spatial planning.
Central to this effort is the State’s technical capacity for integrated planning, both at the national and sub-national level and cross-sectoral implementation. This approach marks a substantive shift in the way the business of the state is conducted.
3.3 the Four pillars of NDp5
The NDP5 framework is organised around the four interconnected pillars that are founded on the principle of sustainable development namely, economic progression, social transformation, environmental sustainability and good governance. These pillars are aligned with Namibia’s commitment to eradicate poverty and inequality as outlined in Vision 2030, the Harambee Prosperity Plan (2016), and the SWAPO Party Manifesto (2014). Additionally, the pillars support the global and continental development frameworks to which Namibia is committed. These include Agenda 2030, Sustainable Development Goals (SDGs), The Paris Agreement (CoP21); African Union (AU) Agenda 2063 and SADC Regional Indicative Strategic Development Plan (RISDP).
Within these contexts, Namibia commits itself to enhancing growth and economic diversification while addressing challenges that include a high degree of regulation and a mismatch between the skill levels in Namibia’s work force and the skills demanded by the labor market.
4. a Coordinated and inclusive strategy
A critical success factor is the active involvement of partners from all sectors of society as the country moves forward. For that reason, the theme of NDP5 is ‘Working together towards prosperity’. This approach stems from a realization that government alone cannot grow the economy, eradicate poverty and inequality and enhance the quality of life. The state needs to work with partners across the social spectrum; including the private sector, civil society, NGOs, women and youth organizations, parliamentarians, faith-based organisations and development partners.
5. game changers
NDP5 identifies five game changers that will move Namibia from a reactive, input-based economy towards a proactive, high performing economy. The game changers are;
• Increase investment in infrastructure development
• Increase productivity in agriculture, especially for smallholder farmers
• Invest in quality technical skills development
• Improve value addition in natural resources
• Achieve industrial development through Local Procurement
8 Namibia’s 5th National Development Plan
5.1 increase investment in infrastructure development
5.1.1 energy
Energy is that “indispensable force driving all economic activities”. The more the economy expands the more energy it will require in order to support industrialisation. Access to electricity in rural areas will improve the standard of living and bolster rural economic activity. Current local electricity peak demand stands at, 656MW, exceeding local generation capacity at 484MW at peak. The sector therefore relies on energy imports from neighboring power corporations. Total peak demand is expected to reach 755MW by 2022. Adequate infrastructure in terms of generation, storage and distribution will ensure the smooth running of economic activities, and the reliability of energy supply. Lack of infrastructure is a bottleneck towards economic development.
Secure and reliable electricity provision will improve the country’s competitiveness through lower input costs. The country will benefit from low import bill, thus improving the balance of payment. Availability of electricity will accelerate rural electrification improving the standard of living of rural communities by unlocking rural economic activities and preservation of food and medicine. There is strong correlation between availability of electricity and educational performance.
It is envisaged that during NDP5 public investment in critical electricity generating projects will be increased. Promotion of Independent Power Producers (IPP) and of renewable energy such as solar, wind and biomass resources will be accelerated. Competition in the electricity sector will be encouraged through the transformation of the current power market structure.
5.1.2 Water
The availability and affordability of water is crucial for Namibia’s transformation into an industrialized economy. Water demand for economic activities and urban consumption is estimated to increase from 416.1 million cubic meters per year in 2015 to about 572.5 million in 2025 while rural domestic use is estimated to increase from 10.6 million cubic meters per year in 2015 to 10.9 million in 2025. Agriculture (irrigation) is and will remain the largest consumer of water until 2030.
Water provision especially in rural areas will improve service delivery to the communities and improve the standard of living and health of rural communities. Provision of water infrastructure through PPP will enhance competition and hence increase efficiency in water management. Reliable water supply will increase investment in agriculture and manufacturing sectors thus increasing production.
Opportunities exist in the coastal areas for the construction of desalination plants either through public investment and or through partnerships with the private sector. Public investment are essential for secure underground water in central areas by tapping water from aquifers, drilling of boreholes inland, and harness flood water from flood prone areas.
5.2 increase productivity in agriculture, especially for smallholder farmers
The agriculture sector employs one third of the workforce, while contributing only about 3.8% to GDP. Average wages in the sector are very low estimated at N$2114 per month. In 2015, Namibia imported about 76%, 98% and 91% of its demand for maize, millet and wheat respectively. Such import dependency poses

9 Working Together Towards Prosperity
a food security risk and trade imbalance. In 2016, 595 839 Namibians suffered from inadequate nutrition. The productivity of small, medium and large scale farms must be maximized to increase the wealth of Namibians and ensure food security for all.
Currently most of smallholder farmers are not organized and therefore not productive. Re-organization of smallholder farmers will increase production, food security and income for them. Increased production of smallholder farmers will create opportunities for value addition and development of agro business. This in turn narrows the trade deficit of agricultural related products but also improved nutritional status of the Namibia people.
The government will intensify agricultural extension services to smallholder farmers and/or communal farmers by providing information on how to organize themselves into cooperatives, access credit and acquire agricultural implements such as tractors. Furthermore, government will support the modernization of agriculture production. There will be increased, acquiring land for redistribution, supportive infrastructure for small-scale farmers including increased access to market, quality control support and better seeds. Green scheme projects will be expanded.
Government institutions will procure locally-sourced produce in bulk for prisons, army barracks, hospitals and schools and will encourage larger companies to do the same. In addition, the government tender system will be used to favor local producers.
5.3 invest in quality technical skills development
With 37% of the population between the ages of 16-35 and an unemployment rate of 37% for the youth, Namibia has a large pool of young workers who can contribute to the economic transformation agenda. The challenge is that the youth are unskilled. A
youth sector with technical skills is a precondition for becoming an industrialized nation. Vocational Education and Training (VET) is critical for expanding manufacturing and value addition. Currently enrollment in Technical Vocational Education and Training (TVET) represents half of the enrolment of Namibian’s three universities.
The development of vocational technical skills in the country will reduce unemployment rate through increased employment creation. This in turn will increase and improve manufacturing and value addition economic activities.
During NDP5, TVET training centers will be upgraded. In addition to expanding and upgrading the physical infrastructure, equipment and programmes, new training centers will be established in areas where there are none. Initiatives will include harmonizing TVET curricula, transforming some Vocational Training Centres (VTCs) into TVET colleges, re-introduction of pre-vocational subjects in schools, attracting qualified artisans into TVET and upskilling current trainers. TVET will also be rebranded to increase its appeal to career-minded young people. The total number of trainees enrolled at both private and public TVET institutions will be doubled from the current enrollment of 25 000 to 50 000.
5.4 improve value addition in natural resources
About 67% of Namibia’s total export products are exported in their raw form. During, the NDP5 period, the following sectors will be targeted for value addition: mining and mineral beneficiation, agriculture and agro-processing, fish and fish processing. Other subsectors include chemicals linked to local available minerals, steel manufacturing and components for the automotive industries.
Investment in value addition activities will transform the economic structure from the one dependent on the trade of raw materials to the one trading
10 Namibia’s 5th National Development Plan
in finished products. The production of finished products will create more employment opportunities and increase the distribution of income. Increased economic activities through value addition will facilitate more trade and thus improving the balance of payment and increased government revenue to finance social programmes.
During NDP5 the Government will endeavor to create a conducive business environment that attracts investments and facilitates the development of value addition activities with an emphasis on involving SMEs.
5.5 achieve industrial development through local procurement
It is well-established that Namibia produces what it does not consume, and consume a great deal of what it does not produce. The Growth at Home Strategy encourages the public and private sectors to buy
local products. The government procures a large quantity of food products for government-supported organizations. This presents a potential market for local produce. Encouraging larger private companies and retailers to procure local products, in particular from SMEs, will benefit local industries.
The encouragement of local procurement of goods by government and large private companies will support local industry development and competitiveness by provision of market access for local produce. This will benefit the economy at large in many ways including reduction in import bill, improved balance of payments and employment creation.
By enforcing the Public procurement Act and implementing the retail charter, there will be increased markets for local produce. There is a need to create infrastructure to ensure local products comply with retailer standards. Efforts will be doubled to establish Namibia’s coding system which is a requirement for most retailers.

11 Working Together Towards Prosperity

12 Namibia’s 5th National Development Plan
13 Working Together Towards Prosperity
eCoNomiC progressioN
2
aChieve iNClusive, sustaiNable aND equitable groWth
• Moving Forward: Namibia 2017-2022
• Structural Transformation through Value Added Industrialization
» Enterprise Development
» Manufacturing Sector
» Agriculture Sector and Food Security
» Rural Economic Development
» Blue Economy
» Fishery
» Mining
» Tourism
» Research and Innovation
• Expansion and Modernization of Physical Infrastructure
» Energy
» Water
» Transport And Logistics
» Information & Communication Technology (ICT)
• Strengthened Export Capacity and Greater Regional Integration
• Supportive Financial Infrastructure for Greater Inclusion
overview
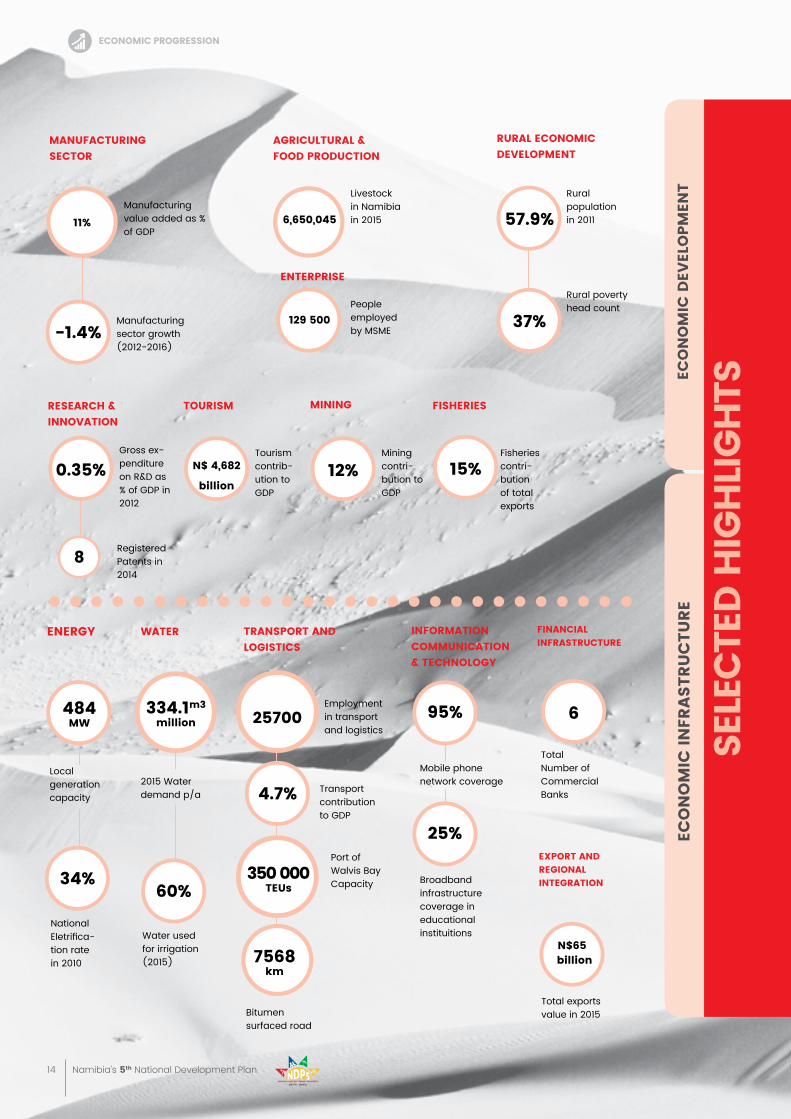
14 Namibia’s 5th National Development Plan
sele
Cte
D h
igh
lig
htseC
oN
om
iC D
evel
opm
eNt
eCo
No
miC
iNFr
ast
ruC
ture
Manufacturing value added as % of GDP
11%
maNuFaCturiNg seCtor
Rural population in 2011
Rural poverty head count
57.9%
37%
rural eCoNomiC DevelopmeNt
Gross ex-penditure on R&D as % of GDP in 2012
RegisteredPatents in 2014
0.35%
8
researCh &iNNovatioN
Livestockin Namibiain 2015
People employed by MSME
6,650,045
129 500
agriCultural & FooD proDuCtioN
Employmentin transport and logistics
2015 Water demand p/a
Port of Walvis Bay Capacity
Bitumen surfaced road
Transport contribution to GDP
25700
4.7%
350 000teus
7568km
traNsport aND logistiCs
Local generation capacity
National Eletrifica-tion ratein 2010
484mW
34%
eNergY
Water used for irrigation(2015)
334.1m3 million
60%
Water
Mobile phone network coverage
Broadbandinfrastructure coverage in educational instituitions
95%
25%
iNFormatioNCommuNiCatioN& teChNologY
Total exports value in 2015
N$65 billion
eXport aND regioNal iNtegratioN
Total Number of Commercial Banks
6
FiNaNCial iNFrastruCture
Fisheries contri-bution of total exports
15%
Fisheries
Mining contri-bution to GDP
12%
miNiNg
eNterprise
Tourismcontrib-ution to GDP
N$ 4,682
billion
tourism
Manufacturing sector growth (2012-2016)
-1.4%
eCoNomiC progressioN
15 Working Together Towards Prosperity
sele
Cte
D h
igh
lig
hts
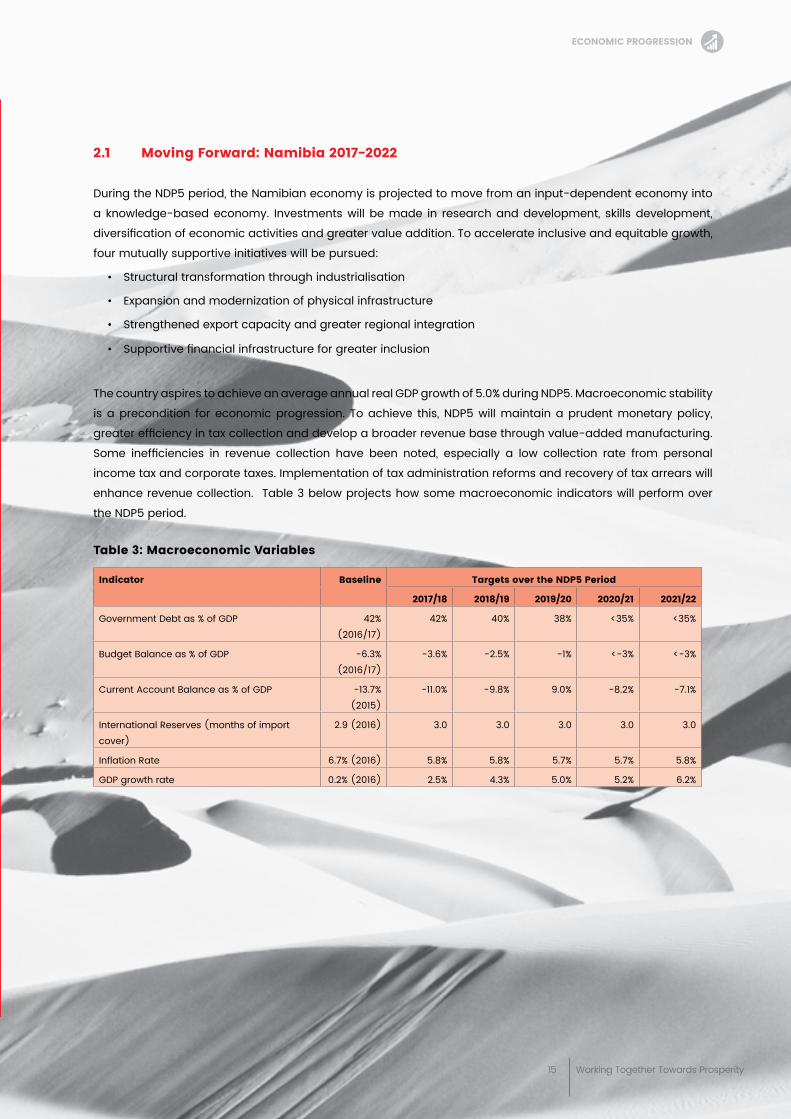
2.1 moving Forward: Namibia 2017-2022
During the NDP5 period, the Namibian economy is projected to move from an input-dependent economy into
a knowledge-based economy. Investments will be made in research and development, skills development,
diversification of economic activities and greater value addition. To accelerate inclusive and equitable growth,
four mutually supportive initiatives will be pursued:
• Structural transformation through industrialisation
• Expansion and modernization of physical infrastructure
• Strengthened export capacity and greater regional integration
• Supportive financial infrastructure for greater inclusion
The country aspires to achieve an average annual real GDP growth of 5.0% during NDP5. Macroeconomic stability
is a precondition for economic progression. To achieve this, NDP5 will maintain a prudent monetary policy,
greater efficiency in tax collection and develop a broader revenue base through value-added manufacturing.
Some inefficiencies in revenue collection have been noted, especially a low collection rate from personal
income tax and corporate taxes. Implementation of tax administration reforms and recovery of tax arrears will
enhance revenue collection. Table 3 below projects how some macroeconomic indicators will perform over
the NDP5 period.
table 3: macroeconomic variables
indicator baseline targets over the NDp5 period
2017/18 2018/19 2019/20 2020/21 2021/22
Government Debt as % of GDP 42% (2016/17)
42% 40% 38% <35% <35%
Budget Balance as % of GDP -6.3% (2016/17)
-3.6% -2.5% -1% <-3% <-3%
Current Account Balance as % of GDP -13.7% (2015)
-11.0% -9.8% 9.0% -8.2% -7.1%
International Reserves (months of import cover)
2.9 (2016) 3.0 3.0 3.0 3.0 3.0
Inflation Rate 6.7% (2016) 5.8% 5.8% 5.7% 5.7% 5.8%
GDP growth rate 0.2% (2016) 2.5% 4.3% 5.0% 5.2% 6.2%
eCoNomiC progressioN
16 Namibia’s 5th National Development Plan
2.2 structural transformation through value added industrialization
In 2016, the services industry account for about 59% of the GDP while the primary and secondary industries each
represent about 17% of GDP respectively. This structure is mainly similar to the one during NDP1 when the service
industry accounted for 60.1% while the primary and secondary industry accounted for 17.6% and 14%, respectively.
During NDP4, only tourism and transport of the four priority sectors performed as expected. Growth in agriculture
and manufacturing contracted due to climate-related factors and external shocks.
Throughout the NDP4 period, the majority of new jobs created were in semi-skilled occupations, which contributed
relatively low labour productivity gains. Structural transformation has been impeded by the underdevelopment of
the manufacturing sector, slow pace of industrialization, and large informal economy.
In order to achieve structural transformation and ultimately inclusive, sustainable and equitable growth, NDP5
proposes interventions in several focus areas.
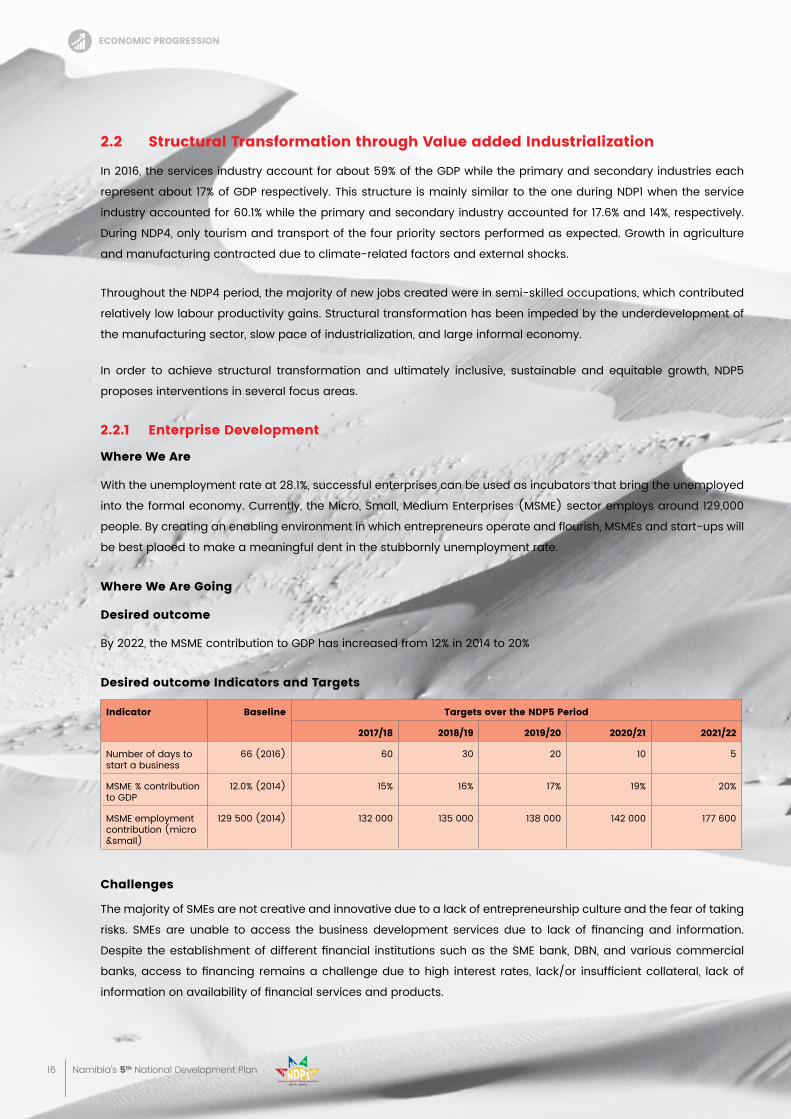
2.2.1 enterprise Development
Where We are
With the unemployment rate at 28.1%, successful enterprises can be used as incubators that bring the unemployed
into the formal economy. Currently, the Micro, Small, Medium Enterprises (MSME) sector employs around 129,000
people. By creating an enabling environment in which entrepreneurs operate and flourish, MSMEs and start-ups will
be best placed to make a meaningful dent in the stubbornly unemployment rate.
Where We are going
Desired outcome
By 2022, the MSME contribution to GDP has increased from 12% in 2014 to 20%
Desired outcome indicators and targets
indicator baseline targets over the NDp5 period
2017/18 2018/19 2019/20 2020/21 2021/22
Number of days to start a business
66 (2016) 60 30 20 10 5
MSME % contribution to GDP
12.0% (2014) 15% 16% 17% 19% 20%
MSME employment contribution (micro &small)
129 500 (2014) 132 000 135 000 138 000 142 000 177 600
Challenges
The majority of SMEs are not creative and innovative due to a lack of entrepreneurship culture and the fear of taking
risks. SMEs are unable to access the business development services due to lack of financing and information.
Despite the establishment of different financial institutions such as the SME bank, DBN, and various commercial
banks, access to financing remains a challenge due to high interest rates, lack/or insufficient collateral, lack of
information on availability of financial services and products.
eCoNomiC progressioN
17 Working Together Towards Prosperity
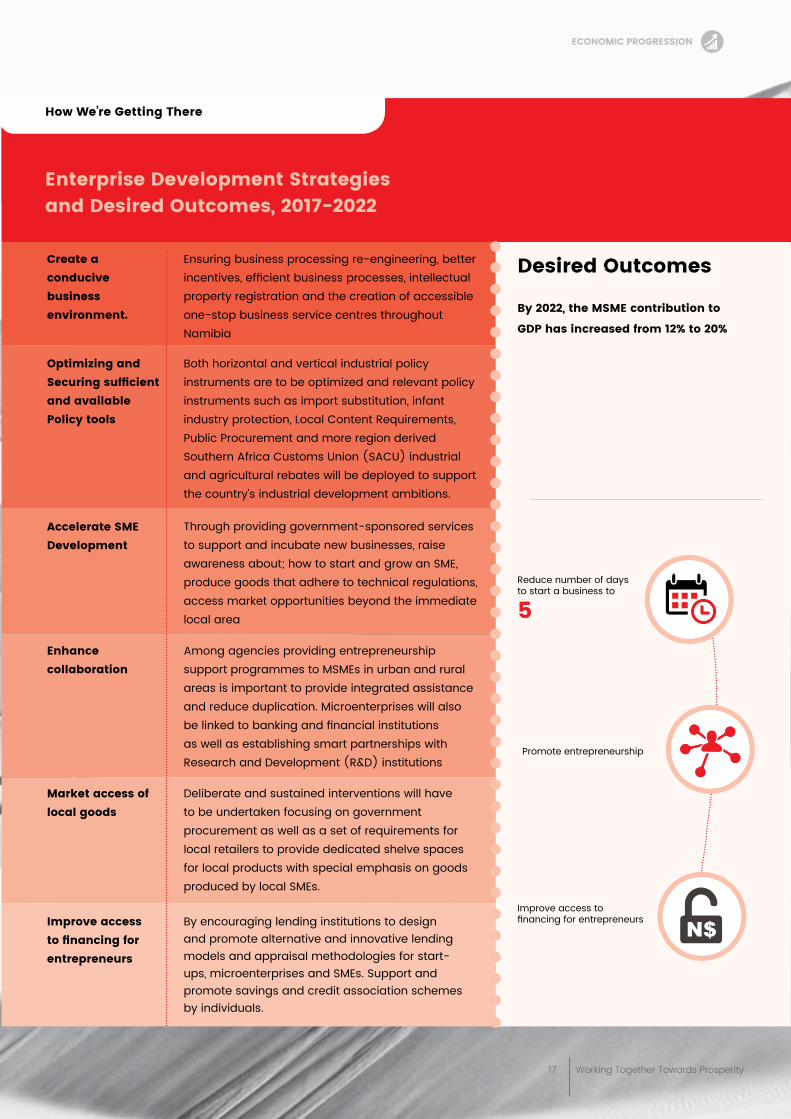
enterprise Development strategies and Desired outcomes, 2017-2022
Create a conducive business environment.
Ensuring business processing re-engineering, better incentives, efficient business processes, intellectual property registration and the creation of accessible one-stop business service centres throughout Namibia
Both horizontal and vertical industrial policy instruments are to be optimized and relevant policy instruments such as import substitution, infant industry protection, Local Content Requirements, Public Procurement and more region derived Southern Africa Customs Union (SACU) industrial and agricultural rebates will be deployed to support the country’s industrial development ambitions.
Through providing government-sponsored services to support and incubate new businesses, raise awareness about; how to start and grow an SME, produce goods that adhere to technical regulations, access market opportunities beyond the immediate local area
Among agencies providing entrepreneurship support programmes to MSMEs in urban and rural areas is important to provide integrated assistance and reduce duplication. Microenterprises will also be linked to banking and financial institutions as well as establishing smart partnerships with Research and Development (R&D) institutions
Deliberate and sustained interventions will have to be undertaken focusing on government procurement as well as a set of requirements for local retailers to provide dedicated shelve spaces for local products with special emphasis on goods produced by local SMEs.
By encouraging lending institutions to design and promote alternative and innovative lending models and appraisal methodologies for start-ups, microenterprises and SMEs. Support and promote savings and credit association schemes by individuals.
optimizing and Securingsufficientand available policy tools
accelerate sme Development
enhance collaboration
market access of local goods
improve access tofinancingforentrepreneurs
Desired outcomes
by 2022, the msme contribution to
gDp has increased from 12% to 20%
Reduce number of days to start a business to
5
Promote entrepreneurship
Improve access to financing for entrepreneurs
how We’re getting there
eCoNomiC progressioN
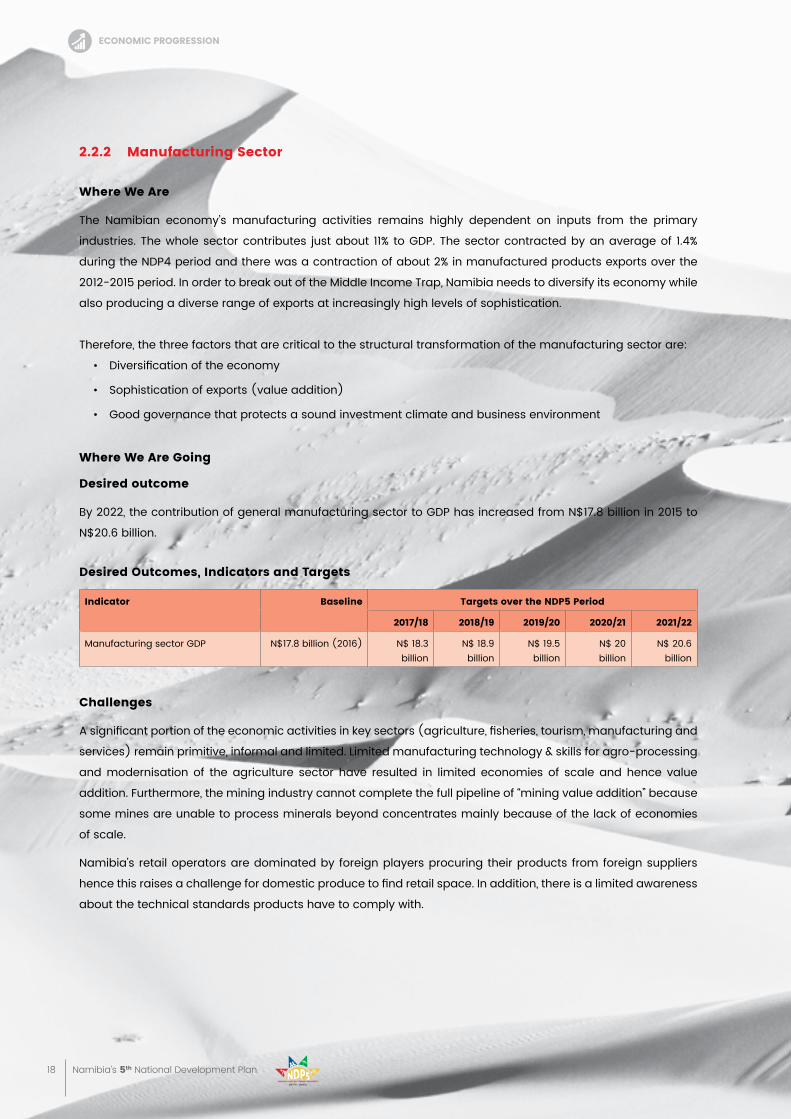
18 Namibia’s 5th National Development Plan
2.2.2 manufacturing sector
Where We are
The Namibian economy’s manufacturing activities remains highly dependent on inputs from the primary
industries. The whole sector contributes just about 11% to GDP. The sector contracted by an average of 1.4%
during the NDP4 period and there was a contraction of about 2% in manufactured products exports over the
2012-2015 period. In order to break out of the Middle Income Trap, Namibia needs to diversify its economy while
also producing a diverse range of exports at increasingly high levels of sophistication.
Therefore, the three factors that are critical to the structural transformation of the manufacturing sector are:
• Diversification of the economy
• Sophistication of exports (value addition)
• Good governance that protects a sound investment climate and business environment
Where We are going
Desired outcome
By 2022, the contribution of general manufacturing sector to GDP has increased from N$17.8 billion in 2015 to
N$20.6 billion.
Desired outcomes, indicators and targets
indicator baseline targets over the NDp5 period
2017/18 2018/19 2019/20 2020/21 2021/22
Manufacturing sector GDP N$17.8 billion (2016) N$ 18.3 billion
N$ 18.9 billion
N$ 19.5 billion
N$ 20 billion
N$ 20.6 billion
Challenges
A significant portion of the economic activities in key sectors (agriculture, fisheries, tourism, manufacturing and
services) remain primitive, informal and limited. Limited manufacturing technology & skills for agro-processing
and modernisation of the agriculture sector have resulted in limited economies of scale and hence value
addition. Furthermore, the mining industry cannot complete the full pipeline of “mining value addition” because
some mines are unable to process minerals beyond concentrates mainly because of the lack of economies
of scale.
Namibia’s retail operators are dominated by foreign players procuring their products from foreign suppliers
hence this raises a challenge for domestic produce to find retail space. In addition, there is a limited awareness
about the technical standards products have to comply with.
eCoNomiC progressioN
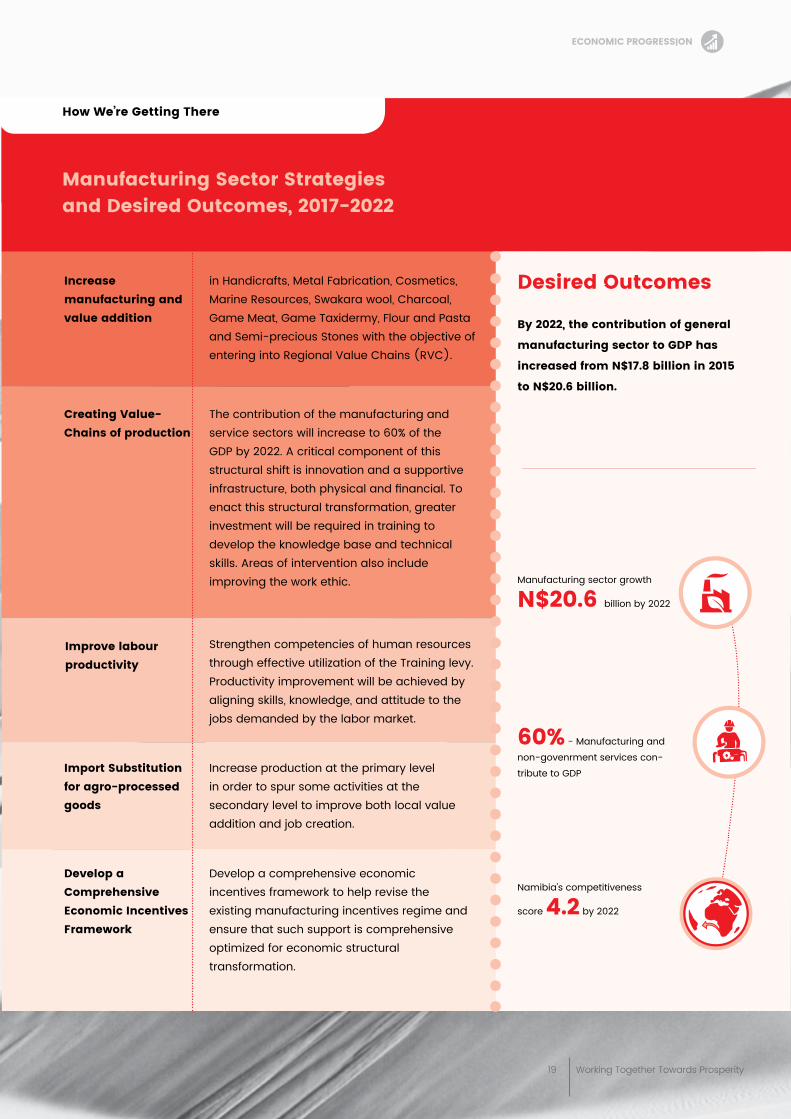
19 Working Together Towards Prosperity
manufacturing sector strategies and Desired outcomes, 2017-2022
increase manufacturing and value addition
in Handicrafts, Metal Fabrication, Cosmetics, Marine Resources, Swakara wool, Charcoal, Game Meat, Game Taxidermy, Flour and Pasta and Semi-precious Stones with the objective of entering into Regional Value Chains (RVC).
The contribution of the manufacturing and service sectors will increase to 60% of the GDP by 2022. A critical component of this structural shift is innovation and a supportive infrastructure, both physical and financial. To enact this structural transformation, greater investment will be required in training to develop the knowledge base and technical skills. Areas of intervention also include improving the work ethic.
Strengthen competencies of human resources through effective utilization of the Training levy. Productivity improvement will be achieved by aligning skills, knowledge, and attitude to the jobs demanded by the labor market.
Increase production at the primary level in order to spur some activities at the secondary level to improve both local value addition and job creation.
Develop a comprehensive economic incentives framework to help revise the existing manufacturing incentives regime and ensure that such support is comprehensive optimized for economic structural transformation.
Creating value-Chains of production
Desired outcomes
by 2022, the contribution of general
manufacturing sector to gDp has
increased from N$17.8 billion in 2015
to N$20.6 billion.
improve labour productivity
import substitution for agro-processed goods
Develop a Comprehensive economic incentives Framework
Manufacturing sector growth
N$20.6 billion by 2022
60% - Manufacturing and non-govenrment services con-tribute to GDP
Namibia’s competitiveness
score 4.2 by 2022
how We’re getting there
eCoNomiC progressioN
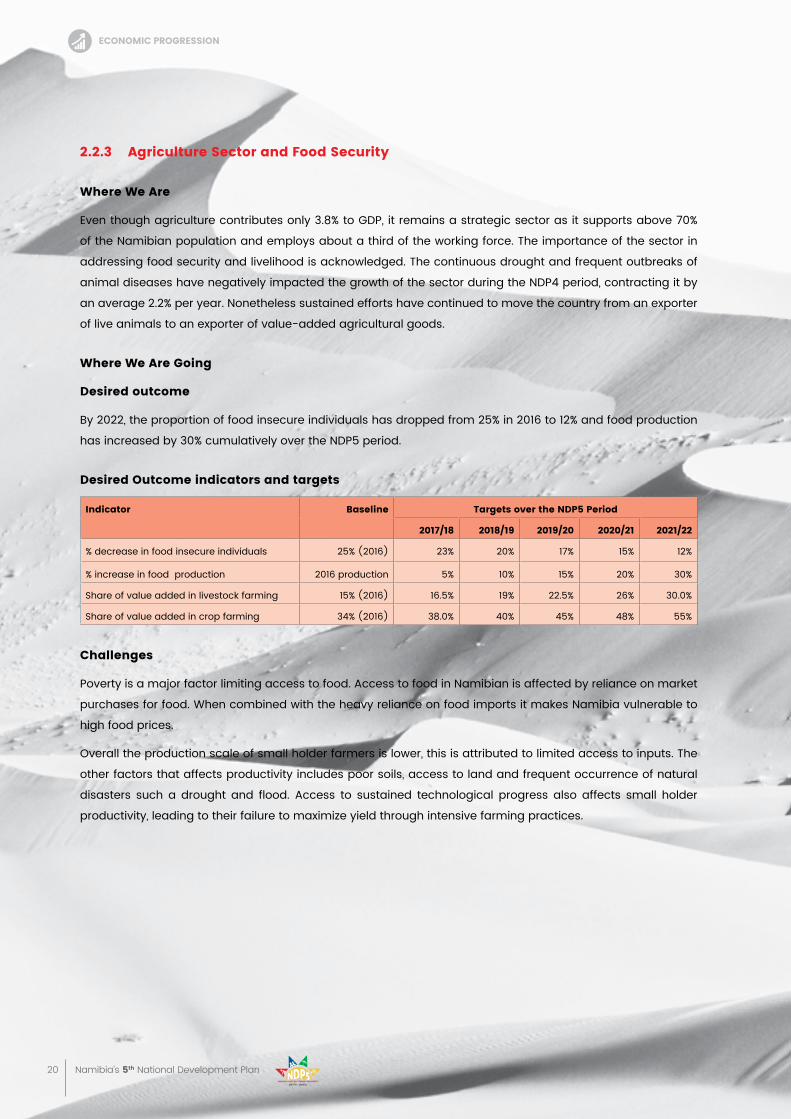
20 Namibia’s 5th National Development Plan
2.2.3 agriculture sector and Food security
Where We are
Even though agriculture contributes only 3.8% to GDP, it remains a strategic sector as it supports above 70%
of the Namibian population and employs about a third of the working force. The importance of the sector in
addressing food security and livelihood is acknowledged. The continuous drought and frequent outbreaks of
animal diseases have negatively impacted the growth of the sector during the NDP4 period, contracting it by
an average 2.2% per year. Nonetheless sustained efforts have continued to move the country from an exporter
of live animals to an exporter of value-added agricultural goods.
Where We are going
Desired outcome
By 2022, the proportion of food insecure individuals has dropped from 25% in 2016 to 12% and food production
has increased by 30% cumulatively over the NDP5 period.
Desired outcome indicators and targets
indicator baseline targets over the NDp5 period
2017/18 2018/19 2019/20 2020/21 2021/22
% decrease in food insecure individuals 25% (2016) 23% 20% 17% 15% 12%
% increase in food production 2016 production 5% 10% 15% 20% 30%
Share of value added in livestock farming 15% (2016) 16.5% 19% 22.5% 26% 30.0%
Share of value added in crop farming 34% (2016) 38.0% 40% 45% 48% 55%
Challenges
Poverty is a major factor limiting access to food. Access to food in Namibian is affected by reliance on market
purchases for food. When combined with the heavy reliance on food imports it makes Namibia vulnerable to
high food prices.
Overall the production scale of small holder farmers is lower, this is attributed to limited access to inputs. The
other factors that affects productivity includes poor soils, access to land and frequent occurrence of natural
disasters such a drought and flood. Access to sustained technological progress also affects small holder
productivity, leading to their failure to maximize yield through intensive farming practices.
eCoNomiC progressioN
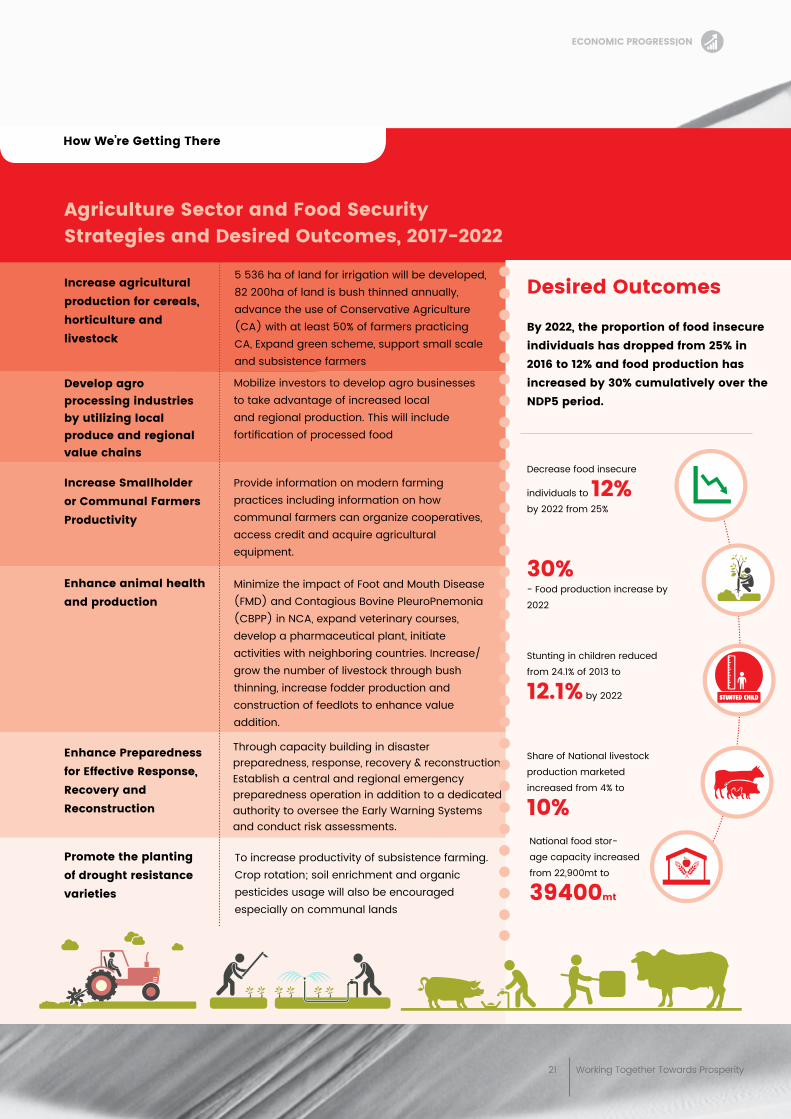
21 Working Together Towards Prosperity
agriculture sector and Food securitystrategies and Desired outcomes, 2017-2022
increase agricultural production for cereals, horticulture and livestock
5 536 ha of land for irrigation will be developed, 82 200ha of land is bush thinned annually, advance the use of Conservative Agriculture (CA) with at least 50% of farmers practicing CA, Expand green scheme, support small scale and subsistence farmers
Mobilize investors to develop agro businesses to take advantage of increased local and regional production. This will include fortification of processed food
Provide information on modern farming practices including information on how communal farmers can organize cooperatives, access credit and acquire agricultural equipment.
Minimize the impact of Foot and Mouth Disease (FMD) and Contagious Bovine PleuroPnemonia (CBPP) in NCA, expand veterinary courses, develop a pharmaceutical plant, initiate activities with neighboring countries. Increase/ grow the number of livestock through bush thinning, increase fodder production and construction of feedlots to enhance value addition.
Through capacity building in disaster preparedness, response, recovery & reconstruction. Establish a central and regional emergency preparedness operation in addition to a dedicated authority to oversee the Early Warning Systems and conduct risk assessments.
To increase productivity of subsistence farming. Crop rotation; soil enrichment and organic pesticides usage will also be encouraged especially on communal lands
Develop agro processing industries by utilizing local produce and regional value chains
Desired outcomes
by 2022, the proportion of food insecure individuals has dropped from 25% in 2016 to 12% and food production has increased by 30% cumulatively over the NDp5 period.
Decrease food insecure
individuals to 12% by 2022 from 25%
30%- Food production increase by 2022
Stunting in children reduced from 24.1% of 2013 to
12.1% by 2022
Share of National livestock production marketed increased from 4% to
10%National food stor-age capacity increased from 22,900mt to
39400mt
increase smallholder or Communal Farmers productivity
enhance animal health and production
enhance preparedness for effective response, recovery and reconstruction
promote the planting of drought resistance varieties
how We’re getting there
eCoNomiC progressioN
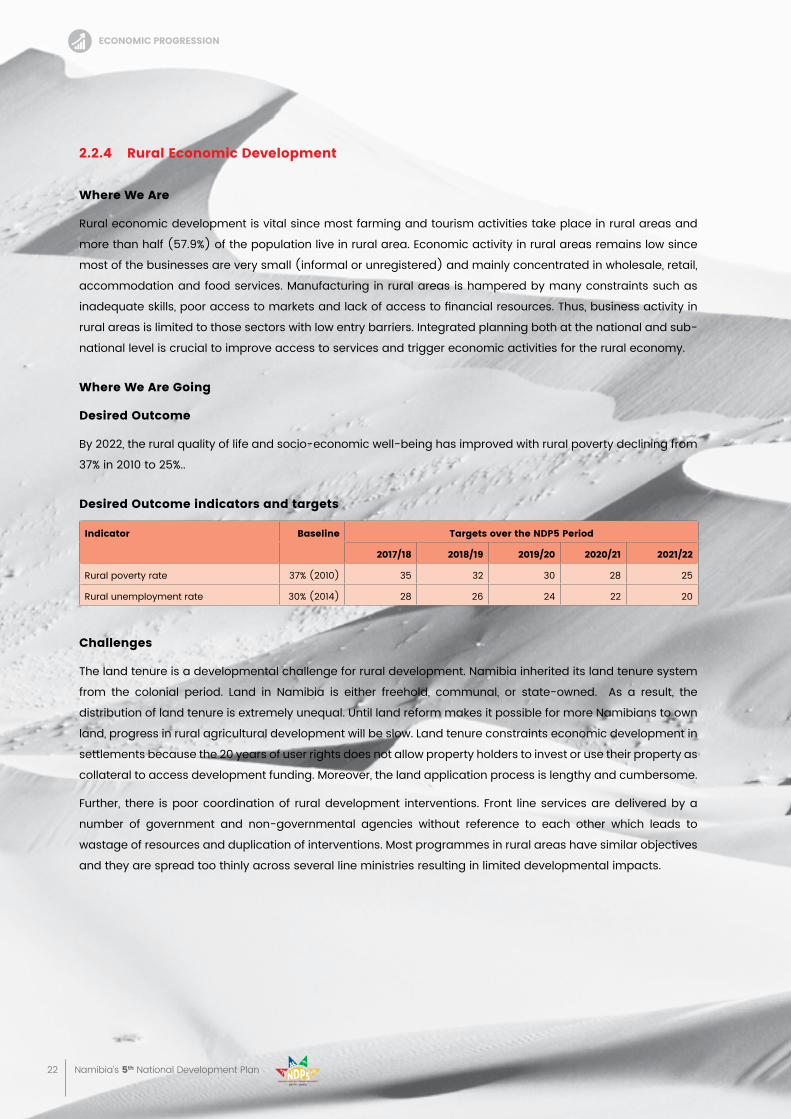
22 Namibia’s 5th National Development Plan
2.2.4 rural economic Development
Where We are
Rural economic development is vital since most farming and tourism activities take place in rural areas and
more than half (57.9%) of the population live in rural area. Economic activity in rural areas remains low since
most of the businesses are very small (informal or unregistered) and mainly concentrated in wholesale, retail,
accommodation and food services. Manufacturing in rural areas is hampered by many constraints such as
inadequate skills, poor access to markets and lack of access to financial resources. Thus, business activity in
rural areas is limited to those sectors with low entry barriers. Integrated planning both at the national and sub-
national level is crucial to improve access to services and trigger economic activities for the rural economy.
Where We are going
Desired outcome
By 2022, the rural quality of life and socio-economic well-being has improved with rural poverty declining from
37% in 2010 to 25%..
Desired outcome indicators and targets
indicator baseline targets over the NDp5 period
2017/18 2018/19 2019/20 2020/21 2021/22
Rural poverty rate 37% (2010) 35 32 30 28 25
Rural unemployment rate 30% (2014) 28 26 24 22 20
Challenges
The land tenure is a developmental challenge for rural development. Namibia inherited its land tenure system
from the colonial period. Land in Namibia is either freehold, communal, or state-owned. As a result, the
distribution of land tenure is extremely unequal. Until land reform makes it possible for more Namibians to own
land, progress in rural agricultural development will be slow. Land tenure constraints economic development in
settlements because the 20 years of user rights does not allow property holders to invest or use their property as
collateral to access development funding. Moreover, the land application process is lengthy and cumbersome.
Further, there is poor coordination of rural development interventions. Front line services are delivered by a
number of government and non-governmental agencies without reference to each other which leads to
wastage of resources and duplication of interventions. Most programmes in rural areas have similar objectives
and they are spread too thinly across several line ministries resulting in limited developmental impacts.
eCoNomiC progressioN
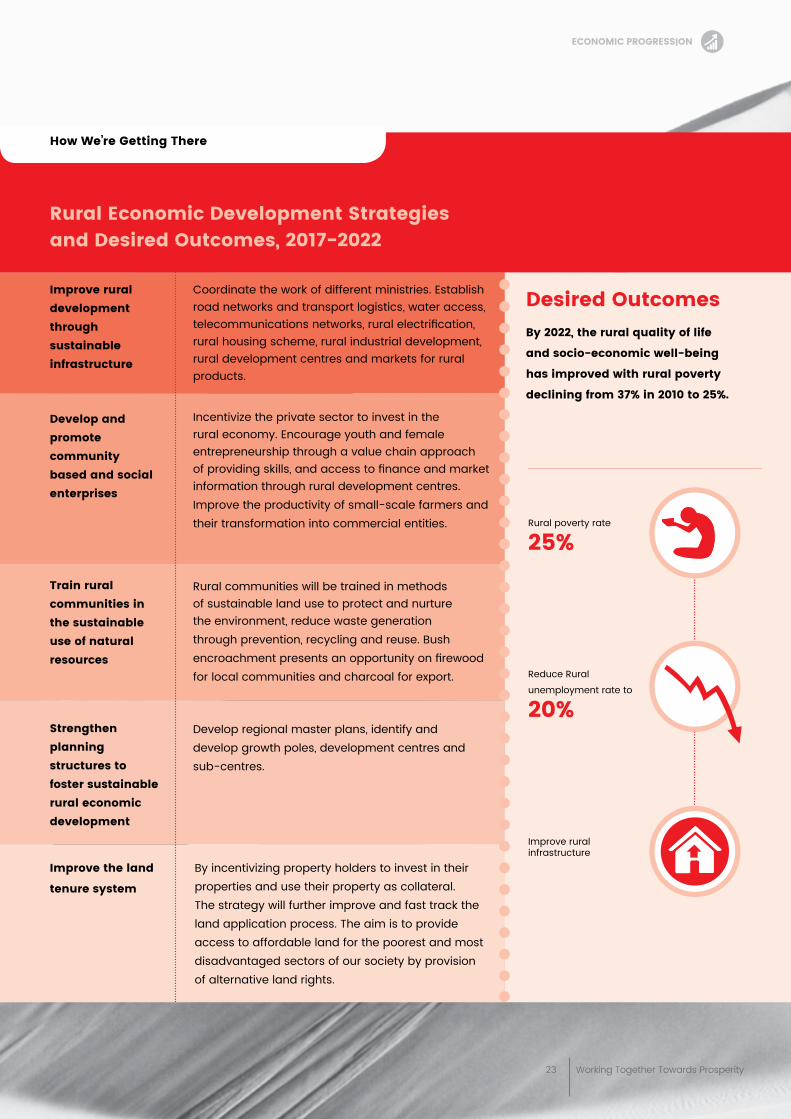
23 Working Together Towards Prosperity
rural economic Development strategies and Desired outcomes, 2017-2022
improve rural development through sustainable infrastructure
Coordinate the work of different ministries. Establish road networks and transport logistics, water access, telecommunications networks, rural electrification, rural housing scheme, rural industrial development, rural development centres and markets for rural products.
Incentivize the private sector to invest in the rural economy. Encourage youth and female entrepreneurship through a value chain approach of providing skills, and access to finance and market information through rural development centres. Improve the productivity of small-scale farmers and their transformation into commercial entities.
Rural communities will be trained in methods of sustainable land use to protect and nurture the environment, reduce waste generation through prevention, recycling and reuse. Bush encroachment presents an opportunity on firewood for local communities and charcoal for export.
Develop regional master plans, identify and develop growth poles, development centres and sub-centres.
Develop and promote community based and social enterprises
train rural communities in the sustainable use of natural resources
strengthen planning structures to foster sustainable rural economic development
improve the land
tenure system
Desired outcomes by 2022, the rural quality of life
and socio-economic well-being
has improved with rural poverty
declining from 37% in 2010 to 25%.
how We’re getting there
Reduce Rural unemployment rate to
20%
Rural poverty rate
25%
Improve rural infrastructure
eCoNomiC progressioN
By incentivizing property holders to invest in their properties and use their property as collateral. The strategy will further improve and fast track the land application process. The aim is to provide access to affordable land for the poorest and most disadvantaged sectors of our society by provision of alternative land rights.
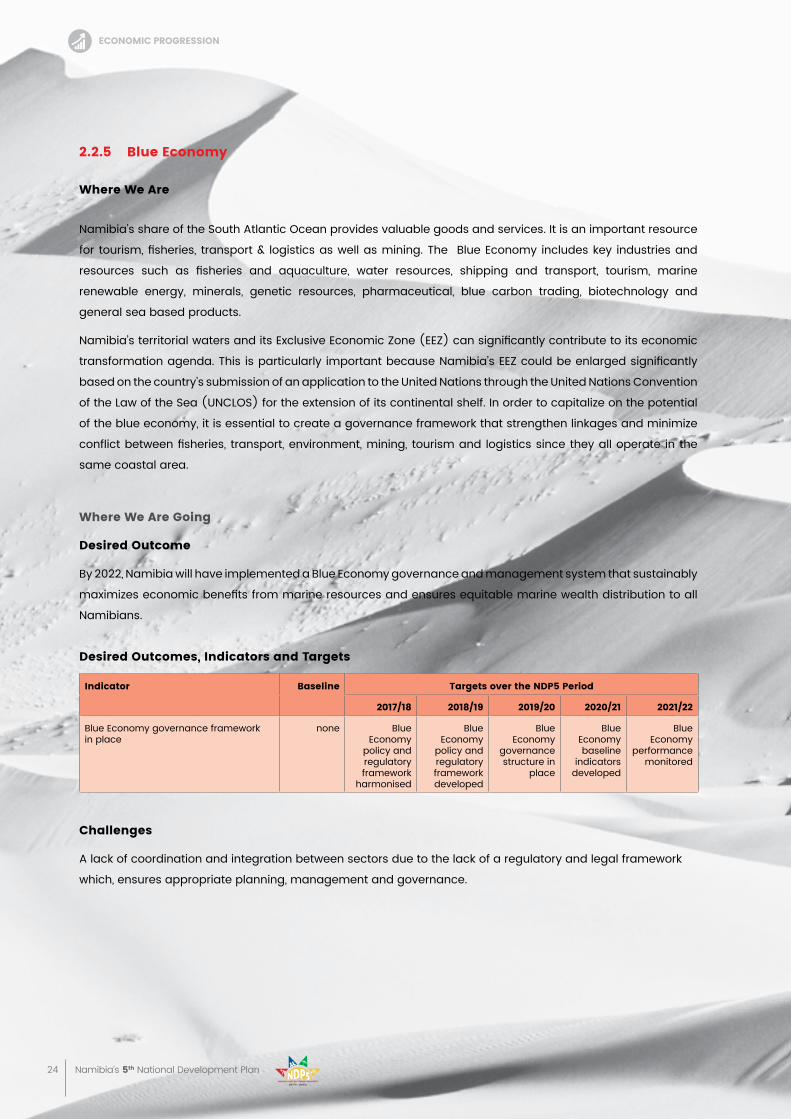
24 Namibia’s 5th National Development Plan
2.2.5 blue economy
Where We are
Namibia’s share of the South Atlantic Ocean provides valuable goods and services. It is an important resource
for tourism, fisheries, transport & logistics as well as mining. The Blue Economy includes key industries and
resources such as fisheries and aquaculture, water resources, shipping and transport, tourism, marine
renewable energy, minerals, genetic resources, pharmaceutical, blue carbon trading, biotechnology and
general sea based products.
Namibia’s territorial waters and its Exclusive Economic Zone (EEZ) can significantly contribute to its economic
transformation agenda. This is particularly important because Namibia’s EEZ could be enlarged significantly
based on the country’s submission of an application to the United Nations through the United Nations Convention
of the Law of the Sea (UNCLOS) for the extension of its continental shelf. In order to capitalize on the potential
of the blue economy, it is essential to create a governance framework that strengthen linkages and minimize
conflict between fisheries, transport, environment, mining, tourism and logistics since they all operate in the
same coastal area.
Where We are going
Desired outcome
By 2022, Namibia will have implemented a Blue Economy governance and management system that sustainably
maximizes economic benefits from marine resources and ensures equitable marine wealth distribution to all
Namibians.
Desired outcomes, indicators and targets
indicator baseline targets over the NDp5 period
2017/18 2018/19 2019/20 2020/21 2021/22
Blue Economy governance framework in place
none Blue Economy
policy and regulatory framework
harmonised
Blue Economy
policy and regulatory framework developed
Blue Economy
governance structure in
place
Blue Economy baseline
indicators developed
Blue Economy
performance monitored
Challenges
A lack of coordination and integration between sectors due to the lack of a regulatory and legal framework
which, ensures appropriate planning, management and governance.
eCoNomiC progressioN
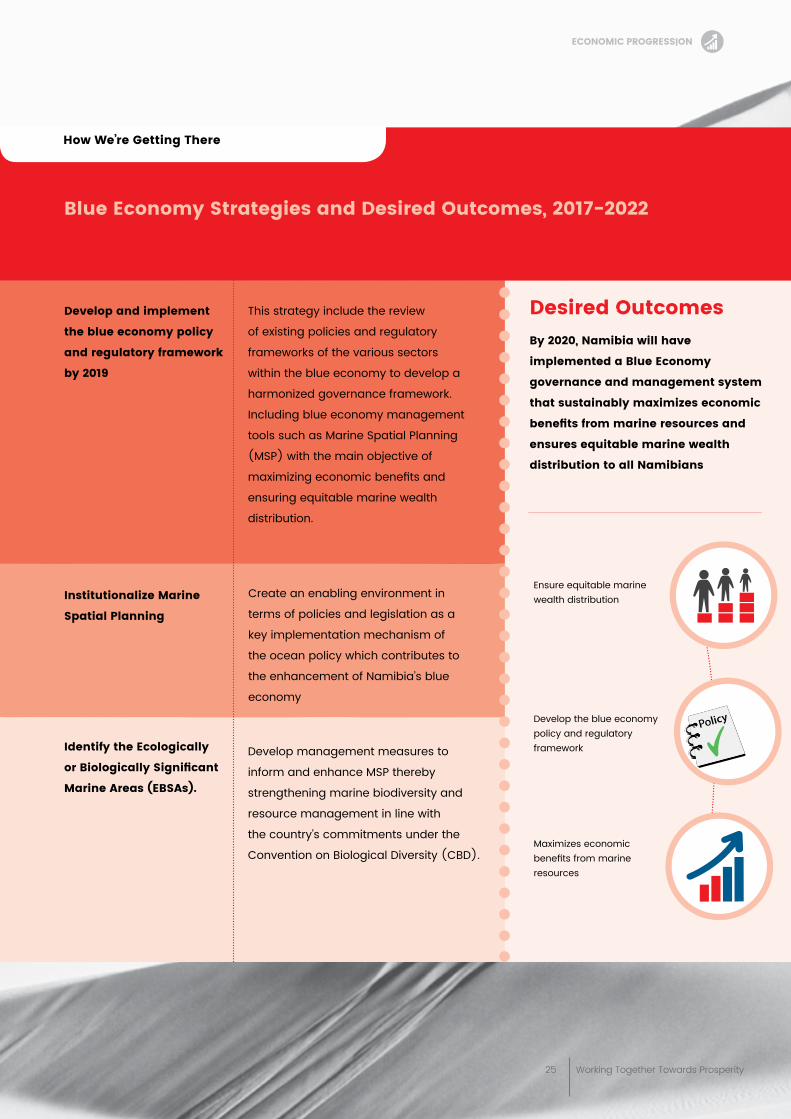
25 Working Together Towards Prosperity
blue economy strategies and Desired outcomes, 2017-2022
Develop and implement
the blue economy policy
and regulatory framework
by 2019
This strategy include the review
of existing policies and regulatory
frameworks of the various sectors
within the blue economy to develop a
harmonized governance framework.
Including blue economy management
tools such as Marine Spatial Planning
(MSP) with the main objective of
maximizing economic benefits and
ensuring equitable marine wealth
distribution.
Develop management measures to
inform and enhance MSP thereby
strengthening marine biodiversity and
resource management in line with
the country’s commitments under the
Convention on Biological Diversity (CBD).
Create an enabling environment in
terms of policies and legislation as a
key implementation mechanism of
the ocean policy which contributes to
the enhancement of Namibia’s blue
economy
identify the ecologically
orBiologicallySignificant
marine areas (ebsas).
Desired outcomes by 2020, Namibia will have
implemented a blue economy
governance and management system
that sustainably maximizes economic
benefitsfrommarineresourcesand
ensures equitable marine wealth
distribution to all Namibians
how We’re getting there
Ensure equitable marine wealth distribution
Develop the blue economy policy and regulatory framework
Maximizes economic benefits from marine resources
institutionalize marine
spatial planning
eCoNomiC progressioN
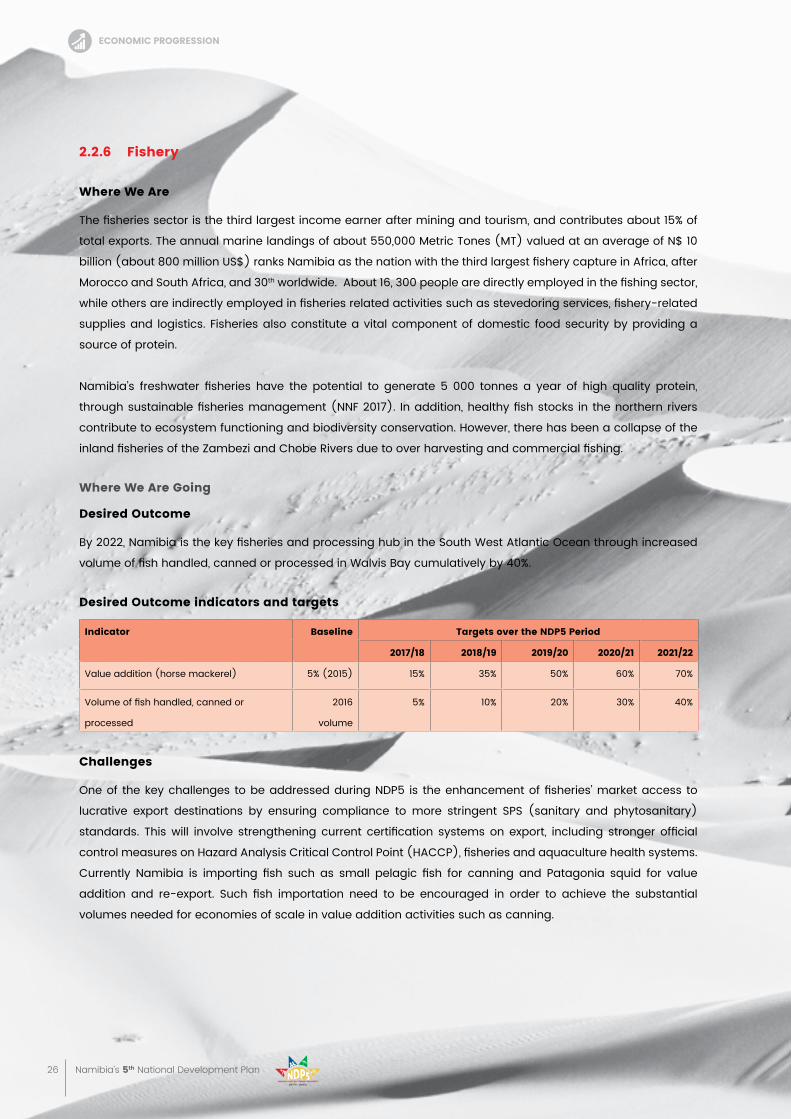
26 Namibia’s 5th National Development Plan
2.2.6 Fishery
Where We are
The fisheries sector is the third largest income earner after mining and tourism, and contributes about 15% of
total exports. The annual marine landings of about 550,000 Metric Tones (MT) valued at an average of N$ 10
billion (about 800 million US$) ranks Namibia as the nation with the third largest fishery capture in Africa, after
Morocco and South Africa, and 30th worldwide. About 16, 300 people are directly employed in the fishing sector,
while others are indirectly employed in fisheries related activities such as stevedoring services, fishery-related
supplies and logistics. Fisheries also constitute a vital component of domestic food security by providing a
source of protein.
Namibia’s freshwater fisheries have the potential to generate 5 000 tonnes a year of high quality protein,
through sustainable fisheries management (NNF 2017). In addition, healthy fish stocks in the northern rivers
contribute to ecosystem functioning and biodiversity conservation. However, there has been a collapse of the
inland fisheries of the Zambezi and Chobe Rivers due to over harvesting and commercial fishing.
Where We are going
Desired outcome
By 2022, Namibia is the key fisheries and processing hub in the South West Atlantic Ocean through increased
volume of fish handled, canned or processed in Walvis Bay cumulatively by 40%.
Desired outcome indicators and targets
indicator baseline targets over the NDp5 period
2017/18 2018/19 2019/20 2020/21 2021/22
Value addition (horse mackerel) 5% (2015) 15% 35% 50% 60% 70%
Volume of fish handled, canned or
processed
2016
volume
5% 10% 20% 30% 40%
Challenges
One of the key challenges to be addressed during NDP5 is the enhancement of fisheries’ market access to
lucrative export destinations by ensuring compliance to more stringent SPS (sanitary and phytosanitary)
standards. This will involve strengthening current certification systems on export, including stronger official
control measures on Hazard Analysis Critical Control Point (HACCP), fisheries and aquaculture health systems.
Currently Namibia is importing fish such as small pelagic fish for canning and Patagonia squid for value
addition and re-export. Such fish importation need to be encouraged in order to achieve the substantial
volumes needed for economies of scale in value addition activities such as canning.
eCoNomiC progressioN
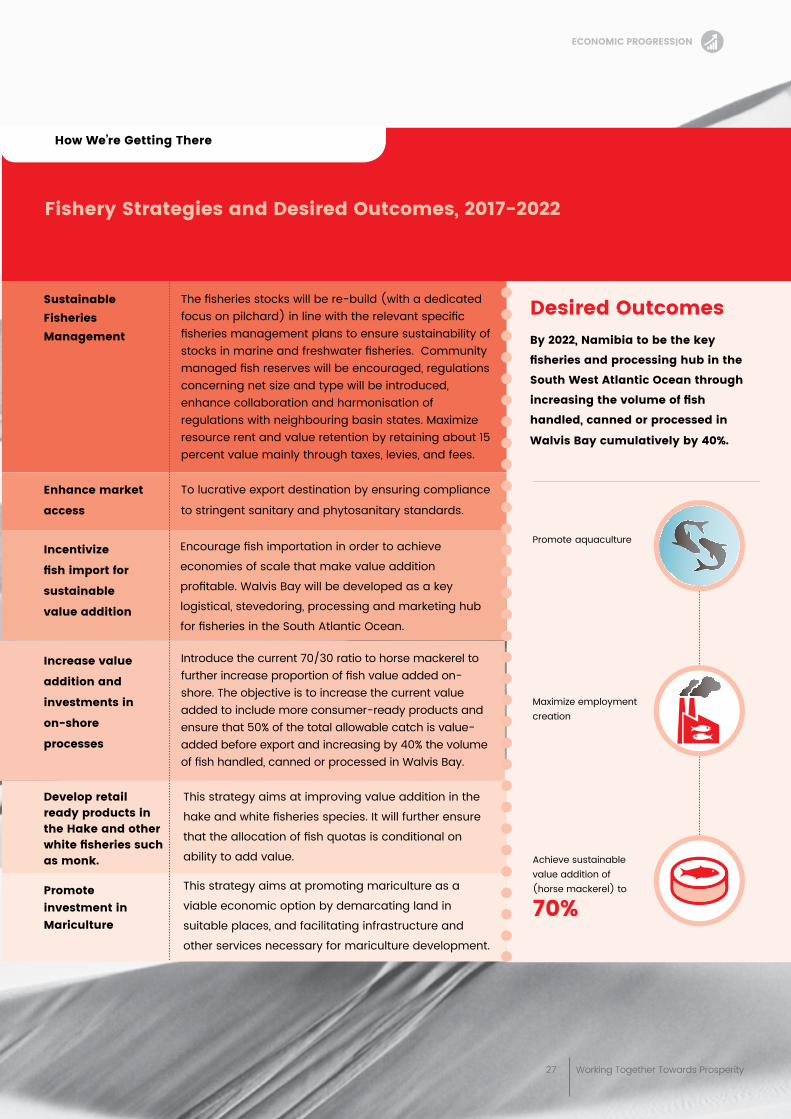
27 Working Together Towards Prosperity
Fishery strategies and Desired outcomes, 2017-2022
sustainable Fisheries management
enhance market
access
The fisheries stocks will be re-build (with a dedicated focus on pilchard) in line with the relevant specific fisheries management plans to ensure sustainability of stocks in marine and freshwater fisheries. Community managed fish reserves will be encouraged, regulations concerning net size and type will be introduced, enhance collaboration and harmonisation of regulations with neighbouring basin states. Maximize resource rent and value retention by retaining about 15 percent value mainly through taxes, levies, and fees.
To lucrative export destination by ensuring compliance
to stringent sanitary and phytosanitary standards.
Encourage fish importation in order to achieve
economies of scale that make value addition
profitable. Walvis Bay will be developed as a key
logistical, stevedoring, processing and marketing hub
for fisheries in the South Atlantic Ocean.
Introduce the current 70/30 ratio to horse mackerel to further increase proportion of fish value added on-shore. The objective is to increase the current value added to include more consumer-ready products and ensure that 50% of the total allowable catch is value-added before export and increasing by 40% the volume of fish handled, canned or processed in Walvis Bay.
This strategy aims at improving value addition in the
hake and white fisheries species. It will further ensure
that the allocation of fish quotas is conditional on
ability to add value.
This strategy aims at promoting mariculture as a
viable economic option by demarcating land in
suitable places, and facilitating infrastructure and
other services necessary for mariculture development.
incentivize
fishimportfor
sustainable
value addition
increase value
addition and
investments in
on-shore
processes
Develop retail ready products in the hake and other whitefisheriessuchas monk.
promote investment in mariculture
Desired outcomes by 2022, Namibia to be the key
fisheriesandprocessinghubinthe
south West atlantic ocean through
increasingthevolumeoffish
handled, canned or processed in
Walvis bay cumulatively by 40%.
how We’re getting there
Achieve sustainable value addition of (horse mackerel) to
70%
Promote aquaculture
Maximize employment creation
eCoNomiC progressioN
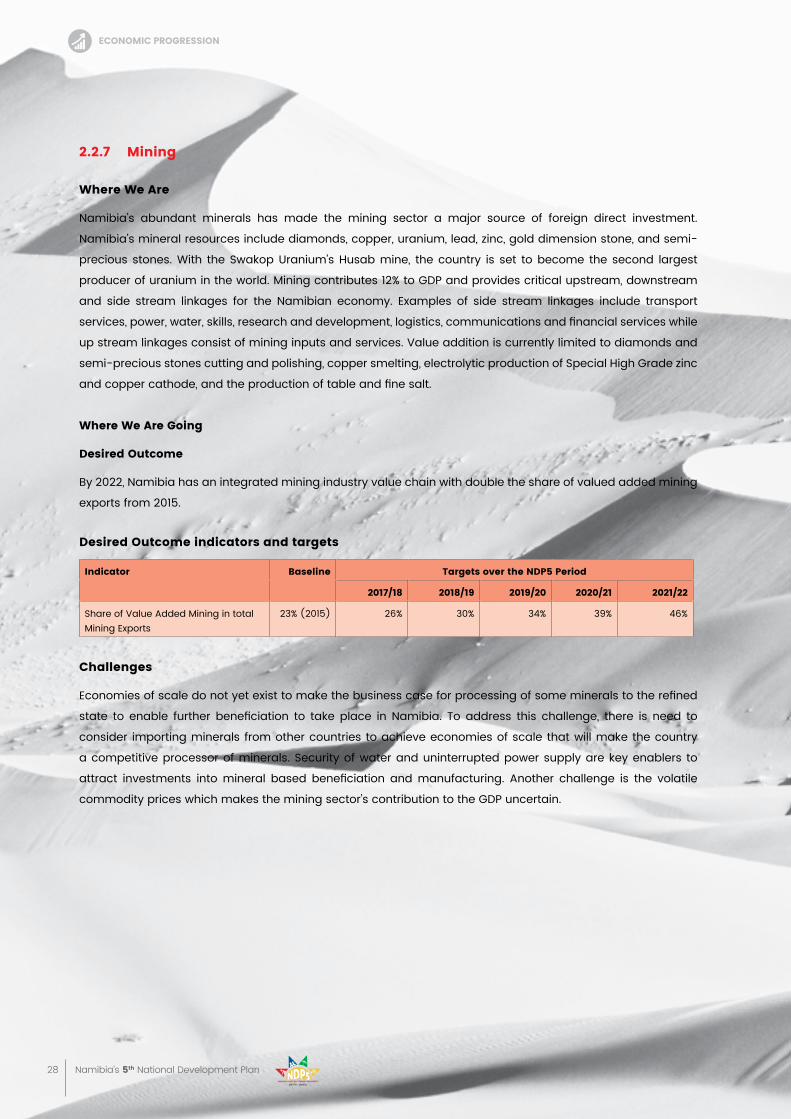
28 Namibia’s 5th National Development Plan
2.2.7 mining
Where We are
Namibia’s abundant minerals has made the mining sector a major source of foreign direct investment.
Namibia’s mineral resources include diamonds, copper, uranium, lead, zinc, gold dimension stone, and semi-
precious stones. With the Swakop Uranium’s Husab mine, the country is set to become the second largest
producer of uranium in the world. Mining contributes 12% to GDP and provides critical upstream, downstream
and side stream linkages for the Namibian economy. Examples of side stream linkages include transport
services, power, water, skills, research and development, logistics, communications and financial services while
up stream linkages consist of mining inputs and services. Value addition is currently limited to diamonds and
semi-precious stones cutting and polishing, copper smelting, electrolytic production of Special High Grade zinc
and copper cathode, and the production of table and fine salt.
Where We are going
Desired outcome
By 2022, Namibia has an integrated mining industry value chain with double the share of valued added mining
exports from 2015.
Desired outcome indicators and targets
indicator baseline targets over the NDp5 period
2017/18 2018/19 2019/20 2020/21 2021/22
Share of Value Added Mining in total Mining Exports
23% (2015) 26% 30% 34% 39% 46%
Challenges
Economies of scale do not yet exist to make the business case for processing of some minerals to the refined
state to enable further beneficiation to take place in Namibia. To address this challenge, there is need to
consider importing minerals from other countries to achieve economies of scale that will make the country
a competitive processor of minerals. Security of water and uninterrupted power supply are key enablers to
attract investments into mineral based beneficiation and manufacturing. Another challenge is the volatile
commodity prices which makes the mining sector’s contribution to the GDP uncertain.
eCoNomiC progressioN
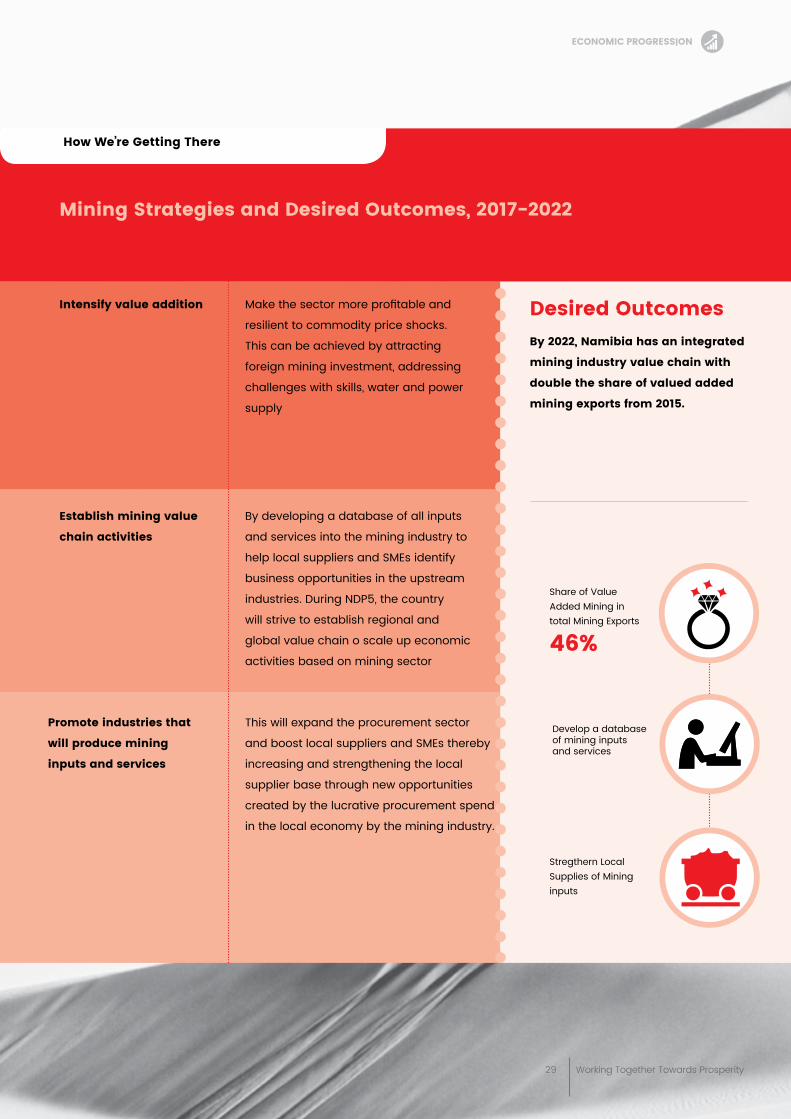
29 Working Together Towards Prosperity
mining strategies and Desired outcomes, 2017-2022
intensify value addition Make the sector more profitable and
resilient to commodity price shocks.
This can be achieved by attracting
foreign mining investment, addressing
challenges with skills, water and power
supply
By developing a database of all inputs
and services into the mining industry to
help local suppliers and SMEs identify
business opportunities in the upstream
industries. During NDP5, the country
will strive to establish regional and
global value chain o scale up economic
activities based on mining sector
This will expand the procurement sector
and boost local suppliers and SMEs thereby
increasing and strengthening the local
supplier base through new opportunities
created by the lucrative procurement spend
in the local economy by the mining industry.
establish mining value
chain activities
promote industries that
will produce mining
inputs and services
Desired outcomes by 2022, Namibia has an integrated
mining industry value chain with
double the share of valued added
mining exports from 2015.
how We’re getting there
Develop a database of mining inputs and services
Share of Value Added Mining in total Mining Exports
46%
Stregthern Local Supplies of Mining inputs
eCoNomiC progressioN
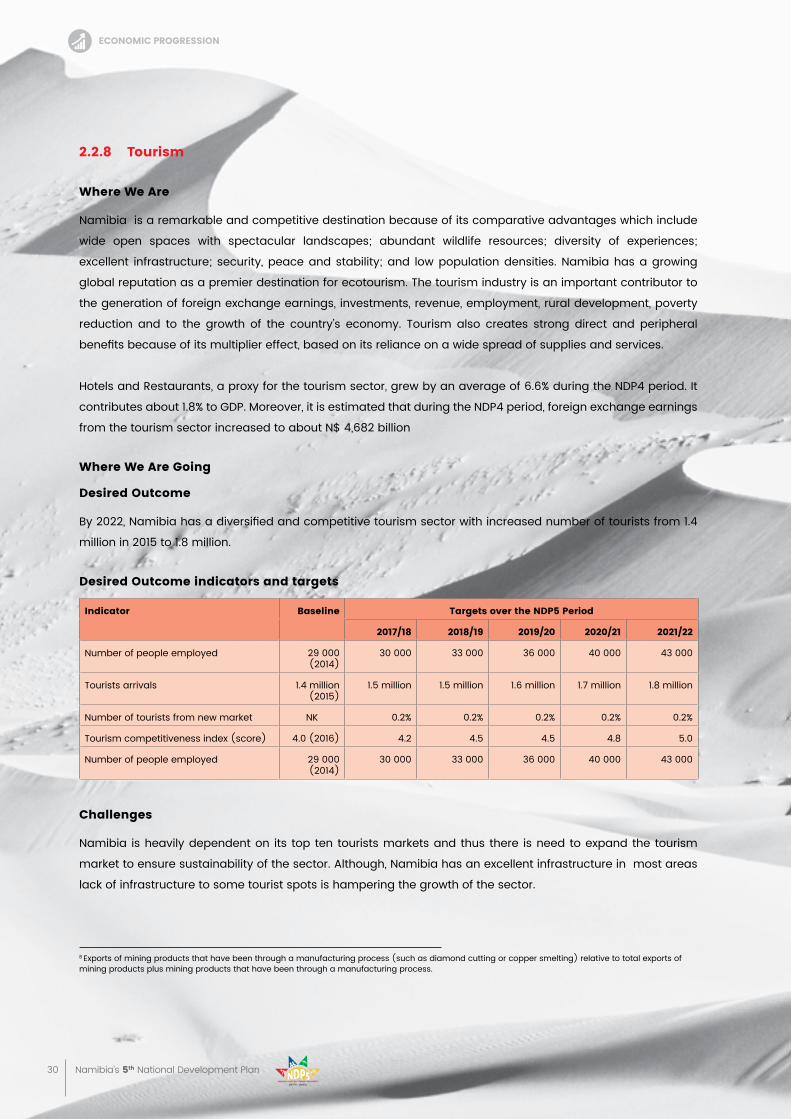
30 Namibia’s 5th National Development Plan
2.2.8 tourism
Where We are
Namibia is a remarkable and competitive destination because of its comparative advantages which include
wide open spaces with spectacular landscapes; abundant wildlife resources; diversity of experiences;
excellent infrastructure; security, peace and stability; and low population densities. Namibia has a growing
global reputation as a premier destination for ecotourism. The tourism industry is an important contributor to
the generation of foreign exchange earnings, investments, revenue, employment, rural development, poverty
reduction and to the growth of the country’s economy. Tourism also creates strong direct and peripheral
benefits because of its multiplier effect, based on its reliance on a wide spread of supplies and services.
Hotels and Restaurants, a proxy for the tourism sector, grew by an average of 6.6% during the NDP4 period. It
contributes about 1.8% to GDP. Moreover, it is estimated that during the NDP4 period, foreign exchange earnings
from the tourism sector increased to about N$ 4,682 billion
Where We are going
Desired outcome
By 2022, Namibia has a diversified and competitive tourism sector with increased number of tourists from 1.4
million in 2015 to 1.8 million.
Desired outcome indicators and targets
indicator baseline targets over the NDp5 period
2017/18 2018/19 2019/20 2020/21 2021/22
Number of people employed 29 000 (2014)
30 000 33 000 36 000 40 000 43 000
Tourists arrivals 1.4 million (2015)
1.5 million 1.5 million 1.6 million 1.7 million 1.8 million
Number of tourists from new market NK 0.2% 0.2% 0.2% 0.2% 0.2%
Tourism competitiveness index (score) 4.0 (2016) 4.2 4.5 4.5 4.8 5.0
Number of people employed 29 000 (2014)
30 000 33 000 36 000 40 000 43 000
Challenges
Namibia is heavily dependent on its top ten tourists markets and thus there is need to expand the tourism
market to ensure sustainability of the sector. Although, Namibia has an excellent infrastructure in most areas
lack of infrastructure to some tourist spots is hampering the growth of the sector.
8 Exports of mining products that have been through a manufacturing process (such as diamond cutting or copper smelting) relative to total exports of mining products plus mining products that have been through a manufacturing process.
eCoNomiC progressioN
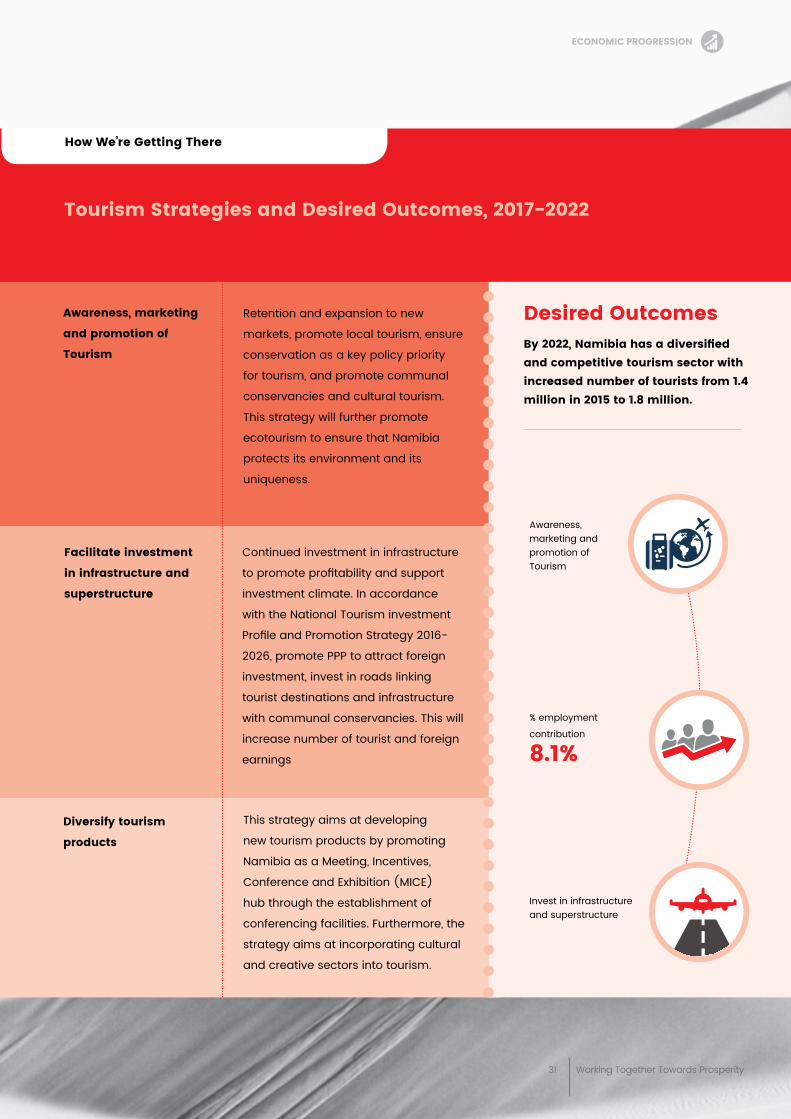
31 Working Together Towards Prosperity
tourism strategies and Desired outcomes, 2017-2022
Retention and expansion to new
markets, promote local tourism, ensure
conservation as a key policy priority
for tourism, and promote communal
conservancies and cultural tourism.
This strategy will further promote
ecotourism to ensure that Namibia
protects its environment and its
uniqueness.
Continued investment in infrastructure
to promote profitability and support
investment climate. In accordance
with the National Tourism investment
Profile and Promotion Strategy 2016-
2026, promote PPP to attract foreign
investment, invest in roads linking
tourist destinations and infrastructure
with communal conservancies. This will
increase number of tourist and foreign
earnings
This strategy aims at developing
new tourism products by promoting
Namibia as a Meeting, Incentives,
Conference and Exhibition (MICE)
hub through the establishment of
conferencing facilities. Furthermore, the
strategy aims at incorporating cultural
and creative sectors into tourism.
awareness, marketing
and promotion of
tourism
Facilitate investment
in infrastructure and
superstructure
Diversify tourism
products
Desired outcomes By2022,Namibiahasadiversifiedand competitive tourism sector with increased number of tourists from 1.4 million in 2015 to 1.8 million.
how We’re getting there
% employment
contribution
8.1%
Awareness, marketing and promotion of Tourism
Invest in infrastructure and superstructure
eCoNomiC progressioN
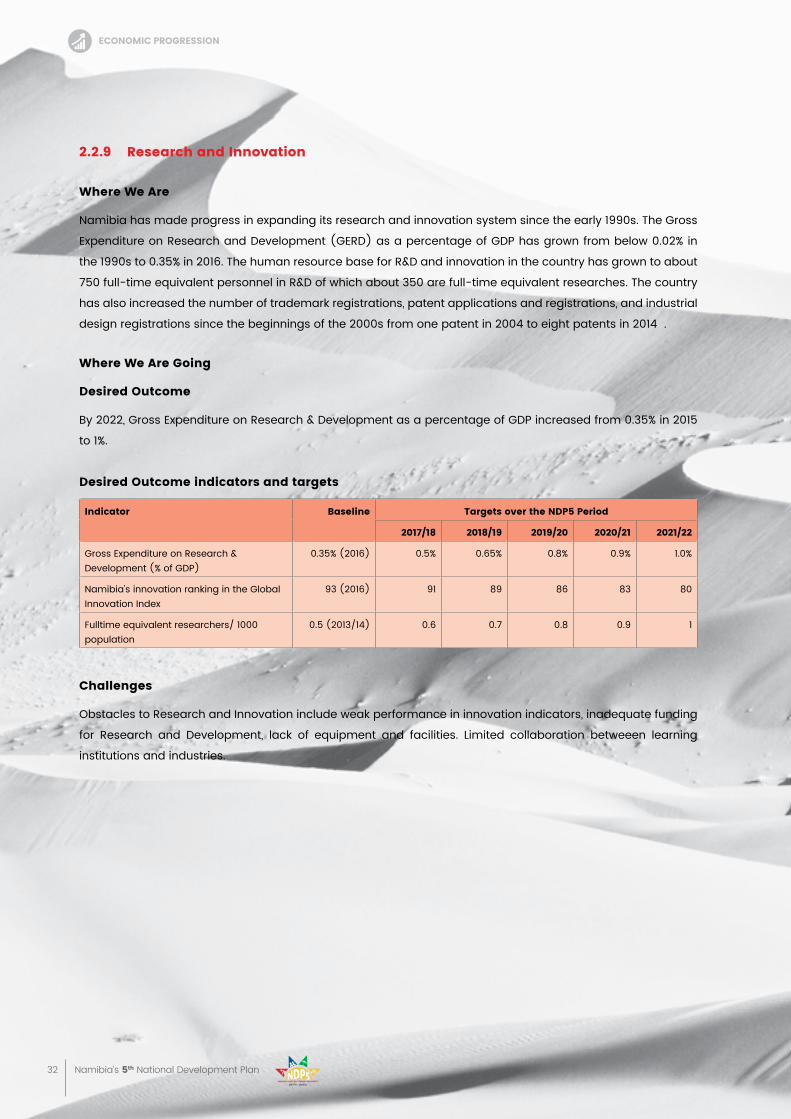
32 Namibia’s 5th National Development Plan
2.2.9 research and innovation
Where We are
Namibia has made progress in expanding its research and innovation system since the early 1990s. The Gross
Expenditure on Research and Development (GERD) as a percentage of GDP has grown from below 0.02% in
the 1990s to 0.35% in 2016. The human resource base for R&D and innovation in the country has grown to about
750 full-time equivalent personnel in R&D of which about 350 are full-time equivalent researches. The country
has also increased the number of trademark registrations, patent applications and registrations, and industrial
design registrations since the beginnings of the 2000s from one patent in 2004 to eight patents in 2014 .
Where We are going
Desired outcome
By 2022, Gross Expenditure on Research & Development as a percentage of GDP increased from 0.35% in 2015
to 1%.
Desired outcome indicators and targets
indicator baseline targets over the NDp5 period
2017/18 2018/19 2019/20 2020/21 2021/22
Gross Expenditure on Research & Development (% of GDP)
0.35% (2016) 0.5% 0.65% 0.8% 0.9% 1.0%
Namibia’s innovation ranking in the Global Innovation Index
93 (2016) 91 89 86 83 80
Fulltime equivalent researchers/ 1000 population
0.5 (2013/14) 0.6 0.7 0.8 0.9 1
Challenges
Obstacles to Research and Innovation include weak performance in innovation indicators, inadequate funding
for Research and Development, lack of equipment and facilities. Limited collaboration betweeen learning
institutions and industries.
eCoNomiC progressioN
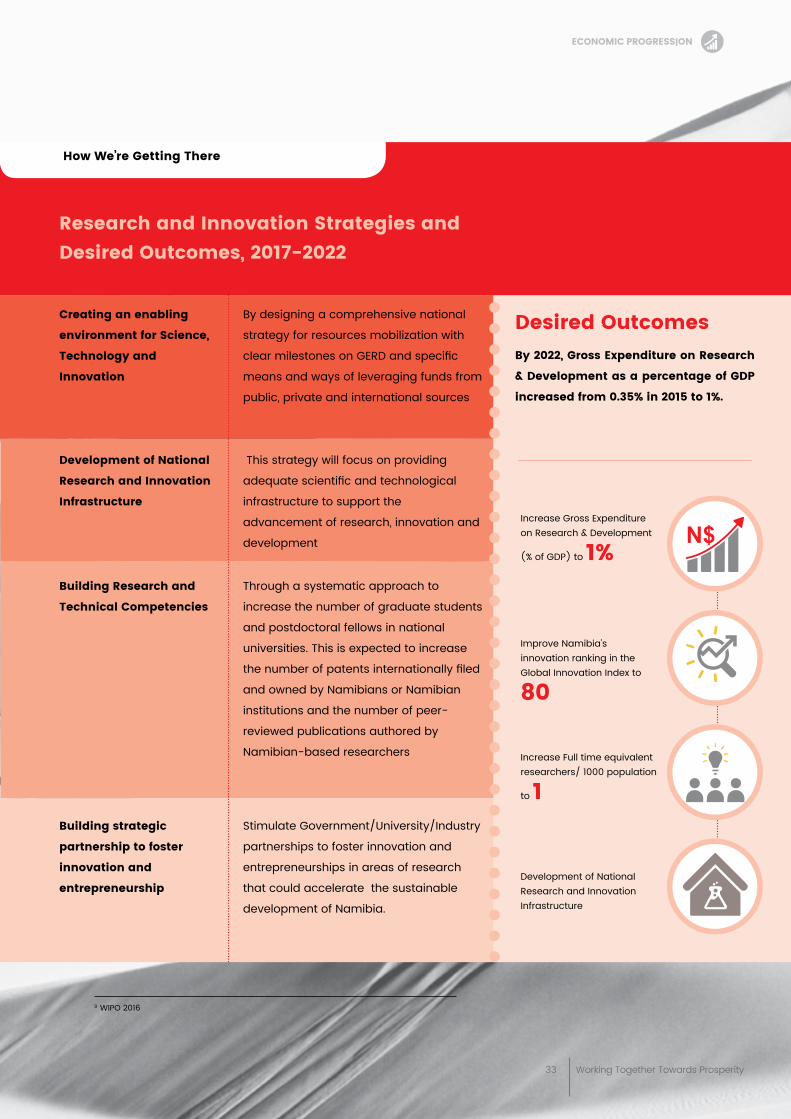
33 Working Together Towards Prosperity
research and innovation strategies and Desired outcomes, 2017-2022
Creating an enabling
environment for science,
technology and
innovation
Development of National
research and innovation
infrastructure
building research and
technical Competencies
building strategic
partnership to foster
innovation and
entrepreneurship
By designing a comprehensive national
strategy for resources mobilization with
clear milestones on GERD and specific
means and ways of leveraging funds from
public, private and international sources
This strategy will focus on providing
adequate scientific and technological
infrastructure to support the
advancement of research, innovation and
development
Through a systematic approach to
increase the number of graduate students
and postdoctoral fellows in national
universities. This is expected to increase
the number of patents internationally filed
and owned by Namibians or Namibian
institutions and the number of peer-
reviewed publications authored by
Namibian-based researchers
Stimulate Government/University/Industry
partnerships to foster innovation and
entrepreneurships in areas of research
that could accelerate the sustainable
development of Namibia.
Desired outcomes by 2022, gross expenditure on research
& Development as a percentage of gDp
increased from 0.35% in 2015 to 1%.
Increase Gross Expenditure on Research & Development
(% of GDP) to 1%
Improve Namibia’s innovation ranking in the Global Innovation Index to
80
Increase Full time equivalent researchers/ 1000 population
to 1
Development of National Research and Innovation Infrastructure
how We’re getting there
9 WIPO 2016
eCoNomiC progressioN
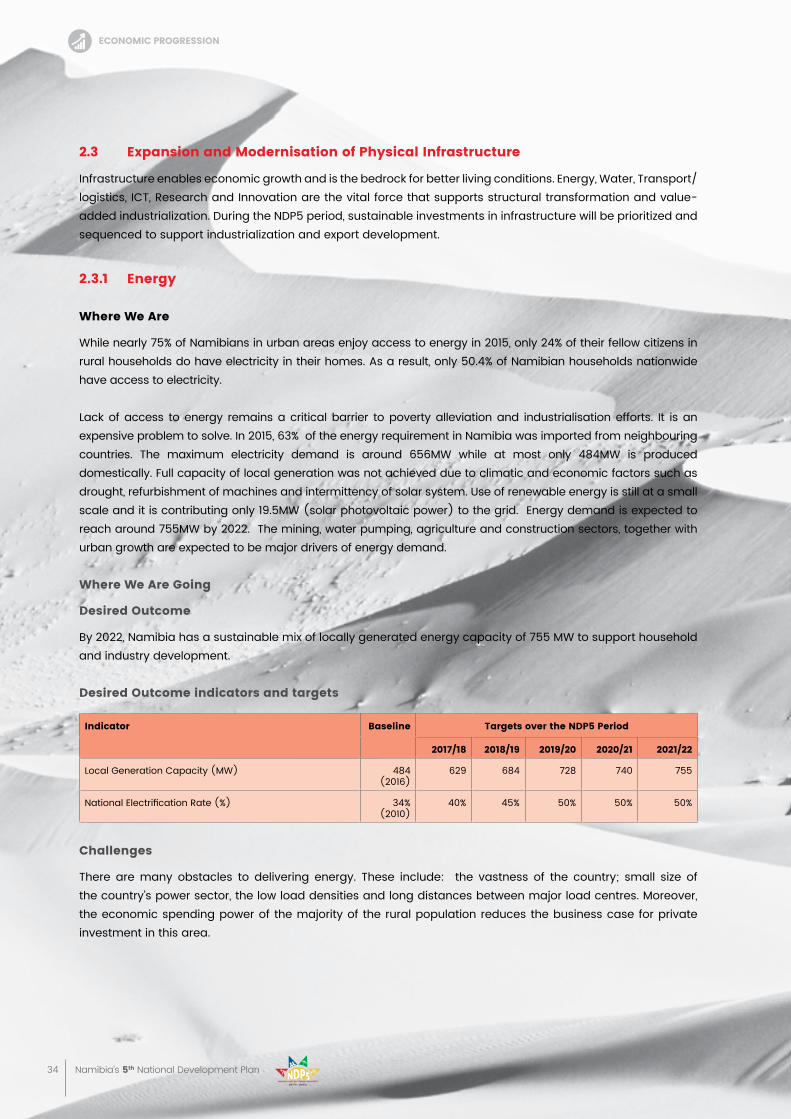
34 Namibia’s 5th National Development Plan
2.3 expansion and modernisation of physical infrastructure
Infrastructure enables economic growth and is the bedrock for better living conditions. Energy, Water, Transport/logistics, ICT, Research and Innovation are the vital force that supports structural transformation and value-added industrialization. During the NDP5 period, sustainable investments in infrastructure will be prioritized and sequenced to support industrialization and export development.
2.3.1 energy
Where We are
While nearly 75% of Namibians in urban areas enjoy access to energy in 2015, only 24% of their fellow citizens in rural households do have electricity in their homes. As a result, only 50.4% of Namibian households nationwide have access to electricity.
Lack of access to energy remains a critical barrier to poverty alleviation and industrialisation efforts. It is an expensive problem to solve. In 2015, 63% of the energy requirement in Namibia was imported from neighbouring countries. The maximum electricity demand is around 656MW while at most only 484MW is produced domestically. Full capacity of local generation was not achieved due to climatic and economic factors such as drought, refurbishment of machines and intermittency of solar system. Use of renewable energy is still at a small scale and it is contributing only 19.5MW (solar photovoltaic power) to the grid. Energy demand is expected to reach around 755MW by 2022. The mining, water pumping, agriculture and construction sectors, together with urban growth are expected to be major drivers of energy demand.
Where We are going
Desired outcome
By 2022, Namibia has a sustainable mix of locally generated energy capacity of 755 MW to support household and industry development.
Desired outcome indicators and targets
indicator baseline targets over the NDp5 period
2017/18 2018/19 2019/20 2020/21 2021/22
Local Generation Capacity (MW) 484 (2016)
629 684 728 740 755
National Electrification Rate (%) 34% (2010)
40% 45% 50% 50% 50%
Challenges
There are many obstacles to delivering energy. These include: the vastness of the country; small size of the country’s power sector, the low load densities and long distances between major load centres. Moreover, the economic spending power of the majority of the rural population reduces the business case for private investment in this area.
eCoNomiC progressioN
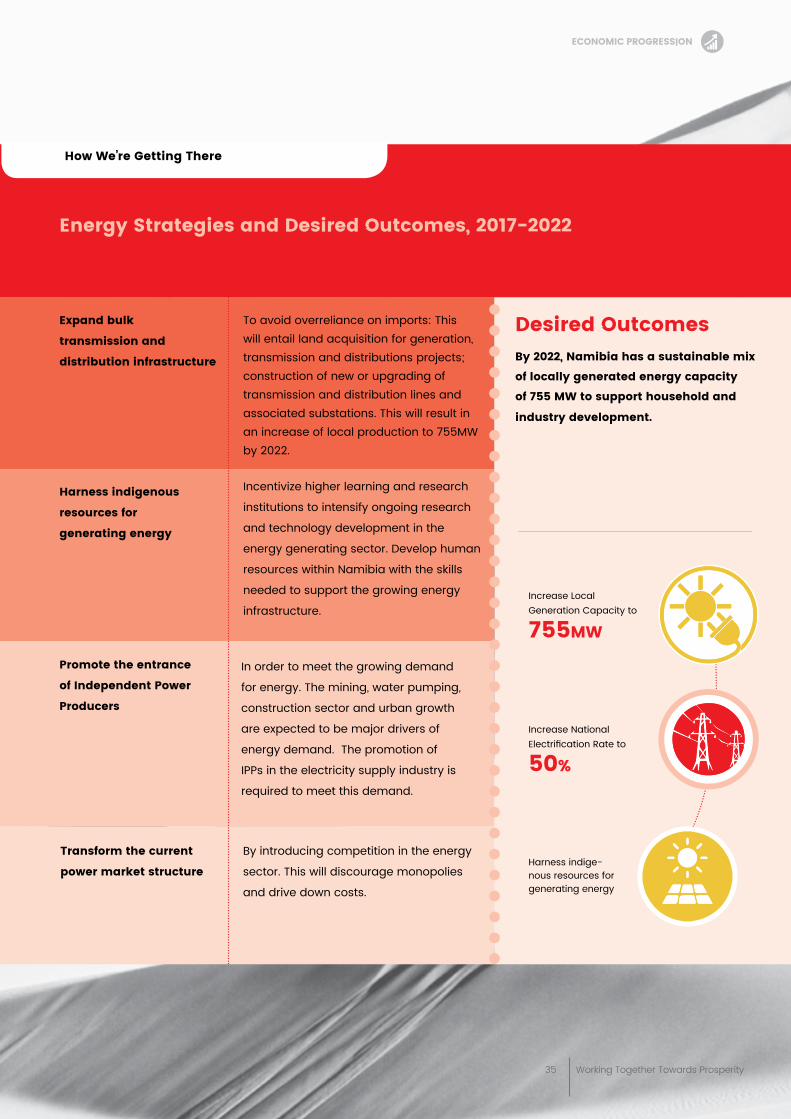
35 Working Together Towards Prosperity
By introducing competition in the energy
sector. This will discourage monopolies
and drive down costs.
transform the current
power market structure
energy strategies and Desired outcomes, 2017-2022
expand bulk
transmission and
distribution infrastructure
To avoid overreliance on imports: This will entail land acquisition for generation, transmission and distributions projects; construction of new or upgrading of transmission and distribution lines and associated substations. This will result in an increase of local production to 755MW by 2022.
Incentivize higher learning and research
institutions to intensify ongoing research
and technology development in the
energy generating sector. Develop human
resources within Namibia with the skills
needed to support the growing energy
infrastructure.
In order to meet the growing demand
for energy. The mining, water pumping,
construction sector and urban growth
are expected to be major drivers of
energy demand. The promotion of
IPPs in the electricity supply industry is
required to meet this demand.
harness indigenous
resources for
generating energy
promote the entrance
of independent power
producers
Desired outcomes by 2022, Namibia has a sustainable mix
of locally generated energy capacity
of 755 mW to support household and
industry development.
how We’re getting there
Increase National Electrification Rate to
50%
Harness indige-nous resources for generating energy
Increase Local Generation Capacity to 755mW
eCoNomiC progressioN
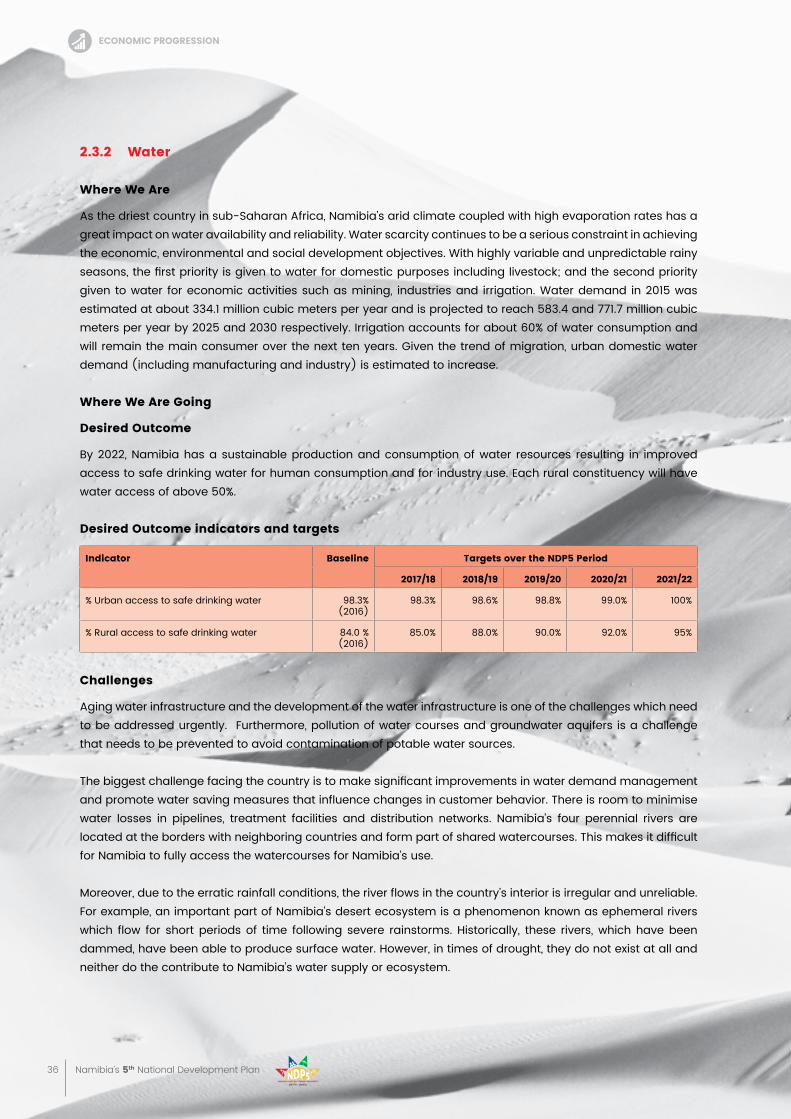
36 Namibia’s 5th National Development Plan
2.3.2 Water
Where We are
As the driest country in sub-Saharan Africa, Namibia’s arid climate coupled with high evaporation rates has a great impact on water availability and reliability. Water scarcity continues to be a serious constraint in achieving the economic, environmental and social development objectives. With highly variable and unpredictable rainy seasons, the first priority is given to water for domestic purposes including livestock; and the second priority given to water for economic activities such as mining, industries and irrigation. Water demand in 2015 was estimated at about 334.1 million cubic meters per year and is projected to reach 583.4 and 771.7 million cubic meters per year by 2025 and 2030 respectively. Irrigation accounts for about 60% of water consumption and will remain the main consumer over the next ten years. Given the trend of migration, urban domestic water demand (including manufacturing and industry) is estimated to increase.
Where We are going
Desired outcome
By 2022, Namibia has a sustainable production and consumption of water resources resulting in improved access to safe drinking water for human consumption and for industry use. Each rural constituency will have water access of above 50%.
Desired outcome indicators and targets
indicator baseline targets over the NDp5 period
2017/18 2018/19 2019/20 2020/21 2021/22
% Urban access to safe drinking water 98.3% (2016)
98.3% 98.6% 98.8% 99.0% 100%
% Rural access to safe drinking water 84.0 % (2016)
85.0% 88.0% 90.0% 92.0% 95%
Challenges
Aging water infrastructure and the development of the water infrastructure is one of the challenges which need to be addressed urgently. Furthermore, pollution of water courses and groundwater aquifers is a challenge that needs to be prevented to avoid contamination of potable water sources.
The biggest challenge facing the country is to make significant improvements in water demand management and promote water saving measures that influence changes in customer behavior. There is room to minimise water losses in pipelines, treatment facilities and distribution networks. Namibia’s four perennial rivers are located at the borders with neighboring countries and form part of shared watercourses. This makes it difficult for Namibia to fully access the watercourses for Namibia’s use.
Moreover, due to the erratic rainfall conditions, the river flows in the country’s interior is irregular and unreliable. For example, an important part of Namibia’s desert ecosystem is a phenomenon known as ephemeral rivers which flow for short periods of time following severe rainstorms. Historically, these rivers, which have been dammed, have been able to produce surface water. However, in times of drought, they do not exist at all and neither do the contribute to Namibia’s water supply or ecosystem.
eCoNomiC progressioN
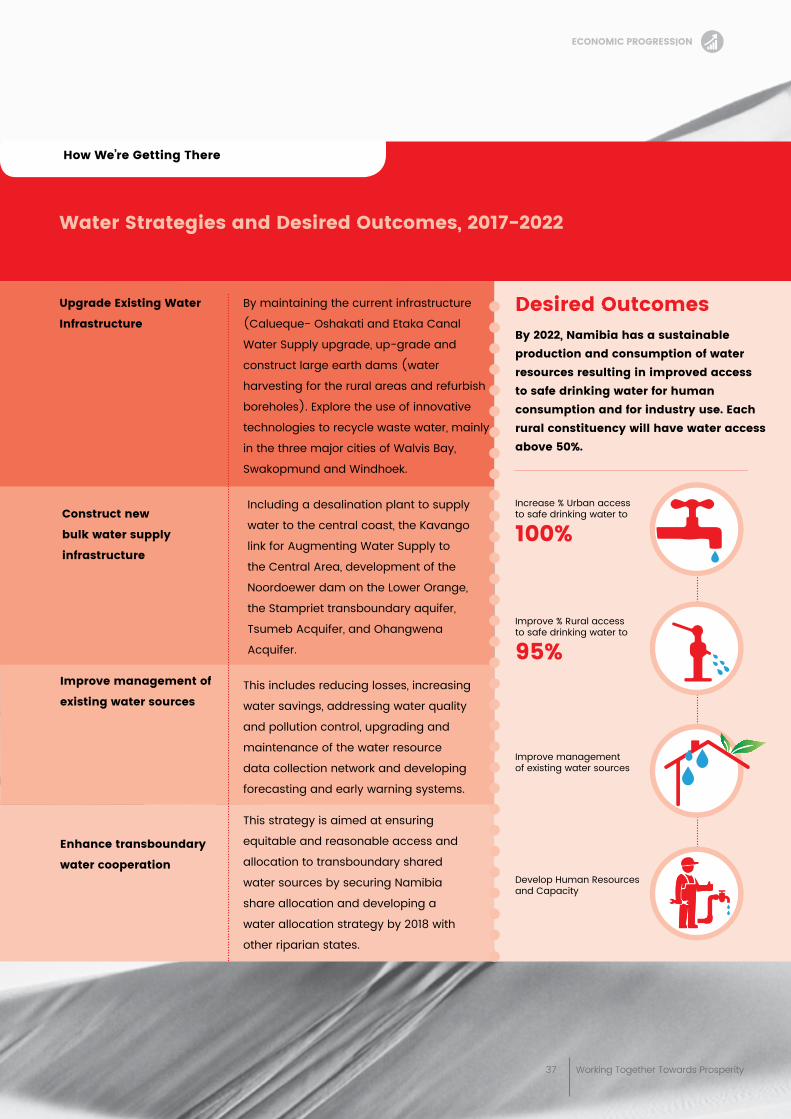
37 Working Together Towards Prosperity
Water strategies and Desired outcomes, 2017-2022
upgrade existing Water
infrastructure
By maintaining the current infrastructure
(Calueque- Oshakati and Etaka Canal
Water Supply upgrade, up-grade and
construct large earth dams (water
harvesting for the rural areas and refurbish
boreholes). Explore the use of innovative
technologies to recycle waste water, mainly
in the three major cities of Walvis Bay,
Swakopmund and Windhoek.
Including a desalination plant to supply
water to the central coast, the Kavango
link for Augmenting Water Supply to
the Central Area, development of the
Noordoewer dam on the Lower Orange,
the Stampriet transboundary aquifer,
Tsumeb Acquifer, and Ohangwena
Acquifer.
This includes reducing losses, increasing
water savings, addressing water quality
and pollution control, upgrading and
maintenance of the water resource
data collection network and developing
forecasting and early warning systems.
This strategy is aimed at ensuring
equitable and reasonable access and
allocation to transboundary shared
water sources by securing Namibia
share allocation and developing a
water allocation strategy by 2018 with
other riparian states.
Construct new
bulk water supply
infrastructure
improve management of
existing water sources
enhance transboundary
water cooperation
Desired outcomes by 2022, Namibia has a sustainable production and consumption of water resources resulting in improved access to safe drinking water for human consumption and for industry use. each rural constituency will have water access above 50%.
how We’re getting there
Increase % Urban access to safe drinking water to
100%
Improve % Rural access to safe drinking water to
95%
Improve management of existing water sources
Develop Human Resources and Capacity
eCoNomiC progressioN
38 Namibia’s 5th National Development Plan
2.3.3 transport and logistics
Where We are
Transport and Logistics are essential for trade, industrialization, socio-economic development and regional integration and thus remains a key developmental priority. Over the past 20 years, the government has invest-ed in transport infrastructure development (roads, rail, maritime and ports, and aviation) in order to meet the national demand and position Namibia as a logistics hub within the Southern Africa Development Community (SADC).
Currently, the sector employs about 25,700 persons which is about 3.6% of the total work force, while contribut-ing 4.7% to the GDP. Sluggish economic growth and weakened demand, coupled with a decline in commodity and oil prices and an unfavorable exchange rate, has resulted in a decline in volumes handled by the ports in the past few years. Namibia has been consistently improving its position on this indicator of the Global Com-petitiveness Index, moving to 24 out of 138 countries in 2016/2017. Given the potential of this sector to enhance industrial development and contribute substantially to the GDP, NDP5 takes a holistic and integrated approach to transport planning, including multimodal and intermodal approach to handling goods, transporting people and providing services in accordance with the Transport Master Plan and Master Plan of an International Lo-gistics Hub for SADC Countries. A functional and efficient transport and logistics sector is the backbone for the realisation of the NDP5 targets in agriculture, mining, manufacturing, fisheries, rural and urban development and tourism. It is also a critical factor in promoting environmental sustainability.
Where We are going
Desired outcome
By 2022, Namibia has a sustainable transport system supporting a world-class logistics hub connecting SADC to international markets.
eCoNomiC progressioN
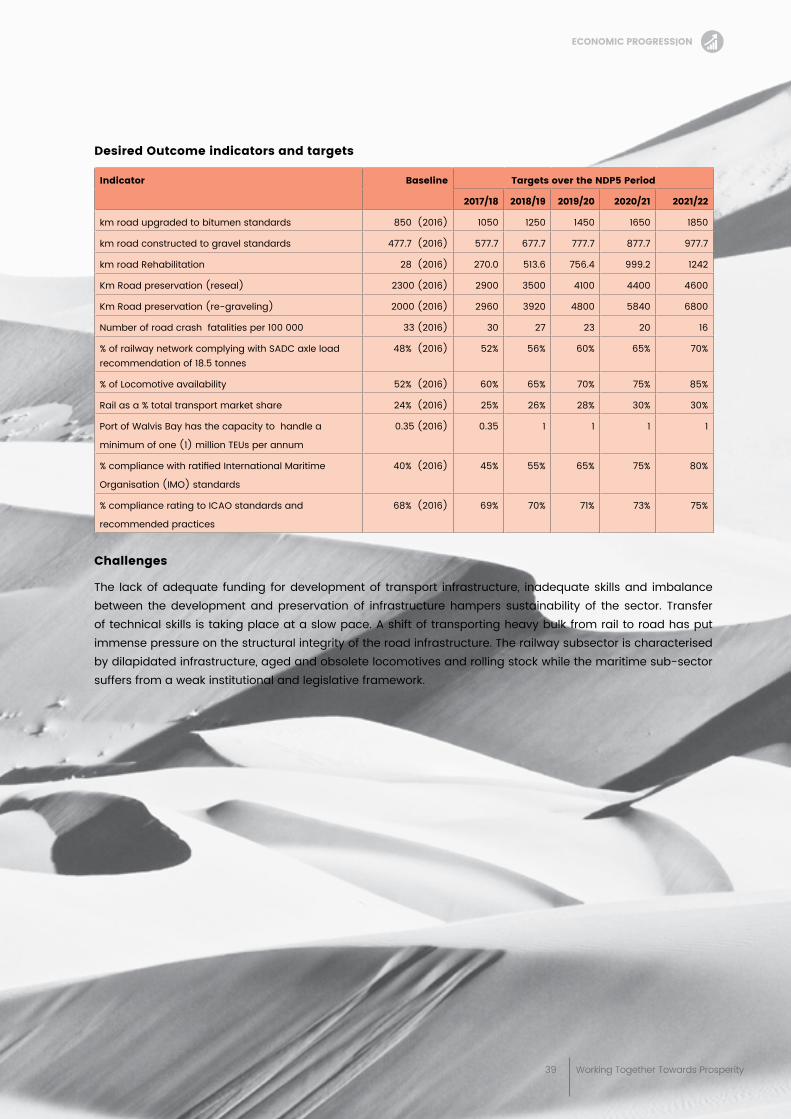
39 Working Together Towards Prosperity
Desired outcome indicators and targets
indicator baseline targets over the NDp5 period
2017/18 2018/19 2019/20 2020/21 2021/22
km road upgraded to bitumen standards 850 (2016) 1050 1250 1450 1650 1850
km road constructed to gravel standards 477.7 (2016) 577.7 677.7 777.7 877.7 977.7
km road Rehabilitation 28 (2016) 270.0 513.6 756.4 999.2 1242
Km Road preservation (reseal) 2300 (2016) 2900 3500 4100 4400 4600
Km Road preservation (re-graveling) 2000 (2016) 2960 3920 4800 5840 6800
Number of road crash fatalities per 100 000 33 (2016) 30 27 23 20 16
% of railway network complying with SADC axle load recommendation of 18.5 tonnes
48% (2016) 52% 56% 60% 65% 70%
% of Locomotive availability 52% (2016) 60% 65% 70% 75% 85%
Rail as a % total transport market share 24% (2016) 25% 26% 28% 30% 30%
Port of Walvis Bay has the capacity to handle a
minimum of one (1) million TEUs per annum
0.35 (2016) 0.35 1 1 1 1
% compliance with ratified International Maritime
Organisation (IMO) standards
40% (2016) 45% 55% 65% 75% 80%
% compliance rating to ICAO standards and
recommended practices
68% (2016) 69% 70% 71% 73% 75%
Challenges
The lack of adequate funding for development of transport infrastructure, inadequate skills and imbalance between the development and preservation of infrastructure hampers sustainability of the sector. Transfer of technical skills is taking place at a slow pace. A shift of transporting heavy bulk from rail to road has put immense pressure on the structural integrity of the road infrastructure. The railway subsector is characterised by dilapidated infrastructure, aged and obsolete locomotives and rolling stock while the maritime sub-sector suffers from a weak institutional and legislative framework.
eCoNomiC progressioN
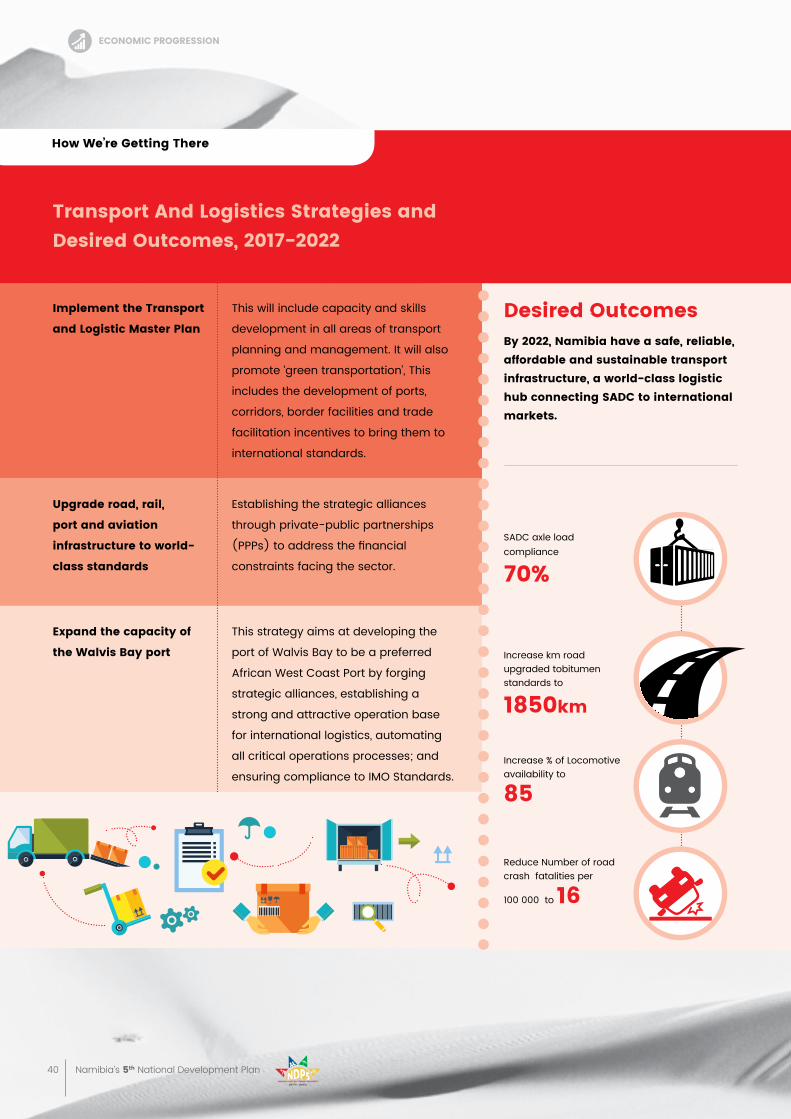
40 Namibia’s 5th National Development Plan
transport and logistics strategies and Desired outcomes, 2017-2022
implement the transport
and logistic master plan
upgrade road, rail,
port and aviation
infrastructure to world-
class standards
expand the capacity of
the Walvis bay port
This will include capacity and skills
development in all areas of transport
planning and management. It will also
promote ‘green transportation’, This
includes the development of ports,
corridors, border facilities and trade
facilitation incentives to bring them to
international standards.
Establishing the strategic alliances
through private-public partnerships
(PPPs) to address the financial
constraints facing the sector.
This strategy aims at developing the
port of Walvis Bay to be a preferred
African West Coast Port by forging
strategic alliances, establishing a
strong and attractive operation base
for international logistics, automating
all critical operations processes; and
ensuring compliance to IMO Standards.
Desired outcomes by 2022, Namibia have a safe, reliable, affordable and sustainable transport infrastructure, a world-class logistic hub connecting saDC to international markets.
how We’re getting there
Increase km road upgraded tobitumen standards to
1850km
SADC axle load compliance
70%
Reduce Number of road crash fatalities per
100 000 to 16
Increase % of Locomotive availability to
85
eCoNomiC progressioN
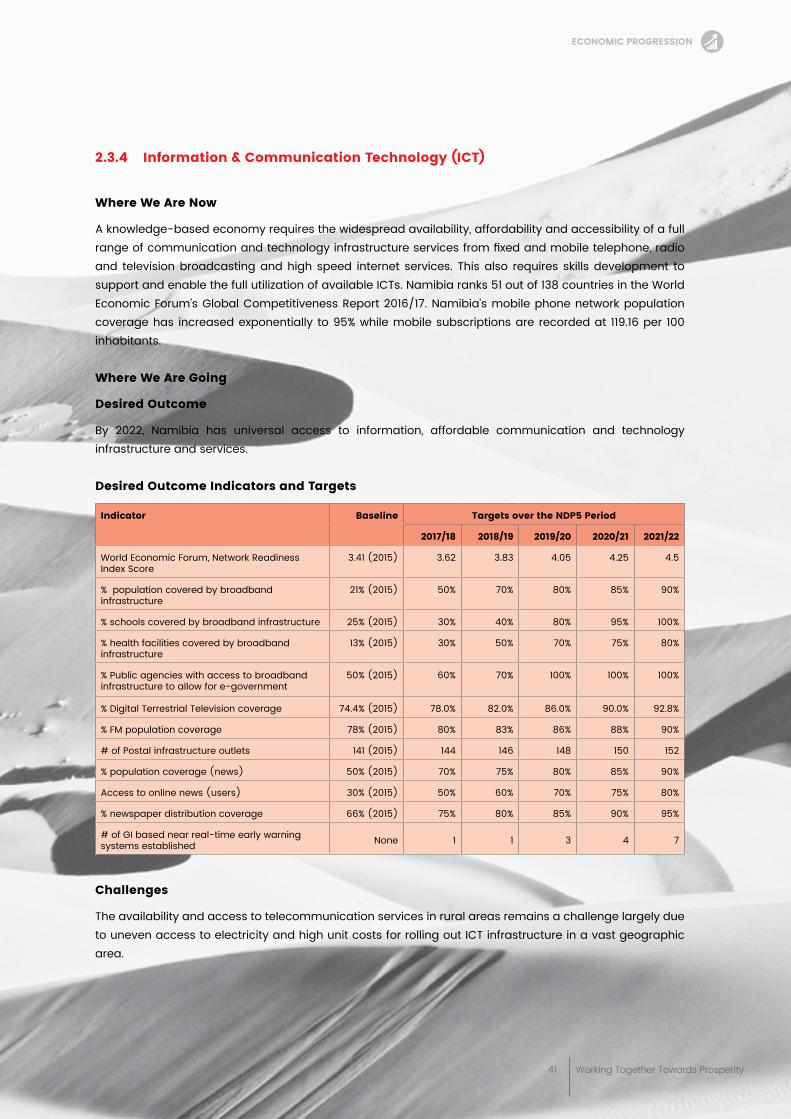
41 Working Together Towards Prosperity
transport and logistics strategies and Desired outcomes, 2017-2022
2.3.4 information & Communication technology (iCt)
Where We are Now
A knowledge-based economy requires the widespread availability, affordability and accessibility of a full range of communication and technology infrastructure services from fixed and mobile telephone, radio and television broadcasting and high speed internet services. This also requires skills development to support and enable the full utilization of available ICTs. Namibia ranks 51 out of 138 countries in the World Economic Forum’s Global Competitiveness Report 2016/17. Namibia’s mobile phone network population coverage has increased exponentially to 95% while mobile subscriptions are recorded at 119.16 per 100 inhabitants.
Where We are going
Desired outcome
By 2022, Namibia has universal access to information, affordable communication and technology infrastructure and services.
Desired outcome indicators and targets
indicator baseline targets over the NDp5 period
2017/18 2018/19 2019/20 2020/21 2021/22
World Economic Forum, Network Readiness Index Score
3.41 (2015) 3.62 3.83 4.05 4.25 4.5
% population covered by broadband infrastructure
21% (2015) 50% 70% 80% 85% 90%
% schools covered by broadband infrastructure 25% (2015) 30% 40% 80% 95% 100%
% health facilities covered by broadband infrastructure
13% (2015) 30% 50% 70% 75% 80%
% Public agencies with access to broadband infrastructure to allow for e-government
50% (2015) 60% 70% 100% 100% 100%
% Digital Terrestrial Television coverage 74.4% (2015) 78.0% 82.0% 86.0% 90.0% 92.8%
% FM population coverage 78% (2015) 80% 83% 86% 88% 90%
# of Postal infrastructure outlets 141 (2015) 144 146 148 150 152
% population coverage (news) 50% (2015) 70% 75% 80% 85% 90%
Access to online news (users) 30% (2015) 50% 60% 70% 75% 80%
% newspaper distribution coverage 66% (2015) 75% 80% 85% 90% 95%
# of GI based near real-time early warning systems established None 1 1 3 4 7
Challenges
The availability and access to telecommunication services in rural areas remains a challenge largely due to uneven access to electricity and high unit costs for rolling out ICT infrastructure in a vast geographic area.
eCoNomiC progressioN
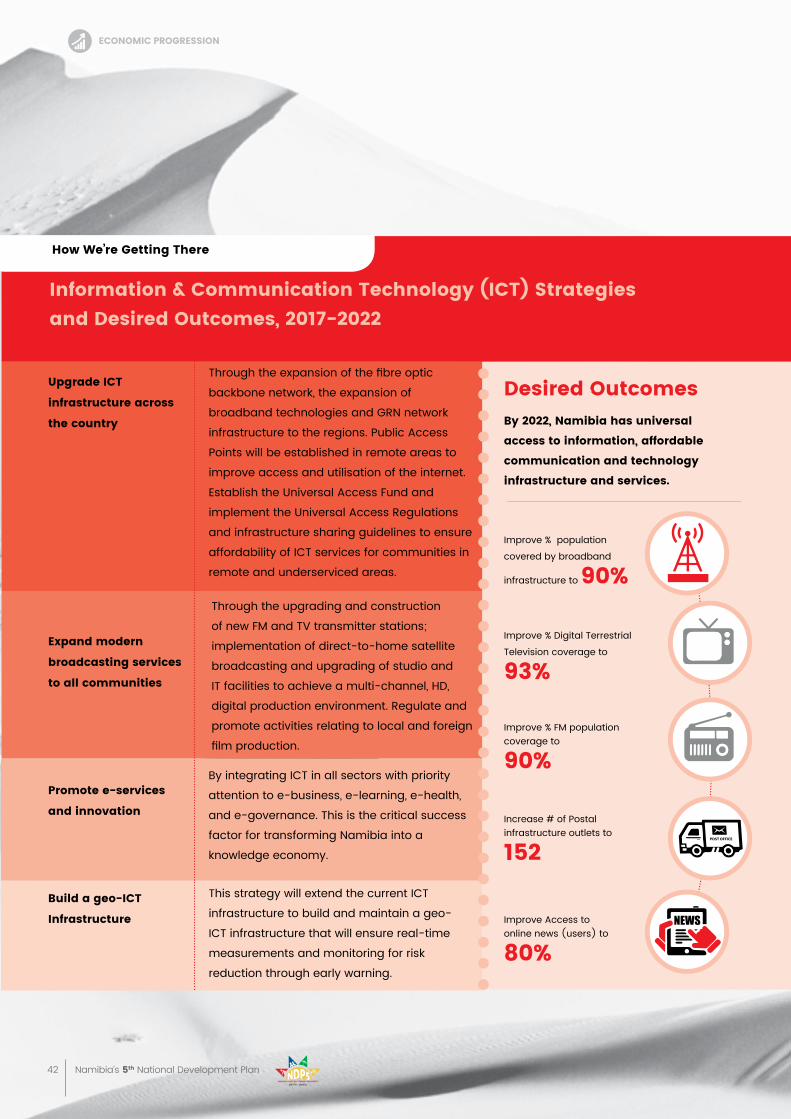
42 Namibia’s 5th National Development Plan
information & Communication technology (iCt) strategies and Desired outcomes, 2017-2022
upgrade iCt
infrastructure across
the country
expand modern
broadcasting services
to all communities
promote e-services
and innovation
build a geo-iCt
infrastructure
Through the expansion of the fibre optic
backbone network, the expansion of
broadband technologies and GRN network
infrastructure to the regions. Public Access
Points will be established in remote areas to
improve access and utilisation of the internet.
Establish the Universal Access Fund and
implement the Universal Access Regulations
and infrastructure sharing guidelines to ensure
affordability of ICT services for communities in
remote and underserviced areas.
Through the upgrading and construction
of new FM and TV transmitter stations;
implementation of direct-to-home satellite
broadcasting and upgrading of studio and
IT facilities to achieve a multi-channel, HD,
digital production environment. Regulate and
promote activities relating to local and foreign
film production.
By integrating ICT in all sectors with priority
attention to e-business, e-learning, e-health,
and e-governance. This is the critical success
factor for transforming Namibia into a
knowledge economy.
This strategy will extend the current ICT
infrastructure to build and maintain a geo-
ICT infrastructure that will ensure real-time
measurements and monitoring for risk
reduction through early warning.
Desired outcomes by 2022, Namibia has universal
access to information, affordable
communication and technology
infrastructure and services.
how We’re getting there
Improve % population
covered by broadband
infrastructure to 90%
Improve % Digital Terrestrial
Television coverage to
93%
Improve % FM population coverage to
90%
Increase # of Postal infrastructure outlets to
152
Improve Access to online news (users) to
80%
eCoNomiC progressioN
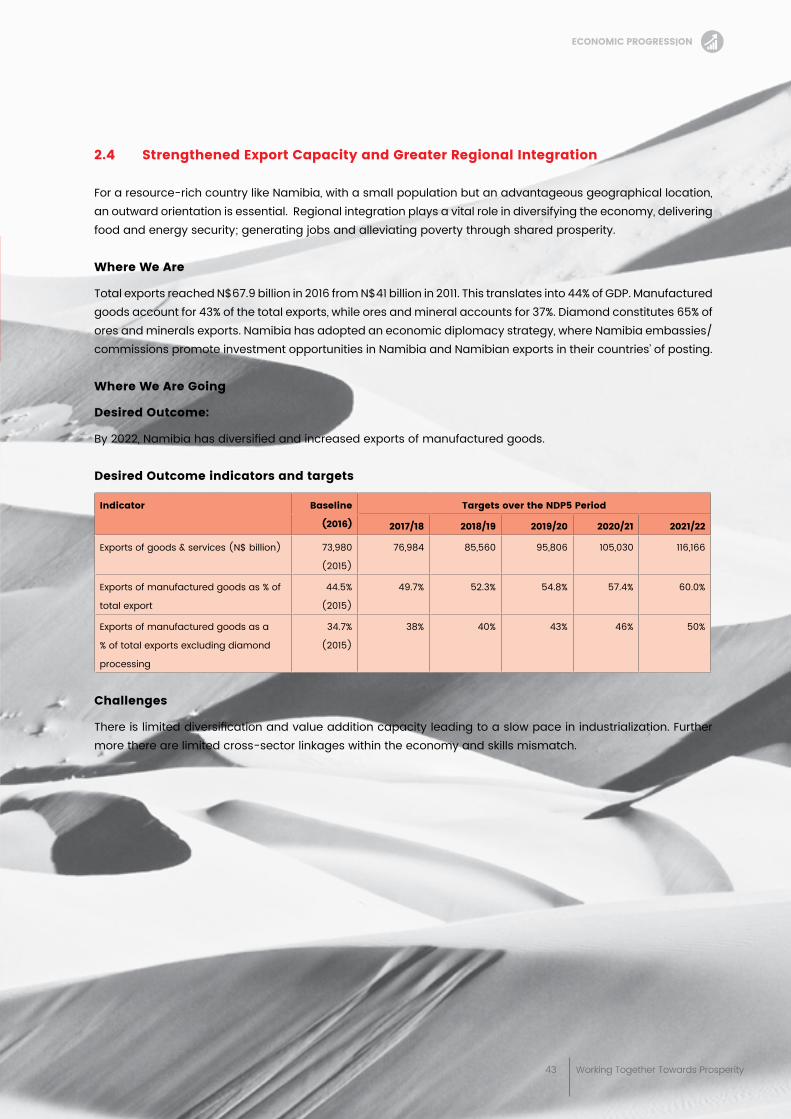
43 Working Together Towards Prosperity
2.4 strengthened export Capacity and greater regional integration
For a resource-rich country like Namibia, with a small population but an advantageous geographical location, an outward orientation is essential. Regional integration plays a vital role in diversifying the economy, delivering food and energy security; generating jobs and alleviating poverty through shared prosperity.
Where We are
Total exports reached N$67.9 billion in 2016 from N$41 billion in 2011. This translates into 44% of GDP. Manufactured goods account for 43% of the total exports, while ores and mineral accounts for 37%. Diamond constitutes 65% of ores and minerals exports. Namibia has adopted an economic diplomacy strategy, where Namibia embassies/commissions promote investment opportunities in Namibia and Namibian exports in their countries’ of posting.
Where We are going
Desired outcome:
By 2022, Namibia has diversified and increased exports of manufactured goods.
Desired outcome indicators and targets
indicator baseline
(2016)
targets over the NDp5 period
2017/18 2018/19 2019/20 2020/21 2021/22
Exports of goods & services (N$ billion) 73,980
(2015)
76,984 85,560 95,806 105,030 116,166
Exports of manufactured goods as % of
total export
44.5%
(2015)
49.7% 52.3% 54.8% 57.4% 60.0%
Exports of manufactured goods as a
% of total exports excluding diamond
processing
34.7%
(2015)
38% 40% 43% 46% 50%
Challenges
There is limited diversification and value addition capacity leading to a slow pace in industrialization. Further more there are limited cross-sector linkages within the economy and skills mismatch.
eCoNomiC progressioN
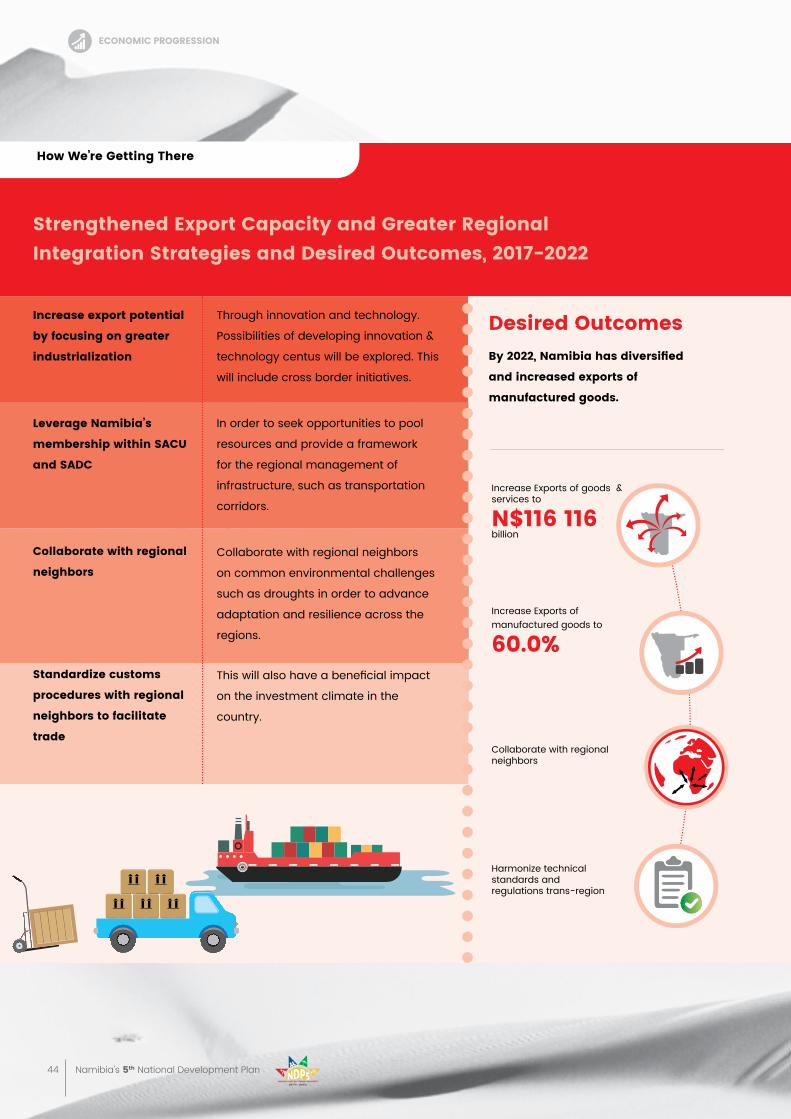
44 Namibia’s 5th National Development Plan
strengthened export Capacity and greater regional integration strategies and Desired outcomes, 2017-2022
increase export potential
by focusing on greater
industrialization
leverage Namibia’s
membership within saCu
and saDC
Collaborate with regional
neighbors
standardize customs
procedures with regional
neighbors to facilitate
trade
Through innovation and technology.
Possibilities of developing innovation &
technology centus will be explored. This
will include cross border initiatives.
In order to seek opportunities to pool
resources and provide a framework
for the regional management of
infrastructure, such as transportation
corridors.
Collaborate with regional neighbors
on common environmental challenges
such as droughts in order to advance
adaptation and resilience across the
regions.
This will also have a beneficial impact
on the investment climate in the
country.
Desired outcomes By2022,Namibiahasdiversified
and increased exports of
manufactured goods.
how We’re getting there
Increase Exports of goods & services to
N$116 116 billion
Increase Exports of manufactured goods to
60.0%
Collaborate with regional neighbors
Harmonize technical standards and regulations trans-region
eCoNomiC progressioN
45 Working Together Towards Prosperity
2.5 supportive Financial infrastructure for greater inclusion
Where We are Now
During the NDP4 period, the financial sector recorded a significant growth, averaging 8.4% per annum. Domestic credit to the private sector as a percentage of GDP improved to 55.3% in 2016 compared to 49.2% in 2011. Over the same period, banking financial institutions increased to six banks from four banks in 2011. Micro, Small and Medium Enterprises (MSME) sector in Namibia are estimated to be around 33 700 in 2015. About half of these MSMEs are formally registered while others remain in the informal sector of the economy. During NDP4 the four priority sectors identified under NDP4 collectively received disbursements to the value of N$1.6 billion, representing 37% of total disbursements from Development Bank of Namibia. Furthermore, Agricultural Bank of Namibia (Agribank) provided short and long term lending facilities aimed at promoting growth in the agriculture sector. Accordingly, Agribank’s total loans and advances increased from N$1.6 billion in 2010/11 to N$2.3 billion in 2014/15, mainly driven by farmland acquisitions and livestock purchases.
Namibia’s banking industry has established a clearinghouse (NAMCLEAR) that facilitates the clearing of interbank payment transactions. In addition, the local switch (NAMSWITCH) was established. NAMSWITCH enables the local switching of all Namibian inter-bank Automated Teller Machine (ATM) card transactions as well as Point-of-Sale terminals card transactions. At regional level, the SADC Integrated Regional Electronic Settlement System (SIRESS) has been established which enables settlement of all Rand-denominated cross-border transactions, with discussions underway to make it a multi-currency settlement system. The establishment of SIRESS contribute to the enhancement of regional trade.
Where We are going
Desired outcome
By 2022, Namibia has an effective, resilient and inclusive financial system that supports accelerated industrialization and infrastructure development.
Desired outcome indicators and targets
indicator baseline targets over the NDp5 period
2017/18 2018/19 2019/20 2020/21 2021/22
Retail Payment Systems Efficiency and Interoperability
Medium-Low efficiency and
interoperability (e-money not interoperable
yet)
Medium Medium Medium-High
High level of efficiency and
interoperability
High level of efficiency and
interoperability
Namibia Interbank Settlement System Availability
98.00% 99.5% 99.99% 99.99% 99.99% 99.99%
Approved funding for SMEs 44% (est.) 48% 53% 58% 62% 65%
Financial Inclusion 69% (2011 Finscope survey)
71% 72% 73% 74% (As per NFSS target)
80%
eCoNomiC progressioN
46 Namibia’s 5th National Development Plan
Challenges
Limited access to finance and support services for MSMEs inhibit growth and sustainable development. Secondary, supportive financial infrastructures to enhance the provision and access to financial services are limited. Other challenges include:
• lack of collateral required by lending institutions: Many of the borrowers, especially SMEs do not have the required collateral and hence unable to get credit.
• PoorfinancialandbusinessmanagementonthepartofMSMEs: Improved business and financial management increases the businesses’ ability to access finance from a financial institution and improves the business’s ability to service debt and to grow.
• Inadequate information onavailability of financial services andproducts: majority of business especially those residing in rural areas are unaware of the existence of financial services and products.
• limited competition within the National payment system: Competition in the payment systems is beneficial not only to consumers but for the competitiveness of the financial sector as whole.
eCoNomiC progressioN
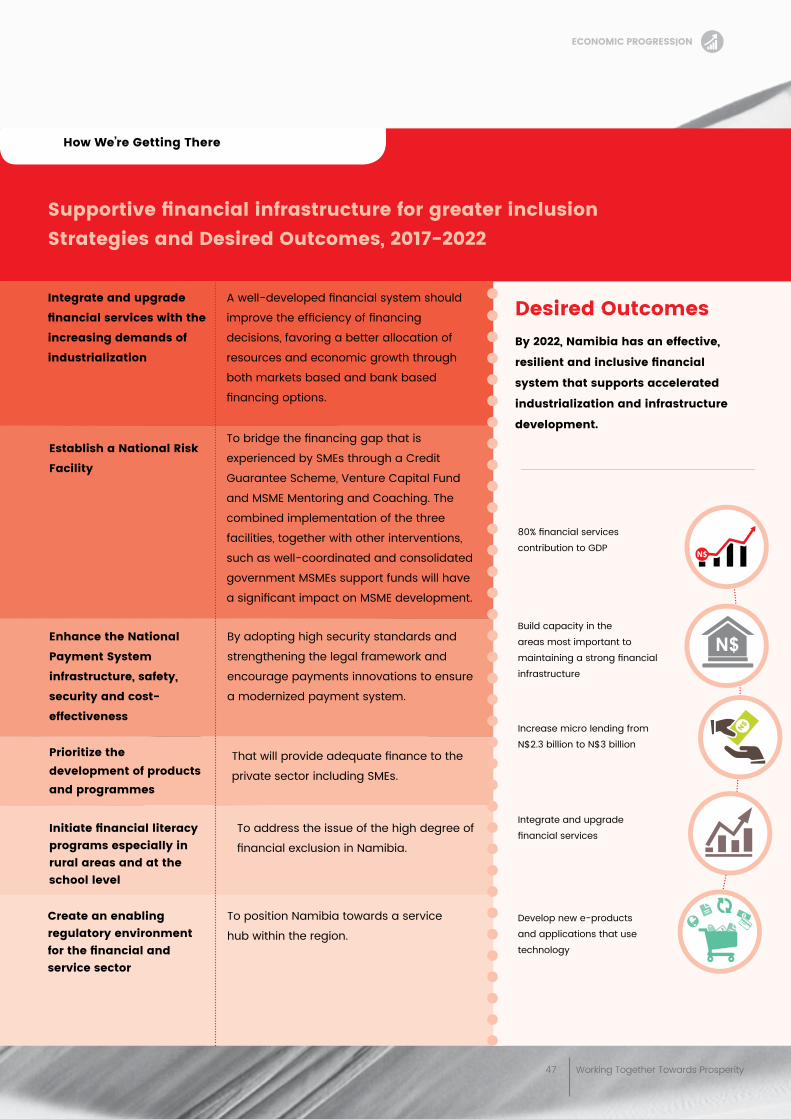
47 Working Together Towards Prosperity
Supportivefinancialinfrastructureforgreaterinclusionstrategies and Desired outcomes, 2017-2022
integrate and upgrade
financialserviceswiththe
increasing demands of
industrialization
establish a National risk
Facility
enhance the National
payment system
infrastructure, safety,
security and cost-
effectiveness
prioritize the development of products and programmes
Create an enabling regulatory environment forthefinancialandservice sector
Initiatefinancialliteracyprograms especially in rural areas and at the school level
A well-developed financial system should
improve the efficiency of financing
decisions, favoring a better allocation of
resources and economic growth through
both markets based and bank based
financing options.
To bridge the financing gap that is
experienced by SMEs through a Credit
Guarantee Scheme, Venture Capital Fund
and MSME Mentoring and Coaching. The
combined implementation of the three
facilities, together with other interventions,
such as well-coordinated and consolidated
government MSMEs support funds will have
a significant impact on MSME development.
By adopting high security standards and
strengthening the legal framework and
encourage payments innovations to ensure
a modernized payment system.
That will provide adequate finance to the
private sector including SMEs.
To position Namibia towards a service
hub within the region.
To address the issue of the high degree of
financial exclusion in Namibia.
Desired outcomes by 2022, Namibia has an effective,
resilientandinclusivefinancial
system that supports accelerated
industrialization and infrastructure
development.
how We’re getting there
Build capacity in the areas most important to maintaining a strong financial infrastructure
80% financial services contribution to GDP
Increase micro lending from N$2.3 billion to N$3 billion
Integrate and upgrade financial services
Develop new e-products and applications that use technology
eCoNomiC progressioN

48 Namibia’s 5th National Development Plan
49 Working Together Towards Prosperity
soCial traNsFormatioN
3
builD a Capable aND healthY humaN resoures
harnessing the Demographic Dividends
human Capital Development
• Social Protection
• Early Childhood Development
• Basic Education
• Technical, Vocational Education and Training
• Higher Education
• Health and Nutrition
social Development
• Gender Equality
• Housing and Land
• Sanitation
• Youth Empowerment: (Harnessing the Demographic
Dividend - Moulding Youth to Become Productive Citizens)
• Empowering People and Communities through Sports
• Arts and Culture
• Integrate marginalized communities into mainstream
economy
overview
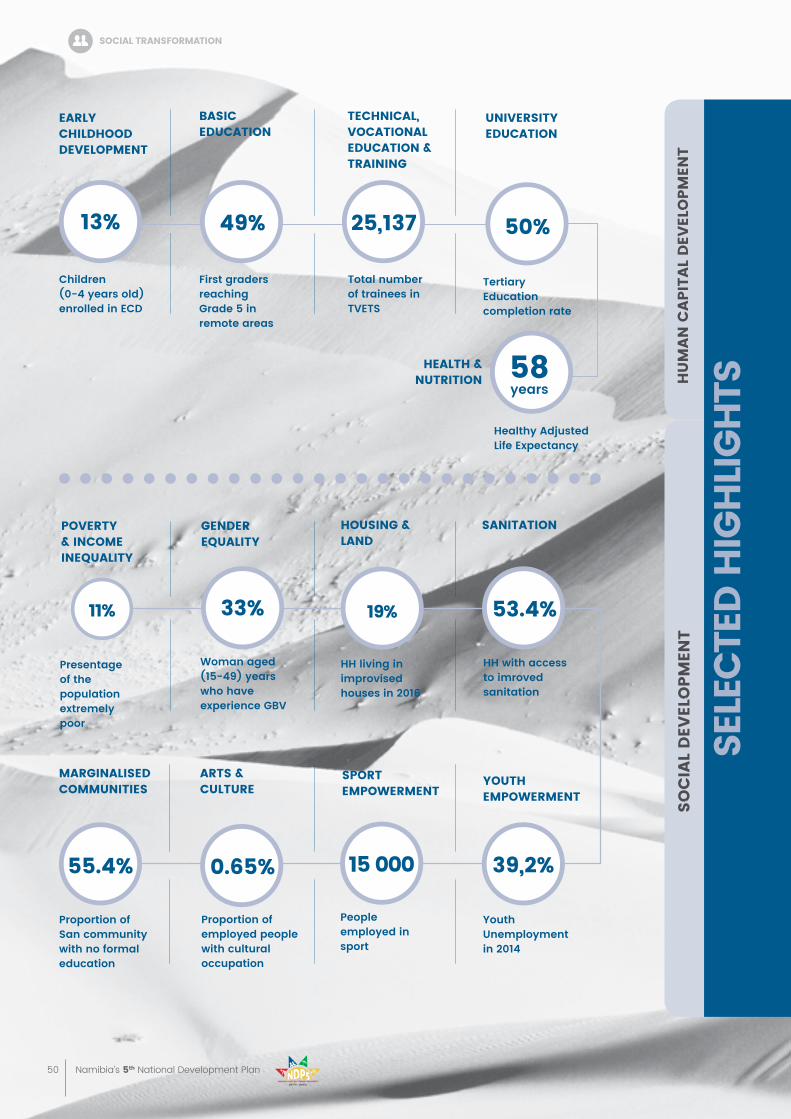
50 Namibia’s 5th National Development Plan
soCial traNsFormatioN
sele
Cte
D h
igh
lig
hts
First gradersreaching Grade 5 in remote areas
basiC eDuCatioN
49%
Children (0-4 years old) enrolled in ECD
13%
earlY ChilDhooD DevelopmeNt
hu
ma
N C
api
tal
Dev
elo
pmeN
tso
Cia
l D
evel
opm
eNt
HH living in improvised houses in 2016
19%
housiNg & laND
Presentage of the population extremely poor
11%
povertY & iNCome iNequalitY
Youth Unemploymentin 2014
39,2%
Youth empoWermeNt
Proportion of San community with no formal education
55.4%
margiNaliseD CommuNities
People employed in sport
15 000
sport empoWermeNt
Woman aged (15-49) years who have experience GBV
33%
geNDer equalitY
Proportion of employed people with cultural occupation
0.65%
arts & Culture
HH with access to imroved sanitation
53.4%
Total number of trainees in TVETS
25,137
teChNiCal, voCatioNal eDuCatioN & traiNiNg
Healthy AdjustedLife Expectancy
58years
health & NutritioN
Tertiary Education completion rate
uNiversitY eDuCatioN
50%
saNitatioN
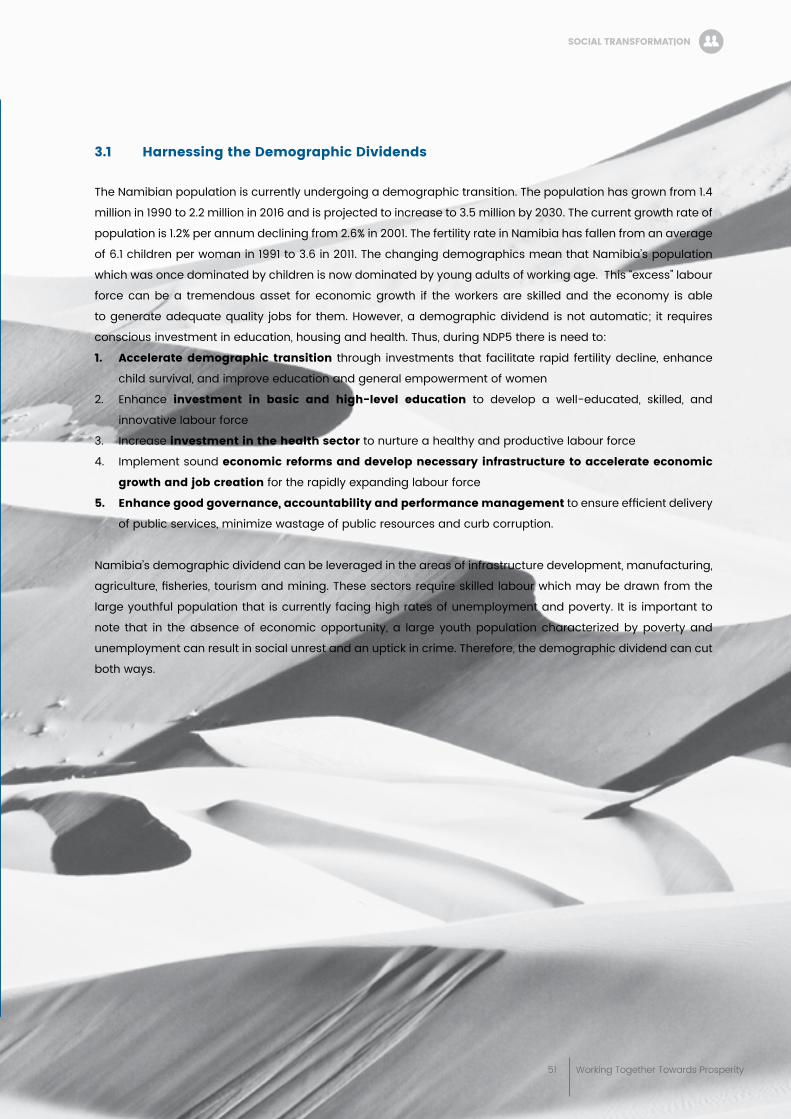
51 Working Together Towards Prosperity
3.1 harnessing the Demographic Dividends
The Namibian population is currently undergoing a demographic transition. The population has grown from 1.4
million in 1990 to 2.2 million in 2016 and is projected to increase to 3.5 million by 2030. The current growth rate of
population is 1.2% per annum declining from 2.6% in 2001. The fertility rate in Namibia has fallen from an average
of 6.1 children per woman in 1991 to 3.6 in 2011. The changing demographics mean that Namibia’s population
which was once dominated by children is now dominated by young adults of working age. This “excess” labour
force can be a tremendous asset for economic growth if the workers are skilled and the economy is able
to generate adequate quality jobs for them. However, a demographic dividend is not automatic; it requires
conscious investment in education, housing and health. Thus, during NDP5 there is need to:
1. accelerate demographic transition through investments that facilitate rapid fertility decline, enhance
child survival, and improve education and general empowerment of women
2. Enhance investment in basic and high-level education to develop a well-educated, skilled, and
innovative labour force
3. Increase investment in the health sector to nurture a healthy and productive labour force
4. Implement sound economic reforms and develop necessary infrastructure to accelerate economic
growth and job creation for the rapidly expanding labour force
5. enhance good governance, accountability and performance management to ensure efficient delivery
of public services, minimize wastage of public resources and curb corruption.
Namibia’s demographic dividend can be leveraged in the areas of infrastructure development, manufacturing,
agriculture, fisheries, tourism and mining. These sectors require skilled labour which may be drawn from the
large youthful population that is currently facing high rates of unemployment and poverty. It is important to
note that in the absence of economic opportunity, a large youth population characterized by poverty and
unemployment can result in social unrest and an uptick in crime. Therefore, the demographic dividend can cut
both ways.
soCial traNsFormatioN
sele
Cte
D h
igh
lig
hts
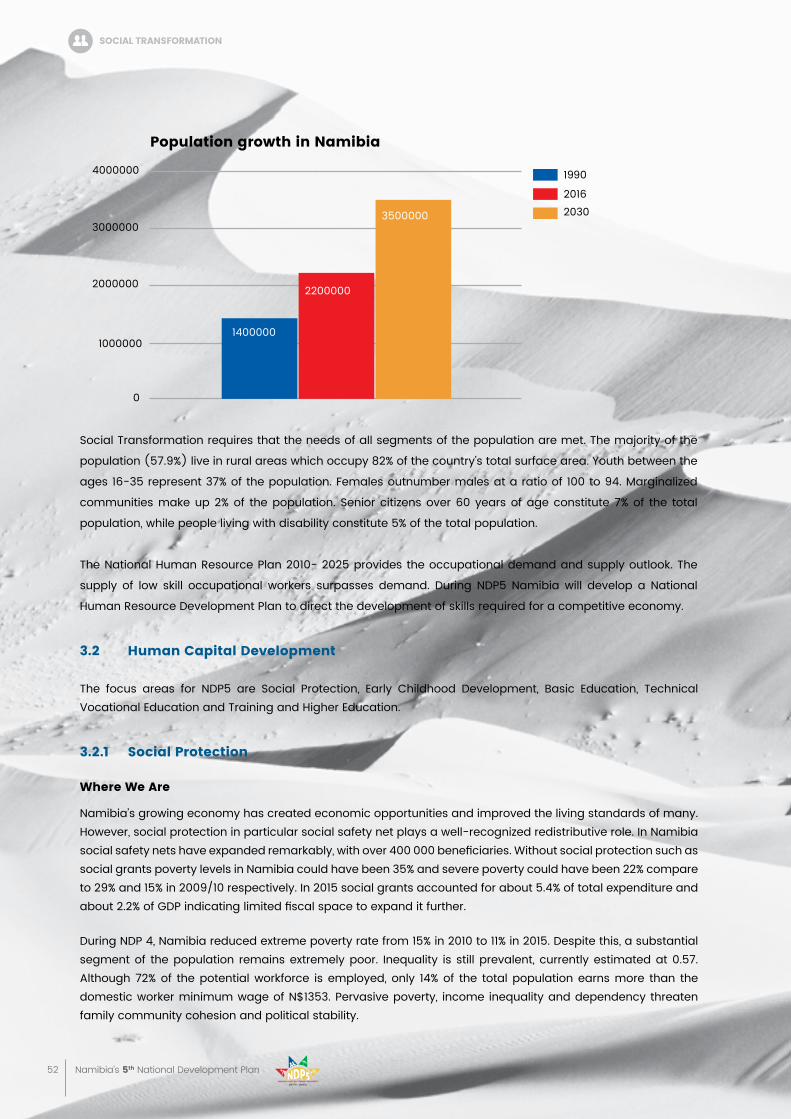
52 Namibia’s 5th National Development Plan
Social Transformation requires that the needs of all segments of the population are met. The majority of the
population (57.9%) live in rural areas which occupy 82% of the country’s total surface area. Youth between the
ages 16-35 represent 37% of the population. Females outnumber males at a ratio of 100 to 94. Marginalized
communities make up 2% of the population. Senior citizens over 60 years of age constitute 7% of the total
population, while people living with disability constitute 5% of the total population.
The National Human Resource Plan 2010- 2025 provides the occupational demand and supply outlook. The
supply of low skill occupational workers surpasses demand. During NDP5 Namibia will develop a National
Human Resource Development Plan to direct the development of skills required for a competitive economy.
3.2 human Capital Development
The focus areas for NDP5 are Social Protection, Early Childhood Development, Basic Education, Technical Vocational Education and Training and Higher Education.
3.2.1 social protection
Where We are
Namibia’s growing economy has created economic opportunities and improved the living standards of many. However, social protection in particular social safety net plays a well-recognized redistributive role. In Namibia social safety nets have expanded remarkably, with over 400 000 beneficiaries. Without social protection such as social grants poverty levels in Namibia could have been 35% and severe poverty could have been 22% compare to 29% and 15% in 2009/10 respectively. In 2015 social grants accounted for about 5.4% of total expenditure and about 2.2% of GDP indicating limited fiscal space to expand it further.
During NDP 4, Namibia reduced extreme poverty rate from 15% in 2010 to 11% in 2015. Despite this, a substantial segment of the population remains extremely poor. Inequality is still prevalent, currently estimated at 0.57. Although 72% of the potential workforce is employed, only 14% of the total population earns more than the domestic worker minimum wage of N$1353. Pervasive poverty, income inequality and dependency threaten family community cohesion and political stability.
soCial traNsFormatioN
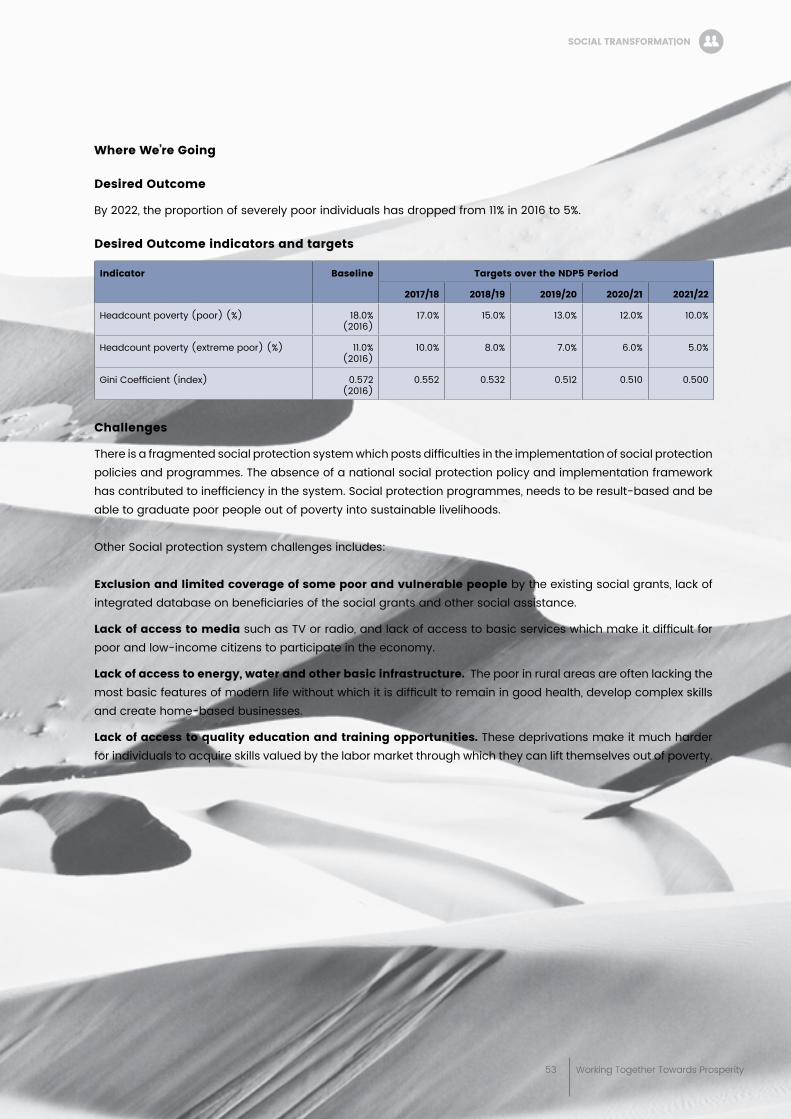
53 Working Together Towards Prosperity
soCial traNsFormatioN
Where We’re going
Desired outcome
By 2022, the proportion of severely poor individuals has dropped from 11% in 2016 to 5%.
Desired outcome indicators and targets
indicator baseline targets over the NDp5 period
2017/18 2018/19 2019/20 2020/21 2021/22
Headcount poverty (poor) (%) 18.0% (2016)
17.0% 15.0% 13.0% 12.0% 10.0%
Headcount poverty (extreme poor) (%) 11.0% (2016)
10.0% 8.0% 7.0% 6.0% 5.0%
Gini Coefficient (index) 0.572 (2016)
0.552 0.532 0.512 0.510 0.500
Challenges
There is a fragmented social protection system which posts difficulties in the implementation of social protection policies and programmes. The absence of a national social protection policy and implementation framework has contributed to inefficiency in the system. Social protection programmes, needs to be result-based and be able to graduate poor people out of poverty into sustainable livelihoods.
Other Social protection system challenges includes:
exclusion and limited coverage of some poor and vulnerable people by the existing social grants, lack of integrated database on beneficiaries of the social grants and other social assistance.
lack of access to media such as TV or radio, and lack of access to basic services which make it difficult for poor and low-income citizens to participate in the economy.
lack of access to energy, water and other basic infrastructure. The poor in rural areas are often lacking the most basic features of modern life without which it is difficult to remain in good health, develop complex skills and create home-based businesses.
lack of access to quality education and training opportunities. These deprivations make it much harder for individuals to acquire skills valued by the labor market through which they can lift themselves out of poverty.
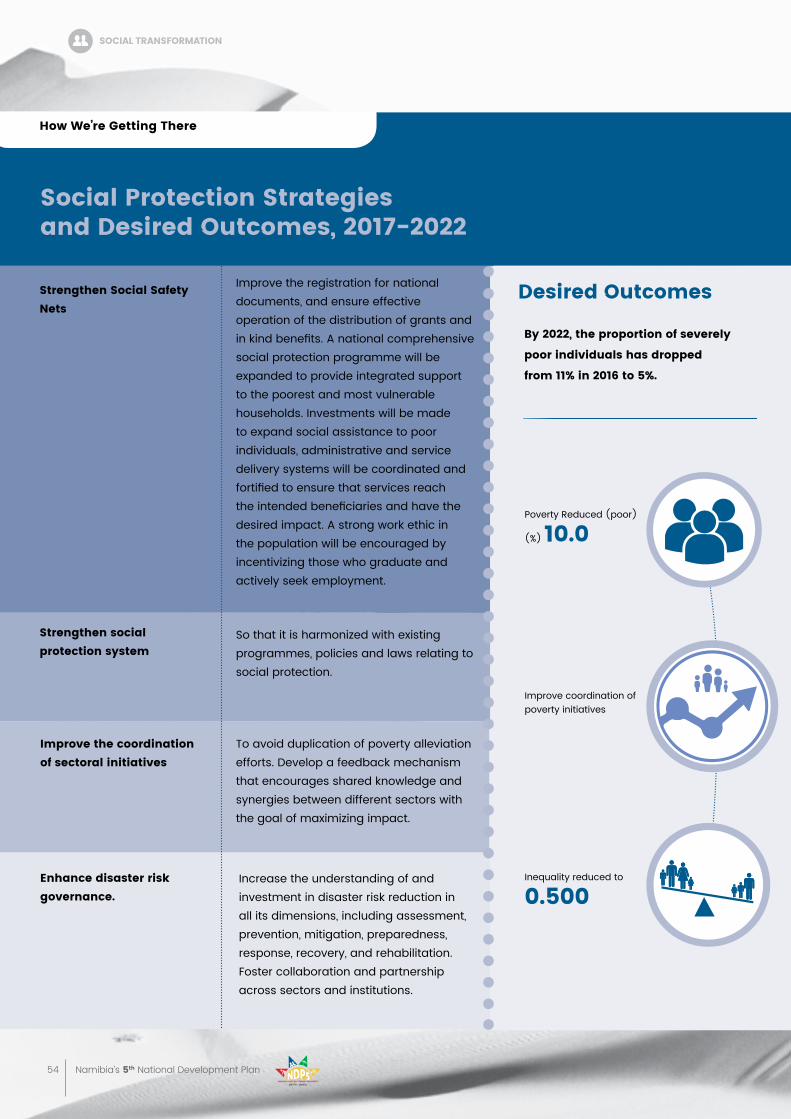
54 Namibia’s 5th National Development Plan
social protection strategies and Desired outcomes, 2017-2022
strengthen social safety Nets
strengthen social protection system
improve the coordination of sectoral initiatives
enhance disaster risk governance.
Improve the registration for national documents, and ensure effective operation of the distribution of grants and in kind benefits. A national comprehensive social protection programme will be expanded to provide integrated support to the poorest and most vulnerable households. Investments will be made to expand social assistance to poor individuals, administrative and service delivery systems will be coordinated and fortified to ensure that services reach the intended beneficiaries and have the desired impact. A strong work ethic in the population will be encouraged by incentivizing those who graduate and actively seek employment.
So that it is harmonized with existing programmes, policies and laws relating to social protection.
To avoid duplication of poverty alleviation efforts. Develop a feedback mechanism that encourages shared knowledge and synergies between different sectors with the goal of maximizing impact.
Increase the understanding of and investment in disaster risk reduction in all its dimensions, including assessment, prevention, mitigation, preparedness, response, recovery, and rehabilitation. Foster collaboration and partnership across sectors and institutions.
Desired outcomes
by 2022, the proportion of severely
poor individuals has dropped
from 11% in 2016 to 5%.
how We’re getting there
soCial traNsFormatioN
Poverty Reduced (poor)
(%) 10.0
Improve coordination ofpoverty initiatives
Inequality reduced to
0.500
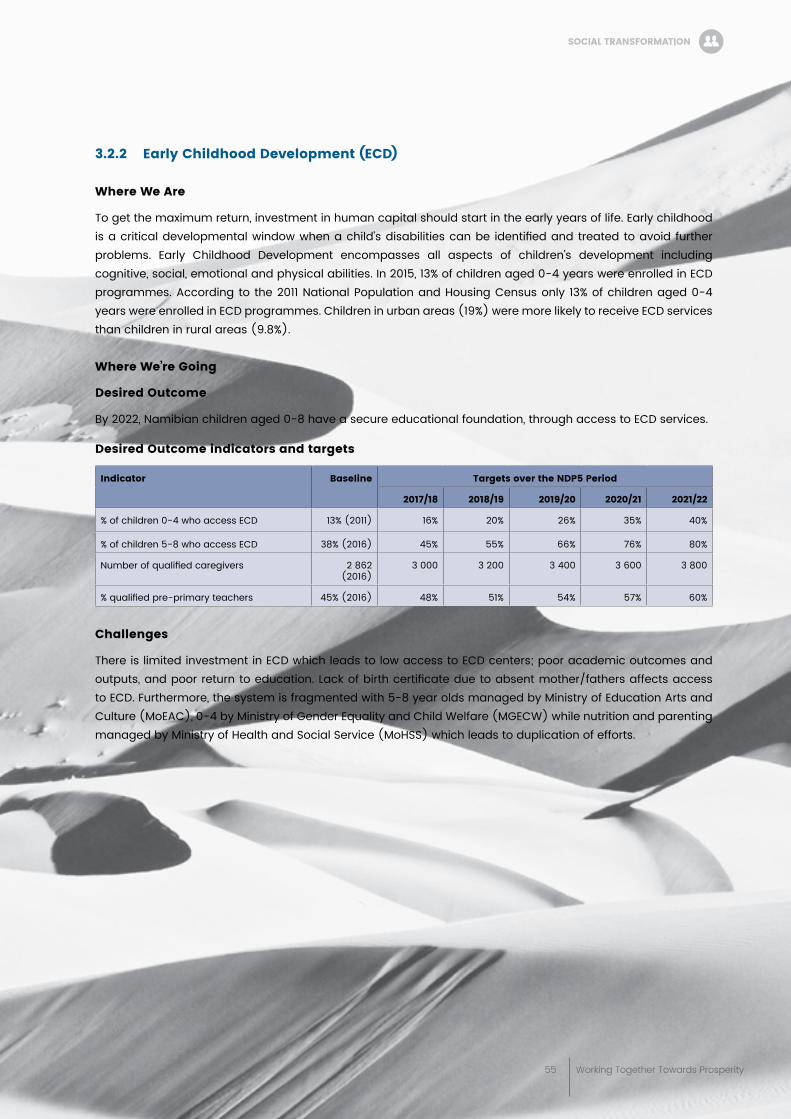
55 Working Together Towards Prosperity
3.2.2 early Childhood Development (eCD)
Where We are
To get the maximum return, investment in human capital should start in the early years of life. Early childhood is a critical developmental window when a child’s disabilities can be identified and treated to avoid further problems. Early Childhood Development encompasses all aspects of children’s development including cognitive, social, emotional and physical abilities. In 2015, 13% of children aged 0-4 years were enrolled in ECD programmes. According to the 2011 National Population and Housing Census only 13% of children aged 0-4 years were enrolled in ECD programmes. Children in urban areas (19%) were more likely to receive ECD services than children in rural areas (9.8%).
Where We’re going
Desired outcome
By 2022, Namibian children aged 0-8 have a secure educational foundation, through access to ECD services.
Desired outcome indicators and targets
indicator baseline targets over the NDp5 period
2017/18 2018/19 2019/20 2020/21 2021/22
% of children 0-4 who access ECD 13% (2011) 16% 20% 26% 35% 40%
% of children 5-8 who access ECD 38% (2016) 45% 55% 66% 76% 80%
Number of qualified caregivers 2 862 (2016)
3 000 3 200 3 400 3 600 3 800
% qualified pre-primary teachers 45% (2016) 48% 51% 54% 57% 60%
Challenges
There is limited investment in ECD which leads to low access to ECD centers; poor academic outcomes and outputs, and poor return to education. Lack of birth certificate due to absent mother/fathers affects access to ECD. Furthermore, the system is fragmented with 5-8 year olds managed by Ministry of Education Arts and Culture (MoEAC), 0-4 by Ministry of Gender Equality and Child Welfare (MGECW) while nutrition and parenting managed by Ministry of Health and Social Service (MoHSS) which leads to duplication of efforts.
soCial traNsFormatioN
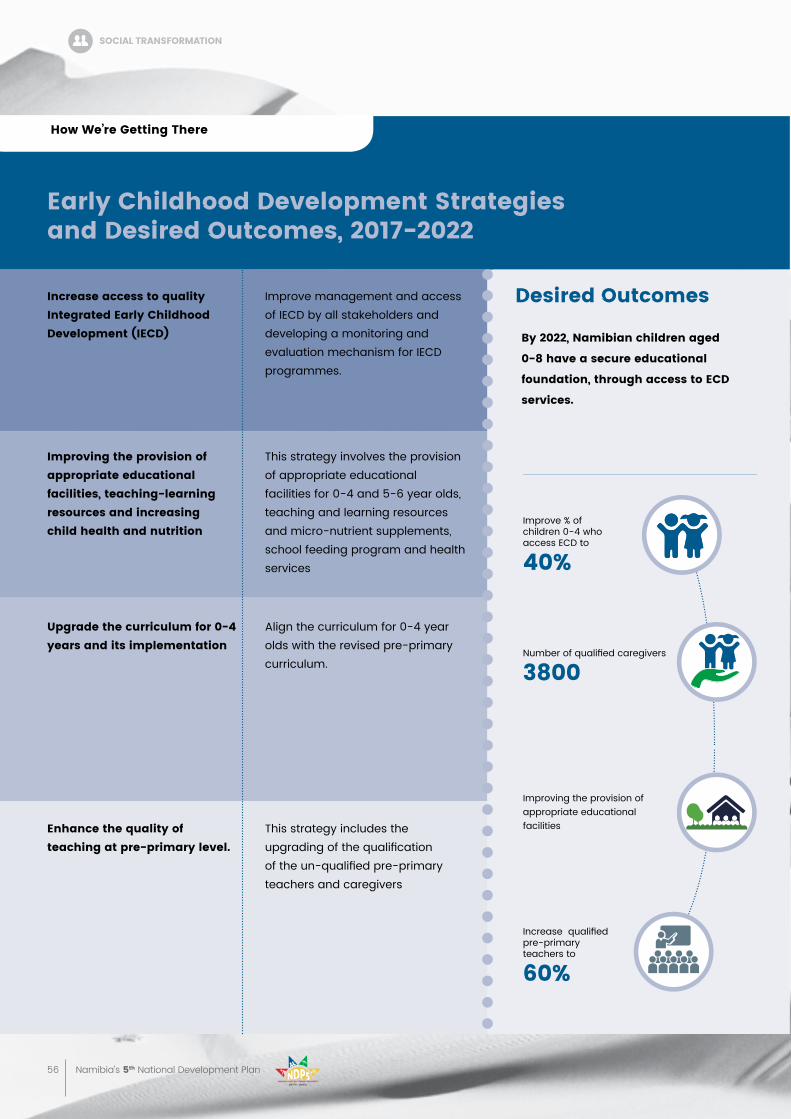
56 Namibia’s 5th National Development Plan
early Childhood Development strategies and Desired outcomes, 2017-2022
increase access to quality integrated early Childhood Development (ieCD)
improving the provision of appropriate educational facilities, teaching-learning resources and increasing child health and nutrition
upgrade the curriculum for 0-4 years and its implementation
enhance the quality of teaching at pre-primary level.
Improve management and access of IECD by all stakeholders and developing a monitoring and evaluation mechanism for IECD programmes.
This strategy involves the provision of appropriate educational facilities for 0-4 and 5-6 year olds, teaching and learning resources and micro-nutrient supplements, school feeding program and health services
Align the curriculum for 0-4 year olds with the revised pre-primary curriculum.
This strategy includes the upgrading of the qualification of the un-qualified pre-primary teachers and caregivers
Desired outcomes
by 2022, Namibian children aged
0-8 have a secure educational
foundation, through access to eCD
services.
how We’re getting there
Improve % of children 0-4 who access ECD to
40%
Improving the provision of appropriate educational facilities
Number of qualified caregivers
3800
Increase qualified pre-primary teachers to
60%
soCial traNsFormatioN
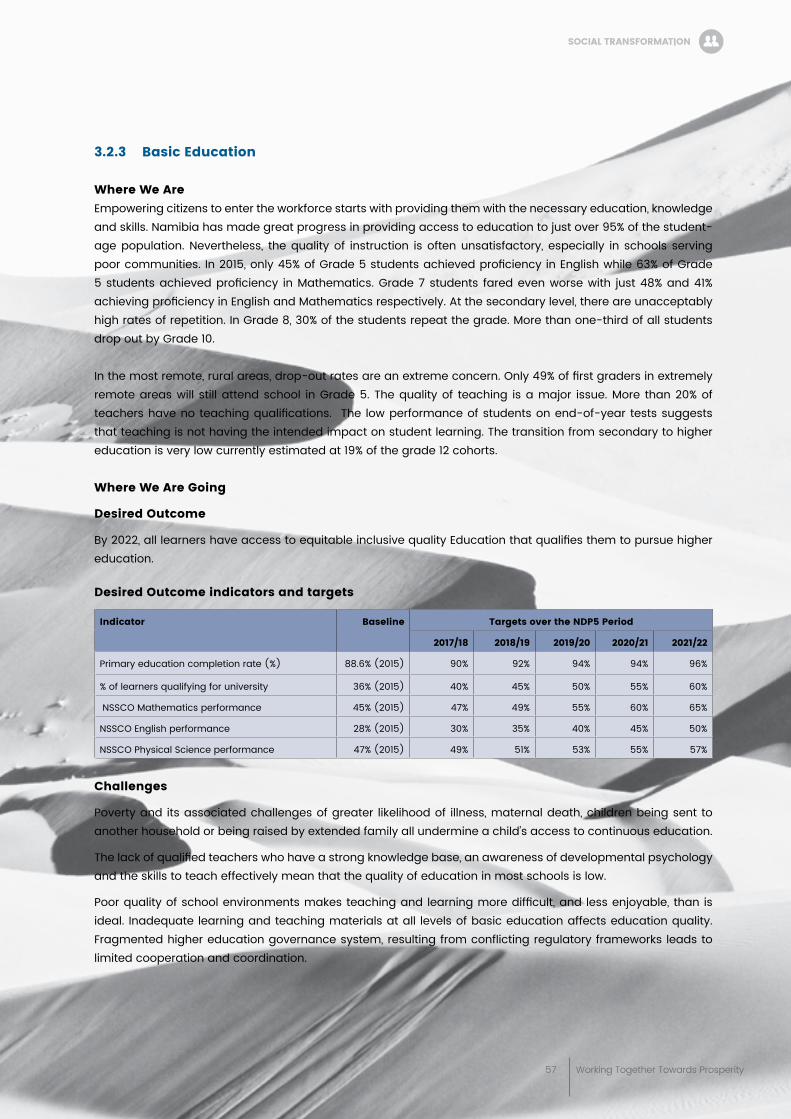
57 Working Together Towards Prosperity
3.2.3 basic education
Where We are Empowering citizens to enter the workforce starts with providing them with the necessary education, knowledge and skills. Namibia has made great progress in providing access to education to just over 95% of the student-age population. Nevertheless, the quality of instruction is often unsatisfactory, especially in schools serving poor communities. In 2015, only 45% of Grade 5 students achieved proficiency in English while 63% of Grade 5 students achieved proficiency in Mathematics. Grade 7 students fared even worse with just 48% and 41% achieving proficiency in English and Mathematics respectively. At the secondary level, there are unacceptably high rates of repetition. In Grade 8, 30% of the students repeat the grade. More than one-third of all students drop out by Grade 10.
In the most remote, rural areas, drop-out rates are an extreme concern. Only 49% of first graders in extremely remote areas will still attend school in Grade 5. The quality of teaching is a major issue. More than 20% of teachers have no teaching qualifications. The low performance of students on end-of-year tests suggests that teaching is not having the intended impact on student learning. The transition from secondary to higher education is very low currently estimated at 19% of the grade 12 cohorts.
Where We are going
Desired outcome
By 2022, all learners have access to equitable inclusive quality Education that qualifies them to pursue higher education.
Desired outcome indicators and targets
indicator baseline targets over the NDp5 period
2017/18 2018/19 2019/20 2020/21 2021/22
Primary education completion rate (%) 88.6% (2015) 90% 92% 94% 94% 96%
% of learners qualifying for university 36% (2015) 40% 45% 50% 55% 60%
NSSCO Mathematics performance 45% (2015) 47% 49% 55% 60% 65%
NSSCO English performance 28% (2015) 30% 35% 40% 45% 50%
NSSCO Physical Science performance 47% (2015) 49% 51% 53% 55% 57%
Challenges
Poverty and its associated challenges of greater likelihood of illness, maternal death, children being sent to another household or being raised by extended family all undermine a child’s access to continuous education.
The lack of qualified teachers who have a strong knowledge base, an awareness of developmental psychology and the skills to teach effectively mean that the quality of education in most schools is low.
Poor quality of school environments makes teaching and learning more difficult, and less enjoyable, than is ideal. Inadequate learning and teaching materials at all levels of basic education affects education quality. Fragmented higher education governance system, resulting from conflicting regulatory frameworks leads to limited cooperation and coordination.
soCial traNsFormatioN
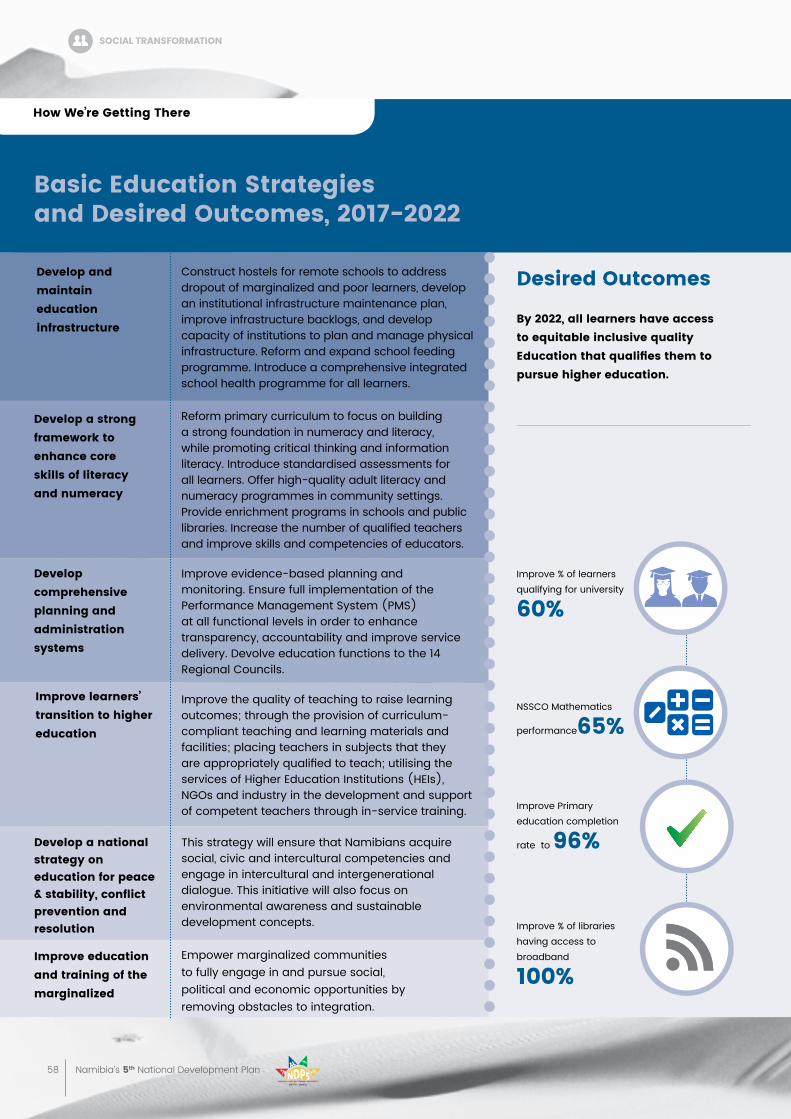
58 Namibia’s 5th National Development Plan
basic education strategies and Desired outcomes, 2017-2022
Develop and maintain education infrastructure
Develop a strong framework to enhance core skills of literacy and numeracy
Develop comprehensive planning and administration systems
improve learners’ transition to higher education
Develop a national strategy on education for peace &stability,conflictprevention and resolution
improve education and training of the marginalized
Construct hostels for remote schools to address dropout of marginalized and poor learners, develop an institutional infrastructure maintenance plan, improve infrastructure backlogs, and develop capacity of institutions to plan and manage physical infrastructure. Reform and expand school feeding programme. Introduce a comprehensive integrated school health programme for all learners.
Reform primary curriculum to focus on building a strong foundation in numeracy and literacy, while promoting critical thinking and information literacy. Introduce standardised assessments for all learners. Offer high-quality adult literacy and numeracy programmes in community settings. Provide enrichment programs in schools and public libraries. Increase the number of qualified teachers and improve skills and competencies of educators.
Improve evidence-based planning and monitoring. Ensure full implementation of the Performance Management System (PMS) at all functional levels in order to enhance transparency, accountability and improve service delivery. Devolve education functions to the 14 Regional Councils.
Improve the quality of teaching to raise learning outcomes; through the provision of curriculum-compliant teaching and learning materials and facilities; placing teachers in subjects that they are appropriately qualified to teach; utilising the services of Higher Education Institutions (HEIs), NGOs and industry in the development and support of competent teachers through in-service training.
This strategy will ensure that Namibians acquire social, civic and intercultural competencies and engage in intercultural and intergenerational dialogue. This initiative will also focus on environmental awareness and sustainable development concepts.
Empower marginalized communities to fully engage in and pursue social, political and economic opportunities by removing obstacles to integration.
Desired outcomes
by 2022, all learners have access to equitable inclusive quality Educationthatqualifiesthemtopursue higher education.
how We’re getting there
Improve Primary education completion
rate to 96%
Improve % of libraries having access to broadband
100%
NSSCO Mathematics
performance65%
Improve % of learners qualifying for university
60%
soCial traNsFormatioN
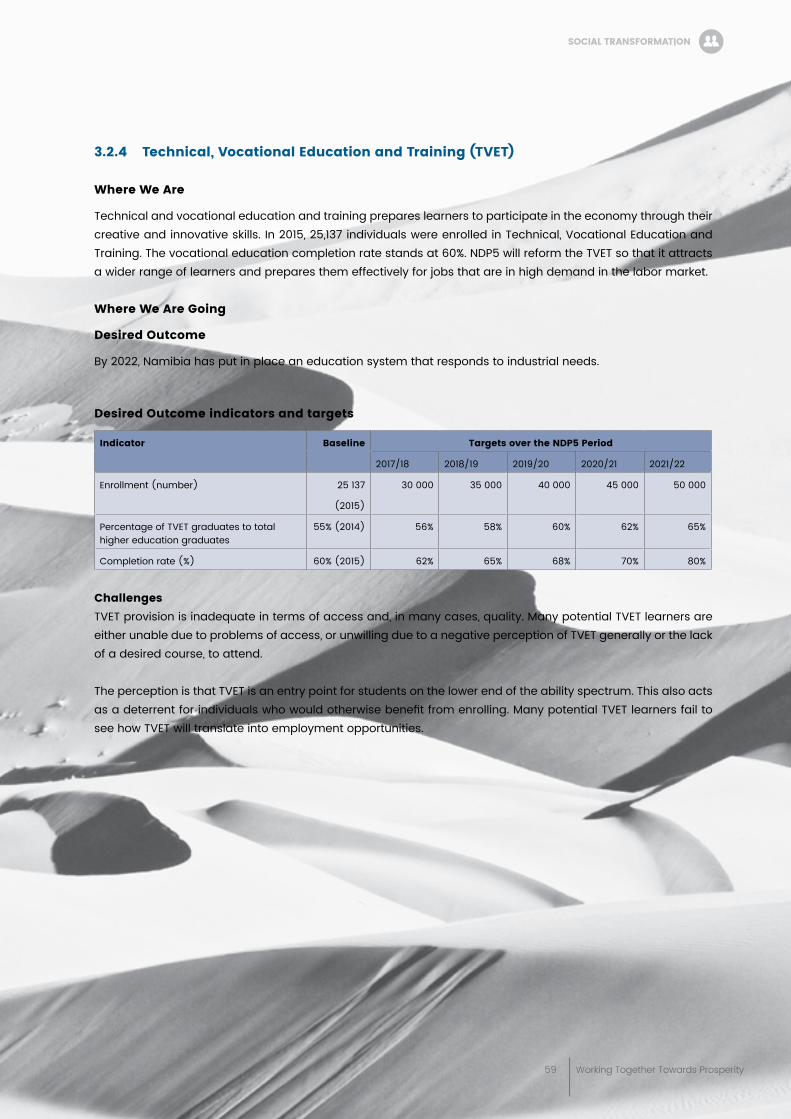
59 Working Together Towards Prosperity
3.2.4 technical, vocational education and training (tvet)
Where We are
Technical and vocational education and training prepares learners to participate in the economy through their creative and innovative skills. In 2015, 25,137 individuals were enrolled in Technical, Vocational Education and Training. The vocational education completion rate stands at 60%. NDP5 will reform the TVET so that it attracts a wider range of learners and prepares them effectively for jobs that are in high demand in the labor market.
Where We are going
Desired outcome
By 2022, Namibia has put in place an education system that responds to industrial needs.
Desired outcome indicators and targets
indicator baseline targets over the NDp5 period
2017/18 2018/19 2019/20 2020/21 2021/22
Enrollment (number) 25 137
(2015)
30 000 35 000 40 000 45 000 50 000
Percentage of TVET graduates to total higher education graduates
55% (2014) 56% 58% 60% 62% 65%
Completion rate (%) 60% (2015) 62% 65% 68% 70% 80%
Challenges TVET provision is inadequate in terms of access and, in many cases, quality. Many potential TVET learners are either unable due to problems of access, or unwilling due to a negative perception of TVET generally or the lack of a desired course, to attend.
The perception is that TVET is an entry point for students on the lower end of the ability spectrum. This also acts as a deterrent for individuals who would otherwise benefit from enrolling. Many potential TVET learners fail to see how TVET will translate into employment opportunities.
soCial traNsFormatioN
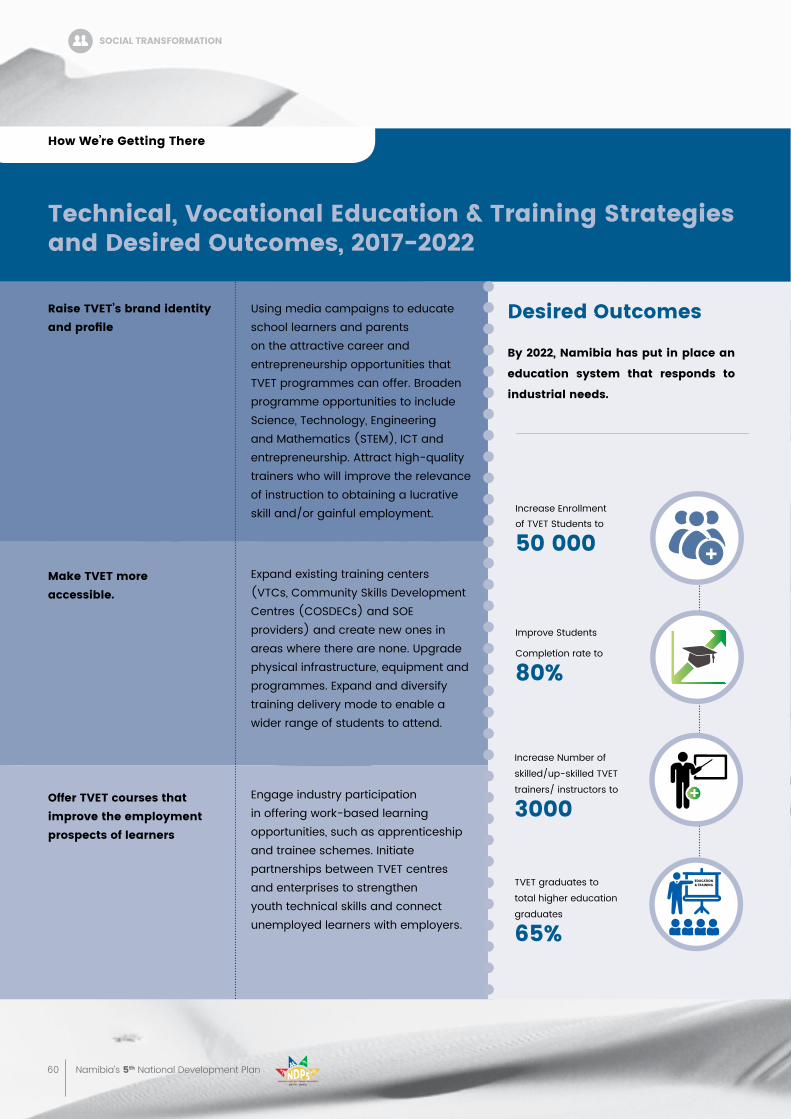
60 Namibia’s 5th National Development Plan
technical, vocational education & training strategies and Desired outcomes, 2017-2022
raise tvet’s brand identity andprofile
make tvet more accessible.
offer tvet courses that improve the employment prospects of learners
Using media campaigns to educate school learners and parents on the attractive career and entrepreneurship opportunities that TVET programmes can offer. Broaden programme opportunities to include Science, Technology, Engineering and Mathematics (STEM), ICT and entrepreneurship. Attract high-quality trainers who will improve the relevance of instruction to obtaining a lucrative skill and/or gainful employment.
Expand existing training centers (VTCs, Community Skills Development Centres (COSDECs) and SOE providers) and create new ones in areas where there are none. Upgrade physical infrastructure, equipment and programmes. Expand and diversify training delivery mode to enable a wider range of students to attend.
Engage industry participation in offering work-based learning opportunities, such as apprenticeship and trainee schemes. Initiate partnerships between TVET centres and enterprises to strengthen youth technical skills and connect unemployed learners with employers.
Desired outcomes
by 2022, Namibia has put in place an
education system that responds to
industrial needs.
how We’re getting there
Increase Enrollment of TVET Students to
50 000
Improve Students
Completion rate to
80%
Increase Number of skilled/up-skilled TVET trainers/ instructors to
3000
TVET graduates to total higher education graduates
65%
soCial traNsFormatioN
61 Working Together Towards Prosperity
3.2.5 higher education
Where We are
The quality and relevance of university education has been a serious concern of both private and public sector employers. Post-graduate education continues to be underdeveloped and its contribution to research and innovation remains small. Considerable inequalities of access to university education remain in terms of social class, geographical location, marginalized groups as well as those with special needs and disabilities.
University education institutions enroll around 19% of the grade 12 cohorts. In 2015, the Gross Enrolment Ratio stood at 21.1%. The total enrolment at public Higher Education Institutions (HEIs) was 34,917 of which the Namibia University of Science and Technology (NUST) enrolled 12,245 and the University of Namibia (UNAM) 20,619. Total enrolment for private HEIs for 2015 was 14,761 and is projected to increase to 16,000 in 2016. Student from rural areas have a much lower rate of enrolment into tertiary education institutions. University education completion rate is at 50%. Where We are going
Desired outcomes
By 2022, Namibia has put in place an education system that responds to industrial needs.
Desired outcome indicators and targets
indicator baseline targets over the NDp5 period
2017/18 2018/19 2019/20 2020/21 2021/22
Tertiary education completion rate (%) 50%
(2015)
55% 58% 62% 66% 70%
Challenges
Access to university education opportunities continues to be low, especially for poor, rural students from marginalised and special needs groups.
High drop-out and low graduation rates leads to wasted investment. Access and drop-out rates are often linked to limited funding available to students and lack of student support systems. Further, there is limited infrastructure for quality teaching, research and innovation, including limited access to broadband. There are weak linkages with labour market, including industry, impacting negatively on relevance of training programmes and employability.
soCial traNsFormatioN
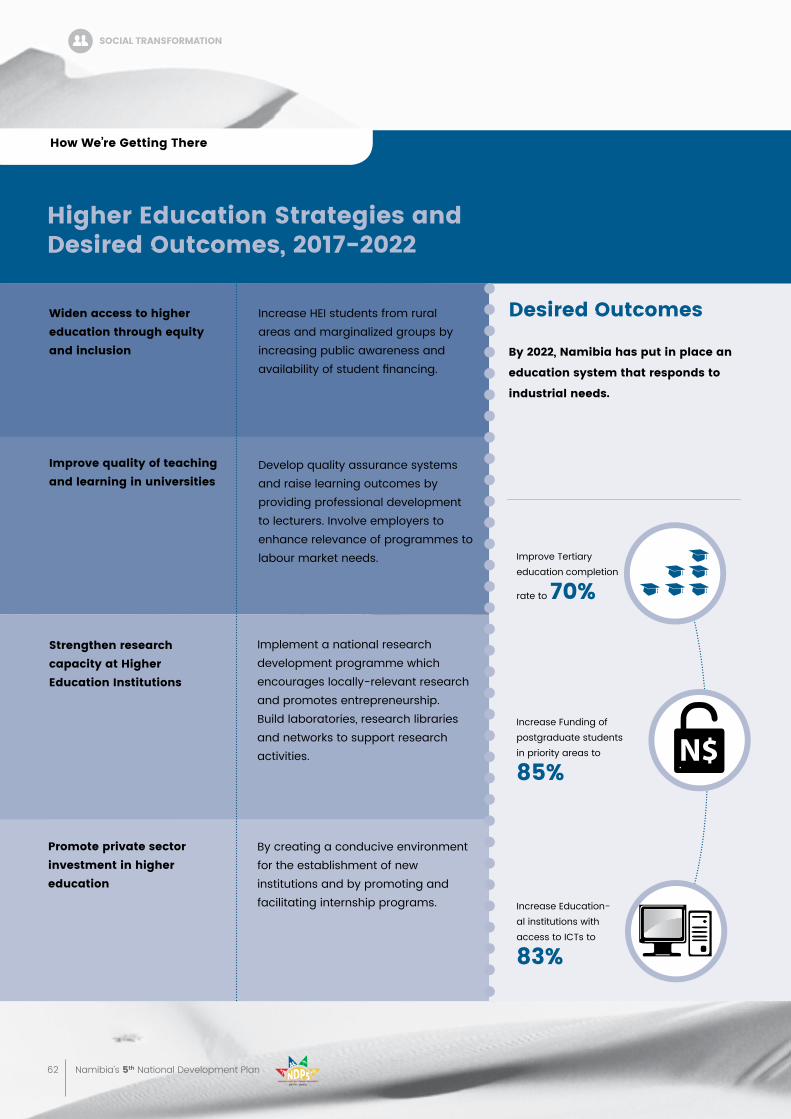
62 Namibia’s 5th National Development Plan
higher education strategies and Desired outcomes, 2017-2022
Widen access to higher education through equity and inclusion
improve quality of teaching and learning in universities
strengthen research capacity at higher education institutions
promote private sector investment in higher education
Increase HEI students from rural areas and marginalized groups by increasing public awareness and availability of student financing.
Develop quality assurance systems and raise learning outcomes by providing professional development to lecturers. Involve employers to enhance relevance of programmes to labour market needs.
Implement a national research development programme which encourages locally-relevant research and promotes entrepreneurship. Build laboratories, research libraries and networks to support research activities.
By creating a conducive environment for the establishment of new institutions and by promoting and facilitating internship programs.
Desired outcomes
by 2022, Namibia has put in place an
education system that responds to
industrial needs.
how We’re getting there
Improve Tertiary education completion
rate to 70%
Increase Funding of postgraduate students in priority areas to
85%
Increase Education-al institutions with access to ICTs to
83%
soCial traNsFormatioN
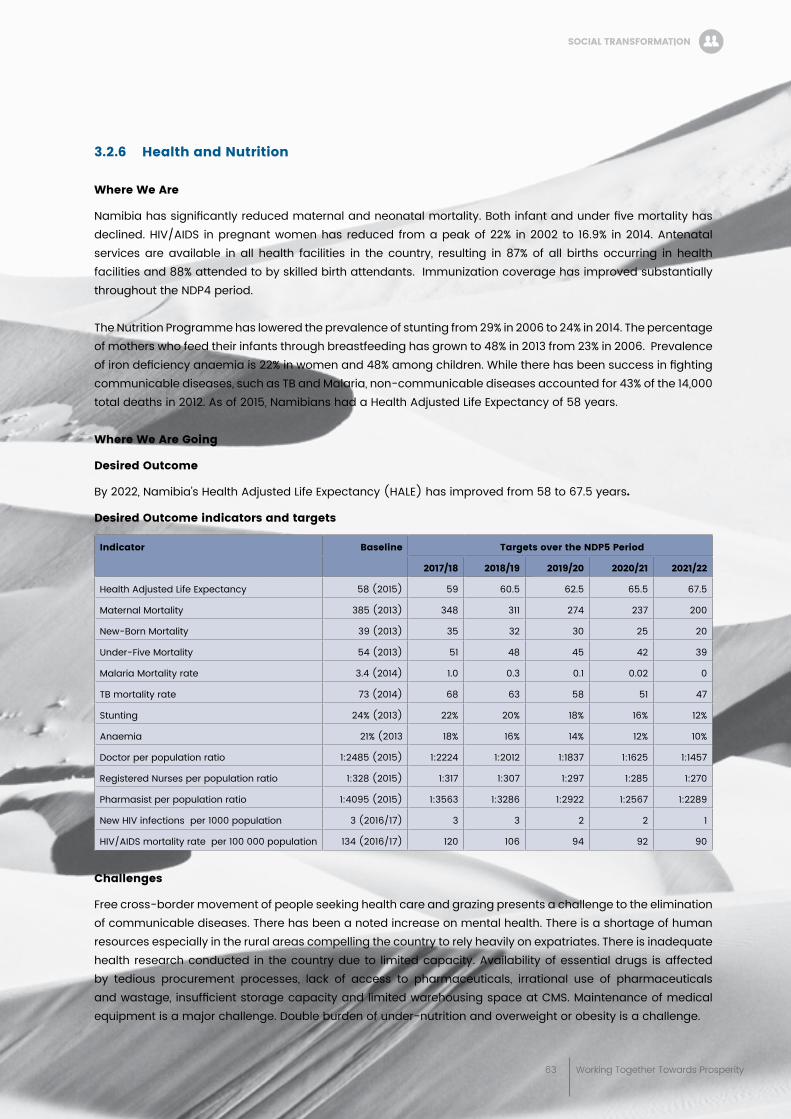
63 Working Together Towards Prosperity
3.2.6 health and Nutrition
Where We are
Namibia has significantly reduced maternal and neonatal mortality. Both infant and under five mortality has declined. HIV/AIDS in pregnant women has reduced from a peak of 22% in 2002 to 16.9% in 2014. Antenatal services are available in all health facilities in the country, resulting in 87% of all births occurring in health facilities and 88% attended to by skilled birth attendants. Immunization coverage has improved substantially throughout the NDP4 period.
The Nutrition Programme has lowered the prevalence of stunting from 29% in 2006 to 24% in 2014. The percentage of mothers who feed their infants through breastfeeding has grown to 48% in 2013 from 23% in 2006. Prevalence of iron deficiency anaemia is 22% in women and 48% among children. While there has been success in fighting communicable diseases, such as TB and Malaria, non-communicable diseases accounted for 43% of the 14,000 total deaths in 2012. As of 2015, Namibians had a Health Adjusted Life Expectancy of 58 years.
Where We are going
Desired outcome
By 2022, Namibia’s Health Adjusted Life Expectancy (HALE) has improved from 58 to 67.5 years.
Desired outcome indicators and targets
indicator baseline targets over the NDp5 period
2017/18 2018/19 2019/20 2020/21 2021/22
Health Adjusted Life Expectancy 58 (2015) 59 60.5 62.5 65.5 67.5
Maternal Mortality 385 (2013) 348 311 274 237 200
New-Born Mortality 39 (2013) 35 32 30 25 20
Under-Five Mortality 54 (2013) 51 48 45 42 39
Malaria Mortality rate 3.4 (2014) 1.0 0.3 0.1 0.02 0
TB mortality rate 73 (2014) 68 63 58 51 47
Stunting 24% (2013) 22% 20% 18% 16% 12%
Anaemia 21% (2013 18% 16% 14% 12% 10%
Doctor per population ratio 1:2485 (2015) 1:2224 1:2012 1:1837 1:1625 1:1457
Registered Nurses per population ratio 1:328 (2015) 1:317 1:307 1:297 1:285 1:270
Pharmasist per population ratio 1:4095 (2015) 1:3563 1:3286 1:2922 1:2567 1:2289
New HIV infections per 1000 population 3 (2016/17) 3 3 2 2 1
HIV/AIDS mortality rate per 100 000 population 134 (2016/17) 120 106 94 92 90
Challenges
Free cross-border movement of people seeking health care and grazing presents a challenge to the elimination of communicable diseases. There has been a noted increase on mental health. There is a shortage of human resources especially in the rural areas compelling the country to rely heavily on expatriates. There is inadequate health research conducted in the country due to limited capacity. Availability of essential drugs is affected by tedious procurement processes, lack of access to pharmaceuticals, irrational use of pharmaceuticals and wastage, insufficient storage capacity and limited warehousing space at CMS. Maintenance of medical equipment is a major challenge. Double burden of under-nutrition and overweight or obesity is a challenge.
soCial traNsFormatioN
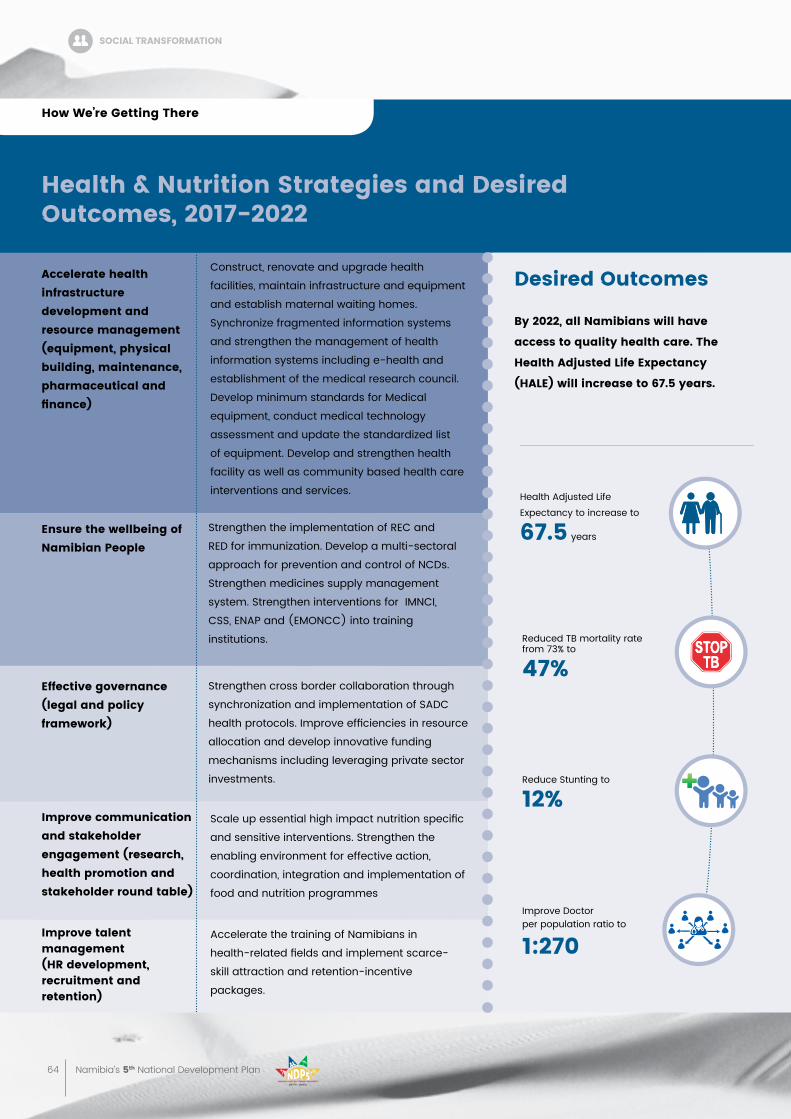
64 Namibia’s 5th National Development Plan
health & Nutrition strategies and Desired outcomes, 2017-2022
improve talent management (hr development, recruitment and retention)
Accelerate the training of Namibians in
health-related fields and implement scarce-
skill attraction and retention-incentive
packages.
accelerate health infrastructure development and resource management (equipment, physical building, maintenance, pharmaceutical and finance)
ensure the wellbeing of Namibian people
Construct, renovate and upgrade health
facilities, maintain infrastructure and equipment
and establish maternal waiting homes.
Synchronize fragmented information systems
and strengthen the management of health
information systems including e-health and
establishment of the medical research council.
Develop minimum standards for Medical
equipment, conduct medical technology
assessment and update the standardized list
of equipment. Develop and strengthen health
facility as well as community based health care
interventions and services.
Strengthen the implementation of REC and
RED for immunization. Develop a multi-sectoral
approach for prevention and control of NCDs.
Strengthen medicines supply management
system. Strengthen interventions for IMNCI,
CSS, ENAP and (EMONCC) into training
institutions.
effective governance (legal and policy framework)
improve communication and stakeholder engagement (research, health promotion and stakeholder round table)
Strengthen cross border collaboration through
synchronization and implementation of SADC
health protocols. Improve efficiencies in resource
allocation and develop innovative funding
mechanisms including leveraging private sector
investments.
Scale up essential high impact nutrition specific
and sensitive interventions. Strengthen the
enabling environment for effective action,
coordination, integration and implementation of
food and nutrition programmes
access to quality SRHR information, HIV counseling and testing, STI management and contraceptive services for young people including those living with disabilities
Desired outcomes
by 2022, all Namibians will have
access to quality health care. the
health adjusted life expectancy
(hale) will increase to 67.5 years.
Health Adjusted Life Expectancy to increase to
67.5 years
how We’re getting there
soCial traNsFormatioN
Reduced TB mortality rate from 73% to
47%
Reduce Stunting to
12%
Improve Doctor per population ratio to
1:270
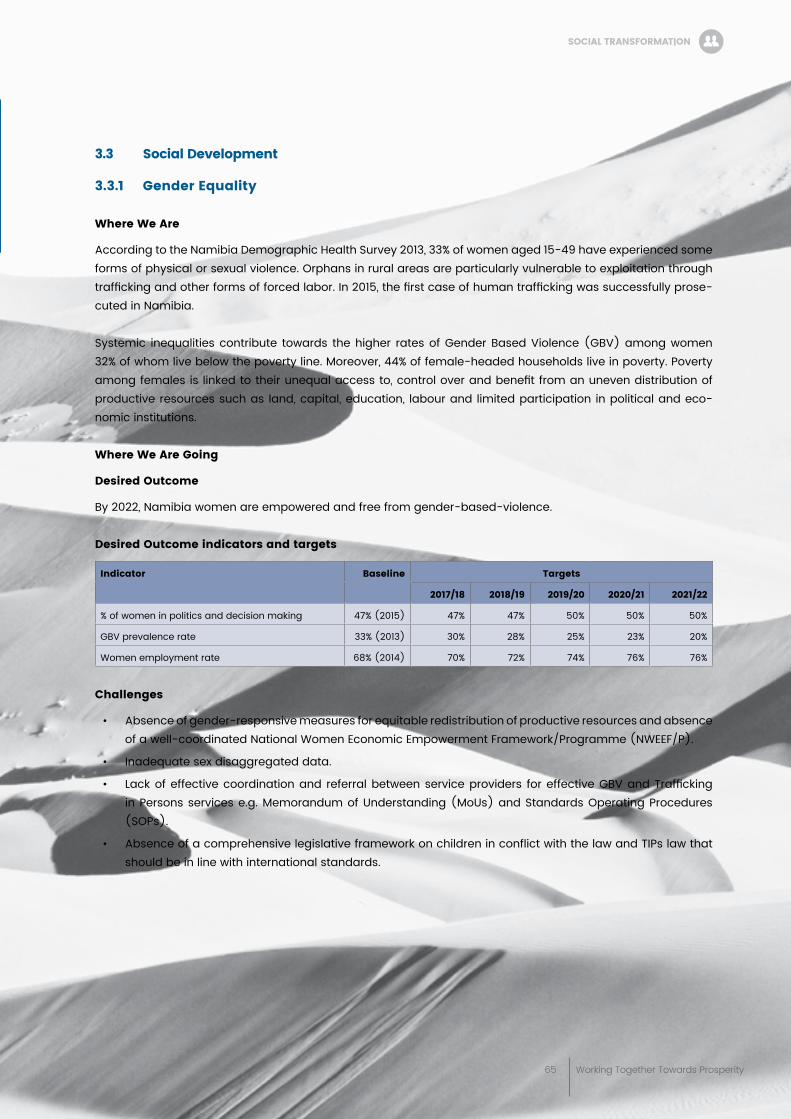
65 Working Together Towards Prosperity
3.3 social Development
3.3.1 gender equality
Where We are
According to the Namibia Demographic Health Survey 2013, 33% of women aged 15-49 have experienced some forms of physical or sexual violence. Orphans in rural areas are particularly vulnerable to exploitation through trafficking and other forms of forced labor. In 2015, the first case of human trafficking was successfully prose-cuted in Namibia.
Systemic inequalities contribute towards the higher rates of Gender Based Violence (GBV) among women 32% of whom live below the poverty line. Moreover, 44% of female-headed households live in poverty. Poverty among females is linked to their unequal access to, control over and benefit from an uneven distribution of productive resources such as land, capital, education, labour and limited participation in political and eco-nomic institutions. Where We are going
Desired outcome
By 2022, Namibia women are empowered and free from gender-based-violence.
Desired outcome indicators and targets
indicator baseline targets
2017/18 2018/19 2019/20 2020/21 2021/22
% of women in politics and decision making 47% (2015) 47% 47% 50% 50% 50%
GBV prevalence rate 33% (2013) 30% 28% 25% 23% 20%
Women employment rate 68% (2014) 70% 72% 74% 76% 76%
Challenges
• Absence of gender-responsive measures for equitable redistribution of productive resources and absence of a well-coordinated National Women Economic Empowerment Framework/Programme (NWEEF/P).
• Inadequate sex disaggregated data.
• Lack of effective coordination and referral between service providers for effective GBV and Trafficking in Persons services e.g. Memorandum of Understanding (MoUs) and Standards Operating Procedures (SOPs).
• Absence of a comprehensive legislative framework on children in conflict with the law and TIPs law that should be in line with international standards.
soCial traNsFormatioN
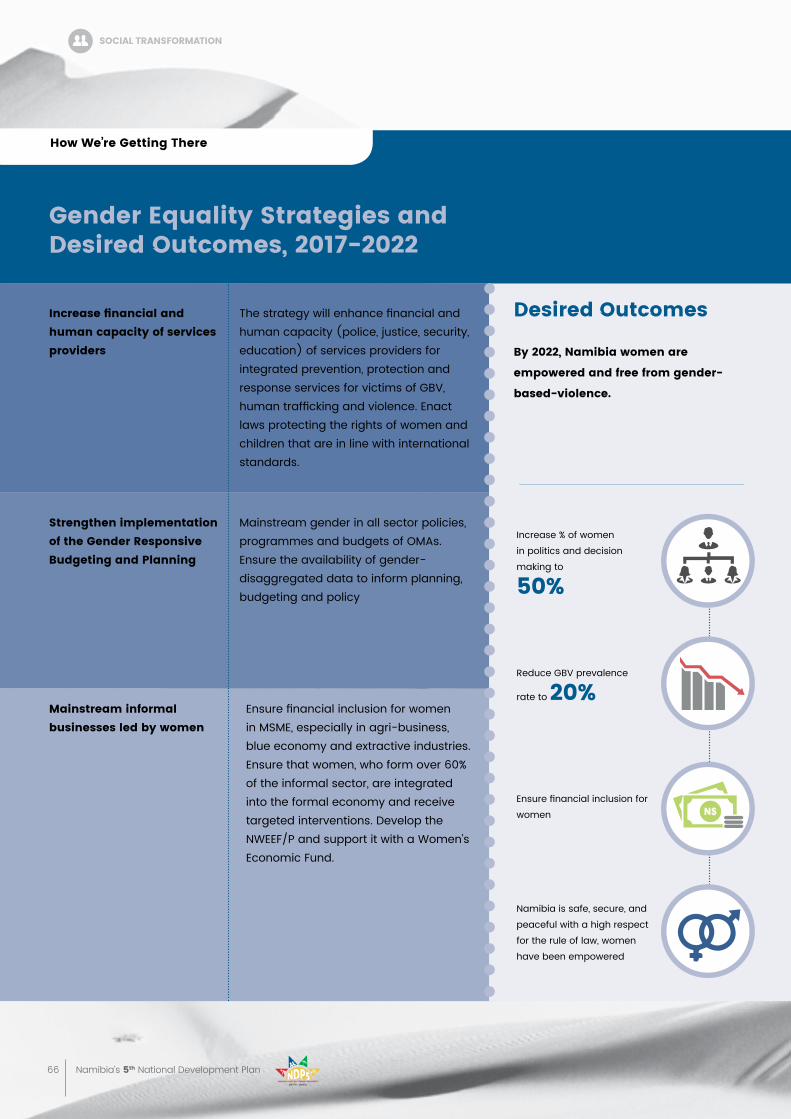
66 Namibia’s 5th National Development Plan
gender equality strategies and Desired outcomes, 2017-2022
Increasefinancialandhuman capacity of services providers
strengthen implementation of the gender responsive budgeting and planning
mainstream informal businesses led by women
The strategy will enhance financial and human capacity (police, justice, security, education) of services providers for integrated prevention, protection and response services for victims of GBV, human trafficking and violence. Enact laws protecting the rights of women and children that are in line with international standards.
Mainstream gender in all sector policies, programmes and budgets of OMAs. Ensure the availability of gender-disaggregated data to inform planning, budgeting and policy
Ensure financial inclusion for women in MSME, especially in agri-business, blue economy and extractive industries. Ensure that women, who form over 60% of the informal sector, are integrated into the formal economy and receive targeted interventions. Develop the NWEEF/P and support it with a Women’s Economic Fund.
Desired outcomes
by 2022, Namibia women are
empowered and free from gender-
based-violence.
how We’re getting there
Increase % of women in politics and decision making to
50%
Reduce GBV prevalence
rate to 20%
Ensure financial inclusion for women
Namibia is safe, secure, and peaceful with a high respect for the rule of law, women have been empowered
soCial traNsFormatioN
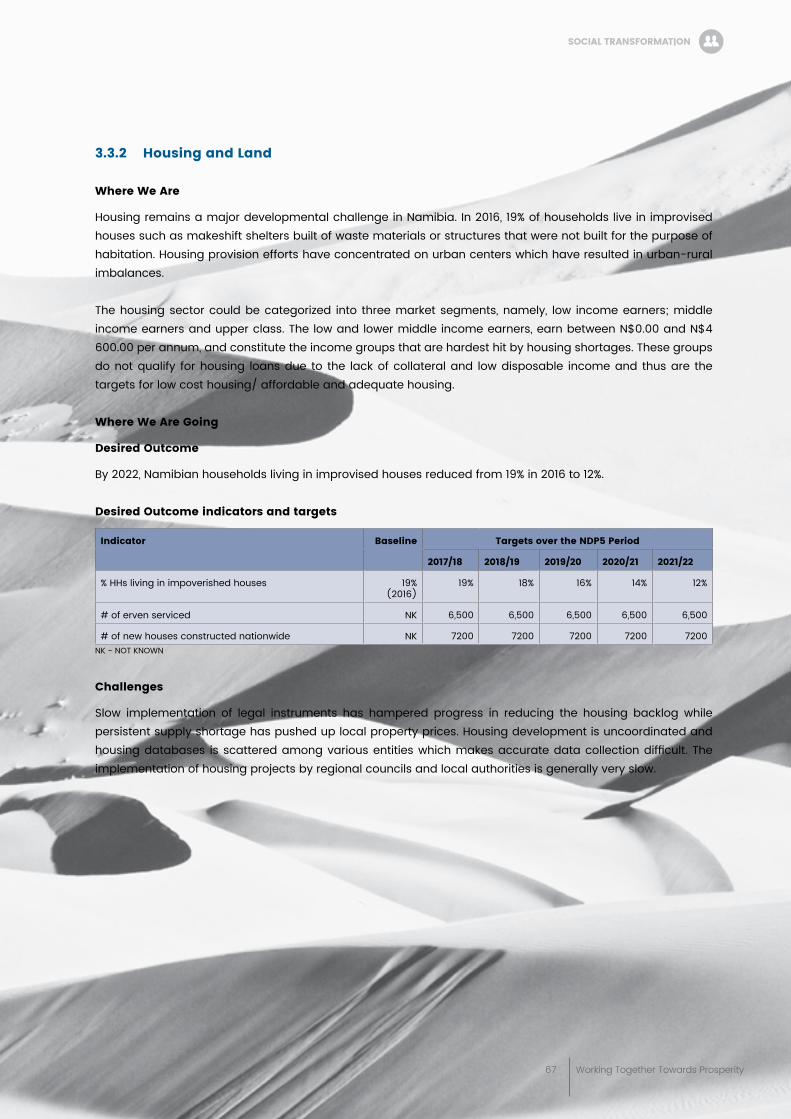
67 Working Together Towards Prosperity
3.3.2 housing and land
Where We are
Housing remains a major developmental challenge in Namibia. In 2016, 19% of households live in improvised houses such as makeshift shelters built of waste materials or structures that were not built for the purpose of habitation. Housing provision efforts have concentrated on urban centers which have resulted in urban-rural imbalances.
The housing sector could be categorized into three market segments, namely, low income earners; middle income earners and upper class. The low and lower middle income earners, earn between N$0.00 and N$4 600.00 per annum, and constitute the income groups that are hardest hit by housing shortages. These groups do not qualify for housing loans due to the lack of collateral and low disposable income and thus are the targets for low cost housing/ affordable and adequate housing.
Where We are going
Desired outcome
By 2022, Namibian households living in improvised houses reduced from 19% in 2016 to 12%.
Desired outcome indicators and targets
indicator baseline targets over the NDp5 period
2017/18 2018/19 2019/20 2020/21 2021/22
% HHs living in impoverished houses 19% (2016)
19% 18% 16% 14% 12%
# of erven serviced NK 6,500 6,500 6,500 6,500 6,500
# of new houses constructed nationwide NK 7200 7200 7200 7200 7200NK - NOT KNOWN
Challenges
Slow implementation of legal instruments has hampered progress in reducing the housing backlog while persistent supply shortage has pushed up local property prices. Housing development is uncoordinated and housing databases is scattered among various entities which makes accurate data collection difficult. The implementation of housing projects by regional councils and local authorities is generally very slow.
soCial traNsFormatioN
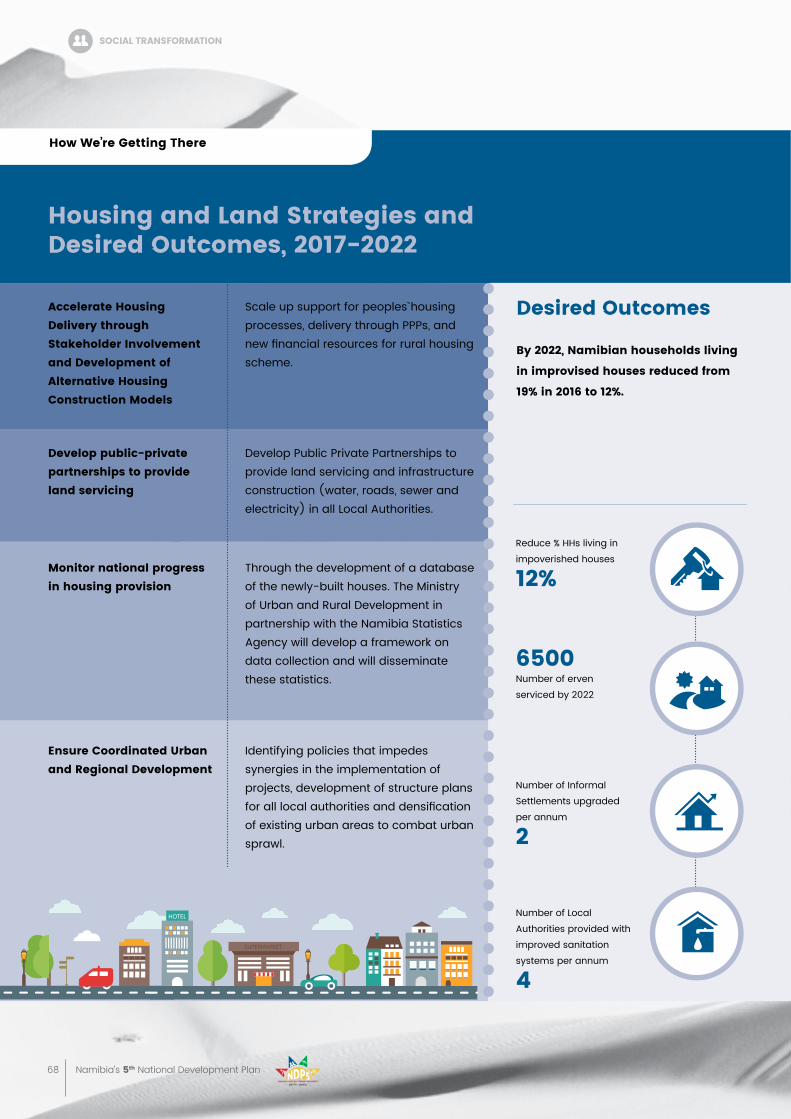
68 Namibia’s 5th National Development Plan
housing and land strategies and Desired outcomes, 2017-2022
accelerate housing Delivery through stakeholder involvement and Development of alternative housing Construction models
Develop public-private partnerships to provide land servicing
monitor national progress in housing provision
ensure Coordinated urban and regional Development
Scale up support for peoples ̀housing processes, delivery through PPPs, and new financial resources for rural housing scheme.
Develop Public Private Partnerships to provide land servicing and infrastructure construction (water, roads, sewer and electricity) in all Local Authorities.
Through the development of a database of the newly-built houses. The Ministry of Urban and Rural Development in partnership with the Namibia Statistics Agency will develop a framework on data collection and will disseminate these statistics.
Identifying policies that impedes synergies in the implementation of projects, development of structure plans for all local authorities and densification of existing urban areas to combat urban sprawl.
how We’re getting there
Desired outcomes
by 2022, Namibian households living
in improvised houses reduced from
19% in 2016 to 12%.
Reduce % HHs living in impoverished houses
12%
6500Number of erven serviced by 2022
Number of Informal Settlements upgraded per annum
2
Number of Local Authorities provided with improved sanitation systems per annum
4
soCial traNsFormatioN
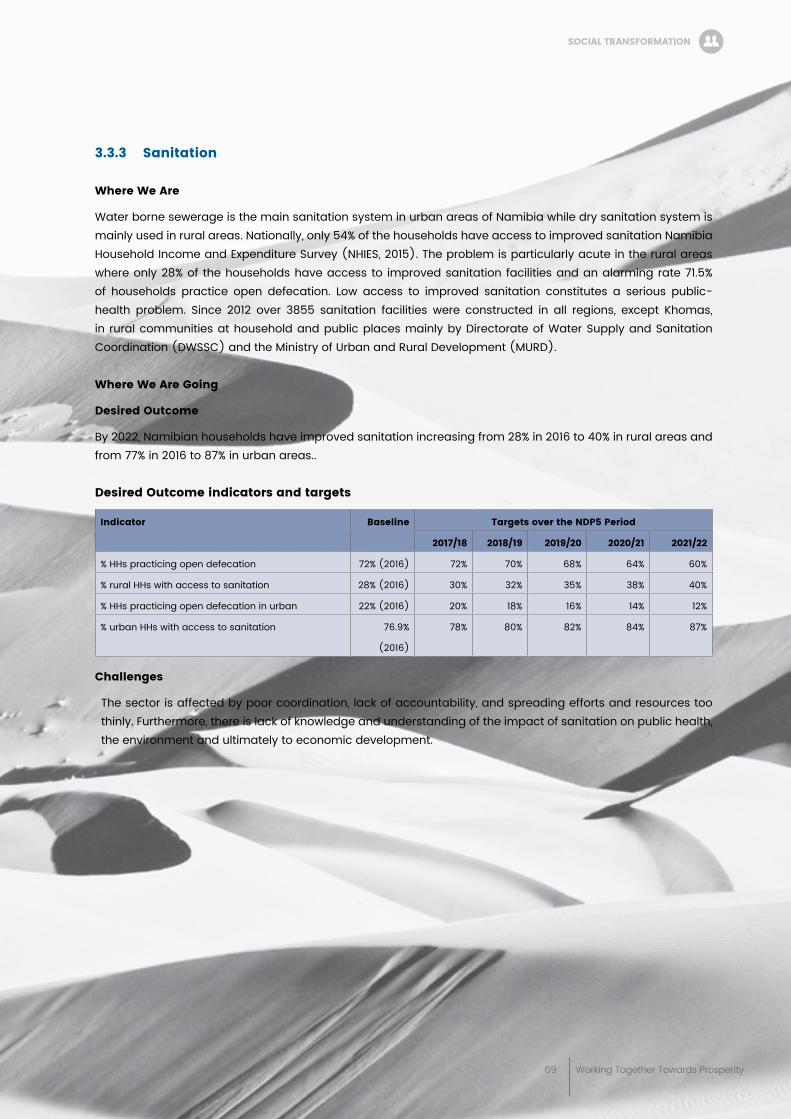
69 Working Together Towards Prosperity
3.3.3 sanitation
Where We are
Water borne sewerage is the main sanitation system in urban areas of Namibia while dry sanitation system is mainly used in rural areas. Nationally, only 54% of the households have access to improved sanitation Namibia Household Income and Expenditure Survey (NHIES, 2015). The problem is particularly acute in the rural areas where only 28% of the households have access to improved sanitation facilities and an alarming rate 71.5% of households practice open defecation. Low access to improved sanitation constitutes a serious public-health problem. Since 2012 over 3855 sanitation facilities were constructed in all regions, except Khomas, in rural communities at household and public places mainly by Directorate of Water Supply and Sanitation Coordination (DWSSC) and the Ministry of Urban and Rural Development (MURD).
Where We are going
Desired outcome
By 2022, Namibian households have improved sanitation increasing from 28% in 2016 to 40% in rural areas and from 77% in 2016 to 87% in urban areas..
Desired outcome indicators and targets
indicator baseline targets over the NDp5 period
2017/18 2018/19 2019/20 2020/21 2021/22
% HHs practicing open defecation 72% (2016) 72% 70% 68% 64% 60%
% rural HHs with access to sanitation 28% (2016) 30% 32% 35% 38% 40%
% HHs practicing open defecation in urban 22% (2016) 20% 18% 16% 14% 12%
% urban HHs with access to sanitation 76.9%
(2016)
78% 80% 82% 84% 87%
Challenges
The sector is affected by poor coordination, lack of accountability, and spreading efforts and resources too thinly. Furthermore, there is lack of knowledge and understanding of the impact of sanitation on public health, the environment and ultimately to economic development.
soCial traNsFormatioN
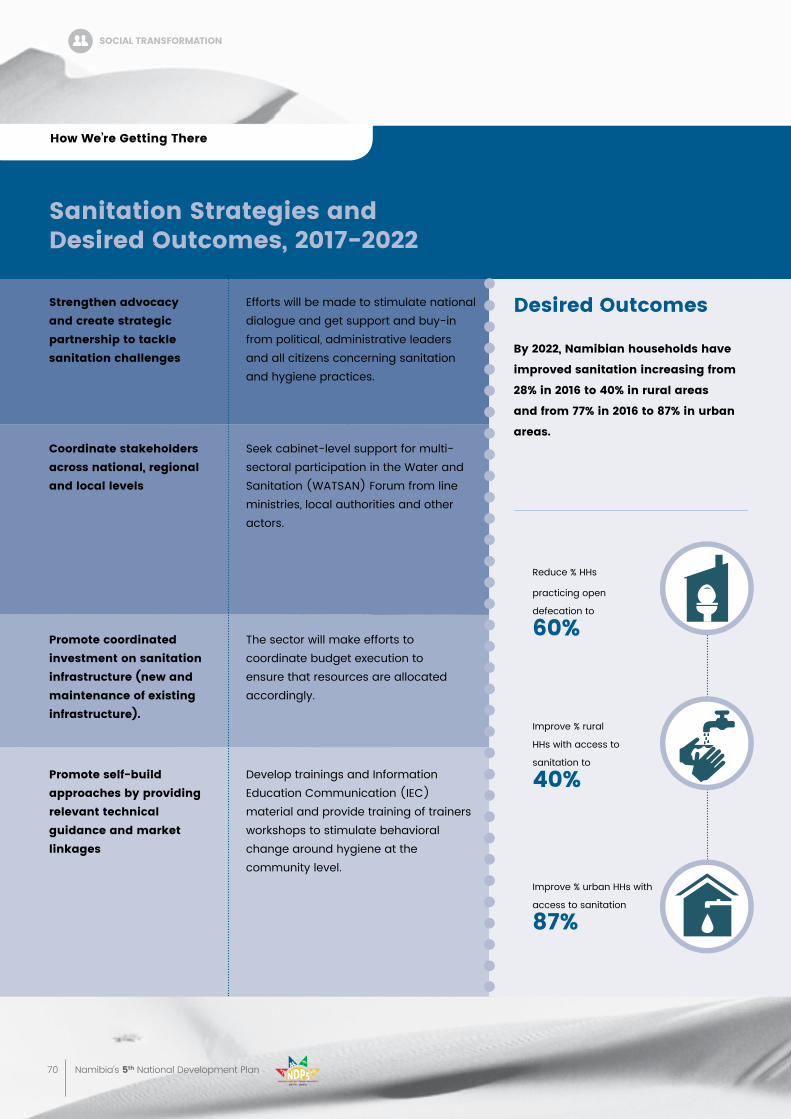
70 Namibia’s 5th National Development Plan
sanitation strategies and Desired outcomes, 2017-2022
strengthen advocacy and create strategic partnership to tackle sanitation challenges
Coordinate stakeholders across national, regional and local levels
promote coordinated investment on sanitation infrastructure (new and maintenance of existing infrastructure).
promote self-build approaches by providing relevant technical guidance and market linkages
Efforts will be made to stimulate national dialogue and get support and buy-in from political, administrative leaders and all citizens concerning sanitation and hygiene practices.
Seek cabinet-level support for multi-sectoral participation in the Water and Sanitation (WATSAN) Forum from line ministries, local authorities and other actors.
The sector will make efforts to coordinate budget execution to ensure that resources are allocated accordingly.
Develop trainings and Information Education Communication (IEC) material and provide training of trainers workshops to stimulate behavioral change around hygiene at the community level.
Desired outcomes
by 2022, Namibian households have
improved sanitation increasing from
28% in 2016 to 40% in rural areas
and from 77% in 2016 to 87% in urban
areas.
how We’re getting there
Improve % rural
HHs with access to
sanitation to
40%
Reduce % HHs
practicing open
defecation to
60%
Improve % urban HHs with
access to sanitation
87%
soCial traNsFormatioN
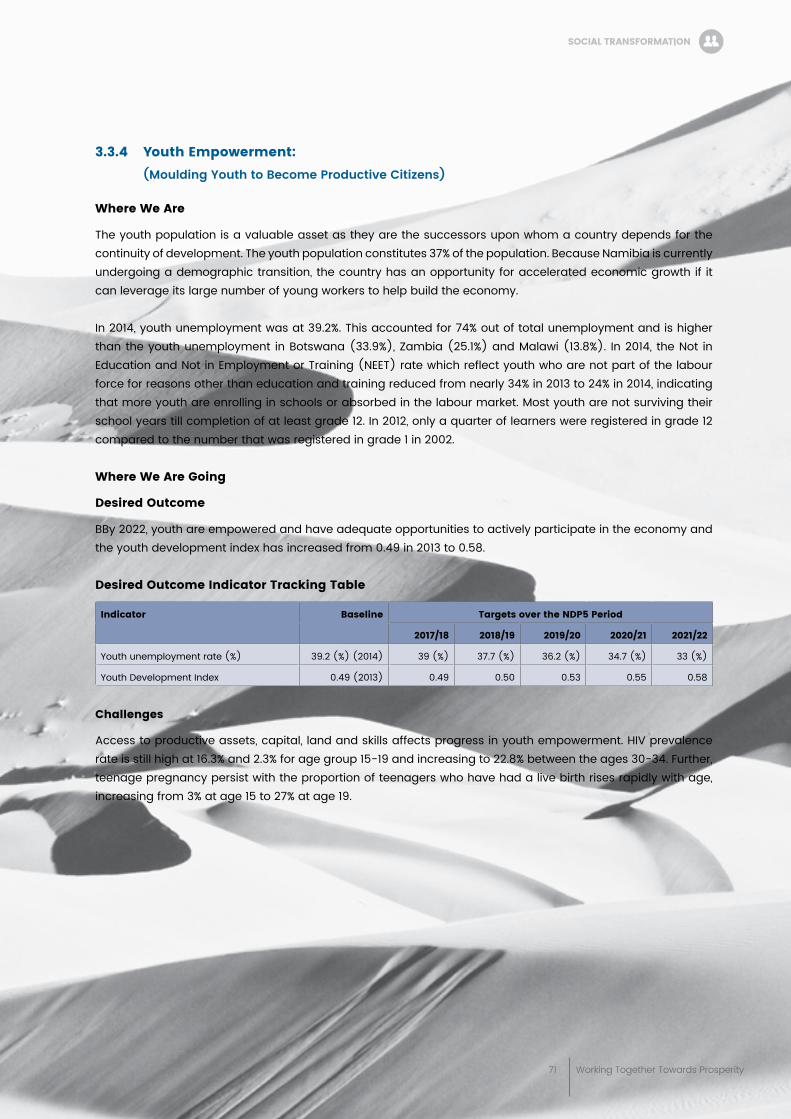
71 Working Together Towards Prosperity
3.3.4 Youth empowerment: (Moulding Youth to Become Productive Citizens)
Where We are
The youth population is a valuable asset as they are the successors upon whom a country depends for the continuity of development. The youth population constitutes 37% of the population. Because Namibia is currently undergoing a demographic transition, the country has an opportunity for accelerated economic growth if it can leverage its large number of young workers to help build the economy.
In 2014, youth unemployment was at 39.2%. This accounted for 74% out of total unemployment and is higher than the youth unemployment in Botswana (33.9%), Zambia (25.1%) and Malawi (13.8%). In 2014, the Not in Education and Not in Employment or Training (NEET) rate which reflect youth who are not part of the labour force for reasons other than education and training reduced from nearly 34% in 2013 to 24% in 2014, indicating that more youth are enrolling in schools or absorbed in the labour market. Most youth are not surviving their school years till completion of at least grade 12. In 2012, only a quarter of learners were registered in grade 12 compared to the number that was registered in grade 1 in 2002.
Where We are going
Desired outcome
BBy 2022, youth are empowered and have adequate opportunities to actively participate in the economy and the youth development index has increased from 0.49 in 2013 to 0.58.
Desired outcome indicator tracking table
indicator baseline targets over the NDp5 period
2017/18 2018/19 2019/20 2020/21 2021/22
Youth unemployment rate (%) 39.2 (%) (2014) 39 (%) 37.7 (%) 36.2 (%) 34.7 (%) 33 (%)
Youth Development Index 0.49 (2013) 0.49 0.50 0.53 0.55 0.58
Challenges
Access to productive assets, capital, land and skills affects progress in youth empowerment. HIV prevalence rate is still high at 16.3% and 2.3% for age group 15-19 and increasing to 22.8% between the ages 30-34. Further, teenage pregnancy persist with the proportion of teenagers who have had a live birth rises rapidly with age, increasing from 3% at age 15 to 27% at age 19.
soCial traNsFormatioN
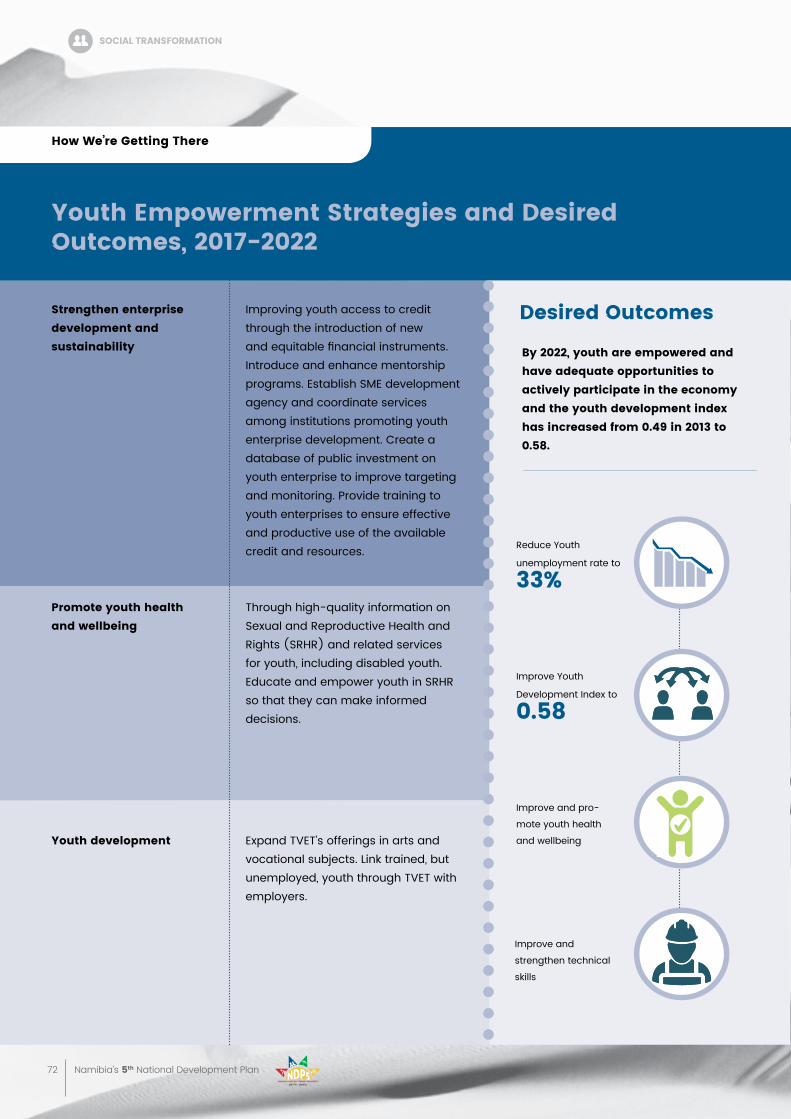
72 Namibia’s 5th National Development Plan
Youth empowerment strategies and Desired outcomes, 2017-2022
strengthen enterprise development and sustainability
Improving youth access to credit through the introduction of new and equitable financial instruments. Introduce and enhance mentorship programs. Establish SME development agency and coordinate services among institutions promoting youth enterprise development. Create a database of public investment on youth enterprise to improve targeting and monitoring. Provide training to youth enterprises to ensure effective and productive use of the available credit and resources.
promote youth health and wellbeing
Through high-quality information on Sexual and Reproductive Health and Rights (SRHR) and related services for youth, including disabled youth. Educate and empower youth in SRHR so that they can make informed decisions.
Youth development Expand TVET’s offerings in arts and vocational subjects. Link trained, but unemployed, youth through TVET with employers.
Desired outcomes
by 2022, youth are empowered and have adequate opportunities to actively participate in the economy and the youth development index has increased from 0.49 in 2013 to 0.58.
how We’re getting there
Reduce Youth
unemployment rate to
33%
Improve Youth
Development Index to
0.58
Improve and pro-
mote youth health
and wellbeing
Improve and
strengthen technical
skills
soCial traNsFormatioN
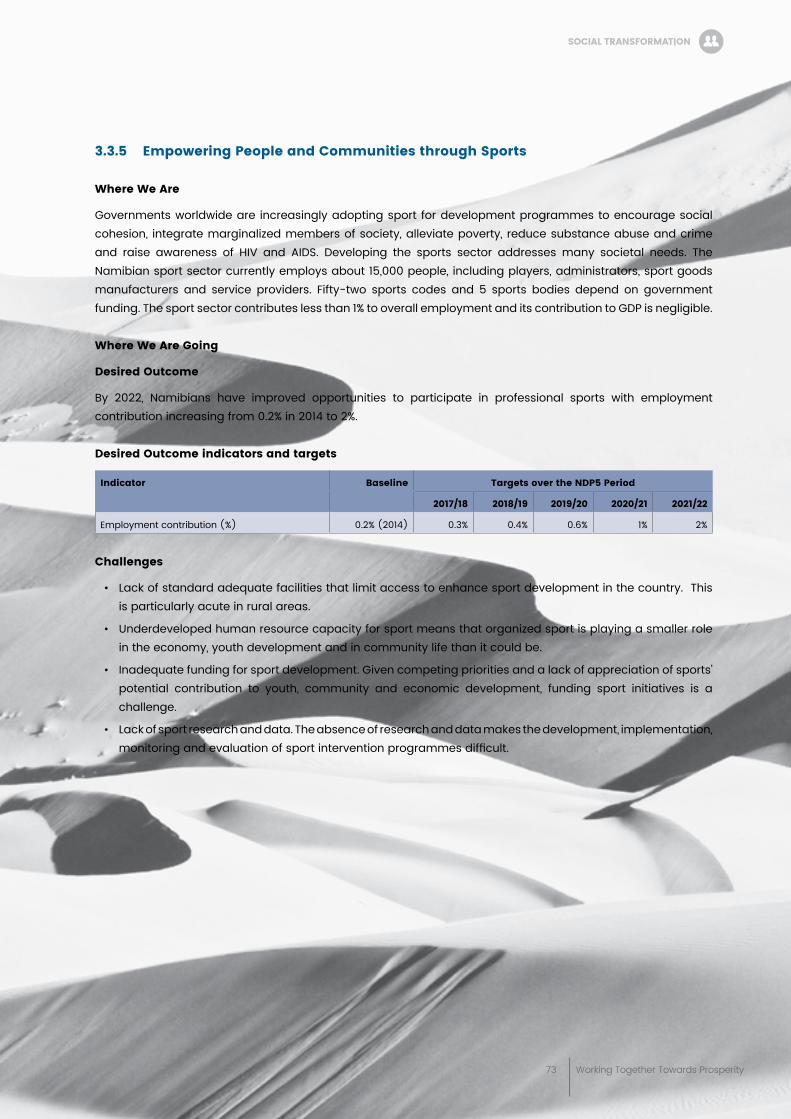
73 Working Together Towards Prosperity
3.3.5 empowering people and Communities through sports
Where We are
Governments worldwide are increasingly adopting sport for development programmes to encourage social cohesion, integrate marginalized members of society, alleviate poverty, reduce substance abuse and crime and raise awareness of HIV and AIDS. Developing the sports sector addresses many societal needs. The Namibian sport sector currently employs about 15,000 people, including players, administrators, sport goods manufacturers and service providers. Fifty-two sports codes and 5 sports bodies depend on government funding. The sport sector contributes less than 1% to overall employment and its contribution to GDP is negligible.
Where We are going
Desired outcome
By 2022, Namibians have improved opportunities to participate in professional sports with employment contribution increasing from 0.2% in 2014 to 2%.
Desired outcome indicators and targets
indicator baseline targets over the NDp5 period
2017/18 2018/19 2019/20 2020/21 2021/22
Employment contribution (%) 0.2% (2014) 0.3% 0.4% 0.6% 1% 2%
Challenges
• Lack of standard adequate facilities that limit access to enhance sport development in the country. This is particularly acute in rural areas.
• Underdeveloped human resource capacity for sport means that organized sport is playing a smaller role in the economy, youth development and in community life than it could be.
• Inadequate funding for sport development. Given competing priorities and a lack of appreciation of sports’ potential contribution to youth, community and economic development, funding sport initiatives is a challenge.
• Lack of sport research and data. The absence of research and data makes the development, implementation, monitoring and evaluation of sport intervention programmes difficult.
soCial traNsFormatioN
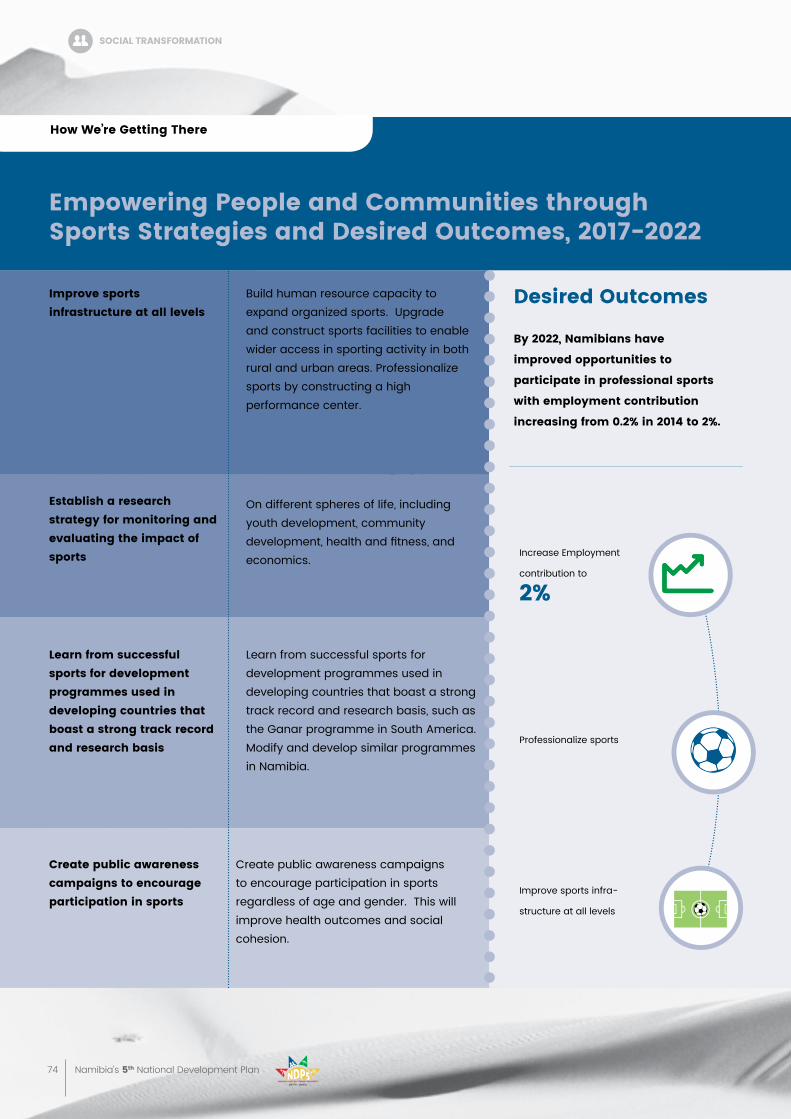
74 Namibia’s 5th National Development Plan
empowering people and Communities through sports strategies and Desired outcomes, 2017-2022
improve sports infrastructure at all levels
establish a research strategy for monitoring and evaluating the impact of sports
learn from successful sports for development programmes used in developing countries that boast a strong track record and research basis
Create public awareness campaigns to encourage participation in sports
Build human resource capacity to expand organized sports. Upgrade and construct sports facilities to enable wider access in sporting activity in both rural and urban areas. Professionalize sports by constructing a high performance center.
On different spheres of life, including youth development, community development, health and fitness, and economics.
Learn from successful sports for development programmes used in developing countries that boast a strong track record and research basis, such as the Ganar programme in South America. Modify and develop similar programmes in Namibia.
Create public awareness campaigns to encourage participation in sports regardless of age and gender. This will improve health outcomes and social cohesion.
Desired outcomes
by 2022, Namibians have
improved opportunities to
participate in professional sports
with employment contribution
increasing from 0.2% in 2014 to 2%.
how We’re getting there
Increase Employment
contribution to
2%
Professionalize sports
Improve sports infra-
structure at all levels
soCial traNsFormatioN
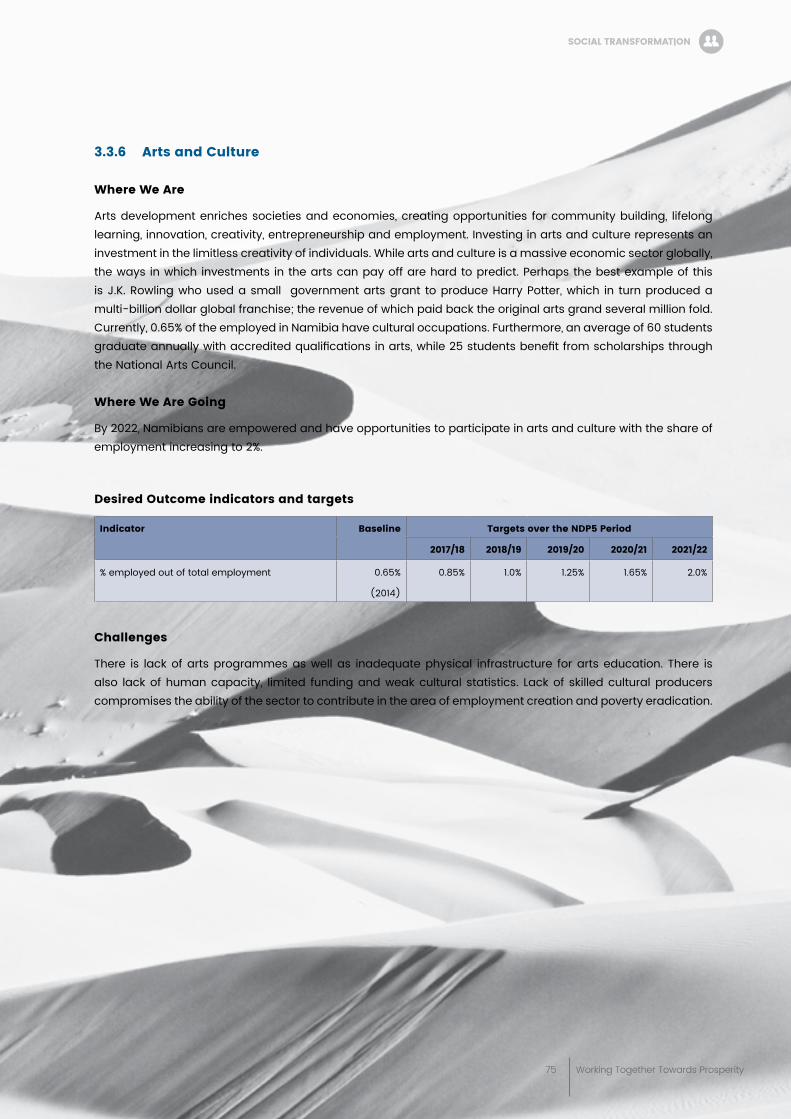
75 Working Together Towards Prosperity
3.3.6 arts and Culture
Where We are
Arts development enriches societies and economies, creating opportunities for community building, lifelong learning, innovation, creativity, entrepreneurship and employment. Investing in arts and culture represents an investment in the limitless creativity of individuals. While arts and culture is a massive economic sector globally, the ways in which investments in the arts can pay off are hard to predict. Perhaps the best example of this is J.K. Rowling who used a small government arts grant to produce Harry Potter, which in turn produced a multi-billion dollar global franchise; the revenue of which paid back the original arts grand several million fold. Currently, 0.65% of the employed in Namibia have cultural occupations. Furthermore, an average of 60 students graduate annually with accredited qualifications in arts, while 25 students benefit from scholarships through the National Arts Council.
Where We are going
By 2022, Namibians are empowered and have opportunities to participate in arts and culture with the share of employment increasing to 2%.
Desired outcome indicators and targets
indicator baseline targets over the NDp5 period
2017/18 2018/19 2019/20 2020/21 2021/22
% employed out of total employment 0.65%
(2014)
0.85% 1.0% 1.25% 1.65% 2.0%
Challenges
There is lack of arts programmes as well as inadequate physical infrastructure for arts education. There is also lack of human capacity, limited funding and weak cultural statistics. Lack of skilled cultural producers compromises the ability of the sector to contribute in the area of employment creation and poverty eradication.
soCial traNsFormatioN
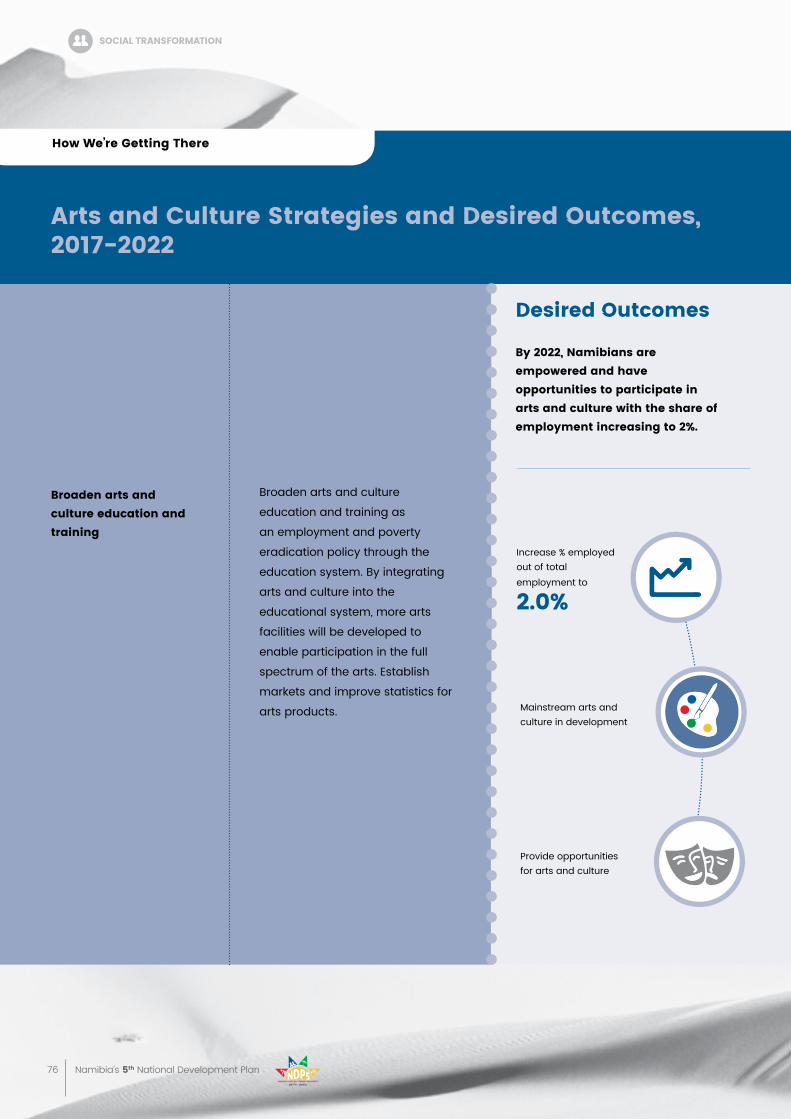
76 Namibia’s 5th National Development Plan
arts and Culture strategies and Desired outcomes, 2017-2022
broaden arts and culture education and training
Broaden arts and culture
education and training as
an employment and poverty
eradication policy through the
education system. By integrating
arts and culture into the
educational system, more arts
facilities will be developed to
enable participation in the full
spectrum of the arts. Establish
markets and improve statistics for
arts products.
Desired outcomes
by 2022, Namibians are empowered and have opportunities to participate in arts and culture with the share of employment increasing to 2%.
how We’re getting there
Provide opportunities for arts and culture
Increase % employed out of total employment to
2.0%
Mainstream arts and culture in development
soCial traNsFormatioN
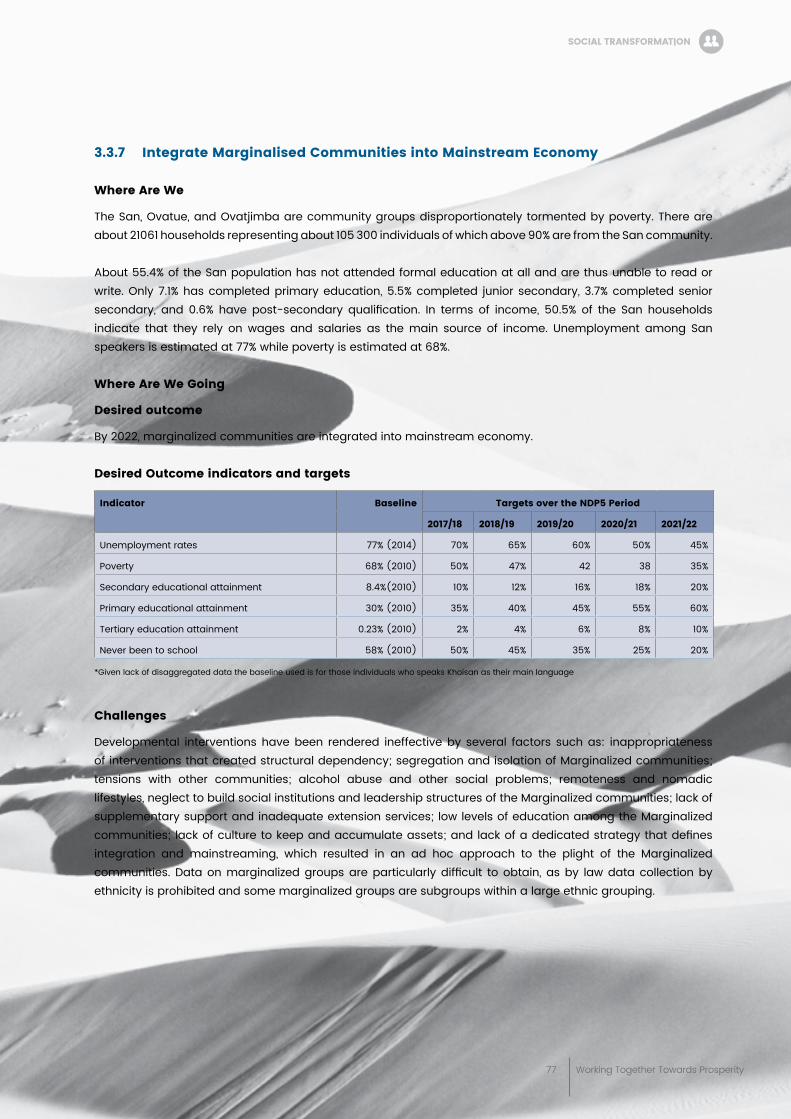
77 Working Together Towards Prosperity
3.3.7 integrate marginalised Communities into mainstream economy
Where are We
The San, Ovatue, and Ovatjimba are community groups disproportionately tormented by poverty. There are about 21061 households representing about 105 300 individuals of which above 90% are from the San community.
About 55.4% of the San population has not attended formal education at all and are thus unable to read or write. Only 7.1% has completed primary education, 5.5% completed junior secondary, 3.7% completed senior secondary, and 0.6% have post-secondary qualification. In terms of income, 50.5% of the San households indicate that they rely on wages and salaries as the main source of income. Unemployment among San speakers is estimated at 77% while poverty is estimated at 68%.
Where are We going
Desired outcome
By 2022, marginalized communities are integrated into mainstream economy.
Desired outcome indicators and targets
indicator baseline targets over the NDp5 period
2017/18 2018/19 2019/20 2020/21 2021/22
Unemployment rates 77% (2014) 70% 65% 60% 50% 45%
Poverty 68% (2010) 50% 47% 42 38 35%
Secondary educational attainment 8.4%(2010) 10% 12% 16% 18% 20%
Primary educational attainment 30% (2010) 35% 40% 45% 55% 60%
Tertiary education attainment 0.23% (2010) 2% 4% 6% 8% 10%
Never been to school 58% (2010) 50% 45% 35% 25% 20%
*Given lack of disaggregated data the baseline used is for those individuals who speaks Khoisan as their main language
Challenges
Developmental interventions have been rendered ineffective by several factors such as: inappropriateness of interventions that created structural dependency; segregation and isolation of Marginalized communities; tensions with other communities; alcohol abuse and other social problems; remoteness and nomadic lifestyles, neglect to build social institutions and leadership structures of the Marginalized communities; lack of supplementary support and inadequate extension services; low levels of education among the Marginalized communities; lack of culture to keep and accumulate assets; and lack of a dedicated strategy that defines integration and mainstreaming, which resulted in an ad hoc approach to the plight of the Marginalized communities. Data on marginalized groups are particularly difficult to obtain, as by law data collection by ethnicity is prohibited and some marginalized groups are subgroups within a large ethnic grouping.
soCial traNsFormatioN
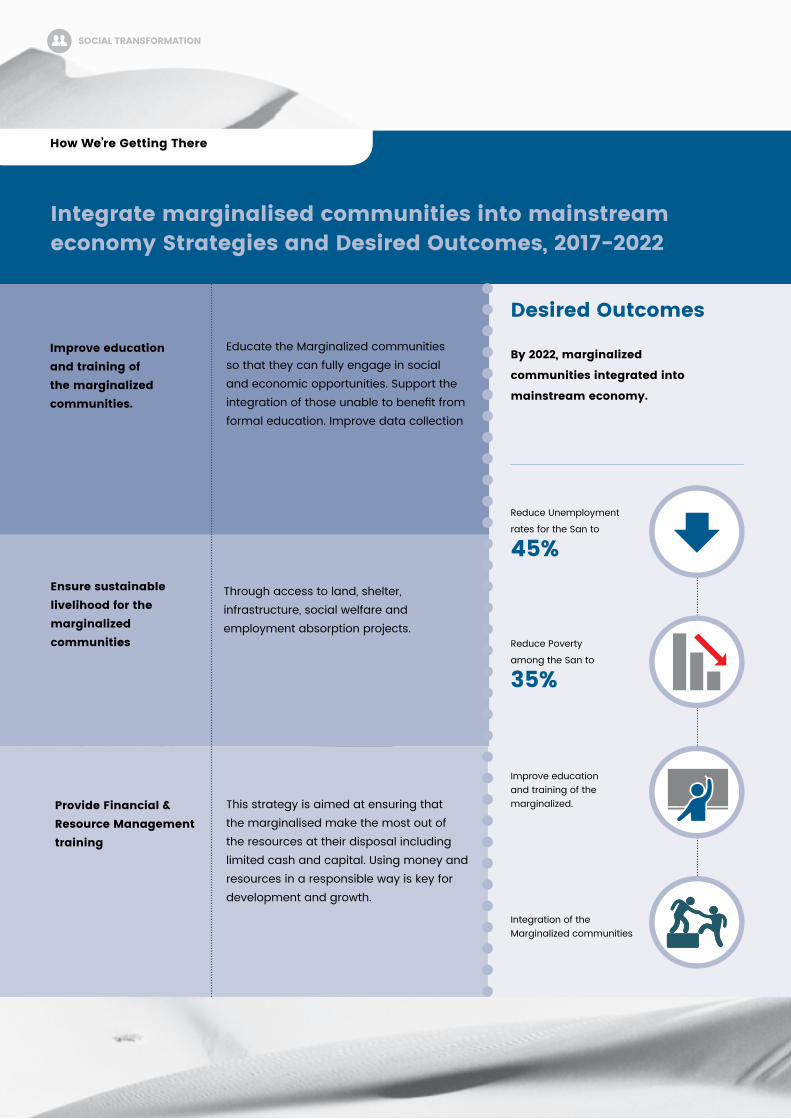
78 Namibia’s 5th National Development Plan
integrate marginalised communities into mainstream economy strategies and Desired outcomes, 2017-2022
improve education and training of the marginalized communities.
ensure sustainable livelihood for the marginalized communities
provide Financial & resource management training
Educate the Marginalized communities so that they can fully engage in social and economic opportunities. Support the integration of those unable to benefit from formal education. Improve data collection
Through access to land, shelter, infrastructure, social welfare and employment absorption projects.
This strategy is aimed at ensuring that the marginalised make the most out of the resources at their disposal including limited cash and capital. Using money and resources in a responsible way is key for development and growth.
Desired outcomes
by 2022, marginalized
communities integrated into
mainstream economy.
how We’re getting there
Reduce Unemployment
rates for the San to
45%
Reduce Poverty
among the San to
35%
Improve education and training of the marginalized.
Integration of the Marginalized communities
soCial traNsFormatioN

80 Namibia’s 5th National Development Plan
81 Working Together Towards Prosperity
eNviroNmeNtal sustaiNabilitY
4
eNsure sustaiNable eNviroNmeNt aND eNhaNCe resilieNCe
• Conservation and Sustainable Use of Natural
Resources
• Environmental Management and Climate
Change
overview
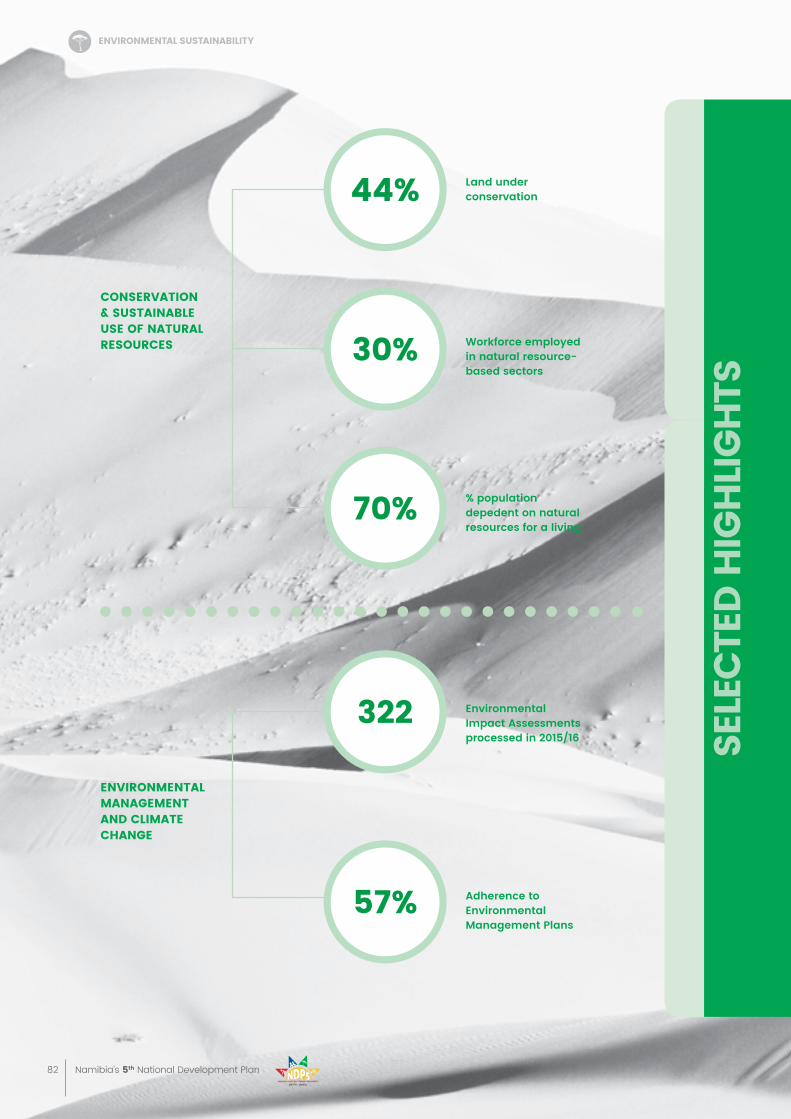
82 Namibia’s 5th National Development Plan
sele
Cte
D h
igh
lig
hts
Land under conservation
Workforce employed in natural resource-based sectors
% population depedent on natural resources for a living
CoNservatioN & sustaiNable use oF Natural resourCes
44%
70%
30%
eNviroNmeNtal sustaiNabilitY
Environmental Impact Assessmentsprocessed in 2015/16
Adherence to Environmental Management Plans
322
57%
eNviroNmeNtal maNagemeNt aND Climate ChaNge
83 Working Together Towards Prosperity
sele
Cte
D h
igh
lig
hts
4.1 Conservation and sustainable use of Natural resources
Where We are
Namibia is endowed with abundant natural resources such as wildlife, fisheries, forestry, minerals as well as a solar and wind regime that is suitable for renewable energy. Natural resource-based sectors are among the largest contributors to GDP and they employ more than 30% of the country’s workforce. Around 70% of Namibia’s population is directly dependent on the natural resource base for income, food, medicinal and health needs, fuel and shelter.
In order to ensure the conservation and sustainable utilization of wildlife and other natural resources, approximately 44% of the country’s land mass is under some form of conservation management. Namibia continues to champion high levels of community participation in the management of their natural resources which has led to an increase of communal conservancies from 66 in 2012 to 82 in 2016, covering over 54% of the communal lands. Community conservation generated approximately N$91.2 million for local communities and has facilitated the creation of 5,808 jobs in 2014, benefiting about 170,000 local community members. However, poaching, human wildlife conflict and the unsustainable utilization of natural resources are threats to environmental sustainability
Where We are going
By 2022, Namibia is sustainably managing her natural resources.
Desired outcome indicators and targets
indicator baseline targets over the NDp5 period
2017/18 2018/19 2019/20 2020/21 2021/22
Annual revenue generated from protected areas and CBNRM Programme
N$147.4 million (2014)
N$169.5 million
N$194.9 million
N$224.1 million
N$257.7 million
N$296.3 million
% reduction in cases of poaching 27% (2017) 25% 20% 15% 10% 5%
Total area burned by veld fires reduced 3.7 Mil ha
(2015)3.2 2.8 2.3 1.8 1.3
Challenges
• Population growth and industrialization – leading to a higher demand for natural resources and services resulting in increased volumes and types of waste and pollution. The expansion of mining and prospecting activities and associated infrastructural development cause habitat loss and destruction, especially in ecologically sensitive areas.
• Sustainability of Community Based Natural Resource Management (CBNRM) Programme – The majority of conservancies and community forests are not optimally attaining the intended benefits. A fragmented legislative framework and weak coordination between institutions responsible for the management of natural resources (fauna, flora, water, land) has resulted in under performance of the CBNRM programme.
• Inadequate resources to manage wildlife crime and illegal harvesting of natural resources: Poaching and illegal trade of wildlife and other natural resource products are on the increase. There is limited manpower to enforce legislation, poor and inadequate infrastructure and equipment pose challenges to address wildlife crime and illegal harvesting of natural resources.
• Human wildlife conflict: The coexistence of human and wildlife is a growing challenge, requiring management and adaptation.
• Insufficient value addition and beneficiation to communities from biodiversity including plants, animals and fisheries resources.
eNviroNmeNtal sustaiNabilitY
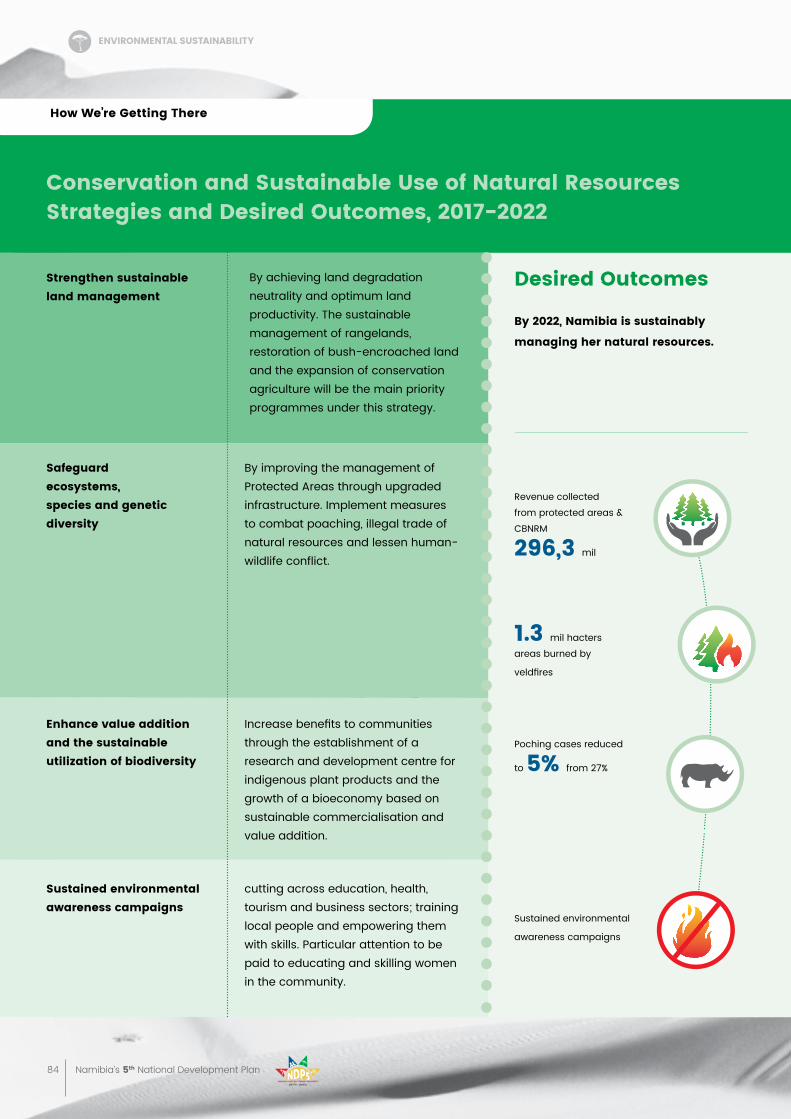
84 Namibia’s 5th National Development Plan
Conservation and sustainable use of Natural resources
strategies and Desired outcomes, 2017-2022
strengthen sustainable land management
By achieving land degradation neutrality and optimum land productivity. The sustainable management of rangelands, restoration of bush-encroached land and the expansion of conservation agriculture will be the main priority programmes under this strategy.
safeguard ecosystems, species and genetic diversity
By improving the management of Protected Areas through upgraded infrastructure. Implement measures to combat poaching, illegal trade of natural resources and lessen human-wildlife conflict.
enhance value addition and the sustainable utilization of biodiversity
sustained environmental awareness campaigns
Increase benefits to communities through the establishment of a research and development centre for indigenous plant products and the growth of a bioeconomy based on sustainable commercialisation and value addition.
cutting across education, health, tourism and business sectors; training local people and empowering them with skills. Particular attention to be paid to educating and skilling women in the community.
Desired outcomes
by 2022, Namibia is sustainably
managing her natural resources.
Revenue collected from protected areas & CBNRM
296,3 mil
1.3 mil hactersareas burned by
veldfires
Poching cases reduced
to 5% from 27%
Sustained environmental
awareness campaigns
how We’re getting there
eNviroNmeNtal sustaiNabilitY
85 Working Together Towards Prosperity
4.2 environmental management and Climate Change
Where We are
Namibia is one of the most vulnerable countries in the world to climate change. Climate variability over the medium and long term is likely to further reduce the productivity of agricultural land, fisheries, and forestry and threatens the growth of the tourist sector.
The demands for Environmental Impact Assessments (EIAs) increased during the NDP4 period. Approximately 322 EIAs were processed in 2015/16 compared to 120 in 2012/13. There is however limited capacity in place to enforce and inspect adherence to Environmental Management Plans (EMPs) with 57% compliance. With industrialization on the increase and towns growing faster than ever before, the management of waste and pollution has become a serious concern.
Climate change presents Namibia with an incentive to move towards low-carbon and climate-resilient development. This transition must include the sectors of energy, transport, industrial production, agriculture, water and waste management.
Where We are going
Desired outcome
By 2022, Namibia is sustainably managing its environment and climate resilient.
Desired outcome indicators and targets
indicator baseline targets over the NDp5 period
2017/18 2018/19 2019/20 2020/21 2021/22
Greenhouse gas emissions (30% reduction against Business As Usual (BAU) projection)
5,240 (Gg CO2 eq) (2015)
5,933 6,627 7,321 8,014 8,708 (12,441 (BAU scenario))
Number of approved waste disposal sites as per the Environmental Management Act
0 (2015) 3 6 9 12 15
% adherence to Environmental Management Plans
57% (2015) 60% 65% 70% 75% 80%
Revenue generated from environmental levies for reinvestment in environmental protection
0 (2015) N$ 60 million
N$ 90 million
N$ 120 million
N$ 140 million
N$ 160 million
Challenges
population growth and industrialization: leading to a higher demand for natural resources and services resulting in increased volumes and types of waste and pollution. The expansion of mining and prospecting activities and associated infrastructural development causes habitat loss and destruction, especially in ecologically sensitive areas (including off-shore). Mechanisms for the rehabilitation of areas degraded through mining and quarrying activities need to be developed and implemented.
Weak institutional capacity and governance mechanisms: this is evident in the implementation and enforcement of existing legislation, particularly the Environmental Management Act, which requires close inter-sectoral collaboration. It further leads to lack of resources for environmental management.
Climate change: Leading to increased droughts and flood events, resulting in reduced agricultural yields, shifts in vegetation types and species, and effects on vulnerable ecosystems. It further exacerbates the threat to the natural environment and the productivity of natural resource-based sectors.
Centralization of functions critical to environmental management: environmental management is centralized which affects service delivery and operational efficiency for sub national government.
eNviroNmeNtal sustaiNabilitY
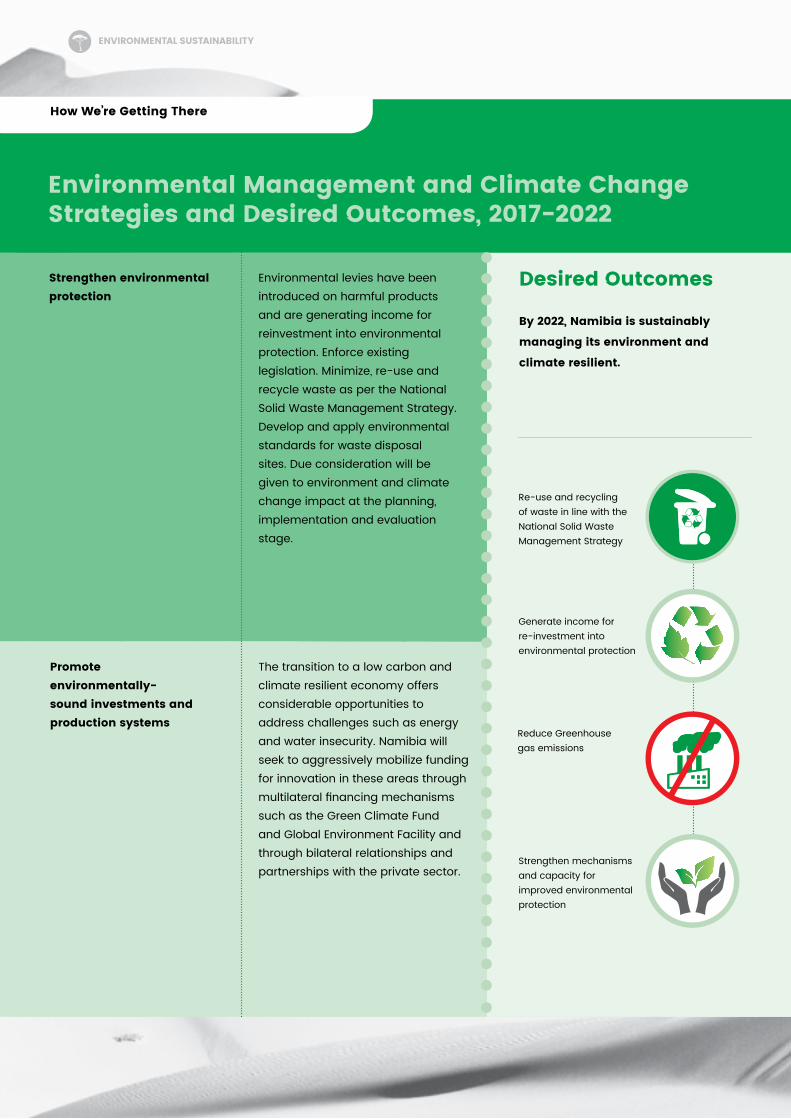
86 Namibia’s 5th National Development Plan
environmental management and Climate Change strategies and Desired outcomes, 2017-2022
strengthen environmental protection
Environmental levies have been introduced on harmful products and are generating income for reinvestment into environmental protection. Enforce existing legislation. Minimize, re-use and recycle waste as per the National Solid Waste Management Strategy. Develop and apply environmental standards for waste disposal sites. Due consideration will be given to environment and climate change impact at the planning, implementation and evaluation stage.
promote environmentally-sound investments and production systems
The transition to a low carbon and climate resilient economy offers considerable opportunities to address challenges such as energy and water insecurity. Namibia will seek to aggressively mobilize funding for innovation in these areas through multilateral financing mechanisms such as the Green Climate Fund and Global Environment Facility and through bilateral relationships and partnerships with the private sector.
Desired outcomes
by 2022, Namibia is sustainably
managing its environment and
climate resilient.
how We’re getting there
Reduce Greenhouse gas emissions
Re-use and recycling of waste in line with the National Solid Waste Management Strategy
Generate income for re-investment into environmental protection
Strengthen mechanisms and capacity for improved environmental protection
eNviroNmeNtal sustaiNabilitY


88 Namibia’s 5th National Development Plan
89 Working Together Towards Prosperity
gooD goverNaNCe
5
promote gooD goverNaNCe through eFFeCtive iNstitutioNs
• Peace, Security and Rule of Law
• Accountability and Transparency
• Public Service Performance and Service Delivery
• Statistical Development
overview
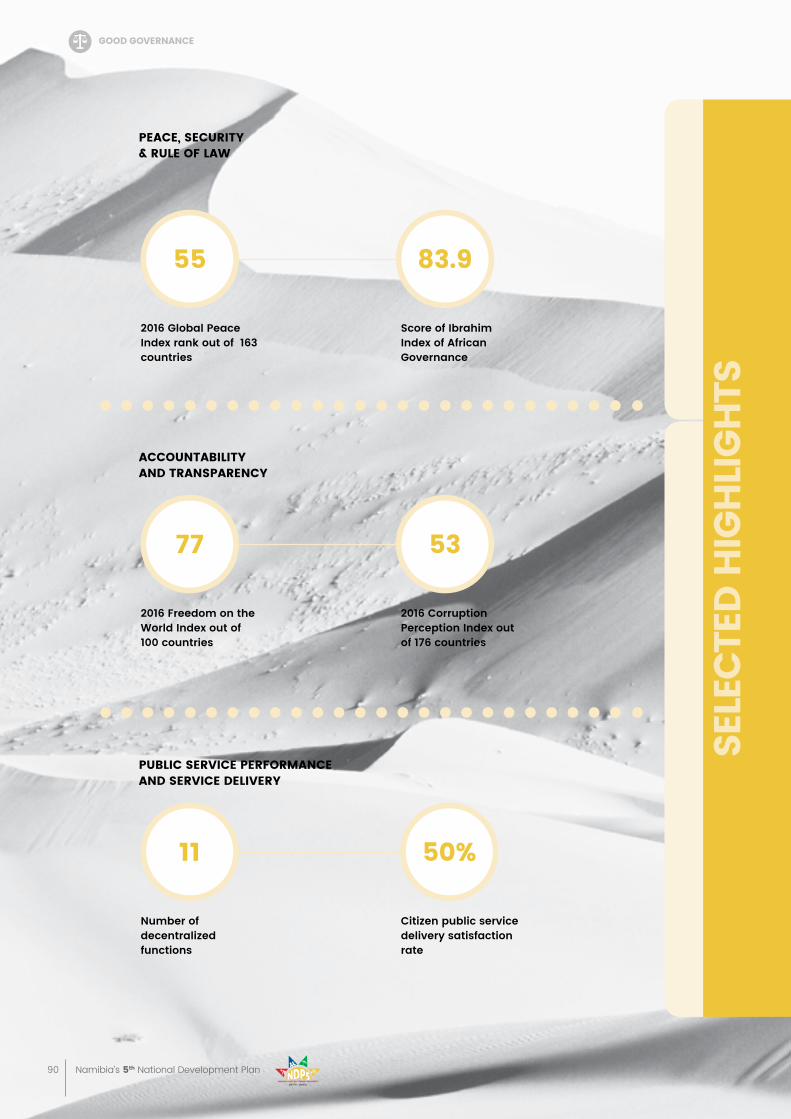
90 Namibia’s 5th National Development Plan
sele
Cte
D h
igh
lig
hts
2016 Global Peace Index rank out of 163 countries
2016 Freedom on the World Index out of 100 countries
Number of decentralized functions
Citizen public service delivery satisfaction rate
Score of Ibrahim Index of African Governance
2016 Corruption Perception Index out of 176 countries
peaCe, seCuritY & rule oF laW
aCCouNtabilitY aND traNspareNCY
publiC serviCe perFormaNCe aND serviCe DeliverY
55
77
11 50%
83.9
53
gooD goverNaNCe
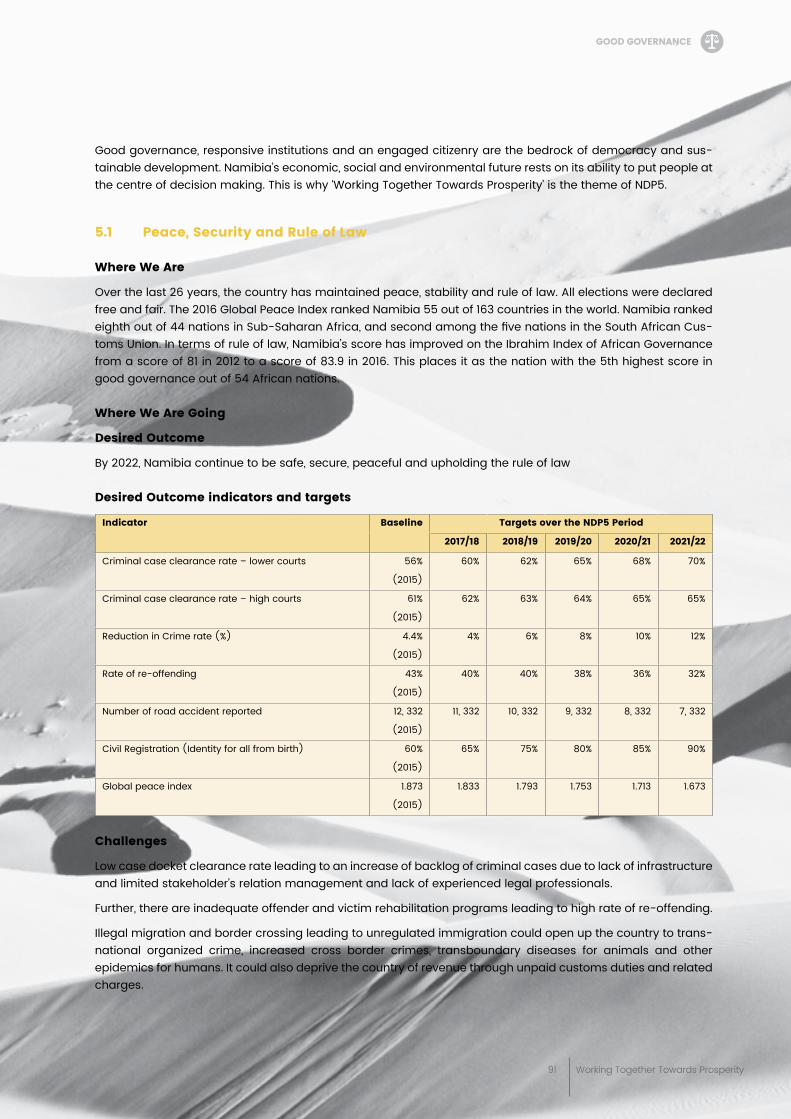
91 Working Together Towards Prosperity
sele
Cte
D h
igh
lig
hts
Good governance, responsive institutions and an engaged citizenry are the bedrock of democracy and sus-tainable development. Namibia’s economic, social and environmental future rests on its ability to put people at the centre of decision making. This is why ‘Working Together Towards Prosperity’ is the theme of NDP5.
5.1 peace, security and rule of law
Where We are
Over the last 26 years, the country has maintained peace, stability and rule of law. All elections were declared free and fair. The 2016 Global Peace Index ranked Namibia 55 out of 163 countries in the world. Namibia ranked eighth out of 44 nations in Sub-Saharan Africa, and second among the five nations in the South African Cus-toms Union. In terms of rule of law, Namibia’s score has improved on the Ibrahim Index of African Governance from a score of 81 in 2012 to a score of 83.9 in 2016. This places it as the nation with the 5th highest score in good governance out of 54 African nations.
Where We are going
Desired outcome
By 2022, Namibia continue to be safe, secure, peaceful and upholding the rule of law
Desired outcome indicators and targets
indicator
baseline targets over the NDp5 period
2017/18 2018/19 2019/20 2020/21 2021/22
Criminal case clearance rate – lower courts 56%
(2015)
60% 62% 65% 68% 70%
Criminal case clearance rate – high courts 61%
(2015)
62% 63% 64% 65% 65%
Reduction in Crime rate (%) 4.4%
(2015)
4% 6% 8% 10% 12%
Rate of re-offending 43%
(2015)
40% 40% 38% 36% 32%
Number of road accident reported 12, 332
(2015)
11, 332 10, 332 9, 332 8, 332 7, 332
Civil Registration (Identity for all from birth) 60%
(2015)
65% 75% 80% 85% 90%
Global peace index 1.873
(2015)
1.833 1.793 1.753 1.713 1.673
Challenges
Low case docket clearance rate leading to an increase of backlog of criminal cases due to lack of infrastructure and limited stakeholder’s relation management and lack of experienced legal professionals.
Further, there are inadequate offender and victim rehabilitation programs leading to high rate of re-offending.
Illegal migration and border crossing leading to unregulated immigration could open up the country to trans-national organized crime, increased cross border crimes, transboundary diseases for animals and other epidemics for humans. It could also deprive the country of revenue through unpaid customs duties and related charges.
gooD goverNaNCe
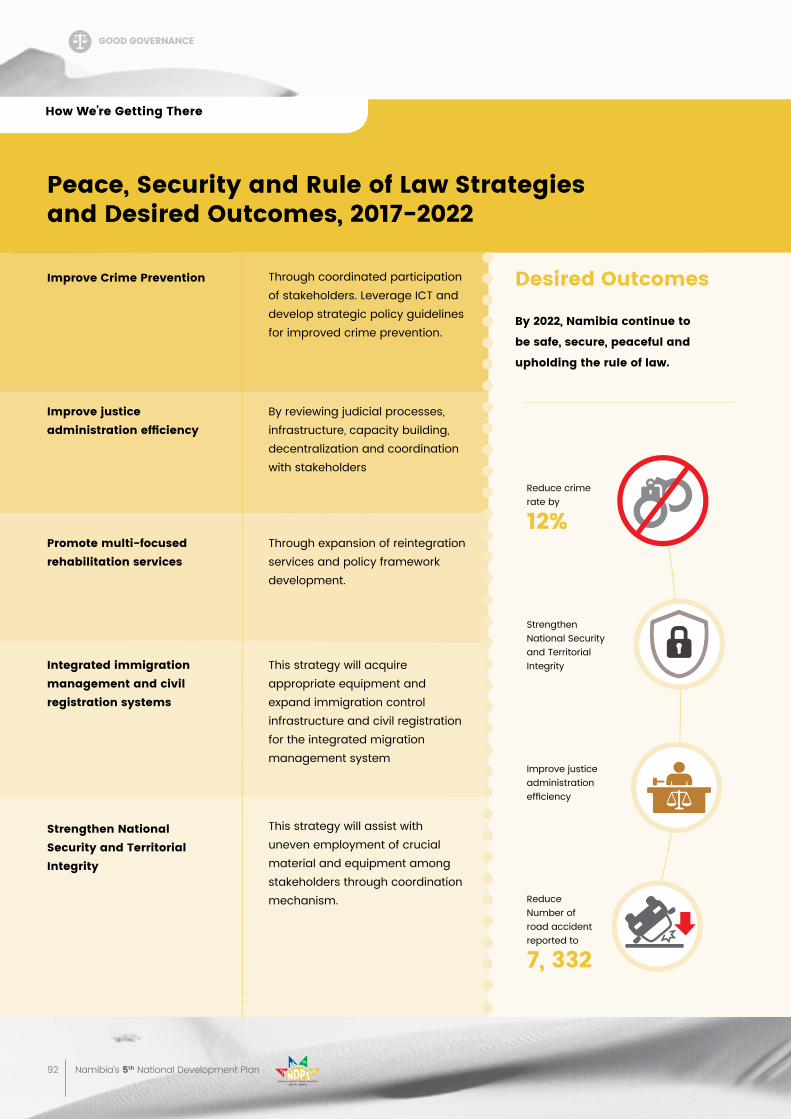
92 Namibia’s 5th National Development Plan
peace, security and rule of law strategies and Desired outcomes, 2017-2022
improve Crime prevention Through coordinated participation of stakeholders. Leverage ICT and develop strategic policy guidelines for improved crime prevention.
improve justice administrationefficiency
promote multi-focused rehabilitation services
integrated immigration management and civil registration systems
strengthen National security and territorial integrity
By reviewing judicial processes, infrastructure, capacity building, decentralization and coordination with stakeholders
Through expansion of reintegration services and policy framework development.
This strategy will acquire appropriate equipment and expand immigration control infrastructure and civil registration for the integrated migration management system
This strategy will assist with uneven employment of crucial material and equipment among stakeholders through coordination mechanism.
Desired outcomes
by 2022, Namibia continue to
be safe, secure, peaceful and
upholding the rule of law.
how We’re getting there
Reduce crime rate by
12%
Strengthen National Security and Territorial Integrity
Improve justice administration efficiency
Reduce Number of road accident reported to
7, 332
gooD goverNaNCe
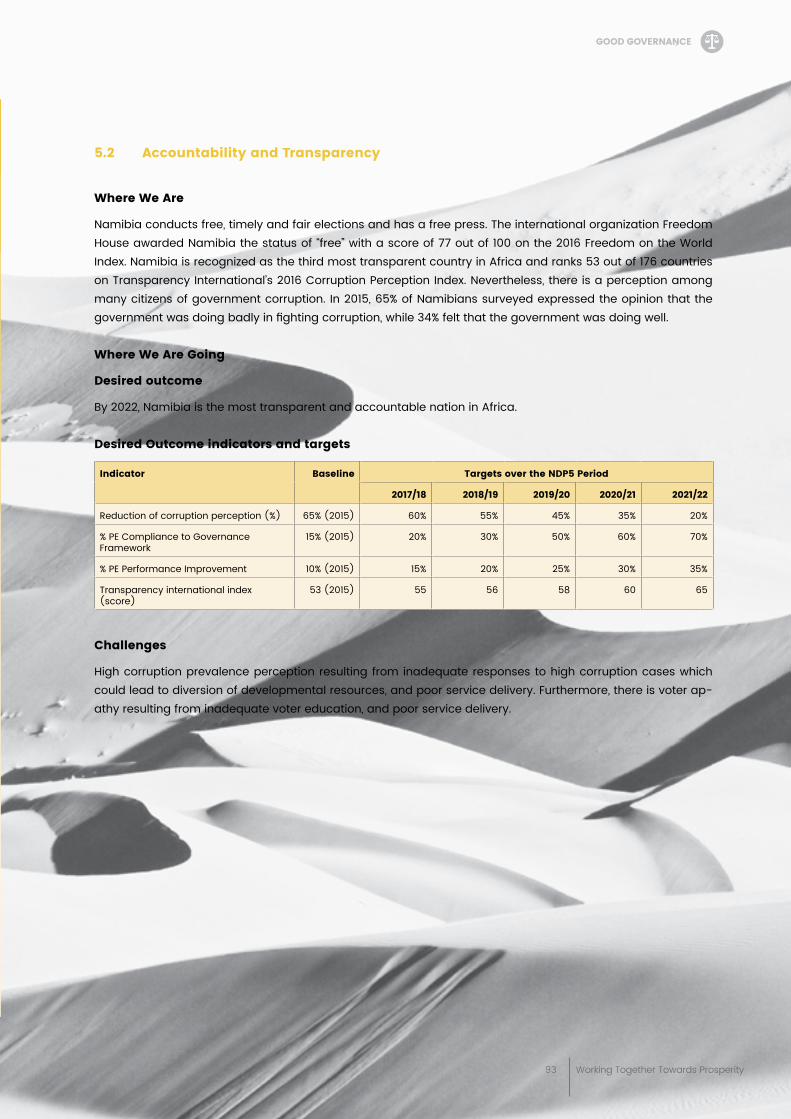
93 Working Together Towards Prosperity
5.2 accountability and transparency
Where We are
Namibia conducts free, timely and fair elections and has a free press. The international organization Freedom House awarded Namibia the status of “free” with a score of 77 out of 100 on the 2016 Freedom on the World Index. Namibia is recognized as the third most transparent country in Africa and ranks 53 out of 176 countries on Transparency International’s 2016 Corruption Perception Index. Nevertheless, there is a perception among many citizens of government corruption. In 2015, 65% of Namibians surveyed expressed the opinion that the government was doing badly in fighting corruption, while 34% felt that the government was doing well.
Where We are going
Desired outcome
By 2022, Namibia is the most transparent and accountable nation in Africa.
Desired outcome indicators and targets
indicator baseline targets over the NDp5 period
2017/18 2018/19 2019/20 2020/21 2021/22
Reduction of corruption perception (%) 65% (2015) 60% 55% 45% 35% 20%
% PE Compliance to Governance Framework
15% (2015) 20% 30% 50% 60% 70%
% PE Performance Improvement 10% (2015) 15% 20% 25% 30% 35%
Transparency international index (score)
53 (2015) 55 56 58 60 65
Challenges
High corruption prevalence perception resulting from inadequate responses to high corruption cases which could lead to diversion of developmental resources, and poor service delivery. Furthermore, there is voter ap-athy resulting from inadequate voter education, and poor service delivery.
gooD goverNaNCe
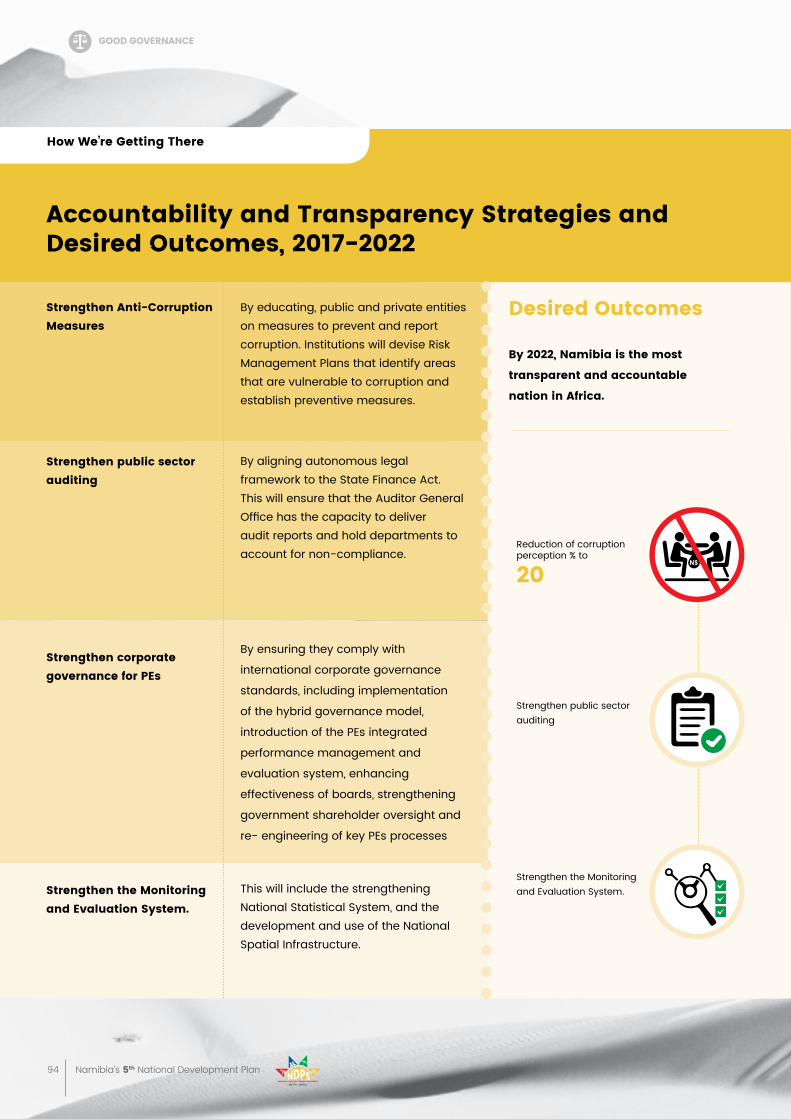
94 Namibia’s 5th National Development Plan
accountability and transparency strategies and Desired outcomes, 2017-2022
strengthen anti-Corruption measures
By educating, public and private entities on measures to prevent and report corruption. Institutions will devise Risk Management Plans that identify areas that are vulnerable to corruption and establish preventive measures.
strengthen public sector auditing
By aligning autonomous legal framework to the State Finance Act. This will ensure that the Auditor General Office has the capacity to deliver audit reports and hold departments to account for non-compliance.
This will include the strengthening National Statistical System, and the development and use of the National Spatial Infrastructure.
strengthen corporate governance for pes
strengthen the monitoring and evaluation system.
By ensuring they comply with
international corporate governance
standards, including implementation
of the hybrid governance model,
introduction of the PEs integrated
performance management and
evaluation system, enhancing
effectiveness of boards, strengthening
government shareholder oversight and
re- engineering of key PEs processes
Desired outcomes
by 2022, Namibia is the most
transparent and accountable
nation in africa.
how We’re getting there
Reduction of corruption perception % to
20
Strengthen public sector auditing
Strengthen the Monitoring and Evaluation System.
gooD goverNaNCe
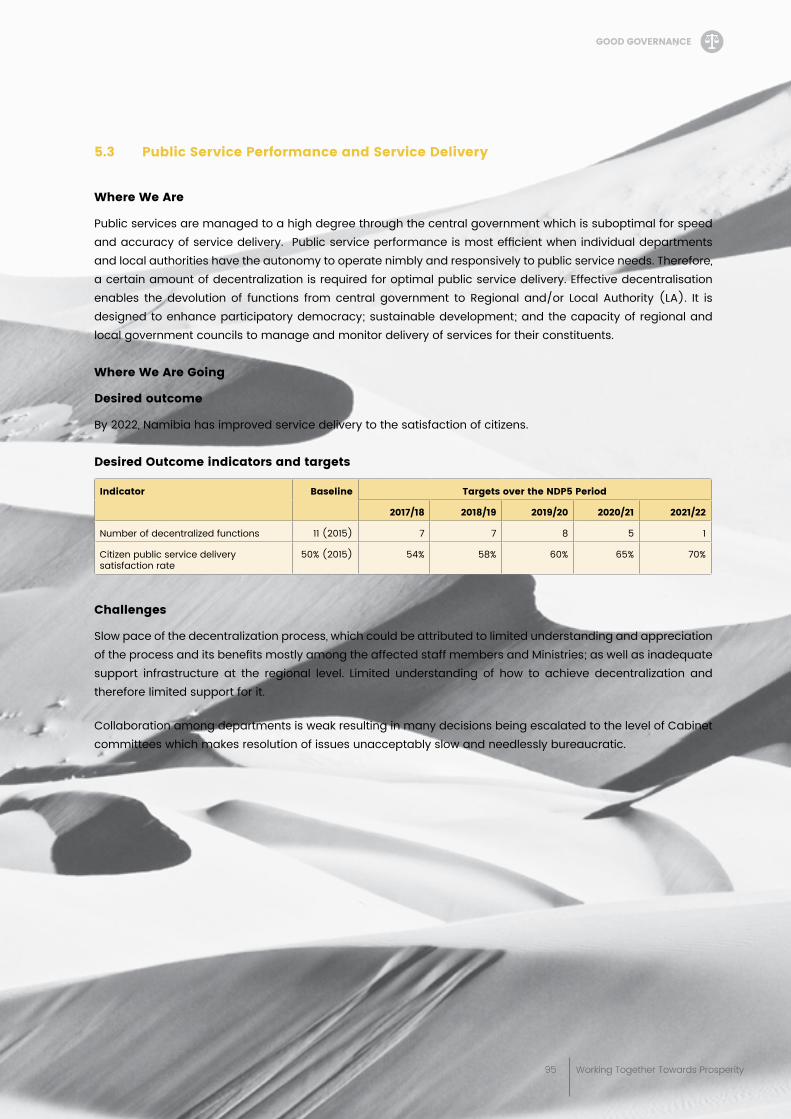
95 Working Together Towards Prosperity
5.3 public service performance and service Delivery
Where We are
Public services are managed to a high degree through the central government which is suboptimal for speed and accuracy of service delivery. Public service performance is most efficient when individual departments and local authorities have the autonomy to operate nimbly and responsively to public service needs. Therefore, a certain amount of decentralization is required for optimal public service delivery. Effective decentralisation enables the devolution of functions from central government to Regional and/or Local Authority (LA). It is designed to enhance participatory democracy; sustainable development; and the capacity of regional and local government councils to manage and monitor delivery of services for their constituents.
Where We are going
Desired outcome
By 2022, Namibia has improved service delivery to the satisfaction of citizens.
Desired outcome indicators and targets
indicator baseline targets over the NDp5 period
2017/18 2018/19 2019/20 2020/21 2021/22
Number of decentralized functions 11 (2015) 7 7 8 5 1
Citizen public service delivery satisfaction rate
50% (2015) 54% 58% 60% 65% 70%
Challenges
Slow pace of the decentralization process, which could be attributed to limited understanding and appreciation of the process and its benefits mostly among the affected staff members and Ministries; as well as inadequate support infrastructure at the regional level. Limited understanding of how to achieve decentralization and therefore limited support for it.
Collaboration among departments is weak resulting in many decisions being escalated to the level of Cabinet committees which makes resolution of issues unacceptably slow and needlessly bureaucratic.
gooD goverNaNCe
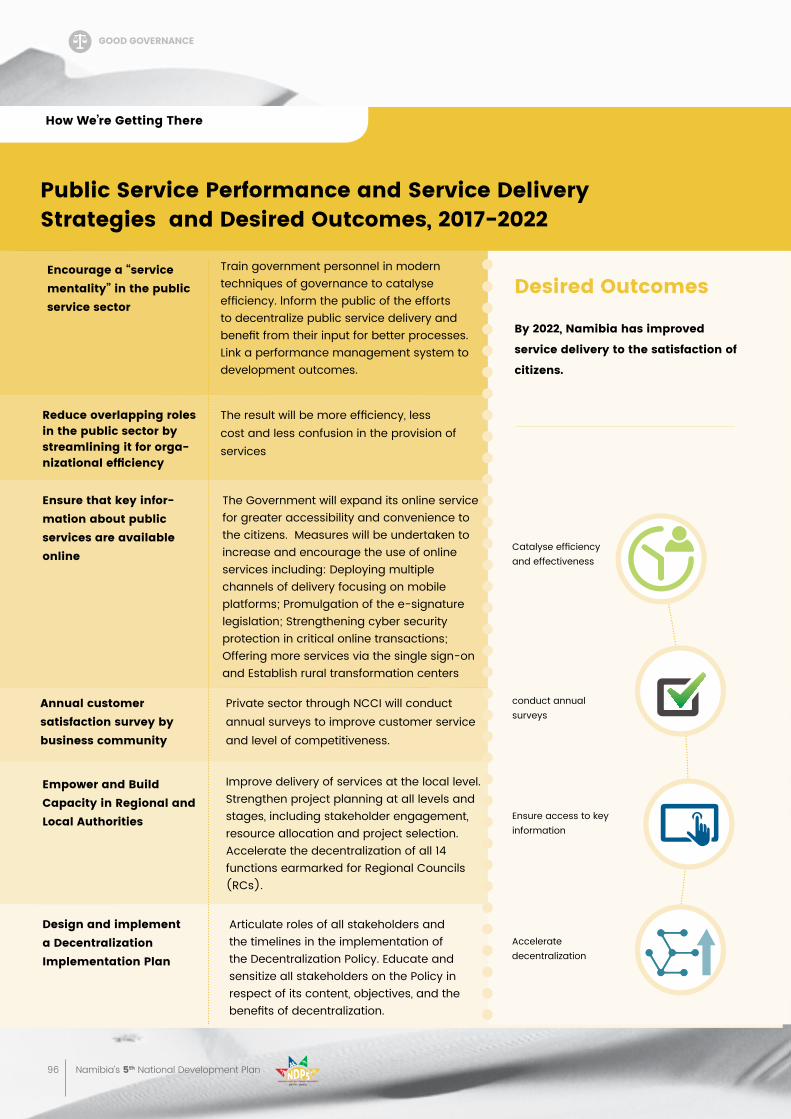
96 Namibia’s 5th National Development Plan
public service performance and service Delivery strategies and Desired outcomes, 2017-2022
encourage a “service mentality” in the public service sector
Train government personnel in modern techniques of governance to catalyse efficiency. lnform the public of the efforts to decentralize public service delivery and benefit from their input for better processes. Link a performance management system to development outcomes.
The result will be more efficiency, less cost and less confusion in the provision of services
Improve delivery of services at the local level. Strengthen project planning at all levels and stages, including stakeholder engagement, resource allocation and project selection. Accelerate the decentralization of all 14 functions earmarked for Regional Councils (RCs).
Articulate roles of all stakeholders and the timelines in the implementation of the Decentralization Policy. Educate and sensitize all stakeholders on the Policy in respect of its content, objectives, and the benefits of decentralization.
The Government will expand its online service for greater accessibility and convenience to the citizens. Measures will be undertaken to increase and encourage the use of online services including: Deploying multiple channels of delivery focusing on mobile platforms; Promulgation of the e-signature legislation; Strengthening cyber security protection in critical online transactions; Offering more services via the single sign-on and Establish rural transformation centers
Private sector through NCCI will conduct annual surveys to improve customer service and level of competitiveness.
reduce overlapping roles in the public sector by streamlining it for orga-nizationalefficiency
ensure that key infor-mation about public services are available online
annual customer satisfaction survey by business community
empower and build Capacity in regional and local authorities
Design and implement a Decentralization implementation plan
Desired outcomes
by 2022, Namibia has improved
service delivery to the satisfaction of
citizens.
how We’re getting there
conduct annual surveys
Ensure access to key information
Accelerate decentralization
Catalyse efficiency and effectiveness
gooD goverNaNCe
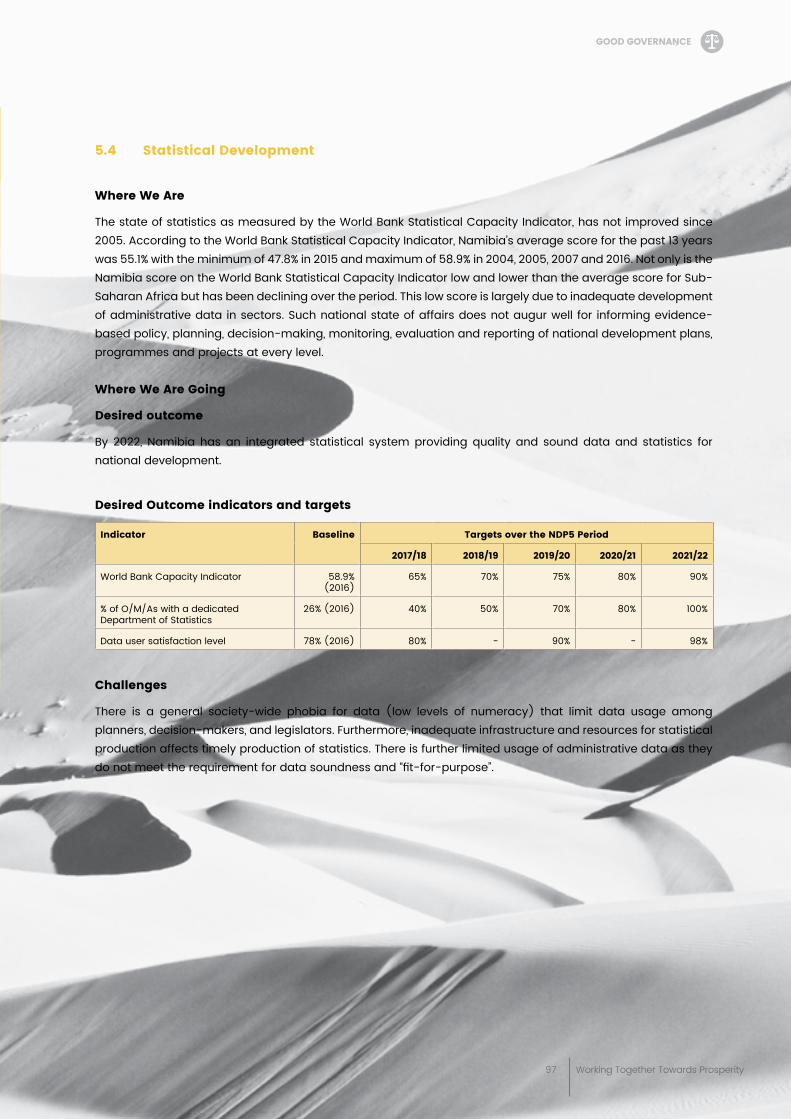
97 Working Together Towards Prosperity
5.4 statistical Development
Where We are
The state of statistics as measured by the World Bank Statistical Capacity Indicator, has not improved since 2005. According to the World Bank Statistical Capacity Indicator, Namibia’s average score for the past 13 years was 55.1% with the minimum of 47.8% in 2015 and maximum of 58.9% in 2004, 2005, 2007 and 2016. Not only is the Namibia score on the World Bank Statistical Capacity Indicator low and lower than the average score for Sub-Saharan Africa but has been declining over the period. This low score is largely due to inadequate development of administrative data in sectors. Such national state of affairs does not augur well for informing evidence-based policy, planning, decision-making, monitoring, evaluation and reporting of national development plans, programmes and projects at every level.
Where We are going
Desired outcome
By 2022, Namibia has an integrated statistical system providing quality and sound data and statistics for national development.
Desired outcome indicators and targets
indicator baseline targets over the NDp5 period
2017/18 2018/19 2019/20 2020/21 2021/22
World Bank Capacity Indicator 58.9% (2016)
65% 70% 75% 80% 90%
% of O/M/As with a dedicated Department of Statistics
26% (2016) 40% 50% 70% 80% 100%
Data user satisfaction level 78% (2016) 80% - 90% - 98%
Challenges
There is a general society-wide phobia for data (low levels of numeracy) that limit data usage among planners, decision-makers, and legislators. Furthermore, inadequate infrastructure and resources for statistical production affects timely production of statistics. There is further limited usage of administrative data as they do not meet the requirement for data soundness and “fit-for-purpose”.
gooD goverNaNCe
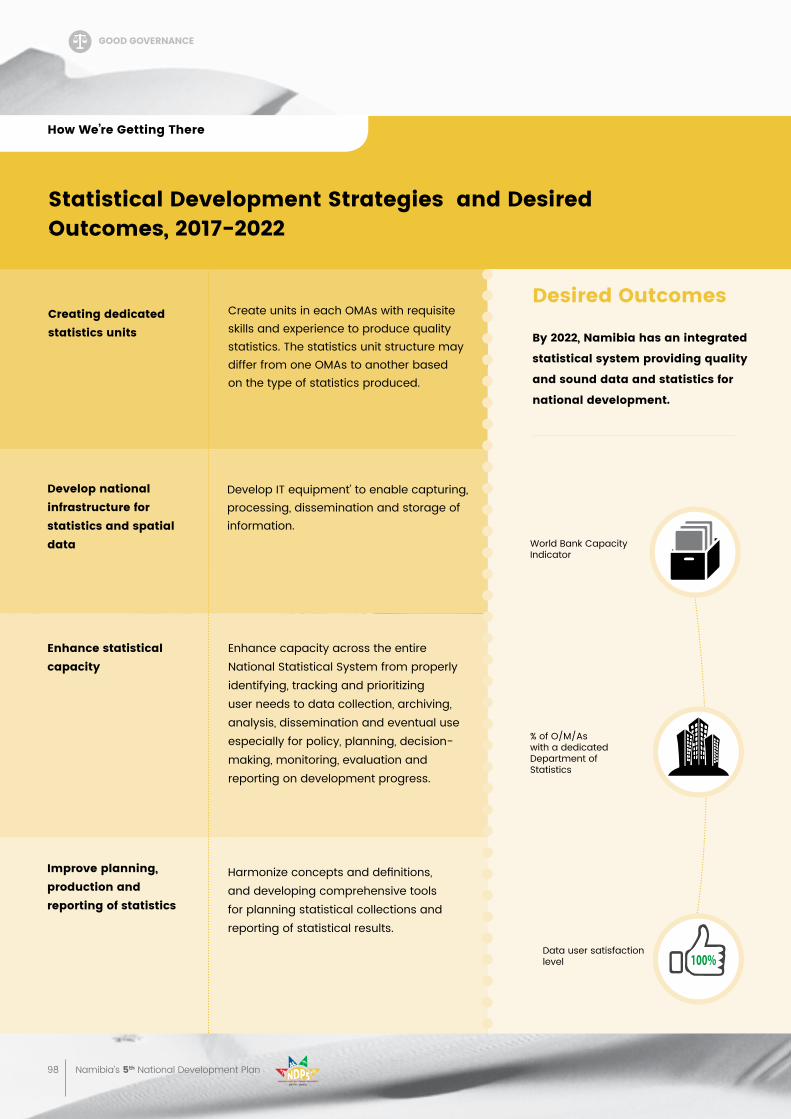
98 Namibia’s 5th National Development Plan
statistical Development strategies and Desired outcomes, 2017-2022
Creating dedicated statistics units
Create units in each OMAs with requisite skills and experience to produce quality statistics. The statistics unit structure may differ from one OMAs to another based on the type of statistics produced.
Develop IT equipment’ to enable capturing, processing, dissemination and storage of information.
Enhance capacity across the entire National Statistical System from properly identifying, tracking and prioritizing user needs to data collection, archiving, analysis, dissemination and eventual use especially for policy, planning, decision-making, monitoring, evaluation and reporting on development progress.
Harmonize concepts and definitions, and developing comprehensive tools for planning statistical collections and reporting of statistical results.
Develop national infrastructure for statistics and spatial data
enhance statistical capacity
improve planning, production and reporting of statistics
Desired outcomes
by 2022, Namibia has an integrated
statistical system providing quality
and sound data and statistics for
national development.
how We’re getting there
World Bank Capacity Indicator
% of O/M/As with a dedicated Department of Statistics
Data user satisfaction level
gooD goverNaNCe
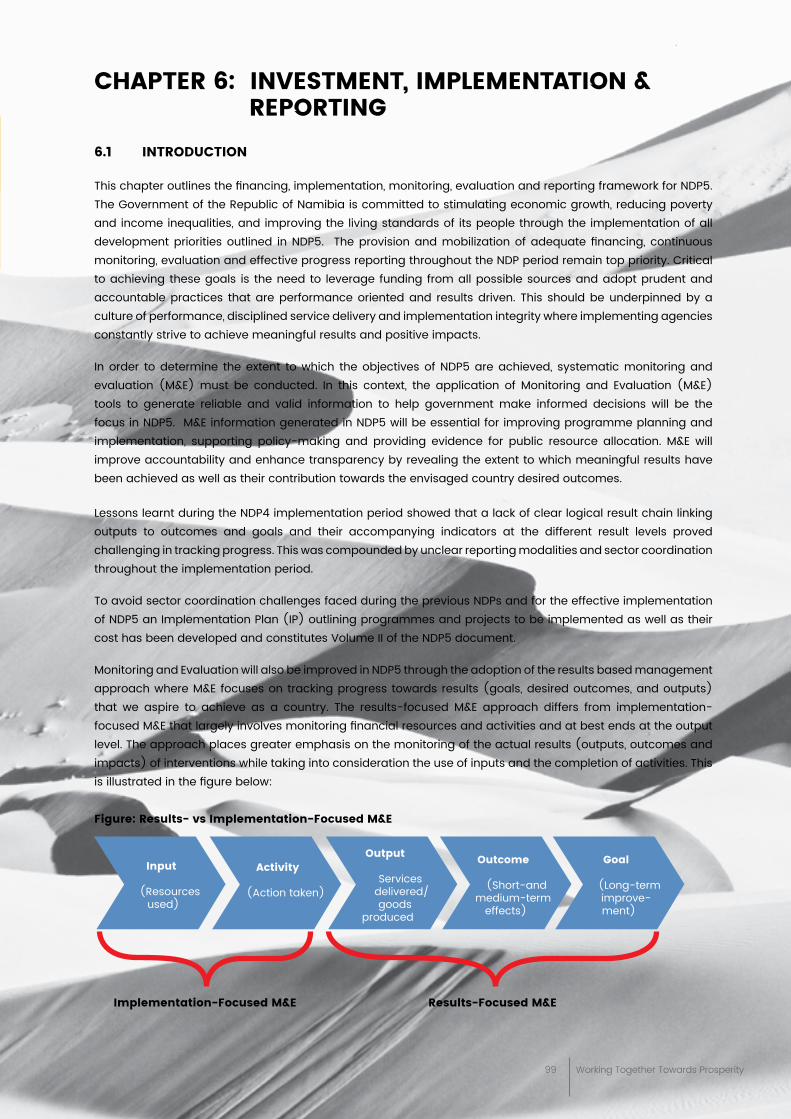
99 Working Together Towards Prosperity
Chapter 6: iNvestmeNt, implemeNtatioN & reportiNg6.1 iNtroDuCtioN
This chapter outlines the financing, implementation, monitoring, evaluation and reporting framework for NDP5. The Government of the Republic of Namibia is committed to stimulating economic growth, reducing poverty and income inequalities, and improving the living standards of its people through the implementation of all development priorities outlined in NDP5. The provision and mobilization of adequate financing, continuous monitoring, evaluation and effective progress reporting throughout the NDP period remain top priority. Critical to achieving these goals is the need to leverage funding from all possible sources and adopt prudent and accountable practices that are performance oriented and results driven. This should be underpinned by a culture of performance, disciplined service delivery and implementation integrity where implementing agencies constantly strive to achieve meaningful results and positive impacts.
In order to determine the extent to which the objectives of NDP5 are achieved, systematic monitoring and evaluation (M&E) must be conducted. In this context, the application of Monitoring and Evaluation (M&E) tools to generate reliable and valid information to help government make informed decisions will be the focus in NDP5. M&E information generated in NDP5 will be essential for improving programme planning and implementation, supporting policy-making and providing evidence for public resource allocation. M&E will improve accountability and enhance transparency by revealing the extent to which meaningful results have been achieved as well as their contribution towards the envisaged country desired outcomes. Lessons learnt during the NDP4 implementation period showed that a lack of clear logical result chain linking outputs to outcomes and goals and their accompanying indicators at the different result levels proved challenging in tracking progress. This was compounded by unclear reporting modalities and sector coordination throughout the implementation period. To avoid sector coordination challenges faced during the previous NDPs and for the effective implementation of NDP5 an Implementation Plan (IP) outlining programmes and projects to be implemented as well as their cost has been developed and constitutes Volume II of the NDP5 document.
Monitoring and Evaluation will also be improved in NDP5 through the adoption of the results based management approach where M&E focuses on tracking progress towards results (goals, desired outcomes, and outputs) that we aspire to achieve as a country. The results-focused M&E approach differs from implementation-focused M&E that largely involves monitoring financial resources and activities and at best ends at the output level. The approach places greater emphasis on the monitoring of the actual results (outputs, outcomes and impacts) of interventions while taking into consideration the use of inputs and the completion of activities. This is illustrated in the figure below:
Figure: results- vs implementation-Focused m&e
input
(Resources used)
activity
(Action taken)
output
Services delivered/goods
produced
outcome
(Short-and medium-term
effects)
goal
(Long-term improve-ment)
implementation-Focused m&e results-Focused m&e
100 Namibia’s 5th National Development Plan
To this end, a results Framework for NDP5 has been developed that states the high level results (goals, outcomes) to be monitored as well as their accompanying indicators against which progress will be measured. The Results Framework also states the targets for the NDP5 period as well as the institutions responsible for implementation and reporting. The Results Framework will be cascaded to O/M/A Strategic Plans and will be the basis for monitoring in NDP5. The results framework is attached as Appendix 1.
The key elements of the NDP5 M & E approach includes the identification of:
a. The results to be measured, monitored and evaluated;
b. Institutions responsible for the various levels of M & E;
c. Reporting requirements, responsibilities and dissemination techniques
6.2. FiNaNCiNg
Funding is a very important component in ensuring that the Plan is implemented. NDP5 has taken a step in identifying programmes and projects per focal area and has attached costs to these, for the entire period. The costing of this project outlays the financing need of the country in order to fully implement NDP5.
The total cost of the programmes and projects is provided for in the second volume of NDP5 (namely the Implementation Plan), and serves as an investment catalogue for the Government and investors (both domestic and foreign) with interests in investing in Namibia.
Within the context of its theme “Working Together Towards Prosperity.” NDP5 extends the concept of partnership to the funding of its outlined programmes and projects where all stakeholders including private sector and development partners are expected to contribute in whatever way possible with government being the main contributor. The investment by all stakeholders will be strategically directed to activities that stimulate economic growth, employment creation and poverty reduction.
Taking cognizance of the fact that Government may not have all the resources required to fully implement NDP5, alternative financing options such as PPP’s will be vigorously explored in the delivery of infrastructure and services. The necessary regulatory framework (such as the PPP policy and PPP Act) is already in place, which will guide the development of PPP projects and further promote private sector participation in the delivery of infrastructure and efficient services to the public.
6.3 implemeNtatioN
Implementation is defined as the process of putting a decision or plan into effect. In the context of NDP5, implementation means executing the plan and strategies to accomplish the identified desired outcomes. The developed Implementation plan outlays programmes and projects that are to be implemented within the 5 years and as such serves as an implementation tool for the Plan. The implementation has been costed for the entire NDP5, and as such calls for a timely and effective execution. Programmes and projects in the implementation plan have been identified per focal area of the NDP5, thus, if fully implemented, the overall goal of NDP5 will un-doubtedly be achieved. There is therefore a need for total commitment and dedication for the implementation of the plan by all stakeholders.
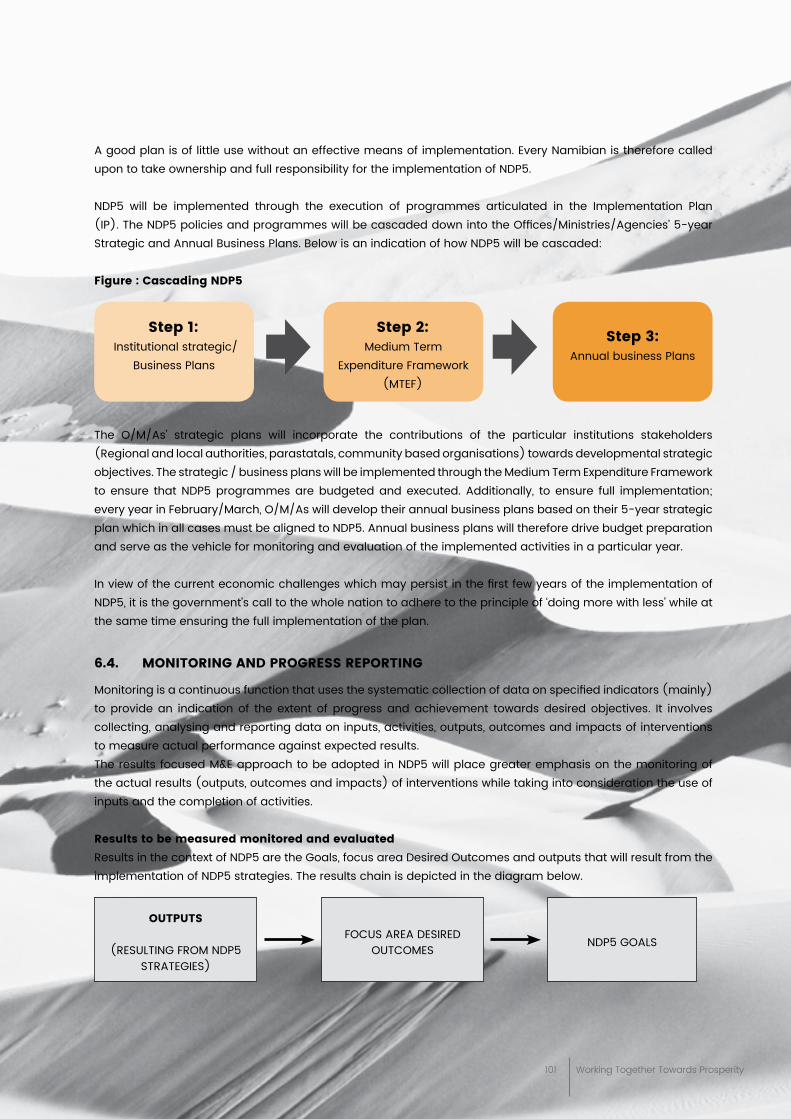
101 Working Together Towards Prosperity
A good plan is of little use without an effective means of implementation. Every Namibian is therefore called upon to take ownership and full responsibility for the implementation of NDP5.
NDP5 will be implemented through the execution of programmes articulated in the Implementation Plan (IP). The NDP5 policies and programmes will be cascaded down into the Offices/Ministries/Agencies’ 5-year Strategic and Annual Business Plans. Below is an indication of how NDP5 will be cascaded:
Figure : Cascading NDp5
The O/M/As’ strategic plans will incorporate the contributions of the particular institutions stakeholders (Regional and local authorities, parastatals, community based organisations) towards developmental strategic objectives. The strategic / business plans will be implemented through the Medium Term Expenditure Framework to ensure that NDP5 programmes are budgeted and executed. Additionally, to ensure full implementation; every year in February/March, O/M/As will develop their annual business plans based on their 5-year strategic plan which in all cases must be aligned to NDP5. Annual business plans will therefore drive budget preparation and serve as the vehicle for monitoring and evaluation of the implemented activities in a particular year.
In view of the current economic challenges which may persist in the first few years of the implementation of NDP5, it is the government’s call to the whole nation to adhere to the principle of ‘doing more with less’ while at the same time ensuring the full implementation of the plan.
6.4. moNitoriNg aND progress reportiNg
Monitoring is a continuous function that uses the systematic collection of data on specified indicators (mainly) to provide an indication of the extent of progress and achievement towards desired objectives. It involves collecting, analysing and reporting data on inputs, activities, outputs, outcomes and impacts of interventions to measure actual performance against expected results.The results focused M&E approach to be adopted in NDP5 will place greater emphasis on the monitoring of the actual results (outputs, outcomes and impacts) of interventions while taking into consideration the use of inputs and the completion of activities.
results to be measured monitored and evaluatedResults in the context of NDP5 are the Goals, focus area Desired Outcomes and outputs that will result from the implementation of NDP5 strategies. The results chain is depicted in the diagram below.
outputs
(RESULTING FROM NDP5 STRATEGIES)
FOCUS AREA DESIRED OUTCOMES
NDP5 GOALS
step 1: Institutional strategic/
Business Plans
step 2: Medium Term
Expenditure Framework (MTEF)
step 3: Annual business Plans
102 Namibia’s 5th National Development Plan
NDP5 monitoring will entail the tracking of progress based on indicators that have been developed at the multiple result levels as well as at implementation level by O/M/As. These indicators will form the basis for NDP5 progress monitoring and reporting. Indicators at goal and outcome levels are reflected in the NDP5 Results Framework while indicators at output and implementation level will be captured in the NDP5 Implementation Plan. Strategic plans of various institutions will capture desired outcome indicators contained in the NDP5 Results Framework per focus area as well as output level indicators contained in the NDP5 Implementation Plan.
Indicators contained in the NDP5 Results Framework, NDP5 Implementation Plan and Strategic Plans will be used as the basis of measuring progress and performance. All implementing institutions should ensure that indicators contained in strategic plans are accompanied by comprehensive related documentation. The minimum documentation entails the following: Indicator definition (meaning of indicator), Indicator classification (How indictor values will be counted), Disaggregation (By region, gender etc.), Baseline year and value, Targets, responsible institution for reporting progress as well the frequency of reporting.
The indicator documentation may also include any other additional information that might be useful. (Further guidance on indicator development and documentation will be provided to O/M/As and other relevant institutions by the National Planning Commission (NPC) and Office of the Prime Minister (OPM).
institutional m&e roles at various levels
monitoring by o/m/as, regional and local authorities, parastatalsO/M/As, Regional and Local Authorities, Parastatals will monitor achievement towards NDP5 strategies as well as the resulting outputs within their specific focus areas and institutional jurisdiction based on set indicators. This will require the monitoring of achievement towards desired results of specific interventions as well as the monitoring of processes, activities and related financial resources as reflected in Strategic Plans.
reporting requirements and responsibilities o/m/as, regional and local authorities, parastatals, During NDP5, progress will be periodically reported in both quantitative (i.e. indicator measures) as well as in more qualitative terms. Since indicators are mainly used as the basis of measuring progress and performance, reporting on progress and results will mainly be done on the basis of those indicators.
The accounting officers of ministries and agencies will submit and sign off quarterly progress reports to NPC on the implementation of NDP5 in the prescribed format not later than two weeks after the end of each quarter. The fourth quarter progress report constituting the end of the year report will include a summary of the overall annual performance of the O/M/As and this will be due on the 30th of April of each year. The progress report to NPC will include progress based on set indicators in the NDP5 Results Framework and output level indicators contained in the NDP5 Implementation Plan. Reports will also include information on financial execution rates as well as overall performance on the set targets (including narratives, describing scenarios).
monitoring by NpCNPC will assess progress towards the achievement of the expected NDP5 results (Goals, Desired outcomes, and outputs) to provide evidence to inform policy decisions and suggest timely remedial actions and policy shifts.
103 Working Together Towards Prosperity
NpC reporting requirements, responsibilities and dissemination techniquesNPC will compile an annual independent progress report on the overall performance towards NDP5. This will include progress on set indicators on results areas (Goals, Desired outcomes, and outputs) as reflected in NDP5 Results Framework and IP. In the middle of each year, an Interim (6 months) report will be prepared to assess progress towards the annual targets. NPC may as required, also prepare complementary reports on programmes/projects of strategic interest in addition to the two reports mentioned above.
The interim and annual progress reports (end of quarter four reports) will be subjected to review at various fora prior to submission to Cabinet for approval. The Hon. Minister of Economic Planning and DG of NPC, will first discuss the findings in the report with his counterparts from various focus areas - verify data and statistics as reported by various focus areas. Once the report has been finalized, NPC will then submit the report to the President or his delegate within the Presidency, who together with Minister of Economic Planning (custodian of NDP5 implementation) and Presidential Advisor on Implementation, Monitoring and Evaluation, will discuss the progress reports of the various focus areas with the Ministers concerned and assess progress towards set targets. Where deviations from the set targets exist, remedial actions will be proposed and the concerned ministries will sign Improvement Plans to address those issues within a prescribed timeframe. The committee will then submit the performance review report along with their findings, recommendations and signed Improvement Plans to Cabinet. Once approved by cabinet, the findings of the NDP5 progress report will be shared with the public through various communication modes. The Minister of Economic Planning will twice a year hold a press conference to inform the public on the implementation progress of NDP5.
6.5. evaluatioN
Although monitoring is an integral part of tracking programme results, it is not sufficient to measure higher level outcomes and impacts on income and wellbeing of beneficiaries, or to generate lessons learned from implementation that can be applied to future interventions. This is instead the function of Evaluation. Evaluations should be undertaken to determine the relevance, efficiency, effectiveness, impact and sustainability of NDP5 interventions to provide the answer to the question “Are we on the right track to achieve our NDP5 desired outcomes and goals?”
Evaluation should always be linked to policymaking processes. This means that evaluation should be used as support mechanism for policy formulation as well as learning tool for improving policies or programs. Two major evaluations of NDP5 will be undertaken, namely, implementation evaluation (mid-term evaluation) , which will take place in 2020 to evaluate the effectiveness of strategies and programs being implemented for NDP5 and assess whether the Plan is on course to achieve its targets or if remedial measures are needed. The impact evaluation at the end of NDP5 (terminal evaluation) on the other hand will take place within six months after the end of NDP5 in 2022 to assess whether NDP5 achieved its intended goals.
During NDP5 systematic evaluations will be undertaken from time to time. NPC will identify programs and projects for evaluation. As a standard practice, programs that are of strategic importance, significant public interest, and/or are of a certain size, nature or scope may be selected for evaluation. The selected Projects will be included in the Evaluation Plan outlining the nature of the projects, expected impacts, date for evaluation and the required budget for the evaluation. O/M/As will be encouraged to undertake self- evaluations especially at process/ implementation level to assess the effectiveness of activities/processes employed in NDP5.
104 Namibia’s 5th National Development Plan
APPENDIX
105 Working Together Towards Prosperity
APPENDIX ONE:
NDP5 REsults FRAmEwORk
Working Together towards prosperity
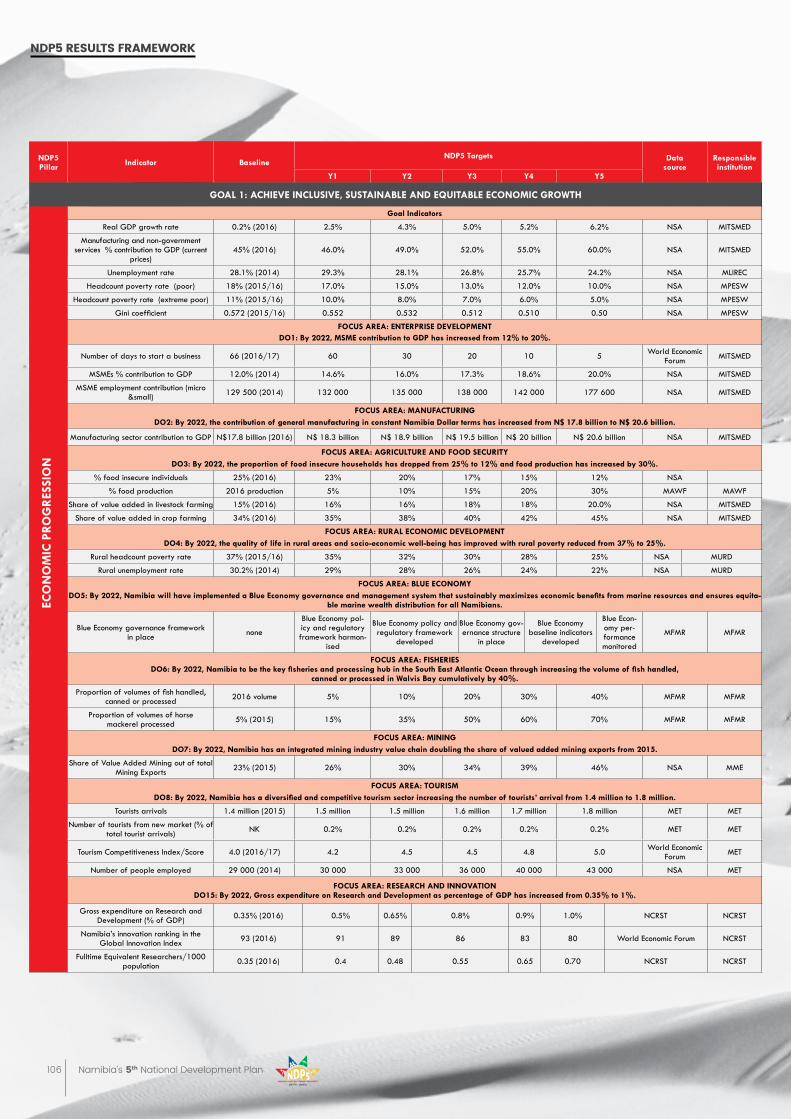
106 Namibia’s 5th National Development Plan
NDP5 Pillar Indicator Baseline
NDP5 targets Data source
Responsible institution
Y1 Y2 Y3 Y4 Y5
GOAl 1: AchIEvE INclusIvE, sustAINABlE AND EquItABlE EcONOmIc GROwth
Goal Indicators
Real GDP growth rate 0.2% (2016) 2.5% 4.3% 5.0% 5.2% 6.2% NSA MITSMED
Manufacturing and non-government services % contribution to GDP (current
prices)45% (2016) 46.0% 49.0% 52.0% 55.0% 60.0% NSA MITSMED
Unemployment rate 28.1% (2014) 29.3% 28.1% 26.8% 25.7% 24.2% NSA MLIREC
Headcount poverty rate (poor) 18% (2015/16) 17.0% 15.0% 13.0% 12.0% 10.0% NSA MPESW
Headcount poverty rate (extreme poor) 11% (2015/16) 10.0% 8.0% 7.0% 6.0% 5.0% NSA MPESW
Gini coefficient 0.572 (2015/16) 0.552 0.532 0.512 0.510 0.50 NSA MPESW
FOcus AREA: ENtERPRIsE DEvElOPmENt DO1: By 2022, msmE contribution to GDP has increased from 12% to 20%.
Number of days to start a business 66 (2016/17) 60 30 20 10 5 World Economic Forum MITSMED
MSMEs % contribution to GDP 12.0% (2014) 14.6% 16.0% 17.3% 18.6% 20.0% NSA MITSMED
MSME employment contribution (micro &small) 129 500 (2014) 132 000 135 000 138 000 142 000 177 600 NSA MITSMED
FOcus AREA: mANuFActuRINGDO2: By 2022, the contribution of general manufacturing in constant Namibia Dollar terms has increased from N$ 17.8 billion to N$ 20.6 billion.
Manufacturing sector contribution to GDP N$17.8 billion (2016) N$ 18.3 billion N$ 18.9 billion N$ 19.5 billion N$ 20 billion N$ 20.6 billion NSA MITSMED
FOcus AREA: AGRIcultuRE AND FOOD sEcuRItYDO3: By 2022, the proportion of food insecure households has dropped from 25% to 12% and food production has increased by 30%.
% food insecure individuals 25% (2016) 23% 20% 17% 15% 12% NSA
% food production 2016 production 5% 10% 15% 20% 30% MAWF MAWF
Share of value added in livestock farming 15% (2016) 16% 16% 18% 18% 20.0% NSA MITSMED
Share of value added in crop farming 34% (2016) 35% 38% 40% 42% 45% NSA MITSMED
FOcus AREA: RuRAl EcONOmIc DEvElOPmENt DO4: By 2022, the quality of life in rural areas and socio-economic well-being has improved with rural poverty reduced from 37% to 25%.
Rural headcount poverty rate 37% (2015/16) 35% 32% 30% 28% 25% NSA MURD
Rural unemployment rate 30.2% (2014) 29% 28% 26% 24% 22% NSA MURD
FOcus AREA: BluE EcONOmYDO5: By 2022, Namibia will have implemented a Blue Economy governance and management system that sustainably maximizes economic benefits from marine resources and ensures equita-
ble marine wealth distribution for all Namibians.
Blue Economy governance framework in place none
Blue Economy pol-icy and regulatory framework harmon-
ised
Blue Economy policy and regulatory framework
developed
Blue Economy gov-ernance structure
in place
Blue Economy baseline indicators
developed
Blue Econ-omy per-formance monitored
MFMR MFMR
FOcus AREA: FIshERIEsDO6: By 2022, Namibia to be the key fisheries and processing hub in the South East Atlantic Ocean through increasing the volume of fish handled,
canned or processed in walvis Bay cumulatively by 40%.
Proportion of volumes of fish handled, canned or processed 2016 volume 5% 10% 20% 30% 40% MFMR MFMR
Proportion of volumes of horse mackerel processed 5% (2015) 15% 35% 50% 60% 70% MFMR MFMR
FOcus AREA: mINING DO7: By 2022, Namibia has an integrated mining industry value chain doubling the share of valued added mining exports from 2015.
Share of Value Added Mining out of total Mining Exports 23% (2015) 26% 30% 34% 39% 46% NSA MME
FOcus AREA: tOuRIsm DO8: By 2022, Namibia has a diversified and competitive tourism sector increasing the number of tourists’ arrival from 1.4 million to 1.8 million.
Tourists arrivals 1.4 million (2015) 1.5 million 1.5 million 1.6 million 1.7 million 1.8 million MET MET
Number of tourists from new market (% of total tourist arrivals) NK 0.2% 0.2% 0.2% 0.2% 0.2% MET MET
Tourism Competitiveness Index/Score 4.0 (2016/17) 4.2 4.5 4.5 4.8 5.0 World Economic Forum MET
Number of people employed 29 000 (2014) 30 000 33 000 36 000 40 000 43 000 NSA MET
FOcus AREA: REsEARch AND INNOvAtIONDO15: By 2022, Gross expenditure on Research and Development as percentage of GDP has increased from 0.35% to 1%.
Gross expenditure on Research and Development (% of GDP) 0.35% (2016) 0.5% 0.65% 0.8% 0.9% 1.0% NCRST NCRST
Namibia’s innovation ranking in the Global Innovation Index 93 (2016) 91 89 86 83 80 World Economic Forum NCRST
Fulltime Equivalent Researchers/1000 population 0.35 (2016) 0.4 0.48 0.55 0.65 0.70 NCRST NCRST
EcO
NO
mIc
PRO
GR
EssI
ON
NDp5 results FrameWorK
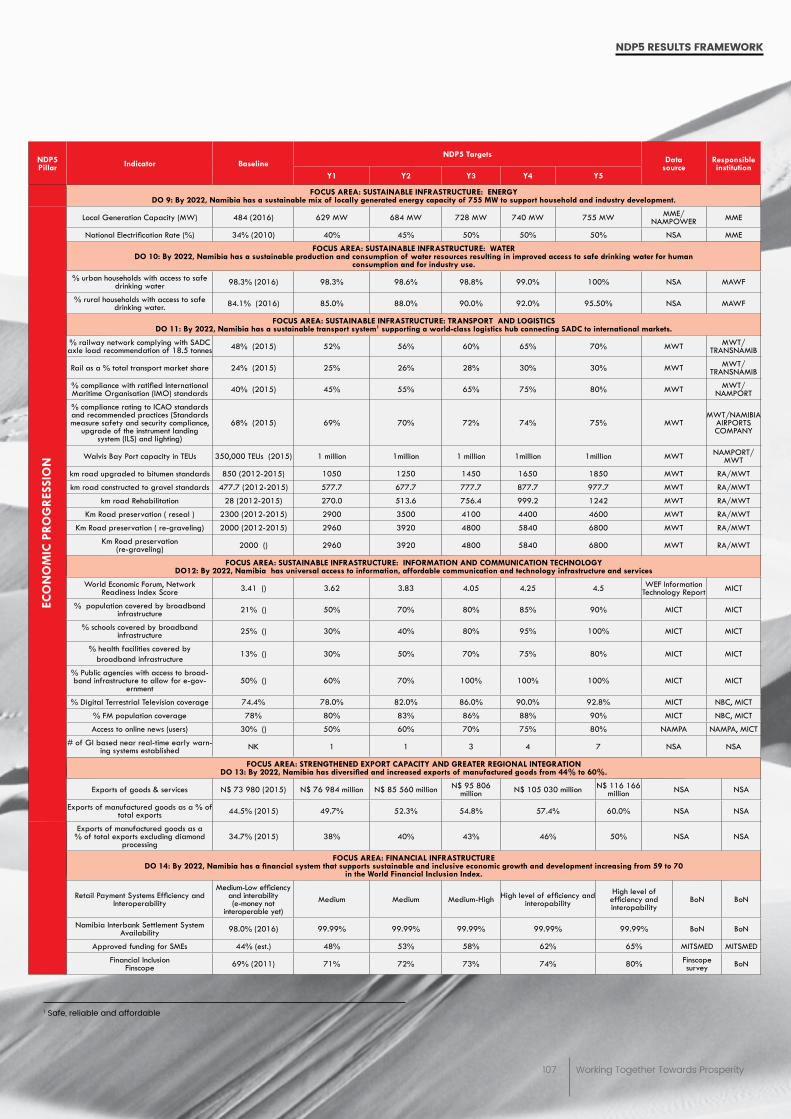
107 Working Together Towards Prosperity
NDp5 results FrameWorK
NDP5 Pillar Indicator Baseline
NDP5 targetsData
sourceResponsible institution
Y1 Y2 Y3 Y4 Y5
FOcus AREA: sustAINABlE INFRAstRuctuRE: ENERGY DO 9: By 2022, Namibia has a sustainable mix of locally generated energy capacity of 755 mw to support household and industry development.
Local Generation Capacity (MW) 484 (2016) 629 MW 684 MW 728 MW 740 MW 755 MW MME/NAMPOWER MME
National Electrification Rate (%) 34% (2010) 40% 45% 50% 50% 50% NSA MME
FOcus AREA: sustAINABlE INFRAstRuctuRE: wAtER DO 10: By 2022, Namibia has a sustainable production and consumption of water resources resulting in improved access to safe drinking water for human
consumption and for industry use.
% urban households with access to safe drinking water 98.3% (2016) 98.3% 98.6% 98.8% 99.0% 100% NSA MAWF
% rural households with access to safe drinking water. 84.1% (2016) 85.0% 88.0% 90.0% 92.0% 95.50% NSA MAWF
FOcus AREA: sustAINABlE INFRAstRuctuRE: tRANsPORt AND lOGIstIcs DO 11: By 2022, Namibia has a sustainable transport system1 supporting a world-class logistics hub connecting sADc to international markets.
% railway network complying with SADC axle load recommendation of 18.5 tonnes 48% (2015) 52% 56% 60% 65% 70% MWT MWT/
TRANSNAMIB
Rail as a % total transport market share 24% (2015) 25% 26% 28% 30% 30% MWT MWT/TRANSNAMIB
% compliance with ratified International Maritime Organisation (IMO) standards 40% (2015) 45% 55% 65% 75% 80% MWT MWT/
NAMPORT
% compliance rating to ICAO standards and recommended practices (Standards measure safety and security compliance,
upgrade of the instrument landing system (ILS) and lighting)
68% (2015) 69% 70% 72% 74% 75% MWTMWT/NAMIBIA
AIRPORTS COMPANY
Walvis Bay Port capacity in TEUs 350,000 TEUs (2015) 1 million 1million 1 million 1million 1million MWT NAMPORT/MWT
km road upgraded to bitumen standards 850 (2012-2015) 1050 1250 1450 1650 1850 MWT RA/MWT
km road constructed to gravel standards 477.7 (2012-2015) 577.7 677.7 777.7 877.7 977.7 MWT RA/MWT
km road Rehabilitation 28 (2012-2015) 270.0 513.6 756.4 999.2 1242 MWT RA/MWT
Km Road preservation ( reseal ) 2300 (2012-2015) 2900 3500 4100 4400 4600 MWT RA/MWT
Km Road preservation ( re-graveling) 2000 (2012-2015) 2960 3920 4800 5840 6800 MWT RA/MWT
Km Road preservation (re-graveling) 2000 () 2960 3920 4800 5840 6800 MWT RA/MWT
FOcus AREA: sustAINABlE INFRAstRuctuRE: INFORmAtION AND cOmmuNIcAtION tEchNOlOGY DO12: By 2022, Namibia has universal access to information, affordable communication and technology infrastructure and services
World Economic Forum, Network Readiness Index Score 3.41 () 3.62 3.83 4.05 4.25 4.5 WEF Information
Technology Report MICT
% population covered by broadband infrastructure 21% () 50% 70% 80% 85% 90% MICT MICT
% schools covered by broadband infrastructure 25% () 30% 40% 80% 95% 100% MICT MICT
% health facilities covered by broadband infrastructure
13% () 30% 50% 70% 75% 80% MICT MICT
% Public agencies with access to broad-band infrastructure to allow for e-gov-
ernment50% () 60% 70% 100% 100% 100% MICT MICT
% Digital Terrestrial Television coverage 74.4% 78.0% 82.0% 86.0% 90.0% 92.8% MICT NBC, MICT
% FM population coverage 78% 80% 83% 86% 88% 90% MICT NBC, MICT
Access to online news (users) 30% () 50% 60% 70% 75% 80% NAMPA NAMPA, MICT
# of GI based near real-time early warn-ing systems established NK 1 1 3 4 7 NSA NSA
FOcus AREA: stRENGthENED EXPORt cAPAcItY AND GREAtER REGIONAl INtEGRAtIONDO 13: By 2022, Namibia has diversified and increased exports of manufactured goods from 44% to 60%.
Exports of goods & services N$ 73 980 (2015) N$ 76 984 million N$ 85 560 million N$ 95 806 million N$ 105 030 million N$ 116 166
million NSA NSA
Exports of manufactured goods as a % of total exports 44.5% (2015) 49.7% 52.3% 54.8% 57.4% 60.0% NSA NSA
Exports of manufactured goods as a % of total exports excluding diamond
processing34.7% (2015) 38% 40% 43% 46% 50% NSA NSA
FOcus AREA: FINANcIAl INFRAstRuctuRE DO 14: By 2022, Namibia has a financial system that supports sustainable and inclusive economic growth and development increasing from 59 to 70
in the world Financial Inclusion Index.
Retail Payment Systems Efficiency and Interoperability
Medium-Low efficiency and interability (e-money not
interoperable yet) Medium Medium Medium-High High level of efficiency and
interopabilityHigh level of efficiency and interopability
BoN BoN
Namibia Interbank Settlement System Availability 98.0% (2016) 99.99% 99.99% 99.99% 99.99% 99.99% BoN BoN
Approved funding for SMEs 44% (est.) 48% 53% 58% 62% 65% MITSMED MITSMED
Financial InclusionFinscope 69% (2011) 71% 72% 73% 74% 80% Finscope
survey BoN
EcO
NO
mIc
PRO
GR
EssI
ON
1 Safe, reliable and affordable
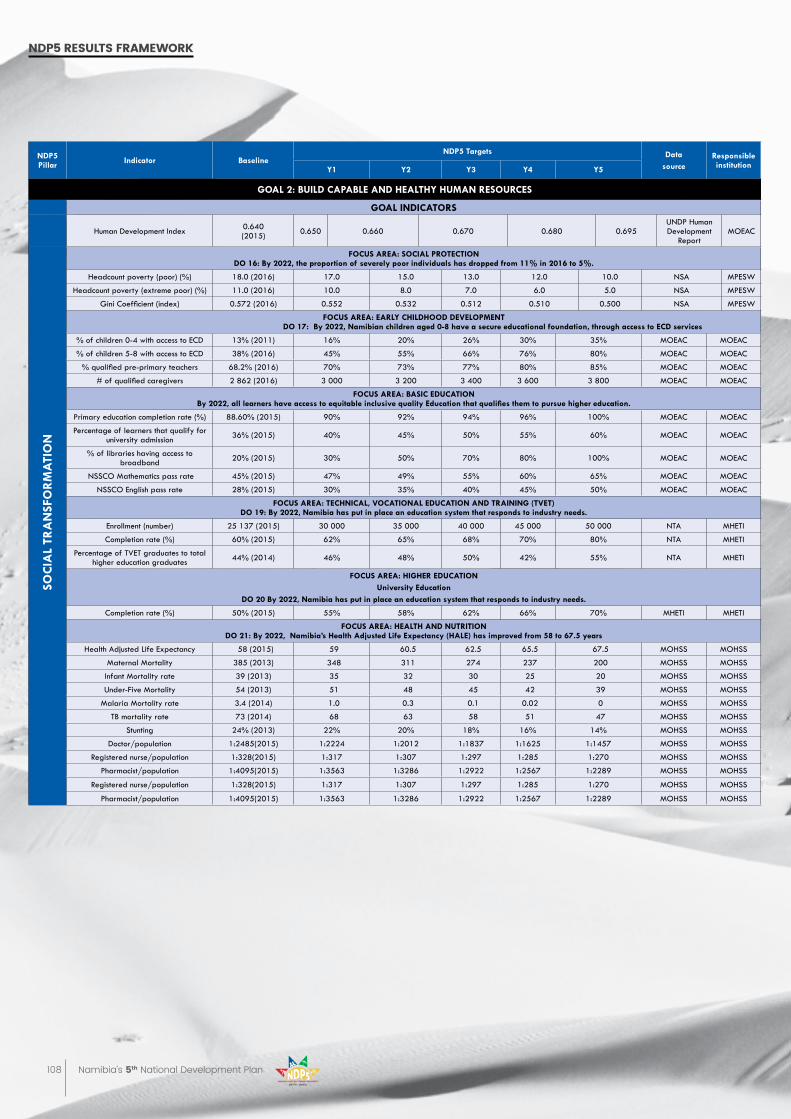
108 Namibia’s 5th National Development Plan
NDp5 results FrameWorK
NDP5 Pillar Indicator Baseline
NDP5 targets Data source
Responsible institutionY1 Y2 Y3 Y4 Y5
GOAl 2: BuIlD cAPABlE AND hEAlthY humAN REsOuRcEs
GOAl INDIcAtORs
Human Development Index 0.640(2015) 0.650 0.660 0.670 0.680 0.695
UNDP Human Development
Report MOEAC
FOcus AREA: sOcIAl PROtEctIONDO 16: By 2022, the proportion of severely poor individuals has dropped from 11% in 2016 to 5%.
Headcount poverty (poor) (%) 18.0 (2016) 17.0 15.0 13.0 12.0 10.0 NSA MPESW
Headcount poverty (extreme poor) (%) 11.0 (2016) 10.0 8.0 7.0 6.0 5.0 NSA MPESW
Gini Coefficient (index) 0.572 (2016) 0.552 0.532 0.512 0.510 0.500 NSA MPESW
FOcus AREA: EARlY chIlDhOOD DEvElOPmENt DO 17: By 2022, Namibian children aged 0-8 have a secure educational foundation, through access to EcD services
% of children 0-4 with access to ECD 13% (2011) 16% 20% 26% 30% 35% MOEAC MOEAC
% of children 5-8 with access to ECD 38% (2016) 45% 55% 66% 76% 80% MOEAC MOEAC
% qualified pre-primary teachers 68.2% (2016) 70% 73% 77% 80% 85% MOEAC MOEAC
# of qualified caregivers 2 862 (2016) 3 000 3 200 3 400 3 600 3 800 MOEAC MOEAC
FOcus AREA: BAsIc EDucAtION By 2022, all learners have access to equitable inclusive quality Education that qualifies them to pursue higher education.
Primary education completion rate (%) 88.60% (2015) 90% 92% 94% 96% 100% MOEAC MOEAC
Percentage of learners that qualify for university admission 36% (2015) 40% 45% 50% 55% 60% MOEAC MOEAC
% of libraries having access to broadband 20% (2015) 30% 50% 70% 80% 100% MOEAC MOEAC
NSSCO Mathematics pass rate 45% (2015) 47% 49% 55% 60% 65% MOEAC MOEAC
NSSCO English pass rate 28% (2015) 30% 35% 40% 45% 50% MOEAC MOEAC
FOcus AREA: tEchNIcAl, vOcAtIONAl EDucAtION AND tRAINING (tvEt) DO 19: By 2022, Namibia has put in place an education system that responds to industry needs.
Enrollment (number) 25 137 (2015) 30 000 35 000 40 000 45 000 50 000 NTA MHETI
Completion rate (%) 60% (2015) 62% 65% 68% 70% 80% NTA MHETI
Percentage of TVET graduates to total higher education graduates 44% (2014) 46% 48% 50% 42% 55% NTA MHETI
FOcus AREA: hIGhER EDucAtIONuniversity Education
DO 20 By 2022, Namibia has put in place an education system that responds to industry needs.
Completion rate (%) 50% (2015) 55% 58% 62% 66% 70% MHETI MHETI
FOcus AREA: hEAlth AND NutRItION DO 21: By 2022, Namibia’s Health Adjusted Life Expectancy (HALE) has improved from 58 to 67.5 years
Health Adjusted Life Expectancy 58 (2015) 59 60.5 62.5 65.5 67.5 MOHSS MOHSS
Maternal Mortality 385 (2013) 348 311 274 237 200 MOHSS MOHSS
Infant Mortality rate 39 (2013) 35 32 30 25 20 MOHSS MOHSS
Under-Five Mortality 54 (2013) 51 48 45 42 39 MOHSS MOHSS
Malaria Mortality rate 3.4 (2014) 1.0 0.3 0.1 0.02 0 MOHSS MOHSS
TB mortality rate 73 (2014) 68 63 58 51 47 MOHSS MOHSS
Stunting 24% (2013) 22% 20% 18% 16% 14% MOHSS MOHSS
Doctor/population 1:2485(2015) 1:2224 1:2012 1:1837 1:1625 1:1457 MOHSS MOHSS
Registered nurse/population 1:328(2015) 1:317 1:307 1:297 1:285 1:270 MOHSS MOHSS
Pharmacist/population 1:4095(2015) 1:3563 1:3286 1:2922 1:2567 1:2289 MOHSS MOHSS
Registered nurse/population 1:328(2015) 1:317 1:307 1:297 1:285 1:270 MOHSS MOHSS
Pharmacist/population 1:4095(2015) 1:3563 1:3286 1:2922 1:2567 1:2289 MOHSS MOHSS
sOc
IAl
tRA
NsF
OR
mA
tIO
N
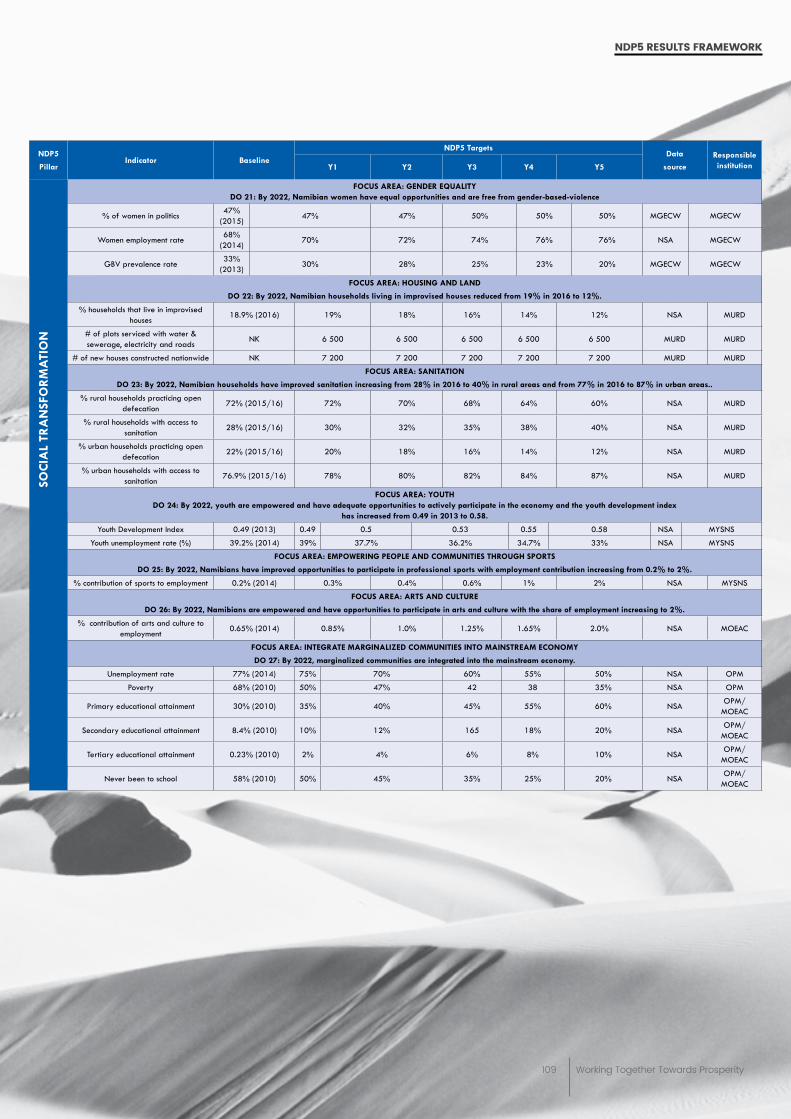
109 Working Together Towards Prosperity
NDp5 results FrameWorK
NDP5
PillarIndicator Baseline
NDP5 targetsData
sourceResponsible institutionY1 Y2 Y3 Y4 Y5
FOcus AREA: GENDER EquAlItYDO 21: By 2022, Namibian women have equal opportunities and are free from gender-based-violence
% of women in politics 47%
(2015) 47% 47% 50% 50% 50% MGECW MGECW
Women employment rate68%
(2014)70% 72% 74% 76% 76% NSA MGECW
GBV prevalence rate 33%
(2013)30% 28% 25% 23% 20% MGECW MGECW
FOcus AREA: hOusING AND lAND
DO 22: By 2022, Namibian households living in improvised houses reduced from 19% in 2016 to 12%.
% households that live in improvised houses
18.9% (2016) 19% 18% 16% 14% 12% NSA MURD
# of plots serviced with water & sewerage, electricity and roads
NK 6 500 6 500 6 500 6 500 6 500 MURD MURD
# of new houses constructed nationwide NK 7 200 7 200 7 200 7 200 7 200 MURD MURD
FOcus AREA: sANItAtION
DO 23: By 2022, Namibian households have improved sanitation increasing from 28% in 2016 to 40% in rural areas and from 77% in 2016 to 87% in urban areas..
% rural households practicing open defecation
72% (2015/16) 72% 70% 68% 64% 60% NSA MURD
% rural households with access to sanitation
28% (2015/16) 30% 32% 35% 38% 40% NSA MURD
% urban households practicing open defecation
22% (2015/16) 20% 18% 16% 14% 12% NSA MURD
% urban households with access to sanitation
76.9% (2015/16) 78% 80% 82% 84% 87% NSA MURD
FOcus AREA: YOuth DO 24: By 2022, youth are empowered and have adequate opportunities to actively participate in the economy and the youth development index
has increased from 0.49 in 2013 to 0.58.
Youth Development Index 0.49 (2013) 0.49 0.5 0.53 0.55 0.58 NSA MYSNS
Youth unemployment rate (%) 39.2% (2014) 39% 37.7% 36.2% 34.7% 33% NSA MYSNS
FOcus AREA: EmPOwERING PEOPlE AND cOmmuNItIEs thROuGh sPORts
DO 25: By 2022, Namibians have improved opportunities to participate in professional sports with employment contribution increasing from 0.2% to 2%.
% contribution of sports to employment 0.2% (2014) 0.3% 0.4% 0.6% 1% 2% NSA MYSNS
FOcus AREA: ARts AND cultuRE
DO 26: By 2022, Namibians are empowered and have opportunities to participate in arts and culture with the share of employment increasing to 2%.
% contribution of arts and culture to employment
0.65% (2014) 0.85% 1.0% 1.25% 1.65% 2.0% NSA MOEAC
FOcus AREA: INtEGRAtE mARGINAlIzED cOmmuNItIEs INtO mAINstREAm EcONOmY
DO 27: By 2022, marginalized communities are integrated into the mainstream economy.
Unemployment rate 77% (2014) 75% 70% 60% 55% 50% NSA OPM
Poverty 68% (2010) 50% 47% 42 38 35% NSA OPM
Primary educational attainment 30% (2010) 35% 40% 45% 55% 60% NSAOPM/
MOEAC
Secondary educational attainment 8.4% (2010) 10% 12% 165 18% 20% NSAOPM/
MOEAC
Tertiary educational attainment 0.23% (2010) 2% 4% 6% 8% 10% NSAOPM/
MOEAC
Never been to school 58% (2010) 50% 45% 35% 25% 20% NSAOPM/
MOEAC
sOc
IAl
tRA
NsF
OR
mA
tIO
N
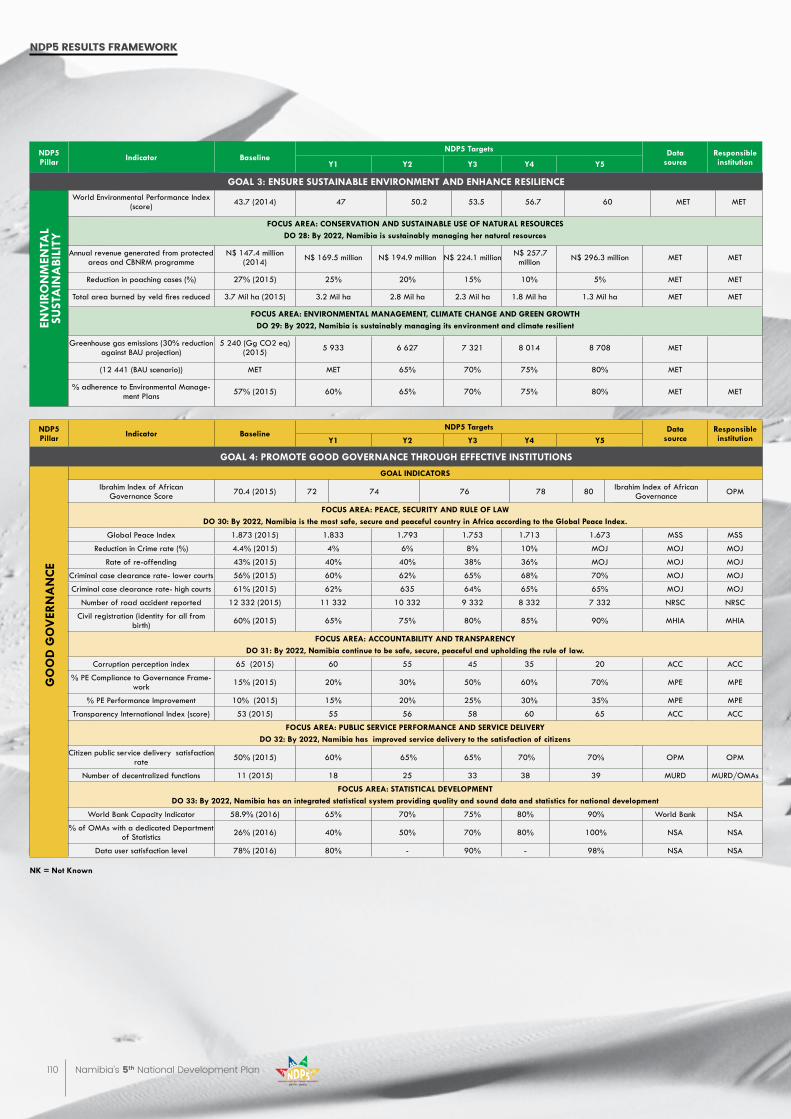
110 Namibia’s 5th National Development Plan
NDP5 Pillar Indicator Baseline
NDP5 targets Data source
Responsible institutionY1 Y2 Y3 Y4 Y5
GOAl 3: ENsuRE sustAINABlE ENvIRONmENt AND ENhANcE REsIlIENcEWorld Environmental Performance Index
(score) 43.7 (2014) 47 50.2 53.5 56.7 60 MET MET
FOcus AREA: cONsERvAtION AND sustAINABlE usE OF NAtuRAl REsOuRcEsDO 28: By 2022, Namibia is sustainably managing her natural resources
Annual revenue generated from protected areas and CBNRM programme
N$ 147.4 million (2014) N$ 169.5 million N$ 194.9 million N$ 224.1 million N$ 257.7
million N$ 296.3 million MET MET
Reduction in poaching cases (%) 27% (2015) 25% 20% 15% 10% 5% MET MET
Total area burned by veld fires reduced 3.7 Mil ha (2015) 3.2 Mil ha 2.8 Mil ha 2.3 Mil ha 1.8 Mil ha 1.3 Mil ha MET MET
FOcus AREA: ENvIRONmENtAl mANAGEmENt, clImAtE chANGE AND GREEN GROwthDO 29: By 2022, Namibia is sustainably managing its environment and climate resilient
Greenhouse gas emissions (30% reduction against BAU projection)
5 240 (Gg CO2 eq) (2015) 5 933 6 627 7 321 8 014 8 708 MET
(12 441 (BAU scenario)) MET MET 65% 70% 75% 80% MET
% adherence to Environmental Manage-ment Plans 57% (2015) 60% 65% 70% 75% 80% MET MET
NDP5 Pillar Indicator Baseline
NDP5 targets Data source
Responsible institutionY1 Y2 Y3 Y4 Y5
GOAl 4: PROmOtE GOOD GOvERNANcE thROuGh EFFEctIvE INstItutIONs
GOAl INDIcAtORs
Ibrahim Index of African Governance Score 70.4 (2015) 72 74 76 78 80 Ibrahim Index of African
Governance OPM
FOcus AREA: PEAcE, sEcuRItY AND RulE OF lAwDO 30: By 2022, Namibia is the most safe, secure and peaceful country in Africa according to the Global Peace Index.
Global Peace Index 1.873 (2015) 1.833 1.793 1.753 1.713 1.673 MSS MSS
Reduction in Crime rate (%) 4.4% (2015) 4% 6% 8% 10% MOJ MOJ MOJ
Rate of re-offending 43% (2015) 40% 40% 38% 36% MOJ MOJ MOJ
Criminal case clearance rate- lower courts 56% (2015) 60% 62% 65% 68% 70% MOJ MOJ
Criminal case clearance rate- high courts 61% (2015) 62% 635 64% 65% 65% MOJ MOJ
Number of road accident reported 12 332 (2015) 11 332 10 332 9 332 8 332 7 332 NRSC NRSC
Civil registration (identity for all from birth) 60% (2015) 65% 75% 80% 85% 90% MHIA MHIA
FOcus AREA: AccOuNtABIlItY AND tRANsPARENcYDO 31: By 2022, Namibia continue to be safe, secure, peaceful and upholding the rule of law.
Corruption perception index 65 (2015) 60 55 45 35 20 ACC ACC
% PE Compliance to Governance Frame-work 15% (2015) 20% 30% 50% 60% 70% MPE MPE
% PE Performance Improvement 10% (2015) 15% 20% 25% 30% 35% MPE MPE
Transparency International Index (score) 53 (2015) 55 56 58 60 65 ACC ACC
FOcus AREA: PuBlIc sERvIcE PERFORmANcE AND sERvIcE DElIvERY DO 32: By 2022, Namibia has improved service delivery to the satisfaction of citizens
Citizen public service delivery satisfaction rate 50% (2015) 60% 65% 65% 70% 70% OPM OPM
Number of decentralized functions 11 (2015) 18 25 33 38 39 MURD MURD/OMAs
FOcus AREA: stAtIstIcAl DEvElOPmENt DO 33: By 2022, Namibia has an integrated statistical system providing quality and sound data and statistics for national development
World Bank Capacity Indicator 58.9% (2016) 65% 70% 75% 80% 90% World Bank NSA
% of OMAs with a dedicated Department of Statistics 26% (2016) 40% 50% 70% 80% 100% NSA NSA
Data user satisfaction level 78% (2016) 80% - 90% - 98% NSA NSA
ENv
IRO
Nm
ENtA
l su
stA
INA
BIlI
tYG
OO
D G
Ov
ERN
AN
cE
NDp5 results FrameWorK
Nk = Not known
111 Working Together Towards Prosperity
APPENDIX twO:
NDP5 At A GlANcE
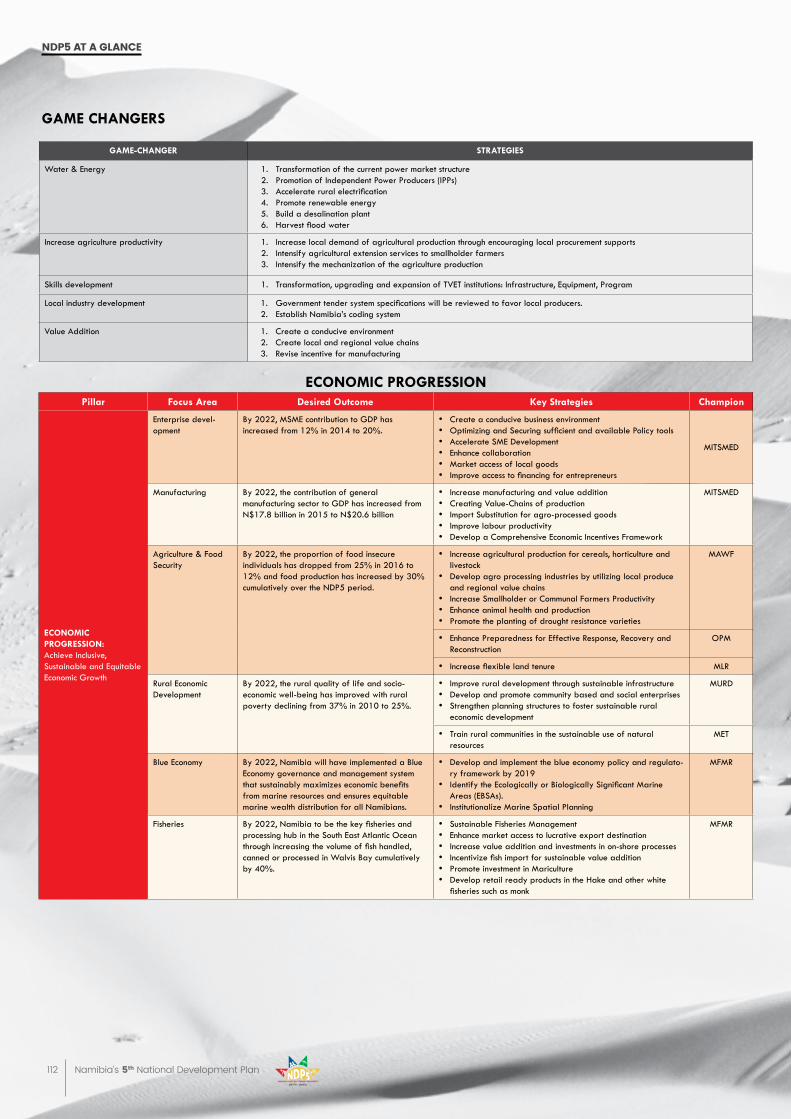
112 Namibia’s 5th National Development Plan
NDp5 at a glaNCe
GAmE chANGERs
GAmE-chANGER stRAtEGIEs
Water & Energy 1. Transformation of the current power market structure2. Promotion of Independent Power Producers (IPPs)3. Accelerate rural electrification4. Promote renewable energy 5. Build a desalination plant6. Harvest flood water
Increase agriculture productivity 1. Increase local demand of agricultural production through encouraging local procurement supports2. Intensify agricultural extension services to smallholder farmers3. Intensify the mechanization of the agriculture production
Skills development 1. Transformation, upgrading and expansion of TVET institutions: Infrastructure, Equipment, Program
Local industry development 1. Government tender system specifications will be reviewed to favor local producers. 2. Establish Namibia’s coding system
Value Addition 1. Create a conducive environment2. Create local and regional value chains3. Revise incentive for manufacturing
EcONOmIc PROGREssIONPillar Focus Area Desired Outcome key strategies champion
EcONOmIc PROGREssION: Achieve Inclusive, Sustainable and Equitable Economic Growth
Enterprise devel-opment
By 2022, MSME contribution to GDP has increased from 12% in 2014 to 20%.
· Create a conducive business environment· Optimizing and Securing sufficient and available Policy tools· Accelerate SME Development · Enhance collaboration· Market access of local goods· Improve access to financing for entrepreneurs
MITSMED
Manufacturing By 2022, the contribution of general manufacturing sector to GDP has increased from N$17.8 billion in 2015 to N$20.6 billion
· Increase manufacturing and value addition· Creating Value-Chains of production· Import Substitution for agro-processed goods· Improve labour productivity · Develop a Comprehensive Economic Incentives Framework
MITSMED
Agriculture & Food Security
By 2022, the proportion of food insecure individuals has dropped from 25% in 2016 to 12% and food production has increased by 30% cumulatively over the NDP5 period.
· Increase agricultural production for cereals, horticulture and livestock
· Develop agro processing industries by utilizing local produce and regional value chains
· Increase Smallholder or Communal Farmers Productivity · Enhance animal health and production· Promote the planting of drought resistance varieties
MAWF
· Enhance Preparedness for Effective Response, Recovery and Reconstruction
OPM
· Increase flexible land tenure MLR
Rural Economic Development
By 2022, the rural quality of life and socio-economic well-being has improved with rural poverty declining from 37% in 2010 to 25%.
· Improve rural development through sustainable infrastructure· Develop and promote community based and social enterprises· Strengthen planning structures to foster sustainable rural
economic development
MURD
· Train rural communities in the sustainable use of natural resources
MET
Blue Economy By 2022, Namibia will have implemented a Blue Economy governance and management system that sustainably maximizes economic benefits from marine resources and ensures equitable marine wealth distribution for all Namibians.
· Develop and implement the blue economy policy and regulato-ry framework by 2019
· Identify the Ecologically or Biologically Significant Marine Areas (EBSAs).
· Institutionalize Marine Spatial Planning
MFMR
Fisheries By 2022, Namibia to be the key fisheries and processing hub in the South East Atlantic Ocean through increasing the volume of fish handled, canned or processed in Walvis Bay cumulatively by 40%.
· Sustainable Fisheries Management· Enhance market access to lucrative export destination · Increase value addition and investments in on-shore processes· Incentivize fish import for sustainable value addition· Promote investment in Mariculture· Develop retail ready products in the Hake and other white
fisheries such as monk
MFMR
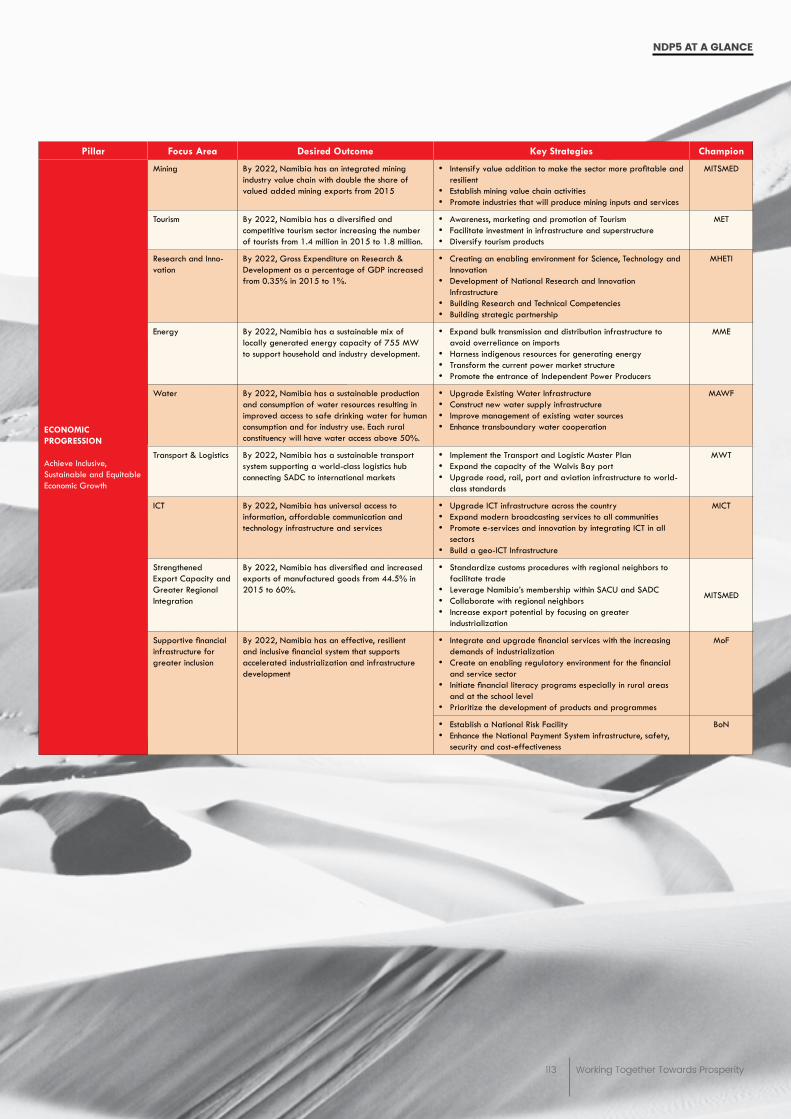
113 Working Together Towards Prosperity
Pillar Focus Area Desired Outcome key strategies champion
EcONOmIc PROGREssION
Achieve Inclusive, Sustainable and Equitable Economic Growth
Mining By 2022, Namibia has an integrated mining industry value chain with double the share of valued added mining exports from 2015
· Intensify value addition to make the sector more profitable and resilient
· Establish mining value chain activities · Promote industries that will produce mining inputs and services
MITSMED
Tourism By 2022, Namibia has a diversified and competitive tourism sector increasing the number of tourists from 1.4 million in 2015 to 1.8 million.
· Awareness, marketing and promotion of Tourism· Facilitate investment in infrastructure and superstructure· Diversify tourism products
MET
Research and Inno-vation
By 2022, Gross Expenditure on Research & Development as a percentage of GDP increased from 0.35% in 2015 to 1%.
· Creating an enabling environment for Science, Technology and Innovation
· Development of National Research and Innovation Infrastructure
· Building Research and Technical Competencies · Building strategic partnership
MHETI
Energy By 2022, Namibia has a sustainable mix of locally generated energy capacity of 755 MW to support household and industry development.
· Expand bulk transmission and distribution infrastructure to avoid overreliance on imports
· Harness indigenous resources for generating energy· Transform the current power market structure · Promote the entrance of Independent Power Producers
MME
Water By 2022, Namibia has a sustainable production and consumption of water resources resulting in improved access to safe drinking water for human consumption and for industry use. Each rural constituency will have water access above 50%.
· Upgrade Existing Water Infrastructure · Construct new water supply infrastructure · Improve management of existing water sources· Enhance transboundary water cooperation
MAWF
Transport & Logistics By 2022, Namibia has a sustainable transport system supporting a world-class logistics hub connecting SADC to international markets
· Implement the Transport and Logistic Master Plan· Expand the capacity of the Walvis Bay port· Upgrade road, rail, port and aviation infrastructure to world-
class standards
MWT
ICT By 2022, Namibia has universal access to information, affordable communication and technology infrastructure and services
· Upgrade ICT infrastructure across the country · Expand modern broadcasting services to all communities · Promote e-services and innovation by integrating ICT in all
sectors · Build a geo-ICT Infrastructure
MICT
Strengthened Export Capacity and Greater Regional Integration
By 2022, Namibia has diversified and increased exports of manufactured goods from 44.5% in 2015 to 60%.
· Standardize customs procedures with regional neighbors to facilitate trade
· Leverage Namibia’s membership within SACU and SADC · Collaborate with regional neighbors · Increase export potential by focusing on greater
industrialization
MITSMED
Supportive financial infrastructure for greater inclusion
By 2022, Namibia has an effective, resilient and inclusive financial system that supports accelerated industrialization and infrastructure development
· Integrate and upgrade financial services with the increasing demands of industrialization
· Create an enabling regulatory environment for the financial and service sector
· Initiate financial literacy programs especially in rural areas and at the school level
· Prioritize the development of products and programmes
MoF
· Establish a National Risk Facility· Enhance the National Payment System infrastructure, safety,
security and cost-effectiveness
BoN
NDp5 at a glaNCe
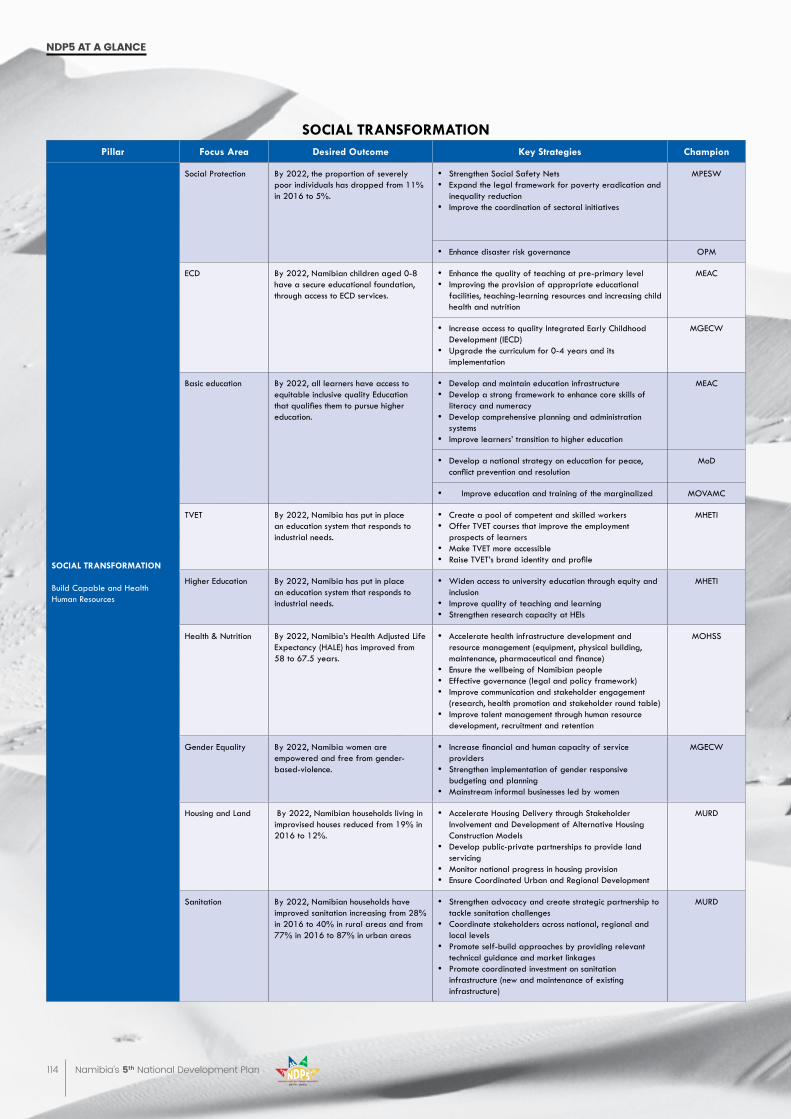
114 Namibia’s 5th National Development Plan
NDp5 at a glaNCe
sOcIAl tRANsFORmAtIONPillar Focus Area Desired Outcome key strategies champion
sOcIAl tRANsFORmAtION
Build Capable and Health Human Resources
Social Protection By 2022, the proportion of severely poor individuals has dropped from 11% in 2016 to 5%.
· Strengthen Social Safety Nets· Expand the legal framework for poverty eradication and
inequality reduction · Improve the coordination of sectoral initiatives
MPESW
· Enhance disaster risk governance OPM
ECD By 2022, Namibian children aged 0-8 have a secure educational foundation, through access to ECD services.
· Enhance the quality of teaching at pre-primary level· Improving the provision of appropriate educational
facilities, teaching-learning resources and increasing child health and nutrition
MEAC
· Increase access to quality Integrated Early Childhood Development (IECD)
· Upgrade the curriculum for 0-4 years and its implementation
MGECW
Basic education By 2022, all learners have access to equitable inclusive quality Education that qualifies them to pursue higher education.
· Develop and maintain education infrastructure· Develop a strong framework to enhance core skills of
literacy and numeracy· Develop comprehensive planning and administration
systems· Improve learners’ transition to higher education
MEAC
· Develop a national strategy on education for peace, conflict prevention and resolution
MoD
· Improve education and training of the marginalized MOVAMC
TVET By 2022, Namibia has put in place an education system that responds to industrial needs.
· Create a pool of competent and skilled workers· Offer TVET courses that improve the employment
prospects of learners· Make TVET more accessible· Raise TVET’s brand identity and profile
MHETI
Higher Education By 2022, Namibia has put in place an education system that responds to industrial needs.
· Widen access to university education through equity and inclusion
· Improve quality of teaching and learning· Strengthen research capacity at HEIs
MHETI
Health & Nutrition By 2022, Namibia’s Health Adjusted Life Expectancy (HALE) has improved from 58 to 67.5 years.
· Accelerate health infrastructure development and resource management (equipment, physical building, maintenance, pharmaceutical and finance)
· Ensure the wellbeing of Namibian people · Effective governance (legal and policy framework)· Improve communication and stakeholder engagement
(research, health promotion and stakeholder round table)· Improve talent management through human resource
development, recruitment and retention
MOHSS
Gender Equality By 2022, Namibia women are empowered and free from gender-based-violence.
· Increase financial and human capacity of service providers
· Strengthen implementation of gender responsive budgeting and planning
· Mainstream informal businesses led by women
MGECW
Housing and Land By 2022, Namibian households living in improvised houses reduced from 19% in 2016 to 12%.
· Accelerate Housing Delivery through Stakeholder Involvement and Development of Alternative Housing Construction Models
· Develop public-private partnerships to provide land servicing
· Monitor national progress in housing provision· Ensure Coordinated Urban and Regional Development
MURD
Sanitation By 2022, Namibian households have improved sanitation increasing from 28% in 2016 to 40% in rural areas and from 77% in 2016 to 87% in urban areas
· Strengthen advocacy and create strategic partnership to tackle sanitation challenges
· Coordinate stakeholders across national, regional and local levels
· Promote self-build approaches by providing relevant technical guidance and market linkages
· Promote coordinated investment on sanitation infrastructure (new and maintenance of existing infrastructure)
MURD
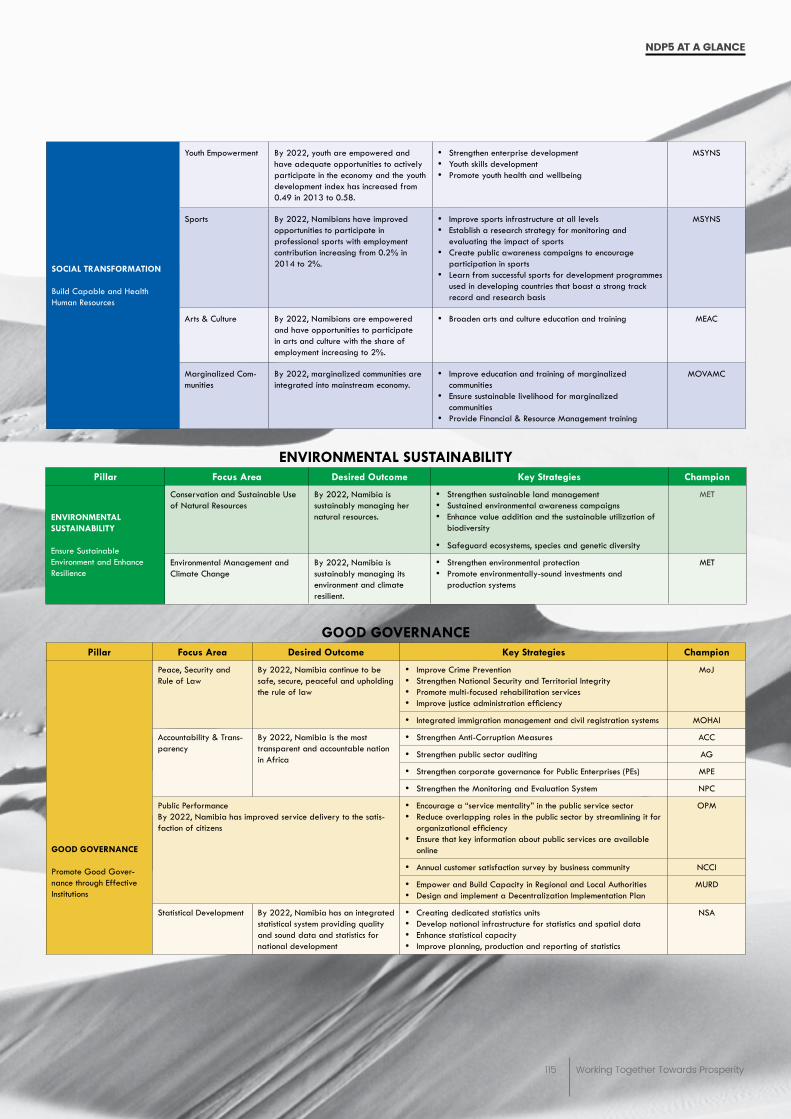
115 Working Together Towards Prosperity
sOcIAl tRANsFORmAtION
Build Capable and Health Human Resources
Youth Empowerment By 2022, youth are empowered and have adequate opportunities to actively participate in the economy and the youth development index has increased from 0.49 in 2013 to 0.58.
· Strengthen enterprise development · Youth skills development· Promote youth health and wellbeing
MSYNS
Sports By 2022, Namibians have improved opportunities to participate in professional sports with employment contribution increasing from 0.2% in 2014 to 2%.
· Improve sports infrastructure at all levels· Establish a research strategy for monitoring and
evaluating the impact of sports · Create public awareness campaigns to encourage
participation in sports · Learn from successful sports for development programmes
used in developing countries that boast a strong track record and research basis
MSYNS
Arts & Culture By 2022, Namibians are empowered and have opportunities to participate in arts and culture with the share of employment increasing to 2%.
· Broaden arts and culture education and training MEAC
Marginalized Com-munities
By 2022, marginalized communities are integrated into mainstream economy.
· Improve education and training of marginalized communities
· Ensure sustainable livelihood for marginalized communities
· Provide Financial & Resource Management training
MOVAMC
ENvIRONmENtAl sustAINABIlItYPillar Focus Area Desired Outcome key strategies champion
ENvIRONmENtAl sustAINABIlItY
Ensure Sustainable Environment and Enhance Resilience
Conservation and Sustainable Use of Natural Resources
By 2022, Namibia is sustainably managing her natural resources.
· Strengthen sustainable land management · Sustained environmental awareness campaigns · Enhance value addition and the sustainable utilization of
biodiversity
· Safeguard ecosystems, species and genetic diversity
MET
Environmental Management and Climate Change
By 2022, Namibia is sustainably managing its environment and climate resilient.
· Strengthen environmental protection· Promote environmentally-sound investments and
production systems
MET
GOOD GOvERNANcEPillar Focus Area Desired Outcome key strategies champion
GOOD GOvERNANcE
Promote Good Gover-nance through Effective Institutions
Peace, Security and Rule of Law
By 2022, Namibia continue to be safe, secure, peaceful and upholding the rule of law
· Improve Crime Prevention · Strengthen National Security and Territorial Integrity· Promote multi-focused rehabilitation services · Improve justice administration efficiency
MoJ
· Integrated immigration management and civil registration systems MOHAI
Accountability & Trans-parency
By 2022, Namibia is the most transparent and accountable nation in Africa
· Strengthen Anti-Corruption Measures ACC
· Strengthen public sector auditing AG
· Strengthen corporate governance for Public Enterprises (PEs) MPE
· Strengthen the Monitoring and Evaluation System NPC
Public PerformanceBy 2022, Namibia has improved service delivery to the satis-faction of citizens
· Encourage a “service mentality” in the public service sector· Reduce overlapping roles in the public sector by streamlining it for
organizational efficiency· Ensure that key information about public services are available
online
OPM
· Annual customer satisfaction survey by business community NCCI
· Empower and Build Capacity in Regional and Local Authorities· Design and implement a Decentralization Implementation Plan
MURD
Statistical Development By 2022, Namibia has an integrated statistical system providing quality and sound data and statistics for national development
· Creating dedicated statistics units · Develop national infrastructure for statistics and spatial data · Enhance statistical capacity · Improve planning, production and reporting of statistics
NSA
NDp5 at a glaNCe

116 Namibia’s 5th National Development Plan
Notes

117 Working Together Towards Prosperity
Notes

118 Namibia’s 5th National Development Plan
Notes

NatioNal plaNNiNg CommissioNGovernment Office Park, Luther Street
Private Bag 13356Windhoek, Namibia
www.npc.gov.na
ISBN:978-99945-0-096-3