Embed Size (px)
Citation preview

Team name: _______________________
Rocket EngineeringTulsa Public Schools
Math Science PartnershipMath Exploration Academy
Dr. Karen High Contact Info:School of Chemical EngineeringOklahoma State University423 Engineering North Stillwater, OK 47078(405) 744-5280 (office)(404) 747-5105 (cell)[email protected]
Objectives:1) Demonstrate the use of the engineering design cycle2) Showcase several kinds of engineering3) Connect to math concepts delivered during the program4) Complement the Gateway to Technology curriculum5) Tie in to PASS objectives and core curriculum6) Allow for innovation and creativity
Scenario:NASA has a new job opening and they are interested in hiring your team! There are other candidate teams for the job, though, so NASA has created a challenge to help them decide which team to hire. The challenge is to design the best propellant and rocket structure for launching. NASA’s decision will be based on how much money you spend (less is better), how high your rocket goes (the higher the better) and how long it takes your rocket to liftoff (the quicker the better). You will also be responsible for determining processing requirements as well as environmental impact of the manufacturing process.
Outline:Day One Propellant design (focus on researching)
Chemistry and chemical engineering Algebra, fractions, ratios
Day Two Propellant testing and rocket launching (focus on modeling) Aerospace engineering Algebra, geometry, fractions, ratios, proportions, functions
Day Three Rocket materials and redesign (focus on implementing) Materials and mechanical engineeringDecimals, algebra, geometry
Day Four Economics and manufacturing process design rocket redesign launch (focus on measuring); Industrial engineering Data analysis
Day Five Redesigned rocket launch data analysis and presentation (focus on communicating) Environmental engineering Data analysis, percents
1

Team name: _______________________
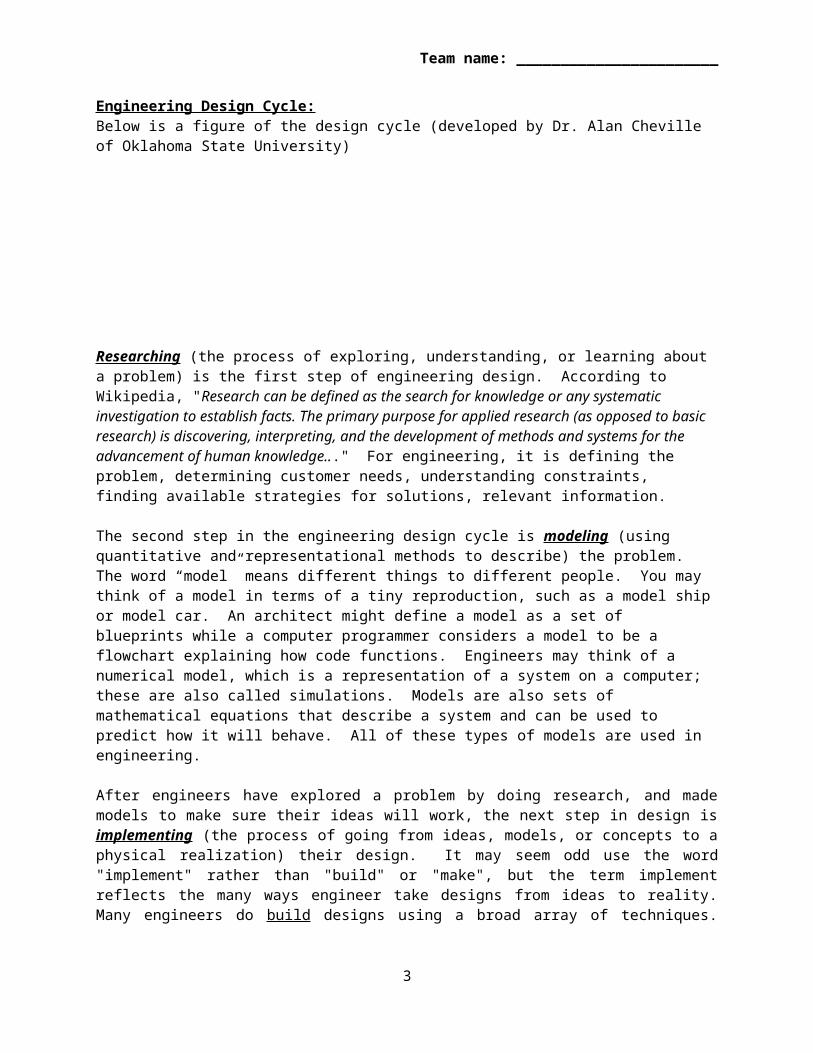
Engineering Design Cycle:Below is a figure of the design cycle (developed by Dr. Alan Cheville of Oklahoma State University)
Researching (the process of exploring, understanding, or learning about a problem) is the first step of engineering design. According to Wikipedia, "Research can be defined as the search for knowledge or any systematic investigation to establish facts. The primary purpose for applied research (as opposed to basic research) is discovering, interpreting, and the development of methods and systems for the advancement of human knowledge..." For engineering, it is defining the problem, determining customer needs, understanding constraints, finding available strategies for solutions, relevant information.
The second step in the engineering design cycle is modeling (using quantitative and representational methods to describe) the problem. The word “model” means different things to different people. You may think of a model in terms of a tiny reproduction, such as a model ship or model car. An architect might define a model as a set of blueprints while a computer programmer considers a model to be a flowchart explaining how code functions. Engineers may think of a numerical model, which is a representation of a system on a computer; these are also called simulations. Models are also sets of mathematical equations that describe a system and can be used to predict how it will behave. All of these types of models are used in engineering.
After engineers have explored a problem by doing research, and made models to make sure their ideas will work, the next step in design is implementing (the process of going from ideas, models, or concepts to a physical realization) their design. It may seem odd use the word "implement" rather than "build" or "make", but the term implement reflects the many ways engineer take designs from ideas to reality. Many engineers do build designs using a broad array of techniques. However some engineers implement ideas through manipulation of information, such as designing computer software or producing plans.
The fourth step of the engineering design cycle is measuring (determining how well a system or device functions by performing measurements). This determines whether or not the design that was implemented words properly. In order to determine if the design functions, engineers compare measurements of design performance with the results of the models done in the modeling step of the design cycle to characterize performance. By comparing how a device really works to how the device should work allows engineers to improve the performance.
The fifth step, communicating (expressing the results of engineering work so others can understand, reproduce, and improve it), is a critical part of engineering design since it is how you share information between the members of a design team, inform managers and customers of your progress, and provide information to those who use your products.
2
Team name: _______________________
Background:
From http://www.teachengineering.org/ Students design and build a paper rocket around a film canister, which is used as the engine. An antacid tablet and water (or other propellants) are put into the canister, react to form carbon dioxide (or other) gas, and act as the pop rocket's propellant. With the lid snapped on, the continuous creation of gas causes pressure to build up until the lid pops off, sending the rocket into the air. The pop rockets demonstrate Newton's third law of motion: for every action, there is an equal and opposite reaction.
Engineers design scale models of a project to determine how it will perform. When designing a rocket, engineers must develop small prototypes to test fuel properties. Does the fuel burn too quickly? Does the fuel create enough thrust? Prototypes of rockets help engineers discover the balance between weight and thrust that is necessary for space flight.
From http://spaceplace.nasa.gov/pop-rocket/ When the fizzy tablet (or other propellant) is placed in water (or other liquid), many little bubbles of gas escape. The bubbles go up, instead of down, because they weigh less than water. When the bubbles get to the surface of the water, they break open. All that gas that has escaped from the bubbles pushes on the sides of the canister (creating pressure).
When you blow up a balloon, the air makes the balloon stretch bigger and bigger. But the little film canister doesn't stretch and all this gas has to go somewhere!
Eventually, something has to give! So the canister pops its top (which is really its bottom, since it's upside down). All the water and gas rush down and out, pushing the canister up and up, along with the rocket attached to it.
We call this wonderful and useful fact the law of action and reaction. The action is the gas rushing out of the rocket. The reaction is the rocket taking off in the other direction. In other words, for every action there is an equal and opposite reaction. The rocket goes in the opposite direction from the gas, and the faster the gas leaves the rocket, the faster the rocket gets pushed the other way.
From http://kitchenpantryscientist.com Three important forces act on rockets:
THRUST (the force lifting the rocket) DRAG (force acting against the rocket caused by air resistance)WEIGHT (the force produced by gravity dragging down the weight of the rocket)
3

Team name: _______________________
Icons for project:
Anytime you see this, we need to collect data
This is the “observation” eye, but don’t forget to also observe with your nose, ears, taste, and touch!
Any time you see this calculator icon that means that there are calculations to be done.
Anytime you see this icon, what follows is a calculation example
Anytime you see this icon, we need to plot data on a graph
Engineers deal with processes to manufacture products. To help us describe what is going on, we use process diagrams like the one above. See how you can make a process diagram to describe how to make breakfast!
4

Team name: _______________________
Economic Data:
Propellant Cost List (this is the cost to purchase these items)
Water fuel $5 per milliliterVinegar fuel $30 per milliliterDiet Coke fuel $100 per milliliterTums chunks $5,000 per ½ tabletAlka Seltzer chunks $7,000 per ½ tabletMentos rocks $5,000 per ½ tabletBaking soda $900 per ½ teaspoonBaking powder $1000 per ½ teaspoonOther See Dr. Karen
Construction Material Cost List (this is the cost to purchase these items)
Construction paper $100/square centimeterPrinter paper $50/square centimeterAluminum foil $500/square centimeterWaxed Paper $200/square centimeterTape $50/cmGlue $10 per swipeOther See Dr. Karen
Waste costs (this is the cost that we have to pay to dispose of these items)
Water fuel $1 per milliliterVinegar fuel $2 per milliliterDiet Coke fuel $8 per milliliterTums chunks $45 per ½ tabletAlka Seltzer chunks $78 per ½ tabletMentos rocks $40 per ½ tabletBaking soda $12 per ½ teaspoonBaking powder $10 per ½ teaspoonConstruction paper $1/square centimeterPrinter paper $0.5/square centimeterAluminum foil $7/square centimeterWaxed paper $3/square centimeterTape $0.60/cmGlue $8 per swipeOther See Dr. Karen
5

Team name: _______________________
PASS (Priority Academic Student Standards) Objectives Addressed by Curriculum:
MATHEMATIC PROCESS STANDARDS (Grades 6-8):Process Standard 1: Problem Solving 1. Develop and test strategies to solve practical, everyday problems which may have single or
multiple answers. 3. Formulate problems from situations within and outside of mathematics and generalize solutions
and strategies to new problem situations.4. Evaluate results to determine their reasonableness.5. Apply a variety of strategies (e.g., restate the problem, look for a pattern, diagrams, solve a
simpler problem, work backwards, trial and error) to solve problems, with emphasis on multistep and non-routine problems.
6. Use oral, written, concrete, pictorial, graphical, and/or algebraic methods to model mathematical situations.
Process Standard 2: Communication 1. Discuss, interpret, translate (from one to another) and evaluate mathematical ideas (e.g., oral,
written, pictorial, concrete, graphical, algebraic). 2. Reflect on and justify reasoning in mathematical problem solving (e.g., convince, demonstrate,
formulate). Process Standard 3: Reasoning1. Identify and extend patterns and use experiences and observations to make suppositions. 2.
Use counter examples to disprove suppositions (e.g., all squares are rectangles, but are all rectangles squares?).
Process Standard 4: Connections 1. Apply mathematical strategies to solve problems that arise from other disciplines and the real
world. 2. Connect one area or idea of mathematics to another (e.g., relates equivalent number
representations to each other, relate experiences with geometric shapes to understanding ratio and proportion).
Process Standard 5: Representation 1. Use a variety of representations to organize and record data (e.g., use concrete, pictorial, and
symbolic representations). 4. Use a variety of representations to model and solve physical, social, and mathematical problems
(e.g., geometric objects, pictures, charts, tables, graphs).
MATHEMATICS CONTENT STANDARDS Grade 6 Standard 1: Algebraic Reasoning2. Write algebraic expressions and simple equations that correspond to a given situation. 3. Use substitution to simplify and evaluate algebraic expressions (e.g., if x = 5 evaluate 3 - 5x). Standard 2: Number Sense and Operation 2. Number Operations
a. Multiply and divide fractions and mixed numbers to solve problems using a variety of methods. b. Multiply and divide decimals with one- or two-digit multipliers or divisors to solve problems. e. Build and recognize models of multiples to develop the concept of exponents and simplify
numerical expressions with exponents and parentheses using order of operations. Standard 4: Measurement 1. Use formulas to find the circumference and area of circles in terms of pi.
6

Team name: _______________________
Standard 5: Data Analysis 1. Data Analysis: Organize, construct displays, and interpret data to solve problems (e.g., data from
student experiments, tables, diagrams, charts, graphs). 3. Central Tendency: Find the measures of central tendency (mean, median, mode, and range) of a
set of data (with and without outliers) and understand why a specific measure provides the most useful information in a given context.
MATHEMATICS CONTENT STANDARDS Grade 7 Standard 1: Algebraic Reasoning1. Identify, describe, and analyze functional relationships (linear and nonlinear) between two
variables (e.g., as the value of x increases on a table, do the values of y increase or decrease, identify a positive rate of change on a graph and compare it to a negative rate of change).
Standard 2: Number Sense and Operation 1. Number Sense
c. Demonstrate the concept of ratio and proportion with models (e.g., similar geometric shapes, scale models).
2. Number Operations a. Solve problems using ratios and proportions. b. Solve percent application problems (e.g., discounts, tax, finding the missing value of
percent/part/whole). c. Simplify numerical expressions with integers, exponents, and parentheses using order of
operations. Standard 4: Measurement 2. Apply the formula for the circumference and area of a circle to solve problems. 3. Find the area and perimeter of composite figures to solve application problems. Standard 5: Data Analysis 1. Data Analysis: Compare, translate, and interpret between displays of data (e.g., multiple sets of
data on the same graph, data from subsets of the same population, combinations of diagrams, tables, charts, and graphs).
3. Central Tendency: Compute the mean, median, mode, and range for data sets and understand how additional data or outliers in a set may affect the measures of central tendency.
MATHEMATICS CONTENT STANDARDS Grade 8 Standard 1: Algebraic Reasoning1. Equations
a. Model, write, and solve multi-step linear equations with one variable using a variety of methods to solve application problems.
d. Apply appropriate formulas to solve problems (e.g., d=rt, I=prt). Standard 2: Number Sense and Operation 2. Number Operations
c. Simplify numerical expressions with rational numbers, exponents, and parentheses using order of operations.
Standard 3: Geometry 1. Construct models, sketch (from different perspectives), and classify solid figures such as
rectangular solids, prisms, cones, cylinders, pyramids, and combined forms. Standard 4: Measurement 2. Apply knowledge of ratio and proportion to solve relationships between similar geometric
figures. 3. Find the area of a “region of a region” for simple composite figures and the area of cross
sections of regular geometric solids (e.g., area of a rectangular picture frame).
7

Team name: _______________________
Standard 5: Data Analysis 1. Data Analysis: Select, analyze and apply data displays in appropriate formats to draw
conclusions and solve problems. 3. Central Tendency: Find the measures of central tendency (mean, median, mode, and range) of a
set of data and understand why a specific measure provides the most useful information in a given context.
MATHEMATICS CONTENT STANDARDS Algebra 1 Standard 1: Number Sense and Algebraic Operations 1. Equations and Formulas
c. Use the formulas from measurable attributes of geometric models (perimeter, circumference, area and volume), science, and statistics to solve problems within an algebraic context.
d. Solve two-step and three-step problems using concepts such as rules of exponents, rate, distance, ratio and proportion, and percent.
Standard 2: Relations and Functions 1. Relations and Functions
a. Distinguish between linear and nonlinear data. 2. Linear Equations and Graphs
c. Slope III. Interpret the slope and intercepts within the context of everyday life (e.g., telephone charges
based on base rate [y-intercept] plus rate per minute [slope]). d. Develop the equation of a line and graph linear relationships given the following: slope and y-
intercept, slope and one point on the line, two points on the line, x-intercept and y-intercept, a set of data points.
Standard 3: Data Analysis, Probability and Statistics 1. Data Analysis
b. Make valid inferences, predictions, and/or arguments based on data from graphs, tables, and charts.
c. Solve two-step and three-step problems using concepts such as probability and measures of central tendency.
2. Collect data involving two variables and display on a scatter plot; interpret results using a linear model/equation and identify whether the model/equation is a line best fit for the data.
COMMON CORE STANDARDS FOR MATHEMATICS
Grade 6Ratios and Proportional Relationships 6.RP Understand ratio concepts and use ratio reasoning to solve problems.1. Understand the concept of a ratio and use ratio language to describe a ratio relationship
between two quantities. For example, “The ratio of wings to beaks in the bird house at the zoo was 2:1, because for every 2 wings there was 1 beak.” “For every vote candidate A received, candidate C received nearly three votes.”
The Number System 6.NS Compute fluently with multi-digit numbers and find common factors and multiples.2. Fluently divide multi-digit numbers using the standard algorithm.3. Fluently add, subtract, multiply, and divide multi-digit decimals using the standard algorithm for
each operation.
8

Team name: _______________________
8. Solve real-world and mathematical problems by graphing points in all four quadrants of the coordinate plane. Include use of coordinates and absolute value to find distances between points with the same first coordinate or the same second coordinate.
Expressions and Equations 6.EE Apply and extend previous understandings of arithmetic to algebraic expressions.
c. Evaluate expressions at specific values of their variables. Include expressions that arise from formulas used in real-world problems. Perform arithmetic operations, including those involving whole number exponents, in the conventional order when there are no parentheses to specify a particular order (Order of Operations). For example, use the formulas V = s3 and A = 6 s2 to find the volume and surface area of a cube with sides of length s = 1/2.
Geometry 6.G Solve real-world and mathematical problems involving area, surface area, and volume.1. Find the area of right triangles, other triangles, special quadrilaterals, and polygons by
composing into rectangles or decomposing into triangles and other shapes; apply these techniques in the context of solving real-world and mathematical problems.
Statistics and Probability 6.SP Develop understanding of statistical variability.2. Understand that a set of data collected to answer a statistical question has a distribution which
can be described by its center, spread, and overall shape.3. Recognize that a measure of center for a numerical data set summarizes all of its values with a
single number, while a measure of variation describes how its values vary with a single number.Summarize and describe distributions.4. Display numerical data in plots on a number line, including dot plots, histograms, and box plots.5. Summarize numerical data sets in relation to their context, such as by:
a. Reporting the number of observations.b. Describing the nature of the attribute under investigation, including how it was measured and
its units of measurement.c. Giving quantitative measures of center (median and/or mean) and variability (interquartile
range and/or mean absolute deviation), as well as describing any overall pattern and any striking deviations from the overall pattern with reference to the context in which the data were gathered.
d. Relating the choice of measures of center and variability to the shape of the data distribution and the context in which the data were gathered.
Grade 7Ratios and Proportional Relationships 7.RP Analyze proportional relationships and use them to solve real-world and mathematical problems.3. Use proportional relationships to solve multistep ratio and percent problems. Examples: simple
interest, tax, markups and markdowns, gratuities and commissions, fees, percent increase and decrease, percent error.
The Number System 7.NS Apply and extend previous understandings of operations with fractions to add, subtract, multiply, and divide rational numbers.3. Solve real-world and mathematical problems involving the four operations with rational
numbers.Expressions and Equations 7.EE Solve real-life and mathematical problems using numerical and algebraic expressions and equations.3. Solve multi-step real-life and mathematical problems posed with positive and negative rational
numbers in any form (whole numbers, fractions, and decimals), using tools strategically. Apply
9

Team name: _______________________
properties of operations to calculate with numbers in any form; convert between forms as appropriate; and assess the reasonableness of answers using mental computation and estimation strategies. For example: If a woman making $25 an hour gets a 10% raise, she will make an additional 1/10 of her salary an hour, or $2.50, for a new salary of $27.50. If you want to place a towel bar 9 3/4 inches long in the center of a door that is 27 1/2 inches wide, you will need to place the bar about 9 inches from each edge; this estimate can be used as a check on the exact computation.
Geometry 7.G Draw, construct, and describe geometrical figures and describe the relationships between them.1. Solve problems involving scale drawings of geometric figures, including computing actual
lengths and areas from a scale drawing and reproducing a scale drawing at a different scale.Solve real-life and mathematical problems involving angle measure, area, surface area, and volume.4. Know the formulas for the area and circumference of a circle and use them to solve problems;
give an informal derivation of the relationship between the circumference and area of a circle.6. Solve real-world and mathematical problems involving area, volume and surface area of two-
and three-dimensional objects composed of triangles, quadrilaterals, polygons, cubes, and right prisms.
Grade 8Expressions and Equations 8.EE Understand the connections between proportional relationships, lines, and linear equations.5. Graph proportional relationships, interpreting the unit rate as the slope of the graph. Compare
two different proportional relationships represented in different ways. For example, compare a distance-time graph to a distance-time equation to determine which of two moving objects has greater speed.
Functions 8.RP Use functions to model relationships between quantities.4. Construct a function to model a linear relationship between two quantities. Determine the rate
of change and initial value of the function from a description of a relationship or from two (x, y) values, including reading these from a table or from a graph. Interpret the rate of change and initial value of a linear function in terms of the situation it models, and in terms of its graph or a table of values.
5. Describe qualitatively the functional relationship between two quantities by analyzing a graph (e.g., where the function is increasing or decreasing, linear or nonlinear). Sketch a graph that exhibits the qualitative features of a function that has been described verbally.
Statistics and Probability 8.SP Investigate patterns of association in bivariate data.1. Construct and interpret scatter plots for bivariate measurement data to investigate patterns of
association between two quantities. Describe patterns such as clustering, outliers, positive or negative association, linear association, and nonlinear association.
2. Know that straight lines are widely used to model relationships between two quantitative variables. For scatter plots that suggest a linear association, informally fit a straight line, and informally assess the model fit by judging the closeness of the data points to the line.
3. Use the equation of a linear model to solve problems in the context of bivariate measurement data, interpreting the slope and intercept. For example, in a linear model for a biology experiment, interpret a slope of 1.5 cm/hr as meaning that an additional hour of sunlight each day is associated with an additional 1.5 cm in mature plant height.
10

Team name: _______________________
Day 1: Propellant design
Mathematical Concepts: Algebra, fractions, ratiosCareers: Chemists and chemical engineeringDesign Cycle Focus: Research
Careers:ChemistryIn simplest terms, chemistry is the science of matter. Anything that can be touched, tasted, smelled, seen or felt is made of chemicals. Chemists are the people who (discover how to) transform the everyday materials around us into amazing things. Some chemists work on cures for cancer while others monitor the ozone protecting us from the sun. Still others discover new materials to make our homes warmer in the winter, or new textiles to be used in the latest fashions. (acs.org)
Chemical engineering:Chemical engineers take raw materials and turn them into the products that we use every day (using manufacturing processes). This means that they are crucial to producing pharmaceuticals, soft drinks, and even makeup. Many chemical engineers work with petroleum and plastics, although both of these are the subject of independent disciplines. The term “environmental engineering” also applies to certain areas of chemical engineering, such as pollution control. (http://www.egfi-k12.org/ )
Activities:Determine a team name:Together as a project team, determine a name for your team!
Propellant design:For this part, we are going to be focusing on the researching phase of the engineering design cycle. We are going to be considering different types of propellants and think about which one(s) work the best in film canister rockets. As you have seen in the background information for economic data, you have available to you several materials to try out to figure out which ones are best for our rocket. Remember that the key is to produce as much pressure as fast as possible.
Experiment with the different propellant mixtures; be sure to keep cost in mind. You will notice that you have not been given any of the film canisters with lids (one without a lid is given to you so you can figure out volume if you want to). You are researching, not implementing yet! So first of all, hypothesize as to what needs to happen to make a lot of pressure, what do you need to look for as you are combining material? Use Table 1 to record what happens when you mix two different materials together. As you do your experiments, write down observations. During this part, we are acting like chemists!
11
Research

Team name: _______________________
Make sure to wear you safety glasses at all timesYou have a limited amount of resources so use your materials wisely!!
Consider here what you will need to look for when you mix the chemicals together.
________________________________________________________________________________
________________________________________________________________________________
________________________________________________________________________________
________________________________________________________________________________
Table 1. What happens when different substances are mixed?
Vinegar Water Diet CokeTums
Alka Seltzer
Mentos
Baking Soda
Baking Powder
Observations:
________________________________________________________________________________
________________________________________________________________________________
________________________________________________________________________________
________________________________________________________________________________
12

Team name: _______________________
Now let’s think like Chemical Engineers, how do we apply our discoveries from Table 1 to make useful propellants for our rockets? Consider the four best combinations to further test. By, the way, you can combine more than two if you want, for example one liquid with two solids. Indicate amounts of the materials that you want to test for the propellants
Table 2. Candidate propellants (with amounts)
Propellant #1 Propellant #2 Propellant #3 Propellant #4Tums
Alka Seltzer
Mentos
Baking Soda
Baking Powder
Vinegar
Water
Diet Coke
Data collection:Now we are going to decide which of the four propellants is best (again without actually using a film canister or rocket). Remember, we want to make the most pressure as fast as we can. To determine how our pressure increases with time, we are going to use a balloon, a graduated cylinder, a stopwatch, and our candidate propellants. You are going to place the materials in the cylinder, put the balloon over the top and watch and collect data about how the radius of the balloon changes with time. Think creatively how you are going to do this as a team. Remember that radius is ½ of the diameter of the ballon.
Graphing data:Once you have your data from Table 3, then you need to graph the data on the attached plot (note that there is some extra graph paper at the end of the packet). Place the data for all four propellants on the plot, that way we can compare them easier. Use different colors for each of the different propellants. Label the title and both axes.
What do you notice about the plots for the four propellants? Write down observations on your plot.
13

Team name: _______________________
Table 3. Balloon radius versus timeTime (sec) Propellant #1
Radius (cm)Time (sec) Propellant #2
Radius (cm)
Time (sec) Propellant #3Radius (cm)
Time (sec) Propellant #4Radius (cm)
14

Team name: _______________________
Observations/information:
15

Team name: _______________________
Analyzing the graphs
Look at the four plots of data. Do any of them look linear? If so, calculate the slope and intercept of the data.
Remember that y=mx+b, where m is the slope and b is the intercept
#1 – linear or not? Slope, intercept if it is.
#2 – linear or not? Slope, intercept if it is.
#3 – linear or not? Slope, intercept if it is.
#4 – linear or not? Slope, intercept if it is.
Which balloon produces the highest pressure?
Which propellant produces the largest balloon radius? (this is the propellant that generated the most pressure)?
The largest radius is ________________________________________________________ cm
Now calculate the ratio of the other 3 propellant radius’ to the largest radius
Ratio One___________________________________________________________________________
Ratio Two___________________________________________________________________________
Ratio Three __________________________________________________________________________
16

Team name: _______________________
Which is the best propellant?
What else is important beside which one produces the highest pressure (which one leads to the largest radius? Think about the slope of the data graphs, what does a larger slope mean? Remember our design objectives of fastest liftoff with highest height of liftoff – and as cheap as possible!)
Tomorrow we are going to try the best two propellants you picked out from your results of your researching today.
Write down your propellants that you are going to try tomorrow:
________________________________________________________________________________
________________________________________________________________________________
________________________________________________________________________________
________________________________________________________________________________
________________________________________________________________________________
________________________________________________________________________________
17

Team name: _______________________
Day 2: Propellant testing and rocket launching
Mathematics concepts: Algebra, geometry, fractions, ratios, proportions, functionsCareer: Aerospace engineeringDesign cycle focus: Modeling
CareersAerospace EngineeringThe intellectual descendants of the Wright brothers, aerospace engineers design and develop some of the world’s most marvelous machines. Commercial airplanes, military fighter jets, and space telescopes are all brainchildren of aerospace engineers. But aerospace technology has plenty of earthbound applications, such as aiding in the design of race cars and golf balls. (http://www.egfi-k12.org/)
Activities:Construct rockets A model or drawing of the rockets we are going to use is given on the next page. For this day, we are going to use construction paper. Tomorrow we are going to experiment with different materials. Construct four rockets. Make your four rockets absolutely identical.
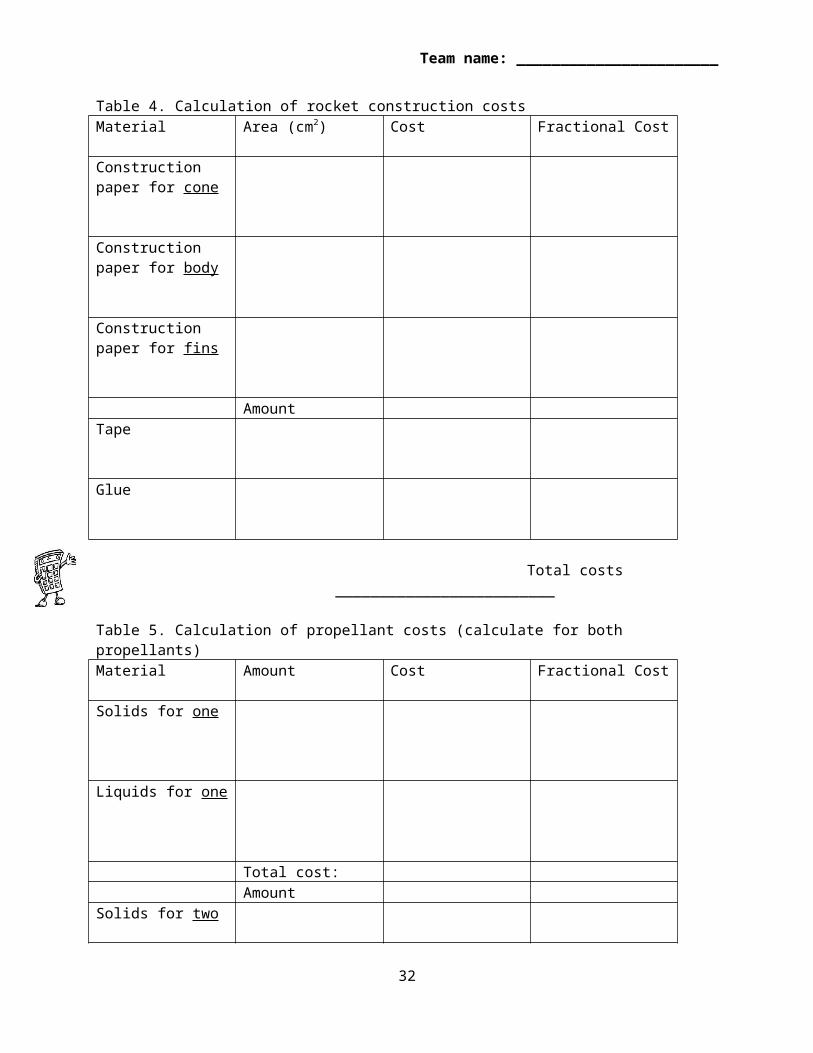
As you construct your rocket, you are going to need to:1. Calculate the area of construction paper used for the three parts of the rocket, the cone, body,
and fins (put calculations in Table 4). 2. Calculate the costs for the construction paper used (for the cone, body, and fins) as well as the
tape and glue (put calculations in Table 4). 3. Calculate the fractional costs that are for each of the 5 parts of the rocket (Table 4). 4. Calculate the costs of your two propellants (Table 5). 5. Calculate the fractional costs for the parts of the propellant (Table 5)
So for example:
Say the total cost for the rocket came to $100 and the cost of the construction paper for the cone is $15, then the fractional cost of the cone is:
$15/$100 = 15/100 or 3/20ths
18
Model
Team name: _______________________
19

Team name: _______________________
Table 4. Calculation of rocket construction costsMaterial Area (cm2) Cost Fractional Cost
Construction paper for cone
Construction paper for body
Construction paper for fins
AmountTape
Glue
Total costs _________________________
Table 5. Calculation of propellant costs (calculate for both propellants)Material Amount Cost Fractional Cost
Solids for one
Liquids for one
Total cost:Amount
Solids for two
Liquids for two
20

Team name: _______________________
Total cost:
21

Team name: _______________________
Launch your rockets one at a time to test the 2 propellants for lift off time and height. Use two rockets to test your first propellant and two rockets to test your second propellant. Record this information in Table 6. Your team is going to need to think creatively about how to obtain height data.
Table 6. Rocket launch data.Propellant mixture Time for liftoff
(seconds)Height rocket traveled (meters)
Then calculate costs for the four combinations (Put in Table 7). Models (equations) for costs:
Determine ratios of parts of costs to total costs (liftoff cost to total cost for example).
Table 7. Total launching costs.Rocket Cost (S) (Table 4)
Propellant Cost ($) (Table 5)
Ignition cost ($) Liftoff cost ($) Total cost ($)
Propellant 1 Rocket 1
Ratio Propellant 1 Rocket 2
RatioPropellant 2 Rocket 1
Ratio
Propellant 2 Rocket 2 Ratio
22

Team name: _______________________
Based on the observations from day 2, which propellant do you plan to use for the rest of this unit?
____________________________________________________________________________
____________________________________________________________________________
____________________________________________________________________________
Draw a scale drawing of your rocket here (scale 0.5 cm on the drawing= 1 cm)
23

Team name: _______________________
Day 3: Rocket redesign
Mathematics concepts: Decimals, algebra, geometryCareers: Materials and mechanical engineeringDesign cycle focus: Implementation
Careers:Mechanical Engineering:Mechanical engineers use mechanics and energy principles to design machines such as engines and motors. Many mechanical engineers work in the areas of air-conditioning and refrigeration, automotive, manufacturing, welding, and robotics. They designed the robotically controlled braces that people with disabilities use to walk. (http://www.egfi-k12.org/)
Materials Engineering:Metallurgical and materials engineers extract, process, refine, combine, and manufacture natural substances to create new materials that are stronger and resist corrosion. Metallurgical engineers work with metal only. Teams of metallurgy and materials engineers created the US Air Force's "stealth" technology that makes a fighter plane's surface nearly invisible to radar. (http://www.egfi-k12.org/)
Activities:Rocket redesign with materials selectionToday you will get to have a completely creative day to try to construct the best rocket (using the best propellant you selected from day 2). Try all sorts of things. Different materials, height of rocket, number of fins, etc. Create up to 10 candidate rockets to try out. Record data in Table 8.
If you have brought in different material than what has been supplied, ask for the costs. Once you have decided on the “best” rocket, calculate the cost of the new rocket. Also develop a spec sheet to help in the manufacturing of the rocket. Imagine that you are handing over your plans to someone else to manufacture. Thus, your plans need to be very specific. Tomorrow we are going to mass produce 10 of the rockets in an assembly line.
24
Implement

Team name: _______________________
Table 8. Rocket Redesign Trials
Rocket Mass of rocket (g)
Other data (materials, number of fins, height, etc.)
Time for liftoff (seconds)
Height rocket traveled (meters)
#1
#2
#3
#4
#5
#6
#7
#8
#9
#10
Construction cost of best rocket:
25

Team name: _______________________
Specification sheet (Spec Sheet)
Table 9. Materials list.
Material How much/many Instructions
Table 10. Equipment list.
Device How many Instructions
26

Team name: _______________________
Schematic of rocket (remember to show the scale):
Construction instructions:
27

Team name: _______________________
Day 4: Economics and manufacturing process design, redesigned rocket launch
Mathematics concepts: Data analysisCareer: Industrial engineeringDesign cycle focus: Measuring
Careers:Industrial engineering:Industrial engineers organize the people, information, energy, materials, and machines involved in the production process. They are concerned with plant design and management, quality control, and the human factors of engineering. Industrial engineers perform tasks such as finding the best location for a high-tech company's new plant. (http://www.egfi-k12.org/)
Activities:Manufacturing process:Yesterday, you developed a “best” rocket to use with your “best” propellant. Today you are going to develop a process to manufacture 10 rockets. Develop a flow chart for the process (see background example). This describes the order of manufacturing. Put it on the next page. Show in what order you are going to construct what part of your rockets.
You are trying to build 10 identical rockets in the fastest amount of time. Industrial engineers use assembly lines to create products. Think about cars. One person might put on the doors, another person might put on the tires, another person might put on the windshield, etc. This allows each person to specialize in their assigned job. Consider how you might do this with your rocket manufacturing.
When you are ready with your process, start a timer, and mass produce your 10 rockets. Make sure to record how long it takes you to produce your 10 rockets.
Do not throw away your waste! We need it for the next step.
Collect environmental dataPut all of your waste materials (those that you didn’t use in your 10 rockets) in Table 11. Tomorrow you will calculate environmental waste.
Launch redesigned rocketsNow you get to launch the 10 rockets that you mass produced. The data goes in Table 12.
28
Measure

Team name: _______________________
Manufacturing Flow Diagram:
Time to construct 10 rockets: ____________________________________________ (seconds)
29

Team name: _______________________
Processing Waste:YOU MUST COUNT EVERYTHING THAT CAN’T BE REUSED, AS WASTE
Table 11. Waste Waste category: Mass: Amount: Cost per amount: Cost for category:
Total mass Total costof waste ___________________ of waste _________________________(grams) ($)
30

Team name: _______________________
Table 12. Redesigned rocket launch data
Standardized rocket propellant: _____________________________________
_____________________________________
_____________________________________
Cost of propellant: _____________________________________
Cost of construction: _____________________________________
Rocket Mass (grams)
Time for liftoff (seconds)
Height rocket traveled (meters)
#1
#2
#3
#4
#5
#6
#7
#8
#9
#10
31
Team name: _______________________
Day 5: Redesigned Rocket Launch Data Analysis and Reporting
Mathematics concepts: Data analysis, percentsCareer: Environmental engineeringDesign cycle focus: Communication
Careers:Environmental Engineering:Environmental engineers assist with the development of water distribution systems, recycling methods, sewage treatment plants, and other pollution prevention and control systems in the water, air, and land. Environmental engineers constantly seek new ways to reduce air pollution and pesticides. (http://www.egfi-k12.org/)
Activity:Analyze rocket redesign launch data:Yesterday you shot off 10 rockets and entered data in Table 12. Today we are going to try to determine the overall performance of your rocket launch. Determine the statistics of the rocket redesign launch data (see attached). Calculate:
Mean Median Range
For rocket mass, rocket liftoff, and rocket launch height.
Also, for the rocket redesign launch data (mass, liftoff and height) graph the data on box and whisker plots.
Analyze environmental waste (cost and mass):Yesterday you collected data (Table 11) for amount and mass of the various production wastes.
1. Calculate your total production waste mass and costs. 2. Determine the amount of total production waste mass that comes from each category3. Determine the amount of total production waste cost that comes from each category
Category waste cost calculations:Let say you wasted 10 cm of tapeThe waste disposal cost for tape is $0.6/cm
So, the waste cost for the tape is:(10 cm )($0.6/cm) = $6
32
Communicate

Team name: _______________________
Repeat these calculations for every category of waste that you will have to dispose of.Then sum up the categories.
Production waste mass percentages:
Let’s say the TOTAL mass generated by our production process is 200 gramsAnd the mass of tape wasted is 15 grams
The percentage of the total waste mass for the tape is:(15 grams/200 grams)*100% = 7.5 %
Production waste cost percentages:
Let’s say the TOTAL cost of the waste disposal for our production process is $150Above, we calculated the cost for the tape to be $6
The percentage of the total waste disposal cost for the tape is:($6/$150)*100% = 4 %
33

Team name: _______________________
Statistics on rocket redesign launch data (see Table 12)
Mass of rocketsMean
Median
Box and Whisker plot:
Time for liftoffMean
Median
Box and Whisker plot:
Height of liftoffMean
Median
Box and Whisker plot:
34

Team name: _______________________
Statistics on waste (see Table 11)
Total waste mass
Determine percentage contribution of each category
Total waste cost
Determine percentage contribution of each category
35

Team name: _______________________
Report resultsHere it is up to your group to decide what are the best data to present to NASA. Think about what they would find most useful.
Best propellant information (cost, percents, ratios)
Best rocket information (cost, percents, ratios, statistics)
Production process information (waste mass, waste costs, percents, ratios, production time, etc.)
36

Team name: _______________________
Final flowcart of production process
Final schematic of rocket
37

Team name: _______________________
Observations/information:
38

Team name: _______________________
Observations/information:
39

Team name: _______________________
_____________________________________________________________________________________
_____________________________________________________________________________________
_____________________________________________________________________________________
_____________________________________________________________________________________
_____________________________________________________________________________________
_____________________________________________________________________________________
_____________________________________________________________________________________
_____________________________________________________________________________________
_____________________________________________________________________________________
_____________________________________________________________________________________
_____________________________________________________________________________________
_____________________________________________________________________________________
_____________________________________________________________________________________
_____________________________________________________________________________________
_____________________________________________________________________________________
_____________________________________________________________________________________
_____________________________________________________________________________________
_____________________________________________________________________________________
_____________________________________________________________________________________
_____________________________________________________________________________________
_____________________________________________________________________________________
_____________________________________________________________________________________
_____________________________________________________________________________________
_____________________________________________________________________________________
40

Team name: _______________________
_____________________________________________________________________________________
_____________________________________________________________________________________
_____________________________________________________________________________________
_____________________________________________________________________________________
_____________________________________________________________________________________
_____________________________________________________________________________________
_____________________________________________________________________________________
_____________________________________________________________________________________
_____________________________________________________________________________________
_____________________________________________________________________________________
_____________________________________________________________________________________
_____________________________________________________________________________________
_____________________________________________________________________________________
_____________________________________________________________________________________
_____________________________________________________________________________________
_____________________________________________________________________________________
_____________________________________________________________________________________
_____________________________________________________________________________________
_____________________________________________________________________________________
_____________________________________________________________________________________
_____________________________________________________________________________________
_____________________________________________________________________________________
_____________________________________________________________________________________
_____________________________________________________________________________________
41