Embed Size (px)
Citation preview

Non-observed economy.Measurement and recording in the national accounts of the Republic of Belarus.
1
General Directorate of National Accounts
National Statistical Committee of the Republic of Belarus
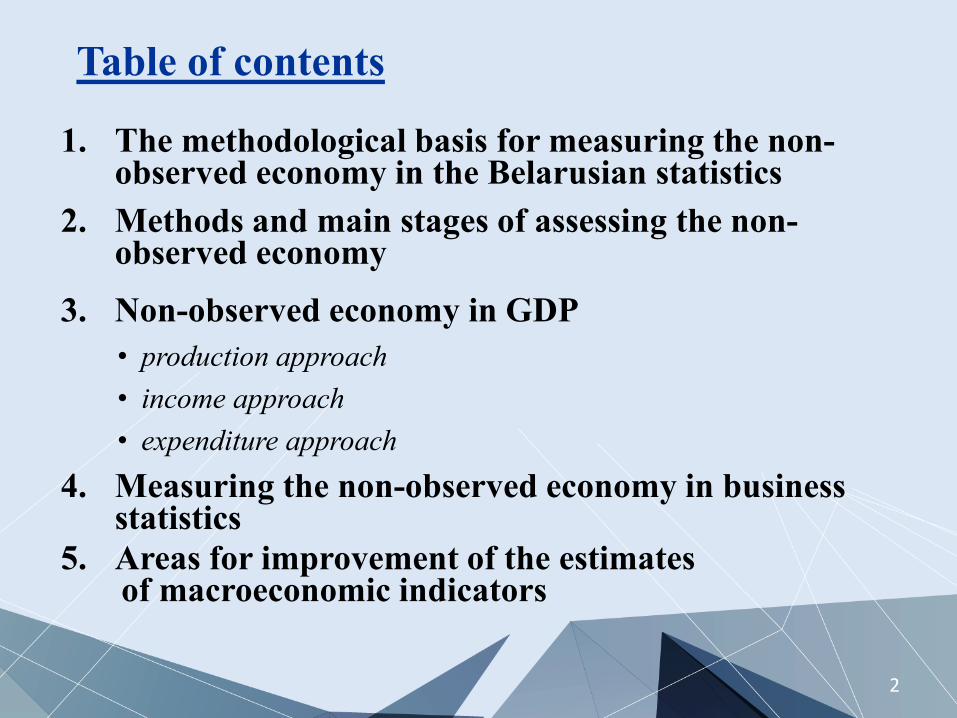
Table of contents
1. The methodological basis for measuring the non-observed economy in the Belarusian statistics
2. Methods and main stages of assessing the non-observed economy
3. Non-observed economy in GDP• production approach• income approach• expenditure approach
4. Measuring the non-observed economy in business statistics
5. Areas for improvement of the estimatesof macroeconomic indicators
2
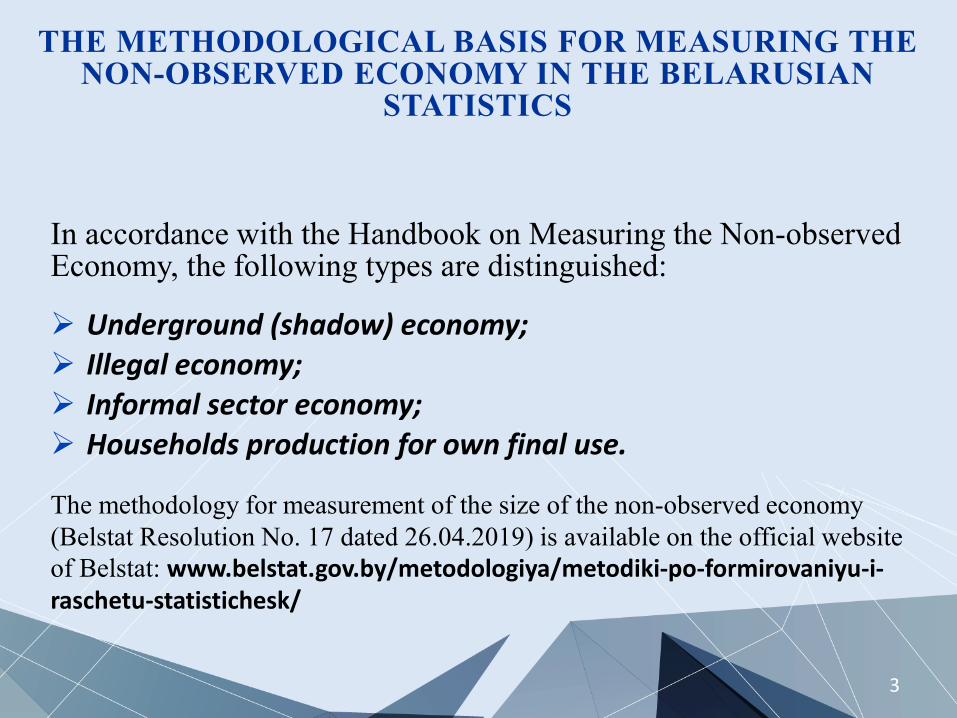
THE METHODOLOGICAL BASIS FOR MEASURING THE NON-OBSERVED ECONOMY IN THE BELARUSIAN
STATISTICS
In accordance with the Handbook on Measuring the Non-observed Economy, the following types are distinguished:
Underground (shadow) economy; Illegal economy; Informal sector economy; Households production for own final use.
The methodology for measurement of the size of the non-observed economy (Belstat Resolution No. 17 dated 26.04.2019) is available on the official website of Belstat: www.belstat.gov.by/metodologiya/metodiki-po-formirovaniyu-i-raschetu-statistichesk/
3

METHODS FOR ASSESSING THE NON-OBSERVED ECONOMY
4
Direct estimate
Indirect estimate
data from statistical reports and sample surveysadministrative data sources
comparison of supply and demandcomparison of households’ income and expenditureestimates based on employment indicatorscommodity flow methodbalancing resources and uses by individual commodities

THE MAIN STEPS OF ASSESSING THE NON-OBSERVED ECONOMY
5
Business statistics indicators used in the calculation of output
National accounts
Input-Output Tables

SHARE OF NON-OBSERVED ECONOMY IN GDPBY THE PRODUCTION METHOD
(ACCORDING TO THE EUROSTAT TABULAR APPROACH)
6
2015 2016 2017 2018 2019
N1 0.5 0.3 0.3 0.4 0.5
N2 - - - - -
N3 5.0 5.6 5.9 5.5 5.3
N4 0 0 0 0 0
N5 3.9 3.1 2.9 3.0 3.1
N6 1.5 1.2 1.1 1.2 1.2
N7 0.3 0.2 0.2 0.2 0.1

SHARE OF NON-OBSERVED ECONOMY IN GDPBY MAIN ECONOMIC ACTIVITY GROUPS
7
2015 2016 2017 2018 2019
Total and by activity as % of GDP 11.2 10.4 10.4 10.3 10.2
Agriculture, forestry and fisheries 1.9 2.2 2.3 2.1 1.9
Manufacturing industry 0.4 0.4 0.5 0.5 0.7
Construction activities 0.5 0.4 0.3 0.4 0.4Trade 2.4 1.5 1.2 1.1 1.0Transport 0.6 0.3 0.4 0.5 0.5Real estate activities 3.4 3.8 3.8 3.6 3.5Other activities 2.0 1.8 1.9 2.1 2.2
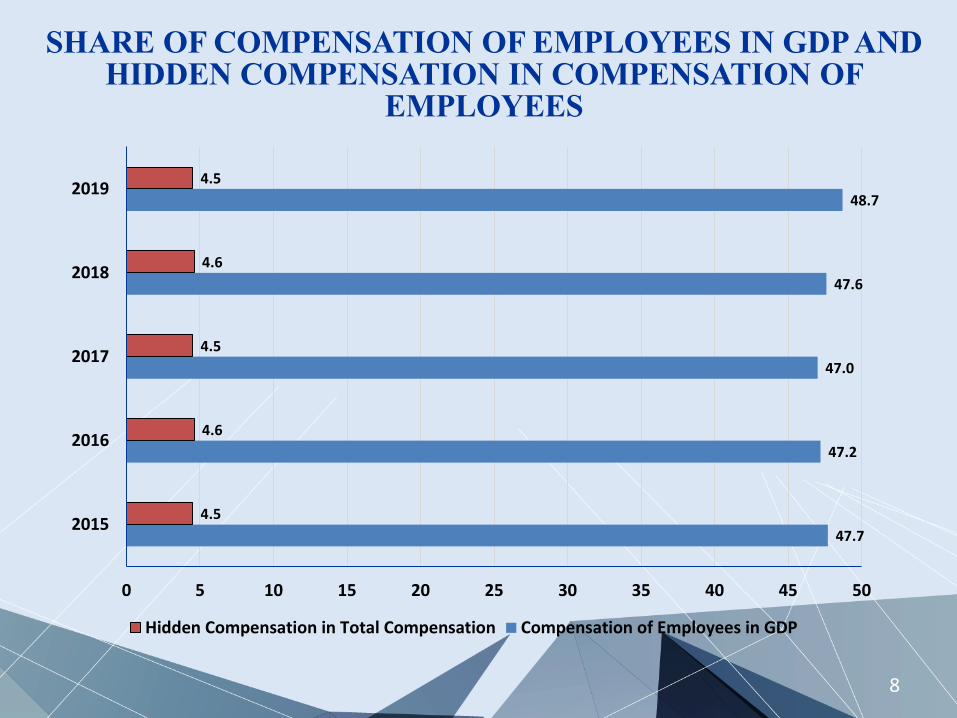
SHARE OF COMPENSATION OF EMPLOYEES IN GDP AND HIDDEN COMPENSATION IN COMPENSATION OF
EMPLOYEES
8
47.7
47.2
47.0
47.6
48.7
4.5
4.6
4.5
4.6
4.5
0 5 10 15 20 25 30 35 40 45 50
2015
2016
2017
2018
2019
Hidden Compensation in Total Compensation Compensation of Employees in GDP

THE SHARE OF NON-OBSERVED ECONOMY IN GDP BY EXPENDITURE COMPONENT
9
2015 2016 2017 2018 2019
Total and by expenditure componsen in % of GDP 12.2 12.2 13.3 12.1 11.4
Household final consumption expenditure 11.0 11.0 11.6 10.3 9.5
GFCF 1.0 0.8 0.9 0.7 0.8Export of goods and services
0.4 0.5 0.8 1.4 1.4
Import of goods and services
0.2 0.1 0.03 0.3 0.3

10
NON-OBSERVED ECONOMY IN BUSINESS STATISTICS INDICATORS
Foreign trade statistics
export
import
Domestic trade statistics
turnover of individual entrepreneurs outside markets and shopping
centres
Hidden paid services provided to the population
Labor statistics Transport statistics
hidden compensation of emplayees Occasional transport of
passengers (cargo)

11
AREAS FOR IMPROVEMENT OF THE ESTIMATES OF MACROECONOMIC INDICATORS

THANK YOU FOR YOUR ATTENTION.
12


![[presentation name]](https://img.pdfslide.us/doc/110x75/56813dff550346895da7d9b1/presentation-name-568e361f8893e.jpg)