Embed Size (px)
Citation preview
NAME: __________________________________DATE: ______________________SECTION: _________MRS. KEINATH
1
NAME: __________________________________DATE: ______________________SECTION: _________MRS. KEINATH
2
Vocabulary and Formulas: Correlation coefficient – The correlation coefficient, r, measures the direction and strength of a linear relationship
between two variables. Formula: ⎟⎟⎠
⎞⎜⎜⎝
⎛ −⎟⎟⎠
⎞⎜⎜⎝
⎛ −
−= ∑
y
i
x
i
syy
sxx
nr
11 .
Extrapolation – the use of a regression curve to make predictions about a relationship between two variables when the input value is less than the smallest, or greater than the largest, first coordinate of any data point used in creating the regression curve. Interpolation –the use of a regression curve to make predictions about a relationship between two variables when the input value is between two numbers which occur as first coordinates of data points used in creating the regression curve. Linear regression line – A straight line that approximates the relationship between two variables represented by a set of data points. Least squares regression line (LSRL) – the line that minimizes the sum of the squares of the vertical distances between the data points and any possible regression line. Median-median line – a linear regression line found by a method based on the calculation of medians. This method of linear regression requires that the data points are ordered from smallest to largest first coordinate and then separates the data into three equal, or nearly equal, groups with at least 1/3 of the data points in each of the first and last groups. The median x-values and y-values of each group are calculated. These medians, from smallest x-values to largest, are named ( ) ( ) ( )332211 ,,,,, yxyxyx . Then a line through the first and third medians is found. Finally, a line parallel to this line, 1/3 of the distance between the line and the remaining median is formed. The resulting line is of the following
form( )3
,, 321321
13
13 xxxayyybxxyyabaxy ++−++
=−
−=+= . This method of regression is more resistant to outliers
than the least squares regression line. Method of finite differences – a method for determining if data points with equally spaced x-values exactly fit a linear, quadratic, or higher degree polynomial model. Quadratic Regression – a quadratic function that minimizes the sum of the squares of the vertical distances between the data points and any possible quadratic function to approximate the data. Regression curve – the graph of a function, including possibly a linear function; that approximates the relationship between two variables represented by a set of data points. (Linear and quadratic regression are explored in this unit.)
NAME: __________________________________DATE: ______________________SECTION: _________MRS. KEINATH
3
NAME: __________________________________DATE: ______________________SECTION: _________MRS. KEINATH
4
NAME: __________________________________DATE: ______________________SECTION: _________MRS. KEINATH
5
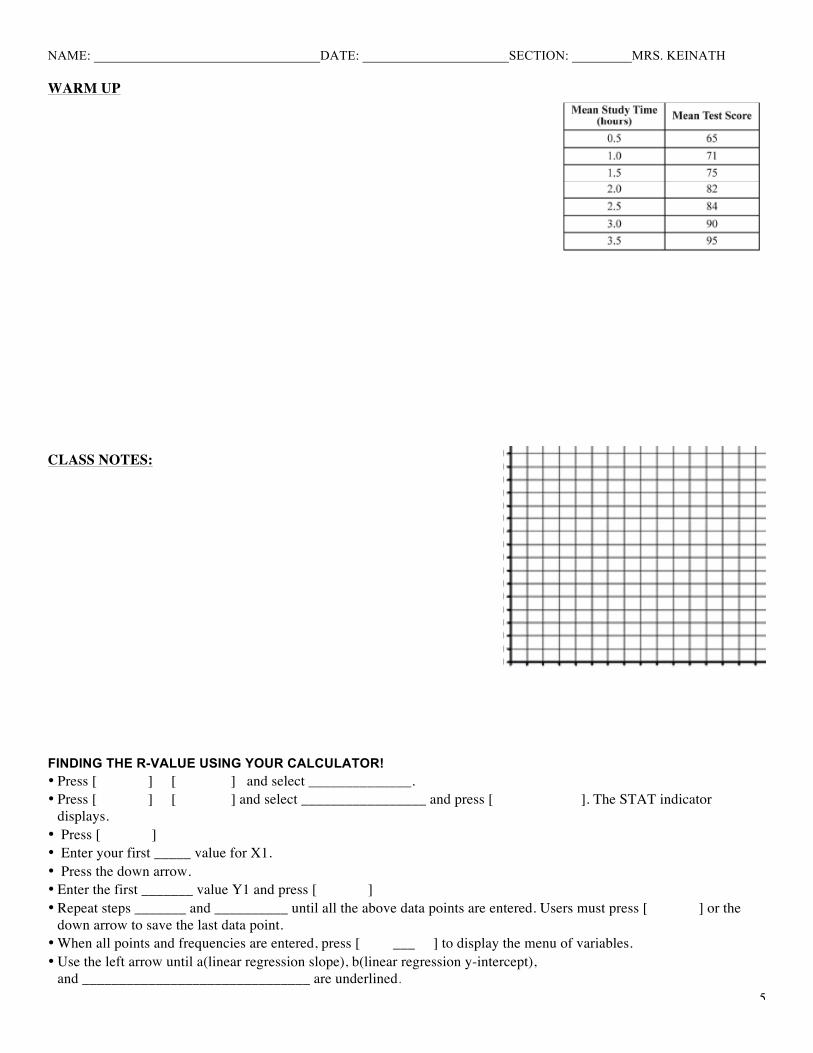
WARM UP CLASS NOTES: FINDING THE R-VALUE USING YOUR CALCULATOR! • Press [ ] [ ] and select ______________. • Press [ ] [ ] and select _________________ and press [ ]. The STAT indicator
displays. • Press [ ] • Enter your first _____ value for X1. • Press the down arrow. • Enter the first _______ value Y1 and press [ ] • Repeat steps _______ and __________ until all the above data points are entered. Users must press [ ] or the
down arrow to save the last data point. • When all points and frequencies are entered, press [ ___ ] to display the menu of variables. • Use the left arrow until a(linear regression slope), b(linear regression y-intercept),
and _______________________________ are underlined.
NAME: __________________________________DATE: ______________________SECTION: _________MRS. KEINATH
6
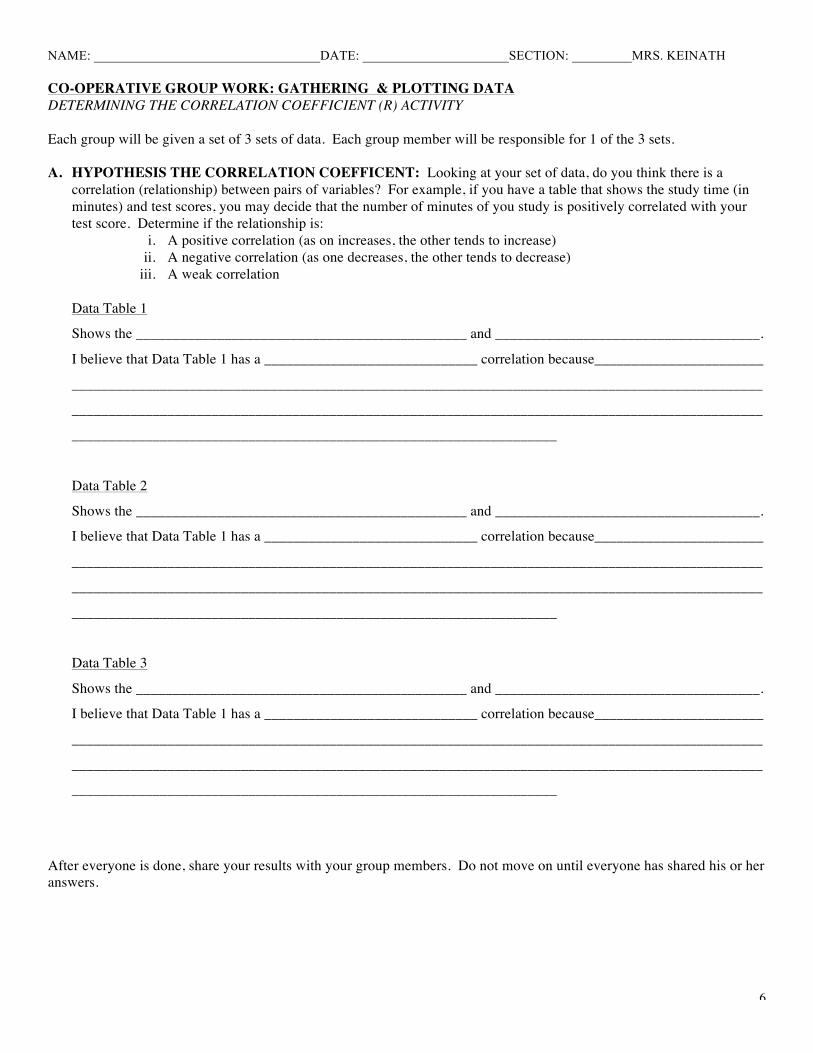
CO-OPERATIVE GROUP WORK: GATHERING & PLOTTING DATA DETERMINING THE CORRELATION COEFFICIENT (R) ACTIVITY Each group will be given a set of 3 sets of data. Each group member will be responsible for 1 of the 3 sets. A. HYPOTHESIS THE CORRELATION COEFFICENT: Looking at your set of data, do you think there is a
correlation (relationship) between pairs of variables? For example, if you have a table that shows the study time (in minutes) and test scores, you may decide that the number of minutes of you study is positively correlated with your test score. Determine if the relationship is:
i. A positive correlation (as on increases, the other tends to increase) ii. A negative correlation (as one decreases, the other tends to decrease)
iii. A weak correlation
Data Table 1
Shows the _____________________________________________ and ____________________________________.
I believe that Data Table 1 has a _____________________________ correlation because_______________________
______________________________________________________________________________________________
______________________________________________________________________________________________
__________________________________________________________________
Data Table 2
Shows the _____________________________________________ and ____________________________________.
I believe that Data Table 1 has a _____________________________ correlation because_______________________
______________________________________________________________________________________________
______________________________________________________________________________________________
__________________________________________________________________
Data Table 3
Shows the _____________________________________________ and ____________________________________.
I believe that Data Table 1 has a _____________________________ correlation because_______________________
______________________________________________________________________________________________
______________________________________________________________________________________________
__________________________________________________________________
After everyone is done, share your results with your group members. Do not move on until everyone has shared his or her answers.
NAME: __________________________________DATE: ______________________SECTION: _________MRS. KEINATH
7
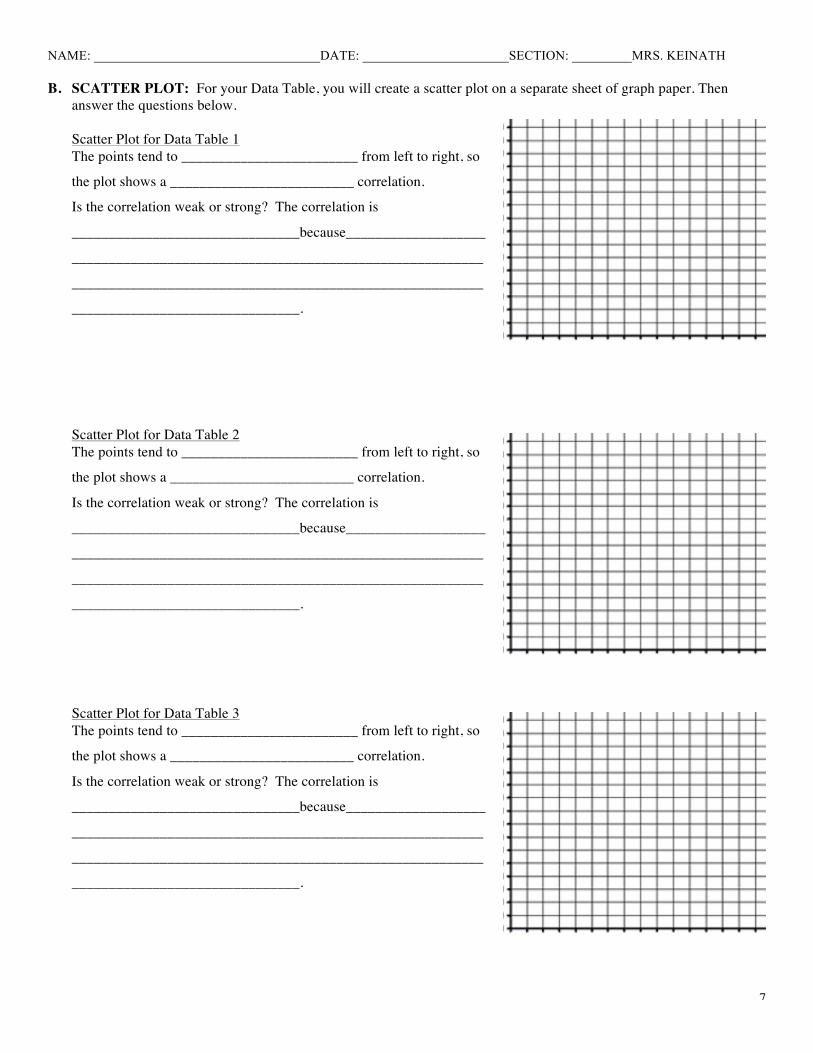
B. SCATTER PLOT: For your Data Table, you will create a scatter plot on a separate sheet of graph paper. Then
answer the questions below. Scatter Plot for Data Table 1 The points tend to ________________________ from left to right, so
the plot shows a _________________________ correlation.
Is the correlation weak or strong? The correlation is
_______________________________because___________________
________________________________________________________
________________________________________________________
_______________________________.
Scatter Plot for Data Table 2 The points tend to ________________________ from left to right, so
the plot shows a _________________________ correlation.
Is the correlation weak or strong? The correlation is
_______________________________because___________________
________________________________________________________
________________________________________________________
_______________________________.
Scatter Plot for Data Table 3 The points tend to ________________________ from left to right, so
the plot shows a _________________________ correlation.
Is the correlation weak or strong? The correlation is
_______________________________because___________________
________________________________________________________
________________________________________________________
_______________________________.
NAME: __________________________________DATE: ______________________SECTION: _________MRS. KEINATH
8
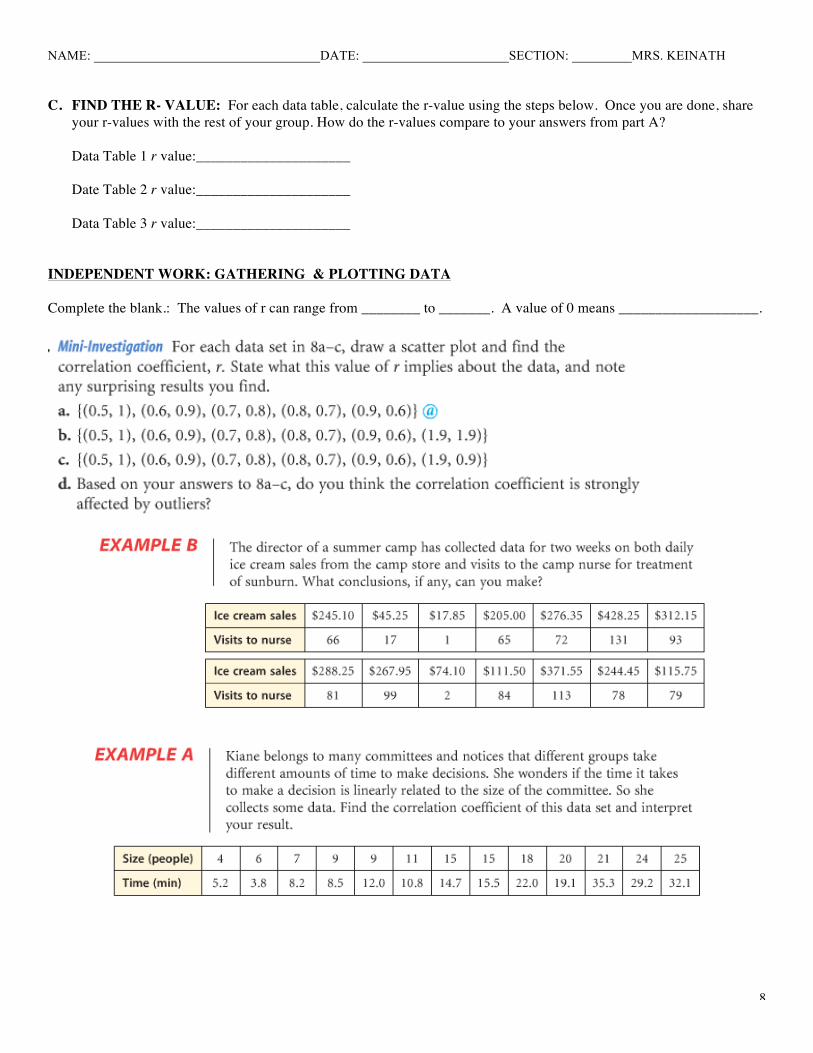
C. FIND THE R- VALUE: For each data table, calculate the r-value using the steps below. Once you are done, share
your r-values with the rest of your group. How do the r-values compare to your answers from part A?
Data Table 1 r value:_____________________ Date Table 2 r value:_____________________ Data Table 3 r value:_____________________
INDEPENDENT WORK: GATHERING & PLOTTING DATA
Complete the blank.: The values of r can range from ________ to _______. A value of 0 means ___________________.
NAME: __________________________________DATE: ______________________SECTION: _________MRS. KEINATH
9
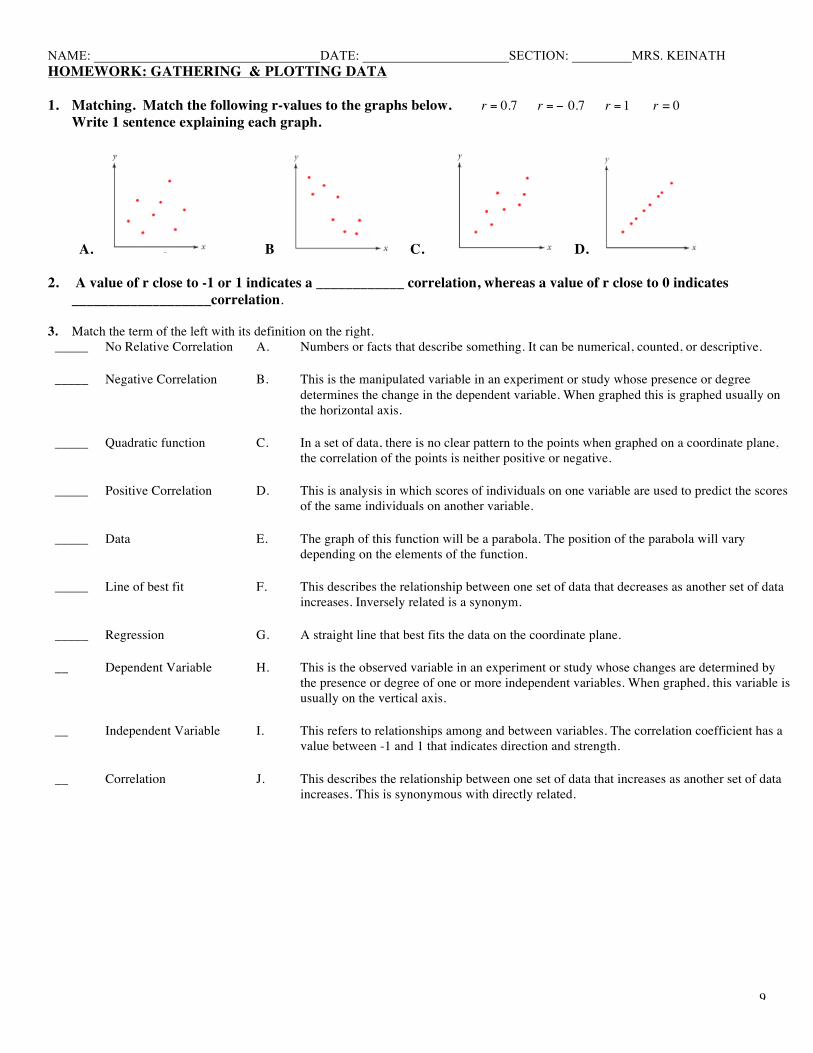
HOMEWORK: GATHERING & PLOTTING DATA 1. Matching. Match the following r-values to the graphs below.
!
r = 0.7 r = " 0.7 r = 1 r = 0 Write 1 sentence explaining each graph.
A. B C. D. 2. A value of r close to -1 or 1 indicates a ____________ correlation, whereas a value of r close to 0 indicates
___________________correlation. 3. Match the term of the left with its definition on the right.
_____ No Relative Correlation A. Numbers or facts that describe something. It can be numerical, counted, or descriptive.
_____ Negative Correlation B. This is the manipulated variable in an experiment or study whose presence or degree determines the change in the dependent variable. When graphed this is graphed usually on the horizontal axis.
_____ Quadratic function C. In a set of data, there is no clear pattern to the points when graphed on a coordinate plane, the correlation of the points is neither positive or negative.
_____ Positive Correlation D. This is analysis in which scores of individuals on one variable are used to predict the scores of the same individuals on another variable.
_____ Data E. The graph of this function will be a parabola. The position of the parabola will vary depending on the elements of the function.
_____ Line of best fit F. This describes the relationship between one set of data that decreases as another set of data increases. Inversely related is a synonym.
_____ Regression G. A straight line that best fits the data on the coordinate plane.
__ Dependent Variable H. This is the observed variable in an experiment or study whose changes are determined by the presence or degree of one or more independent variables. When graphed, this variable is usually on the vertical axis.
__ Independent Variable I. This refers to relationships among and between variables. The correlation coefficient has a value between -1 and 1 that indicates direction and strength.
__ Correlation J. This describes the relationship between one set of data that increases as another set of data increases. This is synonymous with directly related.

NAME: __________________________________DATE: ______________________SECTION: _________MRS. KEINATH
10
WARM UP: CLASS NOTES
NAME: __________________________________DATE: ______________________SECTION: _________MRS. KEINATH
11
CO-OPERATIVE GROUP WORK: Linear Regression: Line of Best Fit & Median-Median Line
BEAM STRENGTH How strong do the beams in a ceiling have to be? How do bridge engineers select beams to support traffic? In this investigation you will collect data and find a linear model to determine the strength of various “beams” made of spaghetti. Materials: Graph Paper, Uncooked Spaghetti, 4 Textbooks, 1 Plastic cup, String, & Pennies Group Roles: Each group member will be one of the following roles. In addition, everyone must record all of their answers on their own sheet. Materials Leader: Collects and returns all materials. Group Leader: Is responsible for making sure the group’s area is cleaned up and that all group members have completed the assignment. Time Leader: Is responsible for making sure all group members are on task at all times. Question Leader: Is responsible for asking questions on behalf of the entire group. In other words, only the Question Leader can go to another group / Ms. A to ask any questions that the group has. STEP A: Gathering Data 1. Gather 8 textbooks. Make sure to use the same 8 books. Make 2 piles of 4 books and lay them across from each
other. 2. Punch holes on opposite sides of the cup and tie the string through the holes. 3. Hang your cup at the center of your spaghetti beam. Support the beam between 2 books. In other words, put 2 books
on top of the piece of spagetti to hold it in place. 4. Put pennies in the cup, one at a time, until the beam (piece of spaghetti) breaks. 5. Record the maximum load (the number of pennies) that this beam will support. 6. Repeat steps 3-5 for beams made from two, three, four, five, and six strands of spaghetti. Step B: Graphing Your Data 7. Plot your data on your calculator. Let x represent the number of strands of spaghetti, and let y represent the maximum
load. Sketch the plot on piece of graph paper. Step C: Determining the Line of Best Fit 8. Use a strand of spaghetti to visualize a line that you think fits the data on your sketch. Choose two points on the line.
Note the coordinates of these points. 9. Calculate the slope of the line between the two points. 10. Use the slope, b, that you found in Step 5 to graph the equation y = bx on your calculator. Why is this line parallel to
the direction the points indicate? Is the line too low or too high to fit the data? 11. Using the spaghetti strand on your sketch, estimate a good y-intercept, a, so that the equation y = a + bx better fits
your data. On your calculator, graph the equation y = a + bx in place of y = bx. Adjust your estimate for a until you have a line of fit.
12. In Step 5, everyone started with a visual model that went through two points. In your group, compare all final lines. Did everyone end up with the same line? Do you think a line of fit must go through at least two data points? Is any one line better than the others?
NAME: __________________________________DATE: ______________________SECTION: _________MRS. KEINATH
12
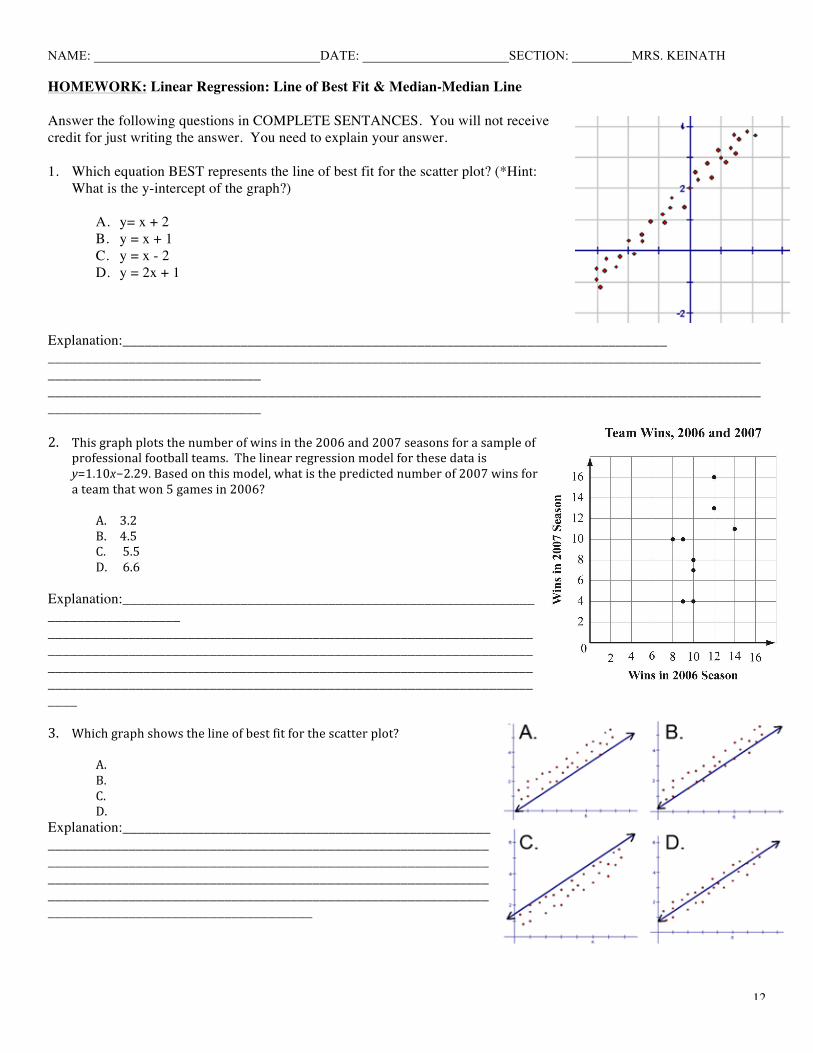
HOMEWORK: Linear Regression: Line of Best Fit & Median-Median Line Answer the following questions in COMPLETE SENTANCES. You will not receive credit for just writing the answer. You need to explain your answer. 1. Which equation BEST represents the line of best fit for the scatter plot? (*Hint:
What is the y-intercept of the graph?)
A. y= x + 2 B. y = x + 1 C. y = x - 2 D. y = 2x + 1
Explanation:__________________________________________________________________________ ______________________________________________________________________________________________________________________________ ______________________________________________________________________________________________________________________________ 2. This graph plots the number of wins in the 2006 and 2007 seasons for a sample of
professional football teams. The linear regression model for these data is y=1.10x−2.29. Based on this model, what is the predicted number of 2007 wins for a team that won 5 games in 2006?
A. 3.2 B. 4.5 C. 5.5 D. 6.6
Explanation:__________________________________________________________________________ ____________________________________________________________________________________________________________________________________________________________________________________________________________________________________________________________________________ 3. Which graph shows the line of best fit for the scatter plot?
A. B. C. D.
Explanation:______________________________________________________________________________________________________________________________________________________________________________________________________________________________________________________________________________________________________________________________________

NAME: __________________________________DATE: ______________________SECTION: _________MRS. KEINATH
13
WARM UP: CLASS NOTES
NAME: __________________________________DATE: ______________________SECTION: _________MRS. KEINATH
14
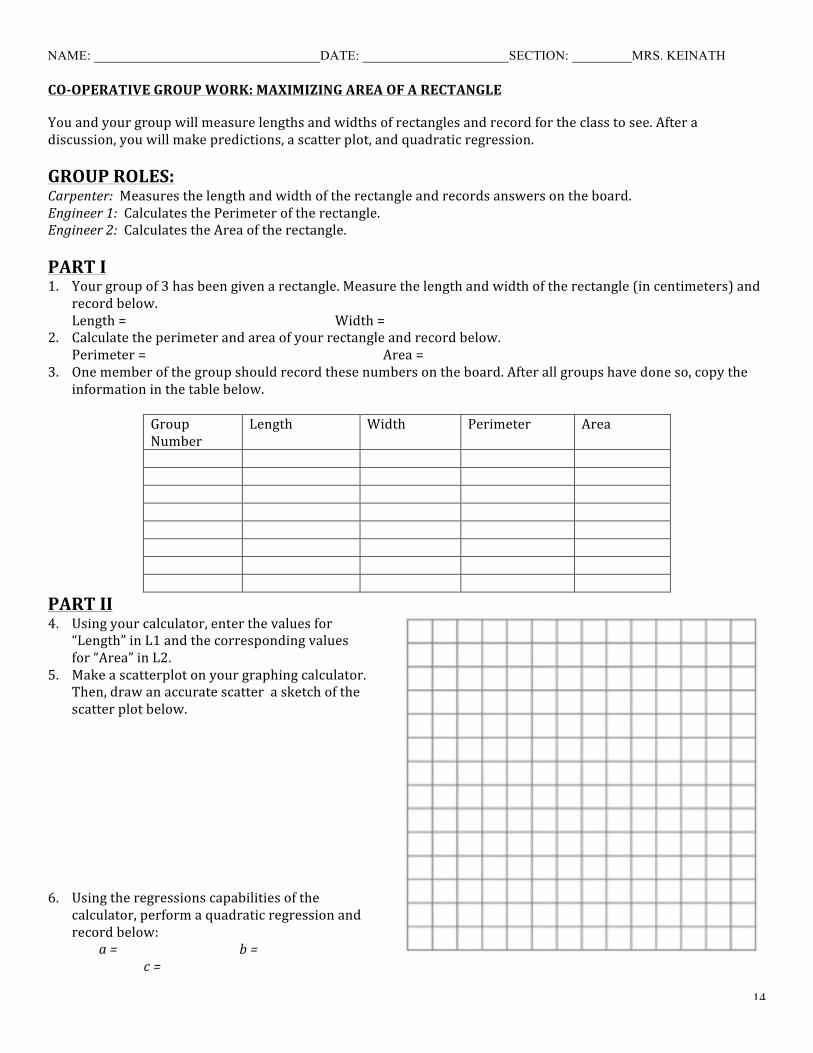
CO-‐OPERATIVE GROUP WORK: MAXIMIZING AREA OF A RECTANGLE You and your group will measure lengths and widths of rectangles and record for the class to see. After a discussion, you will make predictions, a scatter plot, and quadratic regression. GROUP ROLES: Carpenter: Measures the length and width of the rectangle and records answers on the board. Engineer 1: Calculates the Perimeter of the rectangle. Engineer 2: Calculates the Area of the rectangle. PART I 1. Your group of 3 has been given a rectangle. Measure the length and width of the rectangle (in centimeters) and
record below. Length = Width =
2. Calculate the perimeter and area of your rectangle and record below. Perimeter = Area =
3. One member of the group should record these numbers on the board. After all groups have done so, copy the information in the table below.
Group Number
Length Width Perimeter Area
PART II 4. Using your calculator, enter the values for
“Length” in L1 and the corresponding values for “Area” in L2.
5. Make a scatterplot on your graphing calculator. Then, draw an accurate scatter a sketch of the scatter plot below.
6. Using the regressions capabilities of the
calculator, perform a quadratic regression and record below: a = b = c =
NAME: __________________________________DATE: ______________________SECTION: _________MRS. KEINATH
15
The equation for the quadratic model is y =
7. How does the equation in step 3 above compare to the equation in step 9 in Part I? 8. Graph the regression equation with the scatterplot. How well does the graph fit the data? Explain. 9. What is the length that produces a maximum area? 10. What is the maximum area? 11. Do you have a conjecture about the rectangle that produces a maximum area if the perimeter is set? How might
you test your conjecture? 12. Extension: Suppose you were given a rectangle where the lengths of exactly 3 sides summed to 24 centimeters.
Could you create a rectangle with of different size where exactly 3 side lengths summed to 24 centimeters? How would you find the maximum area of such a rectangle? Develop a strategy and describe in detail. Be ready to defend your conclusion tomorrow.
NAME: __________________________________DATE: ______________________SECTION: _________MRS. KEINATH
16
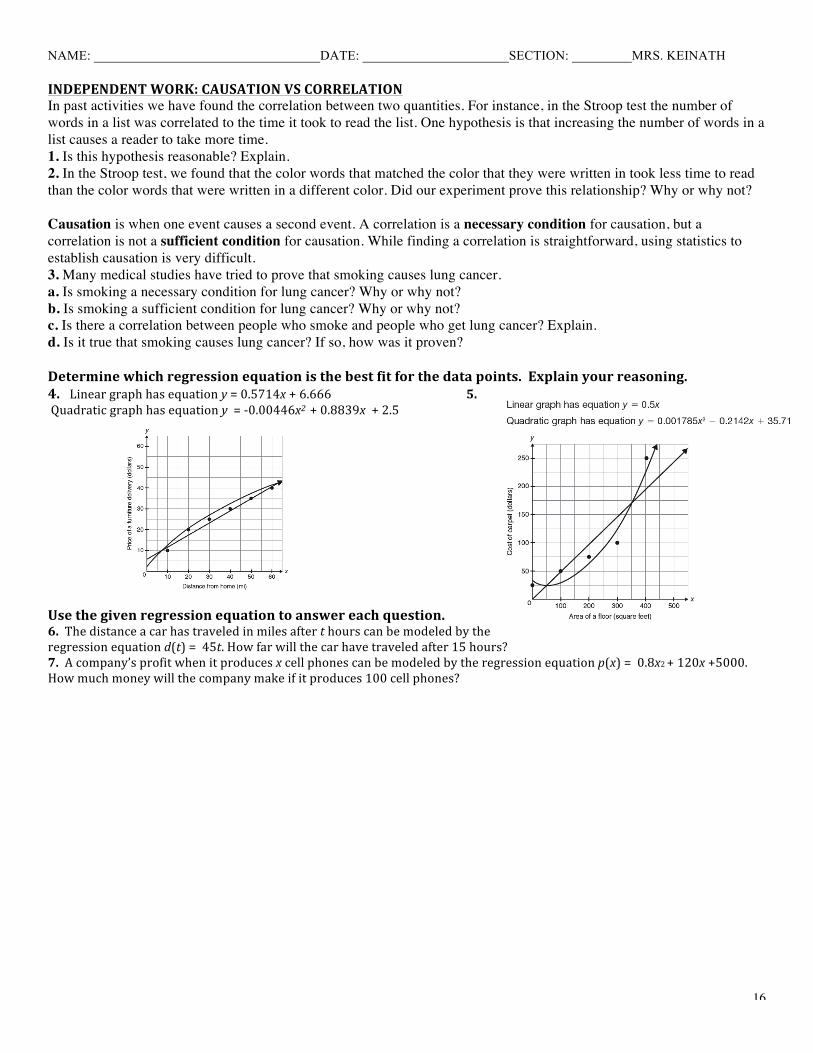
INDEPENDENT WORK: CAUSATION VS CORRELATION In past activities we have found the correlation between two quantities. For instance, in the Stroop test the number of words in a list was correlated to the time it took to read the list. One hypothesis is that increasing the number of words in a list causes a reader to take more time. 1. Is this hypothesis reasonable? Explain. 2. In the Stroop test, we found that the color words that matched the color that they were written in took less time to read than the color words that were written in a different color. Did our experiment prove this relationship? Why or why not? Causation is when one event causes a second event. A correlation is a necessary condition for causation, but a correlation is not a sufficient condition for causation. While finding a correlation is straightforward, using statistics to establish causation is very difficult. 3. Many medical studies have tried to prove that smoking causes lung cancer. a. Is smoking a necessary condition for lung cancer? Why or why not? b. Is smoking a sufficient condition for lung cancer? Why or why not? c. Is there a correlation between people who smoke and people who get lung cancer? Explain. d. Is it true that smoking causes lung cancer? If so, how was it proven? Determine which regression equation is the best fit for the data points. Explain your reasoning. 4. Linear graph has equation y = 0.5714x + 6.666 5. Quadratic graph has equation y = -‐0.00446x2 + 0.8839x + 2.5 Use the given regression equation to answer each question. 6. The distance a car has traveled in miles after t hours can be modeled by the regression equation d(t) = 45t. How far will the car have traveled after 15 hours? 7. A company’s profit when it produces x cell phones can be modeled by the regression equation p(x) = 0.8x2 + 120x +5000. How much money will the company make if it produces 100 cell phones?
NAME: __________________________________DATE: ______________________SECTION: _________MRS. KEINATH
17
HOMEWORK:
1. STUDY DOM 7 : INVERSE FUNCTIONS & ALGEBRAIC MODELS Study all of your notes / class work / homework. The test will cover the following topics:
a. Characteristics of functions and their inverses, including one-‐to-‐oneness, domain, and range. b. Determine inverses of linear, quadratic functions. c. Explore the graphs of functions and their inverses. d. Use composition to verify that functions are inverses of each other. e. Gather and plot data that can be modeled with linear and quadratic functions. f. Examine the issues of curve fitting by finding good linear fits to data using simple such as the
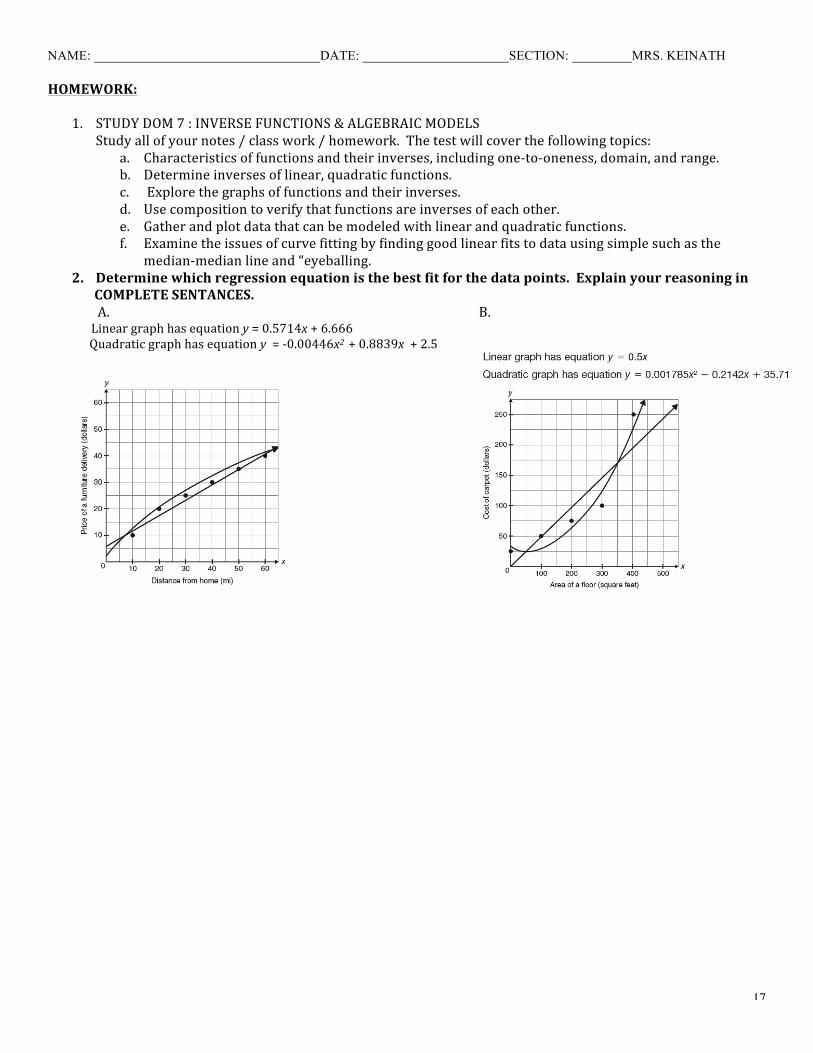
median-‐median line and “eyeballing. 2. Determine which regression equation is the best fit for the data points. Explain your reasoning in COMPLETE SENTANCES. A. B. Linear graph has equation y = 0.5714x + 6.666 Quadratic graph has equation y = -‐0.00446x2 + 0.8839x + 2.5