Embed Size (px)
DESCRIPTION
In 2010, NAL accomplished several key initiatives from a strategic and financial standpoint. Most notably, from a strategic point of view, NAL successfully completed the transition from an oil and gas royalty trust to a corporation effective December 31, 2010. It is important to note that NAL’s conversion to a corporation has not changed our strategy, that is, to provide investors with long-term, sustainable returns. Financially, the Corporation maintained a strong balance sheet and financial flexibility amid a natural gas commodity cycle that remained relatively low and depressed throughout the year.
Citation preview

AR10
md&a and financials

Abbreviationsbbls barrelsbbls/d barrels per dayboe barrels of oil equivalentboe/d barrels of oil equivalent per dayMbbl thousands of barrelsMboe thousands of barrels of oil equivalentMcf thousand cubic feetMcf/d thousand cubic feet per dayMMcf million cubic feetMMcf/d million cubic feet per dayMMbtu millions of British Thermal UnitsD/CF debt to cash flowP+P proved plus probableHz horizontal$MM million dollars$Cdn Canadian dollars$US U.S. dollarsFX foreign exchange
Contents01 2010 Accomplishments and Highlights02 Chief Financial Officer’s Message03 Financial and Operating Highlights04 Management’s Discussion and Analysis30 Consolidated Financial Statements34 Notes to the Consolidated Financial StatementsIBC Corporate Information
Conversion FactorsFrom To Multiply ByMcf cubic metres 28.174cubic metres cubic feet 35.494barrels cubic metres 0.159cubic metres barrels 6.293feet metres 0.305metres feet 3.281miles kilometers 1.609kilometers miles 0.621acres hectares 0.405hectares acres 2.471
01
2010
accomplishmentsand highlights
NAL’s average production volumes increased 24 percent year-over-year related to strong performance in the Corporation’s Cardium, Mississippian and liquids rich natural gas programs and the addition of the Breaker Energy production for the full year;
Funds from operations increased approximately 12 percent largely as a result of stronger operating netbacks and offset by a slightly higher production mix weighting toward natural gas and significantly lower hedging gains than in 2010;
The Corporation delivered production volumes and operating costs consistent with its guidance;
Including acquisitions, NAL replaced 109 percent of production in its year end 2010 McDaniel and Associates reserve report and added $46 million (net) in new land purchases;
NAL currently has identified over 1,300 risked drilling locations in inventory through ongoing work being conducted by our technical teams;
NAL maintains financial flexibility heading into 2011 with over $280 million in available capacity on credit lines of $550 million.

02
Chief Financial Officer’s Message To ShareholdersIn 2010, NAL accomplished several key initiatives from a strategic and financial standpoint. Most notably, from a strategic point of view, NAL successfully completed the transition from an oil and gas royalty trust to a corporation effective December 31, 2010. It is important to note that NAL’s conversion to a corporation has not changed our strategy, that is, to provide investors with long-term, sustainable returns. Financially, the Corporation maintained a strong balance sheet and financial flexibility amid a natural gas commodity cycle that remained relatively low and depressed throughout the year.
In 2010, NAL delivered solid performance with production volumes up 24 percent to 29,713 boe per day, including the gross volumes attributable to the Tiberius and Spear partnership. This volume represents the highest annual average production in the company’s 15 year history. Operating costs of $10.93 per boe were managed within the range of guidance of $10.75 – 11.25 per boe.
On the financial side of the business, funds from operations was up 12 percent despite realized hedging gains being $55 million lower ($25 million in 2010 vs $80 million in 2009). The Corporation’s balance sheet remains relatively strong with over $280 million available on lines of $550 million and a total debt to cash flow ratio at year-end 2010 of 1.96 times, down from 2.07 times at year-end 2009.
Management continues to focus on sustainable total returns and believes that meaningful long-term shareholder value will come from prudent growth and a competitive yield based on NAL’s opportunities, asset mix and focus in the Western Canadian Sedimentary Basin.
Revenue The Corporation’s revenue is primarily derived from the sale of crude oil, natural gas, and natural gas liquids. Revenue from the sale of these commodities was up approximately 36 percent from 2009, supported by higher oil and liquids prices and higher production volumes, offset by lower foreign exchange rates and natural gas prices. Revenues derived from crude oil and natural gas liquids represent over 75 percent of total revenues, highlighting the difference between a barrel of oil and a barrel of oil equivalent (“boe”) of natural gas and their overall economic value to the company. Although volumetrically the company is split equally between oil and natural gas, oil drives the majority of revenue and the increase in the oil price in 2010 provided an overall positive impact to revenue year-over-year.
Risk ManagementNAL employs risk management practices to assist in managing cash flows and to support capital programs and dividends. Management has Board approval to hedge up to 60 percent of net production volumes (net of royalty volumes) in any given year. In 2011, NAL has hedging positions in place on approximately 52 percent of the net (after royalty) forecast crude oil volumes and approximately 20 percent of net forecast natural gas volumes.
Financing Activity & Credit LinesIn 2010, NAL successfully completed an equity offering of $100 million for $13.25 per share. The net proceeds of this financing were used to pay down debt incurred by the acquisition of non-producing assets, predominantly in NAL’s core light oil region of southeast Saskatchewan. Management anticipates these assets will provide a sustainable base of operations and additional light oil drilling inventory for the Corporation in future years.
OutlookLooking forward, NAL remains committed to prudently managing its balance sheet and maintaining financial flexibility. With access to capital markets and current available capacity of approximately $280 million on our existing credit lines, NAL remains positioned to take advantage of acquisition opportunities in the market or to fund future increases in our capital program.
We thank you for your continued interest and support in NAL Energy Corporation.
Keith A. SteevesVice President, Finance and CFO

03
Financial and Operating Highlights(thousands of dollars, except per unit and boe data)(unaudited)
Three months ended December 31 Years ended December 31
2010 2009 2010 2009
Financial
Revenue(1) 116,888 111,477 491,037 361,087
Cash flow from operating activities 65,084 53,060 254,140 236,295
Cash flow per share - basic 0.44 0.45 1.77 2.21
Cash flow per share – diluted 0.43 0.44 1.70 2.14
Funds from operations 61,950 62,953 257,894 230,741
Funds from operations per share - basic 0.42 0.53 1.79 2.15
Funds from operations per share – diluted 0.41 0.51 1.73 2.09
Net income (loss) (4,204) 5,634 32,410 9,200
Distributions declared 39,702 32,625 155,777 120,153
Distributions per share 0.27 0.27 1.08 1.12
Basic payout ratio:
based on cash flow from operating activities 61% 61% 61% 51%
based on funds from operations 64% 52% 60% 52%
Basic payout ratio including capital expenditures(2):
based on cash flow from operating activities 101% 130% 141% 106%
based on funds from operations 106% 110% 139% 109%
Shares outstanding (000’s)
Period end 147,248 137,471 147,248 137,471
Weighted average 146,948 118,174 143,913 107,157
Capital expenditures(3) 26,175 36,764 203,038 133,028
Property acquisitions (dispositions), net 15,963 (17,255) 46,429 (14,721)
Corporate acquisitions, net(4) - 310,051 - 351,664
Net debt, excluding convertible debentures(5) 310,919 282,727 310,919 282,727
Convertible debentures (at face value) 194,744 194,744 194,744 194,744
Operating
Daily production prior to Reorganization(6)
Crude oil (bbl/d) 11,469 10,290 11,575 9,868
Natural gas (Mcf/d) 93,314 78,265 92,522 71,169
Natural gas liquids (bbl/d) 2,635 2,413 2,718 2,287
Oil equivalent (boe/d) 29,657 25,748 29,713 24,016
Daily production after Reorganization(7) 28,596 25,413 29,446 23,624
Operating netback (boe)
Revenue before hedging gains 44.43 47.06 45.69 41.19
Royalties (7.75) (8.95) (8.25) (7.52)
Operating costs (10.21) (10.21) (10.93) (11.09)
Other income 0.20 0.15 0.13 0.17
Operating netback before hedging 26.67 28.05 26.64 22.75
Hedging gains 2.49 4.71 2.37 9.16
Operating netback 29.16 32.76 29.01 31.91
(1) Oil, natural gas and liquid sales less transportation costs and prior to royalties and hedging.
(2) Capital expenditures included are net of non-controlling interest amount of $nil (2009 - $0.4) for the three months ended December 31, 2010 and $nil (2009 - $1.8) for the year ended December 31, 2010, attributable to the Tiberius and Spear properties.
(3) Excludes property and corporate acquisitions, and is net of drilling incentive credits of $12.8 million for the year ended December 31, 2010 (2009 - $3.3 million).
(4) Represents total consideration for corporate acquisitions including fees.
(5) Bank debt plus working capital and other liabilities, excluding derivative contracts, notes payable/receivable and future income tax balances.
(6) Production prior to the conversion includes 100 percent of the volumes attributable to a jointly held partnership with Manulife Financial Corporation, see MD&A disclosure for details; all volumes include royalty interest volumes.
(7) Excludes 50 percent of volumes attributable to a jointly held partnership of NAL and Manulife dissolved as part of Reorganization for 2010 and 2009, see MD&A. 2009 volumes adjusted in order to facilitate a fair and reasonable comparison with 2010 figures.
04
Management’s Discussion and AnalysisThe following discussion and analysis (“MD&A”) should be read in conjunction with the consolidated financial statements for the years ended December 31, 2010 and December 31, 2009 of NAL Energy Corporation (“NAL” or the “Corporation”). It contains information and opinions on the Corporation’s future outlook based on currently available information. All amounts are reported in Canadian dollars, unless otherwise stated. Where applicable, natural gas has been converted to barrels of oil equivalent (“boe”) based on a ratio of six thousand cubic feet of natural gas to one barrel of oil. The boe rate is based on an energy equivalent conversion method primarily applicable at the burner tip and does not represent a value equivalent at the wellhead. Use of boe in isolation may be misleading.
NAL is engaged in the exploration for, and the development and production of natural gas, natural gas liquids and crude oil in Western Canada. The Corporation resulted from a reorganization effective December 31, 2010 as part of the Plan of Arrangement involving, among others, NAL Oil & Gas Trust (the “Trust”), the Corporation, and the security holders of the Trust (“Reorganization”).
Pursuant to the Reorganization, the Trust was restructured from an open-end unincorporated trust to NAL Energy Corporation, a publicly traded exploration and development corporation. Unitholders of the Trust received one common share of the Corporation for every trust unit that the Trust held. The Corporation and its subsidiaries now carry on the business formerly carried on by the Trust and its subsidiaries.
The Reorganization to a corporation has been accounted for on a continuity of interest basis and accordingly, the consolidated financial statements for 2010 and 2009 reflect the financial position, results of operations and cash flows as if the Corporation had carried on the business formerly carried on by the Trust.
References to NAL or the Corporation in this MD&A for periods prior to December 31, 2010 are references to the Trust and for periods after December 30, 2010 are references to NAL Energy Corporation. Additionally, NAL or the Corporation refers to shares, shareholders, and dividends which are comparable to units, unitholders and distributions previously under the Trust.
Non-GAAP Financial MeasuresThroughout this discussion and analysis, management uses the terms funds from operations, funds from operations per share, payout ratio, cash flow from operations per share, net debt to trailing 12 month cash flow, operating netback and cash flow netback. These are considered useful supplemental measures as they provide an indication of the results generated by the Corporation’s principal business activities. Management uses the terms to facilitate the understanding of the results of operations. However, these terms do not have any standardized meaning as prescribed by Canadian Generally Accepted Accounting Principles (“GAAP”). Investors should be cautioned that these measures should not be construed as an alternative to net income determined in accordance with GAAP as an indication of NAL’s performance. NAL’s method of calculating these measures may differ from that of other companies and, accordingly, they may not be comparable to measures used by other companies.
Funds from operations is calculated as cash flow from operating activities before changes in non-cash working capital. Funds from operations does not represent operating cash flows or operating profits for the period and should not be viewed as an alternative to cash flow from operating activities calculated in accordance with GAAP. Funds from operations is considered by management to be a meaningful key performance indicator of NAL’s ability to generate cash to finance operations and to pay monthly dividends. Funds from operations per share and cash flow from operations per share are calculated using the weighted average shares outstanding for the period.
Payout ratio is calculated as dividends declared for a period as a percentage of either cash flow from operating activities or funds from operations; both measures are stated.
Net debt to trailing 12 months cash flow is calculated as net debt as a proportion of funds from operations for the previous 12 months. Net debt is defined as bank debt, plus convertible debentures at face value, plus working capital and other liabilities, excluding derivative contracts and future income tax balances.
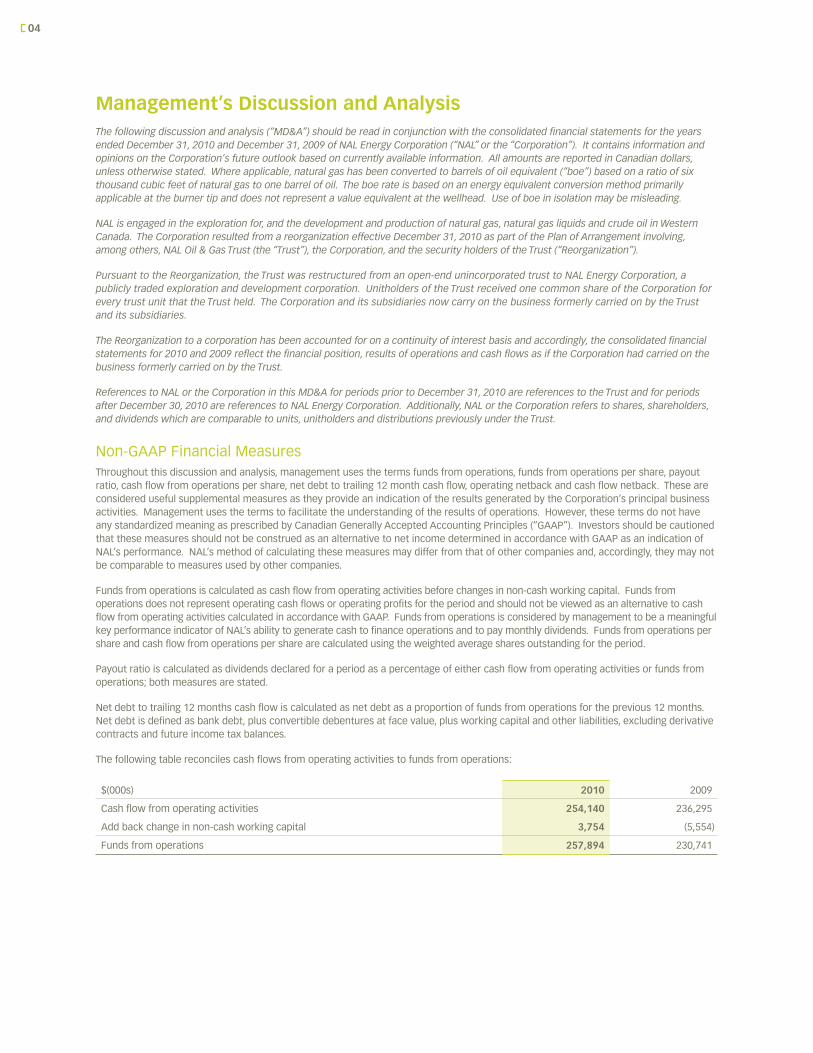
The following table reconciles cash flows from operating activities to funds from operations:
$(000s) 2010 2009
Cash flow from operating activities 254,140 236,295
Add back change in non-cash working capital 3,754 (5,554)
Funds from operations 257,894 230,741

05
Forward-Looking InformationThis discussion and analysis contains forward-looking information as to the Corporation’s internal projections, expectations and beliefs relating to future events or future performance. Forward looking information is typically identified by words such as “anticipate”, “continue”, “estimate”, “expect”, “forecast”, “may”, “will”, “could”, “plan”, “intend”, “should”, “believe”, “outlook”, “project”, “potential”, “target”, and similar words suggesting future events or future performance. In addition, statements relating to “reserves” are forward-looking statements as they involve the implied assessment, based on certain estimates and assumptions, that the reserves described exist in the quantities estimated and can be profitably produced in the future.
In particular, this MD&A contains forward-looking information pertaining to the following, without limitation: the amount and timing of cash flows and dividends to shareholders; reserves and reserves values; 2011 production; future tax treatment of the Corporation; the Corporation’s tax pools; future oil and gas prices; operating, drilling and completion costs; the amount of future asset retirement obligations; future liquidity and future financial capacity; the initiation of an “at-the-market” financing program; future results from operations; payout ratios; cost estimates and royalty rates; drilling plans; tie-in of wells; future development, exploration and acquisition activities and related expenditures; and rates of return.
With respect to forward-looking statements contained in this MD&A and the press release through which it was disseminated, we have made assumptions regarding, among other things: future oil and natural gas prices; future capital expenditure levels; future oil and natural gas production levels; future exchange rates; the amount of future dividends that we intend to pay; the cost of expanding our property holdings; our ability to obtain equipment in a timely manner to carry out exploration and development activities; our ability to market our oil and natural gas successfully to current and new customers; the impact of increasing competition; our ability to obtain financing on acceptable terms; and our ability to add production and reserves through our development and exploitation activities.
Although NAL believes that the expectations reflected in the forward-looking information contained in the MD&A and the press release through which it was disseminated, and the assumptions on which such forward-looking information are made, are reasonable, readers are cautioned not to place undue reliance on such forward looking statements as there can be no assurance that the plans, intentions or expectations upon which the forward-looking information are based will occur. Such information involves known and unknown risks, uncertainties and other factors that may cause actual results or events to differ materially from those anticipated and which may cause NAL’s actual performance and financial results in future periods to differ materially from any estimates or projections of future performance. These risks and uncertainties include, without limitation: changes in commodity prices; unanticipated operating results or production declines; the impact of weather conditions on seasonal demand and NAL’s ability to execute its capital program; risks inherent in oil and gas operations; the imprecision of reserve estimates; limited, unfavorable or no access to capital credit markets; the impact of competitors; the lack of availability of qualified operating or management personnel; the inability to obtain industry partner and other third party consents and approvals, when required; failure to realize the anticipated benefits of acquisitions; general economic conditions in Canada, the United States and globally; fluctuations in foreign exchange or interest rates; changes in government regulation of the oil and gas industry, including environmental regulation; changes in royalty rates; changes in tax laws; stock market volatility and market valuations; OPEC’s ability to control production and balance global supply and demand for crude oil at desired price levels; political uncertainty, including the risk of hostilities in the petroleum producing regions of the world; and other risk factors discussed in other public filings of the Corporation including the Corporation’s current Annual Information Form.
NAL cautions that the foregoing list of factors that may affect future results is not exhaustive. The forward-looking information contained in the MD&A is made as of the date of this MD&A. The forward-looking information contained in the MD&A is expressly qualified by this cautionary statement.
Structure of The Business On December 31, 2010 NAL Oil & Gas Trust completed a plan of arrangement whereby the Trust unitholders exchanged their trust units for common shares of NAL Energy Corporation on a one-to-one basis thereby effectively converting the Trust into a corporation (“Reorganization”). As a result of the Reorganization, the Trust was dissolved and NAL Energy Corporation received all the assets and assumed all the liabilities of the Trust.
In conjunction with the Reorganization, a partnership (“Partnership”) that was indirectly owned jointly by the Corporation and Manulife Financial Corporation (“MFC”) was dissolved on December 31, 2010. This Partnership held the assets acquired from the acquisitions of Tiberius and Spear in February 2008.
Prior to December 31, 2010 the Corporation, by virtue of being the owner of the general partner of the Partnership, was required to consolidate the results of the Partnership into its financial statements on the basis that the Corporation had control over the Partnership. The 2009 MD&A and financial information of the Corporation therefore reflects all the assets, liabilities, revenues and expenses of the Partnership, of which 50 percent are effectively removed through the non-controlling interest. As a result of the Partnership dissolution on December 31, 2010, the Corporation only reflects its proportionate share of the Partnership’s assets, liabilities, revenues and expenses in the December 31, 2010 MD&A and financial information.
NAL’s conversion from a trust to a corporation had no effect on its strategic or operational objectives.

06
Exploration & Development ActivitiesThe Corporation spent $157.8 million on drilling, completion and tie-in operations during 2010, compared to $104.8 million for 2009 and drilled 131 (61.40 net) wells for the full year 2010 including participation in 26 (4.8 net) non-operated wells. Full year drilling activity consisted of 16 (6.4 net) gas wells and 113 (53.6 net) oil wells of which 30 (14 net) were Cardium and 66 (29 net) were Mississippian wells.
2010 Drilling Activity
Crude Oil Natural Gas Service Wells Dry & Abandoned Total
Gross Net Gross Net Gross Net Gross Net Gross Net
Operated wells 97 50.54 6 4.60 2 1.50 0 0 105 56.64
Non-operated wells 16 3.01 10 1.75 0 0 0 0 26 4.76
Total wells drilled 113 53.55 16 6.35 2 1.50 0 0 131 61.40
Southeast SaskatchewanIn Saskatchewan, there were 65 (28.4 net) horizontal oil wells drilled during 2010. Development activity was focused on the Mississippian in Alida, Parkman, Midale, Bromhead and Elswick drilling 150 meter spacing infill wells. NAL also drilled six test wells in Hummingbird, Hardy, Beaubier and Dahinda to validate exploration licenses that were purchased from third parties during the first half of 2010. This activity was part of a land capture strategy which has continued over 100 gross sections. Information gathered was also used to set up 3D seismic programs which were shot in 2010 and early 2011. Seismic has identified conventional Bakken and Mississippian targets on these land blocks and allowed NAL to capture other opportunities through recent crown land sales. A new discovery was tested at Beaubier with 75 bbls/d initial oil production which sets up a potential new stratagraphic play. In the Bakken at Hardy, a test well produced at 25 bbls/d of oil with a high water cut and has validated oil in a closed feature imaged on recently shot 3D seismic. There are ten follow up horizontal locations mapped significantly up structure from the test well which should encounter significantly higher oil cuts. The first well on this structure will be drilled in the first quarter of 2011. Engineering has been completed on the Hoffer battery and construction is expected to commence in the second half of 2011. It is anticipated that waterflood facilities will be functional in the first year of operations reducing operating costs significantly, while enhancing production volumes and reserves through increased recovery factors. NAL intends to drill 66 (30 net) oil wells in 2011 across its diverse land base targeting new pool discoveries, infills and extensions.
Alberta In Alberta, NAL participated in drilling 61 (29.5 net) wells including four (1.09 net) lower working interest wells in the Cardium at Garrington and Lochend in order to test extensions of known accumulations. Garrington results remain in-line with expectations and management remains encouraged by the significant potential of this resource. At Lochend, significant industry activity is identifying more productive areas which is also supported by recent NAL drilling. Results remain highly variable, as expected, in the early stage of this development. Pipeline land acquisition is almost complete, which will allow the extension of a central gas gathering system through the area in order to conserve all solution gas produced from recent and future drilling. It is expected that construction will be complete by the end of the third quarter. Drilling in the Lochend area during 2011 will consist of five wells that will offset some of the best results in order to establish a base of production and justify infrastructure spending.
In 2011, the Corporation plans to drill 31 (20 net) horizontal Cardium oil wells in Garrington and Lochend to further delineate and test significant acreage positions. There will be a significant focus on capital efficiency during 2011 with the use of water as a completion fluid and drilling slightly shorter horizontals with a tighter fracturing density. Performance will be monitored over the course of the year. It is also recognized that there is considerable pressure on services and equipment due to high activity levels which is challenging the efficiency of operations from an equipment availability and cost escalation perspective.
Additional Wilrich gas drilling in the Edson area was completed and brought on stream in the fourth quarter with combined gross production from the 13-7 and 1-8 wells of 11.5 mmcf/d and 175 bbls/d of liquids against 8,000 kpa pipeline pressure. The two wells have been producing at these conditions for several months and there is significant back pressure being applied due to hydraulic restrictions on the pipeline system. Debottlenecking of the pipeline system and future compression will be installed coincident with the drilling of the third well in the area which is expected to be brought on stream by the end of the first quarter 2011.
Northeast British Columbia Production at Sukunka, the major producing asset in northeast BC for the Corporation, was curtailed several times during the year due to third party infrastructure outages and processing capacity interruptions during the year. This outage impacted volumes by approximately 200 boe per day average for the full year but had minimal impact to cash flow. The productive capacity in the area is currently 2,000 boe per day.
NAL will drill two additional Doig horizontal wells in Fireweed during the first quarter of 2011 to fill existing infrastructure capacity with expectations that production will be on stream by April.

07
Focus of Future ActivityNAL continues to advance its knowledge base in the use of horizontal drilling techniques and multi-stage fracing. The efficient application of this technology has unlocked significant low risk oil reserves and value for our shareholders in 2010. In 2011, approximately 95 percent of the wells operated by NAL will be horizontal drills. NAL maintains its strong position in the Cardium oil resource play with acreage at Garrington and Cochrane in central Alberta, leveraging large exclusive farm-in and joint venture agreements. In addition, NAL has taken steps to de-risk unproven acreage through a directed farm-out strategy that is expected to drive near-term value.
Mississippian light oil opportunities also continue to expand the recently developed Hoffer area in southeast Saskatchewan. Current oil prices coupled with provincial royalty incentive programs drive compelling economics for oil development with recycle ratios greater than three times due to very attractive netbacks. NAL will remain focused on an oil weighted program through 2011.
The Corporation currently has catalogued a significant drill ready portfolio of horizontal gas wells in the Rock Creek, Falher, Halfway, Viking, Doig and Mannville zones. As in 2010, it is expected that NAL will spend approximately 15 percent of its exploration and development budget in 2011 on strategic liquids rich gas drilling to prove up reserves. Selective prospects with high initial gas rate potential and high liquid yields that deliver competitive economic returns will be considered in the program to take advantage of attractive government incentives.
Capital ExpendituresFor 2010, capital expenditures, before property acquisitions, totaled $203.0 million compared to $133.0 million in 2009 which is coincident with significant production growth year-over-year.
In 2010, Crown sales and land focused acquisitions equated to approximately $46 million net of dispositions, for land located largely in Saskatchewan. This investment, including five evaluation wells to hold several exploration licenses, equated to $60 million of spending which pre-funds significant future oil opportunities for NAL. The implied land price, including evaluation wells, for entry in these new areas equates to 50 percent of offsetting year-end Crown sale metrics.
Capital Expenditures ($000s)
2010 2009
Drilling, completion and production equipment 157,812 104,769
Plant and facilities 7,913 11,381
Seismic 1,955 1,222
Land 23,960 5,709
Total exploitation and development 191,640 123,081
Office equipment 2,106 692
Capitalized G&A 7,852 5,575
Capitalized unit-based compensation 1,440 3,680
Total other capital 11,398 9,947
Total capitalized expenditures before acquisitions 203,038 133,028
Property acquisitions (dispositions), net 46,429 (14,721)
Total capitalized expenditures 249,467 118,307
ProductionProduction of 29,713 boe/d in 2010 is 24 percent higher than the production of 24,016 boe/d in 2009. The increase in production is related to strong performance in the Corporation’s Cardium, Mississippian and liquids rich natural gas programs and the addition of the Breaker Energy production for the full year.
As discussed in our guidance presentation, accelerated capital spending programs are designed to have maximum impact on annual average volumes and during 2010 this profile of spending translated into peak production during the fourth quarter of over 30,000 boe per day. Drilling of the 2011 capital program commenced in early January, with volumes starting to come on stream by April. The organically supported production profile has been consistent year-over-year in that production peaks in the fourth quarter and declines through the first quarter of the following year. Due to timing of spring break up, capital spending in the first quarter translates into a significant volume increase in April but soft ground conditions will delay some on stream dates until June and July.

08
Average Daily Production Volumes before Reorganization
2010 2009
Oil (bbl/d) 11,575 9,868
Natural gas (Mcf/d) 92,522 71,169
NGLs (bbl/d) 2,718 2,287
Oil equivalent (boe/d) 29,713 24,016
Average Daily Production Volumes after Reorganization
2010 2009(1)
Oil (bbl/d) 11,349 9,541
Natural gas (Mcf/d) 92,403 70,972
NGLs (bbl/d) 2,696 2,255
Oil equivalent (boe/d) 29,446 23,624
(1) Reflects volumes after deducting the non–controlling interest in order to facilitate a fair and reasonable comparison with 2010 figures
The Corporation’s net production, after deducting the non-controlling interest, is 29,446 boe/d for 2010 (2009 – 23,624 boe/d).
For the year ended December 31, 2010 oil and natural gas liquids totaled 48 percent of production while natural gas represented 52 percent supported predominantly by an oil focused drilling program offset by gas weighted acquisitions.
Production Weighting
2010 2009
Oil 39% 41%
Natural gas 52% 49%
NGLs 9% 10%
RevenueFor the year ended December 31, 2010, revenue after transportation costs totaled $491.0 million, an increase of 36 percent from 2009. The increase is attributable to an 11 percent increase in the average realized price per boe and by a 25 percent increase in production. The increase in realized price reflects higher WTI prices, partially offset by a stronger Canadian dollar.
Revenue
2010 2009
Revenue(1) ($000s)
Oil 305,462 222,329
Gas 134,193 106,534
NGLs 51,222 31,729
Sulphur 160 495
Total revenue 491,037 361,087
$/boe 45.69 41.19
(1) Oil, natural gas and liquid sales less transportation costs and prior to royalties and hedging.
Oil MarketingNAL markets its crude oil based on refiners’ posted prices at Edmonton, Alberta and Cromer, Manitoba adjusted for transportation and the quality of crude oil at each field battery. The refiners’ posted prices are influenced by the WTI benchmark price, transportation costs, exchange rates and the supply/demand situation of particular crude oil quality streams during the year.
For the year ended December 31, 2010, NAL’s average oil price was $73.74 per barrel as compared to $61.73 for the comparable period in 2009. The 19 percent increase in realized price was driven by a 29 percent increase in WTI (US$ per barrel) and an increase in crude oil differentials to 90 percent from 88 percent in 2009, partially offset by a 10 percent increase in the value of the Canadian dollar.
For the year ended December 31, 2010, natural gas liquids averaged $52.05 per barrel, an increase of 37 percent from 2009.

09
Natural Gas MarketingApproximately 69 percent of NAL’s current gas production is sold under marketing arrangements tied to the Alberta monthly or daily spot price (“AECO”), with the remaining 31 percent tied to NYMEX or other indexed reference prices.
Prices for Lake Erie natural gas decreased to $5.04/Mcf in 2010, compared to $5.12/Mcf in 2009, a decrease of two percent. Lake Erie production of 3.1 MMcf/d accounted for three percent of the Corporation’s natural gas production in 2010, as compared to four percent in 2009. Natural gas sales from Lake Erie property generally receive a higher price due to the proximity of the Ontario and North eastern U.S. markets.
For the year ended December 31, 2010, NAL averaged $3.98/Mcf, a three percent decrease from the $4.10/Mcf realized in the comparable period of 2009.
Average Pricing
(net of transportation charges)
2010 2009
Liquids
WTI (US$/bbl) 79.54 61.80
NAL average oil (Cdn$/bbl) 73.74 61.73
NAL natural gas liquids (Cdn$/bbl) 52.05 38.01
Natural Gas (Cdn$/mcf)
AECO – daily spot 4.00 3.97
AECO – monthly 4.13 4.14
NAL Western Canada natural gas 3.94 4.05
NAL Lake Erie natural gas 5.04 5.12
NAL average natural gas 3.98 4.10
NAL oil equivalent before hedging (Cdn$/boe – 6:1) 45.69 41.19
Average foreign exchange rate (Cdn$/US$) 1.0301 1.1414
Risk ManagementNAL employs risk management practices to assist in managing cash flows and to support capital programs and distributions. NAL currently has derivative contracts in place to assist in managing the risks associated with commodity prices, interest rates and foreign exchange rates.
NAL’s commodity hedging policy currently provides authorization for management to hedge up to 60 percent of forecasted total production, net of royalties for a period of up to two years. Management’s practice is to hedge more near-term volumes on a six month forward basis with more limited volumes hedged in future periods. The execution of NAL’s commodity hedging program is layered in using a combination of swaps and collars. As at December 31, 2010, NAL had several financial WTI oil contracts and AECO natural gas contracts in place.
NAL’s interest rate hedging policy currently provides authorization to hedge up to 50 percent of outstanding bank debt for periods of up to five years. As at December 31, 2010, NAL had several interest rate swaps outstanding with a total notional value of $139 million.
NAL’s foreign exchange hedging policy currently provides authorization to hedge up to 50 percent of the Corporation’s U.S. dollar exposure for periods of up to 24 months. As at December 31, 2010, NAL had several foreign exchange contracts outstanding with a total notional value of U.S.$78.0 million.
All derivative contract counterparties are Canadian chartered banks in the Corporation’s lending syndicate.
For full year 2010, realized gains were $24.4 million compared to a realized gain of $79.7 million in 2009. The decrease in realized gains in 2010 is attributable to realized losses on crude oil contracts as compared to gains in 2009, mainly due to higher oil prices in 2010.
All derivative contracts are recorded on the balance sheet at fair value based upon forward curves at December 31, 2010. Changes in the fair value of the derivative contracts are recognized in net income for the period.

10
Fair value is calculated at a point in time based on an approximation of the amounts that would be received or paid to settle outstanding instruments, with reference to forward prices at December 31, 2010. Accordingly, the magnitude of the unrealized gain or loss will continue to fluctuate with changes in commodity prices, interest rates and foreign exchange rates.
The fair value of the derivatives at December 31, 2010 was a net liability of $9.9 million, comprised of a $15.3 million liability on oil contracts, partially offset by a $1.6 million asset on gas contracts, a $0.7 million asset on interest rate swaps, and a $3.1 million asset on foreign exchange contracts.
For the year ended December 31, 2010, income includes an unrealized loss of $7.4 million, resulting from the change in the fair value of the derivative contracts during the period, from an unrealized loss of $2.5 million at December 31, 2009 to an unrealized loss of $9.9 million at December 31, 2010. The unrealized loss was comprised of a $2.5 million unrealized loss on crude oil contracts, $2.3 million unrealized loss on natural gas contracts, $1.7 million unrealized loss on interest rate swaps and a $0.9 million unrealized loss on foreign exchange swaps.
The risk management policies for 2011 are expected to remain consistent with those in 2010. The Corporation’s current positions are summarized in the tables below.
The gain/loss on all forward derivative contracts is as follows:
Gain / (Loss) on Derivative Contracts ($000s)
2010 2009
Unrealized gain (loss):
Crude oil contracts (2,467) (68,590)
Natural gas contracts (2,318) (6,430)
Interest rate swaps (1,755) 2,735
Exchange rate swaps (875) 3,986
Unrealized loss (7,415) (68,299)
Realized gain (loss):
Crude oil contracts (4,353) 46,811
Natural gas contracts 23,349 25,382
Interest rate swaps (1,057) (656)
Exchange rate swaps 6,507 8,134
Realized gain 24,446 79,671
Gain on derivative contracts 17,031 11,372

11
The following is a summary of the realized gains and losses on risk management contracts:
Realized Gain (Loss) on Derivative Contracts
2010 2009
Commodity contracts:
Average crude volumes hedged (bbl/d) 6,189 4,472
Crude oil realized gain (loss) ($000s) (4,353) 46,811
Gain (loss) per bbl hedged ($) (1.93) 28.68
Average natural gas volumes hedged (GJ/d) 37,570 24,252
Natural gas realized gain (loss) ($000s) 23,349 25,382
Gain per GJ hedged ($) 1.70 2.87
Average boe hedged (boe/d) 12,124 8,304
Total realized commodity contracts gain ($000s) 18,996 72,193
Gain per boe hedged ($) 4.29 23.82
Gain per boe ($) 1.77 8.24
Interest rate swaps realized loss ($000s) (1,057) (656)
Loss per boe ($) (0.10) (0.07)
Exchange rate swaps realized gain ($000s) 6,507 8,134
Gain per boe ($) 0.61 0.92
Total realized gain ($000s) 24,446 79,671
Gain per boe ($) 2.27 9.09
NAL has the following interest rate risk management contracts outstanding:
Interest Rate Remaining TermAmount
(Cdn$ MM)(1)
Corporation Fixed Rate
Counterparty Floating Rate
Swaps-floating to fixed Jan 2011 – Dec 2011 $39.0 1.5864% CAD-BA-CDOR (3 months)
Swaps-floating to fixed Jan 2011 – Jan 2013 $22.0 1.3850% CAD-BA-CDOR (3 months)
Swaps-floating to fixed Jan 2011 – Jan 2014 $22.0 1.5100% CAD-BA-CDOR (3 months)
Swaps-floating to fixed Jan 2011 – Mar 2013 $14.0 1.8500% CAD-BA-CDOR (3 months)
Swaps-floating to fixed Jan 2011 – Mar 2013 $14.0 1.8750% CAD-BA-CDOR (3 months)
Swaps-floating to fixed Jan 2011 – Mar 2014 $14.0 1.9300% CAD-BA-CDOR (3 months)
Swaps-floating to fixed Jan 2011 – Mar 2014 $14.0 1.9850% CAD-BA-CDOR (3 months)
(1) Notional debt amount
NAL has the following Canadian dollar / U.S. dollar foreign exchange option contracts outstanding.
Fixed Rate (CAD/USD) Notional (US) per month Term Counterparty Floating Rate
1.05 $2.0 MM Jan 1, 2011 to Dec 31, 2011 BofC Monthly Average Noon Rate
1.0608 $5.0 MM Jan 1, 2011 to Dec 31, 2011 BofC Monthly Average Noon Rate

12
NAL has a monthly commitment to settle the above fixed rates against the Bank of Canada monthly average noon rate.
Option Payout Range (CAD/USD)
Notional (US) per month Term
Counterparty Floating Rate
Monthly Premium Received (CAD)
$0.95 - $1.12 $0.5 MM Jan 1, 2011 to Dec 31, 2011 BofC Monthly Average Noon Rate $25K
$0.945 - $1.045 $0.5 MM Jan 1, 2011 to Dec 31, 2011 BofC Monthly Average Noon Rate $18K
$0.95 - $1.025 $2.0 MM Mar 1, 2011 to Jun 30, 2012 BofC Monthly Average Noon Rate $40K
When the monthly average noon spot foreign exchange rate is outside the payout range, the month premium is forfeited. NAL is committed to selling the above listed USD at the upper payout range value for that month when the average noon spot foreign exchange rate exceeds the payout range.
Option Fixing Range (CAD/USD) Notional (US) per month Term Counterparty Floating Rate
$0.94 - $1.06 $0.5 MM Jan 1, 2011 to Dec 31, 2011 BofC Monthly Average Noon Rate
$0.95 - $1.07 $0.5 MM Jan 1, 2011 to Dec 31, 2011 BofC Monthly Average Noon Rate
$0.94 - $1.08 $0.5 MM Jan 1, 2011 to Dec 31, 2011 BofC Monthly Average Noon Rate
$0.95 - $1.04 $0.5 MM Jan 1, 2011 to Dec 31, 2011 BofC Monthly Average Noon Rate
$0.95 - $1.0125 $0.5 MM Mar 1, 2011 to Jun 30, 2012 BofC Monthly Average Noon Rate
When the monthly average noon spot foreign exchange rate exceeds the lower fixing rate, NAL is committed to selling the above listed USD at the upper fixing rate for that month. To the extent the monthly average noon spot foreign exchange rate is below the lower fixing rate, NAL has no commitment to sell USD.
Option Fixing Range (CAD/USD) Notional (US) per month Term Counterparty Floating Rate
$1.05 - $1.15 $1.0 MM Jan 1, 2011 to Dec 31, 2011 BofC Monthly Average Noon Rate
When the monthly average noon spot foreign exchange rate exceeds the fixing range, NAL is committed to selling the above listed USD at the lower fixing rate for that month. To the extent the monthly average spot foreign exchange rate is below the lower fixing rate, NAL has a commitment to sell the above listed USD at the lower fixing rate. When the monthly average noon spot foreign exchange rate falls within the fixing range, NAL has no commitment to sell USD.
NAL has the following commodity risk management contracts outstanding:
CRUDE OIL Q1-11 Q2-11 Q3-11 Q4-11
US$ Collar Contracts
$US WTI Collar Volume (bbl/d) 800 1,000 200 200
Bought Puts – Average Strike Price ($US/bbl) 81.25 83.00 90.00 90.00
Sold Calls – Average Strike Price ($US/bbl) 94.47 95.68 100.50 100.50
US$ Swap Contracts
$US WTI Swap Volume (bbl/d) 4,900 4,900 5,700 5,700
Average WTI Swap Price ($US/bbl) 87.39 87.39 88.10 88.10
Total Oil Volume (bbl/d) 5,700 5,900 5,900 5,900
Two calendar 2011 500 bbl/day swap contracts with an average price of $95.00 contain extendable call options. The extendible call option provides the counterparty with the option to extend the contract into calendar 2012 under the same price and volumetric terms. The counterparty can exercise this option any time before December 31, 2011.

13
NATURAL GAS Q1-11 Q2-11 Q3-11 Q4-11 Q1-12
Swap Contracts
AECO Swap Volume (GJ/d) 5,000 20,000 21,000 21,000 21,000
AECO Average Price ($Cdn/GJ) 5.61 4.32 3.95 3.95 3.95
Total Natural Gas Volume (GJ/d) 5,000 20,000 21,000 21,000 21,000
For 2011, the Corporation has outstanding contracts representing approximately 34 percent of its net liquids and natural gas production after royalties.
Royalty ExpensesCrown, freehold and overriding royalties were $88.6 million, up from $65.9 million in 2009, primarily attributable to higher realized liquid prices in 2010 and higher production volumes. Expressed as a percentage of gross sales net of transportation costs, before gain/loss on derivative contracts, the net royalty rate was 18.0 percent in 2010 as compared to 18.2 percent in 2009.
On March 11, 2010, the Government of Alberta announced measures to advance Alberta’s competitiveness in the upstream oil and gas sector. The royalty framework for natural gas and conventional oil was modified for all production effective January 1, 2011 and the new royalty curves were announced on May 31, 2010. The current incentive program rate of five percent on new natural gas and conventional oil wells is a permanent feature of the royalty system. The maximum royalty rate for conventional oil is reduced at higher price levels from 50 percent to 40 percent. The maximum royalty rate for natural gas is reduced at higher price levels from 50 percent to 36 percent.
For the year ended December 31, 2010, 45 percent of crude oil and 66 percent of natural gas production is from Alberta.
Royalty Expenses
2010 2009
Royalties ($000s) 88,617 65,898
As % of revenue 18.0 18.2
$/boe 8.25 7.52
Operating CostsOperating costs were $10.93 per boe for 2010 a modest reduction from $11.09 per boe in 2009. Year-over-year operating cost decreases are a direct result of an aggressive program focused on cost reduction in NAL’s operations specifically around repairs and maintenance coupled with reduced power costs as a result of lower gas prices. In 2011, NAL is forecasting operating costs to decline further due to the disposition of high cost non-core properties completed in February. However, a sharp increase in industry wide drilling activity may start to negatively impact the decreasing trend of the last two years.
Operating Costs
2010 2009
Operating costs ($000s) 117,523 97,240
As a % of revenue 23.9 26.9
$/boe 10.93 11.09
Other IncomeOther income was $0.13 per boe in 2010 compared to $0.19 per boe in 2009. Other income includes gas processing fees, other miscellaneous income and fees, interest income and interest expense on notes due from and to MFC (see “Related Party Transactions”).
Other Income
2010 2009
Interest on notes with MFC ($000s) - 168
Other ($000s) 1,403 1,464
Total other income ($000s) 1,403 1,632
As a % of revenue 0.3 0.5
Interest on notes with MFC ($/boe) - 0.02
Other ($/boe) 0.13 0.17
Total other income ($/boe) 0.13 0.19

14
Operating NetbackFor the year ended December 31, 2010, NAL’s operating netback, before hedging gains, was $26.64 per boe compared to $22.75 per boe in 2009. The increase was primarily due to higher revenue as a result of higher liquids prices, partially offset by higher royalty expense. Hedging gains, related to commodity and exchange rate derivative contracts, were $2.37 per boe for the year ended December 31, 2010, as compared to $9.16 per boe in 2009, attributable mainly to higher realized crude oil prices in 2009.
Operating Netback
2010 2009
AVERAGE DAILY PRODUCTION
Oil (bbl/d) 11,349 9,868
Gas (Mcf/d) 92,403 71,169
NGLs (bbl/d) 2,696 2,287
Total (boe/d) 29,446 24,016
REVENUE(1)
Oil ($/bbl) 73.74 61.73
Gas ($/Mcf) 3.98 4.10
NGLs ($/bbl) 52.05 38.60
Total ($/boe) 45.69 41.19
ROYALTIES
Oil ($/bbl) 14.83 12.82
Gas ($/Mcf) 0.39 0.45
NGLs ($/bbl) 14.16 9.49
Total ($/boe) 8.25 7.52
OPERATING EXPENSES
Oil ($/bbl) 18.42 10.98
Gas ($/Mcf) 0.94 1.90
NGLs ($/bbl) 9.52 9.88
Total ($/boe) 10.93 11.09
OTHER INCOME(2)
Oil ($/bbl) 0.21 0.24
Gas ($/Mcf) 0.01 0.02
NGLs ($/bbl) 0.15 0.15
Total ($/boe) 0.13 0.17
OPERATING NETBACK, BEFORE HEDGING
Oil ($/bbl) 48.19 38.18
Gas ($/Mcf) 1.78 1.76
NGLs ($/bbl) 27.11 19.39
Total ($/boe) 26.64 22.75
HEDGING GAINS/(LOSSES)(3)
Oil ($/bbl) 0.52 15.26
Gas ($/Mcf) 0.69 0.98
NGLs ($/bbl) - -
Total ($/boe) 2.37 9.16
OPERATING NETBACK, AFTER HEDGING
Oil ($/bbl) 48.71 53.43
Gas ($/Mcf) 2.47 2.74
NGLs ($/bbl) 27.11 19.39
Total ($/boe) 29.01 31.91
(1) Net of transportation charges.(2) Excludes interest on notes with MFC.(3) Realized hedging gains/losses on commodity and exchange rate derivative contracts.

15
General and Administrative ExpensesGeneral and administrative (“G&A”) expenses include direct costs incurred by the Corporation plus the reimbursement of the G&A expenses incurred by NAL Resources Management Limited (the “Manager”) on the Corporation’s behalf.
For the year ended December 31, 2010, G&A expenses were $16.4 million as compared to $16.2 million in 2009. In addition, on a year-to-date basis $7.9 million of G&A costs relating to exploitation and development activities were capitalized, compared with $5.6 million in the comparable period of 2009.
The increase in total G&A of $2.5 million in 2010 compared to 2009 is attributable to unusually low costs in 2009 resulting from an adjustment to the short term incentive payout, plus higher compensation costs due to acquisitions. As a result of increased volumes partly due to acquisitions, the boe rate for G&A has decreased from $1.84 per boe in 2009 to $1.53 per boe in 2010.
General and Administrative Expenses
2010 2009
G&A ($000s):
Expensed 16,393 16,171
Capitalized 7,852 5,575
Total G&A 24,245 21,746
Expensed G&A costs:
$/(boe) 1.53 1.84
As % of revenue 3.3 4.5
Per share ($) 0.11 0.15
Share-Based Incentive Compensation PlanThe employees of the Manager are all members of a share-based incentive plan (the “Plan”). The Plan results in employees of the Manager receiving cash compensation based upon the value and overall return of a specified number of notional common shares. The Plan consists of Restricted Share Units (“RSUs”) and Performance Share Units (“PSUs”). RSUs vest as to one third of the amount of the grant on November 30 in each of three years after the date of grant. PSUs vest on November 30, three years from the date of grant. Dividends paid on the Corporation’s outstanding shares during the vesting period are assumed to be paid on the awarded notional shares and reinvested in additional notional shares on the date of the dividend. Upon vesting, the employee of the Manager is entitled to a cash payout based on the share price at the date of vesting of the shares held. In addition, the PSUs have a performance multiplier which is based on the Corporation’s performance relative to its peers and may range from zero to two times the market value of the notional shares held at vesting.
Pursuant to the Reorganization, all previously issued RSUs and PSUs were amended such that instead of them representing one notional trust unit they represent one notional share on the same terms and continue to be governed by the same terms under the Plan.
For the year ended December 31, 2010, the Corporation has accrued $4.6 million compared to $12.5 million in 2009. The decrease period-over-period is mainly attributable to a six percent decrease in share price during 2010 as compared to a 71 percent increase in share price during 2009.
At December 31, 2010, the share price used to determine unit-based incentive compensation was $12.95. The closing share price of the Corporation on the Toronto Stock Exchange on March 8, 2011 was $13.97.
The calculation of share-based compensation expense is made at the end of each quarter based on the quarter end Corporation share price and estimated performance factors. The compensation charges relating to the shares granted are recognized over the vesting period based on the Corporation share price, number of RSUs and PSUs outstanding, and the expected performance multiplier. As a result, the expense recorded in the accounts will fluctuate in each quarter and over time.
At December 31, 2010, the Corporation has recorded a total accumulated liability for share-based incentive compensation in the amount of $13.8 million, of which $6.8 million was paid in January 2011. The remaining balance represents the Corporation’s estimated liability for the share-based incentive plan as at December 31, 2010, with $5.9 million recorded as a current liability as it is payable in December 2011, and $1.1 million recorded as a long-term liability as it is payable in December 2012 and December 2013.

16
Share-Based Compensation
2010 2009
Share-based compensation ($000s):
Expensed 3,170 8,781
Capitalized 1,440 3,680
Total share-based compensation 4,610 12,461
Expensed share-based compensation:
As % of revenue 0.6 2.4
$/boe 0.29 1.00
Per share ($) 0.02 0.08
Related Party TransactionsThe Corporation continues to be managed by the Manager. The Manager is a wholly-owned subsidiary of MFC and also manages NAL Resources Limited (“NAL Resources”), another wholly-owned subsidiary of MFC. NAL Resources and the Corporation maintain ownership interests in many of the same oil and natural gas properties in which NAL Resources is the joint operator. As a result, a significant portion of the net operating revenues and capital expenditures during the year are based on joint amounts from NAL Resources. These transactions are in the normal course of joint operations and are measured using the fair value established through the original transactions with third parties.
The Manager provides certain services to the Corporation and its subsidiary entities pursuant to an Administrative Services and Cost Sharing Agreement (the “Agreement”). The Agreement requires the Corporation to reimburse the Manager at cost for G&A and share-based compensation expenses incurred by the Manager on behalf of the Corporation calculated on a unit of production basis. The Agreement does not provide for any base or performance fees to be payable to the Manager.
The Corporation paid $13.9 million (2009 - $12.6 million) for the reimbursement of G&A expenses for 2010. The Corporation also pays the Manager its share of share-based incentive compensation expense when cash compensation is paid to employees under the terms of the Plan, of which $7.1 million was paid in the first quarter of 2010, representing shares that vested on November 30, 2009 (2009 - $2.3 million). These reimbursements are included in the G&A and share-based compensation amounts discussed above.
At December 31, 2010 the Corporation owed the Manager $8.7 million for the reimbursement of G&A and share-based incentive compensation, offset by $8.1 million due to NAL Resources relating to capital expenditures less net operating revenues.
In conjunction with the Reorganization, a partnership that was indirectly owned jointly by the Corporation and MFC was dissolved on December 31, 2010. The Partnership held the assets acquired from the acquisitions of Tiberius and Spear in February 2008. Refer to Structure Of The Business.
As a part of the original structuring of the Partnership in 2008, both the Corporation and MFC entered into net profit interest royalty agreements with the Partnership. These agreements entitled each royalty holder to a 49.5 percent interest in the cash flow from the Partnership’s reserves. In exchange for this interest, the royalty holders each paid $49.6 million to the Partnership by way of promissory notes in 2008. Although the MFC note resided in the Partnership, it was consolidated.
During the first quarter of 2009, MFC repaid the note receivable to the Partnership of $49.6 million. The note receivable bore interest at prime plus three percent. The Partnership then paid an equal distribution of $49.6 million to MFC. This payment resulted in a $49.6 million reduction to the non-controlling interest on the balance sheet.
During 2010, the Partnership did not pay distributions to its partners (MFC’s 2009 share being $5.0 million).
In addition, in the Partnership there was a note payable to MFC, which was settled on dissolution of the Partnership. At December 31, 2009, the note payable of $8.9 million was included on consolidation of the Partnership, but was effectively eliminated through the non-controlling interest. The note was due on demand, unsecured and bears interest at prime plus three percent.

17
InterestInterest on bank debt includes charges on borrowings, plus standby fees on the unused portion of the bank credit facility.
Interest on bank debt for 2010 increased $1.4 million to $11.8 million, compared to $10.4 million in 2009. The increase was due to a higher effective interest rate. Average outstanding debt for the year ended December 31, 2010 decreased to $228.7 million compared to $269.6 million for the year ended December 31, 2009. In addition, the effective interest rate averaged 5.16 percent in 2010 compared to 3.86 percent in 2009.
Interest on convertible debentures includes interest charges of $12.5 million for the year ended December 31, 2010 compared to $6.0 million for the year ended December 31, 2009. The interest includes the interest on the 2007 debentures at 6.75 percent and the interest on the debentures issued in December 2009 at 6.25 percent. Accretion of the debt discount was $4.0 million (2009 - $1.7 million) for the year ended December 31, 2010.
Interest and Debt
2010 2009
Interest on bank debt ($000s)(1) 11,794 10,399
Interest and accretion on convertible debentures ($000s) 16,562 7,676
Total interest ($000) 28,356 18,075
Bank debt outstanding at period end ($000s) 266,965 230,713
Convertible debentures at period end ($000s)(2) 181,672 177,977
$/boe:
Interest on bank debt 1.09 1.19
Interest on convertible debentures 1.17 0.68
Accretion on convertible debentures 0.38 0.19
Total interest 2.64 2.06
(1) Excludes interest rate hedge impact.(2) Debt component of the debentures, as reported on the balance sheet.
Cash Flow NetbackFor the year ended December 31, 2010, NAL’s cash flow netback was $24.83 per boe, a nine percent decrease from $27.15 per boe in 2009. The decrease was primarily due to a lower operating netback after hedging, higher interest charges, partially offset by lower G&A expenses including share-based incentive compensation.
Cash Flow Netback ($/boe)
2010 2009
Operating netback, after hedging 29.01 31.91
G&A expenses, including unit-based incentive compensation (1.82) (2.84)
Interest on bank debt and convertible debentures(1) (2.26) (1.87)
Interest on notes with MFC(2) - 0.02
Realized loss on interest rate derivative contracts (0.10) (0.07)
Cash flow netback 24.83 27.15
(1) Excludes non-cash accretion on convertible debentures.(2) Reported as other income.

18
Depletion, Depreciation and Accretion of Asset Retirement Obligations (“DDA”)Depletion of oil and natural gas properties, including the capitalized portion of the asset retirement obligations, and depreciation of equipment is provided for on a unit-of-production basis using estimated proved reserves volumes.
For the year ended December 31, 2010, the DDA rate per boe was $24.51 as compared to $21.77 for 2009.
The DDA rate will fluctuate period-over-period depending on the amount and type of capital expenditures and the amount of reserves added.
Depletion, Depreciation and Accretion Expenses
2010 2009
Depletion and depreciation ($000s) 251,343 182,979
Accretion of asset retirement obligation ($000s) 12,112 7,856
Total DDA ($000s) 263,455 190,835
DDA rate per boe ($) 24.51 21.77
TaxesFor the year ended December 31, 2010, NAL had a future income tax recovery of $41.9 million compared to a $34.8 million income tax recovery in 2009.
As at December 31, 2010, the Corporation’s (including all subsidiaries) estimated tax pools (unaudited) available for deduction from future taxable income approximated $1.4 billion, of which approximately 32 percent represented COGPE and 18 percent represented UCC. The remaining balance was represented by CEE, CDE, share issue costs and non-capital loss carry forwards.
Estimated Tax Pools ($ millions)
December 31, 2010 December 31, 2009
Canadian exploration expense 57 50
Canadian development expense 376 379
Canadian oil and gas property expense 456 436
Undepreciated capital costs 251 274
Other (including loss carry forwards) 279 128
Total estimated tax pools 1,419 1,267
Based on strip prices at December 31, 2010, the Corporation is not expected to be taxable in 2011.
Non-Controlling InterestThe Corporation had recorded a non-controlling interest in respect of the 50 percent ownership interest indirectly held by MFC in the Partnership holding the Tiberius and Spear assets (see “Structure of the Business”) for the year ended December 31, 2009. As the Partnership was wound up December 31, 2010, no non-controlling interest was recorded for the year ended December 31, 2010.
The non-controlling interest presented in the 2009 statement of income has two components; the royalty paid to MFC under the NPI, being a cash payment to the royalty holder, and 50 percent of net income remaining in the Partnership, after NPI expense, attributable to MFC. This share of net income attributable to MFC is a non-cash item.
The non-controlling interest in the consolidated statement of income is comprised of:
Non-Controlling Interest ($000s)
2010 2009
Net profits interest expense (income) - 1,919
Share of net income attributable to MFC - 1,040
- 2,959

19
Net IncomeNet income is a measure impacted by both cash and non-cash items. The largest non-cash items impacting the Corporation’s net income are DDA, unrealized gains or losses on derivative contracts and future income taxes.
Net income for the year ended December 31, 2010 of $32.4 million was $23.2 million more than the net income of the comparable period of 2009. The increase in 2010 is mainly attributable to increased revenues net of royalties ($109.1 million), decreased share-based compensation ($5.6 million), increased gains on derivative contracts ($5.7 million) and increased future income tax recovery ($7.2 million), partly offset by increased operating costs ($20.3 million), increased depletion and accretion expense ($72.6 million), and increased interest expense ($10.3 million).
Net Income ($000s)
2010 2009
Net lncome 32,410 9,200
Capital Resources and LiquidityThe capital structure of the Corporation is comprised of shares, bank debt and convertible debentures.
As at December 31, 2010, NAL had 147,248,494 common shares outstanding, compared with 137,471,209 as at December 31, 2009. The increase from December 31, 2009 is attributable to 7,550,000 shares issued under an equity offering and 2,227,285 shares issued under the Corporation’s dividend reinvestment program (“DRIP”).
On April 14, 2010, the Corporation closed an equity offering of 7,550,000 common shares at a price of $13.25 per share for total gross proceeds of $100.0 million.
Under the DRIP, shareholders may elect to reinvest distributions or make optional cash payments to acquire common shares from treasury under the DRIP at 95 percent of the average market price with no additional fees or commissions. The operation of the DRIP was reinstated effective with the March distribution payable on April 15, 2009, following suspension of the program in October 2008. Participation in the DRIP has averaged 17 percent during 2010.
As at December 31, 2010, the Corporation had net debt of $505.7 million (net of working capital and other liabilities, excluding derivative contracts and future income taxes) including the convertible debentures at face value of $194.7 million. Excluding the convertible debentures, net debt was $310.9 million, compared with $282.7 million at December 31, 2009. The increase in net debt, excluding convertible debentures, of $28.2 million during 2010 is attributable to increased bank debt of $36.3 million, offset by a positive change in working capital of $8.1 million.
Bank debt outstanding was $267.0 million at December 31, 2010 compared with $230.7 million as at December 31, 2009. All of the amounts are outstanding under the production facility.
At the end of 2010, the Corporation had a net debt (excluding convertible debentures) to 12 months trailing funds from operations ratio of 1.21 times and a total net debt (including convertible debentures) to 12 months trailing funds from operations ratio of 1.96 times.
Effective January 29, 2010, the Corporation increased its credit facility by $100 million to $550 million. The credit facility is a fully secured, extendible, revolving facility and will revolve until April 30, 2011 at which time it is extendible for a further 364-day revolving period upon agreement between the Corporation and the bank syndicate. The facility consists of a $535 million production facility and a $15 million working capital facility. The credit facility is fully secured by first priority security interests in all present and after acquired properties and assets of the Corporation and its subsidiary and affiliated entities. The purpose of the facility is to fund property acquisitions and capital expenditures. Principal repayments to the bank are not required at this time. Should principal repayments become mandatory, and in the absence of refinancing arrangements, the Corporation would be required to repay the facility in five equal quarterly installments commencing May 1, 2012.
On December 3, 2009, the Corporation issued $115 million principal amount of 6.25% convertible unsecured subordinated debentures. Interest on the debentures is paid semi-annually in arrears, on June 30 and December 31, and the debentures are convertible at the option of the holder, at anytime, into fully paid common shares at a conversion price of $16.50 per common share. The debentures mature on December 31, 2014 at which time they are due and payable. The debentures are redeemable by the Corporation at a price of $1,050 per debenture on or after January 1, 2013 and on or before December 31, 2013, and at a price of $1,025 per debenture on or after January 1, 2014 and on or before December 31, 2014. On redemption or maturity, the Corporation may opt to satisfy its obligation to repay the principal by issuing common shares. If all of the outstanding debentures were converted at the conversion price, an additional 7.0 million common shares would be required to be issued.
In addition, the Corporation has outstanding $79.7 million principal amount of 6.75% convertible extendible unsecured subordinated debentures. Interest on the debentures is paid semi-annually in arrears, on February 28 and August 31, and the debentures are convertible at the option of the holder, at any time, into fully paid common shares at a conversion price of $14.00 per common share. The debentures mature on August 31, 2012 at which time they are due and payable. The debentures are redeemable by the Corporation at

20
a price of $1,050 per debenture on or after September 1, 2010 and on or before August 31, 2011, and at a price of $1,025 per debenture on or after September 1, 2011 and on or before August 31, 2012. On redemption or maturity, the Corporation may opt to satisfy its obligation to repay the principal by issuing common shares. If all of the outstanding debentures were converted at the conversion price, an additional 5.7 million common shares would be required to be issued.
The convertible debentures are classified as debt on the balance sheet with a portion of the proceeds allocated to equity, representing the value of the conversion feature. As the debentures are converted to common shares, a portion of the debt and equity amounts are transferred to share capital. The debt component of the convertible debentures is carried net of issue costs. The debt balance, net of issue costs, accretes over time to the principal amount owing on maturity. The accretion of the debt discount and the interest paid to debenture holders are expensed each period as part of the line item “interest and accretion on convertible debentures” in the consolidated statement of income.
The Corporation recognized $4.0 million (2009 - $1.7 million) of accretion of the debt discount in 2010.
As at March 8, 2011, the Corporation has 147,625,687 common shares and $194.7 million (194,700 debentures) in convertible debentures outstanding.
Capitalization
2010 2009
Common shares equity ($000s) 892,021 894,192
Bank debt ($000s) 266,965 230,713
Working capital deficit (surplus)(1) ($000s) 43,954 52,014
Net debt excluding convertible debentures ($000s) 310,919 282,727
Convertible debentures ($000s)(2) 194,744 194,744
Net debt ($000s) 505,663 477,471
Net debt excluding convertible debentures to trailing 12-month funds from operations(3) 1.21 1.23
Total net debt to trailing 12-month funds from operations(3) 1.96 2.07
Common shares outstanding (000s) 147,248 137,471
(1) Working capital and other liabilities, excluding derivative contracts, future income taxes and notes with MFC.(2) Convertible debentures included at face value.(3) Calculated as net debt divided by funds from operations for the previous 12 months.
Funds from operations is a non-GAAP measure used by management as an indicator of the Corporation’s ability to generate cash from operations. Assuming the Corporation’s commodity price and guidance assumptions are attained, this dividend level represents a payout ratio in the range of 40 – 50 percent of funds from operations. Currently, the Corporation has a bank line of $550 million of which $267.0 million is drawn at December 31, 2010, leaving available capacity of $283.0 million.
The Corporation benefited from an active hedging program in 2010 at prices above market levels. For 2011, the Corporation expects to continue to benefit from an active hedging program. Currently, the Corporation has in place oil hedges for approximately 52 percent of net forecasted (after royalty) production for 2011. Crude volumes are hedged at an average price of US$87.77 per boe on fixed price contracts. On collared contracts, crude volumes are hedged at an average ceiling price of US$96.12 per boe and at an average floor price of US$83.64 per boe. For natural gas, 2011 hedges total approximately 20 percent of net budgeted production volumes hedged at an average floor in excess of $4.18 per GJ (or $4.41 per Mcf).
NAL’s capital program is designed to be scalable and flexible in response to commodity prices and market conditions. For 2011, the Corporation plans for a $200 - 230 million capital program and expects to drill approximately 139 (79 net) wells. The Corporation, through the Manager, operates approximately 90 percent of the assets to which the capital program is directed, allowing for significant flexibility over the scale and timing of the program.
In the 2011 guidance, released on January 26, 2011, the Corporation used pricing assumptions of US$90.00 per barrel WTI crude oil price, a $1.00 Cdn/US$ exchange rate and $3.75 per GJ natural gas.
Fluctuations in commodity prices, other market factors or growth opportunities may make it necessary to adjust forecasted capital expenditures and/or dividend levels.

21
Asset Retirement ObligationsAt December 31, 2010, the Corporation reported an asset retirement obligation (“ARO”) balance of $144.7 million ($127.9 million as at December 31, 2009) for future abandonment and reclamation of the Corporation’s oil and gas properties and facilities. The ARO balance was increased by $3.2 million due to liabilities incurred and revisions to estimates, $12.1 million from accretion expense, $8.2 million for property acquisitions and was reduced by $6.7 million for actual abandonment and environmental expenditures incurred in 2010.
Variable Interest EntitiesNAL has no variable interest entities.
Contractual obligations
Joint Venture Agreement:Effective April 20, 2009, the Corporation and MFC entered into a joint venture agreement with a senior industry partner. The arrangement consists of a three year commitment to spend $50 million to earn an interest in freehold and crown acreage. The Corporation has a 65 percent interest in this agreement and MFC a 35 percent interest and therefore the Corporation’s net commitment is $32.5 million. The agreement is exclusive and structured to be extendible for up to an additional six years for a total potential commitment of $150 million ($97.5 million net to the Corporation) to earn an interest in over 150 sections (97.5 net) of freehold and crown acreage. If the capital spending commitments are not met, interests in the freehold and crown acreage will not be earned and the Corporation will not be required to pay unspent commitment amounts to the senior industry partner. As at December 31, 2010, the Corporation had spent $13.1 million under this agreement, representing its 65 percent working interest.
Farm-in Agreement:Effective August 10, 2009, the Corporation and MFC entered into a Farm-in Agreement with a senior industry partner. The arrangement consists of a two year initial commitment, with a minimum capital commitment of $40 million in the first year and $57 million in the second year, with an option for a third year, at NAL’s election, for an additional $50 million commitment. The Corporation has a 60 percent interest in this agreement and MFC a 40 percent interest. The agreement provides the opportunity to earn an interest in approximately 1,400 gross sections of undeveloped oil and gas rights in Alberta held by the partner. If the capital spending commitments are not met, interest in the acreage will not be earned and the Corporation will not be required to pay any unspent amounts under the agreement. As at December 31, 2010, the Corporation has spent $24.4 million under this agreement, representing its 60 percent working interest.
Other:NAL has entered into several contractual obligations as part of conducting day-to-day business. NAL has the following commitments for the next five years:
($000s) 2011 2012 2013 2014 2015
Office lease(1) 2,254 2,254 2,239 2,196 2,196
Office lease – Clipper and Breaker(2) 2,200 2,200 364 - -
Transportation agreements 4,274 2,303 2,158 977 121
Processing agreements(3) 628 197 184 - -
Convertible debentures(4) - 79,744 - 115,000 -
Bank debt - 160,179 106,786 - -
Total 9,356 246,877 111,731 118,173 2,317
(1) Represents the Corporation’s share of office lease commitments, including both base rent and operating costs, in relation to the lease held by the Manager, of which the Corporation is allocated a pro rata share (currently approximately 63 percent) of the expense on a monthly basis.
(2) Represents the full amount of the office lease assumed with the acquisition of Clipper and Breaker. MFC will reimburse the Corporation for 50 percent of the Clipper obligation.
(3) Represents gas processing agreements with take or pay components.(4) Principal amount.

22
Quarterly Information
2010 2009
($000s, except per share and production amounts) Q4 Q3 Q2 Q1 Q4 Q3 Q2 Q1
Revenue, net of royalties(1) 85,111 100,657 105,925 135,662 88,165 85,988 60,922 77,791
Per share 0.58 0.69 0.73 0.99 0.75 0.77 0.60 0.81
Cash flow 65,084 82,082 43,326 63,648 53,060 52,999 63,690 66,546
Per share 0.44 0.56 0.30 0.46 0.45 0.47 0.63 0.69
Funds from operations(2) 61,950 60,018 62,684 73,242 62,953 53,766 51,998 62,024
Per share 0.42 0.41 0.43 0.53 0.53 0.48 0.51 0.64
Net income (loss) (4,204) (781) 8,046 29,349 5,634 8,249 (9,407) 4,724
Per share
basic (0.03) (0.01) 0.06 0.21 0.05 0.07 (0.09) 0.05
diluted (0.03) (0.01) 0.06 0.21 0.05 0.07 (0.09) 0.05
Average oil equivalent production (boe/d – 6:1) 28,596 29,473 29,609 30,120 25,748(3) 23,418 23,049 23,836
(1) Represents revenue, net of royalties, plus gain (loss) on derivative contracts(2) Represents cash flow from operating activities prior to the change in non-cash working capital items(3) Includes Breaker volumes effective December 11, 2009.
Selected Annual Information
Years ended December 31
($000s except per unit amounts) 2010 2009 2008
Oil, natural gas and liquid sales 497,538 365,760 618,914
Net income 32,410 9,200 162,580
Net income per share 0.23 0.09 1.72
Net income per share – diluted 0.23 0.09 1.69
Distributions paid and declared 155,777 120,153 181,462
Distributions paid or declared per share 1.08 1.12 1.92
Total assets 1,612,864 1,609,450 1,210,597
Total liabilities 720,843 715,258 653,334
Long term debt(1) 448,637 408,690 356,336
Shareholders’ equity 892,021 894,192 557,263
Number of common shares outstanding at year-end 147,248 137,471 96,181
(1) Includes bank debt and convertible debentures.

23
Fourth Quarter Review
Capital Expenditures and Exploration & Development ActivitiesThe Corporation spent $19.4 million on drilling, completion and tie-in operations during the fourth quarter of 2010, compared to $32.1 million during the fourth quarter of 2009 and drilled 23 (8.61 net) wells as compared to 37 (13.4 net) wells during the same period in 2009.
Fourth Quarter Drilling Activity
Crude Oil Natural Gas Service WellsDry &
Abandoned Total
Gross Net Gross Net Gross Net Gross Net Gross Net
Operated wells 11 5.44 1 0.70 0 0 0 0 12 6.14
Non-operated wells 9 2.25 2 0.22 0 0 0 0 11 2.47
Total wells drilled 20 7.69 3 0.92 0 0 0 0 23 8.61
ProductionFourth quarter 2010 production was 29,657 boe per day before Reorganization, and compares to production of 25,748 boe per day in the same period of 2009. This 15 percent growth in production is related to strong Cardium and Mississippian oil programs through year end and the full year impact of acquisitions. Production in the quarter was negatively impacted by 300 - 500 boe per day due to greater than forecasted down time due to cold weather in December, Enbridge outages in Saskatchewan and a further production curtailment of Sukunka gas volumes through non-operated facilities.
The Corporation’s net production, after deducting the non-controlling interest is 28,596 boe per day for the fourth quarter of 2010 (2009 – 25,413 boe per day).
RevenueGross revenue from oil, natural gas and natural gas liquids sales, after transportation costs and prior to hedging, totaled $116.9 million for the three months ended December 31, 2010, five percent higher than the fourth quarter of 2009. The increase is due to a 13 percent increase in production partially offset by a six percent decrease in the average realized price per boe, which was driven by a 22 percent decrease in the realized natural gas price, partially offset by a six percent increase in realized crude oil prices. The decrease in realized prices reflects lower AECO prices in the fourth quarter of 2010.
PricingNAL’s fourth quarter average realized Canadian crude oil price per barrel, net of transportation costs excluding hedging, was $76.42, as compared to $72.15 for the comparable quarter of 2009. The increase in realized price quarter-over-quarter of six percent, or $4.27/bbl, was primarily driven by a 12 percent increase in WTI (U.S.$/bbl) over the comparable period, partially offset by a four percent increase in the value of the Canadian dollar. For the fourth quarter of 2010, NAL’s crude oil price differential was 89 percent, the same as the comparable period in 2009. The differential is calculated as realized price as a percentage of WTI stated in Canadian dollars.
Natural gas liquids averaged $51.59/bbl in the fourth quarter of 2010, a nine percent increase from $47.43/bbl realized in 2009.
For the three months ended December 31, 2010, the Corporation’s natural gas sales averaged $3.56/Mcf compared to $4.54/Mcf in the comparable period of 2009, a decrease of 22 percent. The quarter-over-quarter decrease in gas prices was mainly attributable to a 20 percent decrease in the benchmark AECO daily spot prices. Prices for Lake Erie natural gas decreased to $4.64/Mcf in the fourth quarter of 2010, compared to $5.32/Mcf in the comparable period in 2009, a decrease of 13 percent. Lake Erie production of 3.0 MMcf/d accounted for three percent of the Corporation’s natural gas production in the fourth quarter of 2010, as compared to four percent in the comparable period of 2009.
Risk ManagementRealized gains on derivative contracts were $6.4 million for the fourth quarter of 2010, compared to $10.9 million in the comparable quarter of 2009. The decrease in gains is attributable to realized losses on crude oil contracts compared to realized gains in 2009, mainly due to higher oil prices in 2010.
During the fourth quarter, an average of 6,099 bbl/d of crude was hedged, resulting in a realized loss of $1.7 million. In addition, 31,337 GJ/d of natural gas were hedged, resulting in a realized gain of $6.1 million, and foreign exchange rate contracts resulted in a realized gain of $2.1 million, which were partially offset by realized losses on interest rate contracts of $0.1 million.
Fourth quarter income for 2010 includes a $20.3 million unrealized loss on derivatives resulting from the change in the fair value of the derivative contracts during the quarter from an unrealized gain of $10.4 million at September 30, 2010, to an unrealized loss of $9.9 million at December 31, 2010. The $20.3 million unrealized loss was comprised of a $15.7 million unrealized loss on crude oil contracts, a $6.0 million unrealized loss on natural gas contracts and a $1.4 million unrealized gain on foreign exchange and interest rate swaps.

24
Royalty ExpensesCrown, freehold and overriding royalties were $20.4 million for the three months ended December 31, 2010. Expressed as a percentage of gross sales net of transportation costs, before gain/loss on derivative contracts, the net royalty rate was 17.4 percent for the quarter ended December 31, 2010, a decrease from the 19.0 percent experienced in the same period of the previous year.
Royalties decreased to $7.75 per boe for the fourth quarter of 2010, a decrease of 13 percent compared to the fourth quarter of 2009. The decrease is primarily attributable to lower realized natural gas prices on a quarter-over-quarter basis.
Operating CostsOperating costs averaged $10.21 per boe for the quarter ended December 31, 2010, the same as the quarter ended December 31, 2009. Costs in the fourth quarter of 2009 and 2010 were positively impacted by a one time reduction from prior period accruals where actual costs were lower than previously assumed.
Other IncomeOther income was $0.33 per boe for the fourth quarter of 2010 compared to $0.10 per boe in the comparable quarter of 2009.
Operating NetbackFor the quarter ended December 31, 2010, NAL’s operating netback, before hedging gains, was $26.67 per boe, a decrease of five percent from $28.05 per boe for the quarter ended December 31, 2009. The decrease was due to lower revenues as a result of lower natural gas prices, partially offset by lower royalties. Hedging gains, related to commodity and exchange rate derivative contracts, were $2.49 per boe in the fourth quarter of 2010, as compared to $4.71 per boe in 2009. The lower hedging gains are attributable to higher realized crude oil prices in the fourth quarter of 2010 as compared to the comparable quarter in 2009.
General and Administrative ExpensesFor the three months ended December 31, 2010, G&A expenses were $4.5 million, compared with $5.4 million in the comparable quarter of 2009. In addition, $1.6 million of G&A costs relating to exploitation and development activities were capitalized in the fourth quarter of 2010, compared with $1.3 million in the fourth quarter of 2009. G&A expense per boe was $1.70 in the quarter, as compared to $2.29 for the same period in 2009.
The Corporation paid $3.4 million (2009 - $3.9 million) to the Manager for the reimbursement of G&A expenses during the fourth quarter.
Share-Based Incentive Compensation PlanDuring the fourth quarter of 2010, the Corporation recorded a $2.1 million charge for share-based incentive compensation that reflects the impact of vesting and an increase in the share price. The share price of the Corporation increased by 12 percent, from $11.53 at September 30, 2010 to $12.95 at December 31, 2010. An increase in share price results in previously accrued amounts being increased.
Share-based incentive compensation increased from $2.8 million in the fourth quarter of 2009 to $3.1 million in 2010. This increase is a reflection of the greater increase in share price used to determine the compensation during the fourth quarter of 2010, as compared to the increase in share price during the fourth quarter of 2009 (from $12.70 at September 30, 2009 to $13.74 at December 31, 2009).
InterestInterest on bank debt for the fourth quarter of 2010 was $3.2 million, an increase of $0.5 million from $2.7 million for the comparable period in 2009. The increase was due to higher average debt levels and higher average interest rates. Average outstanding bank debt for the fourth quarter of 2010 was $251.8 million, $11.7 million higher than the $240.1 million outstanding during the fourth quarter of 2009. NAL’s effective interest rate averaged 5.06 percent during the fourth quarter of 2010, compared to 4.48 percent during the comparable period in 2009. The increase in the interest rate from the fourth quarter of 2009 is attributable to higher average base interest rates, slightly offset by lower stamping fees and borrowing fees. NAL’s interest is calculated based upon a floating rate before any effects of interest rate swaps.
Interest on convertible debentures represents interest charges of $3.1 million for the three months ended December 31, 2010 as compared to $1.9 million for the same period in 2009, and accretion of debt discount of $1.0 million (2009 - $0.6 million) in 2009.
Cash Flow NetbackFor the quarter ended December 31, 2010, NAL’s cash flow netback was $24.33 per boe, a 12 percent decrease from $27.56 per boe for the comparable period in 2009. The decrease was due to a lower operating netback after hedging and higher interest charges, offset by lower G&A expenses, including share-based incentive compensation.
Depletion, Depreciation and Accretion of Asset Retirement Obligation (“DDA”)For the quarter ended December 31, 2010, depletion on property, plant and equipment and accretion on the asset retirement obligations was $24.05 per boe, eight percent higher than $22.34 per boe for the same period of 2009.

25
Net LossNet loss for the fourth quarter of 2010 was $4.2 million compared to net income of $5.6 million for the comparable period in 2009. The decrease of $9.8 million was mainly due to increased losses on derivative contracts ($10.0 million), increased operating costs ($2.7 million) and higher depletion and accretion ($10.3 million), partially offset by a future income tax recovery ($7.0 million) and increased revenues net of royalties ($6.3 million).
Disclosure Controls and ProceduresThe Chief Executive Officer and the Chief Financial Officer are responsible for establishing and maintaining disclosure controls and procedures (“DC&P”), as such term is defined in National Instrument 52-109 Certification of Disclosure in Issuers’ Annual and Interim Filings (“NI 52-109”), for NAL. They have, as at the financial year ended December 31, 2010, designed such DC&P, or caused them to be designed under their supervision, to provide reasonable assurance that information required to be disclosed by NAL in its annual filings, interim filings or other reports filed or submitted by NAL under applicable securities legislation is recorded, processed, summarized and reported within the time periods specified in applicable securities legislation and that all material information relating to NAL is made known to them by others, particularly during the period in which NAL’s annual and interim filings are being prepared.
Under the supervision of the Chief Executive Officer and the Chief Financial Officer, NAL conducted an evaluation of the effectiveness of its DC&P as at December 31, 2010. Based on this evaluation, the officers concluded that as of December 31, 2010, NAL’s DC&P are effective in that information required to be disclosed by NAL in its annual filings, interim filings or other reports that it files or submits under applicable securities legislation is recorded, processed, summarized and reported within the time periods specified in such legislation and that these controls and procedures are also effective in that material information relating to NAL is made known to our Chief Executive Officer and Chief Financial Officer by others.
Internal Control Over Financial ReportingThe Chief Executive Officer and the Chief Financial Officer are responsible for establishing and maintaining internal control over financial reporting (“ICFR”), as such term is defined in NI 52-109, for NAL. They have, as at the financial year ended December 31, 2010, designed ICFR, or caused it to be designed under their supervision, to provide reasonable assurance regarding the reliability of financial reporting and the preparation of financial statements for external purposes in accordance with Canadian GAAP. The control framework the officers used to design NAL’s ICFR is the Internal Control - Integrated Framework (COSO Framework) published by The Committee of Sponsoring Organizations of the Treadway Commission (COSO).
NAL’s ICFR includes polices and procedures that:
• Pertain to the maintenance of records that, in reasonable detail, accurately and fairly reflect transactions, acquisitions and dispositions of assets of the Corporation;
• Provide reasonable assurance that transactions are recorded as necessary to permit preparation of financial statements in accordance with generally accepted accounting principles; and
• Provide reasonable assurance regarding prevention or timely detection of unauthorized acquisition, use or disposition of the Corporation’s assets that could have a material effect on the financial statements.
Under the supervision of the Chief Executive Officer and the Chief Financial Officer (collectively, the “Officers”), NAL conducted an evaluation of the effectiveness of its ICFR as at December 31, 2010 based on the COSO Framework. Based on this evaluation, the Officers concluded that as of December 31, 2010, NAL’s ICFR are effective.
It should be noted that while the Officers believe that NAL’s are effective, they do not expect that the disclosure controls and procedures or internal controls over financial reporting will prevent all errors and fraud. A control system, no matter how well conceived or operated, can provide only reasonable, but not absolute, assurance that the objectives of the control system are met.
There were no changes in the Corporation’s ICFR during the year ended December 31, 2010 that materially affected the Corporation’s ICFR.
Critical Accounting EstimatesThe significant accounting policies used by NAL are disclosed in the notes to NAL’s December 31, 2010 consolidated financial statements. Certain accounting policies require that management make appropriate decisions when formulating estimates and assumptions that affect the reported amounts of assets, liabilities, revenues and expenses. The Manager reviews the estimates regularly. The emergence of new information and changed circumstances may result in actual results or changes in estimated amounts that differ materially from current estimates. NAL might also realize different results from the application of new accounting standards published, from time to time, by various regulatory bodies.
Proved Oil and Gas ReservesUnder National Instrument 51-101 Standards of Disclosure for Oil and Gas Activities (“NI 51-101”), “proved” reserves are those reserves that can be estimated with a high degree of certainty to be recoverable (it is possible that the actual remaining quantities recovered will exceed the estimated proved reserves). The level of certainty should result in at least a 90 percent probability at a Corporation aggregate

26
level that the quantities actually recovered will equal or exceed the estimated reserves. In the case of “probable” reserves, which are less certain to be recovered than proved reserves, NI 51-101 states that it must be equally likely that the actual remaining quantities recovered will be greater or less than the sum of the estimated proved plus probable (“P+P”) reserves. As for certainty, in order to report reserves as P+P, the reporting Corporation must believe that there is at least a 50 percent probability at a Corporation aggregate level that the quantities actually recovered will equal or exceed the sum of the estimated P+P reserves.
The oil and gas reserve estimates are made using all available geological and reservoir data as well as historical production data. Estimates are reviewed and revised as appropriate. Revisions occur as a result of changes in prices, costs, fiscal regimes, reservoir performance or a change in NAL’s plans. The effect of changes in proved oil and gas reserves on the financial results and position of NAL is described under the heading “Impairment of Property, Plant and Equipment” below.
Depletion ExpenseNAL uses the full cost method of accounting for exploration and development activities. In accordance with this method of accounting, all costs associated with exploration and development are capitalized whether or not the activities funded were successful. The aggregate of net capitalized costs and estimated future development costs is amortized using the unit of production method on estimated proved oil and gas reserves.
An increase or decrease in estimated proved oil and gas reserves would result in a corresponding reduction or increase in depletion expense. A decrease or increase in estimated future development costs would result in a corresponding reduction or increase in depletion expense.
Unproved PropertiesThe cost of acquisition and evaluation of unproved properties are initially excluded from the depletion calculation. These properties are assessed to ascertain whether impairment in value has occurred. When proved reserves are assigned or a property is considered to be impaired, the cost of the property or the amount of the impairment will be added to the capitalized costs for the calculation of depletion.
Impairment of Property, Plant & EquipmentNAL is required to review the carrying value of all property, plant and equipment, including the carrying value of oil and gas assets, for potential impairment. Impairment is indicated if the carrying value of the long-lived oil and gas asset is not recoverable by the future undiscounted cash flows. If impairment is indicated, the amount by which the carrying value exceeds the estimated fair value of the property, plant and equipment is charged to net income.
The cash flows used in the impairment assessment require management to make assumptions and estimates about recoverable reserves (see “Proved Oil and Gas Reserves” above), future commodity prices and operating costs. Changes in any of the assumptions, such as a downward revision in reserves, a decrease in future commodity prices, or an increase in operating costs could result in an impairment of an asset’s carrying value.
GoodwillGoodwill is subject to impairment tests annually, or as economic events dictate, by comparing the fair value of the reporting entity to its carrying value, including goodwill. If the fair value of the reporting entity is less than its carrying value, a goodwill impairment loss is recognized as the excess of the carrying value of the goodwill over the implied value of the goodwill. The determination of fair value requires management to make assumptions and estimates about recoverable reserves (see the “Proved Oil and Gas Reserves” discussion above), future commodity prices, operating costs, production profiles and discount rates. Adverse changes in any of these assumptions could result in an impairment of all or a portion of the goodwill carrying value in future periods.
Fair Value of Derivative InstrumentsNAL utilizes financial derivatives to manage market risk. The purpose of hedging activity is to provide an element of stability to NAL’s cash flow in a volatile market environment. NAL recognizes the fair value of derivative contracts on its balance sheet with the change in fair value recognized in net income of the period. The fair value of commodity derivative contracts is based on forward commodity prices. The fair value of interest rate derivative contracts is based on forward interest rates. The fair value of foreign exchange derivative contracts is based on forward exchange rates. Any change in commodity prices, interest rates and foreign exchange rates will impact the fair value of the contracts and therefore net income of the period.
Asset Retirement ObligationNAL is required to recognize and measure liabilities associated with capital assets. A liability is recognized equal to the discounted fair value of the obligation in the period in which the asset is recorded with an equal offset to the carrying amount of the asset. The liability then accretes to its fair value with the passage of time. Management is required to estimate the timing and future costs to settle liabilities. Changes in the estimated future costs, the timing of these costs, and the discount and inflation rate will impact the liability, related asset and expense.
AcquisitionsAcquisitions have been accounted for by the purchase method using fair values. The determination of fair value involves numerous estimates. The valuation of petroleum and natural gas assets is based on NAL’s estimate of P+P reserves using estimated forecasted prices at the time of the transaction, plus an estimate of unproved properties. Management also estimates the fair value of other assets and liabilities in these transactions and the balances for tax pools. This valuation could differ materially by altering the various assumptions which would have impacted the composition of the balance sheet.

27
Legal, Environmental Remediation and Other Contingent MattersNAL is required to determine whether a loss is probable based on judgment, the interpretation of laws and regulations and whether the loss can reasonably be estimated. When the loss is determined, it is charged to net income. NAL’s management must continually monitor known and potential contingent matters and make appropriate provisions by charges to earnings when warranted by circumstances.
Income Tax AccountingThe determination of NAL’s income and other tax liabilities requires interpretation of complex laws and regulations often involving multiple jurisdictions. All tax filings are subject to audit and potential reassessments after the lapse of considerable time. Accordingly, the actual income tax liability may differ significantly from that estimated and recorded by management.
Future income taxes are recognized for temporary differences arising in the Corporation and its subsidiaries. Should the assumptions underlying the estimate of the reversal of temporary differences change, including future commodity prices, capital expenditures and reserves, future taxes recorded may be adjusted for the Corporation.
New Accounting Standards/Future Accounting Changes
International Financial Reporting Standards (“IFRS”)In February 2008, the Accounting Standards Board confirmed that the transition date to IFRS from Canadian GAAP will be January 1, 2011 for publicly accountable enterprises. Therefore, the Corporation is required to report its results in accordance with IFRS starting in 2011, with comparative disclosure for 2010.
The Corporation had an IFRS conversion plan and had established timelines for the completion and execution of the conversion project. The conversion plan included the following phases:
1) An IFRS diagnostic phase which involved a high level assessment of the differences between Canadian GAAP and IFRS, identifying major impact areas.
2) An in-depth review of GAAP differences and determination of transition policy choices as well as ongoing IFRS accounting policies.
3) The implementation phase where solutions are being developed and assessed. This involves an evaluation of information systems, business processes, procedures, internal controls and training to support the new accounting requirements.
4) A post implementation phase which involves the parallel running of 2010 financial results, the preparation of IFRS financial statements and disclosures and a review of processes and controls to make any required changes.
As at December 31, 2010, NAL has made significant progress on its changeover plan, and has substantially completed its conversion to IFRS.
Regular reporting on the status of IFRS has been provided to the Board of Directors through the Audit Committee. In addition, the Corporation has actively engaged its auditors in the conversion project and will continue to engage them in ongoing discussions as the project progresses.
NAL commenced its IFRS conversion project in 2009 and internal staff was assigned to lead the transition project, supplemented with consultants as required. Training of key internal finance and accounting personnel was completed both through external IFRS oil and gas training and internal training. Training and education continues to be expanded to other key personnel within the organization.
The IFRS implementation is not considered to have a significant impact on NAL’s various business activities, including banking arrangements, compensation arrangements and risk management agreements.
Financial systems have been modified to accommodate the reporting of both Canadian GAAP financial results and IFRS financial results in 2010. In addition, modifications have been made to ensure data is captured with the added level of granularity required under IFRS. Other IT systems that capture data used in the financial system are under review as to whether any modifications are still required.
Internal business processes and controls have been assessed, developed and continue to be enhanced to enable the collection of information so that data can be attained in the manner necessary to report under IFRS. As processes are developed or amended, internal controls are being assessed to determine any required changes. This has been, and continues to be, an ongoing process to ensure all changes in accounting policies include appropriate controls and procedures.
The Corporation has completed its January 1, 2010 IFRS opening balance sheet based on its draft accounting policies.
NAL continues to monitor new and amended accounting standards issued by the International Accounting Standards Board to determine the impact on the Corporation’s results, if any.

28
Significant Accounting Policy DifferencesNAL’s preliminary assessment of the impact of adopting IFRS based on current standards has identified several areas as potentially having the most significant impact on the consolidated financial statements. This should not be regarded as a complete list of changes that will result from the transition to IFRS, but rather is intended to highlight the areas believed to be the most significant. As our conversion is finalized additional changes will be confirmed. These assessments are based on available information and the Corporation’s expectations as of the date of the MD&A and are therefore subject to change based on new facts and circumstances.
IFRS 1 provides entities adopting IFRS for the first time with a number of optional exemptions and mandatory exceptions, in certain areas, to the full retrospective application of IFRS. Most adjustments required on transition to IFRS will be made against retained earnings in the comparative balance sheet.
We have identified the following significant differences between our current accounting policies and those required or expected to apply in preparing IFRS financial statements. The estimated impact to the comparative financial statements for 2010 is discussed for certain of these differences.
Property, Plant and EquipmentThe Corporation, like many other Canadian oil and gas reporting issuers, applies the “full cost” accounting methodology to its oil and gas assets. Under full cost, capital expenditures are maintained in a single cost centre for each country, and the cost centre is subject to a single depletion calculation, on a unit of production basis using proved reserves, and a single impairment test. Upon transition, NAL will be required to adopt new accounting policies, including pre exploration costs, exploration costs and development costs.
Capital expenditures will have to be segregated between pre exploration costs, exploration and evaluation (“E&E”) and development and production (“D&P”) assets. In addition, assets will have to be aggregated at a component level.
Pre-explorations costs are required to be expensed. For 2010 these expenditures for NAL were minimal.
E&E costs are those expenditures for which technical feasibility and commercial viability have not yet been determined. These costs will initially be capitalized as E&E assets. When technical feasibility and commercial viability have been determined, the costs are transferred to PP&E. Currently E&E assets are comprised primarily of certain possible reserves on acquisitions of approximately $86.5 million. Consistent with Canadian GAAP, these costs will not be depleted.
D&P assets representing property, plant and equipment will be depleted on a unit of production basis, by component. NAL has defined components to be at an area level. In addition, depletion will be calculated based on proved plus probable reserves. As a result of depleting on a proved plus probable basis, and all other things being equal, depletion expense will be lower than when depletion expense is calculated on proved reserves under Canadian GAAP.
The Corporation is taking advantage of an IFRS 1 exemption on transition to IFRS which allows NAL to deem its carrying value of PP&E under IFRS to remain the same as Canadian GAAP, subject to an impairment test. The Canadian carrying value is allocated to the component areas and cash generating units based on the relative reserve values of the properties as at January 1, 2010. No impairment has been noted by NAL on transition to IFRS.
When NAL divests of properties under Canadian GAAP, there is no requirement to recognize a gain or loss, unless depletion rates change by more than 20 percent. Under IFRS, a gain or loss must be calculated. During 2010 certain divestments were completed by NAL, it is anticipated these divestments will result in gains recognized in net income.
Farm-outs and property swaps under IFRS will also result in a gain or loss recognized in net income. During 2010 NAL did not undertake any material farm outs or property swaps.
Impairment Under Canadian GAAP, an impairment test was completed for the one full cost pool. Impairment losses under Canadian GAAP are not reversed once recognized.
Impairment tests under IFRS are to be calculated at a cash generating unit level (“CGU”), which is defined as the lowest level of assets that produce independent cash inflows. The Corporation has identified its CGU’s for this purpose. An impairment test must be performed when indicators suggest there may be impairment. In addition, the recognition of impairment in a prior period must be reversed should impairment conditions reverse at a depleted value.
An impairment test has been performed individually for all CGU’s on transition with no impairment noted. Given the decrease in gas prices throughout 2010, it is anticipated that NAL will recognize an impairment loss during 2010 in the comparative financial statements.

29
Asset Retirement ObligationsUnder Canadian GAAP, ARO is measured at the estimated fair value of expenditures expected to be incurred and discounted at a credit adjusted rate. This value is not re-measured for a change in discount rate.
On transition to IFRS, the Corporation has selected an IFRS 1 exemption allowing for the ARO liability to be measured in accordance with IFRS as at January 1, 2010 with the offset to retained earnings.
Under IFRS, the liability is re-measured each period end at the current discount rate. Within the industry, there is debate on interpretation of the IFRS standard and whether the discount rate can include a component related to the entity’s own credit risk. Not including this component would decrease the discount rate, thereby significantly increasing the provision on transition to IFRS, with a corresponding charge to a retained earnings or deficit. The Corporation has selected a current policy of including the credit component in the rate, resulting in approximately a $6.5 million increase in the liability on transition.
Further, onerous contracts require identification and, to the extent they exist, must be recorded as a liability on the balance sheet. On transition, no onerous contracts exist that would require recognition under IFRS for the Corporation.
Convertible DebenturesThe Corporation has elected to mark to market its convertible debentures under IFRS. On transition to IFRS, as the convertible debentures are marked to market, the entire $12 million equity component under Canadian GAAP is eliminated and the debt is increased by approximately $26 million.
On conversion to a corporation, there is a requirement to bifurcate the debentures back to their equity and debt components based on the fair value of the debenture at December 31, 2010.
Deferred Income TaxesIn transitioning to IFRS, the Corporation’s deferred tax liability will be impacted by the tax effects resulting from the IFRS changes discussed in this section of the MD&A.
In addition, deferred income taxes are impacted due to the requirement under IFRS to apply the highest applicable tax rate to the temporary differences in question, rather than the most likely rate under Canadian GAAP. As a result, deferred taxes on the balance sheet will increase, due to an increase in the expected tax rate of approximately 39 percent for trust entities.
It is anticipated that on transition to IFRS the deferred tax liability will decrease by approximately $5 million.
On conversion to a corporation, it is expected that the tax rate will decrease to approximately 25 percent, therefore reducing deferred taxes.
Share Based CompensationUnder IFRS the Corporation is required to fair value its share based compensation and to include a forfeiture feature, which the Corporation did not include under Canadian GAAP. This change will only impact the timing of recognition of the expense, as on vesting all phantom shares are paid out in cash and the cash amount will not change. There will be no significant impact on transition.
Other IFRS 1 ConsiderationsIFRS will allow the Corporation to use IFRS rules for business combinations on a prospective basis rather than restating all prior business combinations. The Corporation has elected this exemption on transition to IFRS. The Corporation is currently evaluating acquisitions during the 2010 year to determine if they are business or asset acquisitions in nature.
Trust unitsIn accordance with IFRS, trust units may have to be presented as debt if the terms and conditions of such instruments meet the definition of a financial liability. NAL has reviewed the terms and conditions of its Trust Indenture and has determined that presentation of the units as equity is appropriate.
Dated: March 9, 2011

30
CONSOLIDATED FINANCIAL STATEMENTS
MANAGEMENT’S REPORTNAL Resources Management Limited, as manager of NAL Energy Corporation is responsible for the preparation of the accompanying consolidated financial statements of the Corporation. The consolidated financial statements have been prepared in accordance with Canadian Generally Accepted Accounting principles, and where applicable, amounts based on management’s best estimates and judgment.
Management has established procedures and systems of internal control designed to provide reasonable assurance that assets are safeguarded and that accurate financial information is produced in a timely manner.
The Board of Directors is responsible for reviewing and approving the consolidated financial statements, and through its Audit Committee, ensuring that management fulfills its responsibilities for financial reporting. The Audit Committee, which is comprised of four independent directors, meets regularly with management, the internal auditor and the external auditors to satisfy itself that each party is properly discharging its responsibilities. The Audit Committee reviews the consolidated financial statements and recommends their approval to the Board of Directors.
KPMG LLP, an independent firm of Chartered Accountants, appointed by the shareholders of NAL Energy Corporation, have audited the consolidated financial statements in accordance with Canadian generally accepted auditing standards. KPMG LLP have full and free access to the Audit Committee.
Andrew B. Wiswell Keith A. SteevesPresident and CEO Vice President, Finance and CFO
March 9, 2011
AUDITORS’ REPORT TO THE SHAREHOLDERS OF NAL ENERGY CORPORATIONWe have audited the accompanying consolidated financial statements of NAL Energy Corporation (“NAL” or the “Corporation”), which comprise the consolidated balance sheets as at December 31, 2010 and 2009, the consolidated statements of income, comprehensive income and deficit, and cash flows for the years then ended, and notes, comprising a summary of significant accounting policies and other explanatory information.
Management’s Responsibility for the Consolidated Financial StatementsManagement is responsible for the preparation and fair presentation of these consolidated financial statements in accordance with Canadian generally accepted accounting standards, and for such internal control as management determines is necessary to enable the preparation of consolidated financial statements that are free from material misstatement, whether due to fraud or error.
Auditors’ ResponsibilityOur responsibility is to express an opinion on these consolidated financial statements based on our audits. We conducted our audits in accordance with Canadian generally accepted auditing standards. Those standards require that we comply with ethical requirements and plan and perform the audit to obtain reasonable assurance about whether the consolidated financial statements are free from material misstatement.
An audit involves performing procedures to obtain audit evidence about the amounts and disclosures in the consolidated financial statements. The procedures selected depend on our judgment, including the assessment of the risks of material misstatement of the consolidated financial statements, whether due to fraud or error. In making those risk assessments, we consider internal control relevant to the entity’s preparation and fair presentation of the consolidated financial statements in order to design audit procedures that are appropriate in the circumstances, but not for the purpose of expressing an opinion on the effectiveness of the entity’s internal control. An audit also includes evaluating the appropriateness of accounting policies used and the reasonableness of accounting estimates made by management, as well as evaluating the overall presentation of the consolidated financial statements.
We believe that the audit evidence we have obtained in our audits is sufficient and appropriate to provide a basis for our audit opinion.
Opinion In our opinion, the consolidated financial statements present fairly, in all material respects, the consolidated financial position of the Corporation as at December 31, 2010 and 2009, and the results of its consolidated operations and its consolidated cash flows for the years then ended in accordance with Canadian generally accepted accounting principles.
Chartered AccountantsCalgary, Canada
March 9, 2011

31
CONSOLIDATED BALANCE SHEETSAs at December 31
(thousands of dollars) 2010 2009
Assets
Current assets
Cash $821 $1,604
Accounts receivable 57,839 61,631
Prepaids and other receivables 14,532 15,663
Derivative contracts (Note 15) 422 6,285
Future income tax asset (Note 14) 3,830 3,132
77,444 88,315
Derivative contracts (Note 15) - 2,461
Future income tax asset (Note 14) 17,152 -
Goodwill 14,722 14,722
Property, plant and equipment (Notes 4 and 6) 1,503,546 1,503,952
$1,612,864 $1,609,450
Liabilities and Shareholders’ Equity
Current liabilities
Accounts payable and accrued liabilities $100,837 $110,897
Note payable (Note 5) - 8,907
Dividends payable to shareholders 13,252 12,372
Derivative contracts (Note 15) 7,819 11,231
121,908 143,407
Bank debt (Note 7) 266,965 230,713
Convertible debentures (Note 8) 181,672 177,977
Derivative contracts (Note 15) 2,503 -
Other liabilities (Note 9) 3,057 7,643
Asset retirement obligations (Note 11) 144,738 127,872
Future income tax liability (Note 14) - 24,778
Non-controlling interest (Note 12) - 2,868
720,843 715,258
Shareholders’ equity
Share capital (Note 13) 879,393 -
Unitholders’ capital (Note 13) - 1,482,029
Equity component of convertible debentures (Note 8) 12,628 12,628
Deficit (Notes 1 and 13) - (600,465)
892,021 894,192
$1,612,864 $1,609,450
Commitments (Note 16)
Subsequent event (Note 17)
Common shares outstanding (000s) 147,248 137,471
See accompanying notes.
Irvine J. Koop Gordon S. LackenbauerDirector and Chairman of the Board Director and Chairman of the Audit Committee

32
CONSOLIDATED STATEMENTS OF INCOME, COMPREHENSIVE INCOME AND DEFICIT Years ended December 31
(thousands of dollars, except per unit amounts) 2010 2009
Revenue
Oil, natural gas and liquid sales $497,538 $365,760
Crown royalties (65,032) (44,684)
Freehold and other royalties (23,585) (21,214)
408,921 299,862
Gain (loss) on derivative contracts (Note 15):
Realized gain 24,446 79,671
Unrealized loss (7,415) (68,299)
17,031 11,372
Other income 1,403 1,632
427,355 312,866
Expenses
Operating 117,523 97,240
Transportation 6,501 4,673
General and administrative 16,393 16,171
Share-based incentive compensation (Note 10) 3,170 8,781
Corporate conversion costs 1,483 -
Interest on bank debt 11,794 10,399
Interest and accretion on convertible debentures 16,562 7,676
Bad debt recovery - (296)
Depletion, depreciation and amortization 251,343 182,979
Accretion on asset retirement obligations 12,112 7,856
436,881 335,479
Loss before taxes and non-controlling interest (9,526) (22,613)
Income tax recovery 782 2
Future income tax reduction 41,154 34,770
Total income tax reduction (Note 14) 41,936 34,772
Income before non-controlling interest 32,410 12,159
Non-controlling interest (Note 12) - (2,959)
Net income and comprehensive income 32,410 9,200
Deficit, beginning of year (600,465) (489,512)
Net income 32,410 9,200
Distributions declared (Note 13) (155,777) (120,153)
Reclassification of deficit to capital pursuant to Reorganization (Note 1) 723,832 -
Deficit, end of year $- $(600,465)
Net income per share (Note 13)
Basic $0.23 $0.09
Diluted $0.23 $0.09
Weighted average shares outstanding (000s) 143,913 107,157
See accompanying notes.

33
CONSOLIDATED STATEMENTS OF CASH FLOWSYears ended December 31
(thousands of dollars) 2010 2009
Operating Activities
Net income $32,410 $9,200
Items not involving cash:
Depletion, depreciation and amortization 251,343 182,979
Accretion on asset retirement obligations 12,112 7,856
Unrealized loss on derivative contracts 7,415 68,299
Future income tax reduction (41,154) (34,770)
Non-cash accretion expense on convertible debentures 4,040 1,722
Non-controlling interest - 1,040
Lease amortization (1,655) (366)
Abandonment and reclamation (6,617) (5,219)
Change in non-cash working capital (3,754) 5,554
254,140 236,295
Financing Activities
Distributions paid to shareholders (129,559) (111,256)
Increase (decrease) in bank debt 36,252 (224,952)
Issue of trust units, net of issue costs 94,466 81,577
Note repayment from MFC (Note 5) - 49,599
Partnership distribution paid to MFC - (54,552)
Issuance of convertible debentures (345) 110,287
Change in non-cash working capital - (5,700)
814 (154,997)
Investing Activities
Additions to property, plant and equipment (203,038) (133,028)
Property acquisitions (68,607) (2,800)
Proceeds from dispositions 22,178 17,521
Acquisition of Breaker (Note 4) (901) (1,500)
Acquisition of Clipper (Note 4) - (901)
Disposition of Clipper (Note 4) - 54,432
Acquisition of Spearpoint (Note 4) - (9,749)
Disposition of Spearpoint (Note 4) (309) 6,764
Change in non-cash working capital (4,968) (16,017)
(255,645) (85,278)
Decrease in cash (691) (3,980)
Cash, beginning of year 1,604 5,584
Dissolution of the Partnership (Note 5) (92) -
Cash, end of year $821 $1,604
Supplementary disclosure of cash flow information:
Cash paid (received) during the period for:
Interest $29,044 $16,053
Tax $(196) $(516)
Refer to Notes 4, 11 and 13 for significant non-cash amounts not included in the cash flow statement.
See accompanying notes.

34
NOTES TO THE CONSOLIDATED FINANCIAL STATEMENTSYears ended December 31, 2010 and 2009(Tabular amounts in thousands of dollars, except per share amounts)(unaudited)
1) Nature of OperationsNAL Energy Corporation (“NAL” or the “Corporation”) is engaged in the exploration for, and the development and production of natural gas, natural gas liquids and crude oil in Western Canada. The Corporation resulted from a reorganization effective December 31, 2010 as part of a Plan of Arrangement involving, among others, NAL Oil & Gas Trust (the “Trust”), the Corporation, and the security holders of the Trust (“Reorganization”).
Pursuant to the Reorganization, the Trust was restructured from an open-ended unincorporated trust to NAL Energy Corporation, a publicly traded exploration and development corporation. Unitholders of the Trust received one common share of the Corporation for every trust unit that the Trust held. The Corporation and its subsidiaries now carry on the business formerly carried on by the Trust and its subsidiaries. The outstanding convertible debentures of the Trust were assumed by NAL and are now convertible into common shares of the Corporation, rather than trust units of the Trust, with the same terms and conditions as those previously agreed to by the Trust.
Pursuant to the Reorganization, share capital was reduced by the amount of the deficit of the Trust on December 31, 2010.
The Reorganization to a corporation has been accounted for on a continuity of interest basis and accordingly, the consolidated financial statements for 2010 and 2009 reflect the financial position, results of operations and cash flows as if the Corporation had carried on the business formerly carried on by the Trust.
References to NAL or the Corporation in these financial statements for periods prior to December 31, 2010 are references to the Trust and for periods after December 30, 2010 are references to NAL Energy Corporation. Additionally, NAL or the Corporation refers to shares, shareholders, and dividends which are comparable to units, unitholders and distributions previously under the Trust.
The Corporation, as with the Trust, continues to be managed by NAL Resources Management Limited (the “Manager”). The Manager is a wholly-owned subsidiary of Manulife Financial Corporation (“MFC”) and manages, on their behalf, NAL Resources Limited (“NAL Resources”), another wholly-owned subsidiary of MFC. NAL Resources and the Corporation maintain ownership interests in many of the same oil and natural gas properties. NAL Resources operates these properties on behalf of the Corporation and MFC. As a result, a significant portion of the net operating revenues and capital expenditures represent joint operations amounts from NAL Resources. These transactions are in the normal course of joint operations and are based on the original exchange amounts established through transactions with third parties.
2) Summary of Accounting Policies
Basis of PresentationThe Corporation’s consolidated financial statements are stated in Canadian dollars and have been prepared by management in accordance with Generally Accepted Accounting Principles (“GAAP”) in Canada and they include the accounts of the Corporation and its subsidiary entities. All inter-entity transactions and balances have been eliminated. Effective January 1, 2011, the Corporation will be required to prepare consolidated financial statements in accordance with International Financial Reporting Standards (“IFRS”).
The preparation of financial statements in conformity with GAAP requires management to make estimates and assumptions that affect the reported amounts of assets and liabilities, the disclosure of contingent assets and liabilities at the date of the financial statements, and the reported amounts of revenues and expenses during the period. Actual results could differ from those estimated. In particular, the amounts recorded for depletion and depreciation of property, plant and equipment and for the accretion of asset retirement obligations are based on estimates of reserves and future costs. The amounts recorded for share-based incentive compensation are based on quotes for the price of common shares and performance factors. The fair value estimates for commodity derivatives are based on expected future oil and natural gas prices and expected volatility in these prices while the fair value of interest rate derivatives are based on expected future interest rates and the fair value of foreign exchange rate derivatives are based on expected future exchange rates. The amount recorded for goodwill is based on estimates of the fair value of identifiable assets and liabilities at the date of acquisition, and is subject to impairment testing which is based on estimates of reserves, future commodity prices, future costs, production profiles, discount rates and other relevant assumptions. The ceiling test calculation is based on estimates of reserves, production rates, oil and natural gas prices, future costs and other relevant assumptions. Future income taxes are based on estimates as to the timing of the reversal of temporary differences, and tax rates currently substantively enacted. By their nature, these estimates are subject to measurement uncertainty and may impact the consolidated financial statements of future periods.
Property, Plant and EquipmentThe Corporation follows the full cost method of accounting for petroleum and natural gas properties, whereby all costs of acquiring petroleum and natural gas properties and related development costs are capitalized and accumulated in one cost centre. Such costs include land acquisition, geological and geophysical expenditures, costs of drilling both productive and non-productive wells, related plant and production equipment costs and related overhead charges.

35
Proceeds from the sale of petroleum and natural gas properties are applied against capitalized costs, with no gain or loss recognized, unless such sale would alter the depletion rate by 20 percent or more.
Depletion of petroleum and natural gas properties and depreciation of equipment is calculated using the unit of production method based on total proved reserves before royalties, as determined by independent petroleum engineers. Natural gas reserves are converted to barrels of oil equivalent based on relative energy content (6:1). The depletion base includes capitalized costs, plus future costs to be incurred in developing proved reserves and excludes the unimpaired cost of undeveloped land and other unproved costs. Costs associated with undeveloped land and other unproved costs are not subject to depletion and are assessed periodically to assess whether impairment has occurred. When proved reserves are assigned or the value of the unproved property is considered to be impaired, the cost of the undeveloped land or the amount of impairment is added to the costs subject to depletion.
Petroleum and natural gas properties are evaluated in each reporting period to determine that the carrying amount in a cost centre is recoverable and does not exceed the fair value of the properties in the cost centre.
The carrying amount of petroleum and natural gas properties is assessed to be recoverable when the sum of the undiscounted cash flows expected from the production of proved reserves plus the lower of cost and market of undeveloped land, exceeds the carrying amount. When the carrying amount is not assessed to be recoverable, an impairment loss is recognized to the extent that the carrying amount of the cost centre exceeds the sum of the discounted cash flows expected from the production of proved and probable reserves, plus the lower of cost and market of undeveloped land. The cash flows are estimated using expected future commodity prices and costs and discounted using a risk-free rate.
Asset Retirement ObligationsThe Corporation recognizes the fair value of an asset retirement obligation in the period in which it is incurred, on a discounted basis, with a corresponding increase to the carrying amount of property, plant and equipment. The asset recorded is depleted on a unit of production basis over the life of the reserves. The liability amount is increased each reporting period due to the passage of time and the amount of accretion is charged to income in the period. Revisions to the estimated timing of cash flows or to the original estimated undiscounted cost could also result in an increase or decrease to the obligation. Actual costs incurred upon settlement of the retirement obligation are charged against the obligation to the extent of the liability recorded.
Income TaxesThe Corporation follows the asset and liability method of accounting for income taxes. Under this method, income tax liabilities and assets are recognized for the estimated tax consequences attributable to differences between the amounts reported in the Corporation’s and the Corporation’s subsidiaries financial statements and their respective tax bases, using substantively enacted income tax rates. The effect of the change in income tax rates on future income tax liabilities and assets is recognized in income in the period that the change occurs. A valuation allowance is recorded against any future income tax assets if it is more likely than not that the asset will not be realized. Prior to the Reorganization in December 2010, the Trust was a taxable entity under the Canadian Income Tax Act and was taxable only on income that was not distributed or distributable to unitholders.
Financial InstrumentsA financial instrument is any contract that gives rise to a financial asset to one entity and a financial liability or equity instrument to another entity. Upon initial recognition, financial instruments, including derivatives, are recognized on the balance sheet at fair value. Subsequent measurement is then dependent on the financial instruments being classified into one of five categories: held for trading, held to maturity, loans and receivables, available for sale or other liabilities. Cash and cash equivalents have been designated as held for trading which are measured at fair value. Accounts receivable are classified as loans and receivables which are measured at amortized cost. Accounts payable and accrued liabilities, dividends payable, notes payable and bank debt are classified as other liabilities which are measured at amortized cost, which is determined using the effective interest method. The convertible debentures are classified as debt on the balance sheet with a portion of the proceeds allocated to equity. The debt component has been measured at amortized cost.
All derivative contracts are classified as held for trading and are recorded on the balance sheet at fair value, with changes in the fair value recognized in net income, unless specific hedge criteria are met. The Corporation has entered into certain derivative contracts in order to reduce its exposure to market risks from fluctuations in commodity prices, interest rates and foreign exchange. These instruments are not used for trading or speculative purposes. The Corporation has not designated its derivative contracts as effective accounting hedges, even though the Corporation considers all derivative contracts to be effective economic hedges. Therefore, changes in the fair value of the derivative contracts are recognized in net income for the period. Proceeds and costs realized from holding the derivative contracts are recognized in net income at the time each transaction under a contract is settled. The fair value of derivative contracts is based on an approximation of the amounts that would be received or paid to settle these instruments at the end of the period, with reference to forward commodity prices, foreign exchange rates and interest rates.
The Corporation will assess at each reporting period whether a financial asset is impaired. An impairment loss, if any, is included in net income.
Transaction costs are frequently attributed to the issue of a financial asset or liability. The Corporation has selected a policy of netting all transaction costs with the related financial assets and liabilities, and recording its bank debt net of deferred interest payments. In accordance with this policy convertible debentures are presented net of issue costs and bank debt is presented net of deferred interest payments, with interest recognized in net income on an effective interest basis.

36
The Corporation applies trade date accounting for the recognition of a purchase or sale of short term investments and derivative contracts.
The Corporation measures and recognizes embedded derivatives separately from host contracts when the economic characteristics and risks of the embedded derivative are not closely related to those of the host contract, when it meets the definition of a derivative, and when the contract is not measured at fair value. Embedded derivatives are recorded at fair value.
Joint OperationsSubstantially all development and production activities are conducted jointly with others and, accordingly, these financial statements reflect only the Corporation’s proportionate interests in such activities.
Revenue RecognitionRevenues from the sale of petroleum and natural gas are recorded when title passes to the purchaser and if collection is reasonably assured.
Share-Based Incentive CompensationThe Manager has established a share-based incentive compensation plan (the “Plan”) for all employees. Under the Plan, employees receive cash compensation based upon the value and overall return of a specified number of awarded notional common shares on a fixed vesting date. The notional common shares are in the form of Restricted Share Units (“RSUs”) and Performance Share Units (“PSUs”). Dividends paid on the Corporation’s outstanding common shares during the vesting period are assumed to be reinvested in the awarded notional common shares on the date of distribution. Compensation expense is determined using the liability method and incorporates the common share price and the number of RSUs and PSUs outstanding at each period end. In addition, for the PSUs there is a performance multiplier which is based on the Corporation’s performance relative to its peers and may range from zero to two times the value of the notional common shares held at vesting.
Compensation expense is recognized over the vesting period and is determined based on the market price of the notional common shares at each period end and an expected performance multiplier with a corresponding increase or decrease in liabilities. Classification between current liabilities and long-term liabilities is dependent on the expected payout date.
The Corporation charges the accrued compensation amounts relating to head office employees to general and administrative expenses, the amounts relating to field staff to operating costs, and the amounts relating to exploitation and development personnel to property, plant and equipment.
The Corporation has not incorporated an estimated forfeiture rate for common shares that will not vest and accounts for actual forfeitures as they occur.
Basic and Diluted per ShareBasic per share amounts, and prior to the Reorganization, per unit amounts, are calculated by dividing net income by the weighted average number of common shares/trust units outstanding. Diluted net income per share/unit is calculated using the “if converted method” to determine the dilutive effects of the convertible debentures. Dilutive shares/trust units are arrived at by taking the weighted average shares/trust units and the shares/trust units issuable on conversion of the convertible debentures, giving effect to the potential dilution that would occur had conversion occurred at the beginning of the period or on issuance of the convertible instrument, whichever is later. Interest and accretion on convertible debentures is added back to net income in calculating diluted net income per share/unit.
GoodwillGoodwill is recorded on a business acquisition when the total purchase price exceeds the fair value of the net identifiable assets and liabilities of the acquired business. The goodwill balance is not amortized but, instead, is assessed for impairment annually at year-end, or more frequently if events or changes in circumstances indicate the asset might be impaired. To assess impairment, the fair value of the reporting entity, deemed to be the consolidated Corporation, is compared to the carrying value of the reporting entity. If the fair value of the Corporation is less than the carrying value, then a second test is performed to determine the amount of impairment. Any impairment is measured by allocating the fair value of the consolidated Corporation to the identifiable assets and liabilities as if the Corporation had been acquired in a business combination for a purchase price equal to its fair value. The excess of the fair value of the consolidated Corporation over the amounts assigned to the identifiable assets and liabilities is the implied value of the goodwill. Any excess of the book value of goodwill over the implied value of goodwill is the impairment amount. Any impairment will be charged to net income in the period in which it occurs.
3) Recent Accounting Pronouncements and Changes
International Financial Reporting Standards (IFRS)On February 13, 2008, the Accounting Standards Board (AcSB) confirmed that the changeover to IFRS from Canadian GAAP will be required for publicly accountable enterprises for interim and annual financial statements, effective for fiscal years beginning on or after January 1, 2011, including comparatives for 2010. The objective is to improve financial reporting by having a single set of accounting standards that are comparable with other entities on an international basis. The transition from current Canadian GAAP to IFRS is a significant undertaking that will materially affect the Corporation’s reported financial position and results of operations. The Corporation

37
continues to monitor standards developments issued by the International Accounting Standards Board and the AcSB, as well as regulatory developments issued by the Canadian Securities Administrators which may affect the timing, nature or disclosure of its adoption of IFRS.
4) Corporate Acquisitionsi) Breaker Energy Ltd.Effective December 11, 2009, the Corporation acquired all of the issued and outstanding common shares of Breaker Energy Ltd. (“Breaker”), which has interests in petroleum and natural gas properties and undeveloped land in Alberta and northeast British Columbia.
The Corporation issued 24.8 million shares at a price of $12.45 per share for total consideration, before acquisition costs, of $308.5 million. The share price was based on the weighted average market price of shares at the date of announcement, being October 13, 2009.
The results of Breaker have been included in the accounts of the Corporation from December 11, 2009. The transaction was accounted for using the purchase method of accounting. The fair values assigned to the net assets, and the consideration paid by the Corporation, are as follows:
Net Assets acquired:
Working capital deficiency $(13,270)
Property, plant and equipment 485,844
Future income taxes (37,118)
Excess office lease obligation(1) (4,396)
Asset retirement obligations (25,703)
Bank debt (94,481)
$310,876
Consideration:
Issuance of common shares $308,475
Acquisition costs 2,401
$310,876
1) Represents the present value of an estimated loss on an office lease obligation.
ii) Spearpoint Energy Corp.Effective August 10, 2009, the Corporation acquired all of the issued and outstanding common shares of Spearpoint Energy Corp. (“Spearpoint”) for cash of $10.6 million, prior to acquisition costs.
The results of Spearpoint have been included in the accounts of the Corporation from August 10, 2009. The transaction was accounted for using the purchase method of accounting. The fair values assigned to the net assets, and the consideration paid by the Corporation, are as follows:
Net Assets acquired:
Cash $1,201
Working capital deficiency (1,390)
Property, plant and equipment 16,999
Future income taxes 525
Asset retirement obligations (685)
Note payable (5,700)
$10,950
Consideration:
Cash $10,590
Acquisition costs 360
$10,950

38
Concurrent with the acquisition, the Corporation entered into a purchase and sale agreement (the “Spearpoint PSA”) with MFC, pursuant to which MFC acquired a 40 percent working interest in all of the Spearpoint petroleum and natural gas properties and the associated farm-in agreement for a base price of $6.5 million payable in cash.
As a result, after taking into effect the MFC disposition, the Corporation acquired property, plant and equipment of $10.3 million and a future income tax asset of $0.5 million and assumed a note payable of $5.7 million, asset retirement obligations of $0.4 million and a working capital deficiency of $0.2 million, for consideration of $4.5 million.
iii) Alberta Clipper Energy Inc.Effective June 1, 2009, the Corporation acquired all of the issued and outstanding common shares of Alberta Clipper Energy Inc. (“Clipper”), which has interests in petroleum and natural gas properties and undeveloped land in Alberta and northeast British Columbia.
As consideration the Corporation issued 5.7 million shares at a price of $6.45 per share for total consideration, before acquisition costs, of $36.6 million. The share price was based on the weighted average market price of shares at the date of announcement, being March 23, 2009. This purchase price included the assumption of $78.9 million in bank debt.
The results of Clipper have been included in the accounts of the Corporation from June 1, 2009. The transaction was accounted for using the purchase method of accounting. The fair values assigned to the net assets, and the consideration paid by the Corporation, are as follows:
Net Assets acquired:
Working capital deficiency(1) $(3,998)
Derivative contract 408
Property, plant and equipment 118,125
Future income taxes 17,858
Excess office lease obligation(2) (1,446)
Asset retirement obligations (14,592)
Bank debt (78,852)
$37,503
Consideration:
Issuance of shares $36,600
Acquisition costs 903
$37,503
(1) Includes cash of $2,000.(2) Represents the present value of an estimated loss on an office lease obligation.
Concurrent with the acquisition, the Corporation entered into a purchase and sale agreement (“PSA”) with MFC, pursuant to which MFC acquired a 50% working interest in the Clipper petroleum and natural gas properties for a cash base price of $52.5 million. The cash received from MFC was used to partially repay the assumed bank debt.
As a result, after taking into effect the MFC disposition, the Corporation acquired property, plant and equipment of $56.5 million, a derivative contract of $0.4 million and a future tax asset of $17.9 million and assumed asset retirement obligations of $7.3 million, bank debt of $26.4 million, a working capital deficiency of $2.1 million and a lease obligation of $1.5 million, for consideration of $37.5 million, including estimated acquisition costs.
5) Related Party TransactionsThe Corporation is managed by the Manager. The Manager is a wholly-owned subsidiary of MFC and also manages on their behalf NAL Resources, another wholly-owned subsidiary of MFC.
The Manager continues to provide certain services to the Corporation pursuant to an Administrative Services and Cost Sharing Agreement. This agreement requires the Corporation to reimburse the Manager, at cost, for general and administrative (“G&A”) expenses incurred by the Manager on behalf of the Corporation. The Corporation paid $13.8 million (2009 - $12.6 million) for the reimbursement of G&A expenses in 2010. The Corporation also pays the Manager its share of share-based compensation expense when cash compensation is paid to employees under the terms of the Manager’s incentive compensation plans, of which, $7.1 million has been paid in 2010 relating to notional shares that vested on November 30, 2009 (2009 - $2.3 million).
In conjunction with the Reorganization, a partnership that was jointly owned by the Corporation and MFC was dissolved on December 31, 2010. This Partnership held the assets acquired from the acquisitions of Tiberius and Spear in February 2008.

39
Prior to December 31, 2010 the Corporation, by virtue of being the owner of the general partner of the Partnership, was required to consolidate the results of the Partnership into its financial statements on the basis that the Corporation had control over the Partnership. The 2009 financial statements of the Corporation therefore reflect all the assets, liabilities, revenues and expenses of the Partnership, of which 50 percent are effectively removed through the non-controlling interest. As a result of the Partnership dissolution on December 31, 2010, the Corporation only reflects its proportionate share of the Partnership’s assets, liabilities, revenues and expenses in the December 31, 2010 financial statements.
As a part of the original structuring of the Partnership in 2008, both the Corporation and MFC entered into net profit interest royalty agreements with the Partnership. These agreements entitled each royalty holder to a 49.5 percent interest in the cash flow from the Partnership’s reserves. In exchange for this interest, the royalty holders each paid $49.6 million to the Partnership by way of promissory notes in 2008. Although the MFC note resided in the Partnership, it was consolidated.
During the first quarter of 2009, MFC repaid the note receivable to the Partnership for $49.6 million. The note receivable bore interest at prime plus three percent. The Partnership then paid an equal distribution of $49.6 million to MFC. This resulted in a $49.6 million reduction to the non-controlling interest (Note 12).
During 2010 the Partnership did not pay any distributions to its partners (MFC’s 2009 share being - $5.0 million) (Note 12).
In addition, in the Partnership there was a note payable to MFC, which was settled on dissolution. At December 31, 2009, the note payable of $8.9 million was included on consolidation of the Partnership, but was effectively eliminated through the non-controlling interest. The note was due on demand, unsecured and bore interest at prime plus three percent.
The following amounts are due to and from related parties as at December 31, 2010 and 2009 and have been included in prepaids and other receivables, note receivable, accounts payable and accrued liabilities and note payable on the balance sheet:
2010 2009
Due from (to) NAL Resources Limited(1) $8,058 $1,731
Due to NAL Resources Management Limited (8,719) (8,753)
Due (to) from Manulife Financial Corporation(2) (265) (9,472)
$(926) $(16,494)
(1) Includes base price adjustment due (to) from MFC, relating to the Clipper and Spearpoint asset dispositions to MFC, of nil (2009 - $2.1 million).(2) Included on consolidation, eliminated through non-controlling interest. Represents note payable of $nil (2009 - $8.9 million), plus amounts due from (to) MFC of ($0.3)
million (2009 – ($0.6) million), presented in accounts payable/ accounts receivable, relating to the net interest and NPI amounts due.
6) Property, Plant and Equipment
2010 2009
Petroleum and natural gas properties, at cost $2,826,660 $2,579,268
Less: Accumulated depletion and depreciation (1,323,114) (1,075,316)
$1,503,546 $1,503,952
The calculation of 2010 depletion and depreciation included future development costs for proved reserves of $189.5 million (2009 - $209.2 million) and excluded costs associated with undeveloped land and other unproved costs of $96.8 million (2009 - $128.5 million).
During 2010, the Corporation acquired petroleum and natural gas properties and equipment totaling $68.6 million. In addition, an amount of $8.2 million has been included in property and equipment to recognize the asset retirement obligation on these acquisitions.
During 2010, the Corporation capitalized $7.9 million (2009 - $5.6 million) of G&A costs and $1.4 million (2009 - $3.7 million) of share-based incentive compensation that were directly related to exploitation and development programs.
The Corporation performed a ceiling test calculation at December 31, 2010 to assess the recoverable value of property, plant and equipment. The oil and gas future prices are based on the January 1, 2011 commodity price forecast of the Corporation’s independent reserve evaluators, adjusted for commodity differentials specific to the Corporation. The following table summarizes the benchmark prices used in the ceiling test calculation. Based on these assumptions, the undiscounted value of net reserves from the Corporation’s proved reserves exceeded the carrying value of property, plant and equipment as at December 31, 2010.

40
YearWTI Oil
(US$/bbl)Exchange Rate
US$/Cdn$WTI Oil
(Cdn$/bbl)AECO Gas
(Cdn$/MMBtu)
2011 85.00 0.975 87.18 4.25
2012 87.70 0.975 89.95 4.90
2013 90.50 0.975 92.82 5.40
2014 93.40 0.975 95.79 5.90
2015 96.30 0.975 98.77 6.35
Remainder(1) 2% 2% 2%
(1) Percentage change represents the change in each year after 2015 to the end of the reserve life.
7) Bank Debt
2010 2009
Production loan facility $266,965 $230,713
Working capital facility - -
Total debt outstanding $266,965 $230,713
The Corporation maintains a fully secured, extendible, revolving term credit facility with a syndicate of Canadian chartered banks and one U.S. based lender. As at December 31, 2010, the facility consisted of a $535 million production facility and a $15 million working capital facility. The total amount of the facility is determined by reference to a borrowing base. The borrowing base is calculated by the bank syndicate and is based on the net present value of the Corporation’s oil and gas reserves and other assets. Given that the borrowing base is dependent on the Corporation’s reserves and future commodity prices, lending limits are subject to change on renewal.
The credit facility is fully secured by first priority security interests in all existing and future acquired properties and assets of the Corporation and its subsidiary and affiliated entities. The facility will revolve until April 30, 2011 at which time it may be extended for a further 364-day revolving period upon agreement between the Corporation and the bank syndicate. If the credit facility is not extended in April 2011, the amounts outstanding at that time will be converted to a two-year term loan. The term loan will be payable in five equal quarterly installments commencing May 1, 2012.
Amounts are advanced under the credit facility in Canadian dollars by way of prime interest rate based loans and by issues of bankers’ acceptances and in U.S. dollars by way of U.S. based interest rate and Libor based loans. The interest charged on advances is at the prevailing interest rate for bankers’ acceptances, Libor loans, lenders’ prime or U.S. base rates plus an applicable margin or stamping fee. The applicable margin or stamping fee, if any, varies based on the consolidated debt-to-cash flow ratio of the Corporation. As at December 31, 2010 and 2009 all amounts outstanding were in Canadian dollars.
On December 31, 2010 the effective interest rate on amounts outstanding under the credit facility was 5.16 percent (2009 – 3.27 percent). The Corporation’s interest charge includes this interest rate component, plus a standby fee, a stamping fee and the fee for renewal.
8) Convertible DebenturesOn August 28, 2007, the Corporation issued $100 million principal amount of 6.75 percent convertible extendible unsecured subordinated debentures, at a price of $1,000 per debenture. Interest on these debentures is paid semi-annually in arrears, on February 28 and August 31, and the debentures are convertible at the option of the holder at any time into common shares at a conversion price of $14.00 per share. The debentures mature on August 31, 2012 at which time they are due and payable. The debentures are redeemable by the Corporation at a price of $1,050 per debenture on or after September 1, 2010 and on or before August 31, 2011, and at a price of $1,025 per debenture on or after September 1, 2011 and on or before August 31, 2012. On redemption or maturity the Corporation may opt to satisfy its obligation to repay the principal by issuing common shares.
On December 3, 2009, the Corporation issued $115 million principal amount of 6.25 percent convertible unsecured subordinated debentures, at a price of $1,000 per debenture. Interest on these debentures is paid semi-annually in arrears, on June 30 and December 31, and the debentures are convertible at the option of the holder at any time into common shares at a conversion price of $16.50 per share. The debentures mature on December 31, 2014. The debentures are redeemable by the Corporation at a price of $1,050 per debenture on or after January 1, 2013 and on or before December 31, 2013, and at a price of $1,025 per debenture on or after January 1, 2014 and on or before December 31, 2014. On redemption or maturity the Corporation may opt to satisfy its obligation to repay the principal by issuing common shares.
The debentures are classified as debt on the balance sheet with a portion of the proceeds allocated to equity, representing the value of the conversion feature. As the debentures are converted to common shares, a portion of the debt and equity amounts will be transferred to share capital. The debt component of the convertible debentures is carried net of issue costs. The debt balance, net of issue costs,

41
accretes over time to the principal amount owing on maturity. The accretion of the debt discount and the interest paid to debenture holders are expensed each period as part of the caption “interest and accretion on convertible debentures” in the consolidated statement of income.
The following table reconciles the principal amount, debt component and equity component of the convertible debentures.
2010 2009
6.25% 6.75% Total 6.25% 6.75% Total
Principal, beginning of year $115,000 $79,744 $194,744 $- $79,744 $79,744
Issued during year - - - 115,000 - $115,000
Principal, end of year $115,000 $79,744 $194,744 $115,000 $79,744 $194,744
Debt component, beginning of year $102,450 $75,527 $177,977 $- $74,004 $74,004
Issued during year - - - 106,965 - 106,965
Issue costs (345) - (345) (4,714) - (4,714)
Accretion 2,485 1,555 4,040 199 1,523 1,722
Debt component, end of year $104,590 $77,082 $181,672 $102,450 $75,527 $177,977
Equity component, beginning of year $8,036 $4,592 $12,628 $- $4,592 $4,592
Issued during year - - - 8,036 - 8,036
Equity component, end of year $8,036 $4,592 $12,628 $8,036 $4,592 $12,628
9) Other Liabilities
2010 2009
Share-based incentive compensation (Note 10) $1,054 $3,935
Excess office lease obligations (Note 4)(1) 2,003 3,708
$3,057 $7,643
(1) Represents the present value of the long-term portion of office lease obligations, in excess of sub-leases, assumed on the acquisitions of Clipper and Breaker. MFC reimbursed the Corporation for 50 percent of the Clipper obligation of $0.5 million, under the base price adjustment clause (Note 4).
10) Share-Based Incentive Compensation PlanThe Manager has a long term incentive plan under which employees receive cash compensation based upon the value and overall return of a specified number of awarded notional shares on a fixed vesting date. The notional share grants are in the form of Restricted Share Units (“RSUs”) and Performance Share Units (“PSUs”). RSUs vest one third on November 30 in each of the three years after the date of grant. PSUs vest on November 30, three years after the date of grant.
Pursuant to the Reorganization, all previously issued Restricted Trust Units and Performance Trust Units were amended such that instead of them representing one notional unit they represent one notional share on the same terms and continue to be governed by the same terms under the Plan.
The Corporation recorded a total compensation expense of $4.5 million in 2010, of which $3.2 million was recorded as an expense and $1.4 million as property, plant and equipment ($8.8 million was expensed and $3.7 million recorded as property, plant and equipment for the year ended December 31, 2009). The compensation expense was based on the December 31, 2010 share price of $12.95 (2009 - $13.74), accrued distributions, performance factors and the number of shares vesting on maturity.

42
The following table reconciles the change in total accrued share-based incentive compensation relating to the plan:
2010 2009
Balance, beginning of year $16,411 $6,274
Increase in liability 4,510 12,461
Cash payout, relating to units vested (7,095) (2,324)
Balance, end of year $13,826 $16,411
Current portion of liability(1) $12,772 $12,476
Long-term liability(2) $1,054 $3,935
(1) Included in accounts payable and accrued liabilities.(2) Included in other liabilities.
The following table sets forth a reconciliation of the Corporation’s incentive plan activity for the year ended December 31, 2010 and 2009.
2010
Number of Restricted Shares
Number of Performance
Shares Total
Balance, beginning of year 147,057 521,669 668,726
Allocation rate change(1) 12,147 43,092 55,239
Issued 93,905 205,379 299,284
Exercised (114,131) (185,507) (299,638)
Forfeited (16,496) (41,622) (58,118)
Balance, end of year 122,482 543,011 665,493
Exercisable, end of year - - -
(1) Allocation rate change reflects change in proportion of expenses charged to the Corporation from the Manager based on relative production of the Corporation and MFC.
2009
Number of Restricted Shares
Number of Performance
Shares Total
Balance, beginning of year 87,724 344,791 432,515
Allocation rate change(1) (270) (1,063) (1,333)
Issued 163,824 338,707 502,531
Exercised (94,773) (145,583) (240,356)
Forfeited (9,448) (15,183) (24,631)
Balance, end of year 147,057 521,669 668,726
Exercisable, end of year - - -
(1) Allocation rate change reflects change in proportion of expenses charged to the Corporation from the Manager based on relative production of the Corporation and MFC.
11) Asset Retirement ObligationsThe total future asset retirement obligation was estimated based on the Corporation’s net ownership interests in oil and natural gas assets including well sites, gathering systems and processing facilities, estimated costs to remediate, reclaim and abandon the wells and facilities and the estimated timing of the costs to be incurred in future periods. The Corporation has estimated the net present value of its asset retirement obligations to be $144.7 million as at December 31, 2010 (2009 - $127.9 million) based on a total undiscounted and inflated amount of cash flows required to settle its asset retirement obligations of $418.6 million (2009 - $374.8 million). These costs are expected to be made over the next 43 years with the majority of the costs incurred between 2012 and 2034. The Corporation’s estimated credit-adjusted risk-free rate of eight to nine percent (2009 – eight to nine percent) and an inflation rate of two percent (2009 – two percent) were used to calculate the present value of the asset retirement obligations.

43
The following table reconciles the Corporation’s asset retirement obligations.
2010 2009
Balance, beginning of year $127,872 $90,844
Accretion expense 12,112 7,856
Revisions to estimates (569) 558
Liabilities incurred 4,593 1,522
Liabilities acquired, net (Notes 4 & 6) 8,218 32,311
Liabilities settled (6,617) (5,219)
Dissolution of the Partnership (Note 5) (871) -
Balance, end of year $144,738 $127,872
12) Non-Controlling InterestThe Corporation had recorded a non-controlling interest in respect of the 50 percent ownership interest held by MFC in the Partnership holding the Tiberius and Spear assets (Note 5) as at December 31, 2009. This partnership was dissolved on December 31, 2010 eliminating the non-controlling interest. The non-controlling interest on the balance sheet represented 50 percent of the net assets of the Partnership as follows:
2010 2009
Non-controlling interest, beginning of year $2,868 $56,380
Net income attributable to non-controlling interest - 1,040
Distributions to MFC(1) - (54,552)
Dissolution of the Partnership (Note 5) (2,868) -
Non-controlling interest, end of year $- $2,868
(1) Includes $49.6 million distribution paid following settlement of note receivable (Note 5).
The non-controlling interest in the statement of income is comprised of:
2010 2009
Net profits interest expense (income) $- $1,919
Share of net income attributable to MFC - 1,040
$- $2,959
13) Shareholders’ Equity The Corporation is authorized to issue an unlimited number of common shares and a number of preferred shares, issuable in series, limited in number to an amount equal to not more than one-half of the common shares issued and outstanding at the time of issuance of such preferred shares.
Common Shares of NAL Energy Corporation:
2010 2009
Shares Amount Shares Amount
Balance, beginning of year - $- - $-
Issued pursuant to Reorganization (Note1) 147,248 879,393 - -
Balance, end of year 147,248 $879,393 - $-
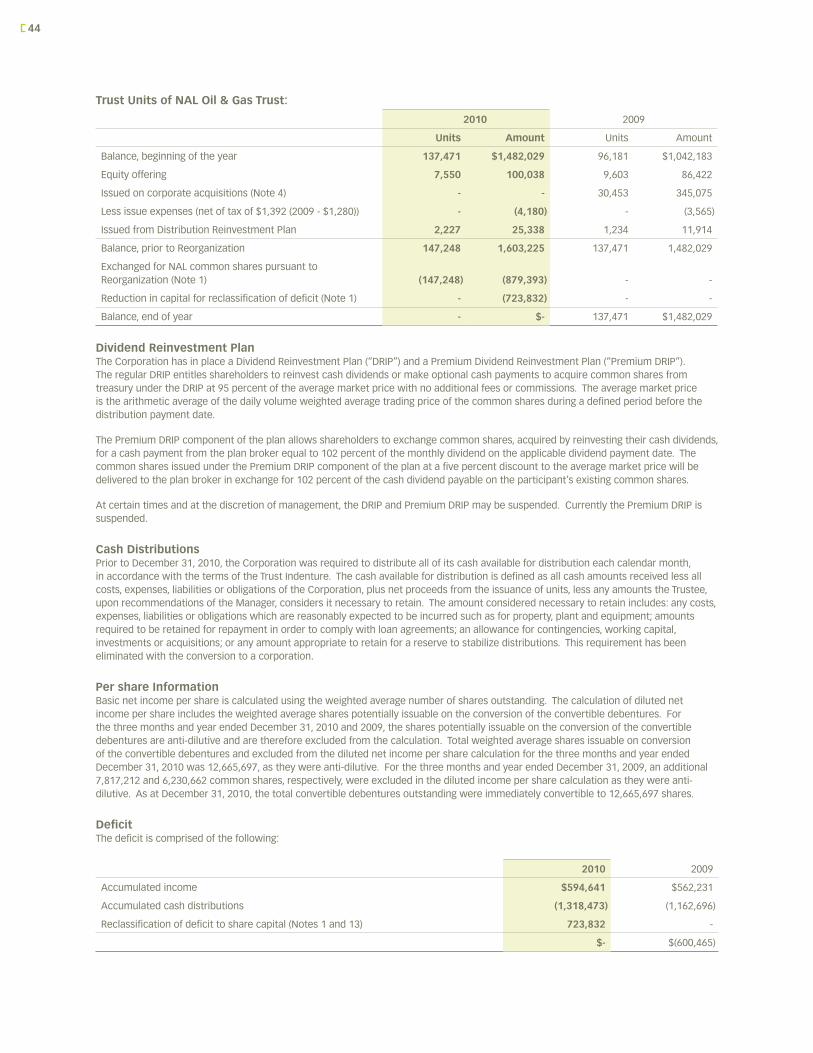
44
Trust Units of NAL Oil & Gas Trust:
2010 2009
Units Amount Units Amount
Balance, beginning of the year 137,471 $1,482,029 96,181 $1,042,183
Equity offering 7,550 100,038 9,603 86,422
Issued on corporate acquisitions (Note 4) - - 30,453 345,075
Less issue expenses (net of tax of $1,392 (2009 - $1,280)) - (4,180) - (3,565)
Issued from Distribution Reinvestment Plan 2,227 25,338 1,234 11,914
Balance, prior to Reorganization 147,248 1,603,225 137,471 1,482,029
Exchanged for NAL common shares pursuant to Reorganization (Note 1) (147,248) (879,393) - -
Reduction in capital for reclassification of deficit (Note 1) - (723,832) - -
Balance, end of year - $- 137,471 $1,482,029
Dividend Reinvestment PlanThe Corporation has in place a Dividend Reinvestment Plan (“DRIP”) and a Premium Dividend Reinvestment Plan (“Premium DRIP”). The regular DRIP entitles shareholders to reinvest cash dividends or make optional cash payments to acquire common shares from treasury under the DRIP at 95 percent of the average market price with no additional fees or commissions. The average market price is the arithmetic average of the daily volume weighted average trading price of the common shares during a defined period before the distribution payment date.
The Premium DRIP component of the plan allows shareholders to exchange common shares, acquired by reinvesting their cash dividends, for a cash payment from the plan broker equal to 102 percent of the monthly dividend on the applicable dividend payment date. The common shares issued under the Premium DRIP component of the plan at a five percent discount to the average market price will be delivered to the plan broker in exchange for 102 percent of the cash dividend payable on the participant’s existing common shares.
At certain times and at the discretion of management, the DRIP and Premium DRIP may be suspended. Currently the Premium DRIP is suspended.
Cash DistributionsPrior to December 31, 2010, the Corporation was required to distribute all of its cash available for distribution each calendar month, in accordance with the terms of the Trust Indenture. The cash available for distribution is defined as all cash amounts received less all costs, expenses, liabilities or obligations of the Corporation, plus net proceeds from the issuance of units, less any amounts the Trustee, upon recommendations of the Manager, considers it necessary to retain. The amount considered necessary to retain includes: any costs, expenses, liabilities or obligations which are reasonably expected to be incurred such as for property, plant and equipment; amounts required to be retained for repayment in order to comply with loan agreements; an allowance for contingencies, working capital, investments or acquisitions; or any amount appropriate to retain for a reserve to stabilize distributions. This requirement has been eliminated with the conversion to a corporation.
Per share InformationBasic net income per share is calculated using the weighted average number of shares outstanding. The calculation of diluted net income per share includes the weighted average shares potentially issuable on the conversion of the convertible debentures. For the three months and year ended December 31, 2010 and 2009, the shares potentially issuable on the conversion of the convertible debentures are anti-dilutive and are therefore excluded from the calculation. Total weighted average shares issuable on conversion of the convertible debentures and excluded from the diluted net income per share calculation for the three months and year ended December 31, 2010 was 12,665,697, as they were anti-dilutive. For the three months and year ended December 31, 2009, an additional 7,817,212 and 6,230,662 common shares, respectively, were excluded in the diluted income per share calculation as they were anti-dilutive. As at December 31, 2010, the total convertible debentures outstanding were immediately convertible to 12,665,697 shares.
DeficitThe deficit is comprised of the following:
2010 2009
Accumulated income $594,641 $562,231
Accumulated cash distributions (1,318,473) (1,162,696)
Reclassification of deficit to share capital (Notes 1 and 13) 723,832 -
$- $(600,465)

45
The Corporation has historically paid cash distributions in excess of accumulated income as cash distributions are based on cash flow generated in the period whereas accumulated income is based on net income which includes non-cash items such as depletion, depreciation, accretion, future income taxes and unrealized gains and losses on derivative contracts.
14) Income TaxesThe provision for income taxes in the consolidated financial statements differs from the result that would have been obtained by applying the combined federal and provincial tax rate to the loss before taxes as follows:
2010 2009
Loss before taxes $(9,526) $(22,613)
Statutory income tax rate 28.0% 29.0%
Expected income tax reduction (2,667) (6,558)
Increase (decrease) resulting from:
Valuation allowance - (2)
Net income of the Trust (43,617) (34,844)
Rate variance 4,691 5,151
Other (343) 1,481
Current and future income tax reduction $(41,936) $(34,772)
The future income tax asset (liability) is comprised of:
2010 2009
Property, plant and equipment $(82,365) $(81,939)
Future tax liability resulting from different year ends (3,476) (7,807)
Non-capital tax loss carry forward 71,581 35,777
Asset retirement obligations 36,923 31,750
Derivative contracts 2,525 621
Other 5,805 8,031
$30,993 $(13,567)
Valuation allowance (10,011) (8,079)
Future income tax asset $20,982 $(21,646)
Current asset (liability) $3,830 $3,132
Long-term asset (liability) $17,152 $(24,778)
On December 31, 2010, the Corporation converted from a publicly traded mutual fund trust to a publicly traded corporation. As a result, the future income tax recognized at December 31, 2010 was calculated on the basis of being a corporation.
The Corporation has non-capital loss carry forwards of $276 million of which $1.5 million expire between 2011 and 2015, $29.3 million expire between 2016 and 2025, and $245.2 million expire after 2025.
15) Financial Risk Management
OverviewThe Corporation has exposure to the following risks from its use of financial instruments: credit risk, liquidity risk and market risk.
This note presents information about the Corporation’s exposure to each of the above risks, the Corporation’s objectives, policies and processes for measuring and managing risk, and the Corporation’s management of capital. Certain other quantitative disclosures are included throughout these financial statements.
The Board of Directors has the responsibility to understand the principal risks of the business and to achieve a proper balance between the risks incurred and the potential return to shareholders. The Board of Directors have oversight for ensuring systems are in place which effectively monitor and manage those risks with a view to the long term viability of the Corporation.
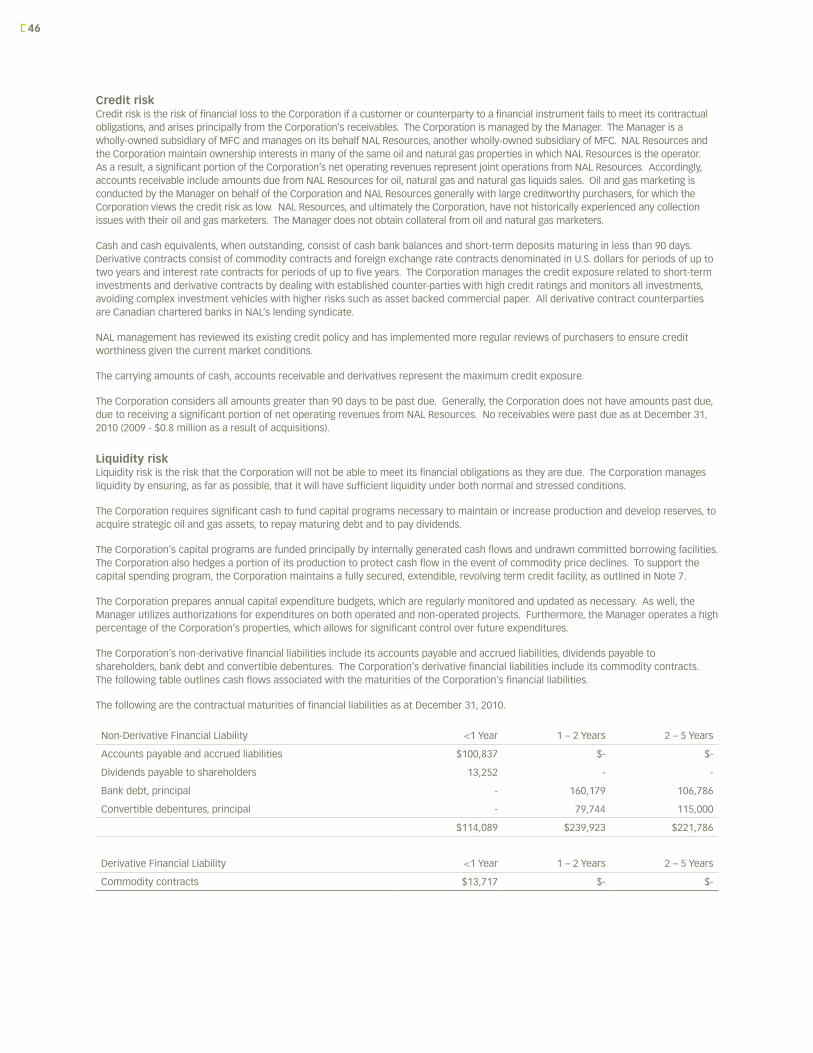
46
Credit riskCredit risk is the risk of financial loss to the Corporation if a customer or counterparty to a financial instrument fails to meet its contractual obligations, and arises principally from the Corporation’s receivables. The Corporation is managed by the Manager. The Manager is a wholly-owned subsidiary of MFC and manages on its behalf NAL Resources, another wholly-owned subsidiary of MFC. NAL Resources and the Corporation maintain ownership interests in many of the same oil and natural gas properties in which NAL Resources is the operator. As a result, a significant portion of the Corporation’s net operating revenues represent joint operations from NAL Resources. Accordingly, accounts receivable include amounts due from NAL Resources for oil, natural gas and natural gas liquids sales. Oil and gas marketing is conducted by the Manager on behalf of the Corporation and NAL Resources generally with large creditworthy purchasers, for which the Corporation views the credit risk as low. NAL Resources, and ultimately the Corporation, have not historically experienced any collection issues with their oil and gas marketers. The Manager does not obtain collateral from oil and natural gas marketers.
Cash and cash equivalents, when outstanding, consist of cash bank balances and short-term deposits maturing in less than 90 days. Derivative contracts consist of commodity contracts and foreign exchange rate contracts denominated in U.S. dollars for periods of up to two years and interest rate contracts for periods of up to five years. The Corporation manages the credit exposure related to short-term investments and derivative contracts by dealing with established counter-parties with high credit ratings and monitors all investments, avoiding complex investment vehicles with higher risks such as asset backed commercial paper. All derivative contract counterparties are Canadian chartered banks in NAL’s lending syndicate.
NAL management has reviewed its existing credit policy and has implemented more regular reviews of purchasers to ensure credit worthiness given the current market conditions.
The carrying amounts of cash, accounts receivable and derivatives represent the maximum credit exposure.
The Corporation considers all amounts greater than 90 days to be past due. Generally, the Corporation does not have amounts past due, due to receiving a significant portion of net operating revenues from NAL Resources. No receivables were past due as at December 31, 2010 (2009 - $0.8 million as a result of acquisitions).
Liquidity riskLiquidity risk is the risk that the Corporation will not be able to meet its financial obligations as they are due. The Corporation manages liquidity by ensuring, as far as possible, that it will have sufficient liquidity under both normal and stressed conditions.
The Corporation requires significant cash to fund capital programs necessary to maintain or increase production and develop reserves, to acquire strategic oil and gas assets, to repay maturing debt and to pay dividends.
The Corporation’s capital programs are funded principally by internally generated cash flows and undrawn committed borrowing facilities. The Corporation also hedges a portion of its production to protect cash flow in the event of commodity price declines. To support the capital spending program, the Corporation maintains a fully secured, extendible, revolving term credit facility, as outlined in Note 7.
The Corporation prepares annual capital expenditure budgets, which are regularly monitored and updated as necessary. As well, the Manager utilizes authorizations for expenditures on both operated and non-operated projects. Furthermore, the Manager operates a high percentage of the Corporation’s properties, which allows for significant control over future expenditures.
The Corporation’s non-derivative financial liabilities include its accounts payable and accrued liabilities, dividends payable to shareholders, bank debt and convertible debentures. The Corporation’s derivative financial liabilities include its commodity contracts. The following table outlines cash flows associated with the maturities of the Corporation’s financial liabilities.
The following are the contractual maturities of financial liabilities as at December 31, 2010.
Non-Derivative Financial Liability <1 Year 1 – 2 Years 2 – 5 Years
Accounts payable and accrued liabilities $100,837 $- $-
Dividends payable to shareholders 13,252 - -
Bank debt, principal - 160,179 106,786
Convertible debentures, principal - 79,744 115,000
$114,089 $239,923 $221,786
Derivative Financial Liability <1 Year 1 – 2 Years 2 – 5 Years
Commodity contracts $13,717 $- $-

47
Market riskMarket risk is the risk that changes in market prices, such as foreign exchange rates, commodity prices, and interest rates will affect the Corporation’s net income or the value of financial instruments.
Foreign currency exchange rate riskForeign currency exchange rate risk is the risk that the fair value or future cash flows will fluctuate as a result of changes in foreign exchange rates. Although substantially all of the Corporation’s oil and natural gas sales are denominated in Canadian dollars, the underlying market prices in Canada for oil and natural gas are impacted by changes in the exchange rate between the Canadian and U.S. dollar.
NAL’s management has authorization to fix the exchange rate on up to 50 percent of the Corporation’s U.S. dollar exposure for periods of up to 24 months.
NAL has the following Canadian dollar / U.S. dollar foreign exchange option contracts outstanding.
Fixed Rate (CAD/USD) Notional (US) per month Term Counterparty Floating Rate
1.05 $2.0 MM Jan 1, 2011 to Dec 31, 2011 BofC Monthly Average Noon Rate
1.0608 $5.0 MM Jan 1, 2011 to Dec 31, 2011 BofC Monthly Average Noon Rate
NAL has a monthly commitment to settle the above fixed rates against the Bank of Canada monthly average noon rate.
Option Payout Range (CAD/USD)
Notional (US) per month Term
Counterparty Floating Rate
Monthly Premium Received (CAD)
$0.95 - $1.12 $0.5 MM Jan 1, 2011 to Dec 31, 2011 BofC Monthly Average Noon Rate $25K
$0.945 - $1.045 $0.5 MM Jan 1, 2011 to Dec 31, 2011 BofC Monthly Average Noon Rate $18K
$0.95 - $1.025 $2.0 MM Mar 1, 2011 to Jun 30, 2012 BofC Monthly Average Noon Rate $40K
When the monthly average noon spot foreign exchange rate is outside the payout range, the monthly premium is forfeited. NAL is committed to selling the above listed USD at the upper payout range value for that month when the average noon spot foreign exchange rate exceeds the payout range.
Option Fixing Range (CAD/USD) Notional (US) per month Term Counterparty Floating Rate
$0.94 - $1.06 $0.5 MM Jan 1, 2011 to Dec 31, 2011 BofC Monthly Average Noon Rate
$0.95 - $1.07 $0.5 MM Jan 1, 2011 to Dec 31, 2011 BofC Monthly Average Noon Rate
$0.94 - $1.08 $0.5 MM Jan 1, 2011 to Dec 31, 2011 BofC Monthly Average Noon Rate
$0.95 - $1.04 $0.5 MM Jan 1, 2011 to Dec 31, 2011 BofC Monthly Average Noon Rate
$0.95 - $1.0125 $0.5 MM Mar 1, 2011 to Jun 30, 2012 BofC Monthly Average Noon Rate
When the monthly average noon spot foreign exchange rate exceeds the lower fixing rate, NAL is committed to selling the above listed USD at the upper fixing rate for that month. To the extent the monthly average noon spot foreign exchange rate is below the lower fixing rate, NAL has no commitment to sell USD.
Option Fixing Range (CAD/USD) Notional (US) per month Term Counterparty Floating Rate
$1.05 - $1.15 $1.0 MM Jan 1, 2011 to Dec 31, 2011 BofC Monthly Average Noon Rate
When the monthly average noon spot foreign exchange rate exceeds the fixing range, NAL is committed to selling the above listed USD at the lower fixing rate for that month. To the extent the monthly average spot foreign exchange rate is below the lower fixing rate, NAL has a commitment to sell the above listed USD at the lower fixing rate. When the monthly average noon spot foreign exchange rate falls within the fixing range, NAL has no commitment to sell USD.
The fair value of foreign exchange derivative contracts has been included on the balance sheet with changes in the fair value reported separately on the statement of income as unrealized gain (loss). As at December 31, 2010, if exchange rates had strengthened by $0.01, with all other variables held constant, net income for the period would have been $0.7 million higher, due to changes in the fair value of the derivative contracts. An equal and opposite effect would have occurred to net income had exchange rates been $0.01 weaker.
Commodity price riskCommodity price risk is the risk that the fair value or future cash flows will fluctuate as a result of changes in commodity prices. Commodity prices for oil and natural gas are impacted by not only the relationship between the Canadian and U.S. dollar, but also macroeconomic events that dictate the levels of supply and demand. The Corporation has attempted to mitigate commodity price risk by entering into financial derivative contracts. The Corporation’s policy is to enter into commodity contracts to a maximum of 60 percent of forecasted, net of royalty, production volumes for a period of up to two years.

48
NAL has the following commodity risk derivative contracts outstanding:
CRUDE OIL Q1-11 Q2-11 Q3-11 Q4-11
US$ Collar Contracts
$US WTI Collar Volume (bbl/d) 800 1,000 200 200
Bought Puts – Average Strike Price ($US/bbl) 81.25 83.00 90.00 90.00
Sold Calls – Average Strike Price ($US/bbl) 94.47 95.68 100.50 100.50
US$ Swap Contracts
$US WTI Swap Volume (bbl/d) 4,900 4,900 5,700 5,700
Average WTI Swap Price ($US/bbl) 87.39 87.39 88.10 88.10
Total Oil Volume (bbl/d) 5,700 5,900 5,900 5,900
Two calendar 2011 500 bbl/d swap contracts with an average price of $95.00 contain extendable call options. The extendible call option provides the counterparty with the option to extend the contract into calendar 2012 under the same price and volumetric terms. The counterparty can exercise this option any time before December 31, 2011.
NATURAL GAS Q1-11 Q2-11 Q3-11 Q4-11 Q1-12
AECO Swap Volume (GJ/d) 5,000 20,000 21,000 21,000 21,000
AECO Average Price ($Cdn/GJ) 5.61 4.32 3.95 3.95 3.95
Total Natural Gas Volume (GJ/d) 5,000 20,000 21,000 21,000 21,000
The fair value of commodity derivative contracts has been included on the balance sheet with changes in the fair value reported separately on the statement of income as unrealized gain (loss). As at December 31, 2010, if oil and natural gas liquids prices had been $1.00 per barrel lower and natural gas prices $0.10 per Mcf lower, with all other variables held constant, net income for the period would have been $2.1 million higher, due to changes in the fair value of the derivative contracts. An equal and opposite effect would have occurred to net income had oil and natural gas liquids prices been $1.00 per barrel higher and natural gas $0.10 per Mcf higher.
Interest rate riskInterest rate risk is the risk that future cash flows will fluctuate as a result of changes in market interest rates. The Corporation is exposed to interest rate fluctuations on its bank debt, which bears a floating rate of interest. The Corporation has attempted to mitigate commodity price risk by entering into financial derivative contracts.
The contracts have a combined notional debt amount of $139 million and require NAL to make fixed quarterly payments. In exchange, the counterparties are required to pay the Corporation a floating rate of interest based on the average rate for Canadian dollar bankers’ acceptances. The Corporation’s interest charge includes this fixed interest rate component plus a standby fee, a stamping fee and the fee for renewal. The Corporation’s policy is to enter into interest rate swap contracts to fix the interest rate on up to 50 percent of outstanding bank debt for periods of up to five years.
NAL has the following interest rate derivative contracts outstanding:
Interest Rate Remaining TermAmount
(Cdn$MM)(1)
Corporation Fixed Rate
Counterparty Floating Rate
Swaps-floating to fixed Jan 2011 – Dec 2011 $39.0 1.5864% CAD-BA-CDOR (3 months)
Swaps-floating to fixed Jan 2011 – Jan 2013 $22.0 1.3850% CAD-BA-CDOR (3 months)
Swaps-floating to fixed Jan 2011 – Jan 2014 $22.0 1.5100% CAD-BA-CDOR (3 months)
Swaps-floating to fixed Jan 2011 – Mar 2013 $14.0 1.8500% CAD-BA-CDOR (3 months)
Swaps-floating to fixed Jan 2011 – Mar 2013 $14.0 1.8750% CAD-BA-CDOR (3 months)
Swaps-floating to fixed Jan 2011 - Mar 2014 $14.0 1.9300% CAD-BA-CDOR (3 months)
Swaps-floating to fixed Jan 2011 – Mar 2014 $14.0 1.9850% CAD-BA-CDOR (3 months)
(1) Notional debt amount

49
The fair value of interest rate derivative contracts has been included on the balance sheet with changes in the fair value reported separately on the statement of income as unrealized gain (loss). As at December 31, 2010, if interest rates had been one percent lower, with all other variables held constant, net income for the year would have been $4.0 million lower, due to changes in the fair value of the derivative contracts. An equal and opposite effect would have occurred to net income had interest rates been one percent higher.
Fair Value of Financial InstrumentsThe carrying amount of the Corporation’s financial instruments, including accounts receivable, accounts payable and accrued liabilities, and dividends payable to shareholders, approximate their fair value due to their short term to maturity.
The Corporation’s bank debt and cash bear interest at floating market rates and, accordingly, the fair market value approximates the carrying amount.
The fair value of the Corporation’s convertible debentures at December 31, 2010 was $204.5 million, based on a quoted and observable market value (2009 - $203.7 million).
Derivative contracts are recorded at fair value on the balance sheet as current or long-term, assets or liabilities, based on their fair values on a contract-by-contract basis. The fair value of commodity contracts is determined as the difference between the contracted prices and published forward curves (ranging from US$91.38 per barrel to US$94.52 per barrel for oil and $3.63 per GJ to $4.31 per GJ for natural gas) as of the balance sheet date, using the remaining contracted oil and natural gas volumes with option contracts also including an element of volatility. The fair value of the interest rate swaps is determined by discounting the difference between the contracted interest rate and forward bankers’ acceptances rates (ranging from 1.05 percent to 2.04 percent) as of the balance sheet date, using the notional debt amount and outstanding term of the swap. The fair value of the exchange rate derivatives is calculated as the discounted value of the difference between the contracted exchange rate and the market forward exchange rates (ranging from 0.9936 to 1.0038) as of the balance sheet date, using the notional U.S. dollar amount and outstanding term of the swap. The fair value of the derivative contracts is as follows:
2010 2009
Fair value of commodity contracts $(13,717) $(8,932)
Fair value of interest rate swaps 706 2,461
Fair value of foreign exchange rate swaps 3,111 3,986
$(9,900) $(2,485)
The gain/(loss) on derivative contracts is as follows:
Gain / (Loss) on Derivative Contracts
2010 2009
Unrealized gain (loss):
Crude oil contracts $(2,467) $(68,590)
Natural gas contracts (2,318) (6,430)
Interest rate swaps (1,755) 2,735
Exchange rate swaps (875) 3,986
Unrealized loss (7,415) (68,299)
Realized gain (loss):
Crude oil contracts (4,353) 46,811
Natural gas contracts 23,349 25,382
Interest rate swaps (1,057) (656)
Exchange rate swaps 6,507 8,134
Realized gain $24,446 $79,671
Gain on derivative contracts $17,031 $11,372

50
These contracts are presented on the balance sheet as short term / long term, assets and liabilities as follows:
2010 2009
Current unrealized loss on derivative contracts $(7,819) $(11,231)
Current unrealized gain on derivative contracts 422 6,285
Current unrealized loss on derivative contracts (7,397) (4,946)
Long term unrealized gain on derivative contracts - 2,461
Long term unrealized loss on derivative contracts (2,503) -
Net fair value of derivative contracts $(9,900) $(2,485)
As at December 31, 2010, the total fair value of derivative contracts was a net liability of $9.9 million (2009 - net liability of $2.5 million). The change in the fair value for year ended December 31, 2010 of $7.4 million has been recognized as an unrealized loss in the statement of income (2009 - $68.3 million loss).
The following table reconciles the movement in the fair value of the Corporation’s derivative contracts:
2010 2009
Unrealized gain (loss), beginning of year $(2,485) $65,406
Unrealized gain acquired(1) - 408
Unrealized loss, end of year (9,900) (2,485)
Unrealized loss for the year (7,415) (68,299)
Realized gain in the year 24,446 79,671
Gain on derivative contracts $17,031 $11,372
(1) Assumed on acquisition of Clipper (Note 4)
The financial instruments carried at fair value, being the derivative contracts and cash, are required to be classified into a hierarchy that prioritizes the inputs used to measure the fair value. The three levels of the fair value hierarchy are:
• Level 1: Unadjusted quoted prices in active markets for identical assets or liabilities;
• Level 2: Inputs other than quoted prices that are observable for the asset or liability either directly or indirectly; and
• Level 3: Inputs that are not based on observable market data.
Fair values are classified as Level 1 when the related derivative is actively traded and a quoted price is available. If different levels of inputs are used to measure a financial instrument’s fair value, the classification within the hierarchy is based on the lowest level input that is significant to the fair value measurement. The following table illustrates the classification of the financial instruments within the fair value hierarchy as at December 31, 2010:
Assets at fair value as at December 31, 2010
Level 1 Level 2 Level 3 Total
Cash $821 $- $- $821
Foreign exchange rate swaps - 3,111 - 3,111
Interest rate swaps - 706 - 706
$821 $3,817 $- $4,638
Liabilities at fair value as at December 31, 2010
Level 1 Level 2 Level 3 Total
Commodity contracts $- $13,717 $- $13,717
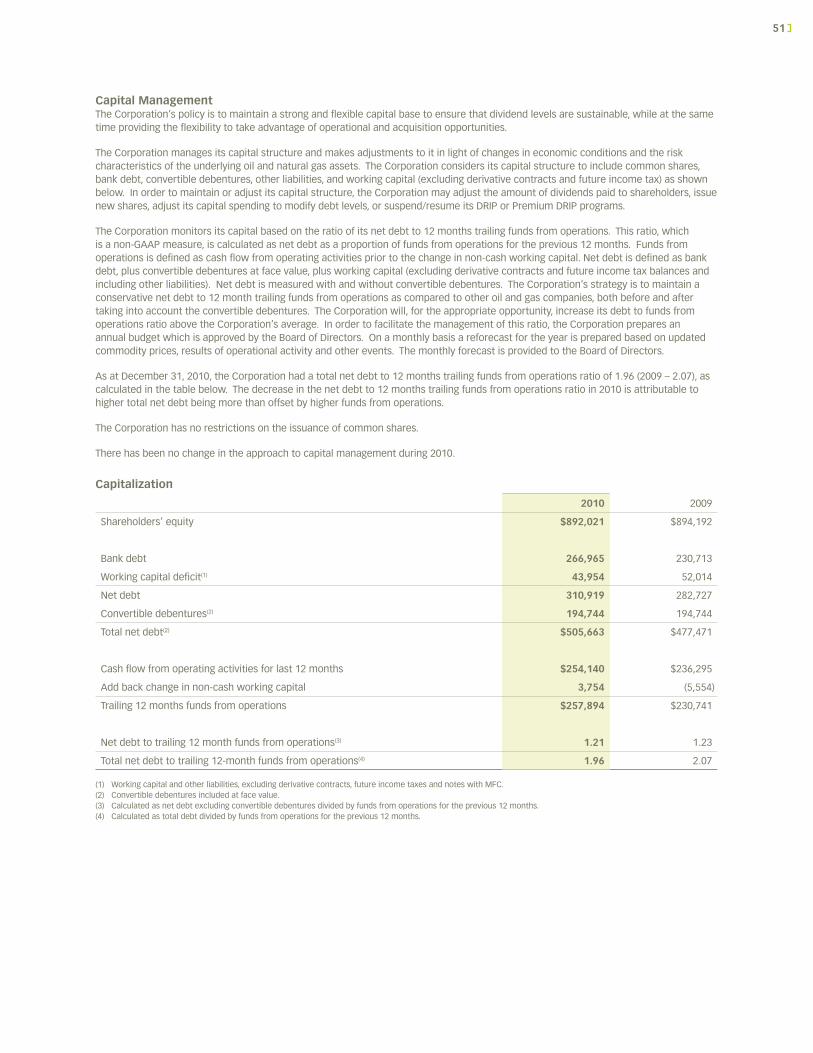
51
Capital ManagementThe Corporation’s policy is to maintain a strong and flexible capital base to ensure that dividend levels are sustainable, while at the same time providing the flexibility to take advantage of operational and acquisition opportunities.
The Corporation manages its capital structure and makes adjustments to it in light of changes in economic conditions and the risk characteristics of the underlying oil and natural gas assets. The Corporation considers its capital structure to include common shares, bank debt, convertible debentures, other liabilities, and working capital (excluding derivative contracts and future income tax) as shown below. In order to maintain or adjust its capital structure, the Corporation may adjust the amount of dividends paid to shareholders, issue new shares, adjust its capital spending to modify debt levels, or suspend/resume its DRIP or Premium DRIP programs.
The Corporation monitors its capital based on the ratio of its net debt to 12 months trailing funds from operations. This ratio, which is a non-GAAP measure, is calculated as net debt as a proportion of funds from operations for the previous 12 months. Funds from operations is defined as cash flow from operating activities prior to the change in non-cash working capital. Net debt is defined as bank debt, plus convertible debentures at face value, plus working capital (excluding derivative contracts and future income tax balances and including other liabilities). Net debt is measured with and without convertible debentures. The Corporation’s strategy is to maintain a conservative net debt to 12 month trailing funds from operations as compared to other oil and gas companies, both before and after taking into account the convertible debentures. The Corporation will, for the appropriate opportunity, increase its debt to funds from operations ratio above the Corporation’s average. In order to facilitate the management of this ratio, the Corporation prepares an annual budget which is approved by the Board of Directors. On a monthly basis a reforecast for the year is prepared based on updated commodity prices, results of operational activity and other events. The monthly forecast is provided to the Board of Directors.
As at December 31, 2010, the Corporation had a total net debt to 12 months trailing funds from operations ratio of 1.96 (2009 – 2.07), as calculated in the table below. The decrease in the net debt to 12 months trailing funds from operations ratio in 2010 is attributable to higher total net debt being more than offset by higher funds from operations.
The Corporation has no restrictions on the issuance of common shares.
There has been no change in the approach to capital management during 2010.
Capitalization
2010 2009
Shareholders’ equity $892,021 $894,192
Bank debt 266,965 230,713
Working capital deficit(1) 43,954 52,014
Net debt 310,919 282,727
Convertible debentures(2) 194,744 194,744
Total net debt(2) $505,663 $477,471
Cash flow from operating activities for last 12 months $254,140 $236,295
Add back change in non-cash working capital 3,754 (5,554)
Trailing 12 months funds from operations $257,894 $230,741
Net debt to trailing 12 month funds from operations(3) 1.21 1.23
Total net debt to trailing 12-month funds from operations(4) 1.96 2.07
(1) Working capital and other liabilities, excluding derivative contracts, future income taxes and notes with MFC.(2) Convertible debentures included at face value.(3) Calculated as net debt excluding convertible debentures divided by funds from operations for the previous 12 months.(4) Calculated as total debt divided by funds from operations for the previous 12 months.

52
16) Commitments
(i) Joint Venture AgreementEffective April 20, 2009, the Corporation and MFC entered into a joint venture agreement with a senior industry partner. The arrangement consists of a three year commitment to spend $50 million on or before August 31, 2012, that provides the Corporation and MFC an opportunity to earn an interest in freehold and crown acreage. The Corporation has a 65 percent interest in this agreement and MFC a 35 percent interest. The three year commitment to the Corporation is $32.5 million. The agreement is exclusive and structured to be extendible for up to an additional six years for a total potential commitment of $150 million ($97.5 million net to the Corporation) to earn an interest in over 150 (97.5 net) sections of freehold and crown acreage. If the capital spending commitments are not met, interests in the freehold and crown acreage will not be earned and the Corporation will not be required to pay unspent commitment amounts under the arrangement. As at December 31, 2010, the Corporation has spent $13.1 million under this agreement.
(ii) Farm-in AgreementEffective August 10, 2009, the Corporation and MFC entered into a farm-in agreement with a senior industry partner. The arrangement consists of a two year initial commitment, with a minimum capital commitment of $40 million in the first year and $57 million in the second year, with an option for a third year, at NAL’s election, for an additional commitment of $50 million. The Corporation has a 60 percent interest in this agreement and MFC a 40 percent interest. The agreement provides the opportunity to earn an interest in approximately 1,400 gross sections of undeveloped oil and gas rights in Alberta held by the partner. If the capital spending commitments are not met, interest in the acreage will not be earned and the Corporation will not be required to pay any unspent amounts. As at December 31, 2010, the Corporation has spent $24.4 million under this agreement and met its first year commitment.
(iii) OtherNAL has entered into several contractual obligations as part of conducting day-to-day business. NAL has the following commitments for the next five years:
($000s) 2011 2012 2013 2014 2015
Office lease(1) $2,254 $2,254 $2,239 $2,196 $2,196
Office lease – Clipper and Breaker(2) 2,200 2,200 364 - -
Transportation agreement 4,274 2,303 2,158 977 121
Processing agreements(3) 628 197 184 - -
Convertible debentures(4) - 79,744 - 115,000 -
Bank debt - 160,179 106,786 - -
Total $9,356 $246,877 $111,731 $118,173 $2,317
(1) Represents the Corporation’s share of office lease commitments, including both base rent and operating costs, in relation to the lease held by the Manager, of which the Corporation is allocated a pro rata share (currently approximately 63 percent) of the expense on a monthly basis.
(2) Represents the full amount of the office leases assumed with the acquisitions of Clipper and Breaker. MFC will reimburse the Corporation for 50 percent of the Clipper obligation under the base price adjustment clause.
(3) Represents gas processing agreements with take or pay components.(4) Principal amount.
17) Subsequent EventIn February, 2011, the Corporation sold certain non-core oil and gas assets for proceeds of approximately $26.2 million, subject to standard industry closing adjustments.

The Annual Meeting of Shareholders of NAL will be held at 3:00 p.m. (MDT) on Wednesday, May 25, 2011 at Bow Valley Club, The Dining Room, 370, 250 – 6th Avenue SW, Calgary, Alberta. Shareholders are encouraged to attend and participate in the business of the meeting.
Des
igne
d by
Bry
an M
ills
Irad
esso
Corporate Information
DIRECTORSIrvine J. Koop, Chairman of the BoardBarry D. StewartGordon S. LackenbauerWilliam J. EeuwesDonald R. IngramKelvin B. JohnstonAndrew B. Wiswell
LEGAL COUNSELBennett Jones LLP
AUDITORSKPMG LLP
INDEPENDENT ENGINEERSMcDaniel and Associates Consultants Ltd.
OFFICERSAndrew B. Wiswell,President and Chief Executive Officer
Keith A. Steeves,Vice President, Finance and Chief Financial Officer
Marlon J. McDougall,Vice President, Operations and Chief Operations Officer
John C. Koyanagi,Vice President, Business Development
John H. Kousinioris,Corporate Secretary
TRADINGToronto Stock ExchangeSymbol: NAE
BANKBank of Montreal
TRUSTEE & TRANSFER AGENTComputershare Trust Company of CanadaTelephone: 1 (800) 564-6253Website: www.computershare.com
INVESTOR RELATIONSClayton Paradis, Manager, Investor RelationsToll-Free Telephone: 1 (888) 223-8792In Calgary: (403) 294-3620Facsimile: (403) 294-3601E-mail: [email protected]: www.nalenergy.com
Printed on Recycled Paper
20%

www.nalenergy.com
NAL Energy Corporation 1000, 550 - 6th Avenue SW Calgary, Alberta T2P 0S2
Investor Relations: 1-888-223-8792 [email protected]