Embed Size (px)
DESCRIPTION
Nakaguma 2015
Citation preview

CHOOSING THE FORM OF GOVERNMENT: THEORY ANDEVIDENCE FROM BRAZIL*
Marcos Yamada Nakaguma
This article proposes a model to study the main factors that influence the preferences of differentpopulation groups between presidential and parliamentary systems. Ceteris paribus, the poor groups inthe population tend to prefer a presidential system relatively more than the rich, as the lower qualityof their local accountability institutions (e.g. local media and judicial courts) makes them morevulnerable to the expropriation of rents by their legislators. The model is able to account for themain stylised facts emerging from an analysis of referendum data from Brazil.
The form of government is one of the most important features of the organisation of ademocracy, as it establishes rules about how the government is to be appointed andremoved from office. There are two major systems: a presidential regime, where theexecutive is directly elected by voters and is guaranteed to stay in office for a fixedterm; and a parliamentary regime, where the executive is appointed by the parliamentand may be removed if it receives a vote of no confidence. The choice of form ofgovernment is a recurrent and controversial issue in many societies, and debates aboutit should gain further relevance as more countries move to democratic systems and asnew democracies gradually consolidate.1
Despite the existence of a large literature studying the differences betweenpresidential and parliamentary systems, little attention has been devoted to the questionof what determines the choice of form of government. Among the few studies thatexamine this issue, the focus has been either on the historical context behind the choice(Persson and Tabellini, 2003; Cheibub, 2007) or on the interests of elites to impose aparticular regime (Lijphart, 1992; Easter, 1997; Robinson and Torvik, 2013). Still, thechallenges posed by constitutional design in modern societies make it important tounderstand how these issues are perceived by citizens, particularly because suchdecisions are likely to depend more and more on the population’s consent, eitherinformally through protests and public manifestations or formally through referenda.
*Corresponding author: Marcos Yamada Nakaguma, Department of Economics, University of Sao Paulo,Av. Prof. Luciano Gualberto, 908, 05508-010, Sao Paulo-SP, Brazil. Email: [email protected].
This study is based on a chapter of my Ph.D. dissertation at Columbia University. I thank Massimo Morelli,Alessandra Casella, Navin Kartik and Suresh Naidu for invaluable support and advice. I am also indebted tothe editor, Martin Cripps, two anonymous referees as well as Patrick Bolton, Rodrigo De Losso, BrunoGiovannetti, Claudio Ferraz, Carlos Eduardo Gonc�alves, Takakazu Honryo, Ethan Kaplan, Gabriel Madeira,Guilherme Martins, Andrea Mattozzi, Marcos Rangel, Mauro Rodrigues, Bernard Salani�e, Hitoshi Shigeoka,Heriberto Tapia, Mariano Tommasi, S�ebastien Turban and seminar participants at Columbia University, EUI,EESP-FGV, PUC-Rio, University of Sao Paulo, University of Siena, EPCS (Zurich), EPSA (Barcelona), ISNIE(Florence) and SBE (Foz do Iguac�u) for comments and suggestions. I am also grateful to the staff at theTribunal Superior Eleitoral (TSE) and CESOP-UNICAMP for help with data collection. Financial supportfrom Columbia University, MWP-EUI and FIPE-USP are gratefully acknowledged. All errors are my own.
1 The possibility of a change in the form of government has been recently considered in several countries,including Argentina, Brazil, Chile, Egypt, Indonesia, Mexico, Nigeria, South Korea, Tunisia and Turkey(Cheibub, 2007).
[ 1986 ]
The Economic Journal, 125 (December), 1986–2023. Doi: 10.1111/ecoj.12163© 2014 Royal Economic Society. Published by John Wiley & Sons, 9600
Garsington Road, Oxford OX4 2DQ, UK and 350 Main Street, Malden, MA 02148, USA.

This article studies the main factors that determine the constitutional preferences ofcitizens over the form of government. To motivate my theoretical analysis, I first studythe case of Brazil, where a referendum in 1993 allowed the population to choosebetween a presidential and a parliamentary system. In doing so, I rely on a novel dataset consisting of the results of the referendum at municipal level as well as severalopinion surveys conducted at that time. This information provides a uniqueopportunity to observe the constitutional preferences of different population groupsand allows me to study the question of choice of the form of government directly fromthe perspective of citizens.
The analysis of the data reveals a surprising new fact: while the Brazilian populationin general voted in favour of a presidential system, there exists a strong positivecorrelation between income per capita and the percentage of votes cast for aparliamentary regime across municipalities; that is, the poor (rich) groups in thepopulation voted more for a presidential (parliamentary) system. I further documentthat among the electorate a common reason for rejecting a parliamentary regime wasthe absence of direct elections for the executive in connection with a lack ofconfidence in the congress. The general perception was that corruption waswidespread among legislators and that a parliamentary system would furtherexacerbate the problem.2
The evidence from Brazil is, in a sense, quite puzzling and the existing studies in theliterature (Persson et al., 1997, 2000; Robinson and Torvik, 2013) are unable toaccount for the fact that the poorer citizens were more likely to vote for a presidentialsystem. I propose a theoretical model to explain the general pattern of the referendumresults, focusing on a fundamental difference between presidential and parliamentarysystems: on the one hand, direct elections for a president allow voters to hold theexecutive leader directly accountable but imply that the president may not be removedfrom office before the next elections; on the other hand, a vote of no confidencetransfers to legislators the responsibility for monitoring the executive but provides amechanism to replace the prime minister before the end of his term.
The formal analysis emphasises that the bargaining power of legislators is largerunder parliamentary systems. This enables them to push for higher transfers toconstituencies, which in turn expands their own capacity to extract rents. Intuitively,these funds are intended to finance the provision of local public goods (e.g.investment in education) but are also subject to expropriation by legislators. As thequality of local accountability institutions (e.g. the local media and judicial courts) isheterogeneous across regions and usually lower in poorer constituencies, the burdenof corruption tends to fall disproportionately on the poor population.3 As a result, aparliamentary system is relatively less attractive to the poor than to the rich.
2 As in many developing countries, corruption was (and still is) a major concern in Brazil. The magnitudeof the problem is huge: it is estimated that, every year, at least US$ 3.5 billion (or 1.5% of Brazil’s GDP) arediverted just through corruption from the federal funds transferred to municipal governments forinvestment in basic education, health and infrastructure. These estimates are based on audit reportspublished by the Controladoria-Geral da Uniao.
3 This implication of the model is consistent with Ferraz and Finan (2008, 2011), who find that thepresence of local media, i.e. a radio station or a local newspaper, reduces the incidence of corruption inBrazilian municipalities.
© 2014 Royal Economic Society.
[ D E C E M B E R 2015] C HOO S I N G T H E F O RM O F G O V E R NM E N T 1987

In a presidential system, on the other hand, the bargaining power of legislators isdiminished, which limits the size of transfers and the amount of political rents that theyare able to obtain. Now, it is the executive leader who is in a stronger position to extractrents, which he does by deviating resources from the federal budget. At the nationallevel, the executive leader is subject to the control of institutions such as large mediaoutlets, federal prosecutors and investigative agencies, which provide commonprotection to the population as a whole. As a consequence, the burden of corruptionimposed by the executive is distributed more uniformly among voters and there is lessdependence on local institutions.4
Why should local accountability institutions matter to control federal-level legislators?The process of corruption consists of a complex chain of illegal transactions involvingseveral agents, including congressmen, contractors, public servants and mayors. As inmany other countries, in Brazil, it usually begins when a contractor approaches acongressman to ‘propose’ a project in a municipality where that legislator has strongpolitical influence. The congressman starts to sponsor the project and works to obtainpolitical support in congress, technical approvals from government agencies as well asthe disbursement of funds. Next, at the local level, the procurement process ismanipulated, usually with the participation of municipal authorities, to ensure that thecontract goes to the ‘right’ firm. Finally, the contractor obtains a profit and distributesrents in the form of bribes, gifts and campaign contributions to the several agentsinvolved in the process. Therefore, expropriation pre-supposes a series of corrupt actswhich take place at the local level. As a consequence, local institutions play an importantrole in restraining corruption by legislators. For instance, local prosecutors and judgesare instrumental in investigating and judging cases of procurement fraud and illicitenrichment, which are all crimes committed at the local level.
The model generates other interesting results. I examine how the form ofgovernment influences the choice of a national public policy in an environmentwhere the policy preference of voters and officeholders may become misaligned afterelections due to an unexpected change in the state of the world. I show that aparliamentary system leads to comparatively better policies for the majority of thepopulation as long as the likelihood that the officeholders remain aligned with theirconstituencies is large enough. Intuitively, this condition can be interpreted asrequiring that the quality of political representation in the society be sufficiently high.
The traditional argument in favour of parliamentarism is that it allows for thepossibility of replacing an unpopular or incompetent government prior to elections.Indeed, many political analysts in Brazil supported a parliamentary regime as being themost ‘modern’ and ‘flexible’ alternative. Nevertheless, my analysis suggests thatparliamentarism is also the regime that is most ‘intensive’ in political institutions, inthat it requires a strong system of protection against expropriation, particularly at the
4 The model captures the idea that the corruption practices of executive leaders tend to be morecentralised in nature, impacting broader sectors of the population at the same time. This notion is consistentwith several corruption cases uncovered in Latin America and other developing countries in recent decades.For instance, Presidents Fernando Collor de Mello (Brazil), Arnoldo Aleman (Nicaragua), Alberto Fujimori(Peru) and Carlos Andres Perez (Venezuela) were all charged with running large corruption schemes, ofteninvolving outright expropriation of public funds or large-scale influence-peddling schemes.
© 2014 Royal Economic Society.
1988 TH E E CONOM I C J O U RN A L [ D E C E M B E R

local level, and a class of politicians who can be trusted to represent well the interests ofvoters.
This study is related to a growing literature on endogenous political institutions,including Acemoglu and Robinson (2000), Aghion et al. (2004), Trebbi et al. (2008),Ticchi and Vindigni (2010), Acemoglu et al. (2013) and Robinson and Torvik (2013).Among these, Robinson and Torvik (2013) is the study that is most closely related tothe present work. They also investigate the question of the choice of the form ofgovernment, although their main focus is on the interests of political elites behind theprocess of constitutional choice. They argue that presidential regimes are prevalent inAfrica and Latin America because it is the system that generates most rents to itsleaders.
Although the argument put forward by Robinson and Torvik (2013) may well applyto a number of historical cases, my analysis suggests that it cannot be taken as a generalexplanation for the predominance and persistence of presidentialism in developingcountries. In this respect, my study sheds new light on the question of the endogenouschoice of the form of government by focusing specifically on the interests of citizens. Icontribute to the literature by providing novel evidence about the constitutionalpreferences of voters in Brazil. To the best of my knowledge, this study is the first to usereferendum data to examine this issue.
The results of this article are also related to Acemoglu and Johnson (2005), whoemphasise the fact that different institutions are often closely linked to each other.This feature makes it particularly difficult to isolate the effect of specific aspects of theinstitutional environment. Interestingly, my model shows that the choice of form ofgovernment depends on the quality of the accountability institutions in a society. Thisresult has important implications for empirical research. For instance, several recentstudies have argued that presidentialism leads to more corruption (Kunicova and Rose-Ackerman, 2005; Lederman et al., 2005). However, my analysis of the Brazilianexperience suggests that causality might run in the opposite direction; that is, it ispossible that countries that are more prone to corruption may also be more likely toadopt presidential systems.
The present study is also connected to a number of articles in comparative politicsthat have examined the differences between presidential and parliamentary systems.An influential view in this literature is that presidential democracies are inherently lessstable and more prone to coups. This notion has been argued by Linz (1978) andStepan and Skach (1993) based on the fact that the relationship between executive andlegislative tends to be more conflictual under presidential regimes. However, manyscholars, including Shugart and Carey (1992), Mainwaring and Shugart (1997) andCheibub (2007), have challenged this view. According to Cheibub (2007, p. 3), theproblem is not that presidential systems are fundamentally flawed, but rather that ‘theytend to exist in societies where democracies of any type are likely to be unstable’. Thisperspective highlights the fact that to understand the political and economicconsequences of each system, one must first understand the reasons behind theiradoption. This study provides a contribution in this direction by highlighting some ofthe main elements behind the process of constitutional choice.
In the political economy literature, Persson et al. (1997, 2000) were the first topropose a formal model to compare presidential and parliamentary regimes. They
© 2014 Royal Economic Society.
2015] CHOO S I N G TH E F O RM O F GO V E R NM EN T 1989

show that presidential systems are associated with less political rents, whereasparliamentary systems are associated with more re-distribution towards broadpopulation groups and a higher provision of public goods. However, their modelassumes that all voters are homogeneous and does not allow for direct elections forpresident. As such, their framework is unable to account for the stylised factspresented in this study, particularly the evidence that poor citizens voted more for apresidential regime.
Finally, my analysis highlights the fact that parliamentarism entails a type of fiscaldecentralisation, in the form of more transfers to constituencies, which increases theneed for better accountability institutions at the local level. The present study is, in thissense, related to a literature on fiscal federalism which also emphasises the distinctionbetween national and local institutions for the performance of public policies (Oates,1999).
1. Brazil’s Referendum of 1993
1.1. Historical Background
In April 1993, the Brazilian population voted in a referendum to choose between apresidential and a parliamentary system of government. The decision to hold thereferendum had been agreed upon five years earlier, during the discussions that led tothe democratic constitution of 1988. The proposal for its realisation received strongsupport among members of the constitutional assembly and served as a compromisesolution to the controversial issue that the choice of form of government proved to be.It was then decided that a presidential system would be provisionally adopted until thereferendum in 1993.5
The period between the early 1980s and mid 1990s, often referred to as Brazil’s ‘lostdecade’, was marked by a series of economic problems, beginning with the debt crisis ofthe 1980s and followed by a long period of stagflation. The country also faced importantdifficulties related to its fragmented party system and widespread corruption in both theexecutive and the congress. Indeed, the first popularly elected president after themilitary regime, Fernando Collor de Mello, was impeached in 1992 amid accusations ofrunning a vast influence-peddling scheme. Around the same time, a massive corruptionscandal was uncovered involving at least 43 members of the congress, several publicofficials and a cartel of construction firms that controlled the procurement of publicworks in several parts of the country (Fleischer, 1997).
In this context, the debates around the referendum focused broadly on two mainthemes: the issue of governability, i.e. the ability of government to respond effectively
5 Brazil had a previous brief experience with a parliamentary system between September 1961 and January1963. This was a very turbulent period of the country’s political history, with a succession of three differentprime ministers in 16 months. In January 1963, the country returned to a presidential system with the supportof around 80% of voters in a popular referendum. This massive support reflected the general dissatisfactionof the population with parliamentarism, which was viewed as the main source of a ‘crisis of authority’ inBrazil. The return to presidentialism matches the ‘narrative’ of the study to the extent that my theory predictsthat a presidential system should be preferable whenever the quality of political representation is weak. Itmust be emphasised, however, that there were a number of other factors at play specific to Brazilian politics atthat time. See Skidmore (1967) for a detailed historical account of that period.
© 2014 Royal Economic Society.
1990 TH E E CONOM I C J O U RN A L [ D E C E M B E R

to crises and changes in the political environment, and a lack of confidence in thepolitical institutions. On the one hand, it was argued that a parliamentary system wouldhelp to create the appropriate conditions for the adoption of social and economicreforms, given the requirement that the government be supported by a majority at alltimes. On the other hand, it was argued that only under a presidential system wouldthe population be able to directly choose its leaders and, as a consequence, to haveactual influence on politics.
For approximately two months prior to the referendum, daily programmes on TVand radio were broadcast to present the various arguments for and against eachalternative.6 The parliamentary system received great support among legislators. Asurvey conducted in 1991 showed that 74% of the members of the congress were infavour of parliamentarism, although some parties with strong candidates in theupcoming elections ended up backing the presidential system.
As shown in Figure 1, a parliamentary regime started ahead in the polls. However,this advantage quickly faded as the campaigns on TV and radio began in mid-February,after which there was a marked shift in voting intentions towards a presidential regime.Many political analysts attributed this dramatic change to an increase in the perceptionof voters that a parliamentary system would, in fact, be the ‘government of congress’.Indeed, this idea was heavily explored by the pro-presidentialism campaign, which hadone TV advertisement maliciously suggesting viewers to ‘imagine what would happen ifwe put the country in the hands of the deputies . . .’.7
The final voting outcome is reported in Table 1. The presidential system was theform of government chosen by the Brazilian population with 55% of total votes.Note that a considerable fraction of voters, approximately 20%, cast a null or ablank vote. After the referendum, many explanations of the defeat of a parliamen-tary system were raised by analysts and politicians involved in the campaigns. Thecongress and the political parties were among the most blamed. According to anewspaper article, ‘supporters of parliamentarism agree that the image of thecongress and the recent scandals involving the institution did not help. “What youhear the most among the public is: not with this congress, not with this congress,”laments Jose Serra (one of the leaders of the pro-parliamentarism campaign)’ (Folhade Sao Paulo, 18 April 1993). Lula da Silva, president of the country during 2002–10and, at that time, leader of the Labour Party, was quoted saying that ‘the Braziliancongress is an institution that does not have the trust of the population’ (Isto �E , 28April 1993). And 15 years later, Fernando Henrique Cardoso, president during1994–2002 and a strong supporter of parliamentarism, admitted: ‘After myexperience as president and in retrospect, I have many doubts. In reality, aparliamentary regime would have required a much stronger party system’ (AgenciaBrasil, 3 October 2008).
6 The Brazilian electoral law obliges all TV and radio stations to broadcast campaign advertisements free ofcharge. The time on TV and radio was divided equally between supporters of each of the two systems.
7 Interestingly, the impeachment process of president Collor de Mello (January 1991 to October 1992),which occurred in an orderly fashion and counted with an active involvement of the population, seems tohave had the actual effect of strengthening the citizens’ beliefs in their ability to hold the executivegovernment accountable. Indeed, this idea was also explored by the pro-presidentialism campaign, whichemphasised the fact that in a presidential system ‘you choose [the president], and you can remove’.
© 2014 Royal Economic Society.
2015] CHOO S I N G TH E F O RM O F GO V E R NM EN T 1991

1.2. Empirical Evidence: New Facts
This subsection presents main stylised facts about the results of the Brazilianreferendum of 1993. The present study explores three sources of data. First, I usemunicipal-level data on the outcomes of the referendum obtained from the supremeelectoral court of Brazil (Tribunal Superior Eleitoral (TSE)) and several regionalelectoral courts. Although part of the information was missing or unavailable, it wasstill possible to recover data for 4,178 municipalities, which amounts to 90% of thecountry’s total population in 1993.8 Second, I use data from several opinion surveys
0Dec/16/92 Feb/04/93 Mar/03/93 Mar/16/93 Mar/28/93 Apr/14/93
15
30
45
60
75
Presidential System
Parliamentary System
Undecided
Fig. 1. Evolution of Voting IntentionsNotes. This Figure plots the evolution of voting intentions during the months preceding thereferendum.Source. Datafolha Institute.
Table 1
Referendum: Final Result
Form of government %
Presidential system 55.5Parliamentary system 24.5Null or blank votes 20.0
Notes. This Table provides a summary of the final outcome of Brazil’s referendum of 1993.The turnout rate was 75%.
8 In Brazil, a municipality is defined as the smallest administrative subdivision to have its owndemocratically elected leadership, a mayor and a local assembly.
© 2014 Royal Economic Society.
1992 TH E E CONOM I C J O U RN A L [ D E C E M B E R

conducted by the Datafolha, an independent research institute, from February to April1993, containing detailed information about the voting intentions and the individualcharacteristics of a large number of subjects.9 Finally, data on the social and economiccharacteristics of Brazilian municipalities for the year 1991 were obtained from theInstituto de Pesquisa Economica Aplicada (IPEA). Table 2 reports basic descriptivestatistics for the main variables used in the analysis.
Figure 2 plots the relationship between income per capita and the percentage of validvotes (excluding null and blank votes) cast for a parliamentary system, with eachmunicipality represented as a circle proportional to its population. The graph shows theexistence of a strong positive correlation between income per capita and the percentageof votes for a parliamentary system across Brazilian municipalities. Remarkably, the R2
of this simple regression line is 0.56. Observe that this relationship is not systematicallydriven by population size, although large municipalities do tend to be richer onaverage. Moreover, using micro-data from an opinion poll conducted before thereferendum, Figure 3 shows that the intention to vote for a parliamentary systemincreases with household income. Thus, the evidence that the poor (rich) voted morefor a presidential (parliamentary) system exists both at municipal and individual levels.
Table 2
Summary Statistics
Observations Mean SD Min. Max.
Panel (a): cross-section of municipalities% parliamentary system (valid votes) 4,169 0.219 0.089 0.034 0.782No. of AM radio stations 4,169 0.349 0.937 0 22Federal judges and prosecutors 4,169 0.041 0.200 0 1Log (income per capita) 4,169 4.73 0.56 3.31 6.36Log (population) 4,169 9.36 1.08 6.62 16.08Illiteracy rate 4,169 0.285 0.160 0.018 0.892Gini coefficient 4,169 0.528 0.054 0.345 0.794
Panel (b): survey dataVoting intention: parliamentary system 2,178 0.239 0.426 0 1Household income: <2 minimum wages 2,178 0.247 0.431 0 1Household income: 2–5 minimum wages 2,178 0.280 0.449 0 1Household income: 5–10 minimum wages 2,178 0.242 0.428 0 1Household income: 10–20 minimum wages 2,178 0.143 0.350 0 1Household income: >20 minimum wages 2,178 0.085 0.279 0 1Municipality’s mean income 2,178 2.51 0.60 1.2 5Schooling: primary 2,178 0.575 0.494 0 1Schooling: secondary 2,178 0.285 0.451 0 1Schooling: superior 2,178 0.139 0.346 0 1Ideology: from left to right (scale 0–10) 2,178 5.83 2.55 0 10Trust in the congress: very low 2,178 0.311 0.463 0 1Do you think that the country would be betteroff if the military returned to power? Yes
2,178 0.358 0.479 0 1
Notes. This Table reports summary statistics for selected key variables considered in the empirical analysis of thestudy. Panel (a) refers to the sample of Brazilian municipalities and is based on 4,169 observations used in theregression reported in column (1), Table 4. Panel (b) refers to survey data from the Datafolha Institute (28March 1993) and is based on 2,178 observations used in the regression reported in column (1), Table 5.
9 These data sets were obtained from the Centro de Estudos de Opini~ao P�ublica, CESOP-UNICAMP.
© 2014 Royal Economic Society.
2015] CHOO S I N G TH E F O RM O F GO V E R NM EN T 1993

How robust are these results? At the municipal level, Figures 4 and 5 show,respectively, that this evidence cannot be accounted for by income inequality (Ginicoefficient) or voting for charismatic and populist leaders, as measured by thepercentage of votes for Lula da Silva (Labour Party) in 1994.10 Moreover, Figure 6shows that the stylised fact remains even after controlling for the party affiliation ofmayors, which captures specific characteristics of the local politics.
Another possible explanation of this evidence could be attributed to the fact thatpoor individuals simply lacked knowledge about the referendum and, therefore, votedmore for a presidential system merely because it represented the status quo. Toinvestigate this possibility, I use information from an opinion survey which askedindividuals to point out at least two differences between presidential and parliamentaryregimes. As the answers to this question were spontaneous, they allow us to identify asubgroup of people who can be considered to be ‘knowledgeable’ enough about thereferendum.
Of 2,607 subjects interviewed, 1,059 (40.6%) were able to point out two or moredifferences between the two alternatives correctly. Table 3 provides a summary of thevoting intentions of subjects both in the full sample and in the subsample of ‘informedindividuals’. Surprisingly, voters with more knowledge about the referendum were
0.8
0.6
0.4
0.2
0
0 200 400 600Income Per Capita
% P
arlia
men
tary
Sys
tem
(V
alid
Vot
es)
Fig. 2. Valid Votes for a Parliamentary System (%) Versus Income Per CapitaNotes. This Figure plots the relationship between income per capita and the percentage of validvotes (excluding null and blank votes) cast for a parliamentary system. Each municipality isrepresented as a circle proportional to its population. The Figure displays a linear regression linewith R2 = 0.56.
10 Lula da Silva was the most popular left-wing candidate in the presidential elections of 1989 and 1994.
© 2014 Royal Economic Society.
1994 TH E E CONOM I C J O U RN A L [ D E C E M B E R

0.5
0.4
0.3
0.2
0.1< 2 [2 , 5] [5 , 10] [10 , 20] > 20
Household Income
% P
arlia
men
tary
Sys
tem
(V
alid
Vot
es)
Fig. 3. Voting Intentions for a Parliamentary SystemNotes. This Figure plots the voting intentions for a parliamentary system for different classes ofhousehold income (as measured in numbers of minimum wages). The data used in the analysiscome from an opinion survey conducted by the Datafolha Institute on 28 March 1993.
0.4
0.4 0.5 0.6 0.7 0.8Income Inequality
0.3
0.2
0.1
0.3
0
% P
arlia
men
tary
Sys
tem
Fig. 4. Votes for a Parliamentary System (%) Versus Income InequalityNotes. This Figure plots the relationship between income inequality, as measured by the Ginicoefficient, and the percentage of votes cast for a parliamentary system. The Figure displays alinear regression line with R2 = 0.
© 2014 Royal Economic Society.
2015] CHOO S I N G TH E F O RM O F GO V E R NM EN T 1995

0.4
0.4 0.6
% Labour Party (Lula)
0.3
0.2
0.2
0.1
0
0
% P
arlia
men
tary
Sys
tem
Fig. 5. Votes for a Parliamentary System (%) Versus Votes for the Labour Party (%)Notes. This Figure plots the relationship between the percentage of votes received by Luis InacioLula da Silva (Labour Party) in the presidential elections of 1994 and the percentage of votes castfor a parliamentary system. The Figure displays a linear regression line with R2 = 0.
0.4
–0.2
–200 200 400 600
0.2
0
0
% P
arlia
men
tary
Sys
tem
Income Per Capita
Fig. 6. Votes for a Parliamentary System (%) Versus Income Per Capita (Partialled-out Data)Notes. This Figure plots the relationship between income per capita and the percentage of votescast for a parliamentary system, where the effect of the party affiliation of mayors has beenpartialled out. Each municipality is represented as a circle proportional to its population.
© 2014 Royal Economic Society.
1996 TH E E CONOM I C J O U RN A L [ D E C E M B E R

comparatively more likely to vote for a presidential rather than a parliamentarysystem. Figure 7 then plots the voting intentions of informed and uninformedindividuals across different classes of income. Observe that contrary to the initialexpectation informed poor individuals were actually more likely to vote for apresidential system.11 I find, therefore, strong evidence that information about thereferendum does not account for the stylised fact presented above. This is aninteresting result in itself, considering that a lack of information among voters hasoften been viewed as one of the main explanatory factors for the final outcome of thereferendum.
I further investigate the determinants of the constitutional preferences of voters inBrazil by performing a more detailed regression analysis. At the municipal level, Table4 presents the results of OLS regressions in which the percentage of valid votes cast fora parliamentary system is regressed on four main socio-economic variables, namely, thelogarithm of income per capita, the logarithm of population, the illiteracy rate and theGini coefficient (income inequality) as well as other municipal characteristics.12
Following Ferraz and Finan (2008, 2011) and Litschig and Zamboni (2011), I alsoinclude the number of AM radio stations and a dummy variable for the presence offederal judges and prosecutors in each municipality. These authors have shown thatthe local media and judiciary play an important role in restraining corruption at themunicipal level in Brazil, so I use these variables as proxies for the presence of localaccountability institutions.
Table 3
Information about the Referendum
Full sample Informed individuals
% parliamentary system 25.7 28.1% presidential system 51.9 58.7% undecided 22.3 13.1
Observations 2,607 1,059
Notes. This Table provides a summary of the voting intentions for subjects in the full sample and in thesubsample of informed individuals. The subgroup of informed individuals consists of those voters who wereable to correctly identify (in spontaneous answers) at least two differences between presidential andparliamentary systems. The data refer to an opinion survey conducted by the Datafolha Institute on 3 March1993.
11 Observe that the voting intention for a parliamentary system increases sharply among uninformedindividuals as one moves from ‘<2 minimum wages’ to ‘between 2 and 5 minimum wages’. I conjecture thatpart of this large increase is driven by the fact that the very poor individuals may have had a harder timearticulating answers to this relatively complex question. As a result, some of them may have ended up beingclassified as ‘uninformed’, even though they intuitively knew the key differences between the two systems. I,therefore, speculate that the ‘true’ voting intention line for uninformed individuals is flatter than the onedepicted in Figure 7, with their voting intentions being more or less constant across income categories.
12 The municipal characteristics considered in the analysis were the following: percentage of thepopulation living in rural areas, population density (inhabitants/km2), state capital dummy, distance to thestate capital, percentage of abstention, percentage of null votes and percentage of votes cast for the PSDB(Fernando Henrique Cardoso) and the PT (Luis Inacio Lula da Silva) candidates in the 1994 presidentialelections.
© 2014 Royal Economic Society.
2015] CHOO S I N G TH E F O RM O F GO V E R NM EN T 1997

All regressions include state fixed effects. I also add dummy variables for the mayors’party affiliations in columns (3) and (4), while the interactions of both measures ofinstitutional presence (radio stations and local judicial branch) with income per capitaand inequality are added in columns (5) and (6). Overall, the estimates reveal aconsistent pattern. The vote for a parliamentary system is always positively correlatedwith income per capita, which shows that the stylised fact presented above is robust tocontrolling for main municipal characteristics.13 Interestingly, the estimates for thenumber of AM radio stations and the presence of federal judges and prosecutors arepositive and statistically significant throughout columns (1)–(4), suggesting that thelocal institutional environment is, indeed, important to determine the constitutionalpreferences of citizens. Furthermore, in columns (5) and (6), I show that the impact ofthe presence of accountability institutions is larger when income per capita is higherand inequality is lower. The interactions with income per capita are both positive andstatistically significant, whereas the interactions with inequality are negative, but onlysignificant in the case of radio stations (column 5). I conjecture that these results could
0.45
0.40
0.35
0.25
0.30
< 2 [2 , 5] [5 , 10] [10 , 20] > 20
Informed Individuals
Uninformed Individuals
Household Income
% P
arlia
men
tary
Sys
tem
(V
alid
Vot
es)
Fig. 7. Lack of Information Does Not Account for Stylised FactsNotes. This Figure plots the voting intentions of informed and uninformed voters for differentclasses of household income (as measured in numbers of minimum wages). The informedindividuals consist of those subjects who were able to correctly identify (in spontaneous answers)at least two differences between presidential and parliamentary systems of government. The dataused in the analysis consists of an opinion survey conducted by the Datafolha Institute on 3March 1993.
13 I also estimated several specifications of the model including the interaction between income per capitaand inequality, but this interaction term turned out to be highly insignificant.
© 2014 Royal Economic Society.
1998 TH E E CONOM I C J O U RN A L [ D E C E M B E R

Tab
le4
OLSRegressions:Cross-section
ofMunicipalities
Dep
enden
tvariab
le:%
parliam
entary
system
(1)
(2)
(3)
(4)
(5)
(6)
Log(inco
mepercapita)
0.05
8***
0.05
8***
0.05
8***
0.05
9***
0.05
7***
0.05
7***
(0.003
)(0.003
)(0.003
)(0.003
)(0.003
)(0.003
)Log(population)
0.00
8***
0.00
9***
0.00
8***
0.00
9***
0.00
7***
0.00
9***
(0.001
)(0.001
)(0.001
)(0.001
)(0.001
)(0.001
)Illiteracy
rate
�0.074
***
�0.076
***
�0.073
***
�0.076
***
�0.081
***
�0.080
***
(0.016
)(0.016
)(0.016
)(0.016
)(0.016
)(0.016
)Ginico
efficien
t(inco
me)
�0.079
***
�0.074
***
�0.079
***
�0.073
***
�0.053
***
�0.069
***
(0.015
)(0.015
)(0.015
)(0.015
)(0.016
)(0.016
)Number
ofAM
radio
stations
0.00
4***
0.00
4***
0.02
8**
(0.001
)(0.001
)(0.014
)Fed
eral
judge
san
dprosecu
tors
0.01
4***
0.01
3***
�0.052
(0.004
)(0.004
)(0.067
)Number
ofAM
radio
stations9
log(inco
mepercapita)
0.00
3*(0.001
)Number
ofAM
radio
stations9
Ginico
efficien
t�0
.074
***
(0.016
)Fed
eral
judge
san
dprosecu
tors
9log(inco
mepercapita)
0.02
0**
(0.008
)Fed
eral
judge
san
dprosecu
tors
9Ginico
efficien
t�0
.081
(0.061
)Municipal
characteristics
YY
YY
YY
Statefixe
deffects
YY
YY
YY
Mayor’sparty
fixe
deffects
NN
YY
NN
Observations
4,16
94,17
34,11
94,12
24,16
94,17
3R2
0.70
0.70
0.71
0.71
0.70
0.70
Notes.This
Tab
lereportsOLSregressionsin
whichthedep
enden
tvariab
leis
thepercentage
ofvalidvotescast
foraparliam
entary
system
ineach
municipality.
Municipal
characteristicsinclude:
percentage
ofthepopulationlivingin
ruralareas,populationden
sity
(inhab
itan
ts/km
2),
statecapital
dummy,
distance
tothe
statecapital,p
ercentage
ofab
sten
tion,p
ercentage
ofnullvotesan
dpercentage
ofvotescastforthePMDB,thePSD
Ban
dthePTcandidates
inthe19
94presiden
tial
elections.Allregressionsincludestatefixe
deffects.Theregressionsreported
inco
lumns(3)an
d(4)includedummyvariab
lesforthemayors’party
affiliations.
Robust
stan
darderrors
arereported
inparen
theses.**
*,**
and*den
ote
sign
ificance
at10
%,5%
and1%
respectively.
© 2014 Royal Economic Society.
2015] CHOO S I N G TH E F O RM O F GO V E R NM EN T 1999

be explained by the fact that both the quality and efficiency of local institutions tend tobe higher in richer and more equal municipalities.14
Next, at the individual level, I use survey data to analyse the determinants of thevoting intentions for a parliamentary system. The analysis takes into account severalimportant explanatory variables, including household income, level of schooling, ameasure of political ideology and the candidate voted for in the second round ofthe 1989 presidential elections, among other individual characteristics.15 I furthercontrol for whether the person believes that ‘the country would be better off if themilitary returned to power’ and whether the level of his or her trust in congress is‘very low’.
Table 5 presents the estimation results. Column (1) reports estimates of a basic logitregression, showing that household income has a positive effect on the probability thata person votes for a parliamentary system. However, this result must be qualified by thefact that, as shown in column (2), both the magnitude and the significance of theestimated coefficients for each class of income drop considerably as municipal fixedeffects are included in the regression, i.e. the importance of individual incomedecreases as I control for municipal characteristics. This result provides evidence thatthe local economic and institutional environment is, in fact, relevant to determine thevote of citizens. It is also interesting to note that voters who do not trust the congressare less likely to vote for a parliamentary system, whereas individuals who definethemselves as being more ideologically inclined towards the right tend to vote more fora presidential system.
To examine these results in more detail and to understand how these findingsrelated to my previous cross-section estimates, it would be interesting to testwhether a municipality’s income per capita affects the preferences of its citizens,even after controlling for household income. Unfortunately, due to data limitations,I am unable to match the survey micro-data with municipal socio-economic character-istics. As an alternative, I construct a measure of the mean income of municipalities byaveraging the household incomes of all individuals living in the same place. I includethis variable in the regressions as a proxy for income per capita.16
The results reported in column (3) show that a municipality’s mean income impactspositively, and in a statistically significant manner, the likelihood that an individualvotes for a parliamentary system. Hence, poor households in rich municipalities are,indeed, more likely to vote for a parliamentary system than poor households in poor
14 See Knack and Keefer (1995) and Chong and Gradstein (2007) for some evidence in this direction. InBrazil, Pinheiro and Cabral (1999) report that members of local courts tend to be less qualified in poorerregions, citing the case of a judge who still used revoked legislation as basis for his decisions.
15 The other individual characteristics included in the regressions were as follows: gender, age, agesquared, two dummy variables indicating whether the person knows the name of the president and the nameof the state’s governor and four dummy variables indicating whether the person is religious, favours abortion,favours the death penalty and serves in local communities.
16 Specifically, I use information on the income class of each subject to define a variable Yim for individual iin municipality m that assumes value 1 if the household income is below 2 minimum wages, 2 if thehousehold income is in between 2 and 5 minimum wages, 3 if the household income is in between 5 and 10minimum wages, 4 if the household income is in between 10 and 20 minimum wages and 5 if the householdincome is above 20 minimum wages. The mean income of a municipality is defined as �Ym ¼ ðPi YimÞ=Nm ;where Nm is the number of individuals sampled in municipality m. There are, in total, 122 municipalities inmy sample and, on average, 38.7 people were interviewed in each place.
© 2014 Royal Economic Society.
2000 TH E E CONOM I C J O U RN A L [ D E C E M B E R

municipalities. In column (4), I add the logarithm of the number of people sampled ineach place to control for possibly correlated unobservable characteristics of munici-palities, such as population size and regional importance. Note that the estimatedcoefficient on mean income remains statistically significant and actually increases inmagnitude. The marginal effects of this latter regression are reported in column (5).These results imply that moving an individual from the municipality with thelowest mean income in the sample to that with the highest mean income wouldincrease the probability that he or she voted for a parliamentary system by 27.3%� (5�1.20) 9 7.2%.
Finally, I proceed to examine the main reasons behind the vote of Brazilian citizensin the referendum. Figure 8 presents the results of a survey which asked individualswhy they would not vote for a parliamentary system. The most frequent reason was that
Table 5
Survey Data
Dependent variable:parliamentary system (0/1)
Logit Marginaleffects
(1) (2) (3) (4) (5)
Household income: 2–5 �0.0003 �0.015 �0.070 �0.078 �0.013minimum wages (0.161) (0.170) (0.164) (0.164) (0.027)
Household income: 5–10minimum wages
0.410*** 0.335* 0.295* 0.282* 0.050(0.160) (0.175) (0.168) (0.169) (0.031)
Household income: 10–20minimum wages
0.437** 0.328 0.251 0.245 0.044(0.190) (0.204) (0.200) (0.201) (0.038)
Household income: >20minimum wages
0.660*** 0.533** 0.459* 0.461** 0.088*(0.219) (0.240) (0.235) (0.235) (0.049)
Municipality’s mean income 0.341** 0.420*** 0.072***(0.148) (0.164) (0.028)
Log (people interviewed inthe municipality)
�0.107 �0.018(0.079) (0.013)
Ideology: from left to right(scale 0–10)
�0.051** �0.052** �0.049** �0.049** �0.008**(0.022) (0.022) (0.022) (0.022) (0.003)
Trust in the congress: very low �0.211* �0.247** �0.235** �0.235** �0.039**(0.115) (0.119) (0.117) (0.117) (0.019)
Do you think that the countrywould be better off if themilitary returned topower? Yes
0.141 0.129 0.133 0.135 0.023(0.112) (0.116) (0.115) (0.115) (0.020)
Individual characteristics Y Y Y Y YMunicipality fixed effects N Y N N NState fixed effects N N Y Y Y
Observations 2,178 2,084 2,150 2,150 2,150
Notes. This Table reports logit regressions in which the dependent variable is a dummy indicating whether theindividual intended to vote for a parliamentary system. The data used in this analysis consist of an opinionsurvey conducted by the Datafolha Institute on 28 March 1993. Individual characteristics include: level ofschooling, gender, age, age squared, two dummy variables indicating the candidate voted in the secondround of the 1989 presidential elections (Fernando Collor de Mello or Luis Inacio Lula da Silva), two dummyvariables indicating whether the person knows the name of the president and the name of the state’sgovernor and four dummy variables indicating whether the person is religious, favours abortion, favoursdeath penalty and serves in local communities. Column (5) reports the marginal effects corresponding to thelogit estimates in column (4). ***, ** and * denote significance at 10%, 5% and 1% respectively.
© 2014 Royal Economic Society.
2015] CHOO S I N G TH E F O RM O F GO V E R NM EN T 2001

‘citizens do not have the right to elect the leader and/or the members of theparliament are the ones who choose’, which amounts to 28% of the subjects whoreported not voting for this alternative. Furthermore, when the sample is restricted tothe subgroup of informed voters, following the same criteria defined above, thepercentage of individuals dissatisfied with the lack of direct elections increases to 41%,while the fact that ‘the congress is corrupt’ was pointed out by 12% as the main reasonfor rejecting this alternative.
As discussed before, a sense of dissatisfaction with congress and the political class ingeneral was widespread among voters and played a crucial role in shaping the results ofthe referendum. I find abundant anecdotal evidence in this direction. As a reader ofthe newspaper Folha de Sao Paulo put it in a letter to the editor: ‘the referendumbecame a judgement of the congress’. Interestingly, other topics frequently high-lighted by previous research, such as political stability and size of government, were notnearly as prominent in public debates. That the trust in congress should affect thepreferences over presidential and parliamentary systems seems intuitive but the case ofBrazil makes it clear that this element may be of first-order importance in the contextof developing countries and recent democracies.
In The Parliamentary System there Are Several People Ruling
The Congress Is Corrupt
Do Not Know How The ParliamentarySystem Works
Do Not Know Why Would Not VoteFor The Parliamentary System
Citizens Do Not have The Right To Elect The Executive Leader./The Members Of The
Parliament Are The Ones Who Choose
0 0.1 0.2 0.3 0.4 0.5
Informed Individuals Full Sample
Fig. 8. Why Not a Parliamentary System? Common ReasonsNotes. This Figure reports the most common reasons mentioned by voters when asked why theywould not vote for a parliamentary system. The subsample of informed individuals consists ofthose subjects who were able to correctly identify (in spontaneous answers) at least twodifferences between presidential and parliamentary systems. The data used in the analysis consistof an opinion survey conducted by the Datafolha Institute on 3 March 1993.
© 2014 Royal Economic Society.
2002 TH E E CONOM I C J O U RN A L [ D E C E M B E R

1.3. Discussion
My analysis of the Brazilian referendum has established the existence of important andsystematic differences in voting patterns across population groups. From a theoreticalpoint of view, however, it remains unclear why different people would have distinctpreferences over the form of government and, in particular, why poor citizens shouldbe more inclined towards a presidential system. Although there have been severalrelated studies in the recent political economy literature (Persson et al., 1997, 2000;Robinson and Torvik, 2013), none of them is able to fully account for the stylised factspresented above. In a sense, the evidence from Brazil is quite puzzling. For instance,many critics of presidentialism have pointed out that this system is inherently less stableand more prone to coups (Linz, 1978; Stepan and Skach, 1993), whereas Persson et al.(2000) and Persson and Tabellini (2004) have argued that re-distribution is largerunder parliamentarism, which is especially beneficial to the poor population. Fromthis perspective, and particularly after a long period of military dictatorship (1964–85),it would have been reasonable to expect that Brazilian voters, especially the poor,would have been more supportive of the parliamentary alternative. Why, then, is thereexactly the opposite in the data?
2. Model
This Section proposes a model to study and compare the performance ofpresidential and parliamentary systems. The analysis focuses on the fundamentaldifference between these two regimes: while in presidential systems the executiveleader is directly elected by voters and has a fixed term in office, in parliamentarysystems the executive leader is appointed by the parliament and may be replaced ifhe receives a vote of no confidence. The model highlights the main trade-offsinvolved in the choice between these two forms of government. I use this frameworkto examine the factors that influence the preferences of different population groupsbetween these alternatives. My analysis concentrates primarily on explainingdifferences in voting behaviour across constituencies, although some of its maininsights could be used to explain part of the variation in individual voting behaviouras well.
2.1. Basic Setup
I consider a moral hazard model with a single period. Following Acemoglu andRobinson (2001, 2006), society is composed of two groups of voters, the ‘poor’ and the‘rich’, indexed, respectively, by superscripts p and r. The population is distributed overn constituencies or localities, each consisting of a continuum of agents of the samegroup (i.e. citizens are either all poor or all rich) with measure 1.17 The number of
17 Note that it would be possible to allow for income heterogeneity within each locality. In fact, what isneeded in the model is simply the existence of a median voter in each constituency as well as in the society asa whole. The present framework does not yield many predictions about income inequality. The homogeneityassumption is, therefore, imposed for simplicity and guarantees that there are only two types ofconstituencies in the society, one where everybody is poor and one where everybody is rich.
© 2014 Royal Economic Society.
2015] CHOO S I N G TH E F O RM O F GO V E R NM EN T 2003

poor and rich constituencies is given by np and nr, with np > nr. I use the term‘constituency’ to refer broadly to a group of voters, distinguished by its geographicallocation, which serves as an electoral base for a representative. This structure appliesnaturally to the case where a majoritarian system (winner take all) is in place but alsocaptures essential features of a proportional representation system with open partylists, given that candidates usually target specific groups of voters in a certainregion.18,19
The utility function of each individual i is given by:
Ui ¼ 1� sð Þyi þ 1
a‘ai �
1
2ðx � hiÞ2; (1)
where s 2 [0, 1] is a common tax rate, yi is the income level, ‘i ≥ 0 represents theprovision of a local public good in individual i’s constituency (e.g. investment ineducation), x 2 R is the position of a national public policy (e.g. a reform of the socialsecurity system) in the ideological space and hi 2 {hL, hH} denotes the agent’spreference over x, with D � hH � hL > 0. The parameter a is such that 0 < a < 1,which guarantees that the utility function is strictly increasing and concave in ‘i. Isuppose that the members of each group are identical in all respects. The poor votershave income yp and preference hp 2 {hL, hH}, whereas the rich have income yr, withyr > yp, and preference hr 2 {hL, hH}. The average income is normalised to unity,�y ¼ ðnpyp þ nr yr Þ=n ¼ 1.The population is represented by n + 1 elected officials, one executive leader, e, and
n legislators, l 2 {1, . . ., n}, elected in their respective constituencies. The utilityfunction of each officeholder j (executive leader and legislators) is given by:
Vj ¼ sj � 1
2ðx � hjÞ2; (2)
where sj ≥ 0 represents the amount of rents expropriated by officeholder j andhj 2 {hL, hH} denotes his preference parameter.
The vector of policies is given by fx; ðs; u; seÞ; ½ð‘i ; siÞ�ni¼1g and consists of a set ofvariables determined through the political process. The public policy x and the budgetpolicy (s, u, se) are decided at the national level and must satisfy the aggregate budgetconstraint:
nuþ se � ns; (3)
18 The geographic concentration of votes for legislators is a well-documented phenomenon in manycountries that adopt multi-member district systems, e.g. Brazil (Fleischer, 1976; Ames, 1995, 2001), Colombia(Crisp and Ingall, 2002; Crisp and Desposato, 2004) and Japan (Hirano, 2006). Formally, Myerson (1993)shows that such systems encourage candidates to cater to narrow sub-constituencies (favoured minorities).The intuition for this result is that appealing to larger fractions of the electorate makes the candidate‘vulnerable’ to an opponent who is only targeting the minimum number of voters required to win elections.
19 Ames (1995), in his analysis of the Brazilian electoral system, remarks that ‘legally, candidates may seekvotes everywhere in their states, but in reality many concentrate their campaigns geographically, finding mostof their support in one or more contiguous regions, regions popularly referred to as ‘electoral strongholds’(redutos eleitorais). Why concentrate on a specific area? For diverse reasons: the candidates’ families havelong held power in the region; a party leader sent them to the area; they appeal to its voters; they make a dealwith a local political leader’.
© 2014 Royal Economic Society.
2004 TH E E CONOM I C J O U RN A L [ D E C E M B E R

where u represents a lump-sum transfer common to all constituencies and se is theamount of rents expropriated by the executive leader.20 At the local level, transfers areallocated between the provision of local public goods, ‘i, and political rents to the locallegislator, si, subject to the following budget constraint:
‘i þ si �u: (4)
I assume that the politicians cannot commit to policy platforms prior to elections.This creates a moral hazard problem in that once in office they will have an incentive toimplement the best policies for themselves. As in Persson et al. (1997, 2000), voters areable to discipline their representatives only ‘retrospectively’ by threatening not tore-elect them at the end of the period. The executive leader and the legislatorsare assumed to receive, respectively, exogenous rewards xE ≥ 0 and xL ≥ 0 whenre-elected. These parameters capture, in a reduced-form fashion, the benefitsassociated with continuing in office and remaining popular with voters, which include‘ego rents’, legacy motives and future rents.
2.2. Preference Structure
I assume that the preference of the poor citizens is always given by hp = hL. At thebeginning of the period, the rich voters’ type is realised with Pr(hr = hL) = q, where theparameter q can be interpreted as a measure of social homogeneity. After that,the government is formed with all officeholders aligned with the preferences of theirrespective constituencies: the executive leader has the same type as the median (poor)voter, he = hL, and the legislators have the same preference as the members of theirconstituencies, i.e. the legislators representing the poor have type hL, whereas thoserepresenting the rich have type hr.
A preference shock then occurs with probability ξ 2 (0, 1) and may change thepreferences of all officeholders. Each politician, executive leader or legislator, remainsaligned with their constituencies with probability p 2 (0, 1), where the parameter pcan be interpreted as a measure of the quality of political representation in the society.After the occurrence of the shock, there are four possible scenarios relevant to theanalysis, two in which the preferences of the executive leader and the median legislatorare the same, he ¼ hlm , and two in which they are different, he 6¼ hlm . I suppose thatthe officeholders’ new types are drawn independently from each other and that thepreferences of the executive leader and the median legislator are observed byeveryone. Note that, as all shocks are independent, nothing would change in themodel if I allowed for a change in the voters’ preferences, provided thatPr(hp = hr) = q and that, after the shock, the officeholders remain aligned with theirconstituencies with probability p.
20 The assumption that transfers are common across constituencies can be interpreted as capturing therestrictions imposed by a ‘federalist pact’ on how resources can be distributed among voters. Note that myframework still allows for re-distribution towards the poor, as taxation is proportional to income. If transferswere allowed to be targeted by groups, then the rich would always receive zero resources in any equilibrium.The model could be extended to incorporate some degree of ‘targeting’, in addition to the lump-sumtransfers, without changing my main insights.
© 2014 Royal Economic Society.
2015] CHOO S I N G TH E F O RM O F GO V E R NM EN T 2005

This structure is intended to capture an environment in which the relevant policyissue becomes known only after the government is formed, due to uncertainty aboutthe future state of the world. The preference shock, thus, reflects the possibility ofchanges in current economic and political conditions combined with the fact thatelected officials may not be aligned with the interests of their constituencies in everypolicy dimension. Furthermore, the assumption that the preferences of the executiveleader and the median legislator are observed after the shock captures the idea thattheir stance on some main political issues is known from public speeches, debates andinterviews as well as from their past career and background.
2.3. Political Structure
The government is divided into two branches, the executive and the legislative, eachresponsible for a distinct but complementary role in the policy-making process. Thelegislative assembly is composed of n members elected in their constituencies, whereasthe executive is composed of a single member whose appointment process depends onthe form of government. Specifically, in a presidential system the president is electedand held accountable directly by the voters, whereas in a parliamentary system theprime minister is appointed and held accountable by the members of the parliament,who can remove him through a vote of no confidence.
After the uncertainty over preferences is resolved, the executive leader is called uponto make a proposal ~q ¼ ½~x; ð~s; ~u; ~seÞ�, which consists of a public policy ~x and a budgetpolicy ð~s; ~u; ~seÞ. The proposal is then submitted to the legislature, where represen-tatives vote separately on ~x and ð~s; ~u; ~seÞ. This structure captures both the de jure andthe de facto agenda-setting powers held by the executive leader under each regime.21
Furthermore, the assumption of a separate vote on each issue is consistent with thecommon practice in most legislatures, where distinct bills, such as a budget proposaland a reform of the health-care system, are discussed and voted on independently.
The legislative process differs across the two systems. In the presidential regime, eachelement of the proposal is approved if supported by a majority of legislators.Otherwise, a default public policy xo = (hL + hH)/2 is implemented when ~x is rejected,whereas a default budget ðso ; uo ; soe Þ is adopted when ð~s; ~u; ~seÞ is rejected. In theparliamentary regime, on the other hand, after observing the proposal, the membersof the parliament vote on a motion of no confidence on the executive. Intuitively, inthis case, the policy vector ~q can be interpreted as the leader’s ‘programme ofgovernment’. If the vote of no confidence is rejected, the prime minister remains inoffice and the proposal is implemented. Otherwise, a new executive leader e 0 is
21 Indeed, the majority of the bills in parliamentary systems are initiated by the cabinet, whereas manypresidential democracies provide substantial agenda-setting powers to their executive governments(Mainwaring and Shugart, 1997). Even in the US, where the president has only limited authority to proposebills, the executive often plays a fundamental role in shaping legislation. An example of this can be found inthe conduct of the Obama administration during the negotiations over the health-care reform. According toan article in the New York Times, ‘in pursuing his proposed overhaul of the health care system, PresidentObama has consistently presented himself as aloof from the legislative fray, merely offering broad principles.(. . .) Behind the scenes, however, Mr. Obama and his advisers have been quite active, sometimes negotiatingdeals with a degree of cold-eyed political realism potentially at odds with the president’s rhetoric’ (New YorkTimes, 13 August 2009).
© 2014 Royal Economic Society.
2006 TH E E CONOM I C J O U RN A L [ D E C E M B E R

appointed and given the chance to make another policy proposal ~q0, which is thenvoted on against the status quo, as in a presidential system.22
I assume that the new prime minister is chosen among a pool of candidates fromoutside the parliament and that the majority of legislators is able to select an agent withthe same preference as their own.23 As I shall discuss below, the cases in which the voteof no confidence can make a difference are those where the preferences of theexecutive leader and the median legislator are misaligned, he 6¼ hlm . The new primeminister is not subject to a confidence procedure but is held accountable by legislatorswho decide, by majority rule, whether to re-appoint him or not at the end of theperiod. The assumption of a single vote of no confidence is in line with the fact thatmany parliamentary democracies impose a limit on the number of censure motionsthat can be proposed in a given period. It also captures the idea that most politicalissues require that a decision be reached in a timely manner to avert an imminent crisisor so that the policy itself does not lose its effectiveness, in which case a vote against thegovernment would be equivalent to maintaining the status quo.
After the legislative process is completed, a vector of policies [x, (s, u, se)] isadopted under both systems and each legislator decides how to allocate the transfersreceived by his constituency between the provision of local public goods, ‘i, andexpropriation of rents, si. Voters observe the policies [x, (s, u, se)] and (‘i, si) as theyare implemented. At the end of the period, they decide, by majority rule, whether tore-elect or not their representatives and the president.
A strategy for citizens is a ‘retrospective voting rule’, which specifies the conditionsunder which an incumbent will receive their electoral support at the time of elections.I impose that, in equilibrium, any voting rule must be credible (i.e. satisfy subgameperfection) in the sense that voters will not have an incentive to re-optimise theirstrategies in later stages of the game, as additional information becomes available. It isalso assumed that a prime minister who receives the confidence of the parliament isalways re-appointed, while the ‘second’ prime minister is held accountable by thelegislators and depends on their political support at the end of the period to remain inoffice (i.e. the legislators decide whether to re-elect him or not). Intuitively, the newprime minister has his proposal voted on only against the status quo and, as aconsequence, does not receive the ‘full’ confidence of the parliament.
2.4. Accountability Institutions
Finally, I describe the role of the accountability institutions in this framework. First, it isassumed that when a legislator i is not re-elected, voters are able to recover theexpropriated resources, si, with probability ki 2 (0, 1), where the parameter ki can beinterpreted as a measure of the quality of local institutions. I suppose that the level ofinstitutional protection in poor and rich constituencies is distinct, with kr > kp. This
22 I discuss a model of a presidential system with impeachment in online Appendix A to this study.Intuitively, the possibility of an impeachment process makes presidentialism more attractive. I show that themain insights of the analysis are robust to this change.
23 The assumption that the new prime minister is selected from outside the parliament is in line with thenotion of a caretaker technocratic government taking office after the fall of the cabinet.
© 2014 Royal Economic Society.
2015] CHOO S I N G TH E F O RM O F GO V E R NM EN T 2007

heterogeneity generates a variation in the ability of voters to constraint expropriationat the local level, so that corruption constitutes a greater burden to the poor than tothe rich. This feature of the model is in accordance with recent empirical evidence byFerraz and Finan (2008, 2011), who emphasise the role of the local media inrestraining corruption in Brazilian municipalities. Similarly, I assume that when theexecutive leader is not re-appointed, the expropriated resources, se, are recovered withprobability �k 2 ð0; 1Þ, where the parameter �k captures the quality of nationalinstitutions (e.g. federal prosecutors and the national media) which provide commonprotection to the population as a whole.
Observe that the assumption that both national and local institutions act only whenan officeholder is ousted from power is in accordance with the fact that a thoroughinvestigation of a corruption scandal may be hindered either because the politician,while in office, is in a privileged position to manipulate evidence or due toconstitutional immunities that are often granted to officeholders. In any case, allqualitative results of the model would remain unchanged as long as the probabilitywith which a politician is prosecuted is higher when he is not in office.
The analysis also assumes that the quality of accountability institutions isexogenous. This assumption is consistent with the fact that institutions tend to bepersistent over time and, therefore, relatively stable in the short and medium run.Naritomi et al. (2012) show that the quality of local institutions across Brazilianmunicipalities is determined, in part, by their colonial histories. In particular, theyprovide evidence that municipalities with origins tracing back to the gold colonialcycle (characterised by heavily inefficient state intervention) have nowadays lowerincome per capita as well as worse governance practices and less access to justice. Ageneral analysis of the determinants of local institutional quality is much beyond thescope of this study. However, it is possible to think of a simple model whereinstitutions are determined, as in Acemoglu (2003), by a bargaining game betweencitizens and local politicians. Under the assumption that the relative bargaining powerof citizens is increasing in income, the quality of local institutions would indeed beworse in poor constituencies.
2.5. Timing
To summarise, the timing of the events under a presidential system is as follows:
(1) At the beginning of the period, government is formed: the executive leaderhas the same preference as the median (poor) voter and the legislators havethe same preference as the members of their constituencies.
(2) A preference shock occurs with probability ξ and may change the preferencesof the executive leader, he, and the median legislator, hlm .
(3) The executive leader makes a policy proposal ~q ¼ ½~x; ð~s; ~u; ~seÞ�:(4) The congress votes separately on ~x and ð~s; ~u; ~seÞ. Each element of the
proposal is approved if supported by a majority in congress. Otherwise, adefault public policy xo = (hL + hH)/2 is implemented when ~x is rejected,whereas a default budget ðso ; uo ; soe Þ is implemented when ð~s; ~u; ~seÞ isrejected.
© 2014 Royal Economic Society.
2008 TH E E CONOM I C J O U RN A L [ D E C E M B E R

(5) Each constituency i receives a transfer u, and the local legislator decides howto allocate it between local public goods, ‘i and political rents, si.
(6) Elections are held and voters decide whether to re-elect their representativesand the president.
The timing of the events under a parliamentary system is similar, except that stages(4) and (6) are replaced by:
(4 0) The parliament votes on a motion of no confidence on the executive. If thevote of no confidence is rejected, the prime minister remains in office and theproposal is implemented. Otherwise, a new executive leader e 0 is appointedand given the chance to make another proposal ~q0, which is then voted onagainst the status quo.
(60) Elections are held and voters decide whether to re-elect their representatives.A prime minister who receives the confidence of the parliament is automat-ically re-appointed, while the ‘second’ prime minister depends on the supportof the legislators to stay in office (i.e. the legislators decide whether to re-electhim or not at the end of the period).
3. Equilibrium
This Section solves for a subgame-perfect Nash equilibrium of the model. I proceedby backward induction, starting in subsection 3.1 with an analysis of the finalsubgame, which is common to both systems of government. The presidentialregime is, then, discussed in subsection 3.2 and the parliamentary regime insubsection 3.3.
3.1. Local Politics
After the vector of policies q = [x, (s, u, se)] is approved and observed by all, eachconstituency receives a transfer u and the local legislator decides how to allocate itbetween the provision of local public goods and the expropriation of rents. When thelegislator decides not to pursue re-election, his optimal strategy is to expropriate allresources, in which case he obtains (1 � ki)u in expected utility. Therefore, given theamount of transfers u received, voters in each constituency formulate their re-electionrules so as to minimise the amount of rents expropriated by legislator i according tothe following problem:
min sisi � 0
(5)
s:t:‘i þ si � u ðBCiÞ
si þ bxL �ð1� kiÞu ICið Þ
(
where b 2 (0, 1) is the discount factor. The incentive compatibility constraint (ICi)guarantees that the legislator prefers to pursue re-election rather than to implementhis outside option. At the optimum, both the budget and the incentive constraint must
© 2014 Royal Economic Society.
2015] CHOO S I N G TH E F O RM O F GO V E R NM EN T 2009

bind, so that:
siðuÞ ¼ max½ð1� kiÞu� bxL; 0� (6)
and
‘iðuÞ ¼ u�max½ð1� kiÞu� bxL ; 0�: (7)
Intuitively, (7) determines the minimum amount of local public goods demanded byvoters to re-elect their representatives. In equilibrium, policies are always adoptedaccording to these expressions and all the legislators are re-appointed.
Observe that political rents are equal to zero when u ≤ bxL/(1 � ki). Thus, tosimplify the analysis, and to avoid uninteresting cases, I assume that the status quotransfer is such that uo > bxL/(1 � kp), which guarantees that the amount of rentsextracted by any legislator representing the poor is always strictly positive. Observe thatthis condition can be re-expressed as xL < (1 � kp)uo/b, which requires that there-election rewards of legislators are not too high.
ASSUMPTION 1. xL<(1�kp)uo/b.
An important feature of the present framework is that legislators are heldaccountable for their behaviour at the local level, despite the fact that they alsoperform other actions prior to this stage. Note that any subgame-perfect equilib-rium requires that, once transfers u are observed, the optimal re-election strategy ofvoters must be given by the solution to Problem (5) above. This renders any othervoting rule non-credible, as voters would always have an incentive to re-optimisetheir strategies after transfers become known. The idea that representatives are heldaccountable for their local behaviour is particularly reasonable in an environmentwhere citizens do not have access to the individual voting record of theirrepresentatives, either due to a low degree of political awareness or a lack ofcongressional transparency.24
3.2. Presidential System
This subsection characterises the policies implemented under a presidential system ofgovernment, taking as given that the rents expropriated by legislators and theprovision of local public goods are determined, respectively, by (6) and (7) derivedabove.
3.2.1. Legislative processSuppose that a proposal ~q ¼ ½~x; ð~s; ~u; ~seÞ� has been submitted to congress. Observethat it is dominant for each legislator l to vote in favour of the budget proposal
24 According to Ames (1995, p. 341), ‘Brazilian citizens exert pressure for pork-barrel programs, but onbroader issues they have little control over their representatives. This should come as no surprise, because noone observing a Brazilian election would feel confident that many voters know anything at all about thepositions of their deputies’. Moreover, even in the case of highly developed countries such as Japan, severalstudies have documented that a considerable fraction of the electorate vote exclusively on the basis of localand parochial interests (Richardson, 1997).
© 2014 Royal Economic Society.
2010 TH E E CONOM I C J O U RN A L [ D E C E M B E R

ð~s; ~u; ~seÞ, if and only if sl ð~uÞ � sl ðuoÞ. Under Assumption 1, it must be that sp(uo) > 0,so that the amount of rents extracted by the legislators representing the poor is positiveand strictly increasing in transfers. Thus, the condition for the approval of ð~s; ~u; ~seÞ isgiven by:
~u�uo : (8)
Similarly, the public policy ~x is approved in congress if, and only if, a majority oflegislators prefers it to the status quo, xo = (hL + hH)/2, which requires that:
� 1
2ð~x � hlm Þ2 � � D2
8; (9)
where hlm 2 fhL; hHg denotes the preference of the median legislator lm . The abovetwo conditions are referred to as the ‘approval constraints’.
The assumption that the default public policy is given by xo = (hL + hH)/2simplifies the analysis of the model by making the value of the status quo the samefor both types of legislators. The results are robust to different specifications of thedefault policy, provided that xo is not too close to either hL or hH. Intuitively, theapproval constraint creates a link between the status quo and the equilibriumpolicies under presidentialism. Specifically, the closer xo is to either hL or hH, thenearer the implemented policies will tend to be to hL or hH respectively. Hence, inthe extreme case where the status quo is very close to hL (or hH), the policiesadopted in equilibrium would also tend to be very good (bad) for the poor voters.This result, however, would merely reflect the particular choice of status quo ratherthan other more fundamental characteristics of a presidential system, such asthe existence of direct elections, as shall be discussed below. I, therefore, focus theanalysis on the more interesting case where the default policy is not ‘too good’ forboth types of agents, so that the results are not entirely driven by the approvalconstraint.
3.2.2 Incentive constraint on the presidentAfter the occurrence of the preference shock, the executive leader is called upon tomake a proposal ~q: The president is held accountable by the voters but always has theoption to give up re-election and propose a policy that maximises his utility subject tothe budget constraint, (3), and the conditions for congressional approval, (8) and (9).In this case, the president sets s = 1 and u = uo, which gives him nð1 � �kÞð1 � uoÞ inexpected utility. Furthermore, when he ¼ hlm , he is able to approve his preferred policyx = he, whereas when he 6¼ hlm , he is able to obtain at most xo = (hL + hH)/2, due to theopposition of congress.
Therefore, to induce the president to pursue re-election, voters must satisfy thefollowing incentive compatibility constraint:
se � 1
2x � heð Þ2þ bxE � nð1� �kÞð1� uoÞ � 1 he 6¼hlmf g
D2
8; (10)
where 1fhe 6¼ hlm g is an indicator function that equals 1 when the preferences of thepresident and the median legislator are misaligned. I assume that j � nð1 � �kÞð1 � uoÞ � bxE [ 0, which guarantees that the amount of rents obtained by the
© 2014 Royal Economic Society.
2015] CHOO S I N G TH E F O RM O F GO V E R NM EN T 2011

executive leader is always strictly positive, se > 0, in equilibrium. Intuitively, thiscondition requires that the re-election rewards of the president are not too high.
ASSUMPTION 2. xE\nð1 � �kÞð1 � uoÞ=b:
3.2.3 EquilibriumThe poor voters constitute the majority of the population and are, therefore, decisivefor the re-appointment of the president. Thus, given the realisation of the politicians’preferences, he and hlm , they formulate their re-election strategies so as to maximisetheir utilities according to the following problem:
maxx2R;ðs;uÞ2½0;1�2
ð1� sÞyp þ 1
a‘pðuÞa � 1
2x � hLð Þ2 (11)
s.t. ð3Þ; ð8Þ; ð9Þ and ð10Þ:The main properties of the equilibrium are summarised in Lemma 1.25
LEMMA 1. The equilibrium under a presidential system is characterised by the followingproperties:
(i) The tax rate may be lower than 1, s ≤ 1, especially when the quality of institutions inpoor constituencies is low.
(ii) The size of transfers is (weakly) increasing in the quality of institutions in poorconstituencies, kp, and (weakly) decreasing in the poor voters’ income, yp. Furthermore,transfers are always such that u ≤ 1 � j/n.
(iii) The amount of rents extracted by the executive leader is such that se ≥ j, with strictinequality when he = hH.
(iv) For any type of median legislator, the distance jx � hLj is largest when the president ismisaligned with the preference of the poor population, i.e. he = hH.
In a presidential system, the existence of direct elections for the executive branchprovides an institutional mechanism for the poor to influence policies according totheir interests. In particular, the size of the taxes and transfers ‘demanded’ by thepopulation depends both on the cost of taxation and on how effectively the resourcescan be converted into local public goods. Formally, the optimal transfers are such that:
u ¼ max uo ; uf g;where (assuming that the constraint s ≤ 1 is not binding) u is implicitly determined by:
‘pðuÞa�1kp ¼ yp : (12)
Therefore, in equilibrium, transfers are:
(i) (weakly) increasing in the quality of institutions available to the poor, kp,which reduces the expropriation at the local level; and
25 All proofs for this study are collected in online Appendix B.
© 2014 Royal Economic Society.
2012 TH E E CONOM I C J O U RN A L [ D E C E M B E R

(ii) (weakly) decreasing in the poor voters’ income, yp, which raises the cost oftaxation for the members of this group.26
An important drawback associated with direct elections is that they impose a limit onthe frequency with which voters are able to check the government, so that a misalignedpresident, he = hH, can never be removed from office before the end of his term. Theexecutive leader is, therefore, in a strong position to push for outcomes that arefavourable to himself and, as a consequence, is able to extract more rents and to distortthe public policy towards his preference.
Observe that, from the incentive compatibility constraint, (10), it follows thatpolitical rents are given by:
se ¼ jþWð~x; hÞ, (13)
where Wð~x; hÞ ¼ ð~x � heÞ2=2� 1fhe 6¼hlm gD2=8 is the amount of rents that must be paid
above j to incentivise the president to propose a public policy ~x. When the executiveleader is aligned with voters, he = hL, the equilibrium entails x = hL when hlm ¼ hL andx = (hH + hL)/2 when hlm ¼ hH , so that Ψ(x; h) = 0 in both cases. A misalignedexecutive leader, on the other hand, must be paid additional rents to propose a policythat is closer to the voters’ preference. The size of these rents is given by:
Wð~x; hÞ ¼ 1
2ð~x � hH Þ2 � 1 he 6¼hlmf g
D2
8: (14)
At the optimum, voters choose ~x to equalise the marginal benefit of reducing thedistance j~x � hLj and the marginal cost of having to provide extra rents for thepresident. Therefore, se ≥ j, with strict inequality when he 6¼ hL, and from the budgetconstraint it follows that u ≤ 1�j/n.
3.3. Parliamentary System
I now proceed to characterise the vector of policies implemented under a parliamen-tary system of government. As before, the rents expropriated by legislators and theprovision of local public goods are determined, respectively, by (6) and (7) derivedabove.
3.3.1 Legislative processSuppose that a programme of government ~q ¼ ½~x; ð~s; ~u; ~seÞ� has been proposed by theprime minister. The members of the parliament vote on a motion of no confidence onthe executive. If the vote of no confidence is rejected, the prime minister remains inoffice and the proposal is implemented, in which case each legislator obtains:
Vl ¼ sl ð~uÞ � 1
2ð~x � hlÞ2: (15)
If, on the other hand, the motion of no confidence is approved, a new primeminister e 0 is selected, with a preference equal to that of the median legislator,
26 Note that these results are ‘weak’ given the possibility that u\uo .
© 2014 Royal Economic Society.
2015] CHOO S I N G TH E F O RM O F GO V E R NM EN T 2013
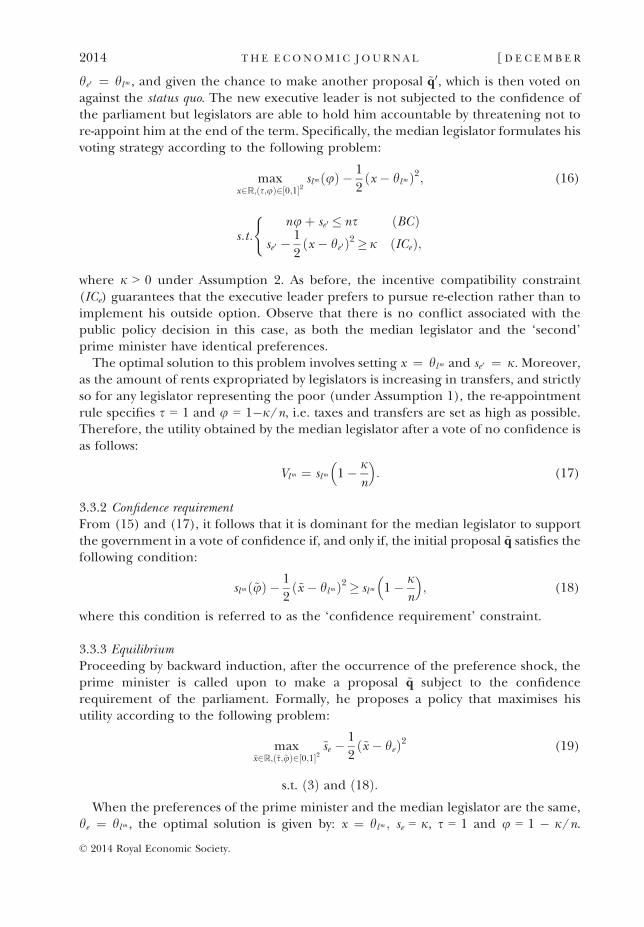
he 0 ¼ hlm , and given the chance to make another proposal ~q0, which is then voted onagainst the status quo. The new executive leader is not subjected to the confidence ofthe parliament but legislators are able to hold him accountable by threatening not tore-appoint him at the end of the term. Specifically, the median legislator formulates hisvoting strategy according to the following problem:
maxx2R;ðs;uÞ2½0;1�2
slm ðuÞ � 1
2ðx � hlm Þ2; (16)
s:t:nuþ se 0 � ns BCð Þ
se 0 � 1
2ðx � he 0 Þ2 � j ðICeÞ;
(
where j > 0 under Assumption 2. As before, the incentive compatibility constraint(ICe) guarantees that the executive leader prefers to pursue re-election rather than toimplement his outside option. Observe that there is no conflict associated with thepublic policy decision in this case, as both the median legislator and the ‘second’prime minister have identical preferences.
The optimal solution to this problem involves setting x ¼ hlm and se 0 ¼ j. Moreover,as the amount of rents expropriated by legislators is increasing in transfers, and strictlyso for any legislator representing the poor (under Assumption 1), the re-appointmentrule specifies s = 1 and u = 1�j/n, i.e. taxes and transfers are set as high as possible.Therefore, the utility obtained by the median legislator after a vote of no confidence isas follows:
Vlm ¼ slm 1� jn
� �: (17)
3.3.2 Confidence requirementFrom (15) and (17), it follows that it is dominant for the median legislator to supportthe government in a vote of confidence if, and only if, the initial proposal ~q satisfies thefollowing condition:
slm ð~uÞ � 1
2~x � hlmð Þ2 � slm 1� j
n
� �; (18)
where this condition is referred to as the ‘confidence requirement’ constraint.
3.3.3 EquilibriumProceeding by backward induction, after the occurrence of the preference shock, theprime minister is called upon to make a proposal ~q subject to the confidencerequirement of the parliament. Formally, he proposes a policy that maximises hisutility according to the following problem:
max~x2R;ð~s;~uÞ2½0;1�2
~se � 1
2~x � heð Þ2 (19)
s.t. ð3Þ and ð18Þ:When the preferences of the prime minister and the median legislator are the same,
he ¼ hlm , the optimal solution is given by: x ¼ hlm ; se = j, s = 1 and u = 1 � j/n.
© 2014 Royal Economic Society.
2014 TH E E CONOM I C J O U RN A L [ D E C E M B E R

That is, the executive leader simply announces the same policies that would havebeen proposed by his successor had he been defeated in the vote of no confidence.When, on the other hand, the prime minister is not aligned with parliament,he 6¼ hlm , the optimal solution involves a distortion of the reform away from themedian legislator’s preference in exchange for an increase in the size of transfers toconstituencies.
Observe that the ‘relevant’ median legislator for this problem is always arepresentative of the poor. Indeed, the executive leader prefers to seek the supportof legislators from this group, as they are ‘cheaper’ to buy. Intuitively, a representativeof the poor is able to extract more rents out of the same amount of transfers and,therefore, requires fewer resources to support the government whenever x 6¼ hlm .Furthermore, by obtaining the support of the median poor legislator, the primeminister automatically guarantees the votes of all other poor representatives. This isbecause the parliament members with median preference are always the ones whosesupport is most difficult to obtain, given that they hold control over the appointmentof the following government and, as a result, have better outside options.
The main properties of the equilibrium are summarised in Lemma 2.
LEMMA 2. The equilibrium under a parliamentary system is characterised by the followingproperties:
(i) The tax rate is always equal to 1, s = 1.(ii) The size of transfers is such that u ≥ 1�j/n, with strict inequality when he 6¼ hlm .(iii) The amount of rents extracted by the executive leader is such that se ≤ j, with strict
inequality when he 6¼ hlm .(iv) When the executive leader is of type he = hH, the distance jx � hLj is smallest when the
median legislator is aligned with the preference of the poor population, hlm ¼ hL.
In a parliamentary system, the ability to check the executive is delegatedto legislators, who hold the prime minister accountable through the confidenceprocedure. This implies that the members of the parliament are in a strong position topush for higher transfers, which expands their expropriation opportunities at the locallevel. The executive leader, in turn, sets the tax rate at its maximum, both to satisfy thedemands of legislators and to raise his own rents.
At the same time, the vote of no confidence adds flexibility to the parliamentarysystem by providing an institutional mechanism to replace the prime minister beforethe end of his term. A misaligned leader, he 6¼ hlm , must satisfy the demands of theparliament to stay in office and is, therefore, forced to accept a reduction in rentswhenever the public policy is to be distorted away from the median legislator’spreference. Formally, the confidence requirement imposes that:
spð~uÞ ¼ sp 1� jn
� �þ 1
2~x � hlmð Þ2; (20)
where sp(�) is the amount of rents obtained by a legislator representing a poor district.Observe that when ~x 6¼ hlm , it must be that ~u [ 1� j=n and ~se \ j.
© 2014 Royal Economic Society.
2015] CHOO S I N G TH E F O RM O F GO V E R NM EN T 2015

Overall, the confidence procedure strengthens the bargaining power of theparliament considerably. Thus, an important requirement for the parliamentarysystem to perform in accordance with the interests of voters is that the legislative beexpected to represent the preferences of the population with sufficiently highlikelihood. In particular, observe that the vote of no confidence works in favour of thepoor citizens whenever he ¼ hH and hlm ¼ hL. In fact, this is the only case where theconfidence procedure may be used to protect their interests.
4. Main Comparative Results
This Section presents the main comparative results of the analysis. The firstProposition compares the size of taxes, transfers and political rents under bothsystems of government.
PROPOSITION 1. From Lemmas 1 and 2, it follows that:
(i) The tax rate is higher under parliamentary systems:
spres � sparl ¼ 1:
(ii) The size of transfers and the provision of local public goods are higher underparliamentary systems:
upres �uparl and ‘presi � ‘
parli ;
with EðupresÞ\ Eðuparl Þ and Eð‘presi Þ\ Eð‘parli Þ.(iii) The expected amount of rents extracted by legislators is larger under parliamentary
systems:
Eðspresl Þ� Eðsparll Þ;with strict inequality if the legislator represents a poor constituency, while theexpected amount of rents obtained by the executive leader is larger under presidentialsystems:
Eðsprese Þ[ Eðsparle Þ:
Intuitively, in a parliamentary system, the threat of a vote of no confidence allowsthe members of the parliament to push for larger transfers to their constituencies and,as a result, to obtain additional rents for themselves. In a presidential system, on theother hand, the existence of direct elections for the president increases the ability ofvoters to influence policies, which limits the size of transfers and the amount of rentsobtained by legislators, while at the same time allowing the executive leader to extractmore rents. The model emphasises that the balance of powers among agents is distinctunder each regime: the legislative has more control over policies under parliamentarysystems, whereas both voters and the executive leader have more power underpresidential systems. Interestingly, the present analysis shows that not only do directelections strengthen the political influence of voters and the executive, but also thatthese two phenomena are intrinsically connected to each other.
© 2014 Royal Economic Society.
2016 TH E E CONOM I C J O U RN A L [ D E C E M B E R
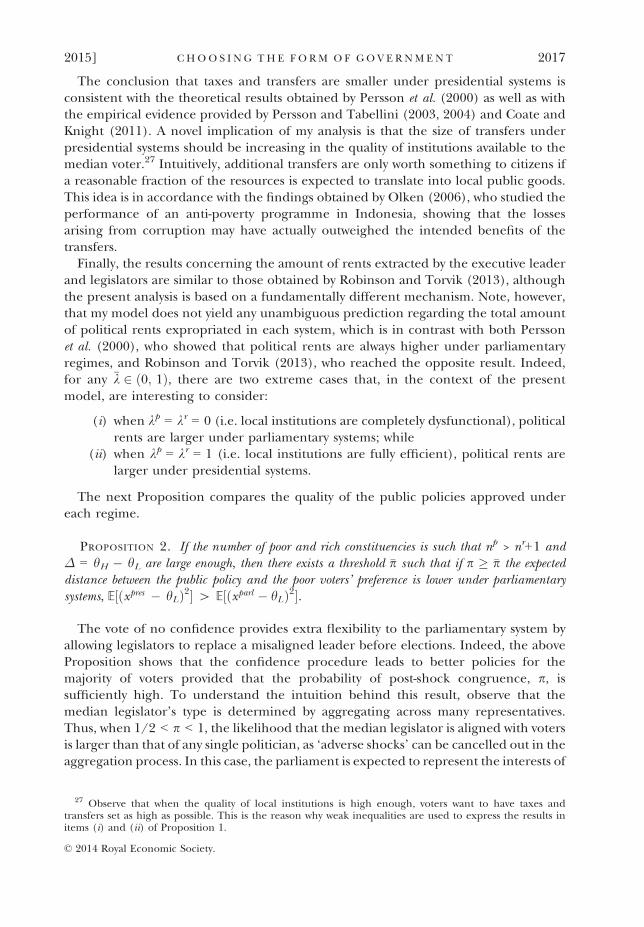
The conclusion that taxes and transfers are smaller under presidential systems isconsistent with the theoretical results obtained by Persson et al. (2000) as well as withthe empirical evidence provided by Persson and Tabellini (2003, 2004) and Coate andKnight (2011). A novel implication of my analysis is that the size of transfers underpresidential systems should be increasing in the quality of institutions available to themedian voter.27 Intuitively, additional transfers are only worth something to citizens ifa reasonable fraction of the resources is expected to translate into local public goods.This idea is in accordance with the findings obtained by Olken (2006), who studied theperformance of an anti-poverty programme in Indonesia, showing that the lossesarising from corruption may have actually outweighed the intended benefits of thetransfers.
Finally, the results concerning the amount of rents extracted by the executive leaderand legislators are similar to those obtained by Robinson and Torvik (2013), althoughthe present analysis is based on a fundamentally different mechanism. Note, however,that my model does not yield any unambiguous prediction regarding the total amountof political rents expropriated in each system, which is in contrast with both Perssonet al. (2000), who showed that political rents are always higher under parliamentaryregimes, and Robinson and Torvik (2013), who reached the opposite result. Indeed,for any �k 2 ð0; 1Þ, there are two extreme cases that, in the context of the presentmodel, are interesting to consider:
(i) when kp = kr = 0 (i.e. local institutions are completely dysfunctional), politicalrents are larger under parliamentary systems; while
(ii) when kp = kr = 1 (i.e. local institutions are fully efficient), political rents arelarger under presidential systems.
The next Proposition compares the quality of the public policies approved undereach regime.
PROPOSITION 2. If the number of poor and rich constituencies is such that np > nr+1 andΔ = hH � hL are large enough, then there exists a threshold �p such that if p � �p the expecteddistance between the public policy and the poor voters’ preference is lower under parliamentarysystems, E½ðxpres � hLÞ2� [ E½ðxparl � hLÞ2�.
The vote of no confidence provides extra flexibility to the parliamentary system byallowing legislators to replace a misaligned leader before elections. Indeed, the aboveProposition shows that the confidence procedure leads to better policies for themajority of voters provided that the probability of post-shock congruence, p, issufficiently high. To understand the intuition behind this result, observe that themedian legislator’s type is determined by aggregating across many representatives.Thus, when 1/2 < p < 1, the likelihood that the median legislator is aligned with votersis larger than that of any single politician, as ‘adverse shocks’ can be cancelled out in theaggregation process. In this case, the parliament is expected to represent the interests of
27 Observe that when the quality of local institutions is high enough, voters want to have taxes andtransfers set as high as possible. This is the reason why weak inequalities are used to express the results initems (i) and (ii) of Proposition 1.
© 2014 Royal Economic Society.
2015] CHOO S I N G TH E F O RM O F GO V E R NM EN T 2017

citizens better than the executive. Finally, to guarantee that the quality of public policiesis indeed higher under parliamentary systems, p must be sufficiently large, so that themedian legislator is aligned with voters with enough frequency.
From the perspective of the rich voters, it is interesting to consider two particular cases:
(i) when q = 1, the preferences of rich and poor citizens are always the same,hr = hL, so that the results discussed above apply to both groups; whereas
(ii) when q = 0, their preferences are always different, hr = hH, so that, for a givenrealisation of preferences of the officeholders, they have exactly opposite viewsabout the quality of the public policies under each regime.28
Thus, my analysis suggests that it should be more difficult to reach an agreement aboutthe choice of form of government in societies with a high degree of preferenceheterogeneity.
Finally, note that the public policies adopted in each system become increasinglysimilar as the likelihood of preference shocks decreases, i.e. for any p 2 (0, 1), theabsolute difference jxpres � xparl j becomes smaller as ξ decreases and, in particular,limn!0 x
pres ¼ limn!0 xparl ¼ hL. This feature of the model emphasises the idea that an
important element of the difference between presidential and parliamentary systems isrelated to the way in which they are able to respond to changes in the politicalenvironment.
5. Constitutional Design
This Section uses the model developed above to study the preferences of voters andpoliticians over the form of government. A hypothetical constitutional stage isintroduced at the beginning of the period, before any uncertainty over policypreferences is realised. It is assumed that every aspect of the model is commonknowledge and that agents know their future social status and political role in thesociety. Following Buchanan and Tullock (1962), I study the issue of constitutionaldesign from a positive point of view. The main goal is to understand the reasonsbehind the constitutional preferences of various population groups, assuming that, atleast in the medium run, citizens (poor and rich) and officeholders (executive leaderand legislators) are to remain in their respective social and political positions.
The next Proposition characterises the constitutional preferences of politicians.
PROPOSITION 3. With respect to the constitutional preferences of officeholders:
(i) The executive leader’s expected utility is always higher under presidential systems:
EðV prese Þ[ EðV parl
e Þ:
28 Formally, for a given realisation of preferences he and hlm , let the public policies implemented underpresidential and parliamentary systems be xpresðhe ; hlm Þ and xparl ðhe ; hlm Þ respectively. Then, it must be that:½xpresðhe ; hlm Þ � hL �2 � ½xparl ðhe ; hlm Þ � hL �2$ ½xpresðhe ; hlm Þ � hH �2 � ½xparl ðhe ; hlm Þ � hH �2, as xpresðhe ; hlm Þ andxparl ðhe ; hlm Þ are always in between hL and hH in any equilibrium of the model.
© 2014 Royal Economic Society.
2018 TH E E CONOM I C J O U RN A L [ D E C E M B E R

(ii) There exists g 2 (0, 1) such that if Pr hl ¼ hlmð Þ� g, then the expected utility oflegislator l is higher under parliamentary systems:
EðV presl Þ\EðV parl
l Þ:According to my analysis, the executive leader prefers a presidential system, where
the certainty of a fixed term in office provides insulation against the checks of votersand the congress, whereas the legislators, on the other hand, tend to prefer aparliamentary system, where the confidence procedure allows them to exert a moreactive role in the political process. Note that in this case each representative is able toextract more rents and, conditional on belonging to the majority in congress, toobtain better public policies for themselves. Thus, the parliamentary regime ispreferred by a legislator if the probability of him belonging to the majority issufficiently large, i.e. Pr ðhl ¼ hlm Þ � g, where the exact threshold g depends on theamount of rents that he is able to extract under each system. Moreover, the analysisalso implies that the legislators representing the poor are relatively more likely toprefer the parliamentary system, given that they belong to the majority coalition withgreater likelihood.
I now turn to the constitutional preferences of citizens. The next results are derivedunder the assumptions required for Proposition 2. I start by characterising theconditions under which the poor voters prefer each regime.
PROPOSITION 4. (Poor voters) For any given level of income 0 < yp < 1, it must be that:
(i) If kp and p are small enough, then the expected utility of the poor voters is higher underpresidential systems.
(ii) If kp and p are large enough, then the expected utility of the poor voters is higher underparliamentary systems.
The poor voters prefer a presidential system of government whenever the quality oflocal institutions, kp, is weak and the probability of post-shock congruence, p, is low. Inthis case, a large fraction of the transfers is diverted by legislators due to the lack ofinstitutional protection at the local level. Furthermore, public policies are expected tobe worse under parliamentary systems given that the median legislator cannot betrusted to represent the voters’ preferences with high likelihood. Under theseconditions, it is best for the poor to keep the ability to check the executive leaderthrough direct elections. This allows them to impose a limit on the size of taxes andtransfers as well as to demand policies that are more in line with their own preferences.Conversely, the parliamentary system is preferred whenever the quality of localinstitutions and the probability of post-shock congruence are both large enough.Overall, these results emphasise that parliamentarism is the regime which is most‘intensive’ in political institutions in that it requires a strong system of protectionagainst expropriation, particularly at the local level, and a class of politicians who canbe trusted to represent well the interests of voters.
Finally, I compare the constitutional preferences of rich and poor voters, focusingon the following utility difference:
© 2014 Royal Economic Society.
2015] CHOO S I N G TH E F O RM O F GO V E R NM EN T 2019

X � EðU r ;parl � U r ;presÞ � EðU p;parl � U p;presÞ; (21)
where Uj,k represents the utility of group j 2 {p, r} under regime k 2 {pres, parl}.Intuitively, Ω provides a measure of how the relative preference towards theparliamentary system differs between rich and poor voters. For instance, if Ω > 0,then the rich citizens prefer parliamentarism relatively more than the poor. I assumethat the incentive compatibility constraint on the rich legislators is always binding, inorder to focus on the more interesting case where variations in kr have an actual impacton rents. The next proposition summarises the main conclusions.
PROPOSITION 5. (Rich voters) Ceteris paribus, it must be that:
(i) As kr increases, the rich voters prefer the parliamentary system more than the poor:
@X@kr
[ 0
(ii) As yr increases, the rich voters prefer the parliamentary system less than the poor:
@X@yr
� 0;
with strict inequality when EðspresÞ\ 1:
The welfare cost generated by the expropriation of rents by legislators is not equallydistributed across the population. The better quality of the local institutions availableto the rich, kr > kp, allows them to obtain more benefits from the larger transfersreceived under parliamentary systems. At the same time, rich voters are more impactedby the higher taxes levied under parliamentary systems, given that, in the presentmodel, taxation is proportional to income, which makes the presidential regime moreattractive to them. Interestingly, these results suggest that income per se cannot accountfor the fact that the rich citizens in Brazil were more likely to vote for a parliamentarysystem. Instead, the model highlights that an important reason behind the empiricalevidence presented in this article can be attributed to differences in the quality of localaccountability institutions across the population.29
Observe that the above result does not allow us to determine the sign of Ω. To do so,it would be necessary to examine the model for particular combinations of theparameters. Here, I focus on a special case which, arguably, captures the main featuresof the political and institutional environment in Brazil and other developing countries.Specifically, I consider a situation where kp and p are small and yr = yp, which isimposed to shut down re-distribution in the model.30
29 In fact, to my knowledge, discussions about taxation and re-distribution did not arise at all during thereferendum. This fact seems reasonable, especially considering that to associate a particular political regimewith precise implications in terms of taxation and re-distribution would require a very sophisticated form ofrationality on the part of voters. Note that the insights from Persson et al. (1997, 2000) about re-distributionpolicies under alternative government regimes were still unavailable even to scholars at that time.
30 Note that the result would remain unchanged as long as the income difference, yr � yp, was not toohigh.
© 2014 Royal Economic Society.
2020 TH E E CONOM I C J O U RN A L [ D E C E M B E R

COROLLARY 1. Suppose that kp and p are small enough and yr = yp. Then, for any kr > kp, Ihave:
EðU p;parl Þ \ EðU p;presÞ (22)
and
X ¼ EðU r ;parl � U r ;presÞ � EðU p;parl � U p;presÞ[ 0: (23)
Therefore, when the quality of the local institutions available to the poor is low andthe congress cannot be trusted to represent the interests of voters, then:
(i) poor citizens prefer a presidential rather than a parliamentary system; and(ii) rich citizens prefer a parliamentary system relatively more than the poor.
6. Conclusion
This article has studied the main factors that determine the constitutional preferencesof citizens for the form of government. I have focused on the case of Brazil, where areferendum in 1993 allowed the population to choose between a presidential and aparliamentary system of government. Using a unique data set consisting of the resultsof the referendum, I show that, while the Brazilian population in general voted infavour of a presidential system, there exists a strong positive correlation betweenincome per capita and the percentage of votes cast for a parliamentary regime in eachmunicipality.
I propose a model to explain the general pattern of the results of the referendum.The analysis was based on a fundamental difference between the two regimes ofgovernment: while in presidential systems the executive leader is directly elected byvoters and has a fixed term in office, in parliamentary systems the executive leader isappointed by the parliament and may be replaced if he receives a vote of noconfidence. I show that a parliamentary regime requires a strong system of protectionagainst expropriation, particularly at the local level, and a class of politicians who canbe trusted to represent well the interests of voters. I also show that the poor groups inthe population tend to prefer a presidential system because the lower quality of theirlocal accountability institutions makes them more vulnerable to expropriation of rentsby legislators.
This study contributes to the literature on endogenous political institutions bystudying a particular case of constitutional reform. Although I do not contend that theresults of the present analysis apply irrespective of the political and institutionalcontext, I believe that my model highlights some of the important factors involved inthe choice of a political regime. As pointed out by North (1990), the study of historicalevents provides a useful way to identify the main elements behind the process ofinstitutional change. This article proposes the use of referendum data, in connectionwith a formal theoretical analysis, as a valuable source of information about thepreferences of the population on certain political issues. I believe that a similarapproach could be fruitfully applied to the study of other types of institutions, giventhe possible existence of data on several potentially interesting questions.
© 2014 Royal Economic Society.
2015] CHOO S I N G TH E F O RM O F GO V E R NM EN T 2021

University of Sao Paulo
Additional Supporting Information may be found in the online version of this article:
Appendix A. Presidential System with Impeachment.Appendix B. Proofs.Data S1.
ReferencesAcemoglu, D. (2003). ‘Why not a political Coase theorem? Social conflict, commitment and politics’, Journal
of Comparative Economics, vol. 31(4), pp. 620–52.Acemoglu, D. and Johnson, S. (2005). ‘Unbundling institutions’, Journal of Political Economy, vol. 113(5),
pp. 949–95.Acemoglu, D. and Robinson, J.A. (2000). ‘Why did the west extend the franchise? Democracy, inequality and
growth in historical perspective’, Quarterly Journal of Economics, vol. 115(4), pp. 938–63.Acemoglu, D. and Robinson, J.A. (2001). ‘A theory of political transitions’, American Economic Review, vol. 91
(4), pp. 938–63.Acemoglu, D. and Robinson, J.A. (2006). Economic Origins of Dictatorship and Democracy, Cambridge:
Cambridge University Press.Acemoglu, D., Robinson, J.A. and Torvik, R. (2013). ‘Why do voters dismantle checks and balances?’, Review
of Economic Studies, vol. 80(3), pp. 845–75.Aghion, P., Alesina, A. and Trebbi, F. (2004). ‘Endogenous political institutions’, Quarterly Journal of
Economics, vol. 119(2), pp. 565–611.Ames, B. (1995). ‘Electoral rules, constituency pressures, and pork barrel: bases of voting in the Brazilian
congress’, Journal of Politics, vol. 57(2), pp. 324–43.Ames, B. (2001). The Deadlock of Democracy in Brazil, Ann Arbor, MI: University of Michigan Press.Buchanan, J. and Tullock, G. (1962). The Calculus of Consent, Ann Arbor, MI: University of Michigan Press.Cheibub, J.A. (2007). Presidentialism, Parliamentarism and Democracy, New York: Cambridge University Press.Chong, A. and Gradstein, M. (2007). ‘Inequality and institutions’, Review of Economics and Statistics, vol. 89(3),
pp. 454–65.Coate, S. and Knight, B. (2011). ‘Government form and public spending: theory and evidence from US
municipalities’, American Economic: Journal Public Policy, vol. 3(3), pp. 82–112.Crisp, B.F. and Desposato, S.W. (2004). ‘Constituency building in multimember districts: collusion or
conflict?’, Journal of Politics, vol. 66(1), pp. 136–56.Crisp, B.F. and Ingall, R.E. (2002). ‘Institutional engineering and the nature of representation:
mapping the effects of electoral reform in Colombia’, American Journal of Political Science, vol. 46(4),pp. 733–48.
Easter, G.M. 1997. ‘Preference for presidentialism: postcommunist regime change in Russia and the NIS’,World Politics, vol. 49(2), pp. 184–211.
Ferraz, C. and Finan, F. (2008). ‘Exposing corrupt politicians: the effects of Brazil’s publicly-released auditson electoral outcomes’, Quarterly Journal of Economics, vol. 123(3), pp. 703–45.
Ferraz, C. and Finan, F. (2011). ‘Electoral accountability and corruption: evidence from the audits of localgovernment’, American Economic Review, vol. 101(4), pp. 1274–311.
Fleischer, D. (1976). ‘Concentrac�~ao e dispers~ao eleitoral: um estudo da distribuic�~ao geogr�afica do voto emMinas Gerais (1966–1974)’, Revista Brasileira de Estudos Pol�ıticos, vol. 43(July), pp. 333–60.
Fleischer, D. (1997). ‘Political corruption in Brazil’, Crime, Law and Social Change, vol. 25(4), pp. 297–321.Hirano, S. (2006). ‘Electoral institutions, hometowns, and favored minorities: evidence from Japanese
electoral reforms’, World Politics, vol. 58(1), pp. 51–82.Knack, S. and Keefer, P. (1995). ‘Institutions and economic performance: cross-country tests using alternative
institutional measures’, Economics and Politics, vol. 7(3), pp. 207–27.Kunicova, J. and Rose-Ackerman, S. (2005). ‘Electoral rules and constitutional structures as constraints on
corruption’, British Journal of Political Science, vol. 35(4), pp. 573–606.Lederman, D., Loayza, N. and Soares, R. (2005). ‘Accountability and corruption: political institutions matter’,
Economics and Politics, vol. 17(1), pp. 1–35.Lijphart, A. (1992). ‘Democratization and constitutional choices in Czecho-Slovakia, Hungary, and Poland,
1989–1991’, Journal of Theoretical Politics, vol. 4(2), pp. 207–23.Linz, J.J. (1978). The Breakdown of Democratic Regimes. Crisis, Breakdown and Reequilibration, Baltimore, MD:
Johns Hopkins University Press.
© 2014 Royal Economic Society.
2022 TH E E CONOM I C J O U RN A L [ D E C E M B E R

Litschig, S. and Zamboni, Y. (2011). ‘Judicial presence and rent extraction’, Working Paper, UniversitatPompeu Fabra.
Mainwaring, S. and Shugart, M.S. (1997). Presidentialism and Democracy in Latin America, Cambridge, MA:Cambridge University Press.
Myerson, R.B. (1993). ‘Incentives to cultivate favored minorities under alternative electoral systems’, AmericanPolitical Science Review, vol. 87(4), pp. 856–69.
Naritomi, J., Soares, R. and Assunc�~ao, J. (2012). ‘Institutional development and colonial heritage withinBrazil’, Journal of Economic History, vol. 72(2), pp. 393–422.
North, D. (1990). Institutions, Institutional Change and Economic Performance, Cambridge: Cambridge UniversityPress.
Oates, W.E. (1999). ‘An essay on fiscal federalism’, Journal of Economic Literature, vol. 37(3), pp. 1120–49.Olken, B. (2006). ‘Corruption and the costs of redistribution’, Journal of Public Economics, vol. 90(4–5), pp.
853–70.Persson, T. and Tabellini, G. (2003). The Economic Effects of Constitutions: What do the Data Say?, Cambridge,
MA: MIT Press.Persson, T. and Tabellini, G. (2004). ‘Constitutional rules and fiscal policy outcomes’, American Economic
Review, vol. 94(1), pp. 25–46.Persson, T., Roland, G. and Tabellini, G. (1997). ‘Separation of powers and political accountability’, Quarterly
Journal of Economics, vol. 112(4), pp. 1163–202.Persson, T., Roland, G. and Tabellini, G. (2000). ‘Comparative politics and public finance’, Journal of Political
Economy, vol. 108(6), pp. 1121–61.Pinheiro, A.C. and Cabral, C. (1999). ‘Credit markets in Brazil: the role of judicial enforcement and other
institutions’, Working Paper 104, Inter-American Development Bank.Richardson, B.M. (1997). Japanese Democracy: Power, Coordination, and Performance, New Haven, CT: Yale
University Press.Robinson, J.A. and Torvik, R. (2013). ‘Endogenous presidentialism’, Working Paper, Harvard University.Shugart, M.S. and Carey, J.M. (1992). Presidents and Assemblies: Constitutional Design and Electoral Dynamics,
Cambridge: Cambridge University Press.Skidmore, T. (1967). Politics in Brazil, 1930–1964: An Experiment in Democracy, New York: Oxford University
Press.Stepan, A. and Skach, C. (1993). ‘Constitutional frameworks and democratic consolidation: parliamentarism
versus presidentialism’, World Politics, vol. 46(1), pp. 1–22.Ticchi, D. and Vindigni, A. (2010). ‘Endogenous constitutions’, ECONOMIC JOURNAL, vol. 120(543), pp. 1–39.Trebbi, F., Aghion, P. and Alesina, A. (2008). ‘Choosing electoral rules: theory and evidence from US cities’,
Quarterly Journal of Economics, vol. 123(1), pp. 325–57.
© 2014 Royal Economic Society.
2015] CHOO S I N G TH E F O RM O F GO V E R NM EN T 2023