Embed Size (px)
Citation preview
© 2016 Blue Camphor Technologies (P) Ltd.
Nagios Essential
By – Rajesh KumarTwitter - RajeshKumarIN
Email – [email protected]
Slide 2© 2017 scmGalaxy.com www.DevOpsSchool.com
Outline
What is Nagios?
Getting StartedHosts, Commands, Services, Timeperiods and Contacts
Remote Checks with NRPE
Hostgroups and Servicegroups
Templates
Config File(s)
Active v. Passive checks
Going FurtherWriting you own Checks
NSCA
Service Hierarchies
Eventhandlers
Modifying the Web Pages
Slide 3© 2017 scmGalaxy.com www.DevOpsSchool.com
What is Nagios
“Nagios is an enterprise-class monitoring solutions for hosts, services, and networks released under an Open Source license.”
www.nagios.org
“Nagios is a popular open source computer system and network monitoring application software. It watches hosts and services that you specify, alerting you when things go bad and again when they get better.”
www.wikipedia.org

Slide 4© 2017 scmGalaxy.com www.DevOpsSchool.com
What is Nagios?
Free network monitoring tool
Open source
Comes in pieces - use what you need
Slide 5© 2017 scmGalaxy.com www.DevOpsSchool.com
What is Nagios?
Nagios watches your computers through user-defined commands
It can be set to inform you when a service or host becomes unavailable
In fact, it can inform you, the Sysadmin, your best friend, and even run commands to try to bring a system back up

Slide 6© 2017 scmGalaxy.com www.DevOpsSchool.com
Where is Nagios?
Nagios runs on nagman, a dedicated server in ML-291U PC
Debian Linux
Backup machine existsNot configured
Will be installed at Foothills

Slide 7© 2017 scmGalaxy.com www.DevOpsSchool.com
Who uses Nagios?
Anyone with a web browser and a Nagios accountNOC staff

Slide 8© 2017 scmGalaxy.com www.DevOpsSchool.com
What does Nagios do?
Monitors 331 network devices
Monitors HMTL on access points
Monitors BGP on routers
Makes noises in the NOC
Links to web pages with instructions

Slide 9© 2017 scmGalaxy.com www.DevOpsSchool.com
What’s good about Nagios?
It’s conceptually simple
It handles the load
It has a web interface
It’s extensible
It’s not overly noisy

Slide 10© 2017 scmGalaxy.com www.DevOpsSchool.com
What’s bad about Nagios?
Lots of configuration
No discovery
Manual network hierarchy
Doesn’t understand multihomed devices
Limited support for SNMP
Slide 11© 2017 scmGalaxy.com www.DevOpsSchool.com
Nagios: a measurement tool that actively monitors availability of devices and services:
Popular: One of the most used open source network monitoring software packages.
Fast: Uses CGI functionality written in C for faster response and scalability.
Scalable: Can support up to thousands of devices and services.
Modular
Cool-Looking Web Interface®
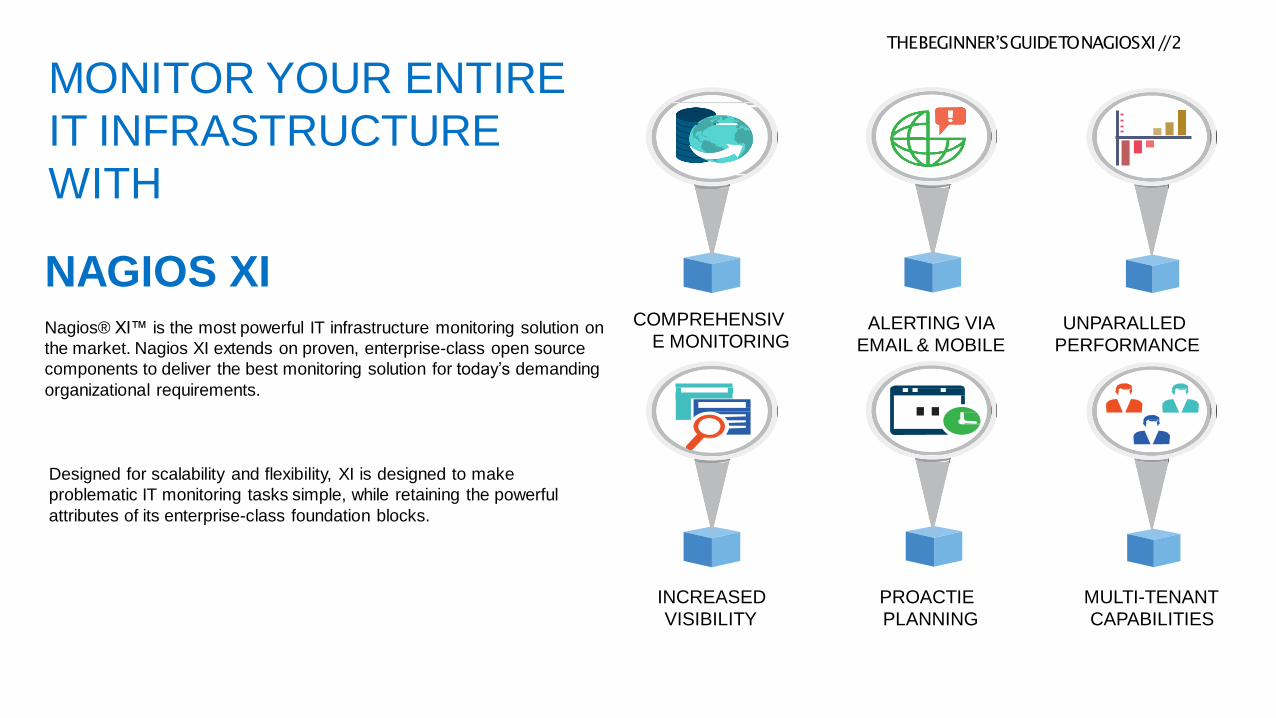
THEBEGINNER’SGUIDETONAGIOSXI//2
COMPREHENSIV
E MONITORINGALERTING VIA
EMAIL & MOBILE
UNPARALLED
PERFORMANCE
INCREASED
VISIBILITY
PROACTIE
PLANNING
MULTI-TENANT
CAPABILITIES
MONITOR YOUR ENTIRE
IT INFRASTRUCTURE
WITH
NAGIOS XINagios® XI™ is the most powerful IT infrastructure monitoring solution on
the market. Nagios XI extends on proven, enterprise-class open source
components to deliver the best monitoring solution for today‟s demanding
organizational requirements.
Designed for scalability and flexibility, XI is designed to make
problematic IT monitoring tasks simple, while retaining the powerful
attributes of its enterprise-class foundation blocks.
Slide 13© 2017 scmGalaxy.com www.DevOpsSchool.com
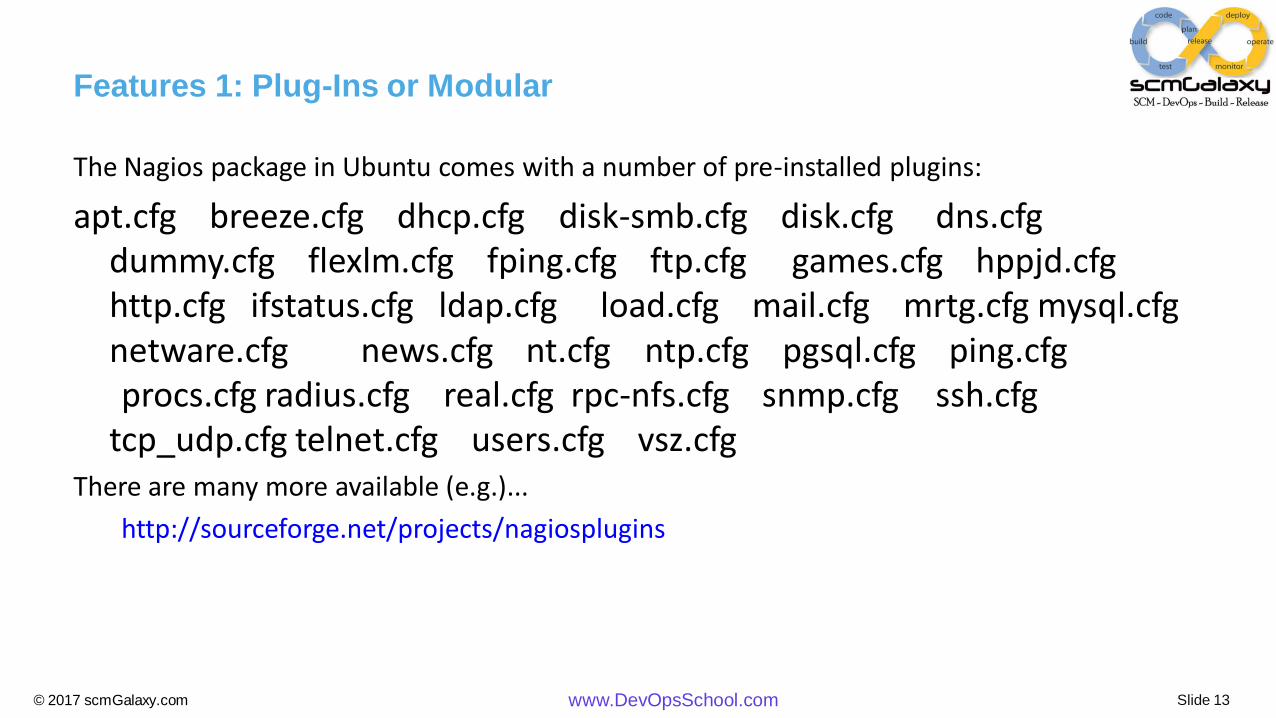
Features 1: Plug-Ins or Modular
The Nagios package in Ubuntu comes with a number of pre-installed plugins:
apt.cfg breeze.cfg dhcp.cfg disk-smb.cfg disk.cfg dns.cfg dummy.cfg flexlm.cfg fping.cfg ftp.cfg games.cfg hppjd.cfg http.cfg ifstatus.cfg ldap.cfg load.cfg mail.cfg mrtg.cfg mysql.cfg netware.cfg news.cfg nt.cfg ntp.cfg pgsql.cfg ping.cfg procs.cfg radius.cfg real.cfg rpc-nfs.cfg snmp.cfg ssh.cfg
tcp_udp.cfg telnet.cfg users.cfg vsz.cfgThere are many more available (e.g.)...
http://sourceforge.net/projects/nagiosplugins
Slide 14© 2017 scmGalaxy.com www.DevOpsSchool.com
Features: 2
Fast and Scalable
Compiled, binary CGIs and common plug-ins for faster performance.
Parallel checking and forking of checks to support large numbers of devices. This has been considerably improved in version 3 of Nagios.
Improvement of efficiency is a controversial topic in the Nagios community. There is now a fork, icinga, trying to re-write Nagios in a different manner.
Slide 15© 2017 scmGalaxy.com www.DevOpsSchool.com
Features: 3
Uses “intelligent” checking capabilities. Attempts to distribute the server load of running Nagios (for larger sites) and the load placed on devices
being checked.
Configuration is done in simple, plain text files, that can contain much detail and are based on templates.
Nagios reads it's configuration from an entire directory. You decide how to define individual files.

Slide 16© 2017 scmGalaxy.com www.DevOpsSchool.com
Features: 4
Topology Aware: To determine dependencies. Differentiates between what is down vs. what is not available. This way it avoids running unnecessary
checks. This is done using parent-child relationships between devices.
Notifications: How they are sent is based on combinations of:
Contacts and lists of contacts. Devices and groups of devices Services and groups of services Defined hours by persons or groups. The state of a service.
Slide 17© 2017 scmGalaxy.com www.DevOpsSchool.com
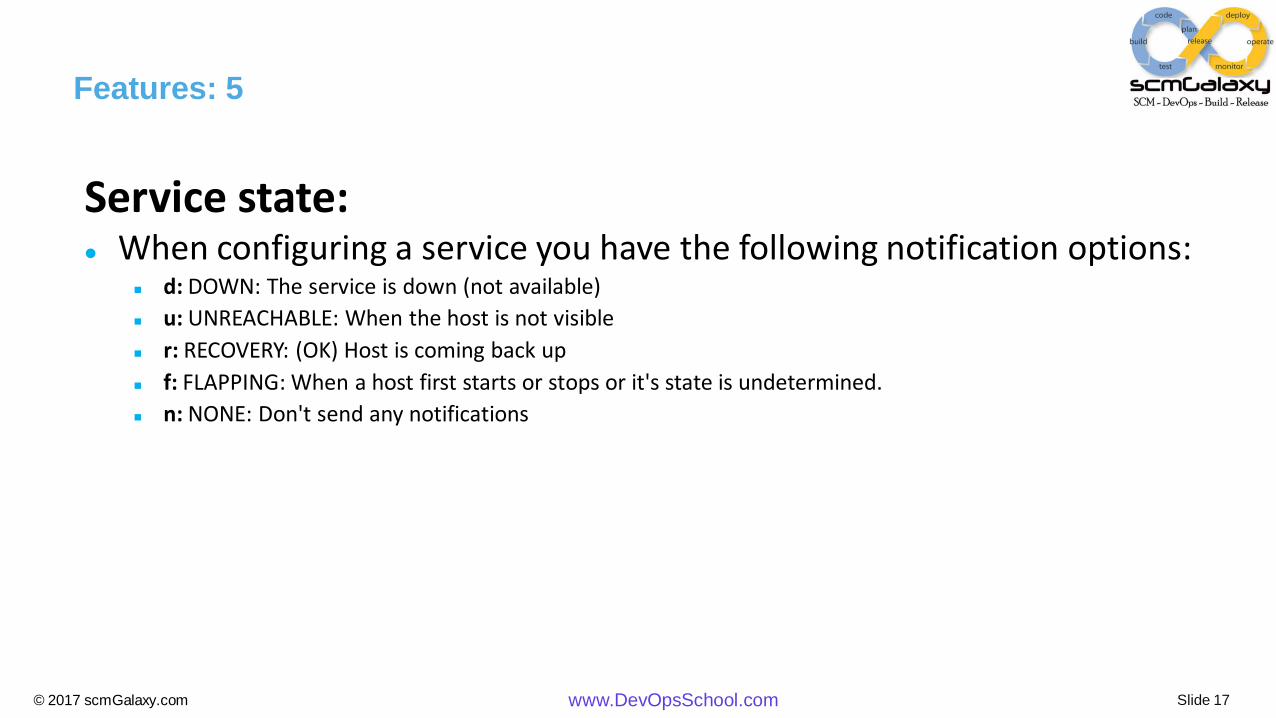
Features: 5
Service state: When configuring a service you have the following notification options:
d: DOWN: The service is down (not available)
u: UNREACHABLE: When the host is not visible
r: RECOVERY: (OK) Host is coming back up
f: FLAPPING: When a host first starts or stops or it's state is undetermined.
n: NONE: Don't send any notifications
Slide 18© 2017 scmGalaxy.com www.DevOpsSchool.com
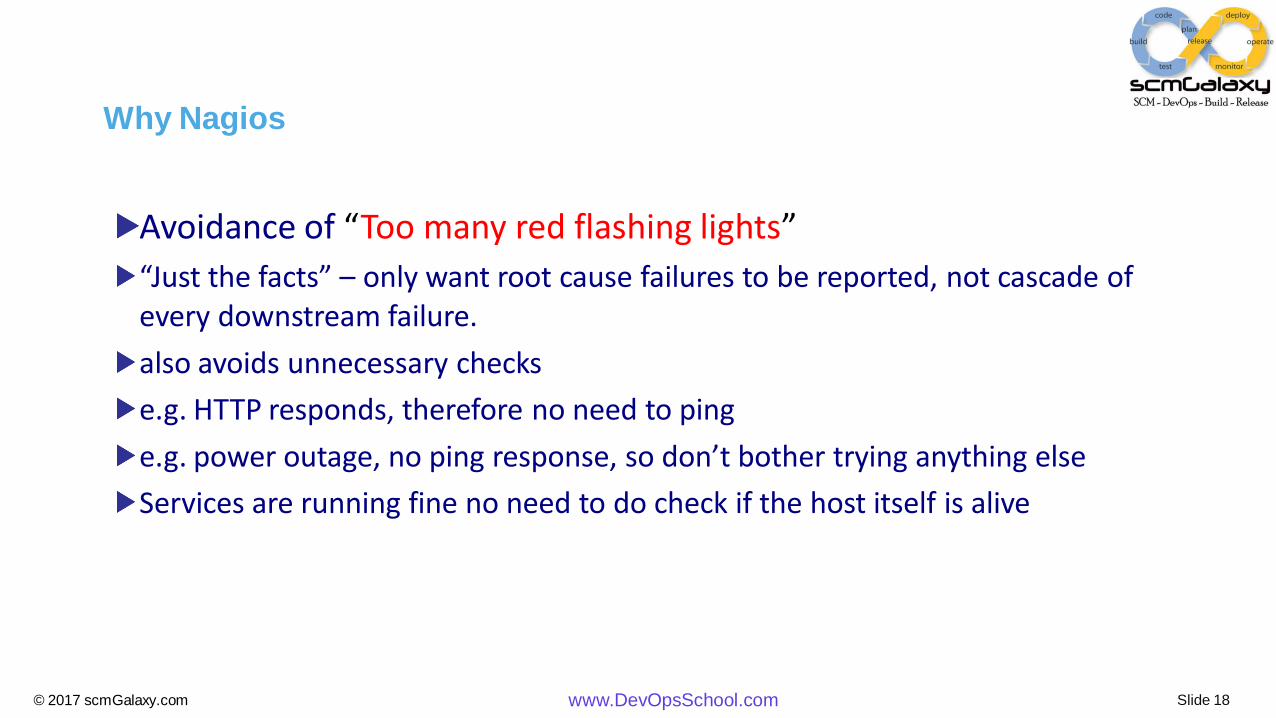
Why Nagios
Avoidance of “Too many red flashing lights”
“Just the facts” – only want root cause failures to be reported, not cascade of every downstream failure.
also avoids unnecessary checks
e.g. HTTP responds, therefore no need to ping
e.g. power outage, no ping response, so don’t bother trying anything else
Services are running fine no need to do check if the host itself is alive

What Can it Do?
A lot, including:• Service monitoring
• Alerts from SNMP traps
• Monitoring redundancy
• Detection of primary failure to avoid multiple like alerts.
• Notifications via email, pager, etc.
• Notifications to individuals or defined groups
• Log information
• Use databases to store history
• Graph generation from MRTG
• Very extensible via plug-ins, add-ons and local scripts.
• Can scale to large installations
• Allows for redundant monitoring
• Aggregation of like-data across multiple nodes.
• Ability to escalate alerts
• Runs on multiple Unices
• Licensed under GPL v2
Overall
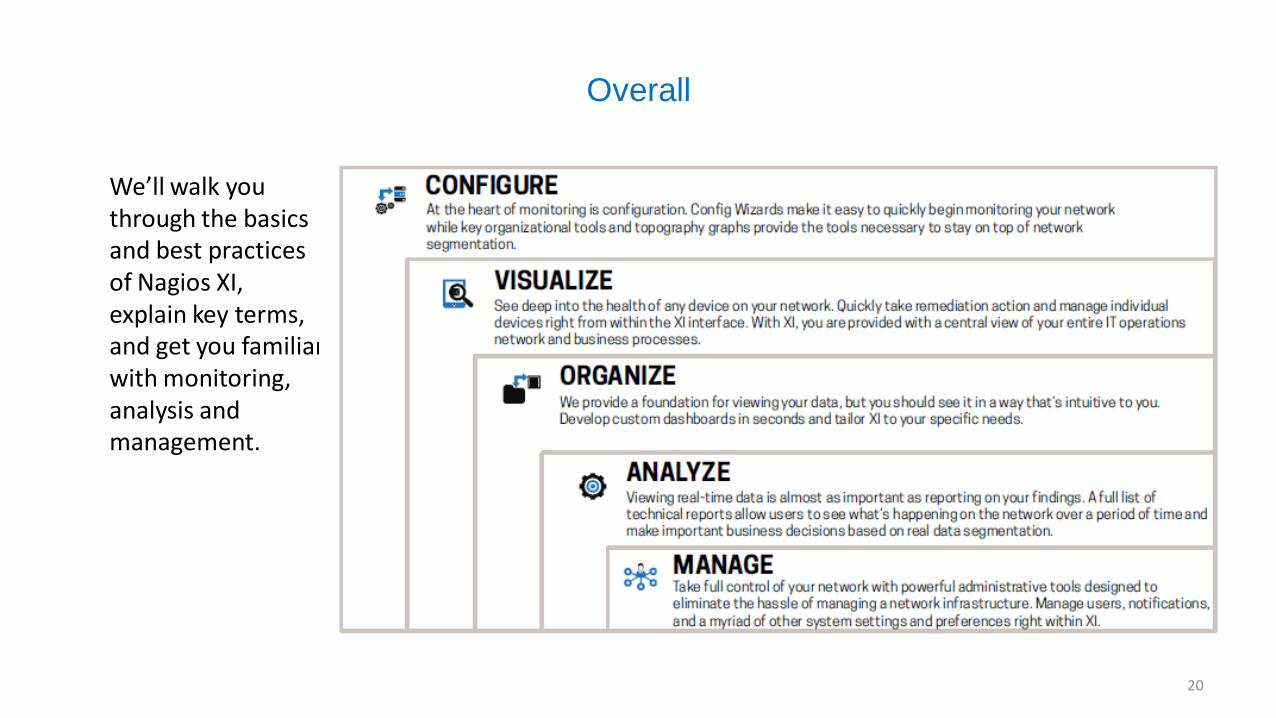
We’ll walk you through the basics and best practices of Nagios XI, explain key terms, and get you familiar with monitoring, analysis and management.
20
Slide 21© 2017 scmGalaxy.com www.DevOpsSchool.com
THEBEGINNER’SGUIDETONAGIOSXI//6
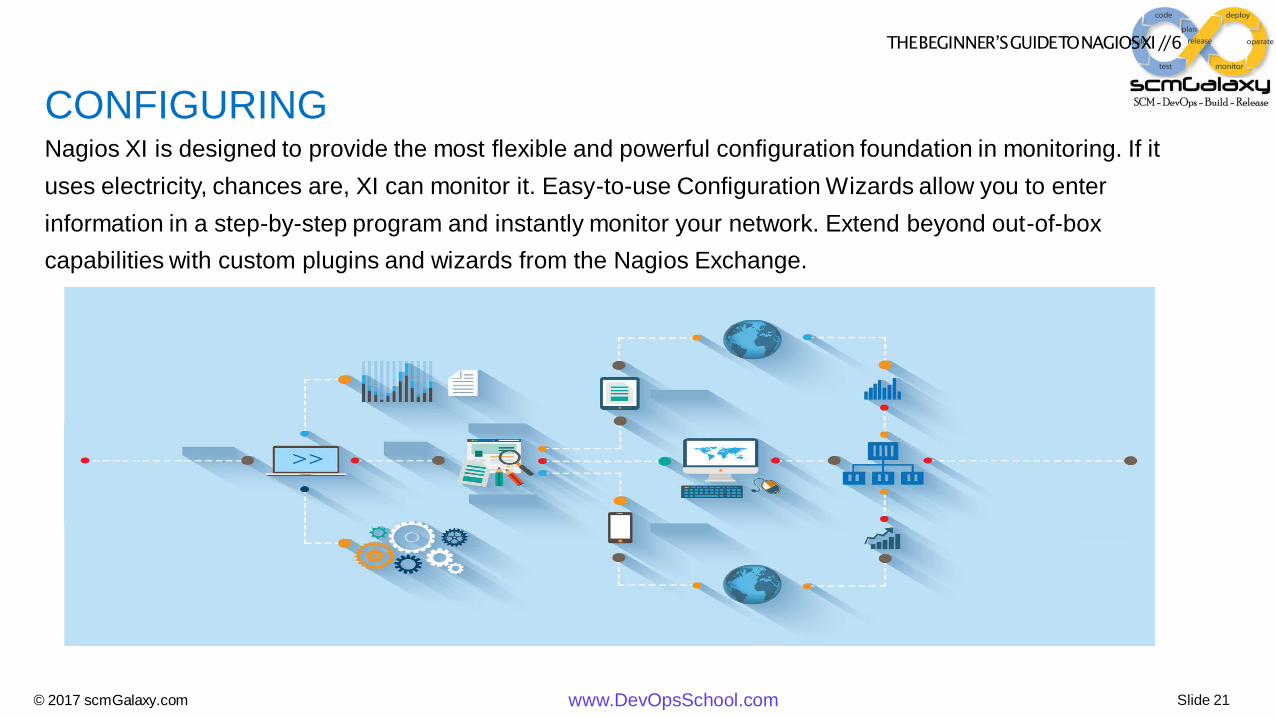
CONFIGURINGNagios XI is designed to provide the most flexible and powerful configuration foundation in monitoring. If it
uses electricity, chances are, XI can monitor it. Easy-to-use Configuration Wizards allow you to enter
information in a step-by-step program and instantly monitor your network. Extend beyond out-of-box
capabilities with custom plugins and wizards from the Nagios Exchange.
THEBEGINNER’SGUIDETONAGIOSXI//7
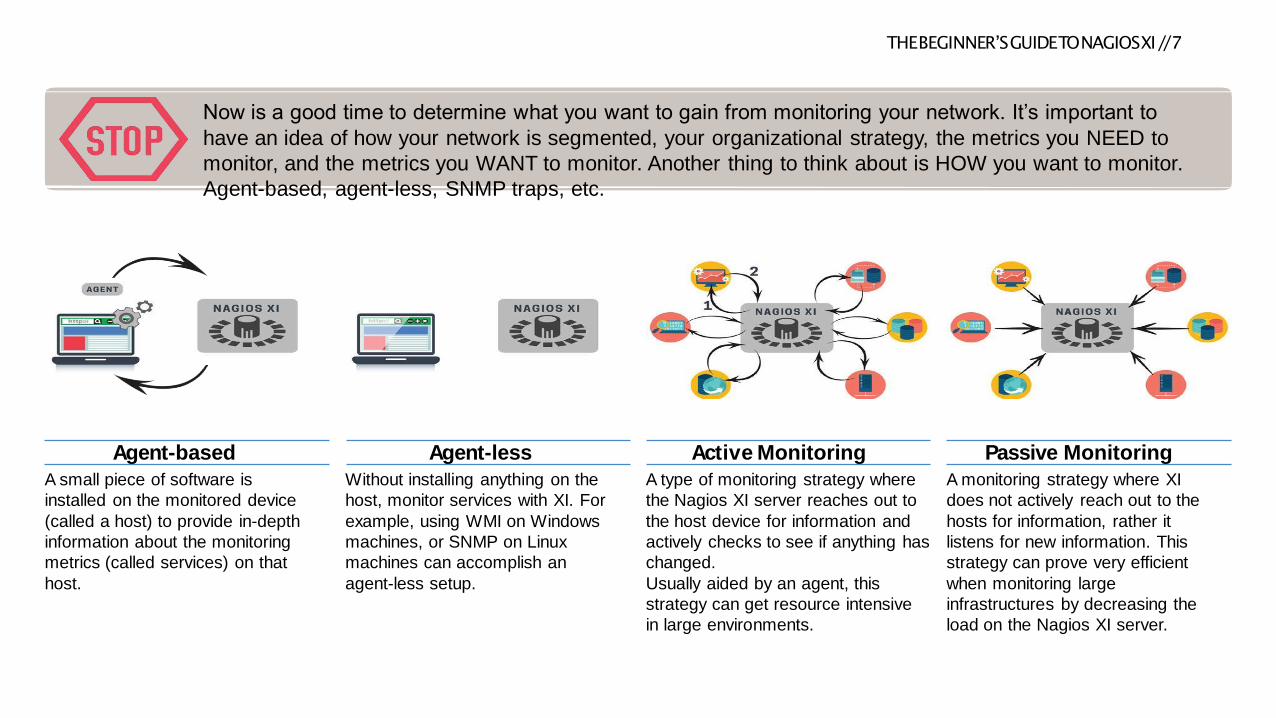
Now is a good time to determine what you want to gain from monitoring your network. It‟s important to
have an idea of how your network is segmented, your organizational strategy, the metrics you NEED to
monitor, and the metrics you WANT to monitor. Another thing to think about is HOW you want to monitor.
Agent-based, agent-less, SNMP traps, etc.
A small piece of software is
installed on the monitored device
(called a host) to provide in-depth
information about the monitoring
metrics (called services) on that
host.
A type of monitoring strategy where
the Nagios XI server reaches out to
the host device for information and
actively checks to see if anything has
changed.
Usually aided by an agent, this
strategy can get resource intensive
in large environments.
Without installing anything on the
host, monitor services with XI. For
example, using WMI on Windows
machines, or SNMP on Linux
machines can accomplish an
agent-less setup.
A monitoring strategy where XI
does not actively reach out to the
hosts for information, rather it
listens for new information. This
strategy can prove very efficient
when monitoring large
infrastructures by decreasing the
load on the Nagios XI server.
Agent-based Agent-less Active Monitoring Passive Monitoring
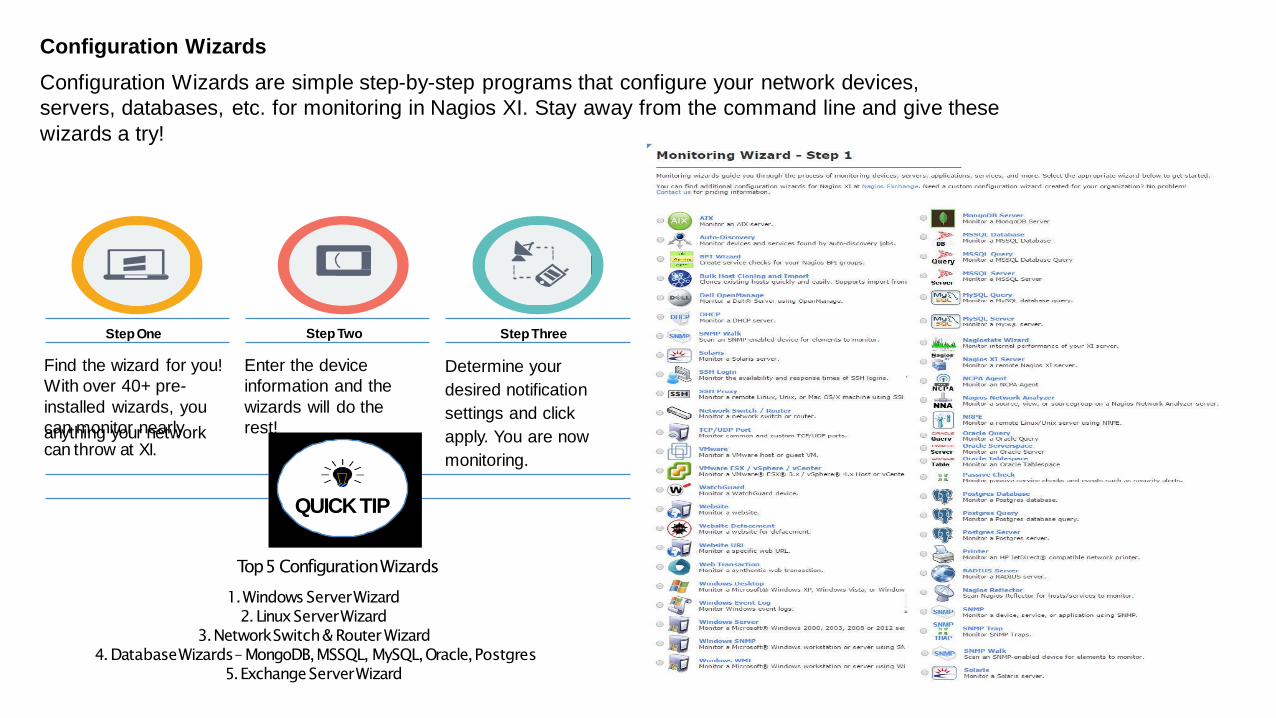
Configuration Wizards
Configuration Wizards are simple step-by-step programs that configure your network devices,
servers, databases, etc. for monitoring in Nagios XI. Stay away from the command line and give these
wizards a try!
Determine your
desired notification
settings and click
apply. You are now
monitoring.
QUICKTIP
Top5 ConfigurationWizards
1.WindowsServerWizard
2.LinuxServerWizard
3.NetworkSwitch&RouterWizard
4.DatabaseWizards– MongoDB,MSSQL, MySQL,Oracle,Postgres
5.ExchangeServerWizard
Step ThreeStep One Step Two
Find the wizard for you!
With over 40+ pre-
installed wizards, you
can monitor nearlyanything your networkcan throw at XI.
Enter the device
information and the
wizards will do the
rest!
Slide 24© 2017 scmGalaxy.com www.DevOpsSchool.com
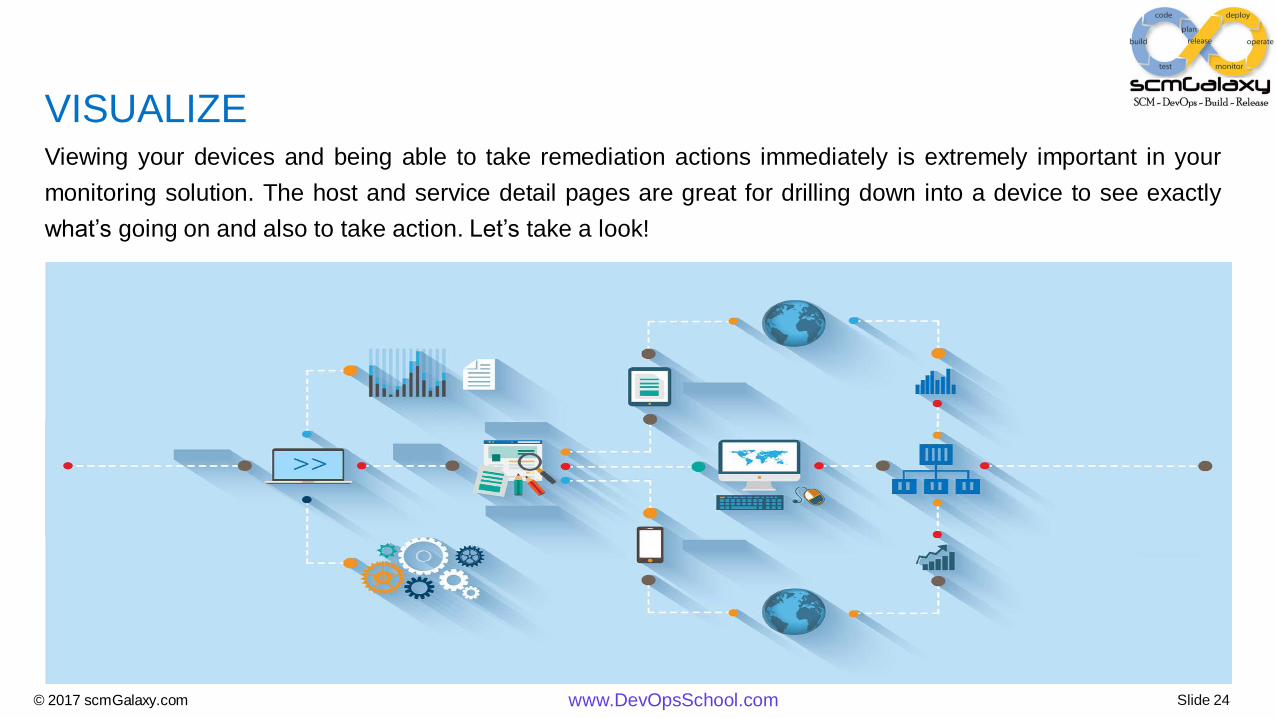
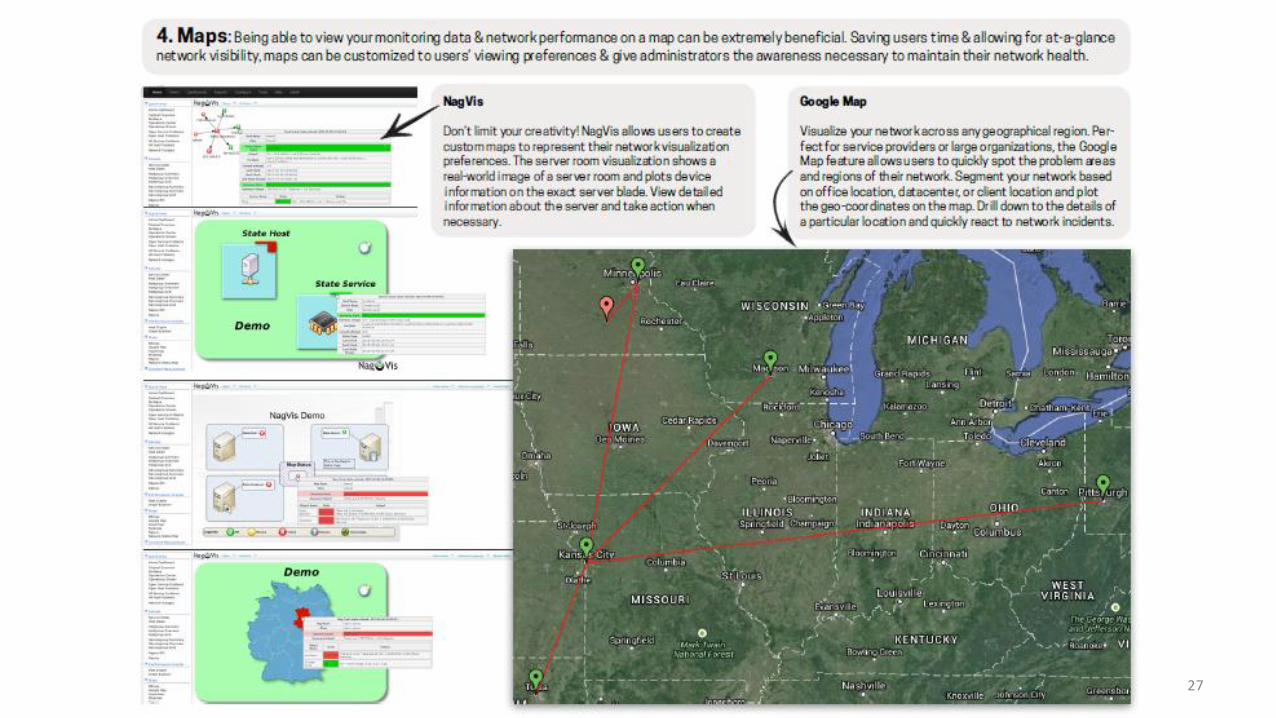
VISUALIZEViewing your devices and being able to take remediation actions immediately is extremely important in your
monitoring solution. The host and service detail pages are great for drilling down into a device to see exactly
what‟s going on and also to take action. Let‟s take a look!

Quick Actions are customizable links that can be programmed to take remediation action as well as other
administrative tasks. Among the many options, you can
schedule a check to make sure
your host or service is truly up or down. You can take action
on your remote devices right from Nagios XI.
Quick Actions are fully customizable. Add links to repair scripts event handlers or other
custom scripts to take remediation action.
Performance Graphs
With Performance Graphs, you can see the historical data
that Nagios XI has collected. These graphs allow for
extensive analysis of monitoring metrics including custom
time frames, user menu memory, and direct linking to
monitored devices. Within the graph you can:
1.Zoom – Drill down to specific events to see what‟s going on
2.Stats – Hover over data points for more detailed information
3.Dashify – Add to your dashboards for a customized view.
Quick Actions Performance Graph Examples
26
27

Slide 28© 2017 scmGalaxy.com www.DevOpsSchool.com
THEBEGINNER’SGUIDETONAGIOSXI//13
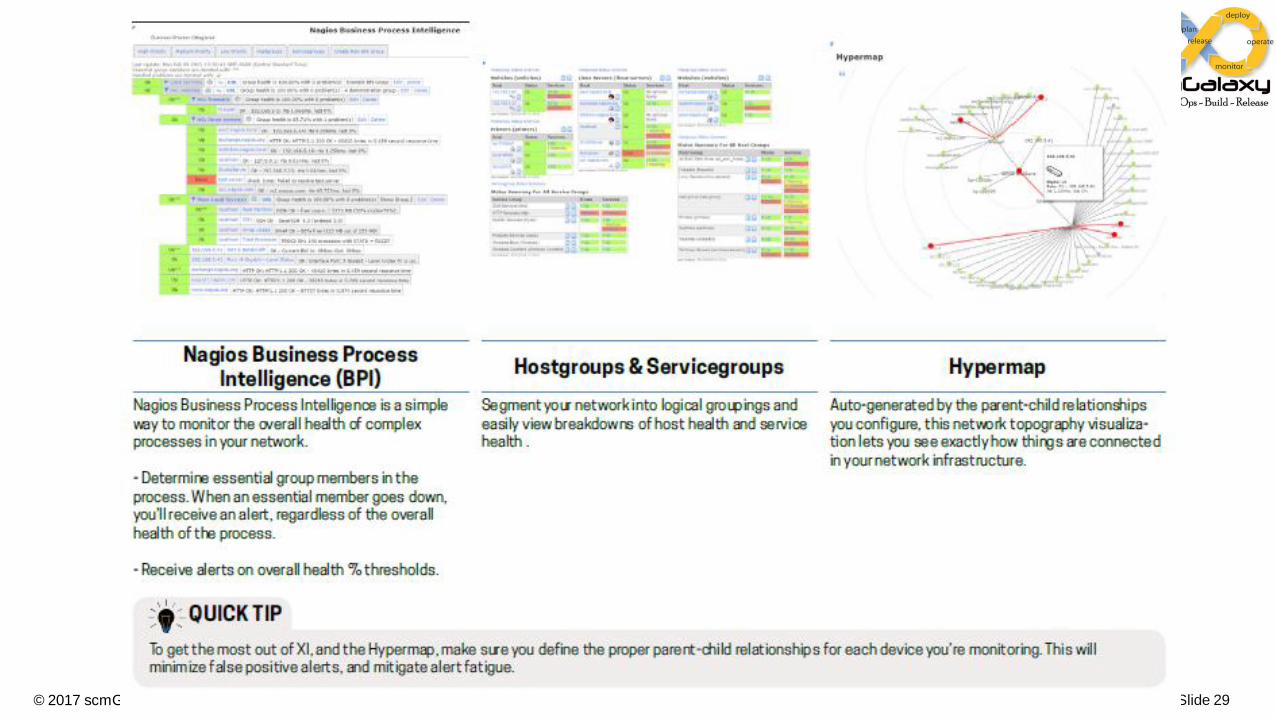
ORGANIZEXI provides you with a lot of tools and options for segmenting, viewing, and mapping your network. Your data
needs to make sense to you. Use the Hostgroups and Servicegroups as well as Nagios BPI to keep track of
device groupings and organize complex business processes. The Hypermap feature auto-generates a network
topography map based on your Parent-Child relationships built into your host configurations so you can see a
quick overview of your networking environment.
Slide 29© 2017 scmGalaxy.com www.DevOpsSchool.com
THE BEGINNER’S GUIDE TO NAGIOS XI // 15
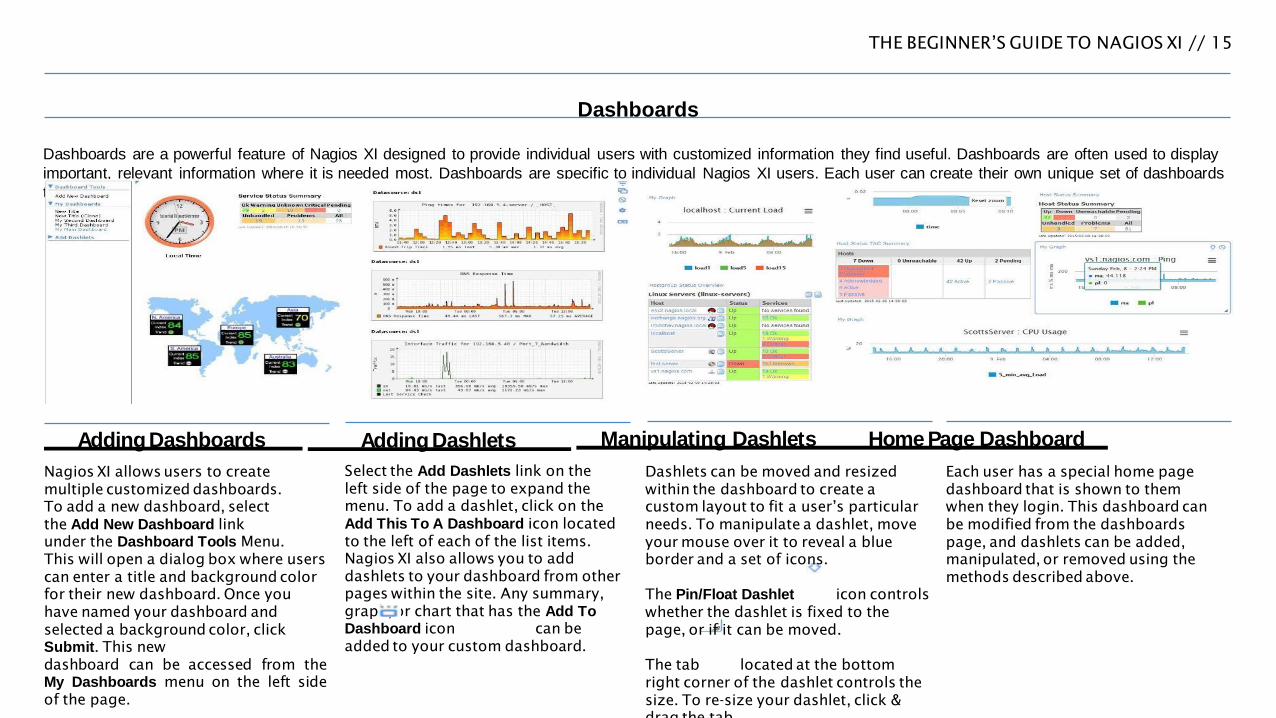
Dashboards
Dashboards are a powerful feature of Nagios XI designed to provide individual users with customized information they find useful. Dashboards are often used to display
important, relevant information where it is needed most. Dashboards are specific to individual Nagios XI users. Each user can create their own unique set of dashboards
to customize Nagios XI to fit their needs.
Nagios XI allows users to create
multiple customized dashboards.
To add a new dashboard, select
the Add New Dashboard link
under the Dashboard Tools Menu.
This will open a dialog box where users
can enter a title and background color
for their new dashboard. Once you
have named your dashboard and
selected a background color, click
Submit. This new
dashboard can be accessed from the
My Dashboards menu on the left side
of the page.
Nagios XI also allows you to add
dashlets to your dashboard from other
pages within the site. Any summary,
graph, or chart that has the Add To Dashboard icon can be
added to your custom dashboard.
Each user has a special home page
dashboard that is shown to them
when they login. This dashboard can
be modified from the dashboards
page, and dashlets can be added,
manipulated, or removed using the
methods described above.
AddingDashboards Adding Dashlets Manipulating Dashlets Home Page Dashboard
Select the Add Dashlets link on the
left side of the page to expand the
menu. To add a dashlet, click on the
Add This To A Dashboard icon located
to the left of each of the list items.
Dashlets can be moved and resized
within the dashboard to create a
custom layout to fit a user’s particular
needs. To manipulate a dashlet, move
your mouse over it to reveal a blue
border and a set of icons.
The Pin/Float Dashlet icon controls
whether the dashlet is fixed to the
page, or if it can be moved.
The tab located at the bottom
right corner of the dashlet controls the
size. To re-size your dashlet, click &
drag the tab.
Slide 31© 2017 scmGalaxy.com www.DevOpsSchool.com
THEBEGINNER’SGUIDETONAGIOSXI//16
ANALYZE AND MANAGE
XI’s powerful reporting features allow you to not only view your data, but make informed business decisions for
your organization. Reports are essentially static dashboards that contain summarized monitoring data that can be
scheduled, exported, saved, and shared.
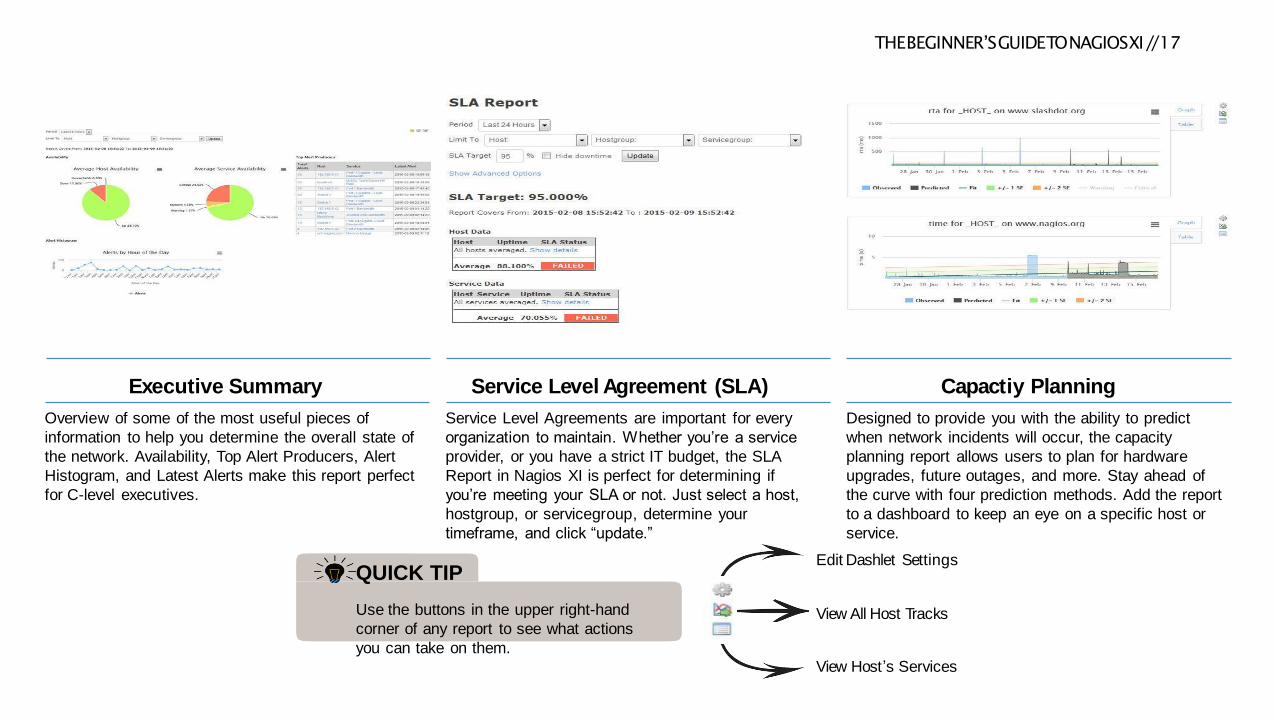
THEBEGINNER’SGUIDETONAGIOSXI//17
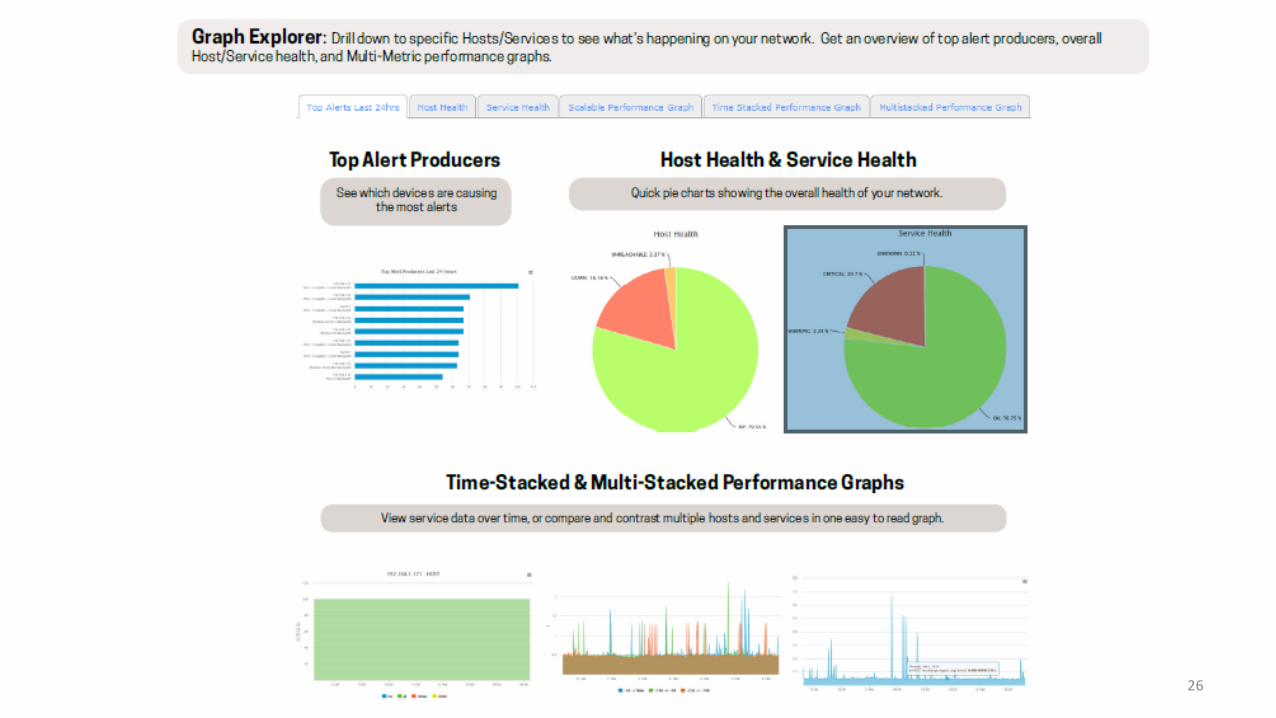
Overview of some of the most useful pieces of
information to help you determine the overall state of
the network. Availability, Top Alert Producers, Alert
Histogram, and Latest Alerts make this report perfect
for C-level executives.
Service Level Agreements are important for every
organization to maintain. Whether you‟re a service
provider, or you have a strict IT budget, the SLA
Report in Nagios XI is perfect for determining if
you‟re meeting your SLA or not. Just select a host,
hostgroup, or servicegroup, determine your
timeframe, and click “update.”
Designed to provide you with the ability to predict
when network incidents will occur, the capacity
planning report allows users to plan for hardware
upgrades, future outages, and more. Stay ahead of
the curve with four prediction methods. Add the report
to a dashboard to keep an eye on a specific host or
service.
Executive Summary Service Level Agreement (SLA) Capactiy Planning
QUICK TIP
Use the buttons in the upper right-hand
corner of any report to see what actions
you can take on them.
Edit Dashlet Settings
View All Host Tracks
View Host‟s Services
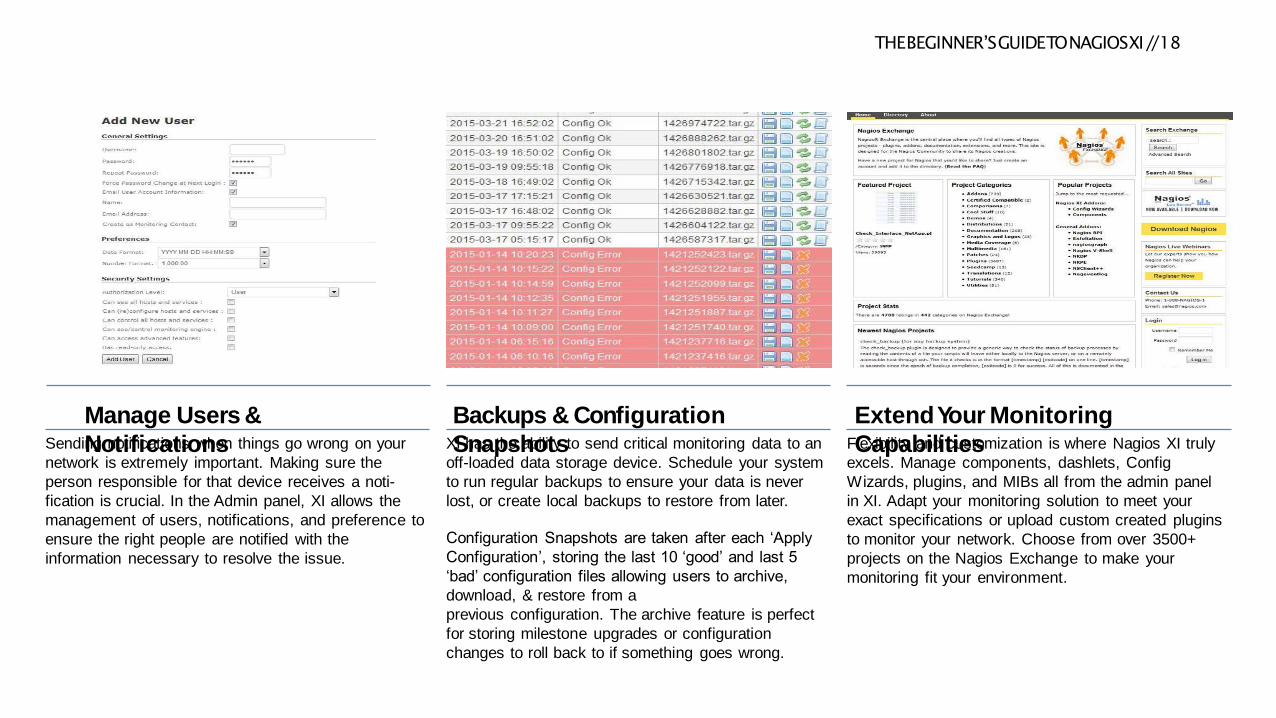
THEBEGINNER’SGUIDETONAGIOSXI//18
Manage Users &
Notifications
Backups & Configuration
Snapshots
ExtendYour Monitoring
CapabilitiesSending notifications when things go wrong on your
network is extremely important. Making sure the
person responsible for that device receives a noti-
fication is crucial. In the Admin panel, XI allows the
management of users, notifications, and preference to
ensure the right people are notified with the
information necessary to resolve the issue.
XI has the ability to send critical monitoring data to an
off-loaded data storage device. Schedule your system
to run regular backups to ensure your data is never
lost, or create local backups to restore from later.
Configuration Snapshots are taken after each „Apply
Configuration‟, storing the last 10 „good‟ and last 5
„bad‟ configuration files allowing users to archive,
download, & restore from a
previous configuration. The archive feature is perfect
for storing milestone upgrades or configuration
changes to roll back to if something goes wrong.
Flexibility and customization is where Nagios XI truly
excels. Manage components, dashlets, Config
Wizards, plugins, and MIBs all from the admin panel
in XI. Adapt your monitoring solution to meet your
exact specifications or upload custom created plugins
to monitor your network. Choose from over 3500+
projects on the Nagios Exchange to make your
monitoring fit your environment.
Slide 34© 2017 scmGalaxy.com www.DevOpsSchool.com
How Checks Work
A node/host/device consists of one or more service checks (PING, HTTP, MYSQL, SSH, etc)
Periodically Nagios checks each service for each node and determines if state has changed. State changes are:
CRITICAL
WARNING
UNKNOWN
For each state change you can assign:
Notification options (as mentioned before)
Event handlers (scripts, actions to take)

Slide 35© 2017 scmGalaxy.com www.DevOpsSchool.com
How Checks Work
Parameters: Set in /etc/nagios3/nagios.cfg: Normal checking interval
Re-check interval
Maximum number of checks.
Period for each check
Services check(s) only happen when a node responds (ping check or “is alive = yes”): Remember a node can be:
DOWN
UNREACHABLE
(What's the difference?)
Slide 36© 2017 scmGalaxy.com www.DevOpsSchool.com
How Checks Work: 2
In this manner it can take some time before a host changes its state to “down” as Nagios first does a service check and then a node check.
By default Nagios does a node check 3 times before it will change the nodes state to down.
You can, of course, change all this. /etc/nagios3/nagios.cfg
Lots of configuration settings and combinations
Default settings have been tested for large install
Slide 37© 2017 scmGalaxy.com www.DevOpsSchool.com
GLOSSARY
Active Check
A check that is initiated and performed by Nagios Core or Nagios XI - usually on a pre-determined schedule. Plugins are used to perform
active checks.
Agent
Software that is installed on servers/workstations so they can be monitored. Agents are available for Windows and Linux machines/
servers. In contrast, agentless monitoring refers to the ability to monitor a machine without having to install an agent on it - usually using
SNMP or WMI.
Alert
A check that is initiated and performed by Nagios Core or Nagios XI - usually on a pre-determined schedule. Plugins are used to perform
Auto-Discovery Wizard
Nagios XI has a builtin Auto-Discovery wizard. When running an Auto-Discovery job the user will enter an network of addresses they would
like to scan and a job is created which utilizes fping and nmap to scan the network defined for alive machines and then performs an nmap
scan on the host to determine which ports it is listening on. The results of the Auto-Discovery scan additionally report the OS of the
machine discovered as well as all of the ports the host is listening on. A user can then optionally pass these results into a wizard that will
monitor to make sure all of these ports continue to be responsive.
Slide 38© 2017 scmGalaxy.com www.DevOpsSchool.com
Config Snapshots
When the configuration is applied in Nagios XI a snapshot is made of the current configuration. These configuration snapshot are stored and used to automatically roll back to the last known good configuration if a configuration cannot be applied. Additionally, the configuration snapshots can be used to store good configurations and allow users to roll back to previously know good configurations.
Config Wizards
Configuration wizards guide users through the process of monitoring new devices, services, and applications – all without having to understand complex monitoring concepts. You can download Config Wizards at the Nagios Exchange.
Slide 39© 2017 scmGalaxy.com www.DevOpsSchool.com
Dashboard
In Nagios XI: A customizable page on which dashlets can be placed. Nagios XI offers each user the ability to have multiple dashboards for customized views of important data.
Dashlet
A moveable container that can be placed on a dashboard in Nagios XI. Different dashletsprovide performance graphs, custom HTML, and other data.
Device
Any machine or component that attaches to a computer. Examples of devices include disk drives, printers, mice, and modems.
Slide 40© 2017 scmGalaxy.com www.DevOpsSchool.com
Host
In Nagios XI, a Host is a device that is monitored. Generally a server, VM, switch/router, or other network device.
Host Group
A host group is a collection of hosts that share access to storage array volumes. Creating host groups lets administrators use the combined processing power of the host group computers to access the volumes.
Slide 41© 2017 scmGalaxy.com www.DevOpsSchool.com
Nagios Exchange
Nagios Exchange is the central place where you’ll find all types of Nagios projects - plugins, addons, documentation, extensions, and
more. Nagios Exchange is designed for the Nagios Community to share its Nagios creations. Have a new project for Nagios that you’d like
to share? Just create an account and add it to the directory.
Notification
Nagios supports optional escalation of contact notifications for hosts and services. Escalation of host and service notifications is
accomplished by defining host escalations and service escalations in your object configuration file(s). Once a notification is escalated,
the contact/groups and notification options for the object will be overridden by the escalation’s settings.
NRDS
NRDS is a component pre-installed on a Nagios XI server that allows the administrator to create and manage configurations and plugins
to be deployed with a passive agent that can be installed on a variety of operating systems including Windows, Linux, AIX & Solaris. The
passive agents downloads the current configuration and the required plugin from the Nagios XI server and run the checks and posting the
results to the XI server.
Slide 42© 2017 scmGalaxy.com www.DevOpsSchool.com
Passive Check
A check that is performed by an external application, operating system, or device and is submitted to Nagios Core or Nagios XI for processing. Some monitoring agents - including NSCA, NCPA, and NRDP can be used to send passive checks to Nagios. An SNMP trap is also considered a passive check.
Plugins
Plugins allow you to monitor anything and everything with Nagios - databases, operating systems, applications, network equipment, protocols and more. Nagios Plugins can be found on the Nagios Exchange.
Report
Nagios XI provides users the ability to measure effectiveness of specific hosts, services, and business processes to determine if service-level agreements are being met. Schedule reports to be sent on a recurring basis for quick and accurate network performance statistics.
Slide 43© 2017 scmGalaxy.com www.DevOpsSchool.com
Service
A metric on a particular Host that is being monitored. For example, CPU usage, Memory usage, or HDD space. Nagios XI pricing does not count the number of services someone wants to monitor.
Service Group
A service group definition is used to group one or more services together for simplifying configuration with object tricks or display purposes in the CGIs.
SNMP Trap
Simple Network Management Protocol (SNMP) is a protocol-based network management system. SNMP traps are alerts generated by agents on a managed device.