Embed Size (px)
Citation preview


I N D E X
Sl No. Chapter / Context Page No. 1. History of the AMC 12 1.1 Origin and History 11 1.2 Location of the City 11 1.3 Climate 11 1.4 Regional Settings 11 1.5 History & Culture 11 1.6 Evolution of Agartala City 12 2. Strengths & Opportunities of the AMC 23 2.1 Strengths 22 2.2 Opportunities 33 3 Weakness & Special Problems of the AMC 34 3.1 Weakness 33 3.2 Threats 34 4. Strategies of Development of the AMC 410 4.1 Overall priority rankings on Infra. Issues 44 4.2 Shared City Vision & Sector Goals 45 4.3 Sector Goals & Strategies 56 4.4 City Investment needs 66 4.5 The Financing Strategies 78 4.6 Methodology 99 4.7 Conclusion 99 5. Profile at a glance 1011 6. Assessment of the Financial Resources 1212 7. Summery of the AMC Plan for 201011 1314 8. Agriculture & Allied Sector 1517 8.1 Proposed activities of Agri. Department 1616 8.2 Proposed activities of Fisheries Department 1616 8.3 Proposed activities of ARD Department 1717 9. Roads & Bridges 1818 10. Drinking Water 1921 10.1. JNNURM (Drinking Water) 1919 10.2 ADB Project 1919 10.3 PWD Water Resources 2020 10.4 Water Supply Scheme 2121 11. Sanitation, Drains & SWM 2223 12. Urban Housing 2424 13. Power 2525 14. Education 2626 15. Health 2728 15.1. Proposed Health Activities 2828 15.2 Hospitals in AMC area 2828 16. Industries & Institutional Finance 29.29 17. Employment 3030

Sl No. Chapter / Context Page No. 18. Markets & Transport 3131 18.1 Markets 3131
18.2 Transportation 3131 19. Sports & Culture 3233 19.1 Parks 3232 19.2 Infrastructure Dev. of Sports activities 3333 20. Welfare of ST, SC, OBC, RM 3434 21. Slum Improvement 3535 22. Other Infrastructure Dev. 3636
AGARTALA MUNICIPAL COUNCIL
PREFACE
The Agartala Municipal Council is committed to provide all civic
amenities to its citizens. Keeping this in mind, the City Development Plan
(CDP) for Agartala city has been initiated by the AMC as approved by
Government of Tripura in the U.D.Deptt. with a perspective of 2006-2021
under the Jawaharlal Nehru National Urban Renewal Mission (JNNURM), a
scheme of Government of India. The objectives are (i) improvement of the
economic and physical infrastructure for the rapidly increasing urban
population and (ii) provision of essential facilities and services to citizens.
The main thrust is to improve water supply, sewerage and sanitation,
drainage, solid waste management, roads and street lighting, energy and
housing. Moreover, at the time of preparation of the city plan the points of
land availability, land suitability, ongoing, committed and proposed major
activity nodes and stakeholders’ perception, has also been taken into
consideration.
It is evident that the city growth would likely to occur on two
directions: (i) North of Katakhal River along the airport road; and (ii) South
of Haora River along the National Highway. Accordingly State Govt. and
AMC have taken up projects of various types and magnitude on two
directions. The major projects include (a) Capital Complex on Airport Road;
(b) Railway Station on the southern part of Agartala; (c) By-pass
connecting NH of Udaipur road to Manu road on the east; (d) Medical
College on the western part; (e) Bus Terminal on south of Haora river; and
(f) Hotel complexes on the north of Katakhal River.
CHIEF EXECUTIVE OFFICER AGARTALA MUNICIPAL COUNCIL

N A G A R O D A Y
ANNUAL PLAN: 2010-11, 2011-12 & 2012-13
AGARTALA MUNICIPAL COUNCIL
1. HISTORY OF THE AGARTALA MUNICIPAL COUNCIL:
1.1. ORIGIN AND HISTORY
The Municipal Administration in Agartala was established in 1874 A.D and the city became a planned city during the reign of Maharaja Bir Bikra Manikya Bahadur in 1940s. This erstwhile Princely State Capital of Tripura merged with India on 15th October 1949. The city has become the nerve center of all political, administrative, cultural and commercial activities of the state.
1.2. LOCATION OF THE CITY
Agartala, the capital of Tripura, is situated along 23° 45’- 23° 55’ N latitude and 91°15’- 91°20’ E longitude, in the flood plains of the Haora River. The city has been an important border-trading town with trading linkages with Bangladesh. The National Highway (NH)-44 connects Agartala with Assam. Agartala is connected by air to rest of the country. Very recently, Agartala is connected with rest of the country by Railways. The city is bounded by Bangladesh on the western direction, Jirania R.D. Block on the East, Monhanpur R.D. Block on the North and Dukli R.D. Block.
1.3. CLIMATE
The climate of Agartala is of tropical monsoon type. The average annual rainfall is around 220 centimeters (cm). The average number of rainy days is 100 days. The winter period is from November to February, summer is from March to May and monsoon is from June to September.
1.4. REGIONAL SETTINGS
Agartala is located on the major corridors of movement in the West Tripura District of Tripura. Being a capital city, it is a center of all political, administrative, cultural and commercial activities. Agartala is situated on the Assam-Agartala- Sabroom Road (NH-44). The surface communication with the rest of the country is only by NH-44, which connects Agartala with Silchar, Guwahati and other towns of Assam. Some major district roads also connect Agartala with other parts of the State.
1.5. HISTORY AND CULTURE
The city has a historical background. The ancient capital of the then princely State ‘Swadhin Tripura’ was at Rangamati (Udaipur, South Tripura) by the bank of the river Gomti and in 1760 A.D. It was shifted by the Maharaja Krishna Manikya to the site of old Agartala by the bank of river Haora and was named ‘Old Haveli’. The Capital city of Agartala was founded in 1838 AD by Maharaja Krishna Kishore Manikya (1830-49 A.D.).
1.6. EVOLUTION OF AGARTALA CITY
Pre-independence / Princely Regime
1838: Maharaja Krishna Kishore Manikya set up the ‘Old Haveli’ at the other side of the river Howrah. Due to frequent invasion of the Kukis and also to keep easy communication with the British Bengal, the Maharaja started the process of shifting of the Capital from Old Haveli to New Haveli (present Agartala) in the year 1849 A.D.
1862: Bir Chandra Manikya started the urbanization of the New Haveli (Agartala).
Contd.p/2

(2)
1871: The Agartala Municipality was established within area of 3 sq. miles having population 875 only by a royal proclamation. Agartala is inhabited mainly by Bengali communities along with 19 scheduled tribes of Tripura. Bengali and Tripuri are the state's official languages. The other important language is Manipuri. Hinduism is the religion of most of the people. There are also small minorities of Muslims, Buddhists, and Christians The tribals, with a rich and varied culture, belong mainly to the Reang, Chakma, Halam and Usai communities.
1874: Municipal regulations were introduced with provision of taxation.
1919-20: New Municipal Committee was formed with 9(nine) nominated members.
Post –independence
1951: The 1st General Municipal election was held on 5th November 1951 for electing 18 members of the municipal committee.
1955 to 1978: Agartala Municipality was under government nominated administrator. By a notification of the Ministry of Home Affairs, Govt.of India, the Bengal Municipal Act, 1932 with some modifications, was extended to the Union Territory of Tripura with effect from 15th August 1961.
1978: Agartala Municipality was divided into 10 wards for the purpose of election of commissioners for the municipality by enlarging the municipal area to 10.94 sq.km. The second general municipal election was held in June 1978, Shri Amal Dasgupta was elected chairman of the 10 members elected municipal board. The municipality was further extended to an area of 15.81 sq.k.m and was divided in to 13 wards. The 3rd general municipal election was held in July 1983. 1988 to 1996: The municipality was placed under government nominated administrator. 26 October 1994: The Tripura Municipal Act.1994 was passed as per 74th amendment of the Constitution of India, The 4th general Municipal election was held in December, 1995, and municipal council of 17 elected members and 3 nominated members was formed. After the 5th general municipal election held in the month of December 2000n another municipal council with 17 elected members and 3 nominated members came to power. The municipal area was 16.012 sq. k.m. with population of 1,89,998 as per 2001 census. 2004: The Agartala Municipal Council area has further been extended from 16.012 sq km to 62.02 sq km in 2004 with a population of 368493 persons. The last general election was held in 2005 in the AMC area including the extended area with 35 members. The body is headed by the Chairman Shri Sankar Das. 2. STRENGTHS AND OPPORTUNITIES OF THE AMC:
2.1 Strengths:
Agartala is the capital city of Tripura. Being the seat of administrative power, it is the center
of administrative, economic and political activities. The city has several strengths. These have been outlined in Table given below. The strengths related to the sectors include location and regional linkage, tourism, trade and commerce, traditional arts and crafts and state reforms.
Sectors Strengths
Location & Linkages
Being the capital of the state, Agartala is the main administrative, center of Tripura. National Highway 44 connects Agartala to Assam and rest of India by road. Agartala is also connected by Air. National Highway 44 has been extended to South, thus improving the road connectivity
between Agartala & South Tripura.
Trade & Commerce
Locally made handicrafts of bamboo products. Border trade with Bangladesh. Increasing import export activity. Tourism. Fruit & Horticulture Industry. Handloom and textiles.
Traditional Arts & Crafts Strong Traditional Arts & Crafts production.
State reforms Presence of a number of development bodies & NGOs Implementation of 74 CAA in true spirit.
Others Rich History and Culture Heritage. Rich in natural resource base.
Contd.p/3

(3)
2.1 Opportunities:
The city has several aspects that are potential Opportunities for the city. The main Opportunities
are in the area of economic growth, proposed projects, state urban reforms and heritage. These have been detailed in Table given below.
Sectors Opportunities Economic
competitiveness Attracts many potential developers in the economic & industrial sectors. Border Trade. Vibrant Tourism..
Proposed Project Improve infrastructure facilities – Water supply, drainage, transportation, sanitation. Improve quality of life. Re-structure taxes of AMC.
State Urban reforms Enforce building by laws and other related development laws. Focus on provision of basic services to the poor.
Heritage Rich heritage – Palace Complex and water bodies attracting tourists. Local crafts – great opportunity for attracting businesses & shoppers.
Apart from these, the elected public representatives, strong Engineering Setup, good number staff
strengths are being the great opportunities of AMC.
3. WEAKNESSES AND SPECIAL PROBLEMS OF THE AMC : 3.1 Weaknesses:
The major areas of weaknesses for the city include infrastructure, Urban growth, conservation, environment, slums and institutional capacity. Sectorwise weaknesses of the city are detailed below:
Sectors Weaknesses
Infrastructure
Poor and inadequate infrastructure. Road Encroachment, poor Traffic management and inadequate public transportation. Very poor drainage system. Poor Solid Waste Management. Inadequate public conveniences.
Urban Growth
Haphazard unregulated growth of the city. High population density within AMC area. Lack of mechanisms for enforcement of development controls and byelaws.
Trade and Commerce
Poor Industrial infrastructure. Limited scope for economic development. Lack of business capital in the community / regional financial institutions.
Conservation Lack of awareness among the people towards heritage conservation. No initiatives from the government for conservation and maintenance of the places of historic
importance.
Environment Vulnerability due to poor drainage. Poor infrastructure and living condition.
Slums Increasing levels of poverty & inadequate coverage of poverty alleviation programs.
3.2 Threats:
Threatening are the preliminary existing weakness, if not addressed adequately might pose as threats for development of the city in the future. These are detailed out in the Table given hereunder.
Sectors Threats
Infrastructure
High Population Growth increase in pressure on infrastructure in the Greater Agartala planning area.
Absence of sewerage network- unhealthy living. Poor infrastructure which is a Threat to ensuring good quality of life..
Institutional and fiscal reforms
Inadequate capacity building results in non-implementation of reforms. Inadequate fiscal reforms for carrying out projects and provision of infrastructure in a
sustainable manner. Lack of efficient marketing of city & state highlighting its USPs
Slums Increasing no of unidentified slums in and around the city. Infrastructure provision in the slums is inadequate leading to poor living conditions.
Others Illegal immigrants from Bangladesh.
Contd.p/4

(4)
Besides these, insufficient flow of fund, inadequate number of skill staff is some of the
weakness. Moreover, acute threats of AMC are flood, earth quake also other natural calamities.
4. STRATEGIES OF DEVELOPMENT OF THE AMC :
4.1 Based on the City Development Plan(CDP) for Agartala, prepared in 2006, sewerage sector has got the topmost importance followed by water supply and road sector for interventions. The quality of the present service delivery and significance of the service can be adjudged from the prioritization of issues and the responses accorded to each sector by the stakeholders.
Based on the CDP, 2006 the overall priority rankings on Infrastructure Issues are:-
Sewerage Water Supply & Drainage. Transportation. Solid Waste Management.
4.2 Shared City vision and Sector Goals
City Development Plan (CDP) 2006 for Agartala city has been initiated by Government of Tripura under the Jawaharlal Nehru National Urban Renewal Mission (JNNURM), a scheme1 of Government of India. The objective of the JNNURM scheme is to improve the economic and physical infrastructure for the rapidly increasing urban population and also to provide essential facilities and services across the fast growing cities using public private partnership. The projects that qualify under this scheme include sub-sectors of water supply, sewerage and sanitation, drainage, solid waste management, roads and street lighting, energy and housing. It has a time horizon for a period up to 2021.
Vision Statement as per the CDP, 2006:
Making Agartala ‘gateway to North East India, eco-friendly, green & clean city sustainable where people want to live, visit and invest’ through:
Provision of basic infrastructure and urban services for all, towards achieving improved quality of life Develop all the water bodies and increase the green coverage of Agartala. Improve Educational achievements for all the citizens. Alleviate poverty and improve living conditions and health.
Sector Vision:
A targeted approach has been worked out to achieve the vision objectives through setting goals for the development of each of the sectors. The under noted table provides a vision for each of the sectors.
Sectors Vision
Water Supply To ensure access to drinking and safe water supply to all.
Sewerage and Sanitation
Towards coverage of the densely populated pockets of the city with an underground sewerage system and promote environmentally safe sanitation practices for treatment of wastewater.
Solid Waste Management
To achieve environmentally sustainable Waste Management Practices.
Roads & Transportation To improve operational efficiencies of the present network, develop new roads for
decongestion of the city core and development of a core road network to facilitate development in the Northern part of the city.
Urban Environment To promote a healthy, clean environment with emphasis on creation of a safe and
livable city, with adequate provisions of recreation and green spaces. Slums Development
and Poverty Alleviation To provide access to housing and basic infrastructure.
City Economic Development
To create diversified economic base.
Urban Growth & Land Management
To achieve a coherent Urban from with adequate open and green space, high standards of infrastructure and effective and management.
Urban Governance & Intuitional Development
To promote a city managed with pro-active institutions and capable staff.
Urban Finance To achieve a city that is a model for Urban Finance Management.
Contd.p/5

(5)
The CDP, 2006 has defined target for the achievement of the vision and goals with a time frame. It is targeted that 80% people would be covered by drainage and flood control, SWM and roads by the year 2011. Water Supply and sewerage has been targeted for 90% and 60% coverage by the years 2010- 11, 2011-12.& 2012-13.
4.3 Sector Goals and Strategies:
The vision for each of the sectors, their development strategies with respect to their issues have been detailed out. The strategies aim at giving shape to the envisioned goals for the city.
Vision Existing Issues Strategies
Water Supply: To ensure access to assured and safe drinking and water to all
Non utilization of optimum capacity of the water treatment plant.
Underproduction from ground water. High iron content in ground water. High operation and maintenance cost. High amount of unaccounted for water (UFW), presently about 35% of production.
Severely deteriorated distribution system, particularly in the older parts of the city.
Water Resource management. Extension of water supply services to uncovered area.
Cost recovery Mechanism. Efficiency in operation and maintenance replacement of old machinery and network systems.
Capacity building of staff. Reduce transmission and distribution losses.
Efficiency in service delivery. Streamlining institutional responsibilities.
Sewerage and Sanitation: To promote safe and environmentally friendly city by ensuring effective treatment and disposal of wastewater and to eradicate open defecation.
Absence of sewerage system. Direct disposal of sewerage and effluent into drains and open spaces.
Open defecation widespread. Lack of enclosed bathing spaces in the slums and low – income areas.
Provision of underground sewerage system.
Provision of household sewer connection.
Provision of public toilets to prevent open defecation.
Solid Waste Management : To achieve environmentally sustainable waste management practice
Waste collection Ltd. to selected area. Inefficient waste collection and transportation.
No segregation of waste at source. Waste disposal not as per solid waste handling Rules 2000.
Lack of awareness on hygiene practices.
Initiate house to house waste collection with source segregation.
Provide mechanized storage bins. Regular maintenance of the container bins.
SWM coverage areas to be increased.
Adopt segregation of biomedical waste with MSW.
Refuse vehicles shall be covered to reduce waste spillage during transportation.
Provide Bio-Gas compost plant. Drainage : Absence of proper drainage system.
Most of the drains unlined and choked with silt and solid waste.
Water logging and flooding common during rainy season.
Construction of lined drains along roads.
Construction of embankments along Katakhal River and Howrah River.
Rising of embankments along Katakhal River.
Transportation : To achieve a transport facility system i.e. adequate, safe comfortable, and Equitable and is efficient and sustainable
Encroachments by vehicles. Low operating speeds. Congestion in the city. Inadequate parking space. Improper traffic management. Poor public transportation system. Lack of pedestrian facilities. Inadequate road capacity.
Capacity building of existing public transport system.
Development of new bypass roads as arterials to decongest the city.
Development of an efficient road network in the northern & southern part of the city to attract development.
Involvement of private players. Road and junction improvements. Identification of designated parking areas.
Develop traffic management system.
Efficient public transport system. Promoting safe pedestrian movement.
Contd.p/6

(6)
Vision Existing Issues Strategies Slum Up- gradation : To provide access to housing and basic infrastructure
Lack of basic urban infrastructure within the slums.
Most of the Slum population engaged in low return income generating activities.
Coverage in terms of target population and target areas of the slum up-gradation and poverty alleviation programs insufficient.
Lack of awareness among the people about poverty alleviation programs.
Provision of basic services to Urban poor.
Providing opportunities for income generation.
Improvement in housing condition. Slum up-gradation and improvement.
Urban Environment : To promote a sustainable and congestion free urban environment with emphasis on safe and livable city for present future generations
Congestion & poor infrastructure. Contamination of water. Absence of sewerage network leading to drains acting as the conduits of sewage disposal.
Indiscriminate dumping of garbage and solid waste into drains and open spaces.
Absence of parks and open recreation spaces.
Identify and develop norms for ecologically fragile zones.
Reduce pollution. Develop parks and water bodies conservation of architectural buildings.
City Economic Development : To create a vibrant city with diversified economic base.
Increasing marginalization & casualisation of labour.
High & rising levels of unemployment. Low levels of industrial development. No organized commercial spaces for retain markets.
Inadequate tourism infrastructure.
Integrated tourism development plan.
Create organized commercial space for retail and wholesale markets.
Urban Growth & Land Management : To achieve a coherent urban form with adequate open & green space, high standards of infrastructure and effective land management
Severe congestion in the core area specially the old municipality area with high density of population.
Unplanned growth of the city without any land use controls.
Lack of development control especially in the flood prone and low lying areas.
Introduction of appropriate land management practices.
Implementation of land use plans. Preparation of land suitability assessment for the city.
Urban Governance & Intuitional Development : To promote a city managed with pro-active institutions and capable staff.
Lack of accountability and transparency in functioning of AMC.
Poor data base and information management.
No implementation of bye laws.
Training to enhance capacity building.
Collective action especially in programs for solid Waste Management, water resources management and slum up-gradation.
People’s participation in Governance.
CITY INVESTMENT NEEDS
4.4 The CDP has assessed Capital Investment Needs for Agartala up to 2021, according to which the total investment requirement would be Rs. 1518.36 Crores for Urban Infrastructure and Governance Sub-Mission, and another INR 77.66 Crores for the Basic services for the urban poor Sub-Mission. This has been tabled below:-
Estimated Investment requirements under JNNURM (Rs. Lakhs)
Project Components INVESTMENT NEEDS @ 2006 prices (Rs. lakhs)
A Sub Mission 1-Urban Infrastructure and Governance 1 Water Supply 13338.24 2 Sewerage & Sanitation 27861.95 3 Storm Water Drainage 6183.68 4 River Embankment 3214.44 5 Solid Waste Management 379.35 6 Traffic and Transportation (Road Improvement, Intersection
improvement, Flyovers, Parking, Terminals) 40758.46
7 Street Lighting 4680.00 8 Parks & Development of playgrounds 1791.63 9 Construction of Indoor Stadium & Stadium 8106.00
10 Other Enabling Development Projects 40686.25 11 Preservation of water bodies 700.00 12 Heritage and conservation 1136.96 13 Urban Governance & Capacity Building 3000.00
Sub Total 151836.95 B Sub Mission 2: Basic services to the poor 1 Slum area Improvements (42 nos slums) & Slum Housing 7766.88 C Total Investment needs 159603.89
Contd.p/7

(7)
4.5 The Financing Strategies based on CDP.
Toolkit – 1 of the JNNURM process explains the funding pattern and sanction and disbursement of the assistances. According to the size of the population, Agartala city falls under category C for the purpose of funding. Accordingly, for the purpose of Sub-Mission on Urban Infrastructure and Governance projects, Agartala is eligible for a grant covering 90 percent of the cost from the Central government and the remaining 10 percent to be raised by the State Government, from either own sources or from borrowings. As regards the Sub-Mission for basic services for urban poor, 90 percent of the cost will be from the Central government and the remaining 10 percent needs to be raised by the State government.
Given the total requirement, the funding pattern of the new investment for Agartala city could be given under Table. The total share of the Central government would be INR 1436.43 Crores, while that of the State government of Tripura would be INR 159.60 Crores.
Funding Pattern of the new investment for Agartala City - Contribution by different levels of government (Rs Lakhs)
Sector
Total Investment Needs (2006
prices)
Central Govt. (JNNURM Funding)
(90%)
State Govt. Share (10%)
Sub Mission 1: Urban Infrastructure and Governance Water Supply 13338.24 12004.42 1333.82
Sewerage and Sanitation 27861.95 25075.76 2786.19
Storm water drainage & River
Embankment
9398.12 8458.31 939.81
Solid Waste Management 379.35 341.42 37.93
Traffic and Transportation (Road
Improvement, Intersection
improvement, Flyovers, Parking,
Terminals)
40758.46 36682.61 4075.85
Street Lighting 4680.00 4212.00 468.00
Parks & Development of playgrounds 1791.63 1612.47 179.16
Construction of Indoor Stadium &
Stadium
8106.00 7295.40 810.60
Other Enabling Development Projects 40686.25 36617.63 4068.63
Preservation of water bodies 700.00 630.00 70.00
Heritage Conservation 1136.96 1023.26 113.70
Urban governance and capacity building 3000.00 2700.00 300.00
Sub Total 151836.96 136653.28 15183.69
Sub Mission 2: Basic Services for Urban Poor
Slum Development and Housing 7766.88 6990.19 776.69
Total 159603.84 143643.47 15960.38
Source : CDP, Agartala (2006 - 21)
Contd.p/8

(8)
The share of investment needs by various institutions would be as in Table given below:
Funding Pattern by Institution for Agartala City (Rs. Lakhs)
Sl No Sector
Total Investment
Needs (2006 prices)
Central Govt. (JNNURM Funding) (90%)
AMC UDD DWS PWD TSECL
Sub Mission 1: Urban Infrastructure and Governance
1 Water Supply 13338.24 12004.42 12004.42
2 Sewerage and Sanitation 27861.95 25075.76 25075.76
3 Storm water drainage &
River Embankment 9398.12 8458.31 8458.31
4 Solid Waste Management 379.35 341.42 341.42
5 Traffic and Transportation (Road Improvement, Intersection improvement, Flyovers, Parking,Terminals)
40758.46 36682.61 36682.61
6 Street Lighting 4680.00 4212.00 4212.00
7 Parks & Development of
playgrounds 1791.63 1612.47 1612.47
8 Construction of Indoor
Stadium & Stadium 8106.00 7295.40
7295.40
Sub Mission 1: Urban Infrastructure and Governance
9 Other Enabling Development Projects
40686.25 36617.63 36617.63
10 Preservation of water bodies
700.00 630.00 630.00
11 Heritage Conservation 1136.96 1023.26 1023.26
12 Urban governance and capacity building
3000.00 2700.00 2700.00
Sub Total 151836.96 136653.28 50220.18 8458.31 37080.18 36682.61
4212.00
Sub Mission 2: Basic Services for Urban Poor
1 Slum Development and Housing
7766.88 6990.19 6990.19
Total 159603.84 143643.47 57210.37 8458.31 37080.18 36682.61 4212.00
16 (% By institution) 100 39.8 5.9 25.8 25.5 2.9
Source : CDP, Agartala (2006 - 21)
Contd.p/9

(9)
4.6 METHODOLOGY FOR PREPARATION OF NAGARODAY OR AMC 3 –YEARS PLAN (2010-13)
The 3 Year Plan for AMC area has been prepared by a team constituting of CEO, OSD
(Admn.), OSD (Dev), PRO, Asstt. Engineer (Div-II). The Team held meeting twice with the different Departments (Line), Executives Officers, Executive Engineers and other AMC Officials. Further, at the time of plan preparation, details were discussed with the CPC Members and Council Members in meetings.
The Plan is enriched by the secondary data available in the perspective plan 2006-2021
(CDP) for Agartala City; information fed by different Line Departments; various wings of AMC Headquarters Offices and Zonal Offices. To a very limited extent primary data has been collected through the interactions during consultations with officials.
Limitations for preparation of Nagaroday (2010-13)
Although, the information required has been discussed at length with officials, the feed
back received has not been to to . In few instances, some columns have remained blank while sending the information by some line departments. Some Departments like SC, OBC, ST, RM have not responded with information feed back on the point that these Departments have hardly any development Schemes in AMC area.
4.7 CONCLUSION :-
The Nagaroday (2010-13) for AMC will be doable plan provided the resources are
mobilized on time with efficiency. For translating the plan into action, efforts need to be made to travel through trajectory of strategy and Stream Lining it into tasks, activities with calendaring.
Capacity Building of the staff of the AMC and acquaintance with the AMC’s vision, Mission and Objectives is a must to absorb the additional fund Flow.
Hopefully, energies will be focused to make Agartala a Clean Geer and Livable City with improvement of quality of life of its citizens.
Contd.p/10

(10)
5. Profile of the AMC, at a glance
1. Total Geographical Area a) Length of border with Bangladesh or other Indian States b) Length of barbed wire fencing built so far
2. General Administration: a) Total Number of Wards b) Total Number of Hamlets( Based on Delimitation of Municipal Wards) c) Number of PS/ OPS/ Security Posts located within AMC
3. Human Resources Total Population (i) Male (ii) Female (iii) No. of children below 6 (six) years (iv) No. of children between 6 to 14 years
4. Social Status Total Number of Families a) ST families b) SC families c) OBC families d) Minorities e) Others
5. Economic Status i) Illiterate (No.) 15-50 yrs. ii) BPL families (No.) iii) APL families (No.) iv) Total Homeless families (No.) v) Total Job (TUEP) Card Holder families vi) Total Un-employed vii) Total Educated Un-employed
6. Occupational Status a) Total number of families b) Main Occupation (by main source of Income)
i) Agriculture & Allied Activities ii) Day Labourer iii) Household (HHS) Industries iv) Small scale & other Industries v) Artisans (Weaver, Porter, Carpenter etc.) vi) Trade and Business vii) Service
A) Government & Govt. Undertaking B) Private Offices
viii) Transport ix) Construction x) Others xi) Not Reported (a-b)
7. Institutional Facilities. a) No. of Destitute Home for Women b) No. of Destitute Home for Children c) No. of Old Age Home d) No. of Night Shelter e) No. of Flood /Disaster shelter f) No. of Cremation / Burial Ground h) No. of Slaughter House
8. Industries and Finance a) Total no. of cottage and household industries. b) Total no. of Small Scale industries. c) Total no. of Banks and Credit Societies.
9. Co-operative Societies and SHG a) Total number of LAMPS / PACS b) Other Co-operative Societies No. c) Total No. of Self Help Groups. Total Members of SHGs
62.60 Sq Km
6.5 Km. 6.5 Km
35 811
PS- 3 OPS- 8
394432 202481 191951 18690 41352
104240 4231 18118 19080 5869 56942
3116 21664
82576 1365 40626 58601 20272
104240
4200
32368 2458 255 3025 15223 22835
4219 1559
1509 10221
6368
01 02l
Nil Nil NA 05 Nil
2458 255 25
01( PACS) 241 890
10685 Contd.p/11

(11)
10. Slums a) Total no. of recognized slums b) Total no. of non-recognized slums 11. Nearest Tourist Spot Name and distance 13. Other important centers a) Handloom & Handicrafts Emporium, Purbasha.
b) Agartala Railway Station.
c) Chandrapur Bus Terminus
d) Agartala Govt. Medical College, G.B.
53
06
1) Ujjyanta Palace
2) Venuban Vihar
3) Rabindra Kanan
4) Nehru Park
5) Akhaura Check Post
6) College Tilla Echo Park.
7) Kamalasagar Kali Temple (28 Km.)
8) 14 God-Heads Mandir (5 Km)
9) Sepahijala Sanctuary (23 Km)
Contd.p/12
(12)
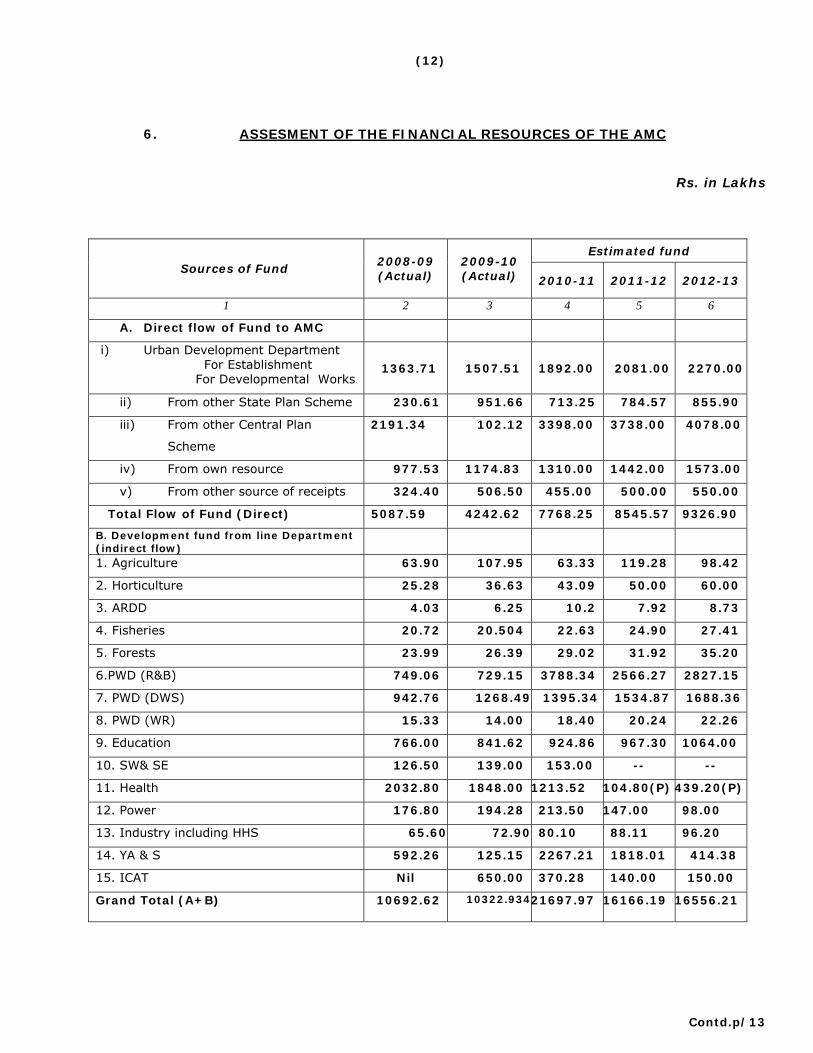
6. ASSESMENT OF THE FINANCIAL RESOURCES OF THE AMC
Rs. in Lakhs
Estimated fund Sources of Fund
2008-09 (Actual)
2009-10 (Actual) 2010-11 2011-12 2012-13
1 2 3 4 5 6
A. Direct flow of Fund to AMC
i) Urban Development Department For Establishment For Developmental Works
1363.71 1507.51 1892.00 2081.00 2270.00
ii) From other State Plan Scheme 230.61 951.66 713.25 784.57 855.90
iii) From other Central Plan
Scheme
2191.34 102.12 3398.00 3738.00 4078.00
iv) From own resource 977.53 1174.83 1310.00 1442.00 1573.00
v) From other source of receipts 324.40 506.50 455.00 500.00 550.00
Total Flow of Fund (Direct) 5087.59 4242.62 7768.25 8545.57 9326.90
B. Development fund from line Department (indirect flow)
1. Agriculture 63.90 107.95 63.33 119.28 98.42
2. Horticulture 25.28 36.63 43.09 50.00 60.00
3. ARDD 4.03 6.25 10.2 7.92 8.73
4. Fisheries 20.72 20.504 22.63 24.90 27.41
5. Forests 23.99 26.39 29.02 31.92 35.20
6.PWD (R&B) 749.06 729.15 3788.34 2566.27 2827.15
7. PWD (DWS) 942.76 1268.49 1395.34 1534.87 1688.36
8. PWD (WR) 15.33 14.00 18.40 20.24 22.26
9. Education 766.00 841.62 924.86 967.30 1064.00
10. SW& SE 126.50 139.00 153.00 -- --
11. Health 2032.80 1848.00 1213.52 104.80(P) 439.20(P)
12. Power 176.80 194.28 213.50 147.00 98.00
13. Industry including HHS 65.60 72.90 80.10 88.11 96.20
14. YA & S 592.26 125.15 2267.21 1818.01 414.38
15. ICAT Nil 650.00 370.28 140.00 150.00
Grand Total (A+B) 10692.62 10322.93421697.97 16166.19 16556.21
Contd.p/13

(13)
7. SUMMERY OF THE AGARTALA MUNICIPAL COUNCIL PLAN FOR 2010-11
Sources of fund Sl
No. Name of Sector Total Plan
(Rs. in lakh) Deptt./Scheme Fund (Rs. in lakh)
1 2 3 4 5 Agri Deptt. 63.33
Horti Deptt. 43.09
Fisheries Deptt. 22.63
ARD Deptt. 10.20
PWD (WR) Deptt. 18.40
Forest Deptt. 29.02
01 Agri. & Allied (Including Irrigation)
186.67
Other source (specify) -
Total
Total
186.77
PWD Deptt. 2504.34 02 Road & Bridges 2504.34
Other source (specify): CSS- 2 RCC Bridge
----
Total
Total
2504.34
PWD (DWS) Deptt. 1380.34 03 Drinking Water 1395.34
Other source (AMC) 15.00
Total
Total
1395.34
PWD (DWS) Deptt. 4.00 04 Sanitation, Drains & Solid Waste Management (Operation & maintenance of 9 nos. drainage pump station)
2150.60
Other source (AMC) 2146.60
Total
Total
2150.60
BSUP 2430.00 2430.00
Other source (specify) --
Total Total
2430.00
Power Deptt. 213.50 06 Power 213.50
Other source (specify) --
Total
Total
213.50
School Education Deptt. 924.86 07 Education 1077.86
Other source (specify) 153.00
Total
9958.31
Total
1077.86
Contd.p/14

(14)
SUMMERY OF THE AGARTALA MUNICIPAL COUNCIL PLAN FOR 2010-11
Sources of fund Sl No. Name of Sector
Total Plan (Rs. in lakh)
Deptt./Scheme Fund (Rs. in lakh)
1 2 3 4 5 Health & F.W. Deptt. 1213.52 08 Health
1213.52 Others source (specify) --
Total
Total
1213.52
Industries Deptt HHS Deptt.
80.10 09 Industries & Banking
80.10 Others source (specify) --
Total
Total
80.10
10 Employment TUEP Rs. 2704.15
SJSRY
a) Subsidy against credit
b) Credit
3885.15
c) Others source (specify)
Bnf.Contribution+RF
302.00 807.00 1181.00 72.00
Total
Total
3885.15
Urban Dev. Deptt 1389.00 11 Markets & Transport 1389.00
Others source (specify) --
Total
Total
1389.00
12. Sports & Culture Sports & YA Deptt. 2267.21
ICAT Deptt. 3707.28
5974.49
Other source (Specify) -
Total
Total
5974.49
13. Slum Improvement IHSDP --
Other source (Specify) (2427.28)
Total
Total
2427.28
14. Other Infrastructure 1419.17 Sources to be specified 1419.17
Total
Total
1419.17
Total Plan Outlay
21697.97
Total Sources of funds
Contd.p/15

(15)
8. AGRICULTURE AND ALLIED SECTORS: PROFILE
PROFILE 1997-98 2007-08 Agriculture & Horticulture a) Total cultivable area b) Total net cropped area. c) Total irrigated areas. d) Total area under plantation / Orchards. e) Total vacant Khas land. f) Total Fallow land. Pisciculture a) Total area of water bodies b) Total area available for Pisciculture. c) Potential for creation of addl. water area for Pisciculture. Animal Resources i) Milch Cow ii) Pig iii) Goat iv) Poultry Birds v) Duck vi) Others (Specify) Sheep Rabbit Dog
NA NA NA NA NA NA
151.43 135.39
32.98
NA NA NA NA NA NA -- -- --
HA
1960.03 1932.03 1447.40 346.52
NA 340.98
266.25 256.23 25.40
991 Nos. 3924 Nos. 1.10 lakhs
12958 Nos. --
129 Nos. 288 Nos.
2371 Nos.
AGRICULTURE AND ALLIED SECTORS: PLAN Rs. in lakhs
PHYSICAL TARGET FINANCIAL REQUIREMENT PLAN UNIT TOTAL NEED IN 2010-11 2010-11 2011-
12 2012-13
2010-11 2011-12 2012-13
BALANC NEED (3-
4-5-6)
1 2 3 4 5 6 7 8 9 10
1. Agriculture /Horticulture/ Forest
Ha
1.1 Land reclamation/ Development
Ha 02 0.6 0.7 0.7 0.525 1.05 1.1
1.2 Horticultural crops/ Orchards / Plantation a) Horti. Deptt. b) Agri. Deptt.
Ha Ha
94.69 21.5
119.4 23.5
137.74
31.5
153.14
45.5
27.77
16.896
24.23
63.526
35.13
33.476
1.3 Road side Plantation No. 16000 4000 3000 3000 35.00 28.00 28.00 6000
Others Distribution of Agri equipments, SRI, Vermicompost etc.
Details is given
in Anex.I
45.9075 54.7075 63.8475
Sub-Total: Agri /Horti/Forest 126.098 171.513 161.55 6000
2.Pisiculture
2.1 Creation of new water bodies
Ha 18.85 1.50 2.26 3.14 4.50 7.34 10.99 11.95
2.2 Maintenance of existing water bodies
Ha 114.10 6.00 7.42 8.12 12.0 16.70 20.30 92.78
2.3 Supply of Inputs Ha 257.34 30.72 33.79 37.17 22.20 24.42 26.86 155.66
2.4 Training Nos. -- 746 1520 1550 0.186 1.36 1.56 --
Others(Distribution of fishing material )
1500 300 325 400 2.97 3.57 4.48 475
Sub-Total Pisiculture
3. Animal Resource Dev.
3.1.Training and Skill upgradation
No Ben
NA -- -- -- -- -- -- --
Self employment through NA -- -- -- -- -- -- --
3.2 Poultry (No. of Beneficiary) Ben NA -- -- -- -- -- -- --
3.3 Goatery Ben 10 10 NA NA 3.00 NA NA --
3.4 Piggery Ben NA -- -- -- -- -- -- --
3.5 Duckery Ben NA -- -- -- -- -- -- --
3.6 Milch Cow Ben NA -- -- -- -- -- -- --
Other activities
Sub-Total Animal Resources Dev.
Total : Agriculture and allied Sectors
297.0525
396.4165 387.2935
Contd.p/16

(16)
8.1 DETAILS OF OTHER ACTIVITIES PROPOSED TO BE TAKEN UP BY AGRI DEPTT.
PHYSICAL TARGET FINANCIAL REQUIREMENT
PLAN
UNIT TOTAL NEED IN 2010-11 2010
-11 2011-12
2012-13
2010-11 2011-12
2012-13
BALANC NEED(3-4-5-
6) 1 2 3 4 5 6 7 8 9 10
Agriculture Sri
Pulses
Ha Ha
823.75
08
240 02
269 02
298 02
12.0625
1.0
13.5125 1.0
14.9625 1.0
Others a) OPEN FIELD FLOWER CULTIVATION
Ha
110.5
22.5
30.5
44.5
17.15
23.15
33.65
b) VERMICOMPOST No 12 03 03 03 1.8 1.8 1.8 03
a) Agri. implements i) Pump Set ii0 Paddy Thresher iii) Spray Machine
Nos. Nos. Nos.
5
162 368
01 53
127
01 52
127
01 53
127
0.25
2.7 2.465
0.25 2.65
2.465
0.25
2.7 2.465
Paddy wider Nos. 1980 660 660 660 4.62 4.62 4.62
Power Tiller Nos. 59 13 19 27 2.6 3.8 0.54
Garden Tools Nos. 229 63 73 93 1.26 1.46 1.86 Grand Total 45.9075 54.7075 63.8475
8.2 ASSESSMENT OF THE FINANCIAL RESOURCES OF THE AMC.
FISHERIES:-
2008-09 2009-10 2010-11 2011-12 2012-13 Sl
No. Name of the
Scheme PHY FIN PHY FIN PHY FIN
1 Composite fish culture 8 unit 1.08 15 unit 1.875 5 unit 0.675
2 Semi intensive fish culture
8 unit 1.424 -- -- -- --
3 Cat fish culture in back yard prawn
10 unit 1.00 -- -- -- --
4 Supply of inputs of the poor small tank holder
200 unit 11.20 280 unit 16.24 300 unit
19.50
5 Identify village (Aralia) 10 unit 0.56 10 unit 0.65 10 unit 0.65
6 Assistance to the Primary fisherman Co-op society in form of Managerial subsidy & share capital
1 unit 0.27 1 unit 0.36 1 unit 0.24
7 Training to fish farmer onscientific fish culture
13 unit 0.22 56 nos. 1.00 -- --
8 One day motivates awareness camp
1470 0.3675 1480 0.37 745 unit
0.186
9 Reclamation of existing small water body of private tank
23 4.60 -- -- -- --
10 Fin fish culture (F.F.D.A)
-- -- -- -- 50 0.40
11 Fresh water prawn culture (F.F.D.A)
-- -- -- -- 25 0.70
12 Supply of basal dose to fisherman Co-op. society
-- -- -- -- 2.22 ha 0.278
Est
imate
d
24
.90
Est
imate
d
27
.41
TOTAL 20.7215 20.495 22.629
Contd.p/17

(17)
8.3 DETAILS OF THE PROPOSED ACTIVITIES OF ARDD IN AMC AREA
Sl No Particulars 2008-2009 2009-2010 2010-2011 2011-2012 2012-2013
1 2 3 4 5 6 7 A Medicine 1,36,079 2,62,100 2,88,310 3,17,140 3,48,855
B Vaccines 2,27,726 3,21,100 3,53,210 3,88,531 4,27,380
C Artificial Insemination 39,380 41,490 32,000 40,000 50,000
D SEP through Goatery
Dev. -- -- 3,00,000 -- --
E Fertility management
camp -- -- 21,000 21,000 21,000
F Castration through
Incentivisation -- -- 15,000 15,000 16,000
G Organizing milk
competition and Calf
rally
-- -- 10,000 10,000 10,000
Total 4,03,635 6,34,690 10,19,520 7,92,171 8,73,235
Contd.p/18

(18) 9. Road and Bridges Profile :
Profile 1997-98 2007-08 Total Length of Roads (Km.) a) Metalled (Black top) Road b) Brick- soled Road c) katcha Road d) Roads on which Vehicles can ply (all weather road) e) Roads fit only for pedestrians
Bridges and Culverts a) SPT Bridges (No.) b) Bailey Bridges (No.) c) RCC Bridges (No.) d) Culverts (No.) e) Other temporary bridges. (No.)
100.30
20.3 0
100.30
65.00
25 0 4
14 0
179.16 60.583 11.481 190.77
118.03
07 01 11
120 0
Roads and Bridges Plan : Rs. in lakhs
PHYSICAL TARGET FINANCIAL REQUIREMENT
PLAN
UNIT TOTAL NEED IN 2010-11 2010-
11 2011-12
2012-13
2010-11
2011-12
2012-13
BALANC NEED (3-4-5-
6)
1 2 3 4 5 6 7 8 9 10
4. Road Communication
4.1. Construction of New Road
Brick soling (AMC) Km 60.33 12.08 13.35 14.90 113.19 129.02 148.72 20.00
Metalled (BlacK top) (a)PWD
(b)AMC
Km 107.85
4.11
24.89 2.15
27.39 1.86
30.13 1.755
901.84 4.66
992.025.97
1092.22 7.45
25.44
Katcha Road Km 38.50 5.00 5.5 6.00 4.24 5.17 6.20 22.00
4.2. Improvement of Roads
Brick soling (AMC) Km 26.07 7.80 8.65 9.62 3.51 4.10 5.29 8.56
Metalled (Black top) (a)(PWD) (b)AMC
Km 110.00 7.95
30.00 2.40
32.70 2.64
36.47
2.99
592.5 69.60
691.25 81.84
716.38 93.70
25.44
Katcha Road Km 15.00 2 2 2 24 24 24 9.00
4.3. Road widening (a) PWD (b)AMC
Km 10 45.60
2 16.75
12
18.50
13.05 20.35
75 30.62
697.537.16
765.5 45.01
4.00
4.4. Box Culvert/ Hume Pipe (a) PWD (b) AMC
No 59 49.00
15 12.00
16
16.00
22 21.00
110 8.40
118
12.10
141.8 16.45
24
4.5.Road side drain (A) PWD (b)AMC
Km 120 40.65
40 12.17
47.5
13.45
50.25 15.08
825 242.06
977.5
286.26
1035.25 340.98
65.00
4.6. Other a. Feeder drain b. Retaining wall c. RCC Bridge
Km Km Nos
2 0.752
2.22
0.825
2.42 0.91
70 30
77 33
84.7 36.3
Total: Roads & Bridges, PWD AMC
230.21
70.35
79.95
91.615
2504.34 476.28
3475.77 561.62
3751.15 663.8
Contd.p/19

(19)
10. Drinking Water: Profile:
Profile 1997-98 2007-08 a) No. of families not covered by safe drinking water. b) Length of Piped Water connection c) Total No. of Households connected by piped water. d) No. Household not connected by piped water. e) No. of spouts (water tap) available on the roads.
NA NA NA NA NA
21435 12.17 km.
18 997 NA
2216 Nos.
Drinking Water Supply: Plan :
Rs. in lakhs
PHYSICAL TARGET FINANCIAL REQUIREMENT
PLAN
UNIT TOTAL NEED IN 2010-11 2010-11 2011-
12 2012-13 2010-11 2010-
12 2012-13
BALANC NEED (3-4-5-6)
1 2 3 4 5 6 7 8 9 10 5.1. Spot Sources (new)
a) Shallow Tube Well NOS 395 120 130 145 6.72 8.00 9.74
b) Mini Deep Tube Well NOS 03 01 01 01 3.00 3.30 3.70
5.2. Deep Tube Well NOS 30 09 10 09 200.00 250.00200.00 02 Nos.
5.3. House Connection NOS 3500 1050 1150 1250 21.00 27.60 37.50 15 Nos.
5.4. Extension of Pipe Line including Remodeling of pipe line
Km 100 25 30 35 250.00 360.00 484.00 10 Km
5.5. Repairing of drinking water supply systems and renovation of drinking water sources
NOS 450 160 120 130 207.00 168.27 187.21 14
Nos.
5.6. Surface Water Treatment plant (operation of Mtc. in/c cost of chemical etc.)
NOS 2 2 2 (contd.)
2 (contd.) 106.24 116.90 128.55
5.7. Iron removal Plants (Const. including operation and Mtc.)
NOS 55 20 18 17 505.60 546.10 618.90
5.8. Over Head Reservoir NOS 1 1 1 (contd.)
1 (contd.)
50.00 50.00 20.00
5.9. for the Institutions NOS 143 50 45 48 2.50 2.70 3.50
5.10. Others 1 1 1 (contd.)
1 (contd.)
50.00 10.10 50.00
Total: Drinking Water 1405.06 1545.17 1701.80
10.1 Jawaharlal Nehru National Urban Renewal Mission :
The Government of India has sanctioned Rs. 78 Crores for Drinking Water Supply Project in North
Zone which has already commenced. The project includes 12 Over Head Tanks, Rejuvenation of 23 Deep Tube Wells and 12 new ones, Rejuvenation of 10 IRPs and 25 new ones, 4 Ground Water Treatment Plants, Distribution Pipeline covering 28,000 households. It is expected that the distribution pipeline laying shall be started by August 2010.
10.2 ADB Project :
The Asian Development Bank has sanctioned project for provision of drinking water supply in Central
and North Zone of Agartala Municipal Council. The grant sanctioned under this project is Rs. 292 Crores which shall include construction of infiltration galleries at College Tilla, augmentation of treatment capacity, rehabilitation of 25 deep tube wells and 9 new ones, rehabilitation of 17 Iron Removal Plants and 8 new ones, 7 ground water treatment plants, 17.5 ML capacity water reservoirs, 67 KM primary pump mains, 140 KM secondary pipeline and metered connections to 70,000 houses.
Contd.p/20

(20)
10.3 DETAILS OF THE SCHEME TAKEN UP BY THE PWD (WATER RESOURCES) IN AMC AREA.
Achievement during 2008-
09
Achievement during 2009-10
Target during 2010-11
Target during 2011-12
Target during 2012-13
Name of scheme/ work
PHY FIN PHY FIN PHY FIN PHY. FIN PHY FIN 1) Extension of pipe line in different irrigation scheme under AMC area.
6. 00 Km
12.00 lakh
1.338 Km
3.00 lakh
6.00 Km
3.00 Km 5 Km
2) Construction of Pick up wire at a) L.I Scheme at Ichamuya=I b) L.I Scheme at Kashipur Moriyamnagar. c) L.I Scheme at Radhanagar.
-- -- 03 Nos. 6.00 lakh
01 No. 01 No. 01 No.
3) Resinking of Deep Tube Well at Nutannagar.
-- -- -- -- 01 No.
-- -- -- --
4) Proposal of New D.T.W. a) Nandannagar near Kalibari. b) Nandannagar SarkarparaWard No. 4. c) Nandannagar ThakuParaWard No. 4.
-- -- --
-- -- --
-- -- --
-- -- --
01 No
-- --
-- -- --
--
01 No --
-- -- --
-- --
01 No
-- -- --
5) Flood Protection Scheme. i) Baldakhal Charra at North Aralia, ward No. 34 (L-260 mtr.) ii) Right Bank of Howrah river at Adarshapalli, College Tilla (op. side of steel bridge L-132 mtr.) iii) Left Bank of Howrah River near Aralia market (Panchabati bazar L- 115.00 mtr.) iv) Right Bank of River Howrah up stream at Julanta Bridge near Ramthakur Boy’s School. v) Right Bank of River Howrah near Dashamighat a Khayerpur near Ratan Lal Ghosh. (L- 150.00 mtr.) vi) Right Bank of River Howrah near kashipur Daspara. (L- 125.00 mtr.) vii) Right Bank of River Howrah near Laxmipur at Kashipur Kabarkhala. (L- 150.00 mtr.) viii) Right Bank of River Howrah near Indira Colony, West Joynagar, Agartala. (L- 200 mtr.) ix) Right Bank of River Howrah (at upstream of Aralia RCC Bridge), (L- 150.00 mtr.)
--
--
--
--
--
--
--
--
--
--
--
--
--
--
--
--
0.26 Km 0.132 Km 0.115 Km 0.154 m 0.125 Km 0.20 Km 0.15 Km
--
-- --
-- -- --
12.00 lakh
9 lakhs
x) Flood Protection Scheme on Howrah embankment portion near Ranthakur Boy’s School and opposite of Rajnagar School.
25.00
mtr.
3.33 lakh
60.00 mtr.
5.00 lakh
15.33 lakh
14.00 lakh
Contd.p/21

(21)
10.4 A) WATER SUPPLY SCHEME :
I) FOR OVER HEAD TANK :
Sl No. Location Capacity (in Lit.) 1 Chandmari Rubber Board 450000
2 East side of Raj Bhavan 650000
3 ARDD Complex 550000
4 Lichubagan near Star Hotel 550000
5 Madhya Bhubanban 550000
6 East side of Raj Bhavan Adjacent OHT-04 500000
7 Near Assam Rifles Garage 900000
8 Radio Colony 250000
9 Radhanagar Bus Stand 800000
10 Near capital Complex 600000
11 Nandan Nagar 600000
12 Kashipur 600000
II) FOR DEEP TUBE WELL (DTW) :
Sl No. Location Capacity (in GPH)
1 Lichubagan near Star Hotel 20000
2 Chandmari Rubber Board 15000
3 TRTC Ground, Kunjaban 15000
4 Bhati Abhoynagar, Molla Para 15000
5 Chandra Pur H.S. School 15000
6 District Institute of Education Training (BT College), G.B. 10000
7 TRTC Garage (AMC), Barjala 12000
8 Near Radhanagar Bus Stand 15000
9 Chandinamura near Saw mill 15000
10 Mariyam nagar near Church 15000
11 Khayerpur Rajdhan Nagar 15000
12 Lichubagan Shopping Centre 10000
III) STATUS OF GROUND WATER TREATMENT PLANT :
Sl No. Location 1 Kunjaban
2 Barjala at AMC Garage
3 Chandmari Rubber Board
4 Das Para, Kashipur, Resham Banag
Contd.p/22

(22)
11. Sanitation, Drains & Solid Waste Management : Profile
Profile 1997-98 2007-08 Sanitation a) No. of families having sanitary or RSP type of latrine b) No. of BPL families who do not have at least RSP standard latrine c) No. of families who do not have at least RSP standard latrine d) ) No. of families ready to take RSP type latrine. e) Total No. of Public latrine / Urinal. f) Institutions not covered with sanitation (Nos.) Education Other Drains
a) Total length of the Kutcha drain by the side of the all weather (metalled or brick) road (Km.)
b) Total length of the pucca drain (Km.) c) Drainage pump for bailing out water
NA NA NA NA NA NA NA Na
NA
NA NA
NA NA NA NA NA NA NA NA
NA
NA
12 Nos.
Sanitation, Drains & Solid Waste Management: Plan Rs. in lakhs
Contd.p/23
PHYSICAL TARGET FINANCIAL REQUIREMENT
PLAN
UNIT TOTAL NEED IN 2010-11)
2010-11 2011-12 2012-13 2010-11 2011- 12 2012- 13
BALANC NEED (3-4-5-
6)
1 2 3 4 5 6 7 8 9 10 6. Sanitation 6.1. For individual (BPL)
NOS 3000 1000 1000 1000 101.00 112.00 124.00
6.2. For individual (APL)
NOS 18790 10000 8790 -- 1250.00 110.00 --
7. Solid Waste Management
7.1. Purchase of Equipments
1.Mechanical sweeping Machine:- 1(one)no 2.Articulated Boom Crane for De-silting: 1(one)no 3.Manufacturing 0.6 Cum capacity container:-110 nos 4.Manufacturing 4.5 Cum capacity container:-50 nos
1. Tipper 4.5Cum Capacity:- 10nos 2. Dumper placer 0.6 cumcopacity:- 6 nos
3.Manufacturing 0.6 Cum capacity container:-110 nos 4. De-silting Machine along with 02 nos siltcarrier lory
Auto tipper: 50 nos
20.0
18.0
15.0
26.5
100.0
42.0
15.0
100.0
100.0
7.2. Maintenance of Equipments
1.Bull-Dozer 2.Body and Cabin Repairing- a. Tipper:-16 nos b. Dumper placer:- 10 nos. c.4.5 Cum container:- 40 nos
4.5 Cum container:- 40 nos
4.0
9.6
6.0 8.0
8.0
7.3. Const. Of Dust Bins
Nil
7.4. Imp. of Dumping Gr.
Up-gradation work is require in entrance and internal roads of Hapania dumping ground by spraying Rabish.
Sanitary land fild and compost plant at Nagichara
Sanitary land fild and compost plant at Debendra nagar
1.5 Under CPCB
Under ADB
8. Drains & Sewerages
8.1. Construction of Drains
Km. 01
01
Sewerage scheme at North Zone
Integrated Drainage Scheme in AMC area under
TFC
--
--
--
--
2000.00
5000.00
10000.00
3221.00
10000.00
8.2.Improvement of Drains (operation & mtc. of 9 nos. drainage pump station)
Nos. 09 09 For Mechanical De-silting silt collection chamberin major drains
09 (Contd.) 09 (contd.)
08
30.0
09 09 10
Total Sanitation & SWM
2146.60 15274.00 13321.00

(23)
Sl no. Name of Sewerage
pumping station Ward No. Location Land dimension
required in M. 1
1 3
Saheed Bhagat Singh Youth Hostel (ginger Hotel Opposite)
15X20
2 3 3 Kumari tilla Village 15X20
3 4 7 Valmiki Ambedkar Malin (Abhoynagar)
15X20
4 5
8
Opposite Hindi School near Radhanagar Bus Stand
20X30
5 8
8
Bhati Abhoynagar near foot Bridge over Katakhal
15X20
6 2A 2 Bholagiri Ashram near Bridge
15X20
7 2B 2 Bholagiri Ashram near Bridge
15X20
8 2C 2 Near Saw Mill Bitatban 15X20
9 6A 6 Indranagar Road near Dhaleswar Bridhe
15X20
10 STP 1 (Cap. 8 MLD) Partly in 8 & party in 2
Near Saw Mill Bitarban 200X175
Contd.p/24

(24)
12. Urban Housing : Profile
Profile 1997-98 2007-08 Housing
a) No. of slum dweller families who do not have at least IAY standard of house.
b) No. of families ready to take loan for LIG/EWS housing.
Nil
NA
Nil
NA
Urban Housing : Plan
Rs. in lakhs
PHYSICAL TARGET FINANCIAL REQUIREMENT
PLAN
UNIT TOTAL NEED IN 2010-11 2010
-11 2011-12
2012-13
2010-11 2011-12
2012-13
BALANC
NEED (3-4-5-6)
1 2 3 4 5 6 7 8 9 10
9. Urban Housing
9.2. Others (Upgradation of houses)
Nos 3972 1200 1320 1452 144.00 158.40 174.24 Nil
Total: Urban Housing
144.00 158.40 174.24 Nil
Contd.p/25

(25)
13. Power : Profile
Profile 1997-98 2007-08 2009-10 Power
a) Number of hamlets (Paras) connected with Power.
b) No. of paras not connected with power line. c) Total No. of existing consumers. d) Number of households without any power
connection. e) Length of the public roads without any street
light (Km.). f) No. of transformers. g) 11 KV Line (HT)
NA NA NA
NA
NA
NA NA
NA NA NA
NA
NA
NA NA
NA NA
88438
15802
180Km.
792 351.0
Power: Plan
Rs. in lakhs
PHYSICAL TARGET FINANCIAL REQUIREMENT PLAN UNIT
TOTAL NEED IN 2010-11 2010-11 2011-12 2012-13 2010-11 2011-12 2012-13
BALANC NEED (3-4-5-6)
1 2 3 4 5 6 7 8 9 10 10.
Electrification
10.1. Extension of LT Line
K.M 95.0 45 KM 30.0 KM
20.0 KM
157.5 105.0 70.0
10.2. Extension of HT Line
NA NA NA NA NA NA NA NA
10.1. Extension of street lights
K.M 180.0 80 KM 60.0KM 40.0 Km
56.0 42.0 28.0
10.4. Transformer/ Substation
NA NA NA NA NA NA NA NA
10.5. Others Total Power 213.50 147.00 98.00
The AMC shall take up the two way street lighting in major streets in Agartala by spending
Rs. 1.20 Crores in 2010-11.
Contd.p/26

(26)
14. Education: Profile
Profile 1997-98 2007-08
a) No. of Aganwadi/ ICDS/ S.E. Centre i) AWS ii) SEC
b) No. of Primary Schools c) No. of Upper Primary Schools (S.B) d) No. of High Schools e) No. of H.S Schools f) No. of Degree College(s) g) Total No. of Students in the College (s) h) No. of non formal Education Centre. i) No. of private & autonomous educational Institutions j) No. of Madrasa. k) Total enrolment from Class I to VIII in Schools. l) Percentage of students enrolled in class I but who could not
complete Class V.
100
0 NA NA NA NA 06 NA NA NA NA NA NA
348 30 36 15 20 35 08
12436 11 NA 20
41352 14%
Education: Plan
Rs. in lakhs
PHYSICAL TARGET FINANCIAL REQUIREMENT
PLAN
UNIT TOTAL NEED IN 2010-11
2010-11 2011
-12 2012-13
2010-11 2011-12
2012-13
BALANC NEED (3-4-5-
6)
1 2 3 4 5 6 7 8 9 10 11. Education 11.1. ICDS/SE Centres Upgradation/ Renovations
Nos. 51 51 0 0 153.00 0 0 0
11.2. Primary/ SB Schools
Nos. 02 02 -- -- 24.86 -- --
New Constructions
Nos
Up-gradation/ Renovations
Nos. 02 02 -- -- 900.00 -- --
Public Library Nos. 01
Total Education 1077.86 -- --
Contd.p/27

(27)
15. Health: Profile
Profile 1997-98 2007-08
Health a) No. of Sub- Centres b) No. of Settelite Dispensaries c) No. of Primary Health Centre d) No. of rural/ Sub-Divisional Hospitals e) No. of District Hospital f) Total No. of Beds in all the Health
Institutions
g) Total No. of Birth last year h) No. of Children dies within one year of
birth i) No. of pregnancy related deaths during
last year
06 06 Nil Nil Nil NA
NA NA
NA
13 06
Nil Nil Nil
510 IGM, 510 GB 50 Cancer Hos. & 30 Ayur. Hos. =
1090 Nos.
45069 NA
NA
Health: Plan Rs. in lakhs
PHYSICAL TARGET FINANCIAL REQUIREMENT
PLAN UNIT
TOTAL NEED IN 2010-11 2010
-11 2011-12
2012-13
2010-11
2011-12
2012-13
BALANC NEED (3-4-5-
6) 1 2 3 4 5 6 7 8 9 10
12. Health
12.1. Construction of New Health Institutions
20 health centre
required in 35 Wards of AMC
22 08 04 04 100.70 60.00 70.00
6
12.2. Repair of Health Institutions
Nil 08 04 02 02 10.00 5.00 5.00 0
12.3. Special Health Camps
35 X1 420 420 420 420 4.2 4.2 4.2 12.6
12.4. Supporting facilities to the Health Institutions
Nil -- -- -- -- -- -- --
12.5. Others Furniture and medicine
Detailed below (NRHM)
Capital Exp. For Hospitals in
AMC area underHealth Deptt.
GB, IGM, Cancer, AGMC
--
--
--
33.60
1075.00
35.60
--
360.00
--
1160.00
--
Total : Health
1213.52 104.80
(P) 439.20 (P)
1178.60
Contd.p/28

(28)
15.1 PROPOSED HEALTH ACTIVITIES OF AMC.
Name of Sector
Total plan (Rs. in lakhs)
Department Fund (Rs. in lakhs)
Health Rs.11540200/- (Rupees one hundred fifteen lakhs forty thousand two hundred)
Health & Family welfare Deptt.
Rs. 11540200/- (Rupees one hundred fifteen lakhs forty thousand two hundred) 1. Construction of 8 no. of Health Centre Rs.1258755/- per Health Centre Rs.10070200. 2. Purchase of medicine for 14 no. of Health Centre Rs.210000. 3. Exp. on equipments and furniture Rs.59,8000/-. 4. Exp. of purchase of one PC with printer Rs.50,000/- salary of 6 MPWs Rs.6,12,000/-
15.2 Hospitals in Agartala Municipality Council Area and Capital Budget during 2010-11
and capital Expenditure during 2009-10 for the Hospitals in AMC Area is as follows:
Name of
Hospital
Budget 2010-11 Expenditure during 2009-10
Plan Non Plan Total Plan Non
Plan
Total
GB Hospital 99.67 15.00 114.67 136.11 44.89 181.00
IGM Hospital 118.00 15.00 133.00 60.08 9.04 69.32
Cancer
Hospital
48.88 4.50 53.38 23.46 4.47 27.93
AGMC 1000.00 75.00 1075.00 1594.00 254.00 1848.00
Contd.p/29

(29) 16. Industries and Institutional Finance: Profile
Profile 1997-98 2007-08 Industries and Finance
a) Total No. of household Industries. b) Total No. of non- household/ Small- Scale Industries. c) Total No. of Banks and Credit Societies.
1728 nos. 180 nos.
N.A
2400 nos. 210Nos .
25 Nos.
Industries and Institutional Finance: Plan Rs. in lakhs
PHYSICAL TARGET FINANCIAL REQUIREMENT PLAN
UNIT TOTAL NEED IN 2010-11 2010-11 2011-
12 2012-13 2010-11 2011
-12 2012-13
BALANC NEED (3-4-5-
6)
1 2 3 4 5 6 7 8 9 10 13. Village/ Small Industries
13.1. Handloom
Ben
Phy-1523 Fin-
23.51
460 506 557 7.10 7.81 8.60
13.2. Handicrafts Ben Phy-270 Fin-9.90
80 90 100 3.00 3.30 3.60
13.3. Skill up-gradation Ben
Phy-662 Fin-
132.00
200 220 242 40.00 44.00 48.00
13.4. Small scale Units Ben
Phy-270 Fin-
99.00
80 90 100 30.00 33.00 36.00
13.5. Other Activities
-- -- -- -- -- -- -- --
Total VSI 820 906 999 80.10 88.11 96.20
Contd.p/30

(30)
17. Employment: Profile
Profile 1997-98 2007-08
a) Total job (TUEP) card holder families b) Total Un-employed (register with Employment
Exchange) c) Total educated Un-employed (register with
Employment Exchange)
Nil NA NA
Nil NA NA
Employment: Plan
Rs. in lakhs
Tripura Urban Employment Programme
Total No. of Job Card issued 21629 Nos.. Each Job Card Holders will be provided 75 days of works in a year.
Contd.p/31
PHYSICAL TARGET FINANCIAL REQUIREMENT
PLAN
UNIT TOTAL NEED IN 2010-11 2010-
11 2011-12 2012-
13 2010-11 2011-12 2012-13
BALANC NEED (3-4-5-
6)
1 2 3 4 5 6 7 8 9 10
14.1. SwarnaJayanti Shahari Rozgar Yojan(SJSRY)
NO. Group
s
Phy.1720 549 Fin.
3905
520 166
570 182
630 201
1181.00
1294.00 1430.00
14.2. TripuraUrban EmploymentProgramme (TUEP).
Nos.
5947975
16221
75
21,62,900
2162 900
2704.15 3605.55 3605.55
14.3. Other Self-employed Programme
Groups
232 70 77 85 35.00 38.50 42.50
Total : Employment
3920.15 4938.05 5078.05

(31)
18. Markets and Transport: Profile
Profile 1997-98 2007-08 Markets Total Number of market (s)
a) Organized / Regulated b) Un-organized
16 nos.
25 nos. 09 nos.
Markets and Transport: Plan Rs. in lakhs
PHYSICAL TARGET FINANCIAL REQUIREMENT
PLAN UNIT
TOTAL NEED IN 2010-11 2010-11 2011-12 2012-13 2010-11 2011-12 2012-13
BALANC
NEED(3-4-5-6)
1 2 3 4 5 6 7 8 9 10 Markets and Transport
15.1.Market/ Shed/ Stall a) construction b)Improvement 15.2. Passenger Facility a) Bus/ Motor stand b) Passenger Shed
Nos. Nos.
Nos.
09 02
02
02 --
01
05 01
01
02 01
--
889.00 ---
500.00
4208.00 2945.00 1500.00
328.00 457.00
1402.00
Total: Markets and Transport
1389.00 8653.00 2187.00
18.1 Markets: The city economy is dependent primarily on the tertiary sector with a small manufacturing base. There are 9 markets maintained by AMC within municipal limits, of which, Battala and Maharaj Ganja Bazaar are important as the main service and distribution center of Agartala. Eight markets of 600 sqm, 700 sqm and 900sqm has been proposed under JNNURM and the total estimated cost amounts to Rs. 4355.00 lakhs.
Cost Estimates for markets:
S. No Development of Markets Cost (Rs.Lakhs) 1. Aralia (600 sqm building) 277.00 2. Vidyasagar (600 sqm building) 250.00 3. Barjala (600 sqm building) 200.00 4. Golchakkar (600 sqm building) 200.00 5. M.G.Bazar 897.00 6. Tulshibati Bazar 1531.00 7. G.B.Bazar 1000.00 8. Development of Whole Sale and retail Fish Market at M.G.Bazar 928.00 9. Development of Vegetable and fruit Market at M.G.Bazar 142.00
Sub Total 5425.00 18.2 TRANSPORTATION
City Bus Service: Tripura Urban Transport Company (TUTC) Ltd. has already been formed by the State Government for managing the City Bus Service in Agartala. The Government has procured of 75 Buses (53 Midi Buses and 22 Regular Buses) under JNNURM for Agartala Town. Out of total 80% buses shall be run on CNG. The buses are expected to begin functioning from May 2010.
It has been decided for extending facilities to the passengers Rs.3402.00 lakhs will be spent for improvement of the following Bus stand in the coming financial years.
1. Nagerjala Motor Stand - Rs.2945.00 Lakhs
2. G.B. Motor Stand - Rs. 4.57.00 Lakhs ----------------------------------------- Total = Rs. 3402.00 Lakhs
Contd.p/32

(32)
19. Sports and Culture: Profile
Profile 1997-98 2007-08
Sports and Culture a) Total No. of Community hall with total capacity 1) AMC 2) ICAT b) Total Number of Play grounds c) Total Number of Sports stadium with capacity d) Total No. Sports College/ Sports Training Centre e) Total No. of water bodies for swimming f) Total No. of Indoor Stadiums/ Gymnasium g) Public Library
NA
01 No/7356 Seats
O8 Nos. 03 Nos.
Nil 03 Nos. 01 No. 02 Nos.
12 Nos.
2 Nos./1484 Seats 03 Nos. 01 No. 04 Nos. 02 Nos. 02 Nos.
Sports and Culture: Profile Rs. in lakhs
PHYSICAL TARGET FINANCIAL
REQUIREMENT PLAN UNIT
TOTAL NEED IN 2010-11 2010-
11 2011-12012-13
2010-11
2011-12
2012-13
BALANC
NEED (3-4-5-6)
1 2 3 4 5 6 7 8 9 10 16.1. Festival/sports meet
(a)Sports & coaching- Sports (b) Youth activities & festival – Sports ICAT
Nos.
Nos.
--
14,975
575
190
6,150
250
82
7,125 275 90
8,850
300
100
1.789
0.98
127.28
2.491
1.078
140.00
2.904
2.046
150.00
Nil
Nil 23.00
16.2. Construction of Community Hall/ Auditoriums – Sports ICAT
Nos. --
15 --
05 --
05 --
05 --
40.00 3580.00
44.00 --
48.50 --
Nil --
16.3. Improvement of Community Hall/ Auditoriums
Nos. 01 01 - - 15.00 - - - Nil
16.4. Construction / Imp. of parks
Nos. 08 04 04 -- 100.00 95.00 -- --
16.5. Infrastructure Development for Sports activities (a)ACA (b)SPA
1350.00 900.00
1120.00680.00
Nil
395.00
Total: Sports & Culture ICAT
190
82
90
100
3707.28
140.00
150.00
23.00
19.1 Parks: The city lacks in recreational facilities and hence improvement of the two existing parks are proposed along with the development of 5 new parks and one science park with a total estimated cost of Rs. 1300.13 lakhs.
Cost Estimates for Parks :
Sl. No PARKS Cost (Rs.Lakhs)
1. Improvement of existing parks (2 nos) ,5000 sqm 60.00 2. Development of new parks (5 nos) ,3000sqm 135.00
Sub Total 195.00
Contd.p/33

(33)
19.2 Infrastructure Development of Sports Activities (Rs. in lakh)
Contd.p/34
Physical Target Financial Target
PLAN ApprovedEstimate
Implementing Agency
Total need in 2010-11 2010-11 2011-12 2012-13
2010-11
2011-12
2012 -13
1 2 3 4 5 6 7 8 9 10
Const. of Gymnasium Hall at Badharghat. Retained on 2002-03
203.00 (3.00BADP)
CPWD Fund placed to the CPWD in the 2003-04 but the work executed in the year 2009-10 and excepted that the
work will be completed with August 2010.
Const. of School Building at TSS, Retained on 12-09-07 (Under NLCPR)
387.07 THCB
During 2008-09 Rs. 75.00 lakh has been
released.
100.00100.00 79.00
Const. of Boys Hostel of TSS, Retained on 12-09-07 (Under NLCPR)
552.78 THCB During 2008-09 Rs.
75.00 lakh has been released.
Sanction awaited
Const. of Girl’s Hostel of TSS, Retained on 12-09-07 (Under NLCPR)
438.17 THCB During 2008-09 Rs.
75.00 lakh has been released.
Sanction awaited
Up gradation of Bharat Singh Youth Hostel, Agartala (350 Bedded Hostel at Khajurbagan) (underSPA)
1475.00 THCB
540.00540.00395.00
Up gradation of Astabal Ground (under SPA) 500.00 THCB
Sanction for Rs.360.00 lakh has already been
issued 360.00140.00
--
Extension of Conference Hall in the existing Saheed Bhagat Singh Youth Hostel, Agartala
80.96 THCB
During 2009-10
Rs.47.00 lakh has been released
33.96 --
--
Up gradation of NSRCC Complex construction of Indoor Stadium at Agartala (under ACA)
2470.00 PWD
Sanction for Rs.1350.00 lakh has already been
issued
1350.00
1120.00
--
Construction of swimming stand for the swimming club at North West Corner of Durgabari Dighi near Jagannath Bari, Agartala
5.80 PWD
During 2009-10 Rs.3.00 lakh has been released
-- -- --
Different Minor Works atDasharatha Deb State Sports Complex, Badharghat
16.56 RD
During 2009-10 Rs.9.75 lakh has been released 7.06 -- --
Dev of U.K. Academy Play ground with remaining grand stand
163.00 PWD
Work undertaken by PWD fund will also be provided by PWD
Dev of play ground near Bholagiri Ashram, Agartala
56.00 PWD
Work undertaken by PWD fund will also be provided by PWD
Dev. Of play ground & const. of retaining wall North Part of DDSSC
19.46 PWD During 2008-09 & 09-10
19.30 lakh has been released.
0.16 -- --

(34)
20. Welfare of ST, SC, OBC, RM : Profile
Profile 1997-98 2009-10
Total No. of ST families
Total No. of SC families
Total No. of OBC families
Total No. of Minority families
N.A
NA
NA
Na
4231
18118
19080
5869
\
Welfare of ST, SC, OBC, RM : Plan
Rs. in lakhs
PHYSICAL TARGET FINANCIAL REQUIREMENT
PLAN
UNIT TOTAL NEED IN 2010-11 2010-
11 2011-12
2012-13
2010-11
2011-12
2012-13
BALANC
NEED (3-4-5-6)
1 2 3 4 5 6 7 8 9 10
Economic Welfare of ST, SC, OBC, RM
NA NA NA NA NA NA
17.1. Economic beneficial programs for
NA NA NA NA NA NA
ST NOS NA NA NA NA NA NA
SC Nos NA NA NA NA NA NA
OBC Nos NA NA NA NA NA NA
RM Nos NA NA NA NA NA NA
17.2. Other Programs
Nos NA NA NA NA NA NA
Total: ST, SC, OBC, RM
NA NA NA NA NA NA
Contd.p/35

(35) 21. Slum Improvement: Profile
1997-98 2007-08 Profile
Recognized Non-
Recognized Recognized Non- Recognized
1 2 3 4 5 1. Total Area/No. of Slum
17 -- 52/32.2 sq.km
06
2. Total No. of Family 2,220 -- 8397 161 3. Total Population 11,100 -- 43947 825 4. No. of ICDS/ SE Centre AWC - SEC
57 - 00
AWC – SEC 118 - 21
AWC - SEC 04 - 03
5. No. of Pre-Primary School NA NA 04 - 6. No. of Primary School NA NA 18 - 7. All weather road (Km) NA NA 22.1 km 8. Piped water supply (km) NA NA 2.10 1.86 9. Spot sources of safe drinking water (No.)
NA NA 18 NA
10. Household without power (No)
NA NA 640 NA
11. Families without IAY type houses (No.)
NA NA 6400 NA
12. Families without RSP type latrine
NA NA 6030- NA
13. Total un-employed NA NA 10% NA 14. Other item (specify) NA NA NA NA
Slum Improvement: Plan
Rs. in lakhs
Contd.p/36
PHYSICAL TARGET FINANCIAL REQUIREMENT
PLAN
UNIT TOTAL NEED IN 2010-11 2010-11 2011-12 2012-13 2010-11 2011-12 2012-13
BALANCE NEED
(3-4-5-6)
1 2 3 4 5 6 7 8 9 10 17. Slum Improvement
a) For Roads Km. 25.10 7.51 8.60 8.99 63.28 53.72 86.63 b) For Drinking water
Km. 12.20 3.50 3.00 3.70 24.50 24.00 27.00 2.00
c) For Sanitation Nos. 1500 400 500 600 50.00 62.50 75.00 d) For Electricity Km. 3 1 1 1 3.50 3.60 3.70 e) For Housing Common Shelters (BSUP) Radhanagar -192 Joynagar – 192 Rajnagar – 512 Bhagat Singh -256
Nos. 1152 192 704 256 2286.00 7458.00 3278.00
f) Other activities Total: Slum Development
12.20 Km 3.50 Km 3.00 Km 3.70 Km 2427.28 7601.82 3470.33 2.00 Km

(36)
22. OTHER INFRASTRUCTURE DEVELOPMENT: PLAN
Rs. in lakhs
PHYSICAL TARGET FINANCIAL
REQUIREMENT PLAN
UNIT TOTAL NEED IN 2010-11 201
0-11 2011-12
2012-13
2010-11
2011-12
2012-13
BALANC NEED(3-4-5-6)
1 2 3 4 5 6 7 8 9 10 18. Other Construction & Improvement Works
18.1. Construction of
i) Destitute Home Nos. 12 04 04 04 35.00 10.00 10.00
ii) Food/ Disaster shelter
Nos Nil Nil Nil Nil Nil Nil Nil
iii) Cremation/ Burial Ground
Nos. 01 01 -- -- 445.32 354.68 --
iv) Slaughter House Nos. 02 -- 01 01 -- 80.00 80.00
v) Others (specify) Nos. Nil Nil Nil Nil Nil Nil Nil
18.2. Improvement of
i) Destitute Home Nos. 12 04 04 04 4.35 10.00 10.00
ii) Food/ Disaster shelter
Nos. Nil Nil Nil Nil Nil Nil Nil
iii) Cremation/ Burial Ground
Nos. 02 02 -- -- 16.10
iv) Slaughter House Nos.--
Nil Nil Nil Nil Nil Nil Nil
v) Others (specify) Nos. Nil Nil Nil Nil Nil Nil Nil
18.3. Improvement of Lakes
Nos. 10 03 04 03 400.00 400.00 361.00
18.4. Conservation of River
Kms. 1.482 0.50 0.50 0.482 18.40 20.24 22.36
Total: Other Construction & Improvement Works
Nos Kms.
39 1.482
14 13 12 919.17 874.92 483.36
19. Other Activities of AMC
i) e-Governess No. 1 1 - - 500.00 447.00 ---
ii) Comprehensive Mobility Plan
No. 1 1 --- 19000.00 7278.00
Total 1419.17 20321.92 7761.36
a) The State Government has sanctioned project for development of modern crematorium at Battala by allocating Rs. 8 Crores in April 2010.
b) In order to extend transportation facilities in the AMC area the State Government has decided to Construct a RING ROAD through the Project Comprehensive Mobility Plan for which under JNNURM Scheme Rs.262.78 crores likely to be sanctioned.

Formation of Road in progress under TUEP (2009-10)
Brick Soled Road under TUEP (2009-10)
Newly developed Park at A.D.Nagar

![AGARTALA MUNICIPAL COUNCIL - [ TOUJI REGISTER ]agartalacity.tripura.gov.in/PDF/Touji/Touji_List.pdf22bsm0010 smt jhumor chowdhury jainagar old touji no ... bhatta pukur kali tilla](https://img.pdfslide.us/doc/110x75/5b4e989e7f8b9a98568b4b4f/agartala-municipal-council-touji-register-smt-jhumor-chowdhury-jainagar-old.jpg)