Embed Size (px)
Citation preview

Good Earth School Naduveerapattu
Physics Practical – Class X
Experiment No. 1A: Principle of Moments
Aim: To find the mass of the metre scale. Apparatus: Meter scale graduated in centimetre and millimeter, stand, 50 gf weight and thin thread. Theory: According to the principle of moments, if a body which is capable of rotation is acted upon by a number of forces, and no-motion takes place, then, the sum of the clockwise moments is equal to that of the anti-clockwise moments. Procedure: Suspend the meter scale with its flat portion in a loop of loose thread, suspended from a stand. Adjust the position of the loop so that the scale rests in a horizontal position. Note this reading on the scale; this is the position of the centre of gravity of the scale. Tie a weight of 50 gf with a thread and suspend it at the 10 cm mark on the left side of the fulcrum. The scale will no longer be balanced. To counter this, slowly increase the length of the right-arm pulling the scale towards the right of the loop till it again balances in a horizontal position. Note the distances d1 and d2 where d1 is the distance between the known weight and the point of suspension and d2 is the distance between the C.G. and the point of suspension. Repeat this experiment four more times by changing the position of the weight ‘w’ to different positions on the scale. Plot the graph d1 vs d2 taking d1 in y-axis and d2 of x-axis. Find the slope and note it down as S. Result: The weight of the meter scale by calculation is = gf. The weight of the meter scale from graph is = gf. S. No Distance of 50 gf from
fulcrum (d1 in cm) Distance of C.G. from fulcrum (d2 in cm)
𝒅𝟏𝒅𝟐
Weight of meter scale
𝒘𝒎 = 𝟓𝟎 𝒙 𝒅𝟏𝒅𝟐
1. 2. 3. 4. 5. Average = gf

Experiment No. 1B: To find the weight of the given object
Aim: To find the weight of the given object. Apparatus: Meter scale, thread, an unknown weight, stand (millimeter, centimeter) Procedure: Suspend the meter scale with its flat portion vertical in a loop of loose thread, suspended from a stand. Adjust the position of the loop so that the scale rests in horizontal position. Note this reading on the scale; this is the position of the C.G. of the scale. Suspend a known weight w (gf) at a distance from 10 cm away from the left end of the meter scale and suspend the given object, whose mass is to be found on the right side of the scale. Let the weight of the object be wx. Adjust the position of the given object such that the meter scale is perfectly horizontal. Measure the distance d1, the distance from the fulcrum to the point of suspension of the object. Repeat the experiment for four more times, each time, changing the value of d1 and getting all the corresponding value of d2. Note all readings. Calculate the value of wx for each set of values and find the average of all readings. S. No Distance of known
weight from fulcrum (d1 in cm)
Distance of unknown weight from fulcrum (d2 in cm)
𝒅𝟏𝒅𝟐
Unknown weight =
𝒘𝒎 = 𝟓𝟎 𝒙 𝒅𝟏𝒅𝟐
1. 2. 3. 4. 5. Average = gf Result: The weight of the given object wx = gf.

Experiment No. 2 – Lateral Displacement
Aim: To trace the course of different rays of light through a rectangular slab at different angles of incidence, refraction and emergence. Also measure the lateral displacement. Apparatus: Drawing board, sheet of paper, pins, board pins, rectangular glass slab. Procedure:
1. Fix a sheet of white paper on the drawing board with the help of board pins on the four corners of the sheet.
2. Place a glass slab at the centre of the paper and mark its boundary ABCD with a fine pencil.
3. Remove the glass slab. Draw a line PQ marking an angle 30° with the normal at the P, closer to R.
4. Put the glass back in position on the boundary line. Fix two pins P1 and P2 vertically on the line PO at least 5 cm apart with pin P1 close to the slab.
5. Look for the images of these pins in the slab from the opposite of CD and fix two more points with pins P3 and P4 so that they are in line with the images of P1 and P2 as seen through the glass slab.
6. Join the pin holes of P3 and P4 to obtain the emergent ray. Draw a normal to CD at point B. Join AB to get the refracted ray.
7. Measure the angle of incidence, angle of reflection and angle of emergence. Produce OP forward and draw a perpendicular from B to OP produced to meet it at L. The lateral displacement = BL.
8. Repeat the experiment with 3 more different angles of incidence. Result and Conclusion: Angles of refraction, angles of emergence and lateral displacement are calculated for specific angle of incidence and tabulated. From the observation we can infer that the lateral displacement depends on the angle of incidence and the angle of refraction. S. No Angle of
incidence ∠i Angle of refraction ∠r
Angle of emergence ∠e
Lateral Displacement ∠BL
1. 2. 3. 4. 5.

Experiment No. 3 – Inclined Plane
AIM: To study the variation of weight required to balance a roller on an inclined plane with angle of inclination of the plane and hence to find the weight of the roller using graphical method and to study the variation of Mechanical Advantage (MA) with angle of inclination. APPARATUS: An inclined plane fitted with glass top, a pulley, weighing pan, roller, thread, spring balance or digital balance. PROCEDURE:
1. Find the weight of the given roller (W) and that of the weighing pan (w0) with the help of the digital balance.
2. Pass a string over the pulley and attach a roller lying on the inclined plane to its one end and the weighing pan to the other end.
3. Set the inclined plane at an inclination of 25°. Add weights in the weighing pan, continue till the roller just begins to move on the inclined plane with a gentle tap. Let the weight in the pan for upward motion of roller be w1. Now start decreasing the weights in the weighing pan and continue till the roller just begins to move down the inclined plane. Let the weight remaining in the pan be w2.
4. Calculate the average weight Wavg = ½ (w1 + w2) which when added to the weight of the pan w0 gives the applied force F. Therefore F = w0 + ½ (w + w2).
5. Tabulate the value of sin θ 6. Repeat the experiment for θ = 30°, 35°, 40° & 45° 7. Plot a graph of F v/s sin θ. The weight of roller will be the slope of the graph. 8. Compare the calculated weight of roller with the weight observed using a digital
balance. CALCULATIONS: Observed mass of roller, W = gf Observed mass of pan, w0 = gf Points chosen for finding slope of graph (x1, y1) =__________; (x2, y2) = ________ Slope of the graph gives the weight of the roller S = 𝑦2− 𝑦1
𝑥2− 𝑥1 = ______ gf
OBSERVATION TABLE S. No Weight on the pan when
roller just starts moving (g) Gravitational Force F = W0 + ½ (w1 + w2)
Inclination θ (deg)
Sin θ MA = 1
Sin θ
Up Down 1. 2. 3. 4.

RESULTS: 1) Weight of roller found with the help of digital balance W = _ gf 2) The slope of F v/s sin θ, graph S = _ gf 3) Difference between the two readings ∆W = g
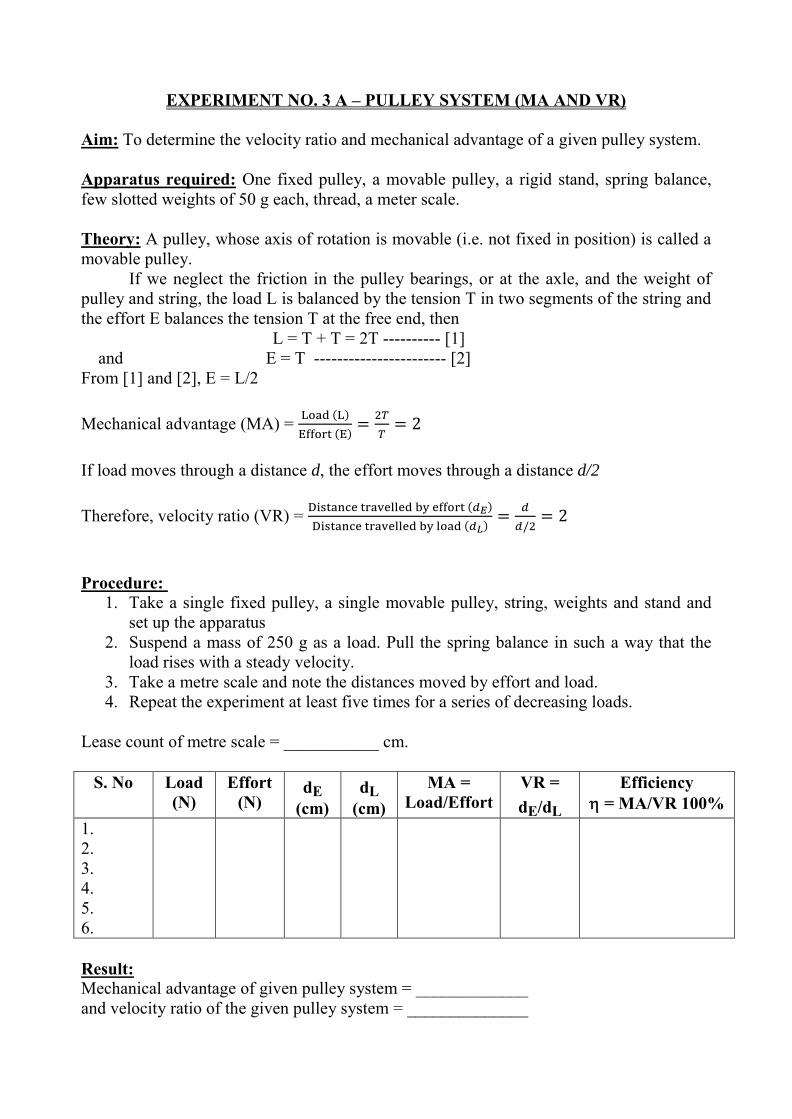
EXPERIMENT NO. 3 A – PULLEY SYSTEM (MA AND VR) Aim: To determine the velocity ratio and mechanical advantage of a given pulley system. Apparatus required: One fixed pulley, a movable pulley, a rigid stand, spring balance, few slotted weights of 50 g each, thread, a meter scale. Theory: A pulley, whose axis of rotation is movable (i.e. not fixed in position) is called a movable pulley. If we neglect the friction in the pulley bearings, or at the axle, and the weight of pulley and string, the load L is balanced by the tension T in two segments of the string and the effort E balances the tension T at the free end, then
L = T + T = 2T ---------- [1] and E = T ----------------------- [2] From [1] and [2], E = L/2 Mechanical advantage (MA) = Load (L)
Effort (E)= 2𝑇
𝑇= 2
If load moves through a distance d, the effort moves through a distance d/2 Therefore, velocity ratio (VR) = Distance travelled by effort (𝑑𝐸)
Distance travelled by load (𝑑𝐿)= 𝑑
𝑑/2= 2
Procedure:
1. Take a single fixed pulley, a single movable pulley, string, weights and stand and set up the apparatus
2. Suspend a mass of 250 g as a load. Pull the spring balance in such a way that the load rises with a steady velocity.
3. Take a metre scale and note the distances moved by effort and load. 4. Repeat the experiment at least five times for a series of decreasing loads.
Lease count of metre scale = ___________ cm.
S. No Load (N)
Effort (N)
dE (cm)
dL (cm)
MA = Load/Effort
VR = dE/dL
Efficiency η = MA/VR 100%
1. 2. 3. 4. 5. 6.
Result: Mechanical advantage of given pulley system = _____________ and velocity ratio of the given pulley system = ______________

1. The pulleys should be free from friction. 2. Load and effort should be increased or decreased in small steps. 3. Displacement of effort and load should be measured accurately.

Experiment No. 4 - REFRACTION OF LIGHT RAYS THROUGH A PRISM
Theory: A ray of light after refraction at the two faces is deviated as shown in the figure. The angle between the incident ray and the emergent ray is called the angle of deviation. The value of the angle of deviation depends on: • The angle of incidence, i • The material of the prism • The colour of the wavelength of the light • The angle of the prism, A For a certain angle of incidence, the angle of deviation δ is minimum. This position is called the position of minimum deviation of the prism with respect to the incident ray. For a triangular prism, angle of incidence i1 + angle of emergence i2 = angle of prism A + angle of deviation δ. i.e i1 + i2 = A + δ
REFRACTION OF LIGHT RAYS THROUGH A PRISM Aim of the experiment: To trace the path of a light ray through a prism and to show that i1 + i2 = A + δ Apparatus: Drawing board, pins, sheet of paper, board pins and a triangular equilateral prism. Procedure:
1. Fix a sheet of paper on the drawing board with drawing pins 2. Divide the page into two equal halves 3. Place the prism in the middle of one half and draw its outline ABC. Measure
angles of ABC, i.e, A, B and C and take their mean. This angle is A, the angle of the prism.
4. Make a point N on AB in the middle and draw the normal NN1
5. Draw a line NP such that ∠N1 NP = 400 6. Fix the prism in its original position ABC 7. Fix two pins P 1 and P 2 around 10 cm apart 8. Look from the side AC and erect two more pins P3 and P4 such that all the four
pins and the image of P1 and P2 are in a straight line. 9. Mark the positions of the pins by clearly encircling the points. 10. Remove the prism 11. Join P1 and P2 and produce it to meet AB at N.
12. Join P3 and P4 and produce it to meet the outline AC at point N1.

13. Join N and N1.
14. Further, produce P1P2 and P3P4 to meet at D. The angle δ is the angle of deviation.
15. Also measure e = i2 = ∠N2 N1P3
16. Repeat the above procedure for ∠i = 500, 600 and 700 and measure i2 for each. 17. For each case show that i1 + i2 = A + δ
Observation: Angle of the prism A = 600
OBSERVATION TABLE S. No. Angle of
incidence Angle of
emergence Angle of deviation
i1 + i2 A + δ
1 40° 2 50° 3 60° 4 70°
Conclusion: since in each case i1 + i2 = A + δ, it is verified that i1 + i2 = A + δ within experimental error. Precautions:
1. The prism should not be disturbed during the course of the experiment. 2. The pins should be positioned in a completely vertical position and should be
around 8 – 10 cm apart from each other. 3. The position of pins must be marked clearly by encircling the holes. 4. Arrow heads should be marked to show the direction of the light rays.
A
400 P 3
N N1
P P 2 P 4
P 1
B C

Experiment No. 5 – Refraction of light ray through prism
Theory: totally reflecting prisms Whenever a ray of light encounters a boundary separating two media, it suffers refraction. A glass prism is a piece of transparent, refracting medium bounded by three intersecting plane surfaces that both disperse and deviate light.
There are three such types of prisms: (a) Equilateral prism (60°), (b) Right angled isosceles prism or porro prism (45°, 45°, 90°) (c) right angled prism (30°, 60°, 90°) When a ray of light is incident normally on prism (angle of incidence, i=0°) the light in each case of prism experiences a total internal reflection as the angle of reflection as the angle inside the prism, D1 than the critical angle of the prism., icrit = 42°. This reflected ray undergoes a deviation from its normal course of path. The angle between the incident ray and the emergent ray is known as the angle of deviation, δ. Aim of the experiment: to trace the course of a light ray incident normally (i=0°) on different types of prisms and also to trace the angle of deviation, δ. Apparatus: glass prisms (45°, 60° and 90°), drawing board, white paper sheets, board pins and paper pins Procedure:
(i) Place a white sheet of paper on a drawing board and fix it with drawing pins. (ii) Place the prism (equilateral prism) in the middle of the paper and draw its
outline ABC. Remove the prism. (iii) Measure and mark angles A,B and C of this outlined triangle ABC. (iv) Mark a point N on AB and draw line NP, as incident ray such that line NP
makes an angle, i = 0° (i.e) falls normally on face AB. (v) Place the prism again in its original position ABC. (vi) Fix two pins P1and P2 on line NP at about 8 – 10 cm distance from each other. (vii) Look from the other side BC, the images of P1 and P2. Erect two more pins P3
and P4 such that these overlap the images of pins P1 and P2 (i.e, all the four pins are in a straight line)
(viii) Remove the prism and the pins and mark the positions by encircling the
points. Join P3 and P4 to meet face BC at a point N1. Also join N and N
1
through D at AC, the path light ray has taken inside the prism. The complete ray diagram gives the course/ path of light ray through the prism when light ray is incident normally on the prism. Measure the angle of incident ray produced forward and emergent ray produced backward.
(ix) Repeat the above procedure with the other two prisms.

Precautions: (i) The pins should be in a perfectly vertical position separated about 8 – 10 cm
from each other. (ii) The prism should not be disturbed during the course of the experiment. (iii) Draw circles around the pin pricks. (iv) Fix the pins P3 and P4 carefully so that they are in line with the images of pins
P1 and P2.

Experiment No. 6 - Determination of specific latent heat of fusion of ice
Aim: To determine the specific latent heat of fusion of ice Apparatus: calorimeter, stirrer, digital balance, some amount of ice and water Procedure:
1. Take a clean and shining calorimeter along with a stirrer and weigh it very accurately on a physical balance. Record the mass.
2. Half fill the calorimeter with water at room temperature and weigh it. Record the mass.
3. Place the calorimeter in a wooden jacket, lined with some insulating material. Cover the top of the calorimeter with a wooden lid, having two holes in it. Pass a thermometer through one hole and a stirrer through the other hole, such that the bulb of the thermometer is dipping in water. Record the temperature of water.
4. Take some ice (prepared from clean water) and break it into small pieces. Take one piece of ice, dry its surface with a filter paper and then drop it into the calorimeter. Stir the water in the calorimeter gently, till the piece of ice melts. Add more bits of ice till the temperature of the mixture drops by approximately 15°C. Record the final temperature of the mixture.
5. Take out the calorimeter from the wooden jacket and reweigh it. Record the mass. Observations:
(i) Mass of empty calorimeter = ‘M’ g (ii) Mass of the empty calorimeter + water at room temperature = ‘M1’ g (iii) Mass of the empty calorimeter + water at room temperature + ice (melted)
= ‘M2 ‘’g (iv) Initial temperature of water at room temperature = θ1 °C (v) Initial
temperature of ice = 0 °C (v) Final temperature of ice = θ °C (vii) S.H.C. of water = 4.2J g-10C-1 (vi) S.H.C. of copper calorimeter = 0.4 J g-10C-1 (vii) Let S.L.H. of ice = x
Calculations:
(i) Mass of water at room temperature =(M1 –M) g (ii) Mass of ice = (M2 –M) g (iii) Rise in temperature of water formed = (θ – 0) °C = θ °C (iv) Fall in temperature of water at room temperature and the calorimeter = (θ1 –
θ) °C Therefore heat gained by ice to change its state = m x L = (M1 – M) g x (x) Heat gained by water formed from ice = m.c. θR = (mass of water) x (4.2) x (θ)°C

Heat lost by calorimeter = m.c. θF = M x 0.4 x (θ1 – θ) J Heat lost by water at room temperature = m.c.θF = 4.2 x (M1 –M) x (θ1 – θ) J By the principle of conservation of energy Heat gained by ice = heat lost by the calorimeter + Heat lost by water at room temperature Result: The specific heat of ice =

Experiment No. 7 – Measurement of Specific Heat Capacity of a Solid
Procedure:
(i) The given solid in the form of a small piece, is first weighed and is then heated by suspending it by a thread in a beaker containing boiling water (or any other hot liquid).
(ii) While the solid is getting heated, the empty dry calorimeter with the stirrer is weighed. The calorimeter is then filled nearly one-third with water (sufficient to submerge the solid) and is weighed again. The difference in the two readings gives the mass of water taken.
(iii) The initial temperature (T1) of water in the calorimeter is noted with a thermometer. (iv) When the solid has attained the steady temperature, its temperature (T2) is recorded
by the thermometer kept in boiling water (or hot liquid). (v) The solid is then gently dropped into the calorimeter carefully without splashing out the
water. (vi) The contents of the calorimeter are well stirred and the final highest temperature (T)
reached is noted. Observations: Mass of solid = m kg Mass of calorimeter = m1 kg Mass of calorimeter + water = m2 kg Initial temperature of water = T1°C Temperature of heated solid = T2°C Temperature of mixture = T°C Calculations: Let c J kg–1 K–1 be the specific heat capacity of solid, while cc J kg–1 K–1 and cw J kg–1 K–1 be the specific heat capacities of the material of calorimeter and of water respectively. From above observations, Mass of water = (m2 – m1) kg Rise in temperature of water = (T – T1)°C ∴ Heat energy gained by water = (m2 – m1) cw (T – T1) J ... (i) Heat energy gained by calorimeter = m1 cc (T – T1) J … (ii) Fall in temperature of solid = (T2 – T) ° C ∴ Heat energy lost by solid = m c (T2 – T) J … (iii) Assuming no loss of heat, by the principle of mixtures, Heat energy lost by solid = Heat energy gained by water + Heat energy gained by calorimeter (or) m c (T2 – T) = (m2 – m1) cw (T – T1) + m1 cc (T – T1) ∴ 𝒄 = [(𝒎𝟐 − 𝒎𝟏)𝒄𝒘 + 𝒎𝟏𝒄𝒄](𝑻 − 𝑻𝟏)
_______________________________ 𝑱 𝑲g–1 k–1 𝒎 (𝑻𝟐 − 𝑻)
In the above expression, the product term m1cc is the heat capacity C'c of the calorimeter (i.e. C'c = m1 cc).

Experiment No. 8 – Ohm’s Law and Potential Drop
Aim: To verify ohm's law for the given Resistance wire of unknown resistance and hence to find its resistance. Apparatus: Given a DC power supply, plug key, voltmeter, ammeter, rheostat, an unknown resistance wire wound on a wooden bobbin and a few connecting wires. Procedure:
1. Make note of the least count of the voltmeter and ammeter. 2. Arrange the circuit as shown in the circuit diagram. 3. Include 2V in the Battery eliminator and insert the plug key. Adjust the rheostat till you get a
small value of current in the ammeter (say 0.1 A). Make sure that the corresponding value of voltage across the unknown resistance (voltmeter reading) is within range of the voltmeter.
4. Note the voltmeter and ammeter readings. 5. Now adjust the rheostat till you get another value of current (say 0.2 A). The voltmeter reading
will also change. Note these two readings down. 6. Repeat the procedure till you reach the maximum range of either of the two instruments and in
each case, note down the values of V and i. 7. Calculate resistance of the wire for each reading using the formula
R = 𝑉𝑖
Find the mean value of all the calculated resistances.
8. Plot a graph of 𝑉 versus 𝑖 and draw a straight line of best fit. Find the slope of this line and this would give you the resistance of the wire.
S. No i (Ampere) V (Volts) 𝐑 = 𝑽
𝒊 [Ω]
Result: Ohm's law was verified for the given resistance wire and its resistance were calculated as follows... • Mean Resistance from Observation = __________ Ω
• Resistance calculated from the Graph = __________ Ω
INSTRUCTIONS (NOT to be written the record book) Keep the resistance in the rheostat at high value in the beginning so that the current will be as low as possible. This reduces the possibility of damage due to excess current. If your connections are wrong, it could damage the voltmeter or ammeter permanently. So, DO NOT switch on the circuit until the teacher has seen your connections. Make sure the polarity of the voltmeter and ammeter is properly noted before connections. Positive of ammeter (red) goes to the positive side of the battery and negative (black) to the negative side. Same applies to voltmeter as well. Do not write on the reverse side of the graph sheet as it has to be stuck in your record book. Show the calculation of slope as part of your observations and calculations in the record book.

Experiment No. 9 – Reflection of light through lenses (UV method)
Theory: A distant object emits a parallel beam of light rays. When these parallel light rays pass through a convex lens, after refraction, they meet at the principal focus to form a real, inverted and diminished image of the object on the screen. This distance between the convex lens and the screen is the focal length, f of the convex lens.
Experiment No.1
Aim of the experiment: To determine the focal length of a convex lens by the distant object method. Apparatus: A convex lens, a white paper (as screen), a half-metre scale, distant object (light from a building) etc. Procedure:
(i) Take a convex lens and point it towards a lighted, distant object like a building.
(ii) Try to focus a sharp image of the object on a sheet of paper or a wall as screen.
(iii) Using half-metre scale, measure the distance between the lens and the screen as here the image is formed at focus.
(iv) Take the mean distance (focal length). Fig 1.1 Fig 1.2 Observations: Distance between the lens and screen, d1 = ____________________ cm
d2 = ____________________ cm d3 = ____________________ cm d4 = ____________________ cm

Mean distance = 𝑑1𝑑2𝑑3𝑑4
4 = focal length, f = __________ cm
Result: Focal length of convex lens by distant object method, f = ____________ cm Theory: In case of a convex lens, when an object is placed between F and 2F, a real, inverted and enlarged image of the object is formed beyond 2F. By measuring the image distance v and the object distance u, the focal length, f is calculated using the formula.
1𝑓
=1𝑣−
1𝑢
⟹1𝑓
=𝑢 − 𝑣𝑢𝑣
𝑜𝑟 𝑓𝑜𝑐𝑎𝑙 𝑙𝑒𝑛𝑔𝑡ℎ,𝑓 = 𝑢𝑣𝑢 − 𝑣
(𝑐𝑚)
The proper sign conventions must be used.
Experiment No.2 Aim or the experiment: To find the focal length of a convex lens using u – v method. Apparatus: Optical bench, a thin convex lens, white screen and an illuminated object (candle or a needle). Procedure:
(i) Arrange the lens, screen and the object (candle) on the optical bench such that the lens is in between the screen and the candle.
(ii) Adjust the height of the candle (placed on a stand), lens and screen in such a way that the candle flame, centre of the lens and the screen are on the same level.
Fig 2
(iii) Focus the illuminated object (candle) on the screen. Adjust the position of the screen, by to-and-fro movement along the optical bench, such that a clear image of the object (candle) is formed on the screen.
(iv) Measure the distance between the screen i.e., image and the lens v and also the distance between the candle i.e., object and the lens u.
(v) Repeat the experiment for different positions of the object and note down the corresponding value for u (object distance) and v (image distance) and find the focal length, f of the convex lens using lens formula. In each observation the position of the screen will also change.

Observation Table S. No Object Distance (u) cm Image Distance (v) cm Focal length
𝒇 = 𝒖𝒗𝒖 − 𝒗
(𝒄𝒎) 1. 2. 3. 4.
According to sign convention u is –ve and v is +ve. Result: The mean focal length, f = ___________________ cm. Precautions:
(i) Experiment should be performed in a dark room so that the bright image appears clearly on the screen.
(ii) Care should be taken that the candle flame is not disturbed by air currents. (iii) The optical centre of the lens, the candle flame and the centre of the screen
should be at the same height. (iv) Proper sign conventions must be applied.
*****