Embed Size (px)
Citation preview
nadlailon _- _ __ .... " " ",,,~~...,....-",-,,,,,,,~,,,-,.,...,._..---..-.--...--.__I~-
"" EPA \-z Risk Assessment Methodology
Draft Environmental Impact Statement for Proposed
ESHAPS for Radionuclides
Volume 1
Background Information Document

40 CFR Part 61 National Emission Standards for Hazardous Air Pollutants
EPA 520/1-89-005
Risk Assessment Methodology
Draft Environmental Impact Statement for Proposed NESHAPS for Radionuclides
VOLUME 1
BACKGROUND INFORMATION DOCUMENT
February 1989 U.S. Environmental Protection Agency
Office of Radiation Programs Washington, DC 20460

The E n v i r o n m e n t a l P r o t e c t i o n Agency i s p r o p o s i n g N a t i o n a l E m i s s i o n S t a n d a r d s f o r H a z a r d o u s A i r P o l l u t a n t s (NESHAPs) f o r R a d i o n u c l i d e s . A D r a f t E n v i r o n m e n t a l I m p a c t S t a t e m e n t (DEIS) h a s b e e n p r e p a r e d i n s u p p o r t o f t h e p r o p o s e d r u l e m a k i n g . The DEIS c o n s i s t s o f t h e f o l l o w i n g t h r e e vo lumes :
Volume I - R i s k A s s e s s m e n t Methodo logy
T h i s document c o n t a i n s c h a p t e r s on h a z a r d i d e n t i f i c a t i o n , movement o f r a d i o n u c l i d e s t h r o u g h e n v i r o n m e n t a l p a t h w a y s , r a d i a t i o n d o s m e t r y , e s t i m a t i n g t h e r i s k o f h e a l t h e f f e c t s r e s u l t i n g f r o m e x p o s e t o low l e v e l s o f i o n i z i n g r a d i a t i o n , a n d a summary o f t h e u n c e r t a i n t i e s i n c a l c u l a t i o n s o f d o s e a n d r i s k s .
Volume I1 - R i s k A s s e s s m e n t s
T h i s document c o n t a i n s a c h a p t e r o n e a c h r a d i o n u c l i d e s o u r c e c a t e g o r y s t u d i e d . The c h a p t e r s i n c l u d e a n i n t r o d u c t i o n , c a t e g o r y d e s c r i p t i o n , p r o c e s s d e s c r i p t i o n , c o n t r o l t e c h n o l o g y , h e a l t h i m p a c t a s s e s s m e n t , s u p p l e m e n t a l c o n t r o l t e c h n o l o g y , a n d c o s t . I t h a s a n a p p e n d i x w h i c h c o n t a i n s t h e i m p u t s t o a l l t h e c o m p u t e r r u n s u s e d t o g e n e r a t e t h e r i s k a s s e s s m e n t .
Volume I11 - Economic A s s e s s m e n t
T h i s document h a s c h a p t e r s o n e a c h r a d i o n u c l i d e s o u r c e c a t e g o r y s t u d i e d . Each c h a p t e r i n c l u d e s a n i n t r o d u c t i o n , i n d u s t r y p r o f i l e , summary o f e m i s s i o n s , r i s k l e v e l s , t h e b e n e f i t s a n d cos ts o f e m i s s i o n c o n t r o l s , and e c o n o m i c i m p a c t e v a l u a t i o n s .
C o p i e s o f t h e DEIS i n w h o l e o r i n p a r t a r e a v a i a b l e t o a l l i n t e r e s t e d p e r s o n s ; a n a n n o u n c e m e n t o f t h e a v a i l a b i l i t y appears i n t h e ~ e d e i a l R e g i s t e r . Comments on t h e DEIS s h o u l d be s e n t i n d u p l i c a t e t o :
C e n t r a l Docket S e c t i o n (LE 1 3 1 ) E n v i r o n m e n t a l P r o t e c t i o n Agency A t t e n t i o n D o c k e t No. A-79-11 4 0 1 M S t r e e t , SW W a s h i n g t o n , DC 20460
For additional information, contact James Kardin at ( 2 0 2 ) 475-9610 or write to:
Director, Criteria and Standards Division Office of Radiation Programs (ANR-460) Environmental Protection Agency 401 M Street, SW Washington, DC 20460
LIST OF PREPARERS
Various staff members from EPA- Office of Radiation Programs contributed in the development and preparation of the DEIS.
Terrence McLaughlin Chief, Environmental Standards Branch
James Hardin Health Physicist Project Officer
Byron Bunger Economist Author/Reviewer
Fran Cohen Attorney Advisor Reviewer
Albert Colli
Larry Gray
Environmental Scientist
Environmental Scientist
W. Daniel Hendricks Environmental Scientist
Paul Magno Environmental Scientist
Christopher B. Nelson Environmental Scientist
Reviewer
Author
Dr. Neal S. Nelson Radiobiologist Author
Barry Parks Health Physicist Reviewer
Dr. Jerome Puskin Chief BioeffecCs ~uthor/Reviewer Analysis Branch
Jack L. Russell Engineer Author/Reviewer
Dr. James. T. Walker Radiation Biophysicist
Author
Larry Weinstock Attorney Advisor Reviewer
An EPA contractor, S. Cohen and Associates, Inc., McLean, VA, provided significant technical support in the preparation of the DEIS.
TABLE OF CONTENTS VOLUME I: RISK ASSESSMENT METHODOLOGY
LIST OF TABLES . . . . . . . . . . . . . . . . . . v f i i
LIST OF FIGURES . . . . . . . . . . . . . . . . . . xi
1. INTRODUCTION . . . . . . . . . . . . . . . . . . . . 1-1 2. CURRENT PROGRAMS AND STRATEGIES
3. HAZARD IDENTIFICATION . . . . . . . . . . . . . . 3-1 4. MOVEMENT OF RADIONUCLIDES THROUGH ENVIRONMENTAL
PATHWAYS . . . . . . . . . . . . . . . . . . 4-1 5. RADIATION DOSIMETRY . . . . . . . . . . . . . . . . 5-1 6. ESTIMATING THE RISK OF HEALTH EFFECTS
RESULTING FROM EXPOSURE TO LOW LEVELS OF IONIZING RADIATION . . . . . . . . . . . . . . . . . 6-1
7. SUMMARY OF UNCERTAINTIES IN DOSES AND RISKS . 7-1
APPENDIX A ASSESSMENT METHODOLOGY . . . . . . . . . . A-1 APPENDIX B MECHANICS OF LIFE TABLE IMPLEMENTATION
OF THE RISK ESTIMATES . . . . . . . . . . . B-1 APPENDIX C OVERVIEW OF TECHNIQUES USED TO QUANTIFY
UNCERTAINTY IN ENVIRONMENTAL RISK ASSESSMENTS . . . . . . . . . . . C-1
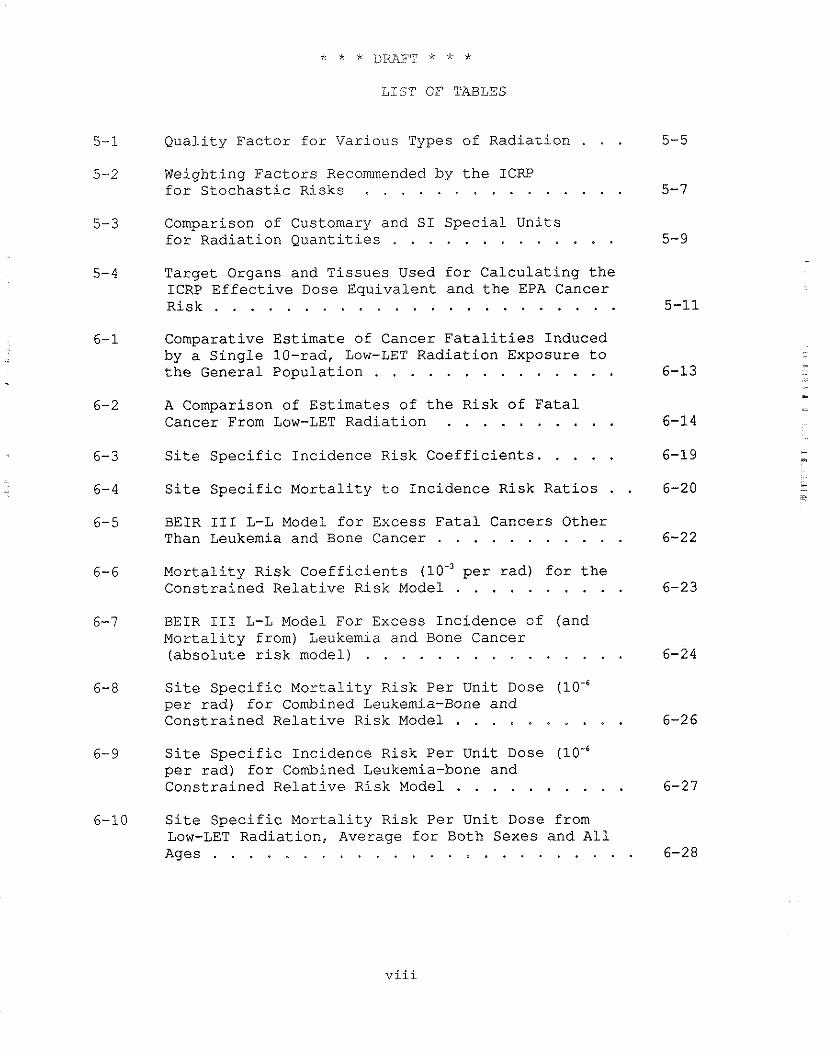
LIST OF TABLES
Quality Factor for Various Types of Radiation . . . Weighting Factors Recommended by the ICRP
. . . . . . . . . . . . . . . for Stochastic Risks
Comparison of Customary and SI Special Units for Radiation Quantities . . . . . . . . . . . . Target Organs and Tissues Used for Calculating the ICRP Effective Dose Equivalent and the EPA Cancer Risk, . . . . . . . . . . . . . . . . . . . . . . Comparative Estimate of Cancer Fatalities Induced by a Single 10-rad, Low-LET Radiation Exposure to
. . . . . . . . . . . . . . the General Population
A Comparison of Estimates of the Risk of Fatal Cancer From Low-LET Radiation . . . . . . . . . . Site Specific Incidence Risk Coefficients. . . . . Site Specific Mortality to Incidence Risk Ratios
BEIR 111 L-L Model for Excess Fatal Cancers Other Than Leukemia and Bone Cancer . . . . . . . . . . . Mortality Risk Coefficients (lo-' per rad) for the
. . . . . . . . . . Constrained Relative Risk Model
BEIR I11 L-L Model For Excess Incidence of (and Mortality from) Leukemia and Bone Cancer (absolute risk model) . . . . . . . . . . . . . . Site Specific Mortality Risk Per Unit Dose per rad) for Combined Leukemia-Bone and
. . . . . . . . . . Constrained Relative Risk Model
Site Specific Incidence Risk Per Unit Dose (lo-$ per rad) for Combined Leukemia-bone and
. . . . . . . . . . Constrained Relative Risk Model
Site Specific Mortality Risk Per Unit Dose from Low-LET Radiation, Average for Both Sexes and All Ages . . . . . . . . . . . . . . . . . . . . . . .
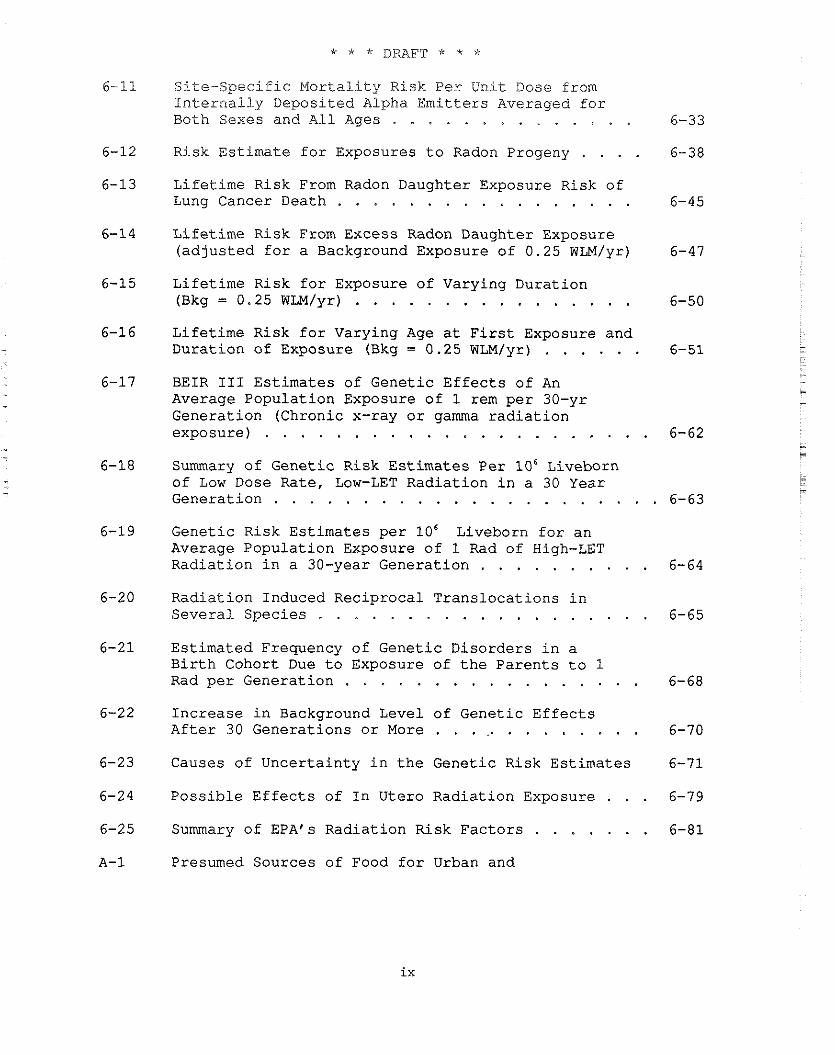
S i t e - S p e c i f i c M o r t a l i t y Risk P e r Unit Dose from I n t e r n a l l y Deposi ted Alpha E m i t t e r s Averaged f o r Both Sexes and A l l Ages . . . . . . . . . . . . . . 6-33
. . . . Risk Es t imate f o r Exposures t o Radon Progeny 6-38
L i fe t ime Risk From Radon Daughter Exposure Risk of Lung Cancer Death . . . . . . . . . . . . . . . . . 6-45
L i fe t ime Risk From Excess Radon Daughter Exposure ( a d j u s t e d f o r a Background Exposure of 0 .25 WLM/yr) 6-47
L i fe t ime Risk f o r Exposure of Varying Durat ion . . . . . . . . . . . . . . . . (Bkg = 0.25 WLM/yr) 6-50
L i fe t ime Risk f o r Varying Age a t F i r s t Exposure and . . . . . . Durat ion of Exposure (Bkg = 0.25 WLM/yr) 6-51
BEIR I11 Es t ima tes of Genet ic E f f e c t s of An Average Popula t ion Exposure of 1 rem p e r 30-yr Generat ion (Chronic x-ray o r gamma r a d i a t i o n exposure) . . . . . . . . . . . . . . . . . . . 6-62
Summary o f Gene t i c Risk Es t ima tes Pe r 106 Liveborn of Low Dose Rate, Low-LET Rad ia t ion i n a 30 Year Generat ion . . . . . . . . . . . . . . . . . . 6-63
Genet ic Risk Es t ima tes p e r 106 Liveborn f o r a n Average Popu la t ion Exposure of 1 Rad of High-LET Rad ia t ion i n a 30-year Generat ion . . . . 6-64
Rad ia t ion Induced Reciproca l T rans loca t ions i n S e v e r a l Spec ie s . . . . . . . . . . . . . 6-65
Es t imated Frequency o f Genet ic Disorders i n a B i r t h Cohort Due t o Exposure of t h e P a r e n t s t o 1 Rad p e r Generat ion . . . . . . . . . . . . . 6-68
I n c r e a s e i n Background Level of Genet ic E f f e c t s A f t e r 30 Genera t ions o r More . . . . . . . . . . 6-70
Causes of Unce r t a in ty i n t h e Genet ic Risk Es t ima tes 6-71
. . . P o s s i b l e E f f e c t s of I n Utero Rad ia t ion Exposure 6-79
. . . . . . . Summary o f EPAfs Rad ia t ion Risk F a c t o r s 6-81
Presumed Sources of Food f o r Urban and
AIRDOS-EPA Parameters Used Eor Generic S i t e Assessments . . . . . . . . . . . . . . . . . . . . A-5
Defau l t Values Used f o r Element Dependent . . . . . . . . . . . . . . . . . . . . . . . F a c t o r s A-7
C a t t l e D e n s i t i e s and Vegetable Crop D i s t r i b u t i o n s f o r u se wi th AIRDOS-EPA . A-9
Risk Fac to r f o r S e l e c t e d Radionucl ides . A-11
LIST OF FIGURES
Pathways of Airborne Radionuclides Into the Environment . . . . . . . . . . . . . 4-2 Vertical Concentration Profiles For Plume vs Downwind Distance From Release . . 4-6
. . . Circular Grid System Used by AIRDOS-EPA 4-16
Schematic Representation of Radioactivity Movement Among Respiratory Tract,
. . . . . . Gastrointestinal Tract, and Blood 5-13
Typical Pattern of Decline of Activity of a Radionuclide in an Organ, Assuming an Initial Activity in the Organ and No Additional Uptake of Radionuclide by the Organ . . . . . . . . . . . . . . . . . . . . 5-15 The ICRP Task Group Lung Model for Particulates. . . . . . . . . . . . . . 5-20 Example of the Output of a Risk Assessment
. . . Using Quantitative Uncertainty Analysis C-3
1. INTRODUCTION
1.1 HISTORY OF STANDARDS DEVELOPMENT
In 1977, Congress amended the Clean Air Act (the Act) to address emissions of radioactive materials. Before 1977, these emissions were either regulated under the Atomic Energy Act or unregulated. Section 122 of the Act required the Administrator of the U.S. Environmental Protection Agency (EPA), after providing public notice and opportunity for public hearings (44 FR 21704, April 11, 1979), to determine whether emissions of radioactive pollutants cause or contribute to air pollution that may reasonably be expected to endanger public health. On December 27, 1979, EPA published a notice in the Federal Register listing radionuclides as hazardous air pollutants under Section 112 of the Act (44 FR 76738, December 27, 1979). To support this determination, EPA published a report entitled "Radiological Impact Caused by Emissions of Radionuclides into Air in the United States, Preliminary Report" (EPA 520/7-79-006, Office of Radiation Programs, U.S. EPA, Washington, D.C., August 1979) .
On June 16, 1981, the Sierra Club filed suit in the U.S. District Court for the Northern District of California pursuant to the citizens' suit provision of the Act (Sierra Club v Gorsuch, No. 81-2436 WTS). The suit alleged that EPA had a nondiscretionary duty to propose standards for radionuclides under Section 112 of the Act within 180 days after listing them. On September 30, 1982, the Court ordered EPA to publish proposed regulations establishing emissions standards for radionuclides, with a notice of hearing within 180 days of the date of that order.
On April 6, 1983, EPA published a notice in the Federal Register proposing standards for radionuclide emission sources in four categories: (1) DOE facilities, (2) Nuclear Regulatory Commission facilities, (3) underground uranium mines, and (4) elemental phosphorus plants. Several additional categories of sources that emit radionuclides were identified, but it was determined that there were good reasons for not proposing standards for them. These source categories were (1) coal-fired boilers; (2) the phosphate industry; (3) other mineral extraction industries; (4) uranium fuel cycle facilities, uranium tailings, and high-level waste management; and (5) low energy accelerators (48 FR 15077, April 6, 1983). To EPA's knowledge, these comprise the source categories that release potentially regulative amounts of radionuclides to the air.
To support these proposed standards and determinations, EPA published a draft report entitled "Background Information
* * * DRAFT * * *
Document., Proposed Standards for Radionuclides" (EPA 520/1-83-001, Office of Radiation Programs, U.S. EPA, Washington, D.C., March 1983).
Following publication of the proposed standards, EPA held an informal public hearing in Washington, D.C., on April 28 and 29, 1983. The comment period was held open an additional 30 days to receive written comments. Subsequently, EPA received a number of requests to extend the time for submission of public comments and to accommodate persons who were unable to attend the first public hearing. In response to these requests, EPA published a notice in the Federal Register that extended the comment period by an additional 45 days and held an additional informal public hearing in Denver, Colorado, on June 14, 1983 (48 FR 23655, May 26, 1983).
On February 17, 1984, the Sierra Club again filed suit in the A U.S. District Court for the Northern District of California pursuant
to the citizens' suit provision of the Act (Sierra Club v - Ruckelshaus, No. 84-0656 WHO). The suit alleged that EPA had a - nondiscretionary duty to issue final emissions standards for
radionuclides or to find that they do not constitute a hazardous air pollutant (i.e., "de-list" the pollutant). In August 1984, the Court - granted the Sierra Club motion and ordered EPA to take final actions on radionuclides by October 23, 1984.
.
On October 22, 1984, the Agency issued its Background Information Document in support of the Agency's final action on radionuclides. The report contains an integrated risk assessment that provides the scientific basis for these actions (EPA 520/1-84- 022-1).
On February 6, 1985, National Emission Standards for Hazardous Air Pollutants (NESHAPS) were promulgated for radionuclide emissions from DOE facilities, NRC-licensed and non-DOE Federal facilities, and elemental phosphorus plants (50 FR 5190). Two additional radionuclide NESHAPS, covering radon-222 emissions from underground uranium mines and licensed uranium mill tailings, were promulgated on April 17, 1985 (50 FR 15386) and September 24, 1986 (51 FR 34056), respectively.
The EPA's basis for the radionuclide NESHAPS was challenged in lawsuits filed by the Sierra Club and the National Resources Defense Council (NRDC). While these suits were under adjudication, the U.S. Court of Appeals for the District of Columbia issued a decision finding that the EPA's NESHAP for vinyl chloride was defective in that costs had been improperly considered in setting the standard. Following the Court's order to review the potential effects of the vinyl chloride decision on other standards, the EPA determined that costs had been considered in many rulemakings on radionuclide emissions. On December 9, 1987, the Court accepted the EPA's proposal to leave the existing radionuclide NESHAPS in place while
the Agency reconsidered the standards. in the interim, the suits filed by the Sierra Club and the NRDC have been placed in abeyance.
1.2 PURPOSE OF THE FINAL BACKGROUND INFORMATION DOCUMENT
Volume I contains background information on radiation protection programs and a detailed description of the Agency's procedures and methods for estimating radiation dose and risk due to radionuclide emissions to the air. This material is arranged as shown in the following descriptions of the chapters:
o Chapter 2 - A summary of regulatory programs for radiation protection and the current positions of the various national and international advisory bodies and state and Federal agencies in regard to radiation.
o Chapter 3 - A description of what makes radiation hazardous, the evidence that proves the hazard, and the evidence that relates the amount of radiation exposure to the amount of risk.
o Chapter 4 - An explanation of how radionuclides, once released into the air, move through the environment and eventually cause radiation exposure of people. This chapter also contains a description of how EPA estimates the amounts of radionuclides in the environment, i.e., in the air, on surfaces, in the food chain, and in exposed humans.
o Chapter 5 - A description of how radionuciides, once inhaled and ingested, move through the body to organs and expose these organs. This chapter also contains a description of how EPA estimates the amounts of radiation dose due to this radiation exposure of organs. It also describes how the amount of radiation dose is estimated when the source of radiation is gamma rays from a source outside of the body.
o Chapter 6 - A description of how the risk of fatal cancers and genetic effects is estimated once the amount of radiation dose is known.
o Chapter 7 - A summary of the uncertainties in the dose and risk estimates of source categories emitting significant amounts of radionuclides, which were made by using the procedures and information in the previous chapters. Associated uncertainties are discussed in the appropriate chapter, but overall uncertainties are discussed in this chapter.
Volume I also contains three appendices. Appendix X describes the environmental transfer factors used in the dose assessment models. Appendix B describes the mechanics of the life table analysis used to estimate risk. Appendix C presents an overview of the quantitative uncertainty analysis techniques currently under review for use as a method for expanding the semiquantitative uncertainty analysis provided in Volume I.
Volume I1 contains detailed risk estimates for each source of emissions, which were performed according to the procedures given in Volume I. Each chapter in Volume I1 addresses four topics: (1) the source category, the processes that result in releases of radionuclides to the environment, and existing controls, (2) the bases for the risk assessment, including reported emissions, source terms used, and other site parameters relevant to the dose assessment, (3) the results of the dose and risk calculation, along
. with an extrapolation to the entire category, and (4) a description of supplementary emissions controls and their cost and effectiveness in reducing dose and risk.
Two appendices are also provided in Volume 11. Appendix A presents the detailed AIRDOS input sheets used to calculate individual and population doses and risks associated with each category. Appendix B presents the methodology used to evaluate the
. costs and effectiveness of earthen covers to control radon emissions from area sources of radon.
1.3 UPDATE METHODOLOGY
The categories of emissions addressed in this document are similar to those addressed in the 1984 Background Information Document. DOE and NRC-licensed facilities, elemental phosphorus plants, underground uranium mines, and licensed uranium mills are addressed because they are covered by NESHAPS. Uranium fuel cycle facilities, high-level waste disposal facilities, coal-fired boilers, and inactive uranium mill tailings sites are addressed because of challenges to previous determinations that they were adequately covered by other laws. Surface uranium mines, DOE radon, and phosphogypsum stacks are addressed because of challenges to the EPAfs lack of risk assessment for these facilities. In sum, this Background Information Document addresses the following categories of radiological emissions to air:
DOE Facilities NRC-Licensed and Non-DOE Federal Facilities Uranium Fuel Cycle Facilities High-Level Waste Elemental Phosphorus Plants Coal-fired Boilers Inactive Uranium Mill Tailings Licensed Uranium Mill Tailings
o DOE Itadon o Underground Uranium Mines o Surface Uranium Mines o Phosphogypsum Stacks
For each category, Volume I1 presents updated information on the number of facilities, radionuclide emissions to air, and control technologies. Depending on the number of facilities in a category, risks are provided for individual facilities, or a set of reference facilities is defined that conservatively represents the category. Risks to the critical population group and the population within 80 km are presented for each category.
EPA recognizes that when it performed a risk assessment to determine the need for regulation of uranium mill tailings under the Uranium Mill Tailings Radiation Control Act (UMTRCA), the Agency considered the national health impact from the radon released from the tailings. In this assessment, EPA is considering only the health effects within 80 km of the source. EPA is using 80 km as the limit in order to be consistent with the other NESHAP rulemakings. This risk assessment in no way disputes the validity of the approach or the results used in the UMTRCA rulemaking.
2. CURRENT PROGRAMS ARB STRATEGIES
2.1 INTRODUCTION
Awareness of radiation and radioactivity dates back only to the end of the last century--to the discovery of x-rays in 1895 and the discovery of radioactivity in 1896. These discoveries mark the beginning of radiation science and the deliberate use of radiation and radionuclides in science, medicine, and industry.
The findings of radiation science rapidly led to the development of medical and industrial radiology, nuclear physics, and nuclear medicine. By the 192OPs, the use of x-rays in diagnostic medicine and industrial applications was widespread, and radium was being used by industry for luminescent dials and by doctors in therapeutic procedures. By the 19301s, biomedical and genetic researchers were studying the effects of radiation on living organisms, and physicists were beginning to understand the mechanisms of spontaneous fission and radioactive decay. By the 19401s, a self-sustaining fission reaction was demonstrated, which led directly to the construction of the first nuclear reactors and atomic weapons.
Developments since the end of World War I1 have been rapid. Today the use of x-rays and radioactive materials is widespread and includes :
0 Nuclear reactors (and their supporting fuel-cycle facilities) generate electricity, power ships and submarines, produce radioisotopes for research, space, defense, and medical applications. They are also used as research tools for nuclear engineers and physicists.
o Particle accelerators produce radioisotopes and are used as research tools for studying the structure of materials and atoms.
o The radiopharmaceutical industry provides the radioisotopes needed for biomedical research and nuclear medicine.
o Nuclear medicine has developed as a recognized medical specialty in which radioisotopes are used in the diagnosis and treatment of numerous diseases.
o X-rays are widely used as a diagnostic tool in medicine and in such diverse industrial fields as oil exploration and nondestructive testing.
o Radionuclides are used in such common consumer products as luminous-dial wristwatches and smoke detectors.
The following sections of this chapter provide a brief history of the evolution of radiation protection philosophy and an outline of the current regulatory programs and strategies of the government agencies responsible for ensuring that radiation and radionuclides are used safely.
2.2 THE INTERNATIONAL COMMISSION ON RADIOLOGICAL PROTECTION AND THE NATIONAL COUNCIL ON RADIATION PROTECTION AND MEASUREMENTS
Initially, the dangers and risks posed by x-rays and radioactivity were little understood. By 1896, however, "x-ray burns" were being reported in the medical literature, and by 1910, it was understood that such "burns" could also be caused by radioactive materials. By the 1920rs, sufficient direct evidence (from experiences of radium dial painters, medical radiologists, and
- miners) and indirect evidence (from biomedical and genetic experiments with animals) had been accumulated to persuade the scientific community that an official body should be established to make recommendations concerning human protection against exposure to x-rays and radium.
At the Second International Congress of Radiology meeting in Stockholm, Sweden, in 1928, the first radiation protection commission was created. Reflecting the use of radiation and - radioactive materials at the time, the body was named the International X-ray and Radium Protection Commission and was charged with developing recommendations concerning protection from radiation. In 1950, to reflect better its role in a changing world, the Commission was reconstituted and renamed the International Commission on Radiation Protection (ICRP) .
During the Second International Congress of Radiology, the newly created Commission suggested to the nations represented at the Congress that they appoint national advisory committees to represent their viewpoints before the ICRP, and to act in concert with the Commission in developing and disseminating recommendations on radiation protection. This suggestion led to the formation, in 1929, of the Advisory Group. After a series of reorganizations and name changes, this committee emerged in 1964 in its present form as the congressionally chartered National Council on Radiation Protection and Measurements (NCRP). The congressional charter provides for the NCRP to:
o Collect, analyze, develop, and disseminate in the public interest information and recommendations about radiation protection and radiation quantities, units, and measurements.
o Develop basic concepts about radiation protection and radiation quantities, units, and measurements, and the application of these concepts.
o Provide a means by which organizations concerned with radiation protection and radiation quantities, units, and measurements may cooperate to use their combined resources effectively and to stimulate the work of such organizations.
o Cooperate with the ICRP and other national and international organizations concerned with radiation protection and radiation quantities, units, and measurements.
Throughout their existence, the ICRP and the NCRP have worked together closely to develop radiation protection recommendations that reflect the current understanding of the dangers associated with exposure to ionizing radiation. The ICRP and the NCRP function as non-government advisory bodies. Their recommendations are not binding on any government or user of radiation or radioactive materials.
The first exposure limits adopted by the ICRP and the NCRP (ICRP34, ICRP38, and NCRP36) established 0.2 roentgen/dayl as the "tolerance dose" for occupational exposure to x-rays and gamma radiation from radium. This limit, equivalent to an absorbed dose of approximately 25 rads/year as measured in air, was established to guard against the known effects of ionizing radiation on superficial tissue, changes in the blood, and "derangement" of internal organs, especially the reproductive organs. At the time the recommendations were made, high doses of radiation were known to cause observable effects, but the epidemiological evidence at the time was inadequate even to imply the carcinogenic induction effects of moderate or low doses. Therefore, the aim of radiation protection was to guard against known effects, and the "tolerance dose" limits that were adopted were believed to represent the level of radiation that a person in normal health could tolerate without suffering observable effects. The concept of a tolerance dose and the recommended occupational exposure limit of 0.2 R/day for x and gamma radiation remained in effect until the end of the 1940's. The recommendations of the ICRP and the NCRP made no mention of exposure of the general populace.
BY the end of World War 11, the widespread use of radioactive materials and scientific evidence of genetic and somatic effects at lower doses and dose rates suggested that the radiation protection recommendations of the NCRP and the ICRP would have to be revised downward.
The NCRPfs recommendation was 0.1 roentgen/day measured in air. This limit is roughly equivalent to the ICRP limit, which was conventionally measured at the point of exposure and included backscatter.
By 1948, the NCRP had formulated its position on appropriate new limits. These limits were largely accepted by the ICRP in its recommendations of 1950 and formally issued by the NCRP in 1954 (ICRP51, NCRP54). Whereas the immediate effect was to lower the basic whole body occupational dose limit to 0.3 rad/week (approximately 15 rads/year), the revised recommendations also embodied several new and important concepts in the formulation of radiation protection criteria.
First, the recommendations recognized the difference in the effects of various types and energies of radiation; both ICRP and NCRP recommendations include discussions of the weighting factors that should be applied to radiations of differing types and energies. The NCRP advocated the use of the "rem" to express the equivalence in biological effect between radiations of differing types and energy.2 Although the ICRP noted the shift toward the acceptance of the rem, it continued to express its recommendations in terms of the rad, with the caveat that the limit for the absorbed dose due to neutron radiation should be one-tenth the limit for x, gamma, or beta radiation.
Second, the recommendations of both organizations introduced the concept of critical organs and tissues. This concept was intended to ensure that no tissue or organ, with the exception of
. the skin, would receive a dose in excess of that allowed for the whole body. At the time, scientific evidence was lacking on tissues and organs. Thus, all blood-forming organs were considered critical and were limited to the same exposure as the whole body.
Third, the NCRP recommendations included the suggestion that individuals under the age of 18 receive no more than one-tenth the
Defining the exact relationship between exposure, absorbed dose, and dose equivalent is beyond the scope of this document. In simple terms, the exposure is a measure of the charge induced by x and gamma radiation in air. Absorbed dose is a measure of the energy per unit mass imparted to matter by radiation. Dose equivalent is an indicator of the effect on an organ or tissue by weighting the absorbed dose with a quality factor, Q, dependent on the radiation type and energy. The customary units for exposure, absorbed dose, and dose equivalent are the roentgen, rad and rem, respectively. Over the range of energies typically encountered, the exposure, dose and dose equivalent from x and gamma radiation have essentially the same values in these units. For beta radiation, the absorbed dose and dose equivalent are generally equal also. At the time of these recommendations, a quality factor of 10 was recommended for alpha radiation. Since 1977, a quality factor of 20 has primarily been used, i.e., for alpha radiation, the dose equivalent is 20 times the absorbed dose.
exposure allowed for adults. The reasoning behind this particular recommendation is interesting, as it reflects clearly the lim'ted knowledge of the times. The scientific evidence indicated a clear relationship between accumulated dose and genetic effect. However, this evidence was obtained exclusively from animal studies that had been conducted with doses ranging from 25 to thousands of rads. There was no evidence from exposure less than 25 rads accumulated dose, and the interpretation of the animal data and the implications for humans were unclear and did not support a specific permissible dose. The data did suggest that genetic damage was more dependent on accumulated dose than previously believed, but experience showed that exposure for prolonged periods to the permissible exposure limit (1.0 R/week) did not result in any observable genetic effects. The NCRP decided that it was not necessary to change the occupational limit to provide additional protection beyond that provided by the reduction in the permissible exposure limit of 0.3 R/week. At the same time, it recommended limiting the exposure of individuals under the age of 18 to assure that they did not accumulate a genetic dose that would later preclude their employment as radiation workers. The factor of ten was rather arbitrary but was believed to be sufficient to protect the future employability of all individuals (NCRP54) .
Fourth, the concept of a tolerance dose was replaced by the concept of a maximum permissible dose. The change in terminology reflected the increasing awareness that any radiation exposure might involve some risk and that repair mechanisms might be less effective than previously believed. Therefore, the concept of a maximum permissible dose (expressed as dose per unit of time) was adopted because it better reflected the uncertainty in our knowledge than did the concept of tolerance dose. The maximum permissible dose was defined as the level of exposure that entailed a small risk compared with those posed by other hazards in life (ICRP51).
Finally, in explicit recognition of the inadequacy of our knowledge regarding the effects of radiation and of the possibility that any exposure might have some potential for harm, the recommendations included an admonition that every effort should be made to reduce exposure to all kinds of ionizing radiation to the lowest possible level. This concept, known originally as ALAP (as low as practicable) and later as ALARA (as low as reasonably achievable), would become a cornerstone of radiation protection philosophy.
During the 195Ors, a great deal of scientific evidence on the effects of radiation became available from studies of radium dial painters, radiologists, and survivors of the atomic bombs dropped on Japan. This evidence suggested that genetic effects and long-term somatic effects were more important than previously considered. Thus, by the late 195O1s, the ICRP and NCRP recommendations were again revised (ICRP59, NCRP59). These revisions include the following major changes: the maximum permissible occupational dose
for who1.e body exposure and the most critical orgaris (blood forming organs, gonads, and the larger lens of the eye) was lowered to 5 rems/year, with a quarterly limit of 3 rems; the limit for exposure of other organs was set at 30 rems/year; internal exposures were controlled by a comprehensive set of maximum permissible concentrations of radionuclides in air and water based on the most restrictive case of a young worker; and recommendations were included for some nonoccupational groups and for the general population (for the first time).
The lowering of the maximum permissible whole-body dose from 0.3 rad/week to 5 rems/year, with a quarterly limit of 3 rems, reflects both the new evidence and the uncertainties of the time. Although no adverse effects had been observed among workers who had received the maximum permissible dose of 0.3 rad/week, there was concern that the lifetime accumulation of as much as 750 rads (15 rads/year times 50 years) was too much. Lowering the maximum permissible dose by a factor of three was believed to provide a greater margin of safety. At the same time, operational experience showed that a limit of 5 rems/year could be met in most instances, particularly with the additional operational flexibility provided by expressing the limit on an annual and quarterly basis.
The recommendations given for nonoccupational exposures were based on concerns about genetic effects. The evidence available
. suggested that genetic effects were primarily dependent on the total accumulated dose. Thus, having sought the opinions of respected geneticists, the ICRP and the NCRP adopted the recommendation that accumulated gonadal dose to age 30 be limited to 5 rems from sources other than natural background and medical exposure. As an operational guide, the NCRP recommended that the maximum dose to any individual be limited to 0.5 rem/year, with maximum permissible body burdens of radionuclides (to control internal exposures) set at one- tenth that allowed for radiation workers. These values were derived from consideration of the genetically significant dose to the population and were established "primarily for the purpose of keeping the average dose to the whole population as low as reasonably possible, and not because of the likelihood of specific injury to the individual" (NCRP59).
During the 1960fs, the ICRP and NCRP again lowered the maximum permissible dose limits (ICRP65, NCRP71). The considerable scientific data on the effects of exposure to ionizing radiation were still inconclusive with respect to the dose response relationship at low exposure levels; thus, both organizations continued to stress the need to keep all exposures to the lowest possible level.
The NCRP and the ICRP made the following similar recommendations:
o Limit the dose to the whole-body, red bone marrow, and gonads to 5 rems in any year, with a retrospective limit of 10 to 15 rems in any given year as long as total accumulated dose did not exceed 5X(N-l8), where N is the age in years.
o Limit the dose to the skin, hands, and forearms to 15, 75, and 30 rems per year, respectively.
o Limit the dose to any other organ or tissue to 15 rems per year.
o Limit the average dose to the population to 0.17 rem per year.
The scientific evidence and the protection philosophy on which the above recommendations were based were set forth in detail in NCRP71. In the case of occupational exposure limits, the goal of protection was to ensure that the risks of genetic and somatic effects were small enough to be comparable to the risks experienced by workers in other safe industries. The numerical limits recommended were based on the linear, no-threshold, dose-response model and were believed to represent a level of risk that was readily acceptable to an average individual. For nonoccupational exposures, the goal of protection was to ensure that the risks of genetic or somatic effects were small compared with other risks encountered in everyday life. The derivation of specific limits was complicated by the unknown dose-response relationship at low exposure levels and the fact that the risks of radiation exposure did not necessarily accrue to the same individuals who benefited from the activity responsible for the exposure. Therefore, it was necessary to derive limits that adequately protected each member of the public and to the gene pool of the population as a whole, while still allowing the development of beneficial uses of radiation and radionuclides .
In 1977, the ICRP made a fundamental change in its recommendations when it abandoned the critical organ concept in favor of the weighted whole-body effective dose equivalent concept for limiting occupational exposure (ICRP77). The change, made to reflect an increased understanding of the differing radiosensitivity of the various organs and tissues, did not affect the overall limit of 5 rems per year for workers, but included a recommendation that chronic exposures of the general public from all controllable sources be limited to 0.1 redyear.
Also significant, ICRP's 1977 recommendations represent the first explicit attempt to relate and justify permissible radiation exposures with quantitative levels of acceptable risk. Thus, average occupational exposures (approximately 0.5 redyear) are equated with risks in safe industries, given as 1.0 E-4 annually. At the maximum limit of 5 rems/year, the risk is equated with that experienced by
some workers in recognized hazardous occupations. Similarly, the risks implied by the nonoccupational limit of 0.5 rem/year are equated to levels of risk of less than 1.0 E-2 in a lifetime; the general populace's average exposure is equivalent to a lifetime risk on the order of 1.0 E-4 to 1.0 E-3. The ICRP believed these levels of risk were in the range that most individuals find acceptable.
In June 1987, the NCRP revised its recommendations to be comparable with those of the ICRP (NCRP87). The NCRP adopted the effective dose equivalent concept and its related recommendations regarding occupational and nonoccupational exposures to acceptable levels of risk. However, the NCRP did not fully adopt a risk-based system because of the uncertainty in the risk estimates and because the details of such a system have yet to be elaborated.
The NCRP recommendations in (NCRP87) for occupational exposures - correspond to the ICRP recommendations. In addition, the relevant nonoccupational exposure guidelines are:
o 0.5 rem/year effective whole-body dose equivalent, not including background or medical radiation, for individuals in the population when the exposure is not continuous.
- o 0.1 rem/year effective whole-body dose equivalent, not including background or medical radiation, for individuals in the population when the exposure is continuous.
o Continuous use of a total dose limitation system based on justification of every exposure and application of the "as low as reasonably achievable" philosophy.
The NCRP equates continuous exposure at a level of 0.1 rem/year to a lifetime risk of developing cancer of about one in a thousand. The NCRP has not formulated exposure limits for specific organs, but it notes that the permissible limits will necessarily be higher than the whole-body limit in inverse ratio for a particular organ to the total risk for whole-body exposure.
In response to EPh's proposed national emission standards for radionuclides, the NCRE suggested that since the 0.1 rem/year limit is the limit for all exposures from all sources (excluding natural background and medical radiation), the operator of any site responsible for more than 25 percent of the annual limit be required to assure that the exposure of the maximally exposed individual is less than 0.1 rem/year from all sources (NCRP84, NCRP87).
2.3 FEDERAL GUIDANCE
The wealth of new scientific information on the effects of radiation that became available in the 1950's prompted the President
to establish an official government entity with responsibility for formulating radiation protection criteria and coordinating radiation protection activities. Executive Order 10831 established the Federal Radiation Council (FRC) in 1959. The Council included representatives from all of the Federal agencies concerned with radiation protection and acted as a coordinating body for all of the radiation activities conducted by the Federal government. In addition to its coordinating function, the Council's major responsibility was to "...advise the President with respect to radiation matters, directly or indirectly affecting health, including guidance for all Federal Agencies in the formulation of radiation standards and in the establishment and execution of programs of cooperation with States . . . " (FRC60).
The Council's first recommendations concerning radiation protection standards for Federal agencies were approved by the President in 1960. Based largely on the work and recommendations of the ICRP and the NCRP, the guidance established the following limits for occupational exposures:
o Whole-body head and trunk, active blood-forming organs, gonads, or lens of eye--not to exceed 3 rems in 13 weeks and total accumulated dose limited to 5 times the number of years beyond age 18.
o Skin of whole body and thyroid--not to exceed 10 rems in 13 weeks or 30 rems per year.
o Hands, forearms, feet, and ankles--not to exceed 25 rems in 13 weeks or 75 rems per year.
o Bone--not to exceed 0.1 microgram of Ra-226 or its biological equivalent.
o Any other organ--not to exceed 5 rems per 13 weeks or 15 rems per year.
Although these levels differ slightly from those recommended by NCRP and ICRP at the time, the differences did not represent any greater or lesser protection. In fact, the FRC not only accepted the levels recommended by the NCRP for occupational exposure, it adopted the NCRP's philosophy of acceptable risk for determining occupational exposure limits. Although quantitative measures of risk were not given in the guidance, the prescribed levels were not expected to cause appreciable bodily injury to an individual during his or her lifetime. Thus, while the possibility of some injury was not zero, it was expected to be so low as to be acceptable if there was any significant benefit derived from the exposure.
The guidance also established dose equivalent limits for members of the public. These were set at 0.5 rem per year (whole body) for an individual and an average of 5 rems in 30 years
(gonadal) per capita. The guidance also provided for developing a suitable sample of the population as a basis for determining compliance with the limit when doses to all individuals are unknown. Exposure of this population sample was not to exceed 0.17 rem per capita per year. The population limit of 0.5 rem to any individual per year was derived from consideration of natural background exposure. Natural background radiation varies by a factor of two to four from location to location.
In addition to the formal exposure limits, the guidance also established as Federal policy that there should be no radiation exposure without an expectation of benefit and that "every effort should be made to encourage the maintenance of radiation doses as far below this guide as practicable." The requirements to consider benefits and keep all exposure to a minimum were based on the possibility that there is no threshold dose for radiation. The linear non-threshold dose response was assumed to place an upper limit on the estimate of radiation risk. However, the FRC explicitly recognized that it might also represent the true level of risk. If so, then any radiation exposure carried some risk, and it was necessary to avoid all unproductive exposures and to keep all productive exposures as "far below this guide as practicable."
In 1967, the Federal Radiation Council issued guidance for the control of radiation hazards in uranium mining (FRC67). The need for such guidance was clearly indicated by the epidemiological evidence that showed a higher incidence of lung cancer in adult males who worked in uranium mines compared with the incidence in adult males from the same locations who had not worked in the mines. The guidance established specific exposure limits and recommended that all exposures be kept as far below the guide limits as possible. The limits chosen represented a tradeoff between the risks incurred at various exposure levels, the technical feasibility of reducing the exposure, and the benefits of the activity responsible for the exposure.
2.4 THE ENVIRONMENTAL PROTECTION AGENCY
In 1970, the functions of the Federal Radiation Council were transferred to the Administrator of the U.S. Environmental Protection Agency. In 1971, the EPA revised the Federal guidance for the control of radiation hazards in uranium mining (EPA71). Based on the risk levels associated with the exposure limits established in 1967, the upper limit of exposure was reduced by a factor of three. The EPA also provided guidance to Federal agencies in the diagnostic use of x-rays (EPA78). This guidance establishes maximum skin entrance doses for various types of routine x-ray examinations. It also establishes the requirement that all x-ray exposures be based on clinical indication and diagnostic need, and that all exposure of patients should be kept as low as reasonably achievable consistent with the diagnostic need.
In 1981, the EPA proposed new Federal guidance for occupational exposures to supersede the 1960 guidance (EPA81). The 1981 recommended guidance follows, and expands upon, the principles set forth by the ICRP in 1977. This guidance was adopted as Federal policy in 1987 (EPA87).
The Environmental Protection Agency has various statutory authorities and responsibilities regarding regulation of exposure to radiation in addition to the statutory responsibility to provide Federal guidance on radiation protection. EPA's standards and regulations for controlling radiation exposures are summarized here.
Reorganization Plan No. 3 transferred to the EPA the authority under the U.S. Atomic Energy Act of 1954, as amended, to establish generally applicable environmental standards for exposure to radionuclides. Pursuant to this authority, in 1977 the EPA issued standards limiting exposure from operations of the light-water reactor nuclear fuel cycle (EPA77). These standards cover normal operations of the uranium fuel cycle, excluding mining and spent fuel disposal. The standards limit the annual dose equivalent to any member of the public from all phases of the uranium fuel cycle (excluding radon and its daughters) to 25 mrems to the whole body, 75 mrems to the thyroid, and 25 mrems to any other organ. To protect against the buildup of long-lived radionuclides in the environment, the standard also sets normalized emission limits for Kr-85, 1-129, and Pu-239 combined with other transuranics with a half-life exceeding one year. The dose limits imposed by the standard cover all exposures resulting from releases to air and water from operations of fuel cycle facilities. The development of this standard took into account both the maximum risk to an individual and the overall effect of releases from fuel cycle operations on the population and balanced these risks against the costs of effluent control.
Under the authority of the Uranium Mill Tailings Radiation Control Act, the EPA has promulgated standards limiting public exposure to radiation from uranium tailings piles (EPA83a, (EPA83b). Whereas the standards for inactive and active tailings piles differ, a consistent basis is used for these standards. Again, the Agency sought to balance the radiation risks imposed on individuals and the population in the vicinity of the pile against the feasibility and costs of control.
Under the authority of the U.S. Atomic Energy Act of 1954, as amended, the EPA has promulgated 40 CFR 191, which establishes standards for disposal of spent fuel, high-level wastes, and transuranic elements (EPA82). The standard establishes two different limits: (1) during the active waste disposal phase, operations must be conducted so that no member of the public receives a dose greater than that allowed for other phases of the uranium fuel cycle; and (2) once the repository is closed, exposure is to be controlled by limiting releases. The release limits were derived by summing, over
long time periods, the estimated risks to all persons exposed to radioactive materials released into the environment. The uncertainties involved in estimating the performance of a theoretical repository led to this unusual approach, and the proposed standard admonishes the agencies responsible for constructing and operating such repositories to take steps to reduce releases below the upper bounds given in the standard to the extent reasonably achievable.
Under the authority of the Atomic Energy Act of 1954, as amended, and the Toxic Substance Control Act, the EPA is developing proposed environmental standards for the land disposal of low-level radioactive wastes and certain naturally occurring and accelerator- produced radioactive wastes. The proposed standards will establish (1) exposure limits for pre-disposal management and storage options, (2) criteria for other agencies to follow in specifying wastes that are Below Regulatory Concern (BRC), ( 3 ) post-disposal exposure limits, and (4) groundwater protection requirements. The proposed regulations are scheduled to be published in the Federal Register in late 1988 (Gr88).
Under the authority of the Safe Drinking Water Act, the EPA has issued interim regulations covering the permissible levels of radium, gross alpha and man-made beta, and photon-emitting contaminants in community water systems (EPA76). The limits are expressed in picocuries/liter. The limits chosen for man-made beta and photon emitters equate to approximately 4 mrems/year whole-body or organ dose to the most exposed individual.
Section 122 of the Clean Air Act amendments of 1977 (Public Law 95-95) directed the Administrator of the EPA to review all relevant information and determine if emissions of hazardous pollutants into air will cause or contribute to air pollution that may reasonably be expected to endanger public health. In December 1979, EPA designated radionuclides as hazardous air pollutants under Section 112 of the Act. On April 6, 1983, EPA published proposed National Emission Standards for radionuclides for selected sources in the Federal Register (48 CFR 15076). Three National Emission Standards for Hazardous Air Pollutants (NESHAPS), promulgated on February 6, 1985, regulated emissions from Department of Energy (DOE) and non-DOE Federal facilities, Nuclear Regulatory Commission (NRC) licensed facilities, and elemental phosphorus plants (FR85a). Two additional NESHAPS, covering radon emission from underground uranium mines and licensed uranium mill tailings, were promulgated on April 17, 1985 and September 24, 1986, respectively (FR85b, FR86).
2.5 NUCLEAR REGULATORY COMMISSION
Under the authority of the Atomic Energy Act of 1954, as amended, the NRC is responsible for licensing and regulating the use of byproduct, source, and special nuclear material, and for ensuring that all licensed activities are conducted in a manner that protects
public health and safety. The Federal guidance on radiation protection applies to the NRC; therefore, the NRC must assure that none of the operations of its licensees exposes a member of the public to more than 0.5 rem/year. The dose limits imposed by the EPA's standard for uranium fuel cycle facilities also apply to the fuel cycle facilities licensed by the NRC. These facilities are prohibited from releasing radioactive effluents in amounts that would result in doses greater than the 25 mrems/year limit imposed by that standard.
The NRC exercises its statutory authority by imposing a combination of design criteria, operating parameters, and license conditions at the time of construction and licensing. It assures that the license conditions are fulfilled through inspection and enforcement. The NRC licenses more than 7,000 users of radioactivity. The regulation of fuel cycle licensees is discussed separately from the regulation of byproduct material licensees.
2.5.1 Fuel Cycle Licenses
The NRC does not use the term "fuel cycle facilities" to define its classes of licensees. The term is used here to coincide with EPA's use of the term in its standard for uranium fuel cycle facilities. As a practical matter, this term includes the NRC's large source and special nuclear material and production and utilization facilities. The NRC's regulations require an analysis of probable radioactive effluents and their effects on the population near fuel cycle facilities. The NRC also ensures that all exposures are as low as reasonably achievable by imposing design criteria and specific equipment requirements on the licensees. After a license has been issued, fuel cycle licensees must monitor their emissions and take environmental measurements to ensure that they meet the design criteria and license conditions. For practical purposes, the NRC adopted the maximum permissible concentrations developed by the NCRP to relate effluent concentrations to exposure.
In the 19701s, the NRC formalized the implementation of as low as reasonably achievable exposure levels by issuing a regulatory guide for as low as reasonably achievable design criteria. This coincided with a decision to adopt, as a design criterion, a maximum permissible dose of 5-mrems/year from a single nuclear electric generating station. The 5 mrem limit applies to the most exposed individual actually living in the vicinity of the reactor and refers to whole-body doses from external radiation by air pathway (NRC77).
2.5.2 Byproduct Material Licenses
The NRC's licensing and inspection procedure for byproduct material users is less uniform than that imposed on major fuel cycle licensees for two reasons: (1) the much larger number of byproduct material licensees, and (2) their much smaller potential for releasing significant quantities of radioactive materials into the
environment. The prelicensing assurance procedures of imposing design reviews, operating practices, and license condLtbons prior to construction and operation are similar.
The protection afforded the public from releases of radioactive materials from these facilities can vary considerably because of three factors. First, the requirements that the NRC imposes for monitoring effluents and environmental radioactivity are much less stringent for these licensees. If the quantity of materials handled is small enough, the NRC might not impose any monitoring requirements. Second, and more important, the level of protection can vary considerably because the exact point where the licensee must meet the effluent concentrations for an area of unrestricted access is not consistently defined. Depending on the particular licensee, this area has been defined as the nearest inhabited structure, as the boundary of the user's property line, as the roof of the building where the effluents are vented, or as the mouth of the stack of vent. Finally, not all users are allowed to reach 100 percent of the maximum permissible concentration in their effluents. In fact, the NRC has placed as low as reasonably achievable requirements on many of their licensees by limiting them to 10 percent of the maximum permissible concentration in their effluents.
. 2.6 DEPARTMENT OF ENERGY
- The DOE operates a complex of national laboratories and weapons
facilities. These facilities are not licensed by the NRC. The DOE is responsible, under the U.S. Atomic Energy Act of 1954, as amended, for ensuring that these facilities are operated in a manner that does not jeopardize public health and safety.
The DOE is subject to the Federal guidance on radiation protection issued by EPA and its predecessor, the FRC. For practical purposes, the DOE has adopted the NCRP's maximum permissible concentrations in air and water as a workable way to ensure that the dose limits of 0.5 rem/year whole-body and 1.5 rems/year to any organ are being observed. The DOE also has a requirement that all doses be kept as low as is reasonably achievable, but the contractors who operate the various DOE sites have a great deal of latitude in implementing policies and procedures to ensure that all doses are kept to the lowest possible level.
The DOE ensures that its operations are within its operating guidelines by requiring its contractors to maintain radiation monitoring systems around each of its sites and to report the results in an annual summary report. New facilities and modifications to existing facilities are subject to extensive design criteria reviews (similar to those used by the NRC). During the mid- 19701s, the DOE initiated a systematic effluent reduction program that resulted in the upgrading of many facilities and effected a
corresponding reductyion in the effluents (including airborne and liquid radioactive materials) released to the environment.
As a continuation of this program, DOE has issued proposed Order 5400.3 "Draft Radiation Protection of the Public and the Environment'hnd has issued several internal guidance documents including procedures for the calculation of internal and.externa1 doses to the public and guidance on environmental surveillance.
2.7 OTHER FEDERAL AGENCIES
2.7.1 Department Of Defense
The Department of Defense operates several nuclear installations, including a fleet of nuclear-powered submarines and their shore support facilities. The DOD, like other Federal agencies, must comply with Federal radiation protection guidance. The DOD has not formally adopted any more stringent exposure limits for members of the public than the 0.5 rem/year allowed by the Federal guidance.
2.7.2 Center for Medical Devices and Radiological Health
Under the Radiation Control Act of 1968, the major responsibility of the Center for Medical Devices and Radiological Health in the area of radiation protection is the specification of performance criteria for electronic products, including x-ray equipment and other medical devices. This group also performs environmental sampling in support of other agencies, but no regulatory authority is involved.
2.7.3 Mine Safety and Health Administration
The Mine Safety and Health Administration (MSHA) has the regulatory authority to set standards for exposures of miners to radon and its decay products and other (nonradiological) pollutants in mines. The MSHA has adopted the Federal guidance for exposure of uranium miners (EPA71). It has no authority or responsibility for protecting members of the general public from the hazards associated with radiation.
2.7.4 Occupational Safety and Health Administration
The Occupational Safety and Health Administration (OSHA) is responsible for assuring a safe workplace for all workers. This authority, however, does not apply to radiation workers at government-owned or NRC-licensed facilities. This group does have the authority to set exposure limits for workers at unlicensed facilities, such as particle accelerators, but it does not have any authority to regulate public exposure to radiation. OSHA has adopted the occupational exposure limits of the NRC, except it has not
imposed the requirement to keep aLL doses as ,low as is reasonably achievab1.e.
2.7.5 Department of Transportation
The Department of Transportation (DOT) has statutory responsibility for regulating the shipment and transportation of radioactive materials. This authority includes the responsibility to protect the public from exposure to radioactive materials while they are in transit. For practical purposes, the DOT has implemented its authority through the specification of performance standards for shipment containers and by setting maximum exposure rates at the surface of any package containing radioactive materials. These limits were set to assure compliance with the Federal guidance for occupational exposure, and they are believed to be sufficient to protect the public from exposure. The DOT also controls potential public exposure by managing the routing of radioactive shipments to avoid densely populated areas.
2.8 STATE AGENCIES
States have important authority for protecting the public from the hazards associated with ionizing radiation. In 26 states, the states have assumed NRC's inspection, enforcement, and licensing responsibilities for users of source and byproduct materials and users of small quantities of special nuclear material. These "NRC Agreement States," which license and regulate more than 11,500 users of radiation and radioactive materials, are bound by formal agreements to adopt requirements consistent with those imposed by the NRC. The NRC continues to perform this function for all licensable uses of the source, byproduct, and special nuclear material in the 24 states that are not Agreement States.
Nonagreement states, as well as NRC Agreement States, regulate the exposures to workers from electronic sources of radiation. Also, all states retain the authority to regulate the use of naturally occurring (i.e., radium) and accelerator-produced radioactive materials.
REFERENCES
U.S. Environmental Protection Agency, "Radiation Protection Guidance for Federal Agencies: Underground Mining of Uranium Ore," Federal Register 36(132), July 9, 1971.
U.S. Environmental Protection Agency, National Interim Primary Drinking Water Regulations, EPA-570/9-76-003, 1976.
U.S. Environmental Protection Agency, "Environmental Radiation Protection Standards for Nuclear Power Operations,"40 CFR 190, Federal Register 42(9), January 13, 1977.
U.S. Environmental Protection Agency, "Radiation Protection Guidance to Federal Agencies for Diagnostic X- Rays," Federal Register 43(22), February 1, 1978.
U.S. Environmental Protection Agency, "Federal Radiation Protection Guidance for Occupational Exposure," Federal Register 46(15), January 23, 1981.
U.S. Environmental Protection Agency, "Environmental Standards for the Management and Disposal of Spent Nuclear Fuel, High-Level and Transuranic Radioactive Wastes," 40 CFR 191, -. Federal Register 47(250), December 29, 1982.
U.S. Environmental Protection Agency, "Standards for Remedial Actions at Inactive Uranium Processing Sites," Federal Register 48(590), January 5, 1983.
U.S. Environmental Protection Agency, "Environmental Standards for Uranium Mill Tailings at Licensed Commercial Processing Sites; Final Rule," Federal Register 48(196), October 7, 1983.
U.S. EPA, "Radiation Protection Guidance to Federal Agencies for Occupational ~xposure," Federal Register 52 (2822), January 27, 1987.
Federal Register 50, 5190-5200, February 6, 1985.
Federal Register 50, 15386-15394, April 17, 1985. -
Federal Register 51, 34056-34067, September 24, 1986
FRCGO Federal Radiation Council, "Radiation Protection Guidance for Federal Agencies," Federal Register 4 4 ( 0 2 ) , May 18, 1960.
FRC67 Federal Radiation Council, Guidance for the Control of Radiation Hazards in Uranium Mininq, Report No. 8, September 1967.
Gr88 Gruhlke, J.M., Galpin, F.L., and Holcomb, W.F., "Overview of EPA1s Environmental Standards for the Land Disposal of LLW and NARM Waste-1988," ORP/EPA, for presentation at DOE'S 10th Annual LLW Management Conference, Denver, Colorado, August 30 - September 1, 1988.
ICRP34 International X-Ray and Radium Protection Commission, - "International Recommendations for X-Ray and Radium
Protection," British Journal of Radiology 7, 695-699, 1934.
ICRP38 International X-Ray and Radium Protection Commission, "International Recommendations for X-Ray and Radium Protection," Amer. J. of Roent and Radium 40, 134-138, 1938.
ICRP51 International Commission on Radiological Protection, "International Recommendations on Radiological Protection 1950," British Journal of Radiology 24, 46-53, 1951.
ICRP59 International Commission on Radiological Protection, Recommendations of the ICRP 1958, ICRP Publication 1, Pergamon Press, Oxford, 1958.
ICRE'65 International Commission on Radiological Protection, Recommendations of the ICRP 1965, ICRP Publication 9, Pergarnon Press, Oxford, 1965.
ICRP77 International Commission on Radiological Protection, Recommendations of the ICRP, ICRP Publication 26, Pergamon Press, Oxford, 1977.
NCRP36 Advisory Committee on X-Ray and Radium Protection, X-Ray Protection, NCRP Report No. 3, 1936.
NCRP 5 4 National Committee on Radiation Protection, Permissible Dose From External Sources of Ionizing Radiation, National Bureau of Standards Handbook 59, 1954.
NCRP 5 9 National Committee on Radiation Protection, Maximum Permissible Body Burdens and Maximum Permissible
Concentrations of Radionuclides in Air and in Water for Occupational Exposure, National Bureau of Standards Handbook 69, 1959.
NCRP 7 1 National Council on Radiation Protection and Measurements, Basic Radiation Protection Criteria, NCRP Report No. 39, 1971.
NCRP 8 4 National Council on Radiation Protection and Measurements, Control of Air Emissions of Radionuclides, September 18, 1984.
NCRP8 7 National Council on Radiation Protection and Measurements, Recommendations on Limits for Exposure to Ionizing Radiation, NCRP Report 91, June 1, 1987.
NRC7 7 U.S. Nuclear Regulatory Commission, 1977, Appendix I: 10 CFR 50, Federal Register 44, September 28, 1979.

3 . HAZARD IDENTIFICATION
The adverse biological reactions associated with ionizing radiations, and hence with radioactive materials, are carcinogenicity, mutagenicity, and teratogenicity. Carcinogenicity is the ability to produce cancer. Mutagenicity is the property of being able to induce genetic mutation, which may be in the nucleus of either somatic (body) or germ (reproductive) cells. Teratogenicity refers to the ability of an agent to induce or increase the incidence of congenital malformations as a result of permanent structural or functional deviations produced during the growth and development of an embryo (these are more commonly referred to as birth defects).
Ionizing radiation causes injury by breaking constituent body molec~les into electrically charged fragments called "ions" and thereby producing chemical rearrangements that may lead to permanent cellular damage. The degree of biological damage caused by various types of radiation varies according to how close together the ionizations occur. Some ionizing radiations (e.g., alpha particles) produce intense regions of ionization. For this reason, they are called high-LET (linear energy transfer) particles. Other types of radiation (such as high-energy photons [x-rays]) that release electrons that cause ionization and beta particles are called low-LET radiations because of the sparse pattern of ionization they produce. In equal doses, the carcinogenicity and mutagenicity of high-LET radiations are generally an order of magnitude or more greater than those of low-LET radiations.
Radium, radon, radon daughters, and several other naturally occurring radioactive materials emit alpha particles; thus, when these materials are ingested or inhaled, they are a source of high-LET particles within the body. Man-made radionuclides are usually beta and photon emitters of low-LET radiations. Notable exceptions to this generalization are plutonium and other transuranium radionuclides, most of which emit alpha radiation.
3.1 EVIDENCE THAT RADIATION IS CARCINOGENIC
The production and properties of x-rays were demonstrated within one month of the public reporting of Roentgen's discovery of x-rays. The first report of acute skin injury was made in 1896 (Mo671. The first human cancer attributed to this radiation was reported in 1902 (Vo02). By 1911, 94 cases of radiation-related skin cancer and 5 cases of leukemia in man had been reported in the literature (Up15). Efforts to study this phenomenon through
the use of experimental animals produced the first reported radiation-related cancers in experimental. anima1.s i n 1910 and 1912 (MalO, Ma12). Since that time, an extensive body of literature has evolved on radiation carcinogenesis in man and animals. This literature has been reviewed most recently by the United Nations Scientific Committee on the Effects of Atomic Radiation (UNSCEAR) and by the National Academy of Sciences Advisory Committee on the Biological Effects of Ionizing Radiations (NAS-BEIR Committee) (UNSCEAR82, NAS80) .
Identification of the carcinogenicity of radioactive emissions followed a parallel course. In 1921, Uhlig first associated inhaled radioactive material and carcinogenesis in man in a study of lung cancer in underground miners in the Erz Mountains (Uh21). This association was reaffirmed by Ludewig and Lorenser in 1924 (Lu24). Ingestion of radioactive materials was also demonstrated to be a pathway for carcinogenesis in man. As early as 1925, ingested radium was known to cause bone necrosis (Ho25), and in 1929, the first report was published on the association of radium ingestion and osteogenic sarcoma (Ma29).
. The expected levels of exposure to radioactive pollutants in the environment are too low to produce an acute (immediate)
- response. Their effect is more likely to be a delayed response, in the form of an increased incidence of cancer long after exposure. An increase in cancer incidence or mortality with increasing radiation dose has been demonstrated for many types of cancer in both human populations and laboratory anima1.s (UNSCEAR77, 82). Studies of humans exposed to internal or external sources of ionizing radiation have shown that the incidence of cancer increases with increased radiation exposure. This increased incidence, however, is usually associated with appreciably greater doses and exposure frequencies than those encountered in the environment. Malignant tumors most often appear long after the radiation exposure, usually 10 to 35 years later (NAS80, UNSCEAR82). The tumors appear in various organs. In the case of internal sources of radiation due to radioactive materials, the metabolism of the materials generally leads to their deposition in specific organs, which results in a radiation dose and higher-than-normal risk of cancer in these organs.
Whereas many, if not most, chemical carcinogens appear to be organ- or tissue-specific, ionizing radiation can be considered pancarcinogenic. According to Storer (St75): "Ionizing radiation in sufficiently high dosage acts as a complete carcinogen in that it serves as both initiator and promoter. Further, cancers can be induced in nearly any tissue or organ of man or experimental animals by the proper choice of radiation
* * * DRAFT * * *
dose and exposure schedule." Radiation-induced cancers in humans have been reported in the following tissues: thyroid, female breast, lung, bone marrow (leukemia), stomach, liver, large intestine, brain, salivary glands, bone, esophagus, small intestine, urinary bladder, pancreas, rectum, lymphatic tissues, skin, pharynx, uterus, ovary, mucosa of cranial sinuses, and kidney (UNSCEAR77, 82; NAS72, 80; Be77, Ka82, Wa83).
Studies of populations exposed to high levels of radiation have identified the organs at greatest risk following radiation exposure. Brief discussions of these findings follow.
1. Atomic Bomb Survivors - The survivors of the atomic bomb explosions at Hiroshima and Nagasaki, Japan, were exposed to whole-body external radiation doses of 0 to more than 200 rads.' An international group has been observing the population since 1950. The most recent reports published by this group (Ka82, Wa83) indicate that an increase in cancer mortality has been shown for many cancers, including leukemia; thyroid, breast, and lung cancer; esophageal and stomach cancer; colon cancer; cancer of urinary organs; and multiple myeloma.
2. Ankylosing Spondylitics - A large group of patients was given x-ray therapy for ankylosing spondylitis of the spine during the years 1934 to 1954. X-ray doses usually exceeded 100 rad. British investigators have been following this group since about 1957. The most recent review of the data shows excess cancers in irradiated organs, including leukemia, lymphoma, lung and bone cancer, and cancer of the pharynx, esophagus, stomach, pancreas, and large intestine (UNSCEAR77, NAS80) .
3. Mammary Exposure - Several groups of women who were exposed to x-rays during diagnostic radiation of the thorax or during radio-therapy for conditions involving the breast have been studied. Although most of the groups have been followed only a relatively short time (about 15 years), a significant increase in the incidence of breast cancer has been observed (UNSCEAR77). The dose that produced these effects averaged about 100 rads.
4. Medical Treatment of Benign Conditions - Several groups of persons who were medically treated with x-rays to alleviate some benign conditions have been studied. Excess
The rad is the unit of absorbed dose in common use; 1 rad equals 100 ergs of absorbed energy per gram of material.
cancer has developed in many of th.e organs irradiated (e. g., breast, brain, thyroid, and probably salivary glands, skin, bone, and pelvic organs) following doses ranging from less than 10 to more than 100 rads (UNSCEAR77). Excess leukemia has also occurred in some groups. The Eollowup period for most groups has been short, often less than 20 years.
5. Underground Miners - Studies of excess cancer mortality in U.S. underground miners exposed to elevated levels of radon started in the 1950's and 1960's. Groups that have worked in various types of mines, including uranium and fluorospar, are being studied in the United States, Canada, Great Britain, Sweden, China, and Czechoslovakia. Most of the miners studied have been subjected to high rates of exposure; however, a recent review indicates that increased incidence of lung cancer has been observed in some miners exposed at cumulative levels approximating those that can occur wherever high environmental concentrations of radon are present (NAS80). The response shown in all the study groups is nearly proportional to the dose (NAS80).
6. Ingested or Injected Radium - Workers who ingested Ra-226 while painting watch and clock dials have been studied for 35 to 45 years, and patients who received injections of Ra-226 or Ra-224 for medical purposes have been studied for 20 to 30 years (NAS72, 80). Excess incidence of leukemia and osteosarcoma related to Ra-224 exposure has been observed. Calculated cumulative average doses for these study groups ranged from 200 to 1,700 rads. A study now underway that deals with exposure levels under 90 rads should provide additional data (NAS80).
7. Injected Thorotrast - Medical use of Thorotrast (colloidalthorium dioxide) as an x-ray contrast medium introduced radioactive thorium and its daughters into a number of patients. Research studies have followed patients in Denmark, Portugal, Japan, and Germany for about 40 years and patients in the United States for about 10 years (UNSCEAR77, NAS80). An increased incidence of liver, bone, and lung cancer has been reported in addition to increased anemia, leukemia, and multiple myeloma (In79) . Calculated cumulative doses range from tens to hundreds of rads.
8. Diagnostic X-ray Exposure During Pregnancy - Effects of x-ray exposure on the fetus during pregnancy have been studied in Great Britain since 1954, and several retrospective studies have been made in the United States since that time (NAS80, UNSCEAR77). Increased incidence of
leukemia and other childhood cancers have been observed in populations exposed to absorbed doses of 0.2 to 20 rads in utero (NASBO, UNSCEAR77) . Not all of the cancers induced by radiation are fatal. The
fraction of fatal cancers is different for each type of cancer. The BEIR-3 committee estimated the fraction of fatal cancers by site and sex (NASBO). Estimates of cancers by site ranged from about 20 percent fatal in the case of thyroid cancer to 100 percent fatal in the case of liver cancer. They concluded that, on the average, females have 2 times as many total cancers as fatal cancers following radiation exposure, and males have 1.5 times as many (NASBO). Although many of the radiation-induced cancers are not fatal, they still are costly and adversely affect the person's lifestyle for the remainder of his or her life. Just how these costs and years of impaired life should be weighed in evaluating the hazards of radiation exposure is not certain. This assessment addresses only the risk of fatal carcinogenesis.
In addition to the evidence that radiation is a pancarcinogen, and as such can induce cancers in nearly any tissue or organ, it also appears that it can induce cancer by any route of exposure (dermal, inhalation, ingestion, and injection).
Inhalation is likely to be the major route of environmental exposure to airborne radioactive pollutants, and the principal organ at risk is.likely to be the lung. Some radiation exposure to airborne pollutants Gy the ingestion route is possible, however, as these pollutants are deposited on soil, on plants, or in sources of water. Ingestion of inhaled particulates also occurs. Some radionuclides may also cause whole-body gamma radiation exposure while airborne or after their deposition on the ground.
Estimates of cancer risk are based on the absorbed dose of radiation in an organ or tissue. Given the same type of radiation, the risk for a particular dosage would be the same, regardless of the source of the radiation. Numerical estimates of the cancer risk posed by a unit dose of radiation in various organs and tissues are presented in Chapter 6. The models used to calculate radiation doses from a specific source are described in Chapters 4 and 5.
The overwhelming body of human epidemiological data makes it unnecessary to base major conclusions concerning the risk of radiation-induced cancers 011 evidence provided by animal tests; however, these data are relevant to the interpretation of human
data (NAS80) and contribute additional evidence to the epidemiological database for humans. Radiation-induced cancers have been demonstrated in several animal species, including rats, mice, hamsters, guinea pigs, cats, dogs, sheep, cattle, pigs, and monkeys. Induced through multiple routes of administration and at multiple dose levels, these cancers have occurred in several organs or tissues. These animal studies have provided information on the significance of dose rate compared with the age of the animals at exposure, the sex of the animals, and the genetic characteristics of the test strain. They have shown that radiation-induced cancers become detectable after varying latent periods, sometimes several years after exposure. The studies further show that the total number of cancers that eventually develop varies consistently with the dose each animal receives. Experimental studies in animals have also established that the carcinogenic effect of high-LET radiation (alpha radiations or neutrons) is greater than that of low-LET radiation (x-rays or gamma rays).
A number of researchers have induced transformations in mammalian tissue culture, including the embryo cells of mice and hamsters (Bo84, Ke84, Ha84, Gu84). Chromosome aberrations in cultured human peripheral lymphocytes have been demonstrated at Rn-222 alpha doses of about 48 mrads/y with an external gamma dose of about 100 mrads/y (Po77). Another major finding of recent research (Gu84) is that DNA from radiation-induced mouse tumors contains an activated oncogene that can transform specific types of cultured cells when introduced into these cells. The researchers also found that a difference in only one base in the oncogene was responsible for the transformation. Thus, radiation can induce tumors even when only a small change in the DNA occurs as a result of irradiation.
3.2 EVIDENCE THAT RADIATION IS MUTAGENIC
Radiation can change the structure, number, or genetic content of the chromosomes in a cell nucleus. These genetic radiation effects are classified as either gene mutations or chromosomal aberrations. Gene mutations refer to alterations of the basic units of heredity, the genes. Chromosomal aberrations refer to changes in the normal number or structure of chromosomes. Both gene mutation and chromosomal aberrations are heritable; therefore, they are considered together as genetic effects. Mutations and chromosomal aberrations can occur in somatic (body) or germ (reproductive) cells. In the case of germ cells, the mutagenic effect of radiation is not seen in those persons exposed to the radiation, but in their descendents.
Mutations often result in miscarriages or produce such undesirable changes in a population as congenital malformations that result in mental or physical defects. Mutations occur in many types of cells; no tendency toward any specific locus or chromosome has been identified. For this reason, they can affect any characteristic of a species. A relatively wide array of chromosome aberrations occurs in both humans and animals.
Early experimental studies showed that x-radiation is mutagenic. In 1927, H.J. Muller reported radiation-induced genetic changes in animals, and in 1928, L.J. Stadler reported such changes in plants (Ki62). Although genetic studies were carried out in the 193O1s, mostly in plants and fruit flies (Drosophila), the bulk of the studies on mammals started after the use of nuclear weapons in World War I1 (UNSCEAR58).
Very few quantitative data are available on radiogenic mutations in humans, particularly from low-dose exposures, for the following reasons: these mutations are interspersed over many generations, some are so mild they are not noticeable, and some mutagenic defects that do occur are similar to nonmutagenic effects and are therefore not necessarily recorded as mutations. The bulk of data supporting the mutagenic character of ionizing radiation comes from extensive studies of experimental animals, mostly mice (UNSCEAR77, 82; NAS72, 80). These studies have demonstrated all forms of radiation mutagenesis--lethal mutations, translocations, inversions, nondisjunction, point mutations, etc. Mutation rates calculated from these studies are extrapolated to humans (because the basic mechanisms of mutations are believed to be the same in all cells) and form the basis for estimating the genetic impact of ionizing radiation on humans (NAS80, UNSCEAR82). The vast majority of the demonstrated mutations in human germ cells contribute to both increased mortality and illness (NAS80, UNSCEAR82). Moreover, the radiation protection community is generally in agreement that the probability of inducing genetic changes increases linearly with dose and that no "threshold" dose is required to initiate heritable damage to germ cells.
Considerable evidence has been documented concerning the production of mutations in cultured cells exposed to radiation. Such mutations have been produced in Chinese hamster ovary cells, mouse lymphoma cells, human diploid fibroblasts, and human blood lymphocytes. Many of the radiation-induced specific types of mutations produced in human and Chinese hamster cultured cells are associated with structural changes in the X chromosome. Evidence suggests that these mutations may be largely due to deletions in the chromosomes.
Mutagenicity in human somatic cells has been demonstrated on the basis of chromosome aberrations detected in cultured lymphocytes. Chromosome aberrations in humans have been demonstrated in lymphocytes cultured from persons exposed to ingested Sr-90 and Ra-226 (Tu63); inhaled/ingested Rn-222, natural uranium, or Pu-239 (Br77); or inhaled Rn-222 (Po78); and in atomic bomb survivors (Aw78). Although no direct evidence of health impact currently exists, these chromosome aberrations demonstrate that mutagenesis is occurring in somatic cells of humans exposed to ionizing radiation.
Evidence of mutagenesis in human germ cells (cells of the ovary or testis) is less conclusive. Studies have been made of several populations exposed to medical radiation, atomic bomb survivors, and a population in an area of high background - radiation in India (UNSCEAR77). Although these studies suggest an increased incidence of chromosomal aberrations in germ cells following exposure to ionizing radiation, the data are not convincing (UNSCEAR77). Investigators who analyzed the data on children born to survivors of the atomic bombings of Hiroshima and Nagasaki found no statistically significant genetic effects due to parental exposure (Sc81). They did find, however, that the observed effects are in the direction of genetic damage from the bomb radiation exposure.
The incidence of serious genetic disease due to mutations and chromosome aberrations induced by radiation is referred to as genetic detriment. Serious genetic disease includes inherited ill health, handicaps, or disabilities. Genetic disease may be manifest at birth or may not become evident until some time in adulthood. Radiation-induced genetic detriment includes impairment of life, shortened life span, and increased hospitalization. Estimates of the frequency of radiation-induced genetic impairment are presented in Chapter 6 of this document. Although the numbers represent rough approximations, they are relatively small in comparison with the magnitude of detriment associated with spontaneously arising genetic diseases (UNSCEAR82) . 3.3 EVIDENCE THAT RADIATION IS TERATOGENIC
Teratogenicity is the malformation of tissues or organs of a fetus resulting from physiologic and biochemical changes. Radiation is a well-known teratogenic agent. Case reports of radiation-induced teratology were made as early as 1921 (St21). By 1929, an extensive review of a series of pregnancies yielded data indicating that 18 of the children born to 76 irradiated
mothers had abliormally small heads (microcephaly) (Mu30). Although the radiation dose in these cases is not known, it was high.
Early experimental studies (primarily in the 1940's and 1950's) demonstrated the teratogenic properties of x-rays in fish, amphibia, chick, mouse, and rat embryos (Ru53). These experiments showed that the developing fetus is much more sensitive to radiation than the mother and provided data on periods of special sensitivity and dose-response. The malformations produced in the embryo depend on which cells, tissues, or organs in the fetus are most actively differentiating at the time of radiation. Embryos are relatively resistant to radiation-induced teratogenic effects during the earliest stages of their development and are most sensitive during development of the neuroblast (these cells eventually become the nerve cells). These experiments showed that different malformations could be elicited by irradiating the fetus at specific times during its development.
Substantial evidence points to the ability of radiation to induce teratogenic effects in human embryos as well. In a study of mental retardation in children exposed in utero to atomic bomb radiation in Hiroshima and Nagasaki, researchers found that damage to the child appears to be related linearly to the radiation dose that the fetus receives (Ot84). The greatest risk of damage occurs at 8 to 15 weeks, which is the time the nervous system is undergoing the most rapid differentiation and proliferation of cells. They concluded that the age of the fetus at the time of exposure is the most important factor in deter- mining the extent and type of damage from radiation. A numerical estimate of mental retardation risk due to radiation is given in Chapter 6.
3.4 UNCERTAINTIES
Although much is known about radiation dose-effect relationships at high-level doses, uncertainty exists when dose-effect relationships based on direct observations are extrapolated to lower doses, particularly when the dose rates are low. As described in Chapter 6, the range of extrapolation varies depending on the sensitivity of the organ system. For breast cancer, this may be as small as a factor of four. Uncertainties in the dose-effect relationships are recognized to relate to such factors as differences in quality and type of radiation, total dose, dose distribution, dose rate, and radiosensitivity (including repair mechanisms, sex, variations in age, organ, and state of health). The range of uncertainty in
the estimates of radiation risk is examined in some detail in Chapters 5, 6 and 7.
The uncertainties in the details of the mechanisms of carcinogenesis, mutagenesis, and teratogenesis make it necessary to rely on the considered judgments of experts on the biological effects of ionizing radiation. These findings, which are well documented in publications by the National Academy of Sciences and the United Nations Scientific Committee on the Effects of Atomic Radiation, are used by advisory bodies such as the International Commission on Radiological Protection (ICRP) in developing their recommendations. The EPA has considered all such findings in formulating its estimate of the relationship between radiation dose and response.
- Estimates of the risk from ionizing radiation are often limited to fatal cancers and genetic effects. Quantitative data on the incidence of nonfatal radiogenic cancers are sparse, and the current practice is to assume that the total cancer incidence resulting from whole-body exposure is 1.5 to 2.0 times the mortality. In 1980, the NAS-BEIR Committee estimated the effects of ionizing radiation directly from epidemiology studies on the basis of both cancer incidence and the number of fatal cancers induced per unit dose (NAS80). The lifetime risk from chronic exposure can be estimated from these data, either on the basis of (1) relative risk (i.e., the percentage of increase in fatal cancer), or (2) absolute risk (i.e., the number of excess cancers per year at risk following exposure). The latter method results in numerically smaller estimated risks for common cancers, but a larger estimated risk for rare cancers.
3.5 S U W Y OF EVIDENCE THAT RADIATION IS A CARCINOGEN, MUTAGEN, AND TERATOGEN
Radiation has been shown to be a carcinogen, a mutagen, and a teratogen. At sufficiently high doses, radiation acts as a complete carcinogen, serving as both initiator and promoter. With proper choice of radiation dose and exposure schedule, cancers can be induced in nearly any tissue or organ in both humans and animals. At lower doses, radiation produces a delayed response in the form of increased incidence of cancer long after the exposure period. This has been documented extensively in both humans and animals. Human data are extensive and include atomic bomb survivors, many types of radiation-treated patients, underground miners, and radium dial workers. Animal data include demonstrations in many mammalian species and in mammalian tissue cultures.
Evidence of mutageni-c properties of radiation comes mostly from animal data, in which all forms of radiation-induced mutations have been demonstrated, mostly in mice. Tissue cultures of human lymphocytes have also shown radiation-induced mutations.
Evidence that radiation is a teratogen has been demonstrated in animals and in humans. A fetus is most sensitive to radiation during the early stages of organ development (between 8 and 15 weeks for the human fetus). The radiation-induced malformations produced depend on which cells are most actively differentiating.
In conclusion, evidence of the mutagenic and teratogenic properties of radiation in man is strong, and for carcinogenesis, the evidence is overwhelming.
REFERENCES
Awa, A.A., et al., Relationship Between Dose and Chromosome Aberrations in Atomic Bomb Survivors, Hiroshima and Nagasaki, RERF TR 12-77, Radiation Effects Research Foundation, Japan, 1978.
Beebe, G.W., Kato, H., and Land, C.E., Mortality Experience of Atomic Bomb Survivors, 1950-1974, Life Span Study Report 8, RERF TR 1-77, Radiation Effects Research Foundation, Japan, 1977.
Borek, C., et al., "Inhibition of X-ray and Ultraviolet Light-Induced Transformation in Vitro by Modifiers Poly (ADP-ribose) Synthesis," Radiation Research 99:219-227, 1984.
Brandom, W.F., et al., "Somatic Cell Chromosome Changes in Humans Exposed to 2j9Plutonium and 222Radon," Contract No. E (29-2) -3639, Progress Report, July 1, 1976, through September 30, 1977, Department of Energy, Washington, D.C., 1977.
Carter, C.O., "Some Rough Estimates of the Load From Spontaneously Arising Genetic Disorders," paper submitted to the U.N. Scientific Committee on the Effects of Atomic Radiation, September 1980.
Guerrero, I., Villasante, A., Corces, V., and Pellicer A., "Activation of a c-K-ras Oncogene by Somatic Mutation in Mouse Lymphomas Induced by Gamma Radiati~n,~ Science 225, 1159-1162, September 14, 1984.
Han, A., Hill, C.K., and Elkind, M.M., "Repair Processes and Radiation Quality in Neoplastic Transformation of Mammalian Cells," Radiation Research 99, 249-261, 1984.
Hoffman, F.L., "Radium (Mesothorium) Necrosis, " J.A.M.A. 85, 961-965, 1925.
International Meeting on the Toxicity of Thorotrast and Other Alpha-Emitting Heavy Elements, Lisbon, June 1977, Environmental Research 18, 1-255, 1979.
Kato, H., and Schull, W.J., '"Studies of the Mortality of A-Bomb Survivors," Report 7 Part 1, "Cancer Mortality Among Atomic Bomb Survivors, 1950-78," Radiation Research 90, 395-432, 1982.
Kennedy, A.R., and Little, J.B., "Evidence That a Second Event in X-ray Induced Oncogenic Transformation in Vitro Occurs During Cellular Proliferation," Radiation Research 99, 228-248, 1984.
King, R.C., Genetics, Oxford University Press, New York, 1962.
Ludewig, P., and Lorenser, E., "Untersuchung der Grubenluft in den Schneeberger Gruben auf den Gebalt an Radiumemanation," Zschr. f. Phys. 22, 178-185, 1924.
Marie, P., Clunet, J., and Raulot-Lapointe, G., "Contribution a L1etude du Developpement des Tumeurs Malignes sur les Ulceres de Roentgen," Bull. Assoc. Franc. Etude Cancer, 3, 404, 1910, cited in UNSCEAR77
Marie, P., Clunet, J., and Raulot-Lapointe, G., "Nouveau cas de Tumeur Maliqne Provoquee par une Radiodermite Experimentale ~ h e z let Rat ~ianc," Assoc. Franc. Etude Cancer 5, 125, 1912, cited in UNSCEAR77.
Ma2 9 Martland, H.S., and Humphries, E.E., "Osteogenic Sarcoma in Dial Painters Using Luminous Paint," Arch. Pathol. 7, 406-417, 1929.
Mo67 Morgan, K.Z., and Turner, J.E., Principles of Radiation Protection, John Wiley and Sons, Inc., New York, 1967.
Mu3 0 Murphy, D .P . , and DeRenyi, M., "Post-Conception Pelvic Irradiation of the Albino Rat (Mus norvesicus): Its - Effect on the Offspring,'' Surgery, Gynecology and Obstetrics 50, 861-863, 1930.
NAS72 National Academy of Sciences - National Research Council, The Effects on Populations of Exposures to Low Levels of Ionizinq Radiation, Report of the Committee on the Biological Effects of Ionizing Radiations (BEIR Report), Washington, D.C., 1972.
National Academy of Sciences - National Research Council, The Effects on Populations of Exposures to Low Levels of lonizing Radiation, Committee on the Biological Effects of Ionizing Radiation, Washington, D.C., 1980.
Otake, M., and Schull W., Mental Retardation in Children Exposed in Utero to the Atomic Bombs: A Reassessment, Technical Report REW TR 1-83, Radiation Effects Research Foundation, Japan, April 1984,
Pohl-Ruling, J., Fischer, P., and Pohl, E., "Einfluss Erhohter Umweltradio-Aktivitat and Beruflicher Strahlen-Belastung auf die Chromosomen-Aberrationen in den Lymphocyten des Peripheren Blutes," Tagungsaber, 0sterr.-Ungar, Tagung uber biomedizin, Forschung, Seibersdorf, September 1977.
Pohl-Ruling, J., Fischer, P., and Pohl, E., "The Low-Level Shape of Dose Response for Chromosome Aberrations," IAEA-SM-224/403, presented at Internatinal Symposium on the Latent Biological Effects of Ionizing Radiation, IAEA, Vienna, 1978.
Rugh, R., "Vertebrate Radiobiology: Embryology," a. Rev. Nucl. Sci. 3, 271-302, 1953.
Schull, W.J., Otake, M., and Neel, J.V., "Genetic Effects of the Atomic Bombs: A Reappraisal," Science 213, 1220-1227, September 1981.
Stettner, E., "Ein Weiterer Fall einer Schadingung einer Menschichen Frucht durch Roentgen Bestrahlung, Jb. Kinderheitk," Phys. Erzieh. 95, 43-51, 1921.
Storer, J.B., "Radiation Carcinogenesis," Cancer 1, pp. 453-483. F.F. Becker, editor, Plenum Press, New York, 1975.
Trimble, B.K., and Smith, M.E., "The Incidence of Genetic Disease and the Im~act on Man of an Altered ~~ ~-~ ~ *
Mutation Rate," Canadian Journal of Genetic Cytology, 19, 375-385, 1977.
Tuscany, R., and Klener, V., "Pokles Euploidie v Bunkach Kostni Drene osob s Vnitrni Kontaminaci Nekterymi Radioisotopy," Cisk. Fysiol. 12, 391, 1963.
Uh2 1 Uhlig, M., "Uber den Schneeberger Lungenkrebs, Virchows," Arch. Pathol. Anat. 230, 76-98, 1921.
UNSCEAR58 United Nations Scientific Committee Report on the Effects of Atomic Radiation, Official Records: Thirteenth Session, Supplement No. 17(A/3838), United Nations, New York, 1958.
UNSCEAR77 United Nations Scientific Committee on the Effects of Atomic Radiation, Sources and Effects of Ionizinq Radiation, United Nations, New York, 1977.
UNSCEAR82 United Nations Scientific Committee on the Effects of Atomic Radiation, Ionizing Radiation: Sources and Biological Effects, United Nations, New York, 1982.
Up75 Upton, A.C., "Physical Carcinogenesis: Radiation-- History and Sources," Cancer 1, 387-403, F.F. Becker, editor, Plenum Press, New York, 1975.
V002 Von Frieben, A., "Demonstration Linas Cancroids des Rechten Handruckens, das sich nach Langdauernder Einwirkung von Rontgen-strahlen Entwickelt Hatte," Fortschr. Geb. Rontgenstr. 6, 106, 1902, cited in Up75
Wa83 Wakabayashi, T., et al., "Studies of the Mortality of A-Bomb Survivors, Report 7, Part 111, Incidence of Cancer in 1959-1978, based on the Tumor Registry, Nagasaki, " Radiat. Res. 93, 112-146, 1983.
4. MOVEMENT OF RADIONUCLIDES THROUGH ENVIRONMENTAL PATHWAYS
4.1 INTRODUCTION
When radionuclides are released to the air, they can enter a number of pathways leading to human exposure. These environmental pathways are shown in Figure 4-1.
Radionuclides, released in the form of particulates or gases, form a plume that disperses down wind (Section 4.2). These radionuclides in the air can directly affect people in two ways: through external dose caused by photon exposure from the plume, or through internal dose resulting from radionuclide inhalation. As the airborne radionuclides move from the point of release, they (especially those in particulate form) deposit on ground surfaces and vegetation as a result of dry deposition and precipitation scavenging (Section 4.3). Photon radiation from the radionuclides deposited on the ground contributes to the external doses. Finally, small fractions of the radionuclides deposited on plant surfaces and agricultural land enter the food chains, concentrating in produce and in animal products such as milk and meat (Section 4.4). Consumption of contaminated foodstuff then contributes to the internal doses of radiation to individuals.
The concentrations of radionuclides in air, on soil surfaces, and in food products are calculated using the computer code AIRDOS-EPA. A description of the code and some examples of its applications, with an overview of the uncertainties, are provided in Section 4.5. (See references Ha82, Ti83, and NCRP84 for a more detailed description of the processes, modeling techniques, and uncertainty estimates. )
4.2 DISPERSION OF RADIONUCLIDES THROUGH THE AIR
4.2.1 Introduction
Radionuclides entering the atmosphere are transported away from their point of release and are diluted by atmospheric processes. To perform a radiological assessment, it is necessary to model the long-term average dispersion resulting from these processes. This is because the sources under consideration release radionuclides at rates that are substantially uniform when considered over long periods of time, and because the somatic and genetic effects on human health are generally treated as being the result of chronic exposure over long periods of time.
As large-scale winds move over the earth's surface, a turbulent boundary layer, or mixed layer, is created that controls the
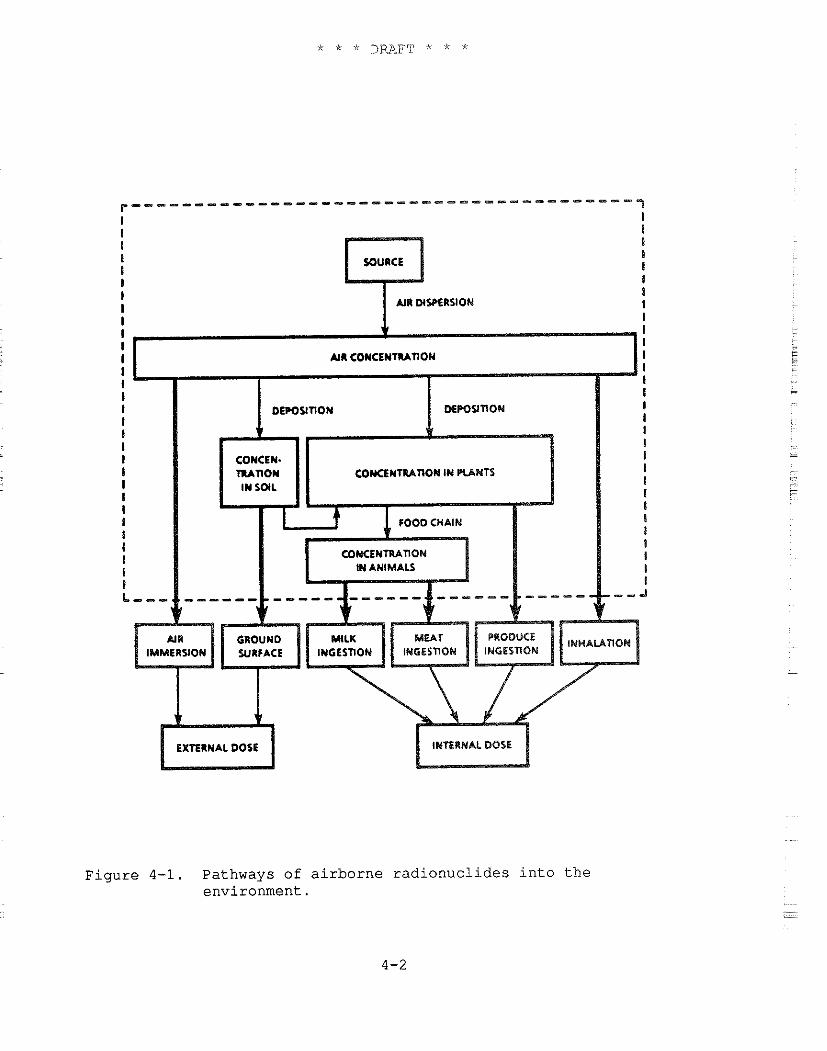
I AIR DISPERSION
EXTERNAL DOSE INTERNAL DOSE
Figure 4-1. Pathways of airborne radionuclides into the environment.
dispersion of the released radionuclides. The depth and dispersion properties of the mixed layer, which are highly variable over short periods of time, are controlled by two sources of turbulent effects: mechanical drag of the ground surface and heat transfer into or from the boundary layer. The mechanical drag of the ground surface on the atmosphere creates a shear zone that can produce significant mechanical mixing. The mechanical mixing is stronger when the wind is stronger and the roughness elements (water, grains of dirt, grass, crops, shrubs and trees, buildings, etc.) are larger. The vertical scale (dimension or thickness) of the mechanical mixing zone is related to the size of these roughness elements. Heat transfer into or from the boundary layer, the second source of turbulent effects, also strongly affects the mixed layer's turbulent structure and thickness. Solar heating creates huge rising bubbles or thermals near the ground. These large bubbles produce turbulent eddies of a much larger scale than those from the mechanical drag of the ground surface. With strong solar heating on a clear day, the mixing layer may be a few thousand meters deep. On a clear, calm night, the boundary layer virtually disappears, so that radionuclides (and other pollutants) are dispersed with very little turbulent diffusion.
The objective of the atmospheric transport models used by EPA is to incorporate the essential physical data necessary to characterize an extremely complex turbulent flow process into a simplified model that is adequate to predict the long-term dispersion of radionuclide releases. In general, the data necessary to implement a detailed theoretical model of atmospheric dispersion are not available and would be impractical to obtain. Apart from the data problem, the mathematical complexities and difficulties of a direct solution to the turbulent dispersion problem are profound and beyond the practical scope of routine EPA regulatory assessments. The widely accepted alternative has been to incorporate experimental observations into a semi-empirical model, such as outlined below, that is practicable to implement.
Three basic meteorological quantities govern dispersion: wind direction, wind speed, and stability. Wind direction determines which way a plume will be carried by the wind: a wind from the northwest moves the plume toward the southeast. Although wind direction is a continuous variable, wind directions are commonly divided into 16 sectors, each centered on one of the cardinal compass directions (e.g., north, north-northeast, northeast, etc.). Since there are 16 sectors, each one covers a 22-1/2-degree angle. Wind speed directly influences the dilution of radionuclides in the atmosphere. If other properties are equal, concentration is inversely proportional to wind speed. Customary wind speed categories include 0 to 3 knots (lowest speed) to greater than 21 knots (highest speed).
Atmospheric stabili,ty, the third meteorological. quantity, categorizes the behavicr of a parcel of air when it is adiabaticall-y (without heat transfer) displaced in a vertical direction. If the displaced parcel would be expected to return toward its original position, the category is stable; if it would continue to move away from its original position, the category is unstable. Under conditions of neutral stability, the parcel would be expected to remain at its new elevation without moving toward or away from its old one.
Typically, the unstable classes are associated with conditions of very little cloud cover, low wind speeds, and a sun high in the sky. The atmosphere is neutral on a windy, cloudy day or night and is stable at the surface at night when the sky is clear and wind speeds are low. Dilution due to vertical mixing occurs more rapidly with increasing distance under unstable conditions than under stable ones. Stability categories range from A (very unstable) to D (neutral) to G (very stable) .
A table of joint frequencies (fractions of time) for each combination of stability, wind direction, and wind speed is the starting point for any assessment of long-term atmospheric dispersion. These data are usually obtained by the analysis of long-term observations from weather stations or from site- specific meteorological facilities.
4.2.2 Air Dispersion Models
EPA uses an empirical Gaussian model for most radionuclide dispersion calculations. The model also considers such processes as plume rise, depletion due to deposition, and radionuclide ingrowth and decay.
Gaussian Plume Model
The basic workhorse of EPA dispersion calculations is the Gaussian model. Several reasons why the Gaussian model is one of the most commonly used are quoted below (Ha82):
"(1) It produces results that agree with experimental data as well as any model.
"(2) It is fairly easy to perform mathematical operations on this equation.
"(3) It is appealing conceptually.
"(4) It is consistent with the random nature of turbulence.
"(5) It is a solution to the Fickian diffusion equation for constants K and u.
"(6) Other so-called theoretical formulas contain large amounts of empiricism in their final stages.
" ( 7 ) As a result of the above, it has found its way into most government guidebooks, thus acquiring a 'blessed' (sic) status."
The long-term Gaussian plume model gets its name from the shape presumed for the vertical concentration distribution. For a ground level source, the concentration is maximum at ground level and decreases with elevation like half of a normal or Gaussian distribution. For an elevated release, the concentration is symmetrically distributed about the effective height of the plume, characteristic of a full Gaussian distribution. Actually, the vertical dispersion is limited by the ground surface below and any inversion lid above the release (see Figure 4 - 2 ) . An inversion lid is defined by the altitude in the atmosphere where the potential temperature begins to increase with increasing height, thus limiting the volume of air available for diluting releases.
At large distances from the point of the release, the radionuclide concentration becomes uniformly distributed between the ground and the lid. Within each of the 16 direction sectors, the concentration is considered to be uniform at any given distance from the release. For a ground-level release, the ground-level concentration decreases monotonically with distance from the release point. For an elevated release, the ground-level concentration increases, reaches a maximum value, and then decreases with increasing distance from the release point.
Mathematically, the long-term average dispersion calculation used by EPA can be expressed as
where x/Q (s/m3) is the concentration for a unit release rate at a distance x(m) from the release point, h,(m) is the effective height of the release, o,(m) is the vertical dispersion parameter appropriate to the stability category and distance x, and p(m/s) is the wind speed. At distances where the release is uniformly mixed between the ground and lid, the expression becomes
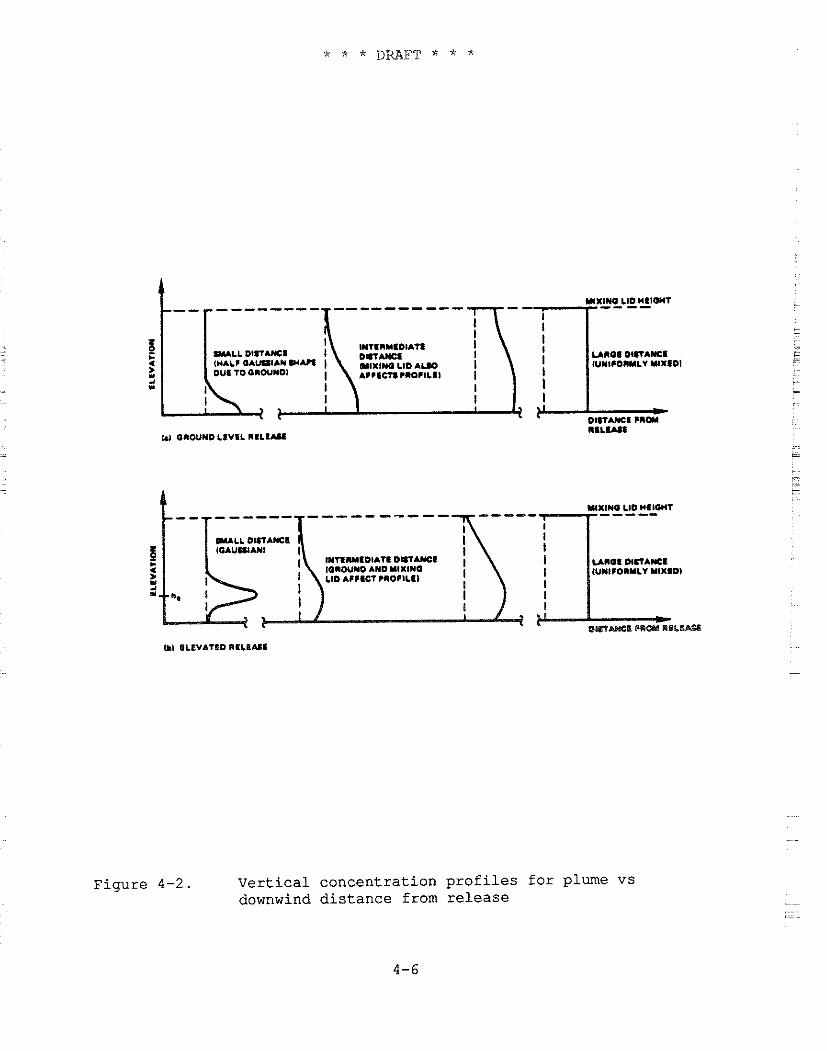
-----
~ ~ M I D I A T I o m m ~ n o s m n A y c s IORWNO AND YlXlWO IUMI~ORYLV YlXRDI L10 A I I I C T PIOCILTI I
I t
Figure 4-2 . Ver t ica l concentrat ion p r o f i l e s f o r plume vs downwind d i s tance from re lease
where h (m) i s t h e l i d h e i g h t ( m e t e r s ) , and t h e o t h e r q u a n t i t i e s a r e L t h e same a s b e f o r e .
Plume R i s e Model
V e r t i c a l momentum o r buoyancy can cause a plume t o rise t o an e f f e c t i v e h e i g h t t h a t i s s e v e r a l times t h e p h y s i c a l h e i g h t of t h e r e l e a s e . The momentum f l u x o f a r e l e a s e i s p r o p o r t i o n a l t o t h e product of t h e volume flow r a t e and t h e v e r t i c a l e x i t v e l o c i t y , whi le t h e buoyancy f l u x i s p r o p o r t i o n a l t o t h e product of t h e volume flow rate and t h e d i f f e r e n c e between t h e tempera tures o f t h e r e l e a s e gases and t h e ambient a i r . Momentum r i s e i s i n i t i a l l y dominant f o r most plumes, even though buoyant rise may become t h e more impor tan t p r o c e s s a t l a r g e r d i s t a n c e s . I n any case , plume r i s e i n c r e a s e s wi th d i s t a n c e from t h e release p o i n t ; t h e e f f e c t i v e h e i g h t of t h e plume may n o t r each a l i m i t i n g v a l u e u n t i l t h e plume i s s e v e r a l k i lome te r s from t h e p o i n t of r e l e a s e .
Plume Deple t ion Model
A s r a d i o n u c l i d e s i n t h e plume a r e d i spe r sed , t h e i r a c t i v i t y i s d e p l e t e d by d r y d e p o s i t i o n and p r e c i p i t a t i o n scavenging. The r a t e of plume d e p l e t i o n due t o d r y d e p o s i t i o n and p r e c i p i t a t i o n scavenging i s p r o p o r t i o n a l t o t h e d e p o s i t i o n r a t e ( s e e Sec t ion 4 . 3 ) . EPA ' s O f f i c e of Rad ia t ion Programs uses a source d e p l e t i o n model which c o n s i d e r s t h e shape o f t h e v e r t i c a l c o n c e n t r a t i o n p r o f i l e t o be unchanged by d e p l e t i o n . Deple t ion due t o d e p o s i t i o n g e n e r a l l y does n o t cause more t h a n h a l f o f t h e r e l e a s e d a c t i v i t y t o be removed a t a d i s t a n c e of 80 km. Deple t ion by p r e c i p i t a t i o n scavenging occur s on ly d u r i n g p e r i o d s of p r e c i p i t a t i o n .
Rad io log ica l Decay and Ingrowth
Rad io log ica l decay can a l s o reduce t h e r a d i o n u c l i d e c o n c e n t r a t i o n i n t h e plume. A t y p i c a l e l a p s e d t i m e f o r t r a v e r s e between t h e p o i n t o f r e l e a s e and a r e c e p t o r l o c a t e d 80 km away i s about 5 hours . Thus, on ly n u c l i d e s wi th s h o r t h a l f - l i v e s would be apprec i ab ly d e p l e t e d by r a d i o l o g i c a l decay. For example, Ar -41 , which has a 1 . 8 hour h a l f - l i f e , decays t o about 1 5 p e r c e n t of i t s o r i g i n a l a c t i v i t y i n 5 hours . When a r e l e a s e d r a d i o n u c l i d e i s a p a r e n t f o r o t h e r r a d i o n u c l i d e s i n a cha in , t h o s e decay p roduc t s w i l l become p a r t o f t h e plume's a c t i v i t y even though t h e y were not r e l e a s e d by t h e sou rce . For example, Cs-137 i s t h e p a r e n t of Ba-137m, which has a h a l f - l i f e of about 2 .6 minutes . The Ba-137m a c t i v i t y would r each 90 p e r c e n t o f t h a t o f t h e Cs-137 i n about 8 . 5 minutes , t h e time r e q u i r e d a t a t y p i c a l wind speed of 5 m / s f o r t h e r e l e a s e t o t r a v e l about 2 . 5 km. For many n u c l i d e s , t h e r a d i o l o g i c a l e f f e c t s a s s o c i a t e d wi th exposure t o decay p roduc t s a r e a t l e a s t a s impor tan t a s t h o s e from exposure t o t h e p a r e n t . For example, t h e
external photon dose from a release of Cs-137 is entirely due t.o photons from its decay product Ba-13711.
4.2.3 Uncertainties in Atmospheric Dispersion Modeling
EPA must deal with several uncertainties in its modeling of atmospheric dispersion. Two basic considerations contribute to these uncertainties. The first involves the parameters that enter into the model and how well they are known or can be determined for a particular situation. The presumption is that the basic assumptions for which the model was developed are satisfied and that the uncertainty of predicted concentrations depends primarily on the uncertainty of the data used in the calculations. The second consideration involves the use of a modeling technique under conditions that do not satisfy the basic assumptions for which the model was developed. Such use may be the only practicable alternative available for assessing atmospheric dispersion, but the principal uncertainties are now related to evaluating the significance of these effects that are not considered in the model. An example of this would be the use of the Gaussian plume model, whlch was developed for short distances over an open, flat terrain, to assess dispersion over large distances or in a complex terrain dominated by hills and valleys.
In regard to the first consideration, the authors of NCRP84 concluded that the appropriate basic parameters, such as wind speed and direction,, can be determined accurately enough so that they are not major contributors to model uncertainty. However, the uncertainties associated with derived parameters (such as stability class) or lumped parameters (such as those used to characterize deposition, resuspension, or building wake effects) can dominate the model uncertainties.
The effect of the uncertainty of an input variable can strongly or weakly influence the model output depending upon circumstances. For example, the effective height of a release, h,, can be estimated using a plume rise model to within a factor of about 1.4 (NCRP84). From equations 4-1 and 4-2, it is clear that when 0, is much smaller than h,, the effect of this uncertainty on equation 4-1 is strong; whereas at large distances where equation 4-2 is appropriate, the value of he has little effect on the calculated concentration.
Little and Miller (Li79 and Mi82) have surveyed a number of validation studies of atmospheric dispersion models. Although these studies provide limited data, they indicate an uncertainty of approximately a factor of 2 for annual average concentrations for locations within 10 km of the release and approximately a factor of 4 (77 percent of their samples) to 10 (92 percent of their samples) for locations between 30 and 140 km of the release. The validation studies were for fairly complex terrain, i.e., substantial hills and
valleys, but not extreme conditions of either terrain or meteorology.
4.3 DEPOSITION OF ATMOSPHERIC RADIONUCLIDES
4.3.1 Introduction
Atmospheric deposition includes a complex set of processes that result in the transfer of radionuclides from the plume to the ground surface and vegetation. Processes are categorized as "dry" when they result in the direct transfer from the plume to the surfaces in contact with it and "wet" when the transfer is first from the plume to precipitation and then from the precipitation to the ground or vegetation surfaces.
4.3.2 Dry Deposition Model
Dry deposition models generally relate the surface deposition flux to the air concentration at some reference height, typically 1 meter above the ground. The resulting equation is
where W is the deposition flux to the surface (Ci/m2s), X, is the reference height air concentration (ci/m3), and v, is the deposition velocity (m/s). Although v, has the units of a velocity (hence its name), it is a lumped variable relating the deposition flux to the air concentration. The value of the deposition velocity depends on a complex interaction of effects--atmospheric, aerosol, and surface (canopy). Thus, while the deposition velocity is often assigned a simple fixed value, it actually represents the result of a diverse combination of effects.
4.3.3 Wet Deposition Model
Wet deposition models relate the flux due to precipitation scavenging to the concentration in the plume. Since the activity scavenged from the plume by an element of precipitation is presumed to remain with the precipitation element until reaching the ground surface, the deposition flux is proportional to the total. wetted activity in a vertical segment of the plume (ci/m2). The resulting equation can be expressed as
- w = h,, x L (4-4)
- where W is the surface flux (Ci/mzs), Xis the average wetted air concentration (Ci/m3), L is the depth of the wetted layer (m), and h., is the scavenging rate (s-'). h,, is a variable that lumps together the complex interactions between precipitation and the
plume. Because the deposition flux is proportional to the vertically integrated concentration (i.e., the total activity in a column of unit ground surface area), it is independent of the effective height of the release. Raising the effective height of a release may lower the dry deposition flux but leaves the flux resulting from precipitation scavenging unchanged.
4.3.4 Soil Concentration Model
The deposited radionuclides accumulate in the surface soil until they are removed either by radiological decay or by processes such as leaching. The areal concentration can be expressed as
where C, is the areal concentration (Ci/m2), W is the radionuclide flux to the ground surface (Ci/mzs) , t, (s) is the time for radionuclide buildup in soils, and h, is the effective removal rate from soil (s-'). When the deposited radionuclide is the parent of other radionuclides, their soil concentrations at time t, due to ingrowth from the parent must also be calculated. For calculating root transfer to crops, the radionuclide concentration in the surface soil layer can be expressed as
where C, is the soil concentration (Ci/kg) and P is the areal density of dry soil (kg/m2) for the plowed or mixed soil layer.
The value of t,, the deposition accumulation time, is typically in the range of 20 to 100 years. For nearby individual assessments, t, is chosen to correspond to the expected operational life of the facility. If EPA considers it likely that the facility would be replaced by another similar one at that time, then t, is increased accordingly up to a maximum value of 100 years. Of course, only those environmental concentrations that depend on soil deposition are affected by the choice of t,. For collective (population) assessments, a value of 100 years is used for t,. This value corresponds to establishing a 100-year cutoff for the time following a release when any significant intake or external exposure associated with deposition on soil might take place. Since radionuclide inhalation is generally the dominant risk pathway, total risk is not sensitive to the choice of t,.
The value of h, is the sum of the radiological decay constant, h , and an environmental removal rate for deposited radionuclides
from soil, h,. Hoffman and Baes (No79) considered a simplified leaching-loss model appropriate to agricultural soil for calculating h.. Their range of values for the parameter K, (the equilibrium distribution coefficient relating the ratio of the radionuclide concentration in soil water to that on soil particles) for Cs is from 36.5 to 30,000 ml/g. The corresponding ratio of & is 820:l. The uncertainty in h, is also significantly affected by the uncertainty in the other parameters. Although their model is a reasonable one, adequate studies for its validation do not exist. Since the choice of appropriate values for h, is so uncertain, EPA has used 0.2 y-' as a genetal nominal value (the geometric mean of h, for Put, I-, Csi, and Sr2+ ions is 1.2x10-' y-' using Hoffman and Baes median data values) and a value of 0.1 yT1 for urban settings where strong surface runoff would be expected to increase the effective removal rate.
4.3.5 Uncertainties
Uncertainties in v, and h,, are substantial; NCRP84 lists measured values of v, which vary over three orders of magnitude. Hanna et al. note that "The use of scavenging coefficient for wet removal modeling is probably best regarded as an order of magnitude estimation procedure" (Ha82). Actually, much of the wide range of values reflects measurement uncertainties as well as actual variations. Furthermore, most field deposition measurements reflect short-term or episodic studies rather than long-term observations. Miller and Little (Mi82) concluded that the data necessary to quantify the accuracy of calculated ground concentrations are not currently available.
4.4 TRANSPORT THROUGH THE FOOD CHAIN
4.4.1 Introduction
Deposited radionuclides may become associated with vegetation by two principal routes: (1) direct interception of a fraction of the deposited activity by plant surfaces, and (2) transfer of deposited activity from the soil through the plant's root system. Radionuclides in animal feed crops such as pasture grass or stored feeds can be transferred to foods such as milk and meat.
4.4.2 Concentration in Vegetation
The radionuclide concentrations in plants due to interception of the deposition flux can be calculated as (Ba76)
where C: is the crop concentration (Cilkg) at harvest, W is the deposition flux (ci/m2s), f, is the fraction of the deposition flux which the vegetation intercepts, Y, is the vegetation yield (kg/m2), T, is a translocation factor, h, is the effective removal rate of the intercepted radionuclide from the vegetation (s-I), and t, is the exposure time of the vegetation to the radionuclide flux (s). Miller (Mi79) has observed that data for f, and Y, are well represented by the expression
where y was found to range between 2.3 and 3.3 m2/kg when Y, is expressed in kg/m2, dry. Since the product 'yY, is generally less than 1.0, for many practical purposes equation 4-8 can be approximated as -
In this case, the quantity f,/Y, (4-7) can be replaced by y which shows much less environmental variation than f, and Y, do separately. Note that Y, is the total vegetative yield which can be several times the edible portion yield for a crop. T,, the
- translocation factor, relates the radionuclide concentration in the - edible portion to that in the entire plant. Baker et al. (Ba76) suggest a value of 1.0 for leafy vegetables and fresh forage, and 0.1 for all other produce. (A value of 1.0 is used for all crops in AIRDOS-EPA. )
The value for h, is the sum of h , the radionuclide decay constant and h,, the weathering rate factor. For a typical weathering half-life of 14 days, has a value of 5.7~10.' s-I. In general, the product h, te >1 and equation 4-9 can be simplified to
Radionuclides also transfer directly from the soil to vegetation through the plant's root system. The plant concentration due to this process can be calculated as
C: = C, B,, (4-11)
where C: is the plant concentration at harvest (Ci/kg), C, is the soil concentration (Ci/kg), and B,, is the element-specific soil to plant transfer factor. The total concentration from both processes is
Generally, the contribution of C:' to C, is greater than that of C: for atmospherically dispersed radionuclides.
4.4.3 Concentration in Meat and Milk
For a concentration C, (Ci/kg) in animal feed, the concentration in meat C, (Ci/kg) can be calculated as
where Q, is the animal's feed consumption (kg/d) and F, is the feed to meat transfer factor (d/kg). F, is element dependent and represents the average mean concentration at slaughter for a unit ingestion rate over the animal's lifetime. Most systematic studies of F, have been made for cattle or other ruminants, although a few measurements for other species also exist (NCRP84). In practice, even the F, values for beef are often based on collateral data (Ba84) .
Similarly for milk, the concentration C, (Ci/L) can be calculated as
where F, (d/L) is the equilibrium transfer factor to milk and the other parameters are as for equation 4-13. Although more statistical data are available for F, than for F,, the estimation of transfer coefficients to animal products is a subject needing both integration and better documentation (NCRP84).
4.4.4 Summary
Radionuclide intake through the food chain depends upon both the concentration in food and human usage. The concentration in food depends upon the food source use of foods grown in proximity to the release location, the fraction of an individual's food that is home produced and other factors that can strongly influence the significance of the food pathway. Unfortunately, generally useful validation studies to quantify the substantial uncertainties in the food chain have not been made. References such as NCRP84, Ti83, Mi82, and Li79 cite ranges for some parameters and make limited model uncertainty estimates but do not make quantitative evaluations of the uncertainties for the ingestion pathway taken as a whole.
EPA has chosen a factor of 10 as a reasonable upper bound for the uncertainty in both the deposition rate model and the calculated intake from eating food containing deposited radionuclides. Assuming that the two factors are independent, uncorrelated, and correspond to the 2 sigma values for a log normal distribution, the
combined uncertainty for the pathway (deposition and intake of radionuclides from food) is a factor of 26.' EPA has rounded this value to 30 as an estimate of the overall food pathway uncertainty factor.
4.5 CALCULATING THE ENVIRONMENTAL CONCENTRATION OF RADIONUCLIDES: THE AIRDOS-EPA CODE
4.5.1 Introduction
Environmental concentrations of radionuclides calculated by EPA may be site specific, meaning that available data relevant to the site are incorporated into the assessment. Or an assessment may be generic; that is, an assessment of a hypothetical facility at a location considered an appropriate possibility for such a facility class. Frequently, EPA performs site-specific assessments for existing facilities, e.g., a national laboratory. In addition, EPA often employs generic assessments in evaluating alternative sitings for a proposed facility or assessing a widespread class of facilities, e.g., industrial coal-burning boilers.
In any case, EPA makes both individual and collective (population) assessments. The purpose of the individual assessment is to assess doses and lifetime risk to individuals living near a facility. EPAfs assumption is that these individuals reside at the same location much of their lives and that their exposures extend from infancy on through adulthood. The doses and risks calculated are expectation values, i.e., the estimates are intended to be typical for a person living a long period of time under the assessed conditions. EPA's collective (or population) assessments evaluate doses and risks to a population that may be regional (typically up to 80 km distant), long-range (e.g., the coterminous United States), or worldwide as appropriate. The risk is usually expressed as the expected number of premature deaths in the population per year of facility operation.
4.5.2 AIRDOS-EPA
EPA has used the AIRDOS-EPA code (Mo79) to calculate environmental concentrations resulting from radionuclide emissions into air. The results of this analysis are estimates of air and ground surface radionuclide concentrations; intake rates via inhalation of air; and ingestion of radioactivity via meat, milk, and fresh vegetables. The atmospheric and terrestrial transport models used in the code, their implementation, and the applicability of the code to different types of emissions are described in detail
* * * DRAFT * * *
in Mo79. Input to AIRDOS-EPA is extensive, but its preparation can be facilitated by using the preprocessor PREPAR (Sj84). Appendix A of this document summarizes many of the default values and assumptions used in EPA's assessments.
AIRDOS-EPA calculates atmospheric dispersion for radionuclides released from one to six stacks or area sources. Radionuclide concentrations in meat, milk, and fresh produce are estimated by coupling the deposition rate output of the atmospheric dispersion models with the Regulatory Guide 1.109 (NRC77) terrestrial food chain models. Radionuclide concentrations for specified distances and directions are calculated for the following exposure pathways: (1) immersion in air containing radionuclides, (2) exposure to ground surfaces contaminated by deposited radionuclides, (3) inhalation of radionuclides in air, and (4) ingestion of food in the area. The code may be used to calculate either annual individual exposures or annual population exposures at each grid location. For either option, AIRDOS-EPA output tables summarize air concentrations and surface deposition rates as well as the intakes and exposures for each location. In addition, working level exposures are calculated and tabulated for evaluating the inhalation of short-lived progeny of Rn-222.
Assessment Grid
AIRDOS-EPA has provision for either a rectangular or a circular calculational grid. The customarily used circular grid (see Figure 4-3) has 16 directions proceeding counterclockwise from north to north-northeast. The user chooses the grid distances. Generally, successive distances are chosen with increasing spacing. It is important to realize that the calculational grid distances and the set of distances associated with population and food production data are one and the same. Hence, the concentration calculated for each grid distance must be the appropriate average value for the corresponding range of distances covered by the population and agricultural data. Choosing a suitable set of grid distances may require different compromises of convenience for different assessments and may be different for individual and collective assessments of the same facility.
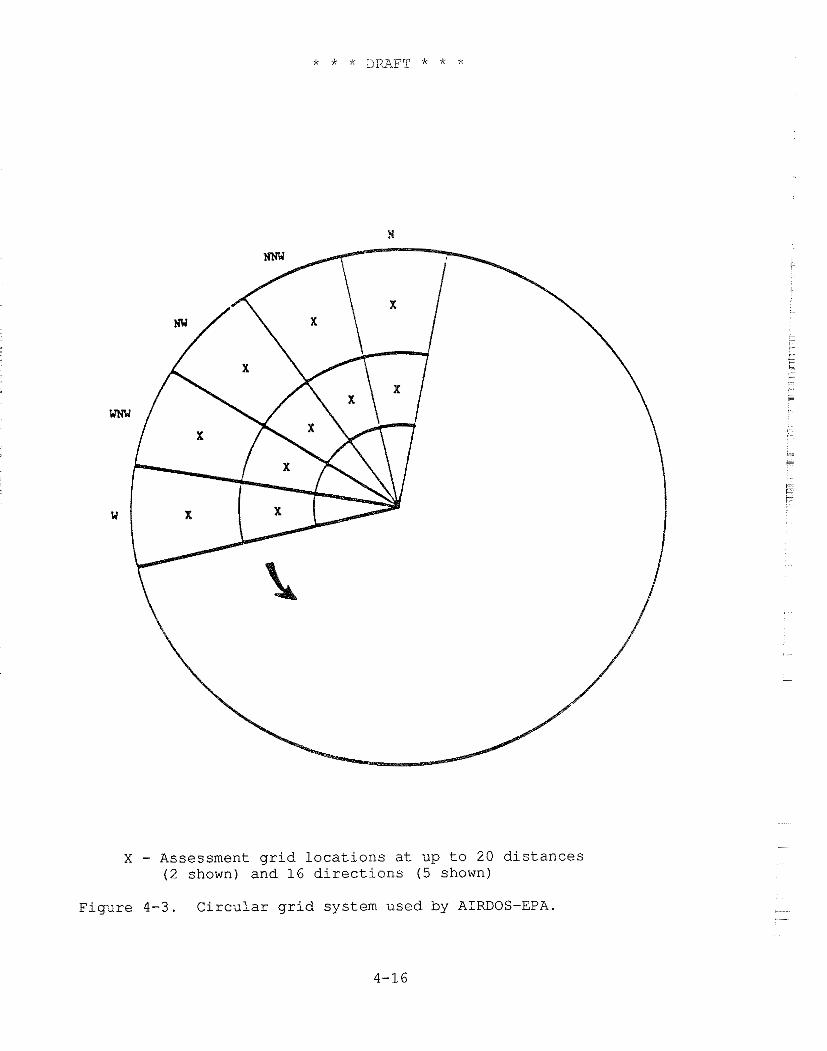
X - Assessment grid locations at up to 20 distances (2 shown) and 16 directions (5 shown)
Figure 4-3. Circular grid system used by AIRDOS-EPA.
Environmental P,ccumulation -- Time
An AIRDOS-EPA assessment is based on what can be viewed as a snapshot of environmental concentrations after the assessed facility has been operating for some period of time. The choice of an environmental accumulation time affects only those pathways dependent on terrestrial concentrations, i.e., ground surface exposure and food intakes. Usually, the accumulation time for an individual assessment is chosen to be consistent with the expected life of the facility (or 100 years when a similar facility might be expected to replace the present one at the end of its useful life). For collective assessments, 100 years is customarily used.
Source Considerations
Point sources are characterized by their physical height and, when desired, the parameters to calculate buoyant or momentum plume rise using Brigg's (Br69) or Rupp's (Ru48) formulations respectively. Alternatively, a fixed plume rise may be specified for each Pasquill-Gifford atmospheric stability class A through G.
The area source model is similar to that of Culkowski and Patterson (Cu76) and transforms the original source into an annular segment with the same area. At large distances, the transformed source approaches a point source at the origin, while at distances close to the origin, it approaches a circle with the receptor at its center.
Building wake effects and downwash are not included in the AIRDOS-EPA models. The same type of rise calculation (buoyant, momentum, or fixed) is used for all sources. As many as six sources may be assessed, but for calculational purposes, they are all considered to be co-located at the origin of the assessment grid.
Radionuclide Releases
Releases for up to 36 radionuclides may be specified for AIRDOS-EPA. Each release is characterized by the radionuclide name, effective decay constant during dispersion, precipitation scavenging coefficient, deposition velocity, and settling velocity, as well as the annual activity release for each source. Decay products that are significant for the assessment of a radionuclide must be included in the list of releases. There is no explicit method for calculating radionuclide ingrowth during atmospheric dispersion in AIRDOS-EPA.
Parameters such as particle size, respiratory clearance class, and gastrointestinal absorption factor (f,) are passed on for use in the DARTAB (Be81) dose and risk assessments as described in Chapters 5 and 6.
The approach ORP has used for calculating a precipitation scavenging coefficient is based on Slinn's (S177) equation 3 2 :
h , , = P o c J E(a,%)
where h., is the scavenging coefficient, c is a constant (Slinn uses 0.5), J, is the rainfall rate, and E is the collection efficiency for a particle of radius a by drops of characteristic radius %. Slinn (S177, p. 23) considers the effects of dry deposition and interprets Dana and Wolf's (Da68, Wo69, Da70) data as supporting a value for E of 0.2, essentially independent of particle size. Adopting Slinn's typical value of q, for a frontal rain (0.3 mm) and selecting a long-term average value of 1,000 mm/yr (3.16~10-~ mm/s) for J,, we obtain:
h,, = 0.5 ( 3 . 1 6 ~ 1 0 - ~ ~ 0.3
-
This value has been rounded to s-' as a working value for the precipitation scavenging coefficient and then scaled according
- to the annual precipitation at the assessment location for use in AIRDOS-EPA. There is substantial uncertainty in interpreting environmental scavenging data, and this estimate is accurate to within an order of magnitude. The EPA scaling procedure reflects the premise that the variation of rainfall from one location to another depends more on rain frequency than on intensity during rainfall episodes.
Dispersion
Wind and stability class frequencies for each direction are the primary data for calculating atmospheric dispersion. The required data for AIRDOS-EPA are calculated from a joint frequency distribution of wind speed and atmospheric stability class for each direction. Inasmuch as the assessments require long-term average dispersion values, the sector-averaged Gaussian plume option is used. The vertical dispersion parameter (0,) is calculated using Brigg's formulas (Gi76). Vertical dispersion is limited to the region between the ground and a mixing depth lid. The harmonic mean of Holzworth's (Ho72) morning and afternoon mixing depths is customarily employed for this value; that is,
where E , andl, are respectively the morning and afternoon mixing depths and h is their harmonic mean. At large distances, the concentration is uniform between the ground and the lid.
Deposition Rate
AIRDOS-EPA models both dry and wet deposition processes. Resuspension, the reintroduction of deposited material into the atmosphere, is not modeled in AIRDOS-EPA. The dry deposition rate is the product of the deposition velocity and the near ground-level air concentration, while the wet deposition rate is the product of the precipitation scavenging coefficient and the vertically integrated air concentration. Wet deposition decreases monotonically with distance and is independent of the effective release height of the source, while the effect of source height can -
. be significant for dry deposition. For locations close to an elevated source, wet deposition can provide the principal source of
. radionuclide exposure. Concentrations are adjusted for depletion - due to deposition at each downwind distance.
Ground Surface Concentration
- AIRDOS-EPA calculates the ground surface concentration from the - total (dry plus wet) deposition rate. The soil concentration is
calculated by dividing this value by the effective agricultural soil surface density (kg/m2). Both concentrations are calculated for the end of the environmental accumulation time t, and can include the ingrowth from deposited parent radionuclides as well as removal due to radiological decay and environmental processes such as leaching.
Ingrowth from a parent radionuclide is calculated using a decay product ingrowth factor. The ingrowth factor is the equivalent deposition rate for a unit deposition rate of the parent radionuclide. For example, the ingrowth factor for Pb-210 as a parent of Po-210 would be calculated by determining the concentration of Po-210 at time t, due to a unit deposition rate of Pb-210 and dividing it by the corresponding concentration for a unit deposition rate of Po-210. These ingrowth factors must be calculated in advance of running AIRDOS-EPA and are dependent on both the accumulation time t, and the soil removal constants for the nuclides in the radionuclide chain (Pb-210, Bi-210, and Po-210 in this case).
Concentrations in Food
Radionuclide concentrations in food are calculated using essentially the same model as in NRC Regulatory Guide 1.109 (NRC77). Changes from that model include consideration of environmental removal from the root zone, and separate values for food and pasture
crops of the interception fraction, areal yield, and soil-to-plant transfer values. Concentration calculations for meat and milk use the same models as the Regulatory Guide model. There are numerous parameters in the terrestrial pathways model. Appendix A of this volume of the BID contains tables of values used in these assessments.
Population and Agricultural Data
For a collective (population) assessment, population and agricultural data for each grid location must be provided. EPA uses the 1970 census enumeration district data to calculate population distributions. AIRDOS-EPA calculates the collective assessment for agricultural products based on consumption by the assessment area population. The assessment can be based on agricultural production by choosing utilization factors large enough to ensure that all items produced are consumed.
Food Utilization Factors
In addition to the consumption rate for different food categories (leafy vegetables, other produce, meat, and milk), the user may specify the fraction of vegetables, meat, and milk that are (1) home grown, (2) produced in the assessment area, or (3) imported from outside the assessment area. Those in the third category are considered to contain no radionuclides. Those from the second category have the average concentration for that category produced within the assessment area, while concentrations for the first category are those that would occur at each grid location. Appendix A of this volume provides some typical food source fractions for urban and rural assessment areas. Note that if the assessment considers food to be only home grown or imported from outside the assessment area, then the actual quantity of food produced at each location is not relevant to the assessment. Experience has shown that the ingestion doses and risks for the nearby individual are usually dominated by the radionuclide intake from home-grown food, and hence there is generally no significant difference between assuming that food that is not home grown is obtained from the assessment area or is imported from outside the assessment area.
Special Radionuclides
Special consideration is given to the radionuclides H-3 (tritium), C-14, and Rn-222. The specific activity of tritium in air (pCi/g of H,O) is calculated for an absolute humidity of 8 mg/m3 (NRC77). Etnier (Et8O) has calculated average absolute humidities for over 200 U.S. locations. The 8 mg/m3 value would be within a factor of 2 for most of them. The specific activity of atmospheric C-14 (pCi/g of carbon) is calculated for a CO, concentration of 330 ppm by volume (Ki78). Concentrations of these nuclides in
v e g e t a t i o n a r e cal..cul.ateci on t h e assuntptioil t h a L the water and carbon con ten t i n v e g e t a t i o n are front t h e atmosphere and have t h e same s p e c i f i c a c t i v i t y a s i n t h e atmosphere. The Rn-222 c o n c e n t r a t i o n i n a i r i s r ep laced by i t s s h o r t - l i v e d decay product c o n c e n t r a t i o n i n working l e v e l u n i t s u s ing a f i x e d e q u i l i b r i u m f r a c t i o n ( t y p i c a l l y 0 . 5 f o r ca lcu l .a t ing populat ior i h e a l t h r i s k s ) .
REFERENCES
Baker, D.A., Hoenes, G.R., and Soldat, J.K., "FOOD-An interactive code to calculate internal radiation doses from contaminated food products," in Proceedings of the Conference on Environmental Modeling and Simulation, Ott, W.R., editor, EPA 600/9-76-016, p. 204, Office of ~esearch ~evklo~ment and Office of Planning and Management, U.S. Environmental Protection Agency, Washington, D.C., July 1976.
Baes, C.F. 111, Sharp, R.D., Sjoreen, A.L., and Shor,
Begovich, C.L., Eckerman, K.F., Schlatter, E.C., Ohr, S.Y., and Chester, R.O., DARTAB: A program to combine airborne radionuclide environmental exposure data with dosimetric and health effects data to generate tabulation of predicted impacts, ORNL/5692, Oak Ridge National Laboratory, Oak Ridge, Tenn., August 1981.
Briggs, G.A., Plume Rise, TID-25075, U.S. Atomic Energy Commission Critical Review Series, National Technical Information Service, Springfield, Va., November 1969.
Culkowski, W.M. and Patterson, M.R., A Comprehensive Atmospheric Transport and Diffusion Model, ORNL/NSF/EATC-17, National Oceanic and Atmospheric Administration, Atmospheric Turbulence and Diffusion Laboratory, Oak Ridge, Tenn., 1976.
Dana, M.T. and Wolf, M.A., "Experimental Studies in Precipitation Scavenging," in Pacific Northwest Laboratory Annual Report for 1967 to the USAEC Division of Biology and Medicine, Vol. 11, Physical Sciences, Part 3, Atmospheric Sciences, Simpson C.L. et al., US.AEC ~ e ~ o r t B N w L - ~ I ~ - ~ , pp. 128-140, Battelle Pacific Northwest Laboratories, Richland, Wa., October 1968.
Dana, M.T., Wolf, M.A., and duplessis, L.A., "Field Experiments in Precipitation Scavenging," in Pacific Northwest Laboratory Annual Report for 1969 to the USAEC Division of Biology and Medicine, Vol. 11, Physical Sciences, Part 1, Atmospheric Sciences, Simpson, C.L. et al., USAEC Report BNWL-1307 (Pt. I), pp. 77-81, Battelle Pacific Northwest Laboratories, June 1970.
Etnier, E.L., "Regional and site-specific absolute humidity data for use in tritium dose calculations," Health Phys. 39, 318-320, 1980.
Gifford, F.S. Jr., "Turbulent Diffusion-Typing Schemes: A Review," Nucl. Saf. 17(1), 68-86, 1976.
Hanna, S.R., Briggs, G.A., and Hosker, R.P. Jr., Handbook on Atmospheric Diffusion, DOE/TIC-11223, Technical Information Center, U.S. Department of'~nergy, Washington, D.C., January 1982.
Holzworth, G.C., Mixing Heights, Wind Speeds an Potential for Urban Air Pollution Throughout the Contiguous United States, Publication No. AP-101, U.S. Environmental Protection Agency, Office of Air Programs, Research Triangle Park, N.C., 1972.
Hoffman, F.O. and Baes, C.F. 111, A Statistical Analysis of Selected Parameters for Predicting Food Chain Transport and Internal Dose of Radionuclides, NUREG/CR-1004, Oak Ridge National Laboratory, Oak Ridge, Tenn., 1979.
Killough, G.C. and Rohwer, P.S., "A new look at the dosimetry of 14c released into the atmosphere as carbon dioxide," Health Phys., 34, 141-159, 1978.
Little, C.A. and Miller, C.W., The Uncertainty Associated with Selected Environmental Transport Models, ORNL-5528, Oak Ridge National Laboratory, Oak Ridge, Tenn., November 1979.
Miller, C.W. and Little, C.A., A Review of Uncertainty Estimates Associated with Models for Assessing the Impact of Breeder Radioactivity Releases, ORNL-5832, Oak Ridge National Laboratory, Oak Ridge, Tenn., August 1982.
Moore, R.E., Baes, C.F. 111, McDowell-Boyer, L.M., Watson, A.P., Hoffman, F.O., Pleasant, J.C., and Miller, C.W., AIRDOS-EPA: A Computerized Methodology for Estimating Environmental Concentrations and Dose to Man from Airborne Releases of Radionuclides, EPA 520/1-79-009 (reprint of ORNL-5532), U.S. Environmental Protection Agency, Office of Radiation Programs, Washington, D.C., December 1979.
NCRP 8 4 Nat:l.onal Council on Radiation Protection and Measurements, Radiol.ogical . Assessment : Predictin~the A
Tr-ort. ~ioaccumulation, and Uptake by Man OF - -- Radionuclides Releascd - to the Environment, NCRP Report No. 76. National Council on Radiation Protection and Measurement, Bethesda, Md., March 1984.
U.S. Nuclear Regul-atory Commission, "Calculation of Annual Doses to Man from Routine Releases of Reactor Effluents for the Purpose of Evaluating Compliance with 10 CFR Part 50 Appendix I (Revisio~ I)," Regulatory Guide 1.109, Office of Standards Development, Washington, D.C., October 1977.
Ru48 Rupp, A.F., Beall, S.E., Bornwasser, L.P., and Johnson, D.H., Dilution of Stack Gases in Cross Winds, USAEC Report AECD-1811 (CE-l620), Clinton Laboratories, 1948.
5177 Slinn, W.G.N., "Precipitation Scavenging: Some Problems, Approximate Solution, and Suggestions for Future Research," in Precipitation Scavenging (1974), CONF-741003, Technical Information Center, Energy Research and Development Administration, Washington, D.C., June 1977.
S j84 S joreen, A. L., and Miller, C.W., PREPAR-A User Friendly Preprocessor to Create AIRDOS-EPA Input Data Sheets, ORNL-5952, August 1984.
Ti83 Till, J.E. and Meyer, K.R., Radiological Assessment, NUREG/CR-3332, ORNL-5968, Division of Systems Integration, Office of Nuclear Reactor Regulation, U.S. Nuclear Regul.atory Commission, Washington, D.C., September 1983.
Wolf, M.A. and Dana, M.?'., '"Experimental Studies in Precipitation Scavenging," in Pacific Northwest Laboratory Annual Report for 1968 to the USAEC Division of Biology and Medicine, Vol.
5. RADIATION DOSIMETRY
5.1 INTRODUCTION
The setting of standards for radionuclides requires an assessment of the doses received by individuals who are exposed by coming into contact with radiation sources. Two forms of potential radiation exposures can occur from these sources -- internal and external. Internal exposures can result from the inhalation of contaminated air or the ingestion of contaminated food or water. External exposures can occur when individuals are immersed in contaminated air or water or are standing on contaminated ground surfaces. Internal or external doses can result from either direct contact with the radiation from radionuclides at the site area or from radionuclides that have been transported from these sites to other locations in the environment. The quantification of the doses received by individuals from these radiation exposures is called radiation dosimetry. This chapter highlights the internal and external dosimetric models used by EPA to assess the dose to individuals exposed to radionuclides.
The models for internal dosimetry consider the quantity of radionuclides entering the body, the factors affecting their movement or transport through the body, and the energy deposited in organs and tissues from the radiation that is emitted during spontaneous decay processes. The models for external dosimetry consider only the photon doses to organs of individuals who are immersed in air or are exposed to a contaminated ground surface. In addition, the uncertainties associated with each model will be discussed.
5.2 BASIC CONCEPTS
Radioactive materials produce radiation as their constituent radioactive nuclides undergo spontaneous radioactive decay. The forms of emitted energy are characteristic of the decay process and include energetic charged particles (alpha and beta particles) and photons (gamma rays and x-rays). Alpha particles are nuclei of helium atoms and carry a positive charge two times that of an electron. These particles can produce dense ionization tracks in the biological material that they traverse. Beta particles are electrons or positrons emitted in radioactive decay. Their penetration power in material is greater than that of alpha particles. Gamma and x-rays are electromagnetic radiation and are distinguishable from alpha and beta particles by their greater penetrating power in material.
This section introduces some terminology used in Chapters 5 and 6 to describe internal and external dosimetry. For a more detailed explanation, the reader is referred to reports published in this area by the International Commission on Radiation Units and Measurements (ICRU80), International Commission on Radiological Protection (ICRP84), and National Council on Radiation Protection and Measurements (NCRP71).
Activity
The activity of a sample of any radionuclide of species, i, is the rate at which the unstable nuclei spontaneously decay. If N is the number of unstable nuclei present at a certain time, t, its activity, A,(t) , is given by
where h: is the radioactive decay constant. The customary unit of activity is the curie (Ci); its submultiples, the millicurie (mCi), the microcurie (pCi), and the picocurie (pCi), are also often used. The curie, which is defined as 3.7x10L0 disintegrations per second, is the approximate activity of 1 gm of Ra-226.
The time variation of the activity can be expressed in the form:
Ai(t) =Aoi exp(- h: t). (5-2)
A,, is the activity of nuclide i at time t=O. For a sample of radioactive material containing more than one radionuclide, the total activity is determined by summing the activities for each radionuclide:
Radioactive Half-Life
From the above equations, it is apparent that the activity exponentially decays with time. The time when the activity of a sample of radioactive material containing species i becomes one- half its original value (i.e., the time t that A,(t) = A,,/2) is called its radioactive half-life, T:, and is defined as:
The unit for the radioactive half-life is any suitable unit of time such as seconds, days, or years. The specific activity of a radionuclide (the activity per unit mass) is inversely proportional to the half-life and can vary over many orders of magnitude.
Radionuclide Chains
Radionuclides decay either to stable atoms or to other radioactive species called daughters. For some species, a decay chain of daughter products may be produced until stable atoms are formed. For example, Sr-90 decays by emitting a beta-particle, producing the daughter Yr-90, which also decays by beta emission to form the stable atom Zr-90:
90 Sr (28.6 yr) ~ ? O Y (64.0 h) -!, "Zr (stable) ( 5 - 5 )
Biological Half-Life
The biological half-life of radionuclides is the time required for biological tissues to eliminate one-half of the activity by elimination processes. This time is the same for both stable and radioactive isotopes of any given element.
Internal and External Exposures to Radionuclides
The term "exposure"', in the context of this report, denotes physical interaction of the radiation emitted from the radioactive material with cells and tissues of the human body. An exposure can be "acute" or "chronic" depending on how long an individual or organ is exposed to the radiation. Internal exposures occur when radionuclides, which have entered the body through the inhalation or ingestion pathway, deposit energy to organ tissues from the emitted gamma, beta, and alpha radiation. External exposures occur when radiation enters the body directly from sources located outside the body, such as radiation from material on ground surfaces, dissolved in water, or dispersed in the air.
In general, for sources of concern in this report, external exposures are from material emitting gamma radiation. Gamma rays are the most penetrating of the emitted radiations, and external gamma ray exposure may contribute heavily to radiation doses to the internal organs. Beta and alpha particles are far less
penetrating and deposit their energy primarily on the skinrs outer layer. Consequently, their contribution to the absorbed dose to the total body, compared to that deposited by gamma rays, is negligible and will not be considered in this report.
Absorbed Dose and Absorbed Dose Rate
The radiological - quantity absorbed dose, D, denotes the mean energy imparted A&, by ionizing radiation to a small finite mass of organ tissue with a mass, Am, and is expressed as
- - D = de/dm = lirn (A EJ A m) .
A m 4
Internal and external exposures from radiation sources are not usually instantaneous but are distributed over extended periods of time. The resulting time rate of change of the absorbed dose to a small volume of mass is referred to as the
absorbed dose rate, D:
D = dD/dt = lirn (A D/A 1). A L-40
The customary unit of absorbed dose rate is any quotient of the rad (or its multiple or submultiple) and a suitable unit of time. In this report, absorbed dose rates are generally given in mrad/yr.
Linear Energy Transfer (LET)
The linear energy transfer, L,, is a quantity that represents the energy lost, by collision, per unit length by charged particles in an absorbing medium. It represents the increment of the mean energy lost, A E , to tissue by a charged particle of specified energy in traversing a distance, AX:
L, = dE/dX = lim (A E E / X) (keV pm-l) (5-8) A x 4
For photons, L-represents the energy imparted by the secondary electrons (electrons that are knocked out of their orbitals by primary radiation) resulting from secondary interactions between the photons and tissue material. High-LET
radiation (alpha particles) imparts more energy per unit length of organ tissue than does low-LET radiation (x-rays, gamma rays, and beta particles). Consequently, the former are more effective per unit dose in causing bioLogica1 damage.
Dose Equivalent and Dose Equivalent Rate
Dose equivalent is a special radiation protection quantity that is used to express the absorbed dose in a manner that considers the difference in biological effectiveness of various kinds of ionizing radiation. The ICRU has defined the dose equivalent, HI as the product of the absorbed dose, D, the quality factor, Q, and all other modifying factors, N, at the point of interest in biological tissue (ICRUBO). This relationship can be expressed in the following manner:
The quality factor is a dimensionless quantity that depends on the collision stopping power for charged particles, and it accounts for the differences in biological effectiveness found among varying types of radiation. By definition, it is independent of tissue and biological endpoint. The generally accepted values for quality factors for high- and low-LET radiation, which are used by EPA, are given in Table 5-1. The product of all other modifying factors, N, such as dose rate, fractionation, etc., is taken as 1.
The dose equivalent rate, H, is the time rate of change of the dose equivalent to organs and tissues and is expressed as:
H = dH/dt = lim (A H/A t) . (mrem/yr) (5-10) AI+O
Table 5-1. Quality factor for various types of radiation (ICRP77).
Radiation Type Quality Factors (Q)
x-rays, gamma rays, and electrons 1
alpha particles 2 0
Effective Dose Equivalent and Effective Dose Equivalent Rate
The ICRP has defined the effective dose equivalent, HE, as:
where H, is the dose equivalent in tissue and w, is the weighting factor, which represents the estimated proportion of the stochastic risk resulting from tissue, T, to the stochastic risk when the whole body is uniformly irradiated (ICRP77). The weighting factors recommended by the ICRP are listed in Table 5-2.
The effective dose equivalent rate is the time derivative of the dose equivalent and is expressed as %, where:
Relationship of the Dose Equivalent and the Effective Dose Equivalent to Risk
The dose equivalent was introduced by the ICRP to allow one to combine and compare - on a risk basis - absorbed doses of different types of radiation. Subsequently, the effective dose equivalent was introduced to provide a single-valued indicator of risk for dose equivalents distributed nonuniformly in the body. By convention, these concepts, in combination with the ICRP- recommended quality factors and organ-weighting factors, are widely used in radiation protection. These recommended factors, however, are based on dose response models that differ significantly from those used by EPA to estimate risk (see Chapter 6) .
To calculate risk, EPA first calculates age-specific, high- and low-LET absorbed dose rates, by organ, for a uniform intake or external exposure rate. The risk from each year's dose is then calculated using a life table procedure in conjunction with age- and organ-specific risk models adapted from the BEIR I11 report (NAS80).
These models (see Chapter 6) assume a linear dose-response relationship and a lifetime relative risk projection for cancers
Table 5-2. Weighting factors recommended by the ICRP for stochastic risks (ZCRP77).
Organ or Tissue WT
Gonads
Breast
Red Bone Marrow
Lung
Thyroid
Bone Surfaces
Remainder
other than bone cancer and leukemia, for which absolute risk projection is employed. Finally, the risks from each year's dose are summed to arrive at the risk from lifetime exposure.
In calculating dose equivalents and effective dose equivalents, the ICRP Publication 30 convention was employed, including the same quality factors and organ-weighting factors. Nevertheless, in calculating the - risk from a given absorbed dose of alpha particle irradiation, RBEs of 8 and 2.7 were used for the induction of cancers and genetic effects, respectively, (see Chapter 6). Since these RBEs are lower than the assumed alpha quality factor (Q=20), the estimated risks per unit dose equivalent (mrem) will generally be lower for alpha particles than for either x-rays or gamma rays. Likewise, the ICRP organ- weighting factors shown in Table 5-2 do not stand in the same proportion as the organ risks calculated using the EPA models for cancer induction or genetic mutations. Furthermore, EPA considers somatic and genetic risks separately. Thus, even if attention was restricted to low-LET radiation, the estimated risk from a given effective dose equivalent will vary, depending on how the absorbed dose is distributed within the body.
To summarize, because EPA risk models differ from those underlying the ICRP recommendations, the risks calculated directly by EPA are not strictly proportional to the effective dose equivalents derived using ICRP quality factors and organ weighting factors.
Working Levels and Working Level Months
The working level is a unit that has been used as a measure the radon decay-product activity in air. It is defined as any combination of short-lived radon daughters (through Po-214) per liter of air that will result in the ultimate emission of 1.3 x lo5 MeV of alpha energy. An activity concentration of 100 pCi/l of Rn-222 in equilibrium with its short-lived daughters gives rise to a potential alpha-energy concentration of approximately 1 WL. The WL unit could also be used for thoron daughters. The potential alpha energy exposure is commonly expressed in units of working level months (WLM). One WLM corresponds to an exposure to a concentration of 1 WL for the commonly used reference period of 170 hours.
Customary and SI Units
The relationship between the customary units used in this text and the international system of units (SI) for radiological quantities is shown in Table 5-3. While the SI radiological units are almost universally used in other countries for radiation protection regulation, the United States has not yet officially adopted their use for such purposes.
5.3 EPA DOSIMETRIC MODELS
The EPA dosimetric models, to be discussed in the following sections, have been described in detail in previous publications (Du80, Su81). Information on the elements treated in these sections was taken directly from those documents or reports.
With the permission of the authors, many edited passages have been adopted to explain EPArs dosimetric models. In most cases, the EPA models are similar or identical to those recommended by the ICRP (ICRP79, ICRP80, ICRP81). However, differences in model parameters do exist for some radionuclides (Su81). The basic physiological and metabolic data used by EPA in calculating radiation doses are taken from ICRP reports (ICRP75, ICRP79) .
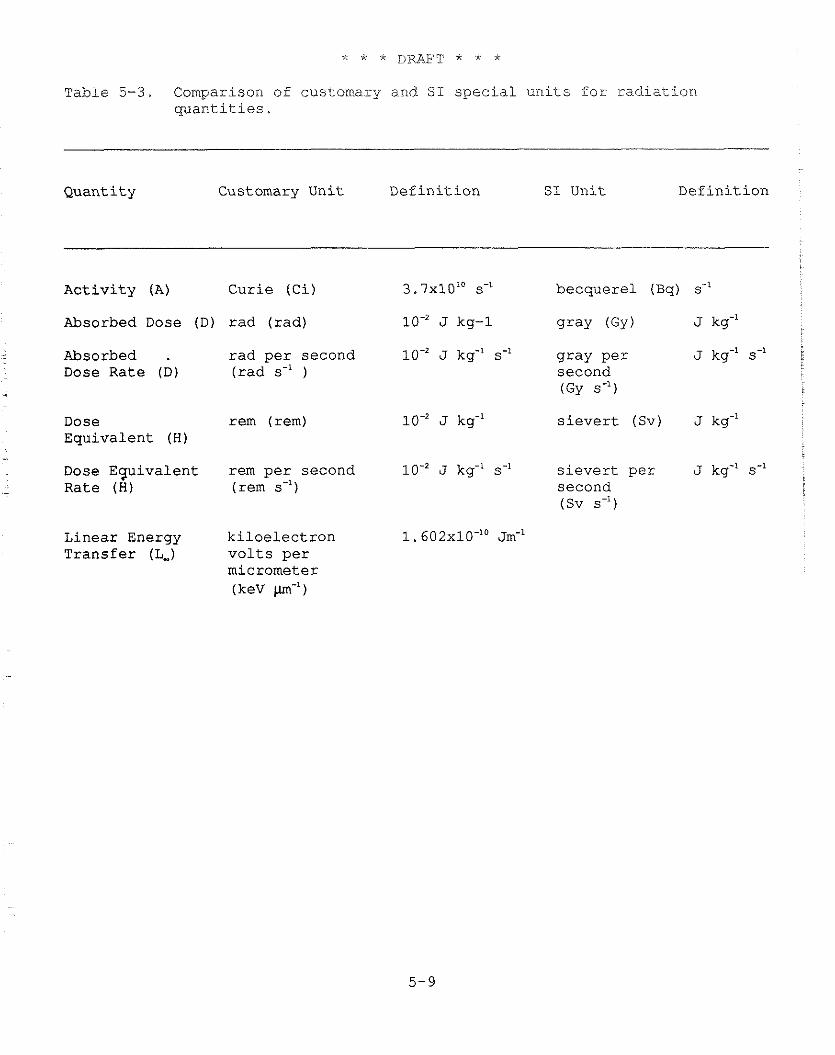
T a b l e 5-3. Comparison of cus tomary a.nd S I s p e c i a l u n i t s f o r r a d i a t i o n q u a n t i t i e s .
Q u a n t i t y Customary U n i t D e f i n i t i o n S I U n i t D e f i n i t i o n
A c t i v i t y (A) C u r i e ( C i ) 3 . 7 ~ 1 0 ' ~ s-' b e c q u e r e l (Bq) s-'
Absorbed Dose ( D ) rad ( r a d ) J kg-1 g r a y ( G y ) J kg"
Absorbed . r a d p e r second J kg-' s-I g r a y p e r J kg-' s-' i
Dose Rate ( D ) ( r a d s-' ) second (GY s-')
Dose rem ( r e m ) E q u i v a l e n t (H)
J kg-' s i e v e r t (Sv) J kg-'
Dose E q u i v a l e n t r e m p e r s e c o n d J kg-' s-' s i e v e r t p e r J kg-' s-' - R a t e (H) (rem s-') s e c o n d
(Sv s-')
L i n e a r Energy k i l o e l e c t r o n 1 . 6 0 2 ~ 1 0 - ' ~ ~ m - ' T r a n s f e r (L,) v o l t s p e r
mic romete r (keV m-')
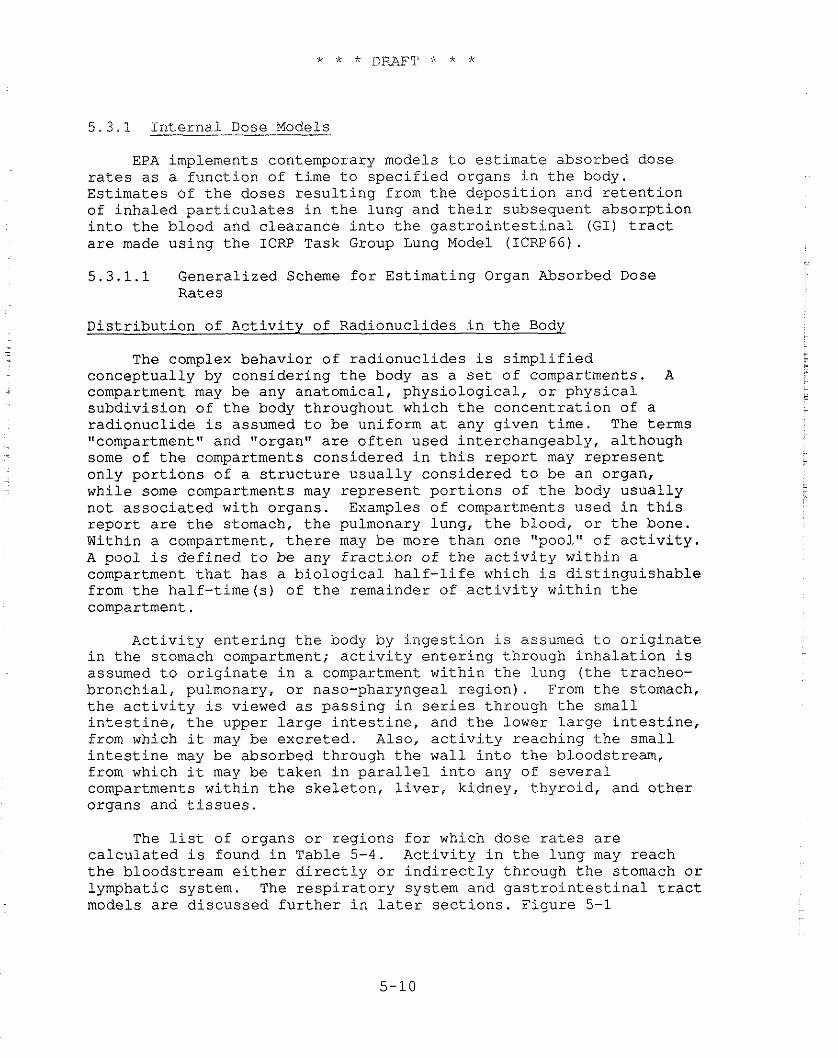
5.3.1 Internal Dose Models
EPA implements contemporary models to estimate absorbed dose rates as a function of time to specified organs in the body. Estimates of the doses resulting from the deposition and retention of inhaled particulates in the lung and their subsequent absorption into the blood and clearance into the gastrointestinal (GI) tract are made using the ICRP Task Group Lung Model (ICRP66).
5.3.1.1 Generalized Scheme for Estimating Organ Absorbed Dose Rates
Distribution of Activity of Radionuclides in the Body
The complex behavior of radionuclides is simplified conceptually by considering the body as a set of compartments. A compartment may be any anatomical, physiological, or physical subdivision of the body throughout which the concentration of a radionuclide is assumed to be uniform at any given time. The terms "compartment" and "organ" are often used interchangeably, although some of the compartments considered in this report may represent only portions of a structure usually considered to be an organ, while some compartments may represent portions of the body usually not associated with organs. Examples of compartments used in this report are the stomach, the pulmonary lung, the blood, or the bone. Within a compartment, there may be more than one "pool" of activity. A pool is defined to be any fraction of the activity within a compartment that has a biological half-life which is distinguishable from the half-time(s) oE the remainder of activity within the compartment.
Activity entering the body by ingestion is assumed to originate in the stomach compartment; activity entering through inhalation is assumed to originate in a compartment within the lung (the tracheo- bronchial, pulmonary, or naso-pharyngeal region). From the stomach, the activity is viewed as passing in series through the small intestine, the upper large intestine, and the lower large intestine, from which it may be excreted. Also, activity reaching the small intestine may be absorbed through the wall into the bloodstream, from which it may be taken in parallel into any of several compartments within the skeleton, liver, kidney, thyroid, and other organs and tissues.
The list of organs or regions for which dose rates are calculated is found in Table 5-4. Activity in the lung may reach the bloodstream either directly or indirectly through the stomach or lymphatic system. The respiratory system and gastrointestinal tract models are discussed further in later sections. Figure 5-1
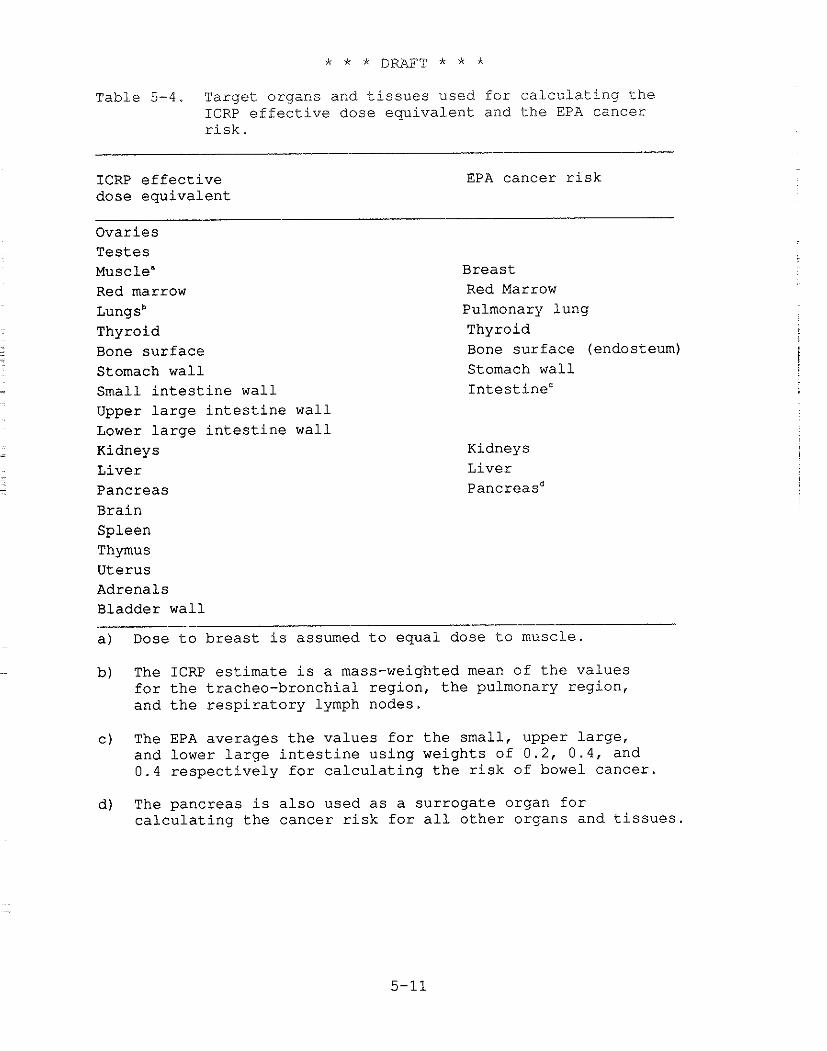
Table 5-4. Target organs and t i s s u e s used f o r c a l c u l a t i n g t h e ICRP e f f e c t i v e dose e q u i v a l e n t and t h e EPA cancer r i s k .
ICRP e f f e c t i v e dose e q u i v a l e n t
EPA cancer r i s k
Ovar ies T e s t e s Muscle" Red marrow ~ u n g s ~ Thyroid Bone s u r f a c e Stomach w a l l Small i n t e s t i n e w a l l Upper l a r g e i n t e s t i n e w a l l Lower l a r g e i n t e s t i n e w a l l Kidneys L ive r Pancreas Bra in
Breas t Red Marrow Pulmonary lung Thyroid Bone s u r f a c e (endosteum) Stomach wal l I n t e s t i n e c
Kidneys L ive r pancreasd
Spleen Thymus Uterus Adrenals Bladder w a l l
a ) Dose t o b r e a s t i s assumed t o equa l dose t o muscle .
b) The ICRP e s t i m a t e i s a mass-weighted mean of t h e va lues f o r t h e t racheo-bronchia l reg ion , t h e pulmonary reg ion , and t h e r e s p i r a t o r y lymph nodes.
C ) The EPA ave rages t h e v a l u e s f o r t h e smal l , upper l a r g e , and lower l a r g e i n t e s t i n e us ing weights of 0 . 2 , 0 . 4 , and 0 . 4 r e s p e c t i v e l y f o r c a l c u l a t i n g t h e r i s k of bowel cance r .
d ) The pancreas i s a l s o used a s a s u r r o g a t e organ f o r c a l c u l a t i n g t h e cance r r i s k f o r a l l o t h e r organs and t i s s u e s .
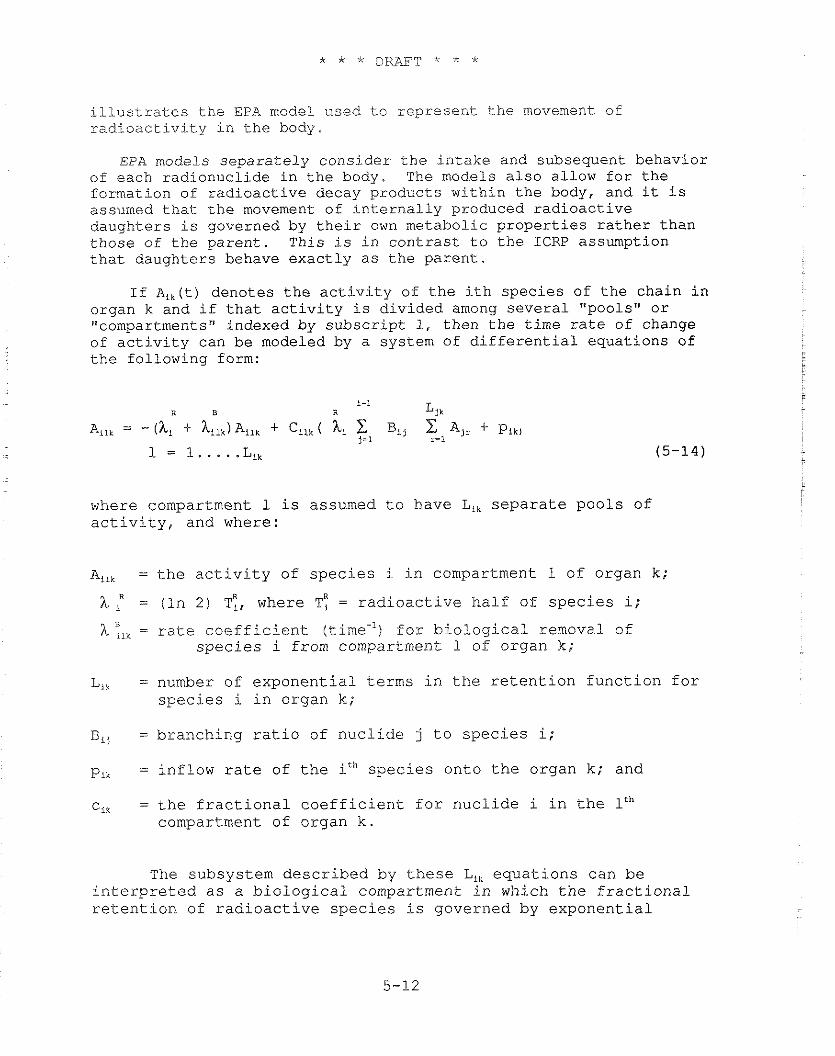
i.ll.ustrates the EPA modei used to represent the movement of radioactivity in the body.
EPA models separately consider the intake and subsequent behavior of each radionuclide in the body. The models also allow for the formation of radioactive decay products within the body, and it is assumed that the movement of internally produced radioactive daughters is governed by their own metabolic properties rather than those of the parent. This is in contrast to the ICRP assumption that daughters behave exactly as the parent.
If A,,(t) denotes the activity of the ith species of the chain in organ k and if that activity is divided among several "pools" or "compartments" indexed by subscript 1, then the time rate of change of activity can be modeled by a system of differential equations of the following form:
where compartment 1 is assumed to have L, separate pools of activity, and where:
Ailk = the activity of species i in compartment 1 of organ k;
h p = (ln 2) T:, where T: = radioactive half of species i;
h p,, = rate coefficient (time.') for biological removal of species i from compartment 1 of organ k;
Lik = number of exponential terms in the retention function for species i in organ k;
Bij = branching ratio of nuclide j to species i;
PI, = inflow rate of the ith species onto the organ k; and
ci, = the fractional coefficient for nuclide i in the lth compartment of organ k.
The subsystem described by these L,, equations can be interpreted as a biological compartment in which the fractional retention of radioactive species is governed by exponential
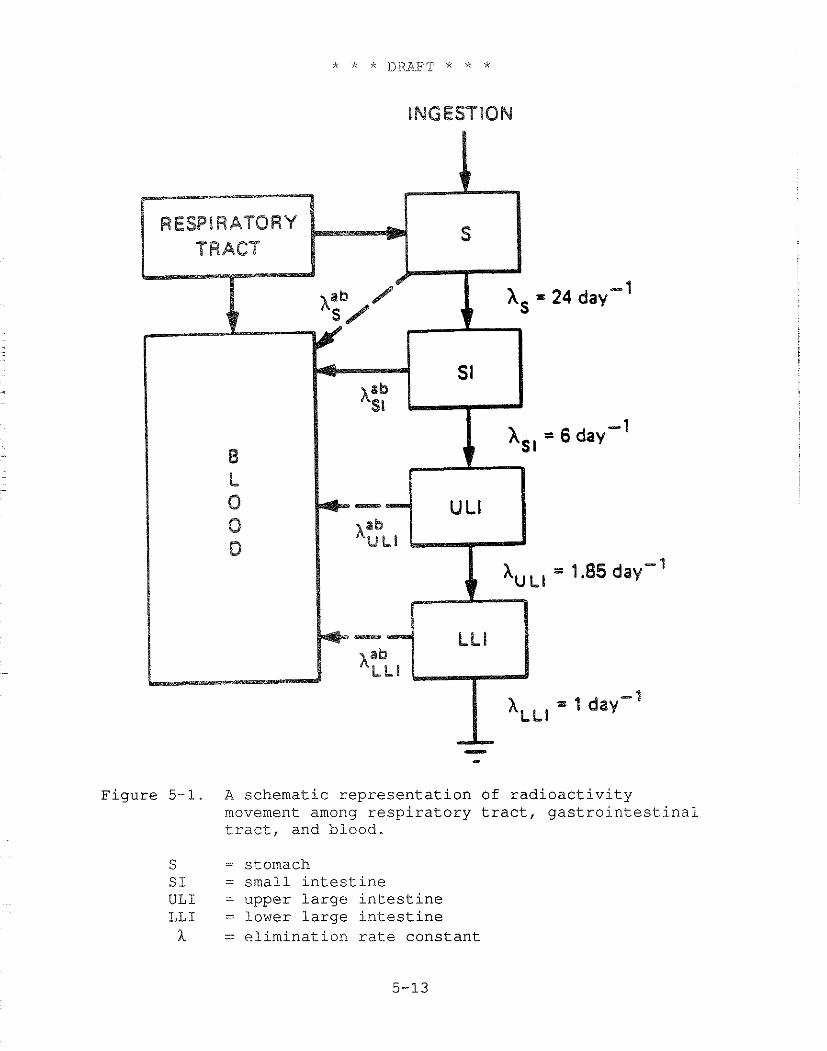
Figure 5-1. A schematic representation of radioactivity movement among respiratory tract, gastrointestinal tract, and blood.
S = stomach S I = small intestine ULI = upper large intestine LLI = lower large intestine h = elimination rate constant
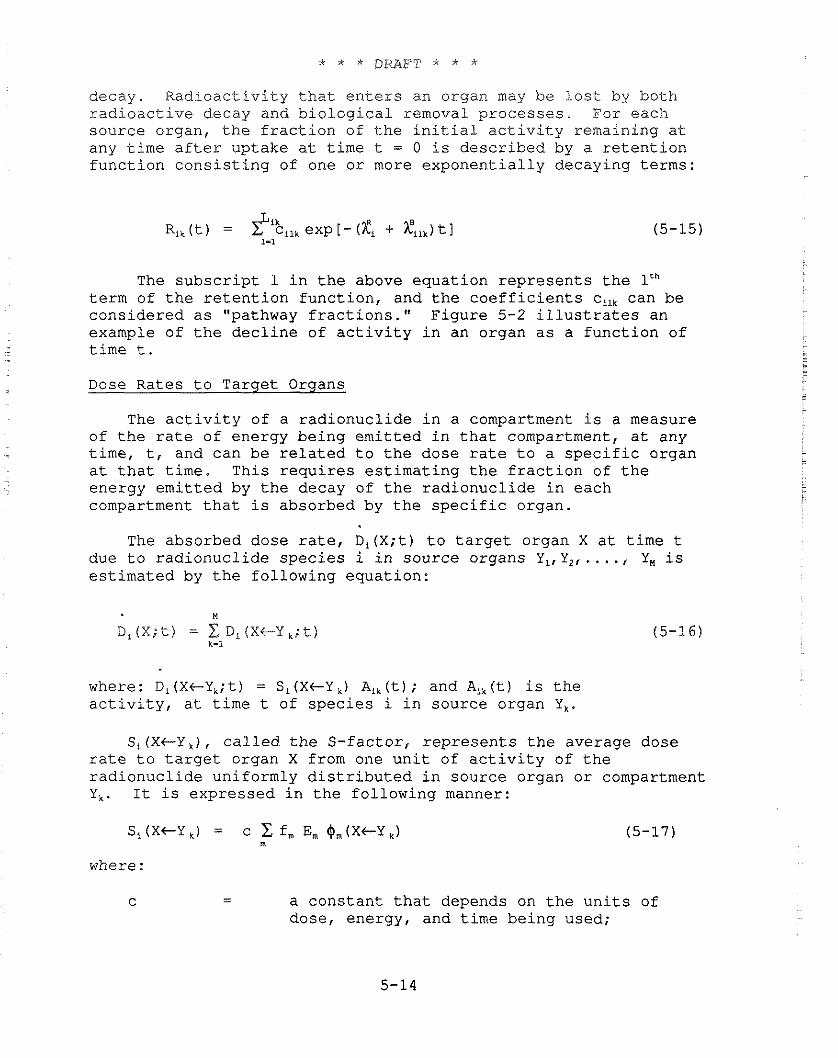
decay. Radioactivity that enters an organ may be lost by both radioactive decay and biological removal processes. For each source organ, the fraction of the initial activity remaining at any time after uptake at time t = 0 is described by a retention function consisting of one or more exponentially decaying terms:
The subscript 1 in the above equation represents the lth term of the retention function, and the coefficients c,, can be considered as "pathway fractions." Figure 5-2 illustrates an example of the decline of activity in an organ as a function of time t.
Dose Rates to Target Organs
The activity of a radionuclide in a compartment is a measure of the rate of energy being emitted in that compartment, at any time, t, and can be related to the dose rate to a specific organ at that time. This requires estimating the fraction of the energy emitted by the decay of the radionuclide in each compartment that is absorbed by the specific organ.
The absorbed dose rate, D,(X;t) to target organ X at time t due to radionuclide species i in source organs Y, ,Y, , ...., Y , is estimated by the following equation:
where: Dl (X+Y,;t) = S,(X+Y ,) A,,(t) ; and A,,(t) is the activity, at time t of species i in source organ Y,.
S,(XtY,), called the S-factor, represents the average dose rate to target organ X from one unit of activity of the radionuclide uniformly distributed in source organ or compartment Y,. It is expressed in the following manner:
where :
C - - a constant that depends on the units of dose, energy, and time being used;
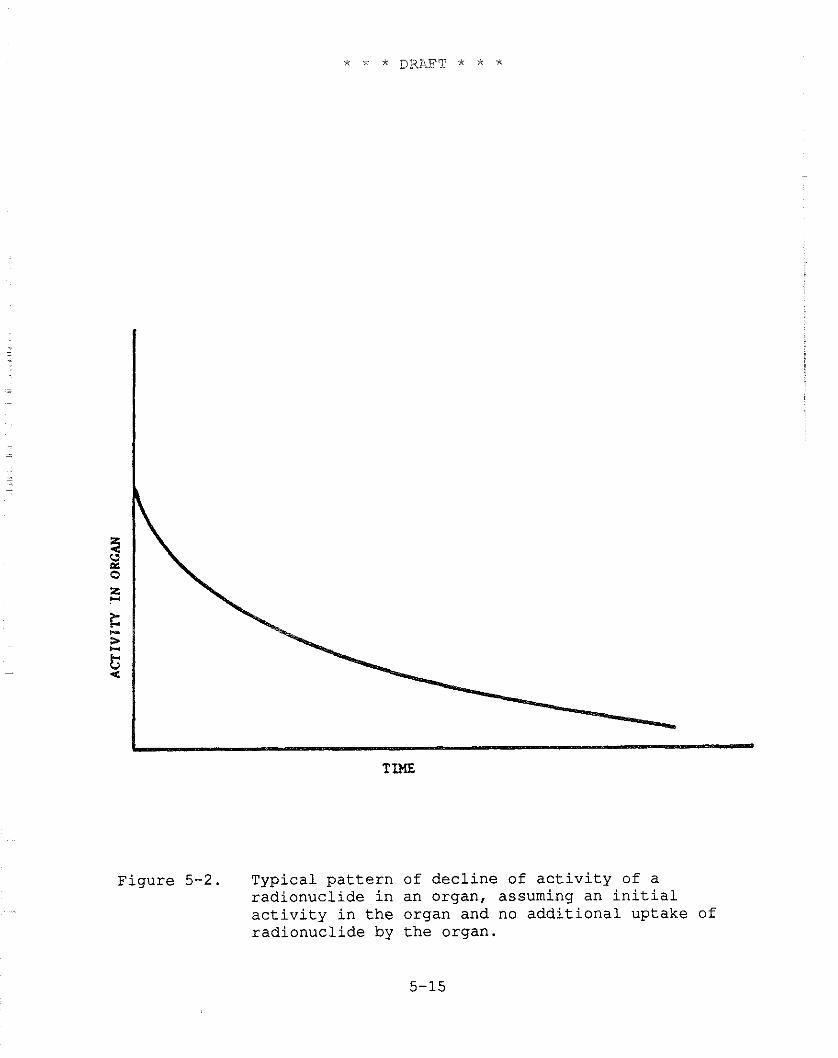
Figure 5-2. Typical pattern of decline of activity of a radionuclide in an organ, assuming an initial activity in the organ and no additional uptake of radionuclide by the organ.
f, = intensity of decay event (number per disintegration);
Em = average energy of decay everit (Mevj; and
@,(XcY ,) = specific absorbed fraction, i .e., the fraction emitted energy from source organ Y, absorbed by target organ X per gram of X,
where the summation is taken over all events of type m. The units for S-factors depend on the units used for activity and time; thus, the S-factor units may be rad/Ci-day. The S-factor is similar in concept to the SEE factor (specific effective energy) used by the ICRP Committee 2 in Publication 30. However, the SEE factor includes a quality factor for the type of radiation emitted during the transformation.
The above equations are combined to produce the following expressions for the absorbed dose rates to target organs at any time due to one unit of activity of radionuclide species, i, uniformly distributed in source organs Y, . . . Y,:
The corresponding dose equivalent rate, H,(X;t), can be estimated by inclusion of the quality factor, Q,, and the modifying factor, N,(Y,) :
Hi (X;t) = C C Aik(t) Q Si,(X+Yk) (5-19) k m
Implicit in the above equations is the assumption that the absorbed dose rate to an organ is determined by averaging absorbed dose distributions over its entire mass.
Alpha and beta particles are usually not sufficiently energetic to contribute a significant cross-irradiation dose to targets separate from the source organ. Thus, the absorbed fraction for these radiations is generally assumed to be just the inverse of the mass of organ X, or if the source and target are separated, then Q,(XtY) = 0 . Exceptions occur when the source and target are in very close proximity, as is the case with various skeletal tissues. Absorbed fractions for cross- irradiations by beta particles among skeletal tissues were taken from ICRP Publication 3 (ICRP80). The energy of alpha particles and their associated recoil nuclei is generally assumed to be
absorbed in the source organ. Therefore, $,(X+X) is taken to be the inverse of the organ mass, and @,(X+Y) = 0 if X and Y are separated. Special calculations are performed for active marrow and endosteal cells in bone, based on the method of Thorne (Th77).
Monte Carlo Methodology to Estimate Photon Doses to Organs
The Monte Carlo method uses a computerized approach to estimate the probability of photons interacting within target organ X after emission from source organ Y. The method is carried out for all combinations of source and target organs and for several photon energies. The body is represented by an idealized phantom in which the internal organs are assigned masses, shapes, positions, and attenuation coefficients based on their chemical composition. A mass attenuation coefficient, p,, is chosen, where p, is greater than or equal to the mass attenuation coefficients for any region of the body. Photon courses are simulated in randomly chosen directions, and potential sites of interactions are selected by taking distances traversed by them as -In r/p,, where r is a random number distributed between 0 and 1. The process is terminated when either the total energy of photons has been deposited or the photon escapes from the body. The energy deposition for an interaction is determined according to standard equations (ORNL74).
Effects of Decay Products
In calculating doses from internal and external exposures, the in-growth of radioactive decay products (or daughters) must be considered for some radionuclides. When an atom undergoes radioactive decay, the new atom created in the process, which may also be radioactive, can contribute to the radiation dose to organs or tissues in the body. Although these decay products may be treated as independent radionuclides in external exposure, the decay products of each parent must be followed through the body in internal exposure situations. The decay product contributions to the absorbed dose rates, which are included in EPA calculations, are based on the metabolic properties of the individual daughters and the organ in which they occur.
5.3.1.2 Inhalation Dosimetry - ICRP Respiratory Tract Model
As stated earlier, individuals immersed in contaminated air will breathe radioactive aerosols or particulates, which can lead to doses to the lung and other organs in the body. The total internal dose caused by inhalation of these aerosols can depend
on a varie'ty of factors, such as breathing rates, particle sizes, and physical activity. Estimating the total dose to individuals over a specific time period requires specifying the distribution of particle depositions in the respiratory tract and the mathematical characteristics of the clearance parameters. The EPA currently uses assumptions established by the ICRP Task Group on Lung Dynamics (TGLM) (ICW66). This section will summarize the essential features of that model. For a more comprehensive treatment, the reader is referred to the actual report.
The basic features of the ICRP lung compartmental model are shown in Figure 5-3. According to this model, the respiratory tract is divided into four regions: naso-pharyngeal (N-P), tracheo-bronchial (T-B), pulmonary ( P ) , and lymphatic tissues.
- In the model, the regions N-P, T-B, and P are assumed to receive fractions D,, D,, and D, of the inhaled particulates, where the sum of these is less than 1 (some particles are removed by prompt exhalation). The values D,, D,, and D, depend on the activity median aerodynamic diameter (AMAD) of the inspired particles. For purposes of risk calculations, EPA uses AMADs of 1 micron. The lung model employs three clearance classes, D, W, and Y, corresponding to rapid, intermediate, and low clearance, respectively, of material deposited in the respiratory passages. The clearance class depends on chemical properties of the inhaled particles.
Like the ICW, EPA assumes that the absorbed dose rate to the N-P region can be neglected. Unlike the ICW, however, EPA averages the dose over the pulmonary region of the lung (compartments e through h), to which is assigned a mass of 570 g, including capillary blood (ICRP75). In addition, it is assumed that the total volume of air breathed in one day by a typical member of the general population is 22,000 liters. This value was determined by averaging the 23 I C W adult male and female values based on 8 hours of working "light activity," 8 hours of nonoccupational activity, and 8 hours of resting.
5.3.1.3 Ingestion Dosimetry - I C W GI Tract Model
According to the ICRP 30 GI tract model, the gastrointestinal tract consists of four compartments: the stomach ( S ) , small intestine (SI), upper large intestine (ULI), and lower large intestine (LLI). The fundamental features of the model are shown in Figure 5-1. It is assumed that absorption into the blood occurs only from the small intestine (SI).
This model postulates that radioactive material entering the compartments of the GI tract is exponentially removed by both radioactive decay and biological removal processes, and that there is no feedback. Absorption of a particular nuclide from the GI tract is characterized by f,, which represents that fraction of the nuclide ingested which is absorbed inta body fluids if no radiological decay occurs:
where
h,": = the absorption coefficient (s-')
h,, = the transfer coefficient fron the small intestine to the large intestine (s-l)
Figure 5-1 graphically presents the role of these coefficients in the gastrointestinal model. The kinetic model, as formulated by the ICRP, does not permit total absorption of a nuclide (f, = 1).
5.3.1.4 Dose Rate Coversion Factors
EPA uses the computer code RADRISK (Du80) for calculating radiation doses and risks to individuals resulting from a unit intake of a radionuclide, at a constant rate, for a lifetime exposure (50-yr dose commitment). These calculations are done for the inhalation and ingestion pathways to individuals who are exposed by immersion in contaminated air or by contaminated ground surfaces.
RADRISK computes doses for both chronic and acute exposures. Following an acute intake, it is assumed the activity in the body decreases monotonically, particularly for radionuclides with rapid radiological decay rates or rapid biological clearance. In the case of chronic exposure, the activity in each organ of the body increases monotonically until a steady state is achieved, at which time the activity remains constant. The instantaneous dose rates at various times after the start of chronic exposure provide a reasonably accurate (and conservative) estimate of the total annual dose for chronic exposure conditions. However, the instantaneous dose rates may err substantially in the estimation of annual dose from an acute exposure, particularly if the activity levels decrease rapidly.
Since the rate of change in activity levels in various organs is more rapid at early times after exposure, doses are computed annually for the first several years and for progressively longer periods thereafter, dividing by the length
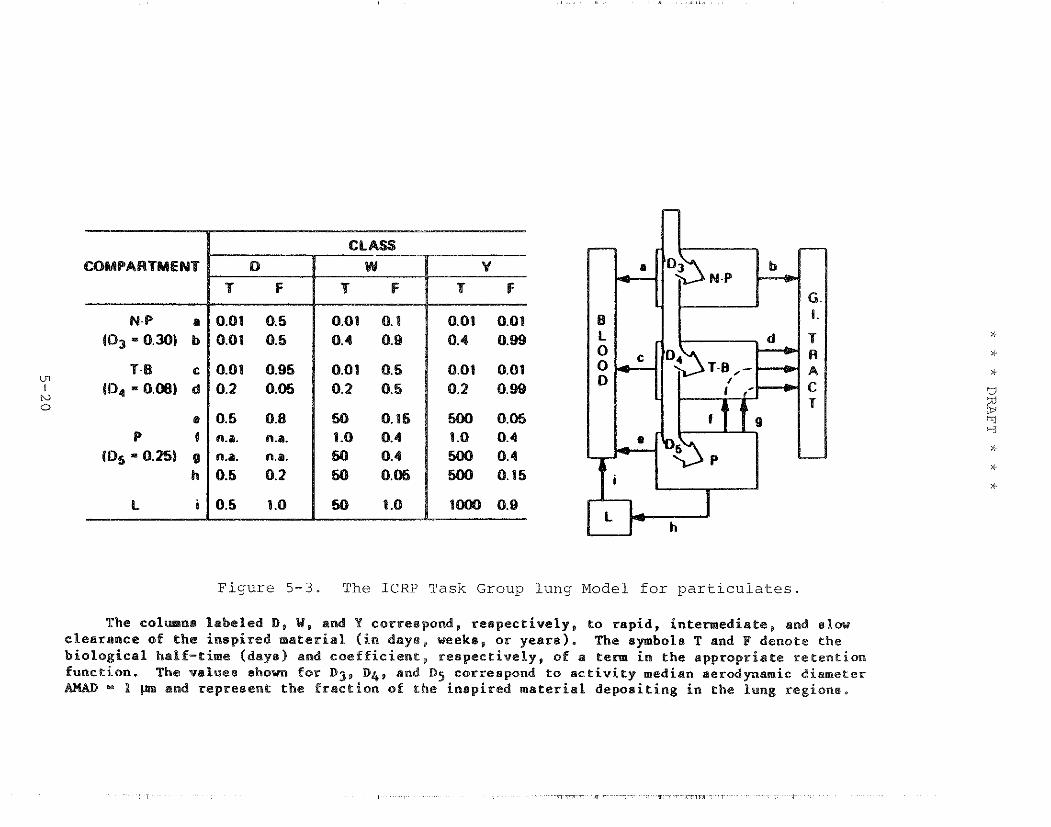
COMPARTMENT
N-P a (D3 = 0.30) b
Figure 5-3. The ICRP Task Group lung Model for particulates.
The c o l m n s l a b e l e d D, W, and Y correspond, r e s p e c t i v e l y , t o r a p i d , i n t e w e d i a t e , and slaw c lea rnnce of t h e i n s p i r e d m a t e r i a l ( i n days , weeks, o r y e a r s ) . The symbols T and P denote the b i o l o g i c a l half-tirne (dayel and c o e f f i c i e n t , r e s p e c t i v e l y , of a term i n the a p p r o p r i a t e r e t e n t i o n func t ion . The va lues shown f o r D j , D q , and Dg correspond t o a c t i v i t y median a e r o d p a m i c diameter AHAD 1 p n and rep resen t t h e f r a c t i o n of t h e i n s p i r e d m a t e r i a l d e p o s i t i n g i n t h e lung regione ,
of the interval to estimate the average annual dose. This method produces estimates of risk that are similar to those computed by the original RADRISK methodology for chronic exposures and provides a more accurate estimate of the risks from acute intakes.
5.3.1.5 Special Radionuclides
The following paragraphs briefly summarize some of the special considerations for particular elements and radionuclides.
Tritium and Carbon-14
Most radionuclides are nuclides of elements found only in trace quantities in the body. Others like tritium (hydrogen-3) or C-14 must be treated differently since they are long-lived nuclides of elements that are ubiquitous in tissue. An intake of tritium is assumed to be completely absorbed and to be rapidly mixed with the water content of the body (Ki78a).
The estimates for inhalation include consideration of absorption through the skin. Organ dose estimates are based on the steady-state specific-activity model described by Killough et al. (Ki78a) .
C-14 is assumed to be inhaled as CO, or ingested in a biologically bound form. Inhaled C-14 is assumed to be diluted by stable carbon from ingestion (Ki78b). This approach allows separate consideration of the ingestion and inhalation pathways. The specific-activity model used for organ dose estimates is also that of Killough et al. (Ki78a). Short-lived carbon radionuclides (e.g., C-11 or C-15) are treated as trace elements, and the organ doses are calculated accordingly.
Noble Gases
Retention of noble gases in the lungs is treated according to the approach described by Dunning et al. (Du79). The inhaled gas is assumed to remain in the lungs until lost by radiological decay or respiratory exchange. Translocation of the noble gas to systemic organs is not considered, but doses due to translocated decay products produced in the lungs are calculated. The inhalation of the short-lived decay products of radon is assessed using a potential alpha energy exposure model (see Chapter 6) rather than by calculating the doses to lung tissues from these radionuclides.
For some essential elements, such as potassium and chemically similar radioelements, such as rubidium and cesium, absorption into the bloodstream is nearly complete at all ages, so that changes with age and possible homeostatic adaptations in absorption are not discernible. The fraction of a radioelement that is transferred to the blood depends on its chemical form, and wide ranges of values are found in the literature for individuals who ingest the material under different conditions. For example, f, values for uranium were found to range from 0.005 to 0.05 for industrial workers, but a higher average value of 0.2 (0.12 to 0.31) is indicated by dietary data from persons not ocoupationally exposed (ICFS79). EPA has used the 0.2 value for uranium ingestion by the general population.
It appears that all iodine entering the small intestine is absorbed into the blood; hence the f, value is taken as 1 for all ages, which is the value used in this analysis.
Organ Masses, m
To a large extent, the variability in organ masses among individuals in the general population is related to age. For most of the target organs listed in Table 5-2, the mass increases during childhood and continues to increase until adulthood, at which time the net growth of the organ ceases; there may be a gradual decrease in mass (for some organs) in later years.
Based on data reviewed by Dunning and Schwarz (Du81), the mass of an adult thyroid ranges from 2 to 62 g. It is expected that this parameter variability would be reflected in large dosimetric variability among adults. Children in the age group from .5 to 2 yr were found to have a mean thyroid mass of 2.1 g, while the adult group had a mean mass of 18.3 g. For this illustration, the same values are used as employed by the ICFS (20 g for the adult thyroid mass and 1.8 g for that of a 6-month-old child), which are also consistent with the recommendation of Bryant (Br69) .
The fraction of a radionuclide taken up from the blood in an organ is strongly correlated with the size of the organ, its metabolic activity, and the amount of material ingested. Iodine introduced into the bloodstream is rapidly deposited in the thyroid, usually reaching a peak slightly after 24 hours. The uptake of 1-131 by the thyroid is similar to that of stable iodine in the diet and can be influenced by sex and dietary differences. There can be considerable variation among populations.
Dunning and Schwarz (Du81) found a mean f,'value of 0.47 for newborns, 0.39 for infants, 0.47 for adolescents, and 0.19 for adults. This analysis uses f; values of .35 and .15 for a child and adult, respectively.
Effective Half-Life, TI,,
Some data suggest a strong correlation between biological half-lives of radionuclides in organs in the body and the age of the individual. Children are expected to exhibit faster elimination rates and greater uptakes (Ro58). For iodine, a range of biological half-lives of 21 to 200 days for adults has been observed, and a similarly wide range would be expected for other age groups (Dual). Rosenberg (Ro58) found a significant correlation between the biological half-life and the age of the individual and an inverse relationship between uptake and age in subjects from 22 to 50 yr of age. Dunning and Schwarz (Dual) concluded that for adults the observed range was from 21 to 372 days; for children in the age group from .5 to 2 yr, the range was 4 to 39 days.
In light of the possible inverse relation between the biological half-life and the f; value, this analysis uses biological half-lives of 24 and 129 days, respectively, for children and adults, based on the paper by Bryant (Br69). Including the effect of radioactive decay, these values imply an effective half-life of 6 days in adults and 8 days in children.
Effective Energy per Disintegration, E
The effective energy per disintegration (MeV/dis) of a radionuclide within an organ depends on the decay energy of the radionuclide and the effective radius of the organ containing the radionuclide (ICRP59). It is expected, therefore, that E is an age-dependent parameter which could vary as the size of the organ changes. While very little work has been done in determining E for most radionuclides, some information has been published for 1-131 and Cs-137. Considering the differences between the child and the adult thyroid, Bryant (Br69) estimates E to be 0.18 MeV/dis for the child and 0.19 MeV/dis for the adult. The above values correspond to a 6-month-old child with a mass of 1.8 g and an f: value of 0.35. The corresponding E value for the adult was calculated for a 20-9 thyroid with an f; value of 0.3.
Taking into account all the age-dependent factors discussed above, this analysis indicates that, for a given concentration of 1-131 in milk, the estimated dose rate to the thyroid of a 6-month-old child would be approximately 13 times that to an
adult thyroid. In other words, use of adult parameters would underestimate the thyroid dose to the child by about a factor of 13.
5.3.1.6.8 Significance of Parameter Variabililty to EPA Dose and Risk Assessments
In its radiological risk assessments, EPA is generally interested in estimating the risk to an average individual due to chronic lifetime exposures. Variation in dosimetric parameters between people and between age groups is of reduced importance in this context because such variation gets averaged over a population and/or over a lifetime. Nevertheless, it should be kept in mind that some individuals in a population are going to be at higher risk from a given exposure. Furthermore, despite such averaging, parameter variability can contribute substantially to the uncertainty in the dose and risk estimates.
Parameter variation among individuals contributes uncertainty to the models by causing random errors in any measured human data upon which the dosimetric models are based. To the extent that the subjects from whom such data are collected are atypical of the U.S. population (e.g., with respect to health status), parameter variation may also be a source of bias. In this respect, since the parameters contained in the dosimetric models were estimated for adult males, primarily, they may not provide an adequate basis for calculating the average dose or risk in cases where age- and sex-related variations in these parameters are large. This problem becomes more significant in light of the generally higher risks associated with a given dose for childhood exposures (see Chapter 6); if doses are also higher in childhood, the enhanced effect on risk will be compounded.
5.3.1.6.9 Past Approaches Used in Estimating Uncertainties in Calculated Organ Dose
As in any predictive exercise, it is useful to question the reliability of the predictions. Variations in environmental levels, dietary and life style preferences, and the variability of controlling physiological and metabolic processes contribute to the distribution of dose among members of the exposed population. Superimposed on this variability is a component of uncertainty arising from limitations in the predictive ability of the dosimetric models themselves. Various approaches have been taken to understand and quantify these uncertainties.
It has recently become popular to estimate the uncertainty by computing the distribution of dose among exposed individuals.
This approach consists of repeated solution of the dosimetric model using parameter values selected at random from a frequency distribution of potential values suggested in the literature. It is assumed that the dosimetric model has been properly formulated, although these models were developed to yield point estimates. Despite these and other difficulties, propagation of parameter uncertainty through the dosimetric equation can provide a measure of the model uncertainty. Application of these methods to the estimation of dose from 1-131 and Cs-137 ingestion can be found in the literature (Du81, Sc82).
An alternative approach to assessing the potential variability is to consider that the observed frequency distribution of a measurable quantity is closely related to dose. Cuddihy and co-workers (Cu79) have investigated the variability of selected target organ deposition among test animals and some individuals exposed. However, they did not address differences in age, gender, magnitude or duration of exposure.
5.3.1.6.10 Uncertainty Classification of Radionuclides
In this section, radionuclides of interest are classified in terms of the uncertainties in estimated dose per unit intake. Nuclides are placed in broad groups, largely reflecting the general status of information on their biokinetic behavior in the body. It is assumed that the uncertainty associated with the calculation of the energy deposition in the target tissues is a minor contributor to the overall uncertainty.
Classification of Uncertainty in Radionuclide Dose
Establishing numerical values of uncertainty for model dose estimates of each of the many radionuclides, for each route of exposure, is a formidable task. Even if there is agreement on the definition of uncertainty, any quantification will be arbitrary to a degree. No model has been verified in man for any long-term exposure scenario; some of the models may be fundamentally wrong in their formulation. In addition, the data selected to establish the parameters used in the model may not be representative of the population being evaluated. Most risk assessors use some informed scientific judgment in estimating the level of uncertainty in a dose model.
A broad categorization of radionuclides reflecting the estimated magnitude of the dosimetric uncertainties is presented. Because of the problems cited above with respect to the development of models and model parameters, it is quite possible that the error in model estimates may be larger than indicated in some cases. Nevertheless, this exercise is useful since it
provides some perspective on the magnitude of the uncertainties in light of current evidence and focuses attention on the largest gaps in knowledge. Ultimately, however, better quantification of dose estimates and their associated uncertainties can be obtained only through the development and verification of improved dosimetric models.
Radioisotopes behave biologically like their stable elements. The elements, in turn, can be broadly grouped as: (1) essential elements and their analogs, (2) inert gases, (3) well-studied toxic metals and (4) others. Uncertainties for each of these categories will be expressed as multiplicative factors, which roughly estimate the 95% upper and lower confidence interval limits. [Since the interval is based on judgment, a preferable term would be "credibility interval" (NIH85).]
Group I - Essential Elements and Their Analogs
Essential elements are controlled by homeostatic mechanisms to within narrow tolerances. Usually, analogs of essential elements have distribution and deposition patterns similar to those of the essential element. The uncertainty expected in calculated dose for essential elements is a factor of two or less in major critical organs, perhaps 3 or less in other significant tissues and organs. The expected dose uncertainty for analogs of essential elements is perhaps a little greater, a factor of 3 or less in major organs and up to 5 or more in less significant tissues. Important radionuclides of essential elements include H-3, C-14, P-32, K-40, Ca-45, Co-60, 1-129, and 1-131; important analogs include Sr-89, Sr-90, Cs-134, Cs-137, Ra-226, and Ra-228.
Group I1 - Inert Gases
Uptake and retention of inhaled inert gases has been fairly well studied. The uncertainty in dose, particularly average whole body dose, is not expected to be large. However, the gases do not distribute uniformly in body tissues, and the effect of distribution on organ dose estimates has not been carefully addressed. The uncertainty in the calculated dose is expected to be about a factor of 2. This group includes, but is not limited to Ar-41, Kr-85, Xe-133, and Rn-222.
Group 111 - Well-Studied Toxic Metals
A number of elements have been extensively studied in animals with limited information available for man. Examples here include toxic elements encountered in industrial activities, e.g., mercury, cadmium, lead, and uranium, for which studies were carried out to help establish safe working conditions. Often the
available information is not sufficiently complete to identify the dominant processes governing the biokinetic behavior or is simply fragmentary. For example, while much information exists on the biokinetics of uranium, considerable uncertainty remains associated with the absorption to blood from the small intestine. Uncertainties for dose estimates in this group of elements would be variable, ranging from 2 or less for lead up to about 5 or more for polonium, thorium, uranium, and the transuranics. Nuclides in this group include, but are not limited to Pb-210, Po-210, U-235, U-238, Th-230, Th-232, Pu-239, Pu-241, and Am-241.
Group IV - Other Elements
For a number of radionuclides information is largely limited to data from animal studies. While animal studies often are the major source of detailed information on the processes governing the biokinetics, the lack of a general framework for extrapolations to man and the limited information upon which to judge the reasonableness of the extrapolations suggest that the estimates must be considered to be potentially in error by at least an order of magnitude. Nuclides in this group include, but are not limited to Ce-144 and other rare earth elements, Tc-99, Cm-244, Cf-252, etc.
The groupings listed above represent the Agency's best judgment on the uncertainty of internal radionuclide dose estimates. The primary source of uncertainty is in the biokinetic modeling with little uncertainty in the physics. The magnitudes of the uncertainties posited for each group of radionuclides should be regarded as only rough estimates; however, the qualitative breakdown between groups is fairly reliable.
Specific Problems
Certain radioisotopes and aspects of dosimetry pose unique problems. While the effect of these problems may be to increase the uncertainty in dose estimates, the extent of such an increase has yet to be evaluated.
Long-Lived Bone Seekers
Radioisotopes with effective half-lives that are short compared to the average life span are expected to be in dynamic equilibrium. However, some bone seekers have long effective half-lives; therefore, they do not reach dynamic equilibrium during a life span. Since the relevant human biokinetic data are
qui.te iimi.ted, dose estimates for such radionuclides are more uncertain.
Nonuniformity of Distribution
The distribution of an element within an organ may not be uniform; in particular, the distribution may be nonuniform with respect to biological targets of interest. This can be a serious problem with respect to the estimation of relevant doses from internally deposited alpha emitters, given the short range of alpha particles in matter. For example, where an alpha emitter is distributed nonuniformly in bone, the calculation of doses to sensitive cells in the bone and the bone marrow will be difficult. Another example is the uncertainty in estimating doses to cells lining the GI tract from ingested alpha emitters passing through the tract. In some cases, the mucus lining may effectively shield the target cells from irradiation.
5.3.2 External Dose Models
This section is concerned with the calculation of dose rates for external exposure to photons from radionuclides dispersed in the environment. Two exposure models are discussed: (1) immersion in contaminated air and (2) irradiation from material deposited on the ground surface. The immersion source is considered to be a uniform semi-infinite radionuclide concentration in air, while the ground surface irradiation source is viewed as a uniform radionuclide concentration on an infinite plane. In both exposure modes, the dose rates to organs are calculated from the dose rate in air.
Dose rates are calculated as the product of a dose rate factor, which is specific for each radionuclide, tissue, and exposure mode, and the corresponding air or surface concentration. The dose rate factors used were calculated with the DOSE FACTOR code (Ko8la,b). Note that the dose rate factors for each radionuclide do not include any contribution for decay products. For example, the ground surface dose factors for cesium-137 are all zero, since no photons are emitted in its decay. To assess surface deposition of Cs-137, the ingrowth of its decay product, metastable Ba-137, which is a photon emitter, must first be calculated.
5.3.2.1 Immersion
For immersion exposure to the photons from radionuclides in air, EPA assumes that an individual is standing at the base of a semi-infinite cloud of uniform radionuclide concentration. First, the dose rate factor (the dose rate for a unit
concentration) in air is calculated for a source of photons with energy E,. At all points in an infinite uniform source, conservation of energy considerations require that the rates of absorbed and emitted energy per unit mass be equal. The absorbed energy rate per unit mass at the boundary of a semi-infinite cloud is just half that value. Hence
where :
D m ; = the immersion dose rate per unit air concentration (rad m3/Ci s);
E, = emitted photon energy (MeV);
k = units conversion factor
= 1.623-13 (J/MeV) x 3.7E+10 (dis/s-Ci) x 1.OE+3 (g/kg) x 100 (rad kg/J)
= 5.93Ei2 (g rad/MeV Ci s); and
P = density of air (g/m3).
The above equation presumes that for each nuclide transformation, one photon with energy E, is emitted. The dose rate factor for a nuclide is obtained by adding together the contributions from each photon associated with the transformation process for that radionuclide.
5.3.2.2 Ground Surface Irradiation
In the case of air immersion, the radiation field was the same throughout the source region. This allows the dose rate factor to be calculated on the basis of energy conservation without having to consider explicitly the scattering processes taking place. For ground surface irradiation, the radiation field depends on the height of the receptor above the surface, and the dose rate factor calculat-ion is more complicated. The radiation flux per unit solid angle is strongly dependent on the angle of incidence. It increases from the value for photons incident from immediately below the receptor to a maximum close to the horizon. Attenuation and buildup due to scattering must be considered to calculate the dose rate factor. Secondary scattering provides a distribution of photon energies at the receptor, which increases the radiation flux above that calculated on the basis of attenuation. Trubey (Tr66) has provided a useful and reasonably accurate expression to approximate this buildup:
but more precise estimates of these distributions are not likely to change the organ dose rate factors substantially.
Kocher (Ko81) has noted that the idealized photon dose rate factors are "likely to be used quite extensively even for exposure conditions for which they are not strictly applicable . . . because more realistic estimates are considerably more difficult and expensive [to make] . "
EPA77 U.S. Environmental Protection Agency, Proposed Guidance on Dose Limits for Persons Exposed to Transuranium Elements in the General Environment, EPA 520/4-77-016, 1977.
Fi35 Findeisen, W., Uber das Absetzen Kleiner in der Luft Suspendierten Teilchen in der Menschlichen Lunge bei der Atmung, Pflugers Arch. f d ges. Physiol., 236, 367, 1935.
FRC67 Federal Radiation Council, Guidance for the Control of Radiation Hazards in Uranium Mining, FRC Report No. 8, Revised, U.S. Government Printing Office, Washington, D.C., 1967.
H075 Holden, W.S., and Marshal, R., "Variations in Bronchial Movement", Clin. Radiol., - 26:439-454, 1975.
Hu72 Hughes, J.M.B., Hoppin, F.G., Jr. and Mead, J., "Effect of Lung Inflation on Bronchial Length and Diameter in Excised Lungs", J. Appl. Physiol., - 32:25-35, 1972.
Hu73 Hursh, J.B., and Spoor, N.L., "Data on Man", Chapter 4 in Uranium, Plutonium and the Transplutonic Elements, Springer, New York, 1973.
ICRP59International Commission on Radiological Protection, Report of Committee I1 on Permissible Dose for Internal Radiation, ICRP Publication 2, Pergamon Press, Oxford, 1959.
ICRP66ICRP Task Group on Lung Dynamics, "Depositions and Retention Models for Internal Dosimetry of the Human Respiratory Tract", Health Phys., g ( 2 ) : 173-207, 1966.
ICRP75International Commission on Radiological Protection, Report on the Task Group on Reference Man, ICRP Publication No. 23, Pergamon Press, Oxford, 1975.
ICRP77International Commission on Radiological Protection, "Recommendations of the International Commission on Radiological Protection", ICRP Publication 26, Annals of the ICRP, Vol. 1, No. 3, Pergamon Press, Oxford, 1977.
ICRP79International Commission on Radiological Protection, Limits for Intakes of Radionuclides by Workers, LCRP Publication No. 30, Pergamon Press, Oxford, 1979.
ICRP80International Commission on Radiological Protection, "Limits for Intakes of Radionuclides by Workers", ICRP Publication 30, Part 2, Annals of the ICRP, Vol. 4 (3/4), Pergamon Press, Oxford, 1980.
ICRP81International Commission on Radiological Protection, "Limits for Intakes of Radionuclides by Workers", ICRP Publication 30, Part 3, Annals of the ICRP, Vol. 6 ( 2 / 3 ) , Pergamon Press, Oxford, 1981.
ICRP84International Commission on Radiological Protection, "A Compilation of the Major Concepts and Quantities in Use by ICRP", ICRF Publication No. 42, Pergamon Press, Oxford, 1984.
ICRU80International Commission on Radiation Units and Measurements, ICRU Report No 33, Washington, D.C., 1980
Ke80 Kerr, G.D., and Eckerman, K.F., Oak Ridge National Laboratory, private communication; see also Abstract P/192 presented at the Annual Meeting of the Health Physics Society, Seattle, Washington, July 20-25, 1980.
Ke80a Kerr., G.D., "A Review of Organ Doses from Isotropic Fields of X-Rays", Health Phys., - 39 (1) :3, 1980.
Ki78a Killough, G.C., Dunning, D.E Jr., Bernard, S.R. and Pleasant, J.C., Estimates of Internal Dose Equivalent to 22 Target Organs for Radionuclides Occurring in Routine Releases from Nuclear Fuel Cycle Facilities, Vol. 1, Report No. ORNL/NUREG/TM-190, Oak Ridge National Laboratory, Tennessee, June 1978.
Ki78b Killough, G.C., and Rohwer, P. S., "A New Look at the Dosimetry of 14c Released to the Atmosphere as Carbon Dioxide", Health Phys., z ( 2 ) :141, 1978.
Ko81a Kocher, D.C., and Eckerrnan, K.F., "Electron Dose-Rate Conversion Factors for External Exposure of the Skin", Health Phys., - 40 (1) : 67, 1981.
Ko8lb Kocher, D.C., "Dose-Rate Conversion Factors for External Exposure to Photon and Electron Radiation from Radionuclides Occurring in Routine Releases from Nuclear Fuel-Cycle Facilities", Health Phys., - 38(4):543-621, 1981
NAS80 National Academy of Sciences - National Research Council, The Effects on Populations of Exposure to Low Levels of Ionizing Radiation, Report of the Committee on the Biological Effects of Ionizing Radiation (BEIR 111), Washington, D.C., 1980.
NCRP71National Council on Radiation Protection and Measurements, Basic Radiation Protection Criteria, NCRP Report No. 39, Washington, D.C., 1971.
Ne84 Nelson, C.B., and Yang, Y., An Estimation of the Daily Average Food Intake by Age and Sex for Use in Assessing the Radionuclide Intake of Individuals in the General Population, EPA 520/1-84-015, 1984.
NIH85 National Institutes of Health, Report of the National Institutes of Health Ad Hoc Working Group to Develop Radioepidemiological Tables, NIH Publication No. 85-2748, U.S. Government Printing Office, Washington, DC 20402, p 92, 1985.
ORNLElOak Ridge National Laboratory, Estimates of Health Risk from Exposure to Radioactive Pollutants, ORNL/RM-7745, Oak Ridge, Tenn., 1981.
ORNL850ak Ridge National Laboratory, "Report of Current Work of the Metabolism and Dosimetry Research Group", ORNL/TM- 9690, Oak Ridge, Tennessee, 1985.
Ph85 Phalen, R.F., Oldham, M.J., Beaucage, C.B., Crocker, T.T., and Mortensen, J.D., Postnatal Enlargement of Human Tracheobronchial Airways and Implications for Particle Deposition, Anat. Rec. 212: 368, 1985.
Ro58 Rosenberg, E., '%iologic Half-life of 1311 in the Thyroid of Healthy Males", J. Clin. Endocrinol. Metab., E, 516-521, 1958.
Sc82 Schwarz, G., and Dunning, Jr., D.E., Imprecision in Estimates of Dose from Ingested Cs-137 due to Variability in Human Biological Characteristics, Health Phys. - 8 43 631-645, 1982.
Sn74 Snyder W.S., Ford, M.R., Warner, G.G., and Watson, S.B., A Tabulation of Dose Equivalent per Microcurie-Day for Source and Target Organs of an Adult for Various Radionuclides, Oak Ridge National Laboratory, ORNL-5000, 1974.
. Sp73 Spoor, N.L., and Hursh, J.B., "Protection Criteria", Chapter 5 in Uranium, Plutonium and the Transplutonic Elements, Springer, New York, 1973.
Su81 Sullivan, R.E., Nelson, N.S., Ellett, W.H., Dunning, D.E. Jr., Leggett, R.W., Yalcintas, M.G. and Eckerman, K.F., Estimates of Health Risk from Exposure to Radioactive Pollutants, Report No. ORNL/TM-7745, Oak Ridge National Laboratory, Oak Ridge, Tennessee, 1981.
Th77 Thorne, M.D., "Aspects of the Dosimetry of Alpha-Emitting Radionuclides in Bone with Particular Emphasis on '"~a and 2 3 9 ~ ~ ~ ~ , Phys. Med. Biol., 22:36-46, 1977. -
Th78 Thurlbeck, W.M. "Miscellany", 287-315 in The Lung: Structure Function and Disease, Thurlbeck, W.M. and Abell, M.R., editors, The Williams and Wilkins Co., Baltimore, Maryland, 1978.
Tr66 Trubey, D.K., A Survey of Empirical Functions Used to Fit Gamma-Ray Buildup Factors, Oak Ridge National Laboratory Rep., ORNL-RSIC-10, 1966.
6. ESTIMATING THE RISK OF HEALTH EFFECTS RESULTING FROM EXPOSURE TO LOW LEVELS OF IONIZING RADIATION
6.1 INTRODUCTION
This c h a p t e r d e s c r i b e s how EPA e s t i m a t e s t h e r i s k of f a t a l cance r , s e r i o u s g e n e t i c e f f e c t s , and o t h e r d e t r i m e n t a l h e a l t h e f f e c t s caused by exposure t o low l e v e l s o f i o n i z i n g r a d i a t i o n .
I o n i z i n g r a d i a t i o n r e f e r s t o r a d i a t i o n t h a t s t r i p s e l e c t r o n s from atoms i n a medium through which it p a s s e s . The h igh ly r e a c t i v e e l e c t r o n s and i o n s c r e a t e d by t h i s p rocess i n a l i v i n g c e l l can produce, th rough a s e r i e s of chemical r e a c t i o n s , permanent changes (muta t ions ) i n t h e c e l l ' s g e n e t i c m a t e r i a l , t h e DNA. These may result i n c e l l dea th o r i n an abnormally f u n c t i o n i n g c e l l . A muta t ion i n a germ c e l l (sperm o r ovum) may be t r a n s m i t t e d t o a n o f f s p r i n g and be expressed a s a g e n e t i c d e f e c t i n t h a t o f f s p r i n g o r i n an i n d i v i d u a l of a subsequent gene ra t ion ; such a d e f e c t i s commonly r e f e r r e d t o a s a g e n e t i c e f f e c t . There i s a l s o s t r o n g ev idence t h a t t h e i n d u c t i o n of a muta t ion by i o n i z i n g r a d i a t i o n i n a non-germ (somat ic ) c e l l can s e r v e a s a s t e p i n t h e development of a cancer . F i n a l l y , m u t a t i o n a l o r o t h e r events , i n c l u d i n g p o s s i b l e c e l l k i l l i n g , produced by i o n i z i n g r a d i a t i o n i n r a p i d l y growing and d i f f e r e n t i a t i n g t i s s u e s of an embryo o r f e t u s can g i v e r i s e t o b i r t h d e f e c t s ; t h e s e a r e r e f e r r e d t o a s t e r a t o l o g i c a l e f f e c t s . A t a c u t e doses above about 2 5 r ads , r a d i a t i o n induces o t h e r d e l e t e r i o u s e f f e c t s i n man; however, f o r t h e low doses and dose r a t e s of i n t e r e s t i n t h i s document, on ly t h o s e t h r e e k inds of e f f e c t s r e f e r r e d t o above a r e thought t o be s i g n i f i c a n t .
Most impor tan t from t h e s t a n d p o i n t of t h e t o t a l s o c i e t a l r i s k from exposures t o low-level i o n i z i n g r a d i a t i o n a r e t h e r i s k s of cance r and g e n e t i c muta t ions . Cons i s t en t w i th ou r c u r r e n t unders tanding o f t h e i r o r i g i n s i n terms of DNA damage, t h e s e a r e b e l i e v e d t o be s t o c h a s t i c e f f e c t s ; i . e . , t h e p r o b a b i l i t y ( r i s k ) of t h e s e e f f e c t s i n c r e a s e s wi th t h e absorbed dose of r a d i a t i o n , b u t t h e s e v e r i t y of t h e e f f e c t s i s independent of dose . For n e i t h e r i n d u c t i o n of cance r nor g e n e t i c e f f e c t s , moreover, is t h e r e any convinc ing ev idence f o r a " th re sho ld , " i . e . , some dose l e v e l below which t h e r i s k i s ze ro . Hence, s o f a r a s i s known, any dose of i o n i z i n g r a d i a t i o n , no m a t t e r how smal l , might g i v e r i s e t o a cance r o r t o a g e n e t i c e f f e c t i n f u t u r e g e n e r a t i o n s . Conversely, t h e r e i s no way t o be c e r t a i n t h a t a g iven dose of r a d i a t i o n , no m a t t e r how l a r g e , has caused an observed cance r i n a n i n d i v i d u a l o r w i l l cause one i n t h e f u t u r e .
Beginning n e a r l y wi th t h e d i scove ry of x-rays i n 1895 b u t e s p e c i a l l y s i n c e World War 11, an enormous amount of r e s e a r c h h a s been conducted i n t o t h e b i o l o g i c a l e f f e c t s of i o n i z i n g r a d i a t i o n . Th i s r e s e a r c h con t inues a t t h e l e v e l of t h e molecule, t h e c e l l , t h e t i s s u e , t h e whole l a b o r a t o r y animal , and man. There a r e two fundamental a s p e c t s t o most of t h i s work:
1. Estimating the radiation dose to a target (cell, tissue, etc.) . This aspect (dosimetry), which may involve consideration of physiological, metabolic, and other factors, is discussed more fully in Chapter 5.
2. Measuring the number of effects of a given type associated with a certain dose (or exposure).
For the purpose of assessing the risk to man from exposures to ionizing radiation, the most important information comes from human epidemiological studies in which the number of health effects observed in an irradiated population is compared to that in an unirradiated control population. The human epidemiological data regarding radiation-induced cancer are extensive. As a result, the risk can be estimated to within an order of magnitude with a high degree of confidence. Perhaps for only one other carcinogen - tobacco smoke - is it possible to estimate risks more reliably.
Nevertheless, there are gaps in the human data on radiation risks. No clear-cut evidence of excess genetic effects has been found in irradiated human populations, for example, probably due to the limited numbers in the exposed cohort providing inadequate power to detect a dose-response. Likewise, no statistically significant excess of cancers has been demonstrated below about 5 rads, the dose
- range of interest from the standpoint of environmental exposures. Since the epidemiological data are incomplete in many respects, risk assessors must rely on mathematical models to estimate the risk from exposures to low-level ionizing radiation. The choice of models, of necessity, involves subjective judgments but should be based on all relevant sources of data collected by both laboratory scientists and epidemiologists. Thus, radiation risk assessment is a process that continues to evolve as new scientific information becomes available.
The EPA estimates of cancer and genetic risks used here are based largely on the results of a National Academy of Sciences (NAS) study as given in the BEIR I11 report (NAS80). The study assessed radiation risks at low exposure levels. As phrased by the President of the Academy, "We believe that the report will be helpful to the EPA and other agencies as they reassess radiation protection standards. It provides the scientific bases upon which standards may be decided after nonscientific social values have been taken into account."
In this discussion, the various assumptions made in calculating radiation risks based on the 1980 NAS report are outlined, and these risk estimates are compared with those prepared by other scientific groups, such as the 1972 NAS BEIR Committee (NAS72), the United Nations Scientific Committee on the Effects of Atomic Radiation
- (UNSCEAR77, 82), and the ICRP (ICRP77). Because information on radiation risks is incomplete, estimates of risk based on the various models may not be highly accurate. This discussion identifies some of the deficiencies in the available data base and points out possible sources of bias in current risk estimates.
Nevertheless, the risk estimates made by EPA are believed to be reasonable in light of current evidence.
Sections 6.2 to 6.2.8 consider the cancer risk resulting from whole-body exposure to low-LET (see Chapter 5) radiation, i.e., sparsely ionizing radiation like the energetic electrons produced by x-rays or gamma rays. Environmental contamination by radioactive materials also leads to the ingestion or inhalation of the material and subsequent concentration of the radioactivity in selected body organs. Therefore, the cancer risk resulting from low-LET irradiation of specific organs is examined in Sections 6.2.9 to 6.2.11.
Organ doses can also result from high-LET radiation, such as that associated with alpha particles. The cancer risks when high- LET radiation is distributed more or less uniformly within a body organ is the third situation considered (Section 6.3). Because densely ionizing alpha particles have a very short range in tissue, there are exposure situations where the dose distribution to particular organs is extremely nonuniform. An example is the case of inhaled radon progeny, Po-218, Pb-214, and Po-214. For these radionuclides, cancer risk estimates are based on the amount of radon progeny inhaled rather than the estimated dose, which is highly nonuniform and cannot be well quantified. Therefore, risk estimates of radon exposure are examined separately (Section 6.4).
In Section 6.5, the causes of uncertainty in the cancer risk estimates and the magnitude of this uncertainty are reviewed so that both the public and EPA decision makers have a proper understanding of the degree of confidence to place in them. In Section 6.6 reviews and quantifies the risk of deleterious genetic effects from radiation and the effects of exposure in utero on the developing fetus. Finally, in Section 6.7, cancer and genetic risks from background radiation are calculated using the models described in this chapter.
6.2 CANCER RISK ESTIMATES FOR LOW-LET RADIATION
Most of the observations of radiation-induced carcinogenesis in humans are of groups exposed to low-LET radiations. These groups include the Japanese A-bomb survivors and medical patients treated with diagnostic or therapeutic radiation, most notably for ankylosing spondylitis in England from 1935 to 1954 (Sm78). Comprehensive reviews of these and other data on the carcinogenic effects of human exposures are available (UNSCEAR77, NAS80).
The most important source of epidemiological data on radiogenic cancer is the population of Japanese A-bomb survivors. The A-bomb survivors have been studied for more than 38 years, and most of them (the Life Span Study Sample) have been followed since 1950 in a carefully planned and monitored epidemiological survey (Ka82, Wa83). They are the largest group that has been studied, and they provide the most detailed information on the response pattern for organs by
age and sex over a wide range of doses of low-LET radiation. Unfortunately, the 1980 BEIR Committee's analysis of the A-bomb survivor data collected up to 1974 was prepared before bias in the dose estimates for the survivors (the tentative 1965 dose estimates, T65) became widely recognized (Lo81). It is now clear that the T65 dose equivalents to organs tended, on average, to be overestimated (Bo82, RERF83,84) so that the BEIR Committee's estimates of the risk per unit dose are likely to be too low. A new dosimetry system, termed the Dosimetry System 1986 (DS86), is now nearly complete, and preliminary analyses of the risk based on DS86 have been published (Pr87,88; Sh87) .
At present, the "BEIR V Committee" of the National Academy of Sciences is preparing a report on radiation risks in light of DS86 and other new information. A detailed reevaluation of EPA's current risk estimates is indicated when this report is issued, probably in early 1989. A brief discussion of the new dosimetry and its likely effect on risk estimates is included in Section 6.5.2.
Uncertainties in radiation risk estimates do not result just from the uncertainties about the Japanese and other epidemiological studies. As discussed below, risk projections based on these studies require certain assumptions (e.g., with regard to low-dose extrapolation). The degree of uncertainty associated with these assumptions is probably greater than the uncertainty of the estimated risk per unit dose among the A-bomb survivors or other sources of risk estimates for radiogenic cancer in humans.
6.2.1 Assumptions Needed to Make Risk Estimates
A number of assumptions must be made on how to extrapolate observations made at high doses to estimate effects from low doses and low-dose rates. Excess cancers have been observed, for the most part, only following doses of ionizing radiation that are relatively high when compared to those likely to occur as a result of the combination of background radiation and environmental contamination from controllable sources of radiation. Therefore, a dose response model must be chosen to allow extrapolation from the number of radiogenic cancers observed at high doses to the number of cancers at low doses resulting from all causes including background radiation.
The range of extrapolation is not the same for all kinds of cancer because it depends upon the radiosensitivity of a particular tissue. For example, the most probable radiogenic cancer for women is breast cancer. As described below, the incidence of radiogenic breast cancer does not seem to diminish when the dose is protracted over a long period of time. For example, the number of excess cancers per unit dose among Japanese women, who received acute doses, is about the same per unit dose as women exposed to small periodic doses of x-rays over many years. If this is actually the case, background radiation is as carcinogenic per unit dose for breast tissue as the acute exposures from A-bomb gamma radiation.
Moreover, the female A-bomb survivors show an excess of breast cancer at doses below 20 rads which is linearly proportional to that observed at several hundred rads (To84). (Evidence of a nonlinear dose response relationship for induction of breast cancer has been obtained in a study of Canadian fluoroscopy patients, but only at doses above about 500 rads [Hoe41 . ) Women in their 401s, the youngest age group in which breast cancer is common, have received about 4 rads of whole-body low-LET background radiation and usually some additional dose incurred for diagnostic medical purposes. Therefore, for this cancer, the difference between the lowest dose at which radiogenic cancers are observed, less than 20 rads, and the dose resulting from background radiation is less than a factor of 5, not several orders of magnitude as is sometimes claimed. Based on data from irradiated tinea capitis patients, induction of thyroid cancer also seems to be linear with doses down to 10 rads or lower (NCRP85). However, for most other cancers, a statistically significant excess has not been observed at doses below 50 rads of low-LET radiation. Therefore, the range of dose and dose rate extrapolation is often large.
6.2.2 Dose Response Functions
The 1980 NAS report (NAS80) examined only three dose response functions in detail: (1) linear, in which the number of effects (risk) is directly proportional to dose at all doses; (2) linear- quadratic, in which risk is very nearly proportional to dose at very low doses and proportional to the square of the dose at high doses; and (3) quadratic, where the risk varies as the square of the dose at all dose levels.
The first two of these functions are compatible with most of the data on human cancer. Information that became available only after the BEIR I11 report was published indicates that a quadratic response function is inconsistent with the observed excess risk of solid cancers at Nagasaki, where the estimated gamma-ray doses are not seriously confounded by an assumed neutron dose component. The chance that a quadratic response function underlies the excess cancer observed in the Nagasaki incidence data has been reported as only 1 in 10,000 (Wa83) .
Although a quadratic response function is not incompatible with the Life Span Study Sample data on leukemia incidence at Nagasaki, Beebe and others (Be78, E177) have pointed out how unrepresentative these data are of the total observed dose response for leukemia in that city. There is no evidence that a quadratic response function provides a better fit to the observed leukemia excess among all A- bomb survivors in the Life Span Study Sample than a simple linear model (NAS80). Based on these considerations, for the purposes of this rulemaking, a quadratic response cannot be used to estimate cancer risks due to ionizing radiation.
The 1980 NAS HEIR Committee considered only the Japanese mortality data in its analysis of possible dose response functions (NAS80). Based on the T65 dose estimates, this Committee concluded that the excess mortality from solid cancers and leukemia among the A-bomb survivors is compatible with either a linear or linear- quadratic dose response to the low-LET radiation component and a linear response to the high-LET neutron component (NAS80). Although the 1980 BEIR report indicated risk estimates for low-LET radiation based on a linear-quadratic response were "preferred" by most of the scientists who prepared that report, opinion was not unanimous, and the subsequent reassessment of the A-bomb dose seriously weakens the Committee's conclusion. The Committee's analysis of dose response functions was based on the assumption that most of the observed excess leukemia and solid cancers among survivors in Hiroshima resulted from neutrons (see Tables V-13, A-7, Equations V-10, V-11 in NAS80). Current evidence, however, is conclusive that neutrons were only a minor component of the dose among all but a few survivors in both Hiroshima and Nagasaki (Bo82; RERF83, 84; Pr87; Sh87). Therefore, it is likely that most of the response attributed to neutrons was caused by the gamma dose, not the dose from neutrons. This point is discussed further in Section 6.3.
The revised dosimetry will involve changes in individual absorbed doses that vary with distance from the explosion in each of the two cities and with shielding characteristics. As a consequence, though it seems clear that there will generally be a higher response per unit dose, there will also be an unpredictable change in the shape of the dose response exhibited by the data. Reanalysis of the Japanese experience after completion of the dose reassessment may then provide more definitive information on the dose response of the A-bomb survivors; nevertheless, it is unlikely to produce a consensus on the dose response at environmental levels, i.e., about 100 mrad/yr. This is because at low enough doses, there will always be sampling variations in the observed risks so that observations are compatible, in a statistical sense, with a variety of dose response functions. In the absence of empirical evidence or a strong theoretical basis, a choice between dose response functions must be based on other considerations.
Although there is evidence for a nonlinear response to low-LET radiations in some, but not all, studies of animal radiocarcinogenesis (see below), no data on human cancers that are incompatible with the linear model are known. In such a case, it may be preferable to adopt the simplest hypothesis that adequately models the observed radiation effect. Moreover, EPA believes that risk estimates, for the purpose of assessing radiation impacts on public health, should be based on scientifically credible risk models that are unlikely to understate the risk. The linear model fulfills this criterion. Given the current bias in the doses assigned to A-bomb survivors (see Section 6.5.1), such an approach seems reasonable as well as prudent. Therefore, EPA has primarily used the BEIR I11 linear dose response model for estimating the risk of radiogenic cancer due to low-LET radiations.

For low-LET radiations, the BEIR 111 Committee preferred the linear-quadratic dose response model. In this model, the risk from an acute dose, D, of low-LET radiation is assumed to be of the form aD + P D ~ . The BEIR 111 Committee assumed that the linear and quadratic terms were equal at 116 rads, leading to a linear coefficient a, which was a factor of 2.5 times lower than the coefficient obtained from the linear model (NAS80). At low doses, the quadratic term becomes negligible; at chronic low-dose rates it is ignored, for reasons discussed below. For environmental exposures, therefore, risk estimates based on the BEIR 111 linear- quadratic dose response model are only 40 percent of those based on the BEIR 111 linear model.
A theoretical basis for the linear-quadratic dose response model has been put forth by Kellerer and Rossi (Ke72). In this theory of "dual radiation action," events leading to "lesions" (i.e., permanent changes) in cellular DNA require the formation of interacting pairs of "sublesions." The interacting pairs can be produced by a single traversing particle, or track, or by two separate tracks, giving rise, respectively, to a linear and quadratic term in the dose response relationship. According to the theory, a sublesion may be repaired before it can interact to form a lesion, the probability of such repair increasing with time. Consequently, as dose rate is reduced, the formation of lesions from sublesions caused by separate tracks becomes less important, and the magnitude of the D' term diminishes. Hence, the theory predicts that at sufficiently low doses or dose rates, the response should be a linear function of dose. Moreover, the constant of proportionality is the same in both cases; i.e., a.
Results of many animal experiments are qualitatively consistent with the theory: low-LET radiation often seems to have a reduced effectiveness per unit dose at low dose rates (NCRP80). However, it is usually not possible from the data to verify that the dose response curve has the linear-quadratic form. Another success of the dual action theory has been in explaining observed differences between the effects of low-LET and high-LET radiations. In this view, the densely ionizing nature of the latter results in a much greater production of interacting pairs of sublesions by single tracks, leading in turn to higher relative biological effectiveness at low doses and a linear dose response relationship for high-LET radiation (except for possible cell-killing effects).
The dual action theory has nevertheless been challenged on experimental grounds, and observed variations in response with dose, dose rate (see below), and LET can also be explained in terms of a theory involving only single lesions and a "saturable" repair mechanism that decreases in effectiveness at high dose rates on the microscopic scale (Go82). One property of such a theory is that the effectiveness of repair, and therefore the shape of the dose response curve, can in principle vary substantially with cell type
1980 NAS report. Table 6-1, taken from Table V-25 (NAS80), shows the range of cancer fatalities that are induced by a single lo-rad dose as estimated using linear, linear-quadratic, and quadratic dose response functions and two projection models, relative and absolute risk (NAS80) .
As illustrated in Table 6-1, estimating the cancer risk for a given projection model on the basis of a quadratic as compared to a linear dose response reduces the estimated risk of fatal cancer by a factor of about 18. Between the more credible linear and linear- quadratic response functions, the difference is less, a factor of about 2.2. For a given dose response model, results obtained with the two projection models for solid cancers differ by about a factor of 3.
Differences in the estimated cancer risk introduced by the choice of the risk projection model are also appreciable. As pointed out above, the 1980 NAS analysis indicates that relative lifetime risk estimates exceed absolute risk estimates by about a factor of 3 (see Table 6-1). However, relative risk estimates are quite sensitive to how the risk resulting from exposure during childhood persists throughout life. This question is addressed in the next section, where risk estimates made by the 1972 and 1980 NAS BEIR Committees are compared with those of the ICRP and UNSCEAR.
6.2.6 Comparison of Cancer Risk Estimates for Low-LET Radiation
Estimates of the risk of fatal cancer following lifetime exposure are compared in Table 6-2. The BEIR I and BEIR I11 values were calculated for this table using risk model data from NAS72 and NAS80. The BEIR I11 values in this table differ slightly from those in NAS80 and Table 6-1 because of some minor calculational corrections including revised age-specific mortality data. Differences between the various estimates in Table 6-1 mainly reflect differences in assumptions regarding extrapolation to low doses and low dose rates and regarding the dependence of risk on age and time.
The NAS BEIR estimates are for lifetime exposure and lifetime expression of induced cancers (NAS72, NAS80). Neither the age distribution of the population at risk nor the projection models (if any) have been specified by the UNSCEAR (UNSCEAR77) or the ICRP (ICRP77). UNSCEAR apparently presumes the same age distributions as in the epidemiological studies it cited, mainly the A-bomb survivors, and a 40-year period of cancer expression. The ICRP risk estimates are for adult workers, presumably exposed between ages 18 and 65, and a similar expression period. These are essentially age- independent absolute risk models with less than lifetime expression
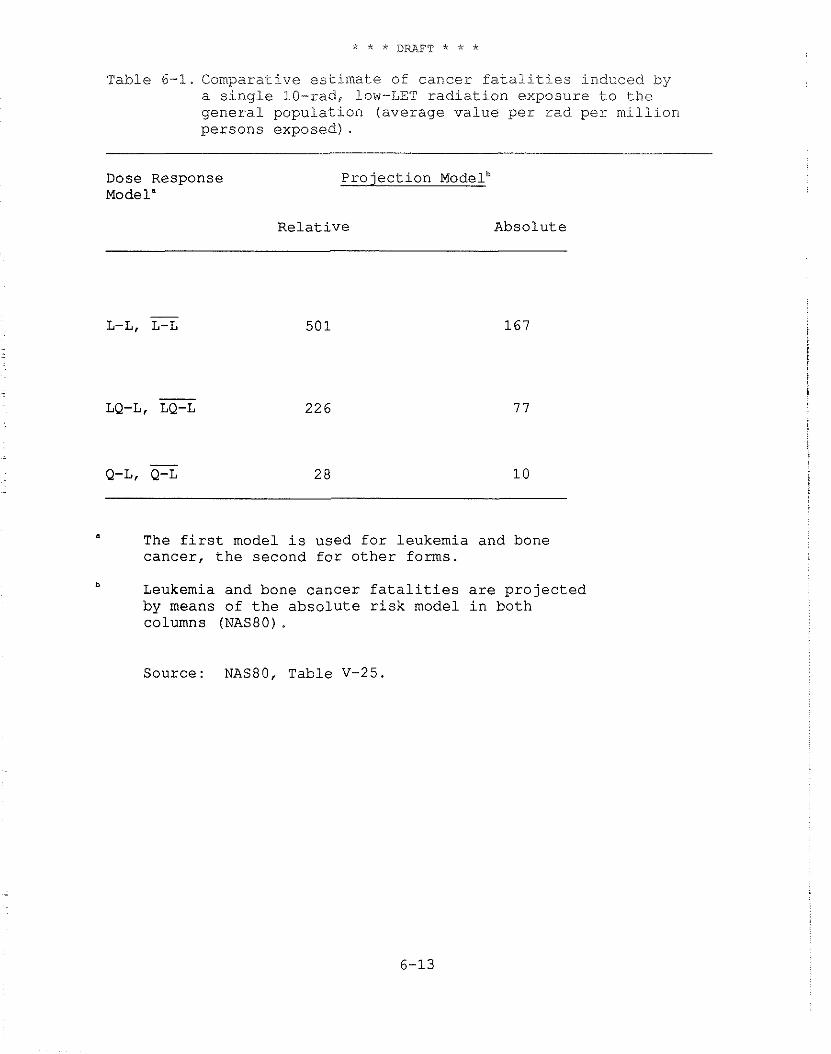
Table 6-1. Comparative estimate of cancer fatalities induced by a single 10-rad, low-LET radiation exposure to the general population (average value per rad per million persons exposed) .
Dose Response Projection Modelb Model"
Relative Absolute
- L-L, L-L 501
- LQ-L, LQ-L 226
- Q-L, Q-L 2 8
a The first model is used for leukemia and bone cancer, the second for other forms.
b Leukemia and bone cancer fatalities are projected by means of the absolute risk model in both columns (NAS80).
Source: NAS80, Table V-25.
increase in solid cancers that has occurred among irradiated populations (Xa82).
To project the number of fatalities resulting from leukemia and bone cancer, EPA uses an absolute risk model, a minimum induction period of 2 years, and a 25-year expression period. To estimate the number of fatalities resulting from other cancers, EPA has used a relative risk projection model (EPA84), a 10-year minimum induction period, and the remaining balance of an exposed person's lifetime as the expression period.
6.2.8 Methodology for Assessing the Risk of Radiogenic Cancer
EPA uses a life table analysis to estimate the number of fatal radiogenic cancers in an exposed population of 100,000 persons. This analysis considers not only death due to radiogenic cancer, but also the probabilities of other competing causes of death which are, of course, much larger and vary considerably with age (Bu81, Co78). Basically, it calculates for ages 0 to 110 the risk of death due to all causes by applying the 1970 mortality data from the National Center for Health Statistics (NCHS75) to a cohort of 100,000 persons. Additional details of the life table analysis are provided in Appendix B. It should be noted that a life table analysis is required to use the age-dependent risk coefficients in the BEIR 111 report. For relative risk estimates, EPA has used age-specific cancer mortality data also provided by NCHS (NCHS73). The EPA computer program used for the life table analysis was furnished to the NAS BEIR 111 Committee by EPA and used by the Committee to prepare its risk estimates. Therefore, the population base and calculations should be essentially the same in both the NAS and EPA analyses.
Both absolute and relative risk models have been considered to project the observed risks of most solid radiogenic cancers beyond the period of current observation. As indicated in Table 6-2, the range of estimated fatal cancers resulting from the choice of a particular projection model and its internal assumptions is about a factor of 3. Although the relative risk model has been tested in some detail only for lung and breast cancer (La78), based on current evidence, it appears to be the better projection model for solid cancers. Therefore, it has been adopted for risk estimates in this report. Previously, EPA used an average of the risks calculated by the absolute and relative risk projection models (EPA84).
To estimate the cancer risk from low-LET, whole-body, lifetime wosure, the analysis uses relative risk projections (the BEIR I11 L-L model) for solid cancers and the absolute risk projection for leukemia and bone cancer (the BEIR TI1 L-L model). Since the expression period for leukemia and bone cancer is less than the follow-up period, the same risk values would be calculated for these
cance r s u s ing e i t h e r p r o j e c t i o n method. For a dose t o t h e whole body, t h i s procedure y i e l d s about 400 f a t a l i t i e s p e r m i l l i o n person- r a d ( f o r t h e B E I R 111 l i n e a r - q u a d r a t i c model, a low-LET whole-body dose would y i e l d an e s t i m a t e d l i f e t i m e r i s k of about 160 f a t a l i t i e s p e r m i l l i o n pe r son- rad ) .
B E I R I11 a l s o p r e s e n t e d e s t i m a t e s of excess s o f t t i s s u e cancer i nc idence r i s k c o e f f i c i e n t s f o r s p e c i f i c s i t e s , a s a f u n c t i o n of age a t exposure, i n i t s Table V-14 . By summing t h e s i t e - s p e c i f i c r i s k s , i t t h e n a r r i v e d a t an e s t i m a t e f o r t h e whole-body r i s k of cance r i nc idence ( o t h e r t h a n leukemia and bone cance r ) a s g iven i n Table V- 30. F i n a l l y , by us ing t h e weighted i n c i d e n c e / m o r t a l i t y r a t i o s g iven i n Table V-15 of t h e same r e p o r t (NAS80), t h e r e s u l t s i n Table V-30 can be expressed i n terms of m o r t a l i t y t o y i e l d ( f o r l i f e t i m e exposure) a r i s k e s t i m a t e of about 242 and 776 cancer f a t a l i t i e s p e r 1 0 ' person-rad, depending on whether an a b s o l u t e o r a r e l a t i v e r i s k p r o j e c t i o n model, r e s p e c t i v e l y , i s used t o e s t i m a t e l i f e t i m e r i s k . These v a l u e s - a r e about 1 . 7 and 2 . 1 t imes t h e i r c o u n t e r p a r t s f o r t h e BEIR I11 L-L model and 4.2 and 5 . 2 t imes t h e LQ-L v a l u e s . These models a l l presume a uniform dose t o a l l t i s s u e s a t r i s k i n t h e body. I n p r a c t i c e , such uniform whole-body exposures seldom occur , p a r t i c u l a r l y f o r i n g e s t e d o r i n h a l e d r a d i o a c t i v i t y . The next s e c t i o n d e s c r i b e s how t h i s r i s k e s t i m a t e i s appor t ioned f o r whole- body exposure when c o n s i d e r i n g t h e r i s k s fo l lowing t h e exposure o f s p e c i f i c o rgans .
6 . 2 . 9 Organ R i s k s
For most sou rces of environmental contaminat ion, i n h a l a t i o n and i n g e s t i o n of r a d i o a c t i v i t y a r e more common than e x t e r n a l exposure. I n many cases , depending on t h e chemical and p h y s i c a l c h a r a c t e r i s t i c s of t h e r a d i o a c t i v e m a t e r i a l , i n h a l a t i o n and i n g e s t i o n r e s u l t i n a nonuniform d i s t r i b u t i o n o f r a d i o a c t i v e m a t e r i a l s w i t h i n t h e body s o t h a t some organ systems r e c e i v e much h ighe r doses t h a n o t h e r s . For example, s i n c e i o d i n e i s o t o p e s c o n c e n t r a t e p r e f e r e n t i a l l y i n t h e t h y r o i d g land , t h e dose t o t h i s organ can be o r d e r s of magnitude l a r g e r t h a n t h e average dose t o t h e body.
To determine t h e p r o b a b i l i t y t h a t f a t a l cance r occur s a t a p a r t i c u l a r s i t e , EPA has performed l i f e t a b l e a n a l y s e s f o r each cancer t y p e u s i n g t h e informat ion on cance r i nc idence and m o r t a l i t y i n NAS80. NAS80 pub l i shed inc idence r i s k c o e f f i c i e n t s (NAS80 Table V - 1 4 ) and m o r t a l i t y t o inc idence r a t i o s (NAS80 Table V-15). The d a t a i n Tables 6-3 and 6-4 a r e from t h e s e t a b l e s wi th t h e excep t ion of t h e m o r t a l i t y t o inc idence r a t i o s f o r t h y r o i d and lung cance r . S ince n o t a l l forms of t h y r o i d cancer can be induced by r a d i a t i o n and s i n c e , f o r t h o s e t h a t are, a more r easonab le m o r t a l i t y t o inc idence r a t i o would be 0 . 1 (NRC85), EPA has used t h a t va lue i n i t s c a l c u l a t i o n s . Lung cancer i nc idence and m o r t a l i t y have both shown
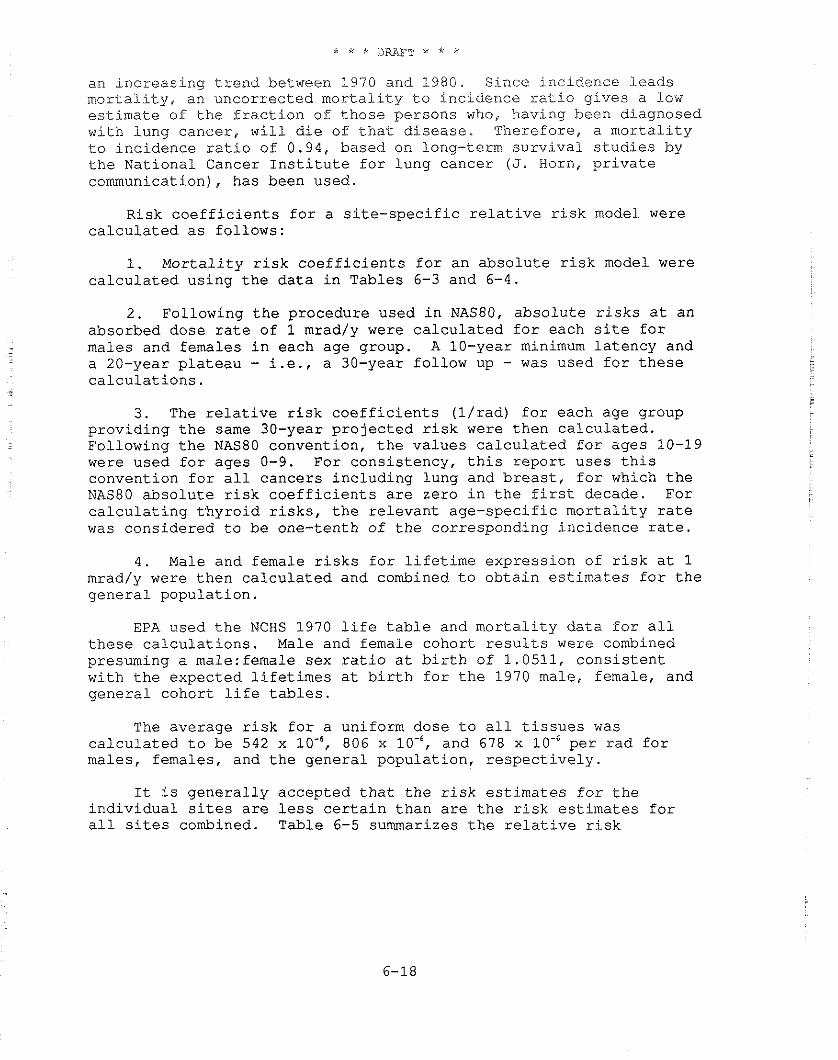
an increasing trend between 1970 and 1980. Since incidence leads mortality, an uncorrected mortality to incidence ratio gives a low estimate of the fraction of those persons who, having been diagnosed with lung cancer, will die of that disease. Therefore, a mortality to incidence ratio of 0.94, based on long-term survival studies by the National Cancer Institute for lung cancer (J. Horn, private communication), has been used.
Risk coefficients for a site-specific relative risk model were calculated as follows:
1. Mortality risk coefficients for an absolute risk model were calculated using the data in Tables 6-3 and 6-4.
2. Following the procedure used in NAS80, absolute risks at an absorbed dose rate of 1 mrad/y were calculated for each site for males and females in each age group. A 10-year minimum latency and a 20-year plateau - i.e., a 30-year follow up - was used for these calculations.
3. The relative risk coefficients (l/rad) for each age group providing the same 30-year projected risk were then calculated. Following the NAS80 convention, the values calculated for ages 10-19 were used for ages 0-9. For consistency, this report uses this convention for all cancers including lung and breast, for which the
- NAS80 absolute risk coefficients are zero in the first decade. For calculating thyroid risks, the relevant age-specific mortality rate was considered to be one-tenth of the corresponding incidence rate.
4. Male and female risks for lifetime expression of risk at 1 mrad/y were then calculated and combined to obtain estimates for the general population.
EPA used the NCHS 1970 life table and mortality data for all these calculations. Male and female cohort results were combined presuming a ma1e:female sex ratio at birth of 1.0511, consistent with the expected lifetimes at birth for the 1970 male, female, and general cohort life tables.
The average risk for a uniform dose to all tissues was calculated to be 542 x 806 x and 678 x per rad for males, females, and the general population, respectively.
It is generally accepted that the risk estimates for the individual sites are less certain than are the risk estimates for all sites combined. Table 6-5 summarizes the relative risk
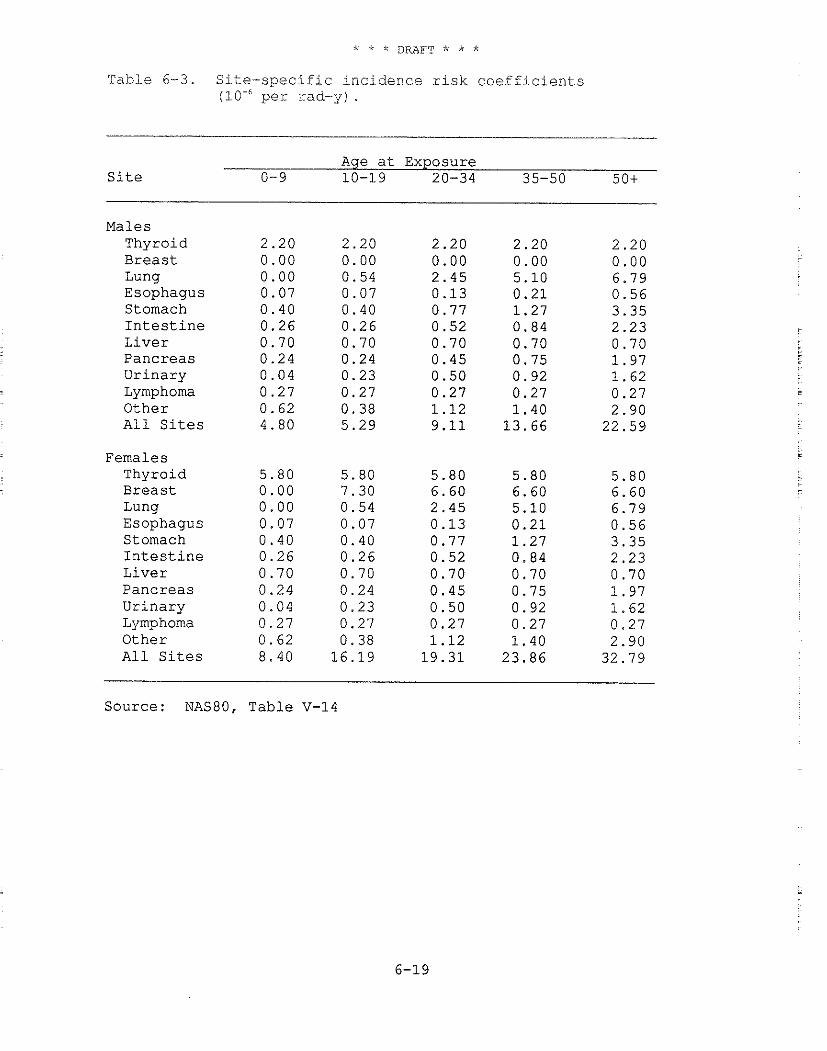
Table 6-3. S i t e - s p e c i f i c i n c i d e n c e r i s k c o e f f i c i e n t s p e r rad-y) .
Age a t Exposure S i t e 0-9 10-19 20-34 35-50 50+
Males Thyroid Breas t Lung Esophagus Stomach I n t e s t i n e L i v e r Pancreas Ur inary Lymphoma Other All S i t e s
Females Thyroid Breast Lung Esophagus Stomach I n t e s t i n e L ive r Pancreas Ur inary Lymphoma Other All S i t e s
Source: NAS80, Table V-14
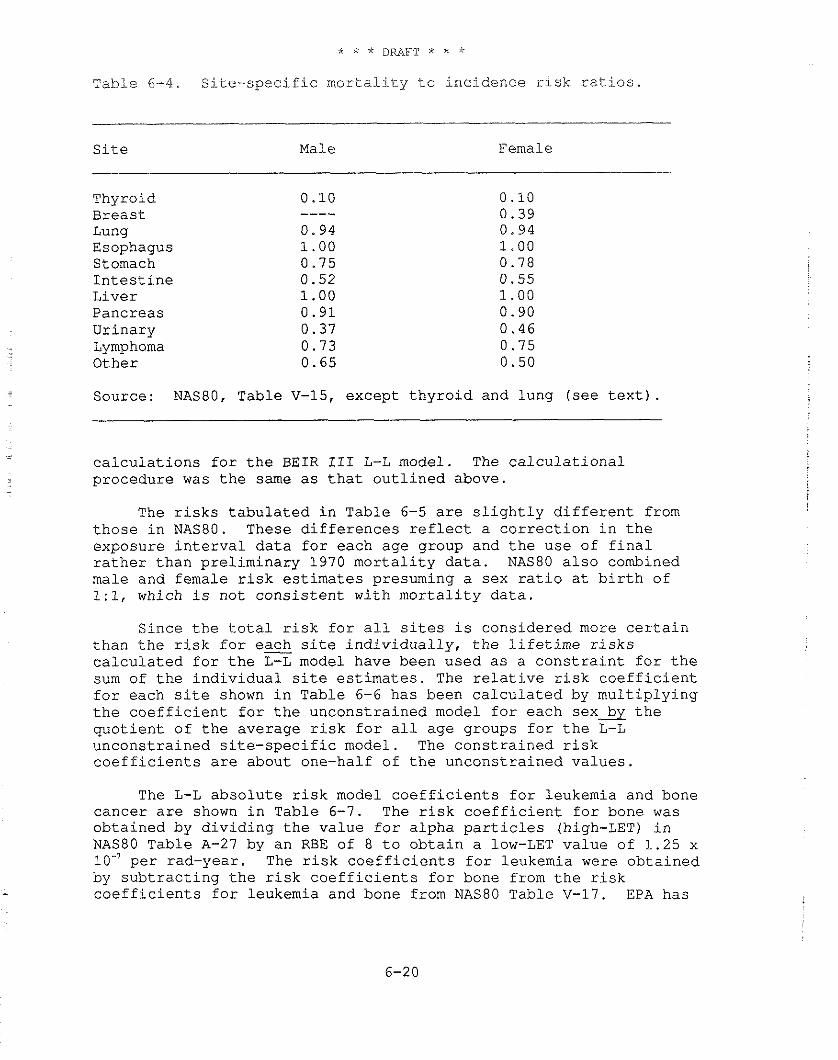
Table 6-4. Site-specific mortality to incidence risk ratios.
Site Male Female
Thyroid Breast Lung Esophagus Stomach Intestine Liver Pancreas Urinary Lymphoma Other
Source: NASBO, Table V-15, except thyroid and lung (see text) .
calculations for the BEIR 111 L-L model. The calculational procedure was the same as that outlined above.
The risks tabulated in Table 6-5 are slightly different from those in NAS80. These differences reflect a correction in the exposure interval data for each age group and the use of final rather than preliminary 1970 mortality data. NAS80 also combined male and female risk estimates presuming a sex ratio at birth of 1:1, which is not consistent with mortality data.
Since the total risk for all sites is considered more certain than the risk for each site individually, the lifetime risks calculated for the L-L model have been used as a constraint for the sum of the individual site estimates. The relative risk coefficient for each site shown in Table 6-6 has been calculated by multiplying the coefficient for the unconstrained model for each sex* the quotient of the average risk for all age groups for the L-L unconstrained site-specific model. The constrained risk coefficients are about one-half of the unconstrained values.
The L-L absolute risk model coefficients for leukemia and bone cancer are shown in Table 6-7. The risk coefficient for bone was obtained by dividing the value for alpha particles (high-LET) in NAS80 Table A-27 by an RBE of 8 to obtain a low-LET value of 1.25 x 10" per rad-year. The risk coefficients for leukemia were obtained by subtracting the risk coefficients for bone from the risk coefficients for leukemia and bone from NAS80 Table V-17. EPA has

fol lowed t h e BEIR 111 Commit teeb p r a c t i c e of u s ing t h e a b s o l u t e r i s k model p r o j e c t i o n s f o r Leukemia and bone cancer w i th t h e r e l a t i v e r i s k p r o j e c t i o n f o r a l l o t h e r cance r s . S ince t h e expres s ion p e r i o d f o r leukemia and bone cance r i s 2 7 yea r s , t h e r e i s no d i f f e r e n c e between t h e number of cance r s p r o j e c t e d f o r a 30-year and a l i f e t i m e follow-up p e r i o d .
Table 6-8 shows t h e average m o r t a l i t y r i s k s p e r u n i t absorbed dose f o r t h e combined leukemia/bone and c o n s t r a i n e d r e l a t i v e r i s k models. The r i s k , i n g e n e r a l , dec reases wi th i n c r e a s i n g age a t exposure. For a c o n s t a n t , uniform absorbed dose r a t e t o a l l o rgans and t i s s u e s , about 60 pe rcen t of t h e r i s k i s confe r r ed by t h e exposures i n t h e f irst 20 y e a r s of l i f e .
The m o r t a l i t y t o inc idence r a t i o s i n Table 6-4 were used t o conver t t h e m o r t a l i t y r i s k e s t i m a t e s i n Table 6-8 t o inc idence r i s k e s t i m a t e s . For leukemia and bone cancer , t h e inc idence r i s k s a r e cons idered t o be equa l a s i n NAS80. The r e s u l t a n t i nc idence r i s k s a r e shown i n Table 6-9.
Table 6-10 summarizes t h e low LET cance r m o r t a l i t y r i s k p e r u n i t dose f o r a uniform, l i f e t i m e dose t o each s i t e i n Table 6-8. S ince s i t e - s p e c i f i c dose f a c t o r s f o r e s t i m a t i n g r i s k of esophageal cancer and lymphoma a r e not a v a i l a b l e , t h e s e r i s k s a r e added t o t h o s e a l r e a d y i n t h e ca t egory " o t h e r . " The p r o p o r t i o n a l r i s k column shows t h e f r a c t i o n of t h e t o t a l r i s k a s s o c i a t e d w i t h each s i t e when a l l organs and t i s s u e s a r e uniformly i r r a d i a t e d .
6 .2 .10 Thyroid Cancer from Iodine-131 and Iodine-129
Iodine-131 has been r e p o r t e d t o be only one-tenth a s e f f e c t i v e a s x-rays o r gamma r a y s i n inducing t h y r o i d cance r (NAS72, NCRP77, NCRP85). B E I R 111 r e p o r t e d e s t i m a t e s of f a c t o r s of 10-80 t imes r e d u c t i o n f o r 1-131 compared t o x-rays and noted t h e e s t i m a t e s were d e r i v e d p r i m a r i l y from animal experiments (NAS80). However, one s tudy i n r a t s r e p o r t e d t h a t 1-131 was j u s t a s e f f e c t i v e a s x-rays i n inducing t h y r o i d cancer , l e a d i n g an NRC review group t o s e l e c t one- t h i r d a s t h e minimum r a t i o of 1-131 t o x-ray e f f e c t s t h a t i s compatible wi th both o l d and new d a t a (NRC85).
I t would be prudent t o use t h i s f a c t o r u n t i l f u r t h e r i n fo rma t ion from animal s t u d i e s o r some human d a t a a r e developed. I n t h i s document, EPA h a s employed a t h y r o i d cance r r i s k c o e f f i c i e n t f o r i n t e r n a l exposures t o 1-131 and 1-129 which i s one - th i rd t h a t used f o r gamma r a y s o r b e t a r a d i a t i o n s from o t h e r r a d i o n u c l i d e s .
6 . 2 . 1 1 Cancer R i s k s f o r a Constant I n t a k e Rate
The f a t a l cancer r i s k s shown i n t h e t a b l e s of t h i s c h a p t e r presume a l i f e t i m e exposure a t a c o n s t a n t dose r a t e . Even f o r a
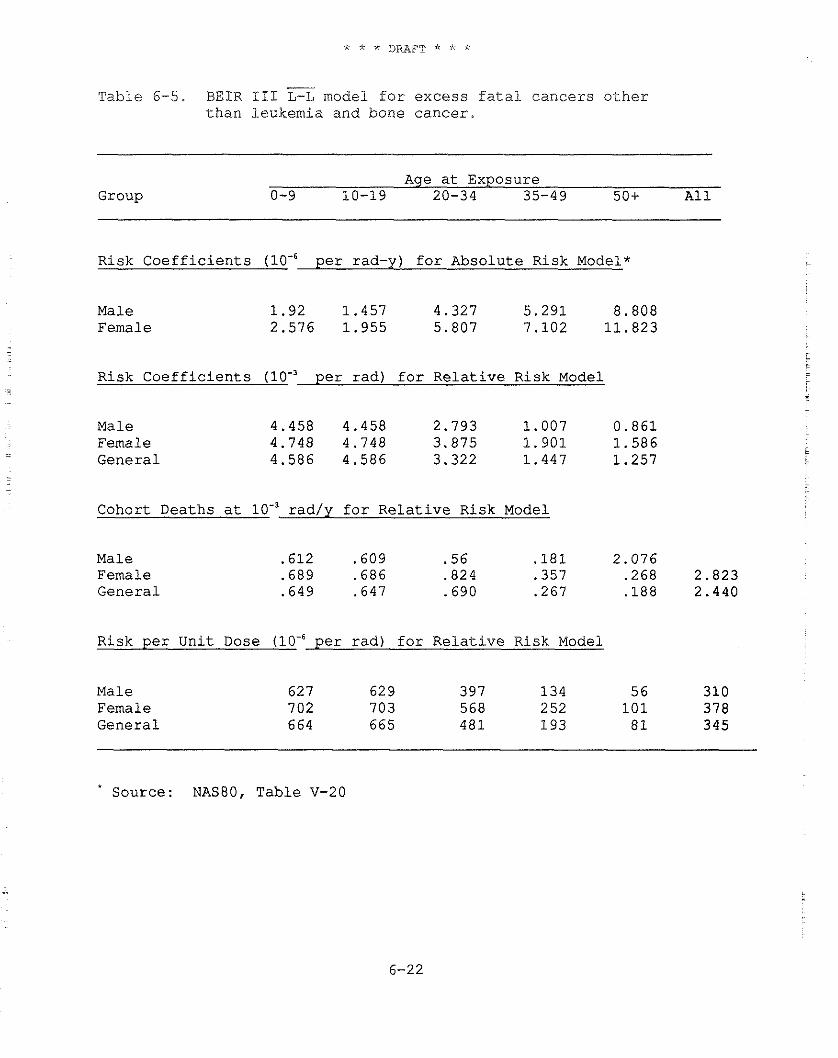
- T a b l e 6-5. BEIR 111 L-L model f o r e x c e s s f a t a l c a n c e r s o t h e r
t h a n l e u k e m i a a n d bone c a n c e r .
Age a t Exposure Group 0-9 10-19 20-34 35-49 50+ A 1 1
R i s k C o e f f i c i e n t s p e r rad-y) f o r A b s o l u t e R i s k Model*
Male 1 . 9 2 1 . 4 5 7 4 .327 5 . 2 9 1 8 .808 Female 2 .576 1 . 9 5 5 5 .807 7 .102 1 1 . 8 2 3
R i s k C o e f f i c i e n t s per r a d ) f o r R e l a t i v e R i s k Model
Male Female G e n e r a l
C o h o r t D e a t h s a t lo-' r a d / y f o r R e l a t i v e R i s k Model
Male Female G e n e r a l
R i s k p e r U n i t Dose per r a d ) f o r R e l a t i v e R i s k Model
Male Female G e n e r a l
S o u r c e : NAS80, T a b l e V-20
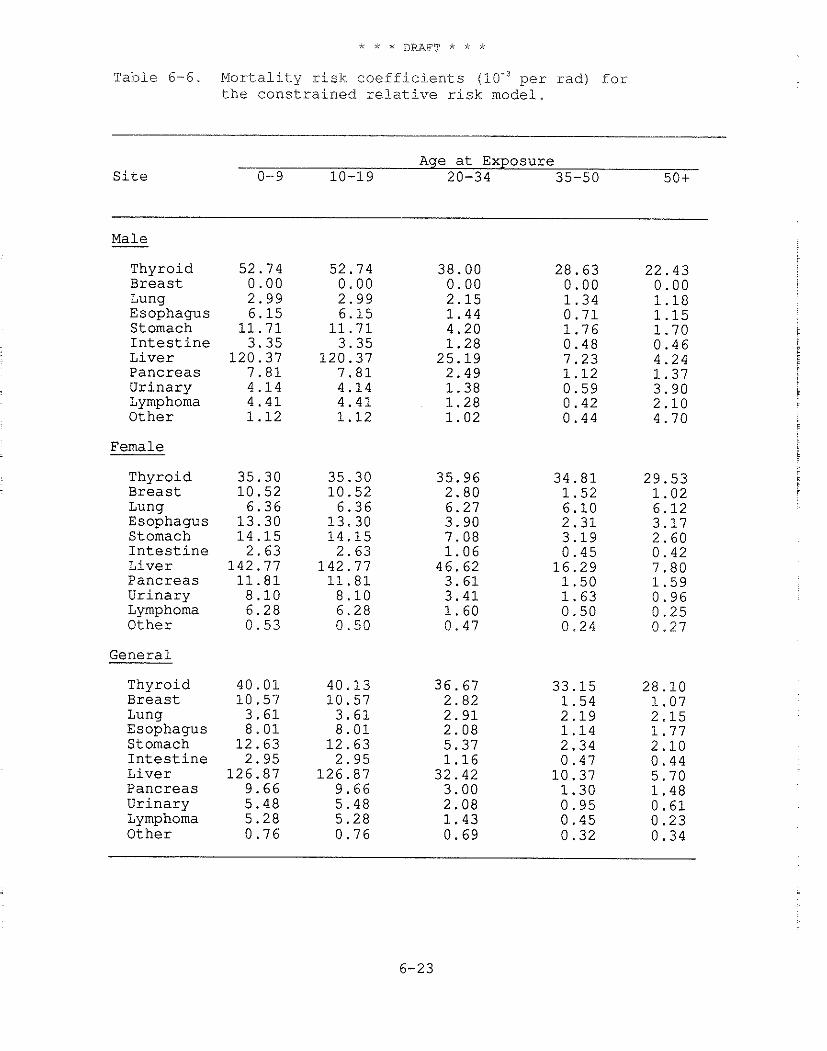
Table 6-6. Mortality risk coefficients per rad) for the constrained relative risk model.
Age at Exposure Site 0-9 10-19 20-34 35-50 501
Male -
Thyroid Breast Lung Esophagus Stomach Intestine Liver Pancreas Urinary Lymphoma Other
Female
Thyroid Breast Lung Esophagus Stomach Intestine Liver Pancreas Urinary Lymphoma Other
General
Thyroid Breast Lung Esophagus Stomach Intestine Liver Pancreas Urinary Lymphoma Other
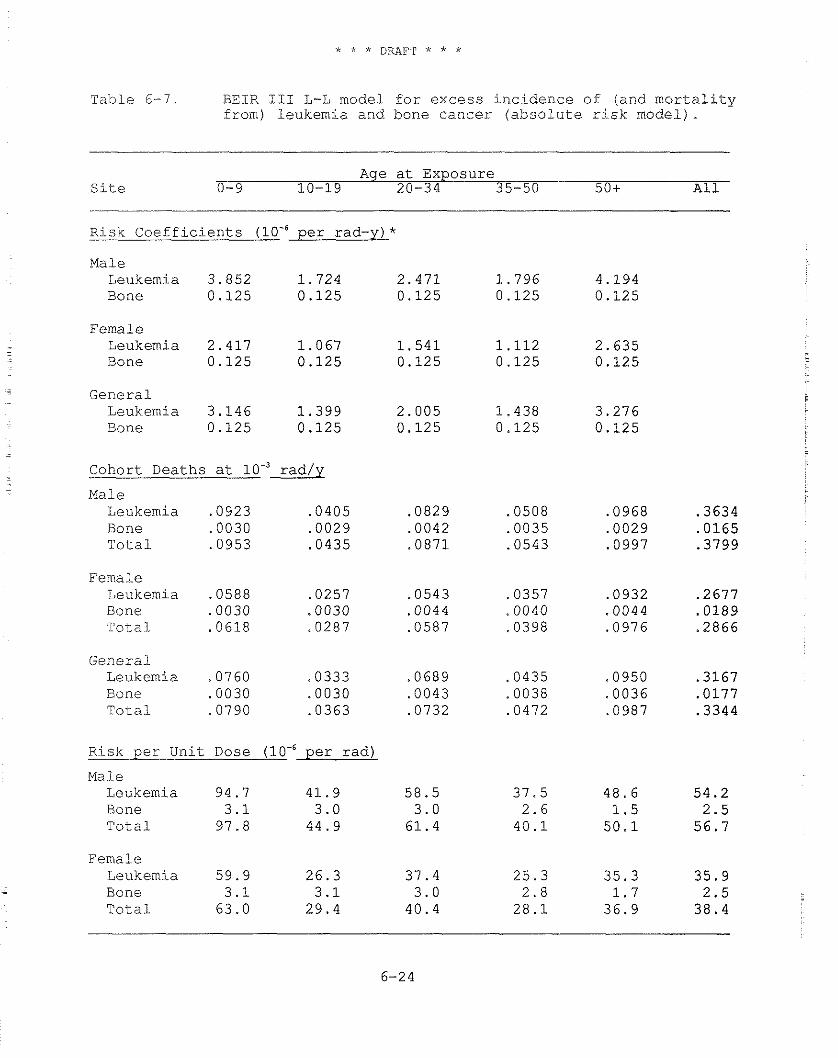
Table 6-7. BEIR 111 L-L model for excess incidence of (and mortality from) leukemia and bone cancer (absolute risk model).
Age at Exposure Site 0-9 10-19 20-34 35-50 50+ All
Risk Coefficients (lo-$ per rad-y) * -
Male Leukemia 3.852 1.724 2.471 1.796 4.194 Bone 0.125 0.125 0.125 0.125 0.125
Female Leukemia 2.417 1.067 1.541 1.112 2.635 Bone 0.125 0.125 0.125 0.125 0.125
. General . Leukemia 3.146 1.399 2.005 1.438 3.276 Bone 0.125 0.125 0.125 0.125 0.125
Cohort Deaths at 10.' rad/y - Male
Leukemia .0923 .0405 Bone .0030 ,0029 Total ,0953 .0435
Female Leukemia .0588 .0257 Bone .0030 .0030 Total .0618 .0287
General Leukemia .07 60 .0333 Bone .0030 .0030 Total .0790 .0363
Risk per Unit Dose per rad)
Male Leukemia 94.7 41.9 Bone 3.1 3.0 Total 97.8 44.9
Female Leukemia 59.9 26.3
- Bone 3.1 3.1 Total 63.0 29.4
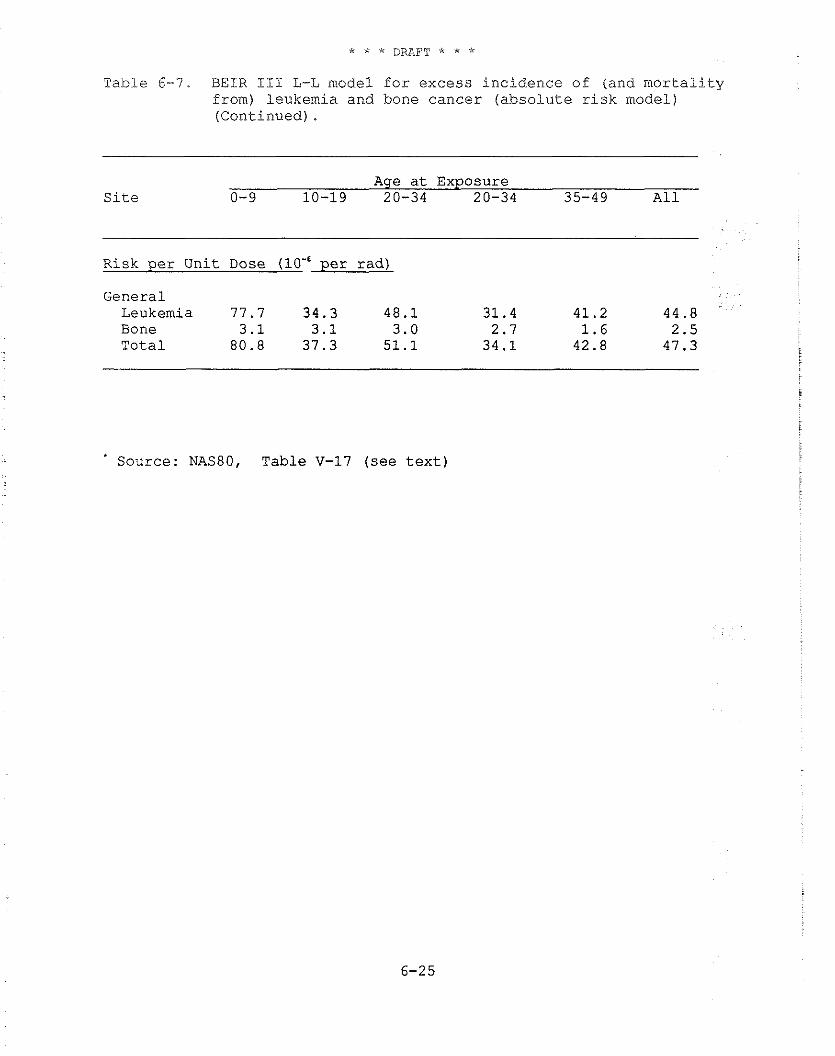
Table 6-7. BEIR I11 L-L model f o r excess inc idence of (and m o r t a l i t y from) leukemia and bone cance r ( a b s o l u t e r i s k model) (Continued) .
Age a t Exposure S i t e 0-9 10-19 20-34 20-34 35-49 A 1 1
Risk p e r Uni t Dose p e r rad)
General Leukemia 77.7 34.3 48.1 31.4 41.2 44.8 Bone 3.1 3.1 3.0 2.7 1.6 2.5 T o t a l 80.8 37.3 51.1 34.1 42.8 47.3
Source: NAS80, Table V-17 ( s e e t e x t )
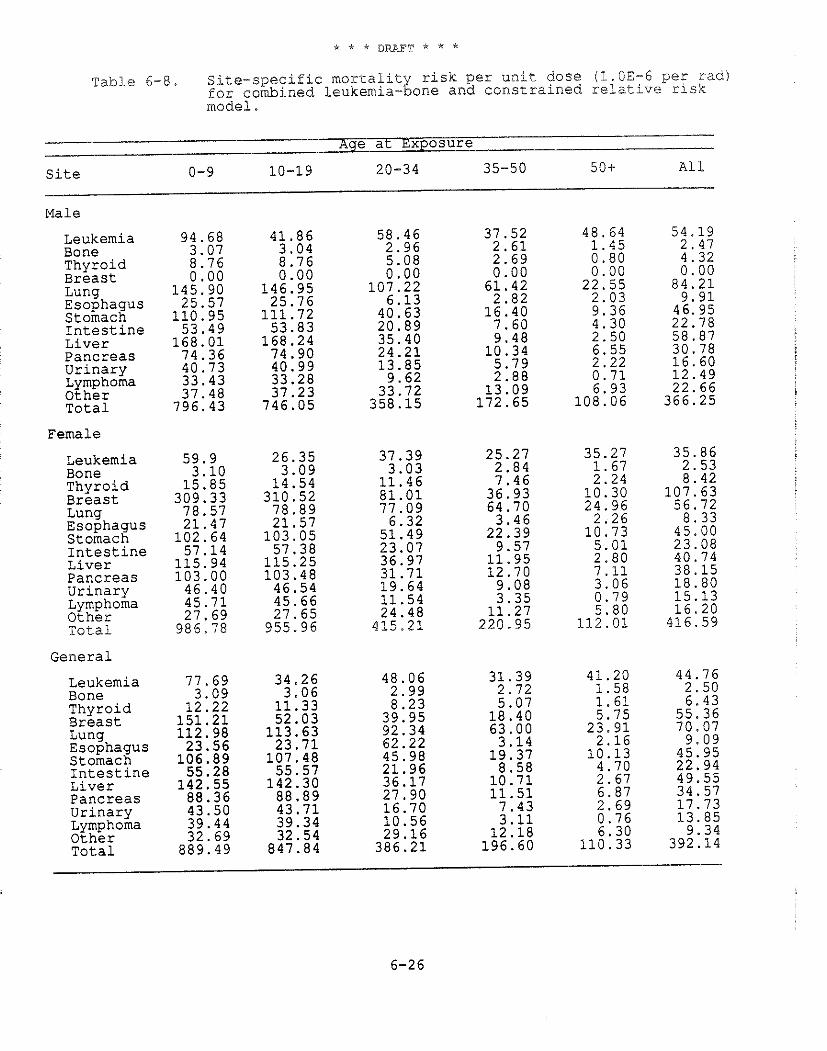
Table 6-8. Site-specific mortalit risk per unit dose (%.CE-6 peg rad) for combined leukemia- g one and constrained relative risk model.
Age at Exposure
Site 0-9 10-19 20-34 35-50 50+ A1 1
Male
Leukemia 94.68 41.86 58 .46 37 .52 48 .64 54.19 Bone 3.07 3 . 0 4 2 .96 2 . 6 1 1 . 4 5 2 .47 Thyroid 8 .76 8 .76 5.08 2 . 6 9 0 . 8 0 4 .32 Breast 0 . 0 0 0 .00 0 . 0 0 0 .00 0 . 0 0 0 . 0 0 Lung 145.90 146 .95 107 .22 61 .42 22 .55 8 4 . 2 1 Esophagus 25.57 25 .76 6 .13 2 .82 2 .03 9 . 9 1 Stomach 110.95 111 .72 40.63 16 .40 9 . 3 6 46.95 Intestine 53 .49 53 .83 20 .89 7 .60 4 .30 22 .78 Liver 1 6 8 . 0 1 168 .24 35.40 9 . 4 8 2 .50 58 .87 pancreas 74.36 74 .90 2 4 . 2 1 10 .34 6.55 30 .78 Urinary 40.73 40.99 13 .85 5 .79 2 . 2 2 16 .60 Lymphoma 33 .43 33.28 9 .62 2 .88 0 . 7 1 12 .49 Other 37.48 37 .23 33.72 13 .09 6.93 22 .66 Total 796.43 746 .05 358 .15 172 .65 108 .06 366 .25
Female
Leukemia Bone Thyroid Breast Lung Esophagus Stomach Intestine Liver Pancreas Urinary Lymphoma Other Total
General
Leukemia Bone Thyroid Breast Lung Esophagus Stomach Intestine Liver Pancreas Urinary Lymphoma Other Total
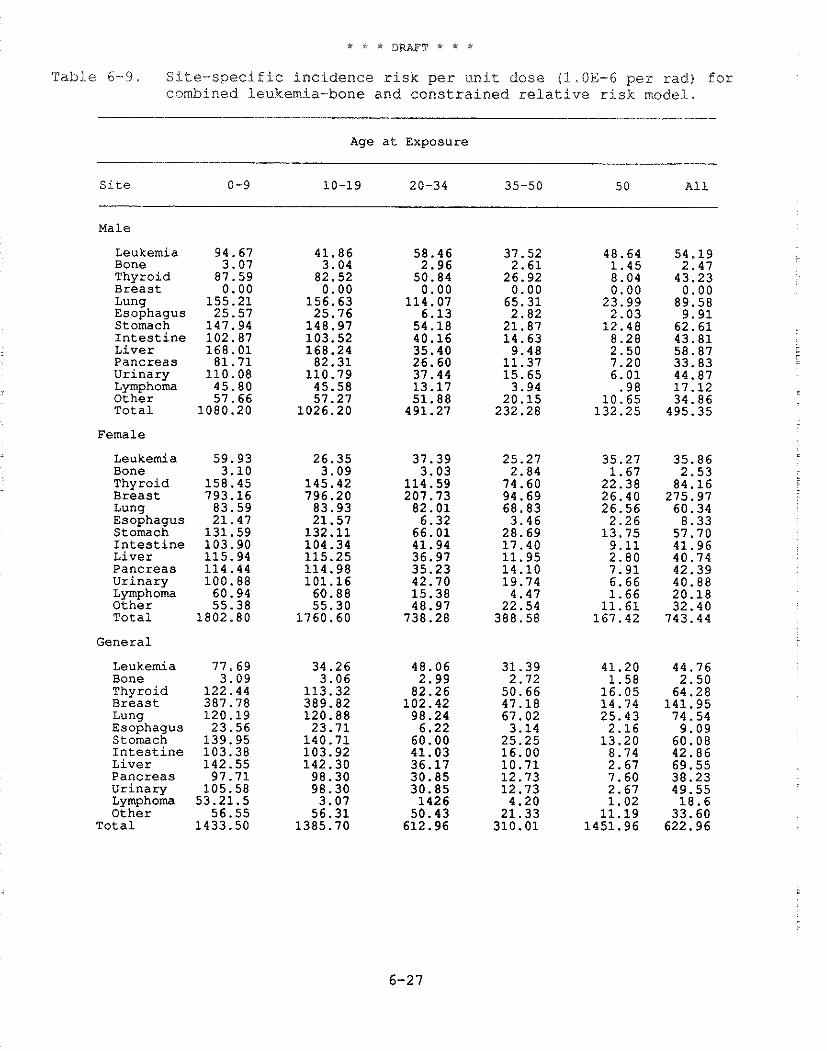
Table 6-9. Site-specific incidence risk per unit dose (1.OE-6 per rad) for combined leukemia-bone and constrained relative risk model.
Age a t Exposure
S i t e 0-9 10-19 20-34 35-50 5 0 A l l
Male
Leukemia 94.67 Bone 3.07 Thyroid 87.59 B r e a s t 0.00 Lung 155.21 Esophagus 25.57 Stomach 147.94 I n t e s t i n e 102.87 L i v e r 168.01 Pancreas 81.71 U r i n a r y 110.08 Lymphoma 45.80 Other 57.66 T o t a l 1080.20
Female
Leukemia Bone Thyroid
Luna
L i v e r Pancreas U r i n a r y Lymphoma O t h e r T o t a l
General
Leukemia Bone Thyroid B r e a s t Lung Esophagus Stomach I n t e s t i n e L i v e r Pancreas U r i n a r y Lymphoma O t h e r
T o t a l
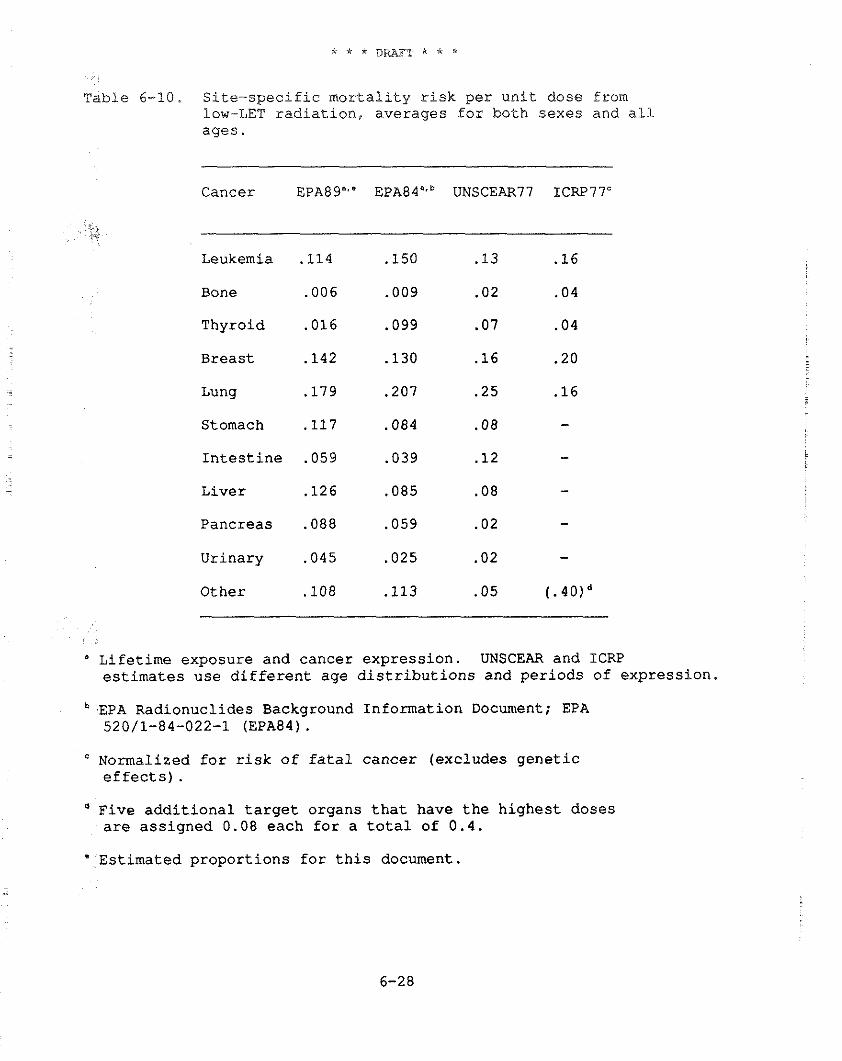
Table 6-10. Site-specific mortality risk per unit dose from low-LET radiation, averages for both sexes and all ages.
Cancer EPA89"." EPA84".b UNSCEAR77 ICRP77'
i.
Leukemia .I14 .I50 .13 .16
Bone .006 .009 .02 .04
Thyroid .016 .099 .07 .04
Breast .I42 .I30 .16 .20
Lung .I79 .207 .25 .16
Stomach .I17 .084 .08 - Intestine .059 .039 .12 - Liver .I26 .085 .08 - Pancreas .088 .059 .02 -
Urinary .045 .025 .02 -
Other .I08 .I13 .05 (.40)d
" Lifetime exposure and cancer expression. UNSCEAR and ICRP estimates use different age distributions and periods of expression.
EPA Radionuclides Background Information Document; EPA 520/1-84-022-1 (EPA84).
Normalized for risk of fatal cancer (excludes genetic effects) . Five additional target organs that have the highest doses are assigned 0.08 each for a total of 0.4.
Estimated proportions for this document.
-
dosimetric mode: with age invariant parameters, dose rates vary with time for a constant intake rate. This variation reflects the tirne- dependent activity levels associated with the retention of the radionuclide in the organs and tissues. The ingrowth of radioactive decay products can also contribute further to the time-dependence of dose rates.
Traditionally, risk estimates for chronic intake of a radionuclide have been determined using a dose commitment modelto calculate dose rates following a fixed period (e.g., a 70-year average lifespan). For the purpose of estimating risk, these dose rates are considered to be invariant over the individual's lifetime. This approach is overly conservative for estimating risk for many long-lived radionuclides. Therefore, EPA estimates risks for constant radionuclide intakes by first determining dose rates to each radiosensitive organ or tissue as a function of time. Then these dose rates and the xisk models of this chapter are used to calculate lifetime risk based on 1970 life table data. The resulting risks are consistent with both the dosimetric and risk models, and the arbitrary choice of a dose commitment period is avoided.
6.3 FATAL CANCER RISK RESULTING FROM HIGH-LET RADIATION
This section explains how EPA estimates the risk of fatal cancer resulting from exposure to high-LET radiations. Unlike exposures to x-rays and gamma rays where the resultant charged particle flux results in linear energy transfers (LET) of the order of 0.2 to 2 keV per pm in tissue, 5-MeV alpha particles result in energy deposition of more than 100 keV per pm. High-LET radiations have a larger biological effect per unit dose (rad) than low-LET radiations. How much greater depends on the particular biological endpoint being considered. For cell killing and other readily observed endpoints, the relative biological effectiveness (RBE) of high-LET alpha radiations is often 10 or more times greater than low-LET radiations. The RBE may also depend on the dose level; for example, if linear and linear-quadratic dose response functions are appropriate for high- and low-LET irradiations, respectively, then the RBE will decrease with increasing dose.
6.3.1 Quality Factors and RBE for Alpha Particles
For purposes of calculating dose equivalent, each type of biologically important ionizing radiation has been assigned a quality factor, Q, to account for its relative efficiency in producing biological damage. Unlike an RBE value, which is for a specific tissue and well-defined endpoint, a quality factor is based on an overall assessment by radiation protection experts of potential harm of a given radiation relative to x or gamma radiation. In 1977, the ICRP assigned a quality factor of 20 to alpha particle irradiation from radionuclides (ICRP77). However, the appropriateness of this numerical factor for estimating fatal
radiogenic cancers is still unclear, particularly for individual sites.
The dose equivalent (in rem) is the dose (in rad) tlmes the appropriate quality factor for a specified kind of radiation. For the case of internally deposited alpha-particle emitters, the dose equivalent from a one-rad dose is 20 rem. It should be noted that prior to ICRP Report 26 (ICRP79), the quality factor assigned to alpha particle irradiation was 10. That is, the biological effect from a given dose of alpha particles was estimated to be 10 times that from an acute dose of low-LET x-rays or gamma rays of the same magnitude in rad. The ICRP decision to increase this quality factor to 20 followed from its decision to estimate the risk of low-LET radiations, in occupational situations, on the assumption that biological effects were reduced at low dose rates. There is general agreement that dose rate effects do not occur for high-LET (alpha) radiations. Implicit in ICRP's risk estimates for low dose/dose - rate gamma radiation is a dose rate reduction factor of about 2.5. The EPA (linear) risk model for low-LET radiation does not involve
- such a DREF; therefore, in order to avoid an artifactual inflation -
in high-LET risk estimates, EPA has assumed an RBE of 8 (20/2.5) for calculating the risks from alpha particles (see Section 6.3.3).
. In 1980, the ICRP published the task group report "Biological Effects of Inhaled Radionuclides," which compared the results of animal experiments on radiocarcinogenesis following the inhalation of alpha-particle and beta-particle emitters (ICRP80). The task group concluded that: "...the experimental animal data tend to support the decision by the ICRP to change the recommended quality factor from 10 to 20 for alpha radiation."
6.3.2 Dose Response Function
In the case of high-LET radiation, a linear dose response is commonly observed in both human and animal studies. This response is not reduced at low dose rates (NCRPBO). Some data on human lung cancer indicate that the carcinogenic response per unit dose of alpha radiation is maximal at low doses (Ar81, Ho81, Wh83); in addition, some studies with animals show the same response (Ch81, Ul82). EPA agrees with the NAS BEIR 111 Committee that: "For high- LET radiation, such as from internally deposited alpha-emitting radionuclides, the linear hypothesis is less likely to lead to overestimates of the risk and may, in fact, lead to underestimates" (NAS80). However, at low doses, departures from linearity are small compared to the uncertainty in the human epidemiological data, and EPA believes a linear response provides an adequate model for evaluating risks in the general environment.
A possible exception to a linear response is provided by the - data for bone sarcoma (but not sinus carcinoma) among U.S. dial
painters who ingested alpha-emitting Ra-226 (NAS80). These data are consistent with a dose-squared response (Ro78). Consequently, the NAS BEIR I11 Committee estimated bone cancer risk on the basis of
both linear and quadratic dose response functions. However, as pointed out in NASRO, the number of U.S. dial painters at risk who received less than 1,000 rads was so small that the absence of excess bone cancer at low doses is not inconsistent with the linear response model. Therefore, the consistency of these data with a quadratic (or threshold) response is not remarkable and, perhaps, not relevant to evaluating risks at low doses. In contrast to the dial painter data, the incidence of bone cancer following short- lived radium-224 irradiation, observed in spondylitics by Mays and Spiess (Ma83, NAS80) in a larger sample at much lower doses, is consistent with a linear response. Therefore, for high-LET radiations, EPA has used a linear response function to evaluate the risk of bone cancer.
Closely related to the choice of a dose response function is what effect the rate at which a dose of high-LET radiation is delivered has on its carcinogenic potential. This is an area of active current research. There is good empirical evidence, from both human and animal studies, that repeated exposures to radium-224 alpha particles are 5 times more effective in inducing bone sarcomas than a single exposure that delivers the same dose (Ma83, NAS80). The 1980 NAS BEIR Committee took this into account in its estimates of bone cancer fatalities, which EPA is using.
6.3.3 Assump~ions Made by EPA for Evaluating ~ h e Dose from Alpha-Parcicle Emit~ers
EPA has evaluated the risk to specific body organs by applying an RBE of 8 for alpha radiations to the risk estimates for low dose rate, low-LET radiations as described above. For some organs, this factor may be too large. Several authors have noted that estimates of the risk of leukemia based on an RBE of 20 for bone marrow alpha irradiation (relative to a low dose rate, low-LET risk model which includes a DREF of 2.5) overpredicts the observed incidence of leukemia in persons receiving thorotrast (thorium oxides) (Mo79) and in the U.S. radium dial painters (Sp83). Nevertheless, in view of the paucity of applicable human data and the uncertainties discussed above, the ICRP quality factor provides a reasonable and prudent way of evaluating the risk due to alpha emitters deposited within body organs.
All EPA risk estimates for high-LET radiations are based on a linear dose response function. For bone cancer and leukemia, EPA uses the absolute risk projection model described in the previous section. For other cancers, the Agency uses relative risk projections.
The Agency's estimates of the risk of fatal cancer due to a uniform organ dose in various organs from internally deposited alpha-particle emitters are given in Table 6-11. The risk values in Table 6-11 were obtained by multiplying the average risk based on the linear model for a uniformly distributed whole-body dose of low-
LET radiation by an RBE of 8 and then apportioning this risk by organ, as indicated.
These estimates are for lifetime doses at a constant dose rate. This procedure was not followed for bone cancer. As outlined above, the risk estimate for this cancer in the BEIR I11 report is based directly on data for high-LET (alpha) radiation. Some readers may note that the risk estimate in Table 6-11, 19 bone cancer fatalities per lo6 person-rad, is less than the 27 fatalities listed in Table A-27 of NAS80 for alpha particles. This is because the analysis in Appendix A of NAS80 (but not Chapter V of that report) assumes that in addition to a 2-year minimum induction period, 25 years are available for cancer expression. This is usually not the case for doses received beyond about age 50. Hence, the estimated lifetime risk is smaller when it is based on a life table analysis that considers lifetime exposure in conjunction with competing causes of death.
The next section describes how EPA estimates the risk due to inhalation of alpha-emitting radon progeny, a situation where the
- organ dose is highly nonuniform.
6.4 ESTIMATING THE RISK FROM LIFETIME POPULATION EXPOSURES FROM RADON-222 PROGENY
- The Agency's estimates of the risk of lung cancer due to
inhaled radon progeny do not use a dosimetric approach, but rather are based on what is sometimes called an epidemiological approach: that is, on the excess human lung cancer in groups known to have been exposed to radon progeny.
When Rn-222, a radioactive noble gas, decays, a number of short half-life radionuclides (principally polonium-218, lead-214, bismuth-214, and polonium-214) are formed. These decay products, commonly referred to as "progeny" or "daughters," readily attach to inhalable aerosol particles in air. When inhaled, the radon progeny are deposited on the surfaces of the larger bronchi of the lung. Since two of these radionuclides decay by alpha-particle emission, the bronchial epithelium is irradiated by high-LET radiation. A wealth of data indicate that a range of exposures to the bronchial epithelium of underground miners causes an increase in bronchial lung cancer, both in smoking and in nonsmoking miners, and in some members of the general public. Recently the National Academy of Sciences, BEIR IV Committee, and the International Commission on Radiological Protection reviewed the question of radon risks and reported their conclusions (NAS88, ICRP87).
Although considerable progress has been made in modeling the deposition of radon daughters in the lung, it is not yet possible to
- characterize adequately the bronchial dose delivered by alpha radiation from inhaled Rn-222 progeny (NAS88). This is in part due to the uncertainty concerning the kinds of cells in which bronchial
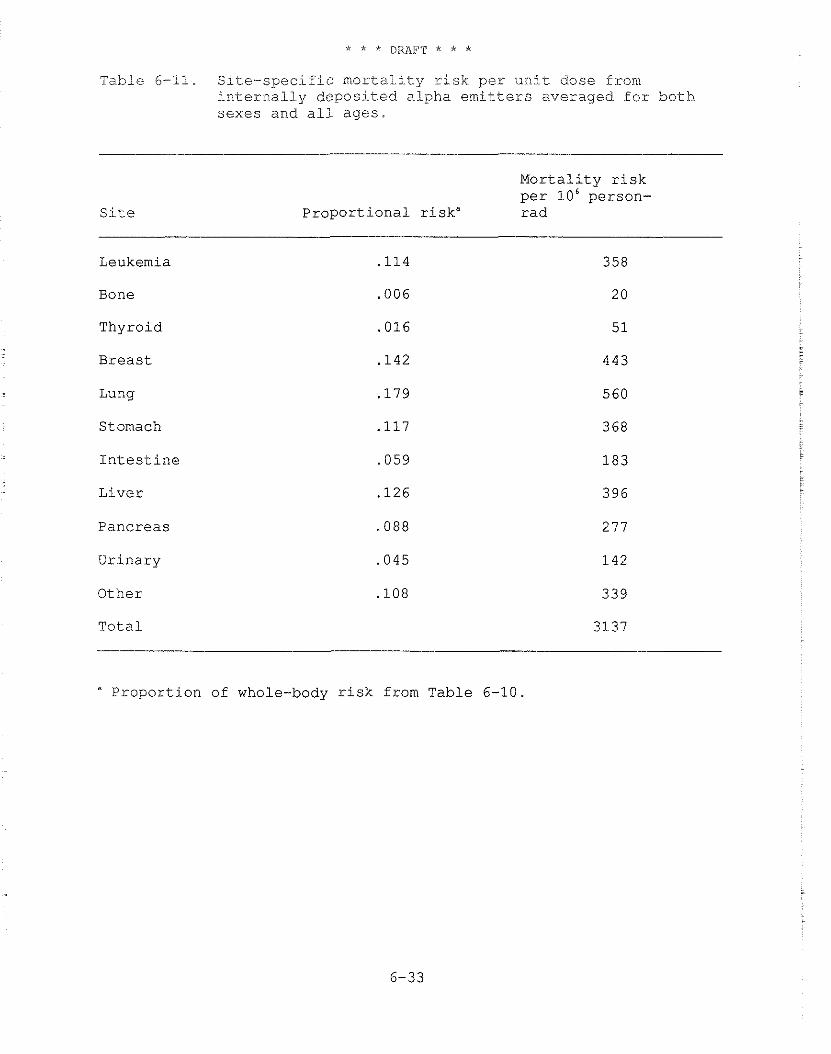
T a b l e 6-1.1. S i t e - s p e c i f i c m o r t a l i t y r i s k p e r u n i t d o s e f rom i n t e r n a l l y d e p o s i t e d a l p h a emitters a v e r a g e d f o r b o t h s e x e s a n d a l i a g e s .
S i t e
M o r t a l i t y r i s k per l o 6 p e r s o n -
P r o p o r t i o n a l r i s k " r a d
Leukemia
Bone
T h y r o i d
B r e a s t
Lung
Stomach
I n t e s t i n e
L i v e r
P a n c r e a s
U r i n a r y
O t h e r
T o t a l
" P r o p o r t i o n of whole-body r i s k from T a b l e 6-10.
cancer i.s i.niti.ated and the depth of these cells in the bronchial epithelium.
Aside from the uncertainties in the dose calculations, a purely dosimetric approach to radon risk estimation appears untenable. Such an approach relates the risk from a given absorbed dose to the lung resulting from radon progeny exposure to that from gamma or x-ray exposure. This approach ignores the extensive epidemiological data on radon exposed miners and bases risk estimates indirectly on epidemiological studies of populations exposed to low-LET radiation. It must also, therefore, make use of an RBE for alpha particles estimated from animal studies. Given the uncertainties in the latter epidemiological studies and in the RBE, there would seem to be no advantage to this approach. Consequently, EPA agrees with the BEIR IV Committee conclusion that radon decay product dosimetry in the lung is only useful for extrapolating radon risk estimates from one exposure situation to another (NAS88).
6.4.1 Characterizinq Exposures to the General Population vis-a-vis Underground Miners
Exposures to radon progeny under working conditions are commonly reported in a special unit called the working level (WL). One working level is any combination of short half-life Rn-222 progeny having 1.3 x 10⁵ MeV per liter of potential alpha energy (FRC67). This value was chosen because it is the alpha energy released from the total decay of the short-lived radon progeny at radioactive equilibrium with 100 pCi/L of Rn-222. The WL unit was developed because the concentration of specific radon progeny depends on ventilation rates and other factors. A working level month (WLM) is the unit used to characterize a miner's exposure to one working level of radon progeny for a working month of about 170 hours. Because the results of epidemiological studies are expressed in units of WL and WLM, the following outlines how they can be interpreted for members of the general population exposed to radon progeny.
There are age- and sex-specific respiratory rate and volume differences, as well as differences in duration of exposure, in a general population as compared to a mining population. In earlier reports, EPA used an "exposure equivalent," a modified WLM in which adjustments were made for age-specific differences in airway dimensions and surface area, respiratory frequency, and tidal volume. These factors were expected to influence aerosol deposition and, therefore, radiation dose from radon daughters. This approach to quantifying exposure, correcting for differences in these factors, was recommended by Evans (Ev69) and is consistent with the original derivation of the working level (Ho57).
- The BEIR IV Cornittee, however, concluded that the tracheo- bronchial "dose per WLM in homes, as compared to that in mines, differs by less than a factor of 2," and advised that the dose and risk per WLM exposure in residences and in mines should be
considered to be identlical until better dosimetric estimates are developed (NAS881. EPA will follow the lead of the BEIR IV Committee in this regard and will not use the "exposure equivalentr' correction employed to compensate for age- and sex-specific tracheo- bronchial deposition in earlier EPA reports. In this report, exposure of any individual to 1 WL for 170 hours is 1 WLM and for l year is 51.56 WLM. This change puts EPA risk estimates in standard units generally used for this purpose, still without requiring dose calculations.
For indoor exposure, an occupancy factor of 0.75 is still employed. Discussion of the support for this estimate can be found in EPA8 6.
6.4.2 The EPA Model
The initial EPA method for calculating radon risks has been described in detail (EPA79, E179). As new data were reported, the EPA revised its model to reflect changes, as contained in consecutive reports (EPA79, EPA82, EPA83a, EPA83b, EPA84, EPA85,and EPA86). The Agency initially projected radon lung cancer deaths for both absolute and relative risk models, but, since 1978, EPA has based risk estimates due to inhaled Rn-222 progeny on a linear dose response function, a relative risk projection model, and a minimum induction period of 10 years. A life table analysis has been used to project this risk over a full life span. Lifetime risks were initially projected on the assumption that an effective exposure of 1 WLM increased the age-specific risk of lung cancer by 3 percent over the age-specific rate in the U.S. population as a whole (EPA79). In the most recent documents, lifetime risks were calculated for a range of risk coefficients from 1 percent to 4 percent per WLM (EPA86).
Although occupational exposures to pollutants other than Rn-222 progeny are probably not important factors in the observed lung cancer risk for underground miners (E179, Th82, Mu83, Ra84, Se88) , the use of occupational risk data to estimate the risk of a general population is far from optimal, as it provides no information on the effect of radon progeny exposures for children and women. While for most estimates, it is assumed that the risk per unit dose received by children is no higher than that received by adults, this assumption may not be correct.
The A-bomb survivor data indicate that, in general, the risk from childhood exposure to low-LET radiation is greater than from adult exposure and continues for at least 33 years, the time over which A-bomb survivors have been observed (Ka82). There are not, as yet, adequate age-specific data on occurrence of lung cancer in those under 10 years of age at the time of exposure (Ka82). Another limitation of the underground miner data is the absence of women in the studied populations. The A-bomb survivor data indicate women are as sensitive as men to radiogenic lung cancer from low-LET
radiation even though, on the whole, they smoke less (Pr83). These data are not conclusive, however.
6.4.3 Comparison of Earlier Risk Estimates
Several estimates of the risk due to radon progeny have been published since the original EPA model was developed. These risk estimates were reviewed recently in a number of EPA reports (EPA894, EPA85, and EPA86)
The recent EPA risk estimates for lifetime exposure to a general population, along with AECB, NAS, UNSCEAR, ICRP, and NCRP estimates of the risk of lung cancer resulting from inhaled radon progeny, are listed in Table 6-12. The AECB estimate for lifetime exposure to Canadian males is 830 fatalities per million - person-WLM (Th82). In Table 6-12, this estimate has been adjusted for the U.S. 1970 male and female population.
. - The National Institute for Occupational Safety and Health
reviewed published data on miner studies used as a basis for estimated risk coefficients and pointed out some of the strengths
- and limitations of selected studies (NIOSH87).
. The occupational exposure groups that constitute the epidemiological database for the risk estimates are as follows:
I. U.S. Uranium Miners (NIOSH87)
(a) Strengths: A large, clearly defined, well-traced cohort with some smoking histories and exposure records on the same persons. Standard sampling techniques were used to make measurements.
(b) Limitations: There were few measurements in small mines, work histories were self-reported, exposures were high, and potential error due to excursions in exposure levels is high.
(c) Follow-up: 19 years in 1977.
2. Czechoslovakian Uranium Miners (NIOSH8
(a) Strengths: Extensive exposure data with a large number of low level exposures and limited exposure to other underground mining. Many possible confounding factors have been investigated and eliminated.
(b) Limitations: Exposure estimates prior to 1960 based on radon gas measurements. Person years at risk not determined in standard manner. Smoking effect neglected. Elevated levels of arsenic in ore.
(c) Follow-up: 26 years in 1975.
3. Ontario Uranium Miners (NIOSH87)
(a) Strengths: Miners received low mean cumulative exposures. Prior mining experience was carefully traced. Exposures prior to 1967 may be disputed.
(b) Limitations: Median age of the cohort was 39 years in 1977. Thoron and gamma exposures may have been high but not accounted for. Smoking history is limited.
(c) Follow-up: 18 years in 1977
4. Malmberget Iron Miners (NIOSH87)
(a) Strengths: Low exposure levels, long follow-up and stability of work force. Complete ascertainment of vital status and confirmation of diagnosis. Risk from confounders was examined and ruled out.
(b) Limitations: Relatively small cohort with limited exposure data and an unclear cohort definition.
(c) Follow-up: 44 years in 1976
5. Eldorado - Uranium Miners (NAS88)
(a) Strengths: Very low exposure rates, miners screened for prior mining experience, roughly equal groups of surface only and underground only miners, Silica and diesel exhaust exposures low. Potential confounders investigated.
(b) Limitations: Exposure estimates are disputed. Sixteen percent of the miners excluded for incorrect or missing data. Average age in 1980 was 43 years.
(c) Follow-up: 14 years in 1980.
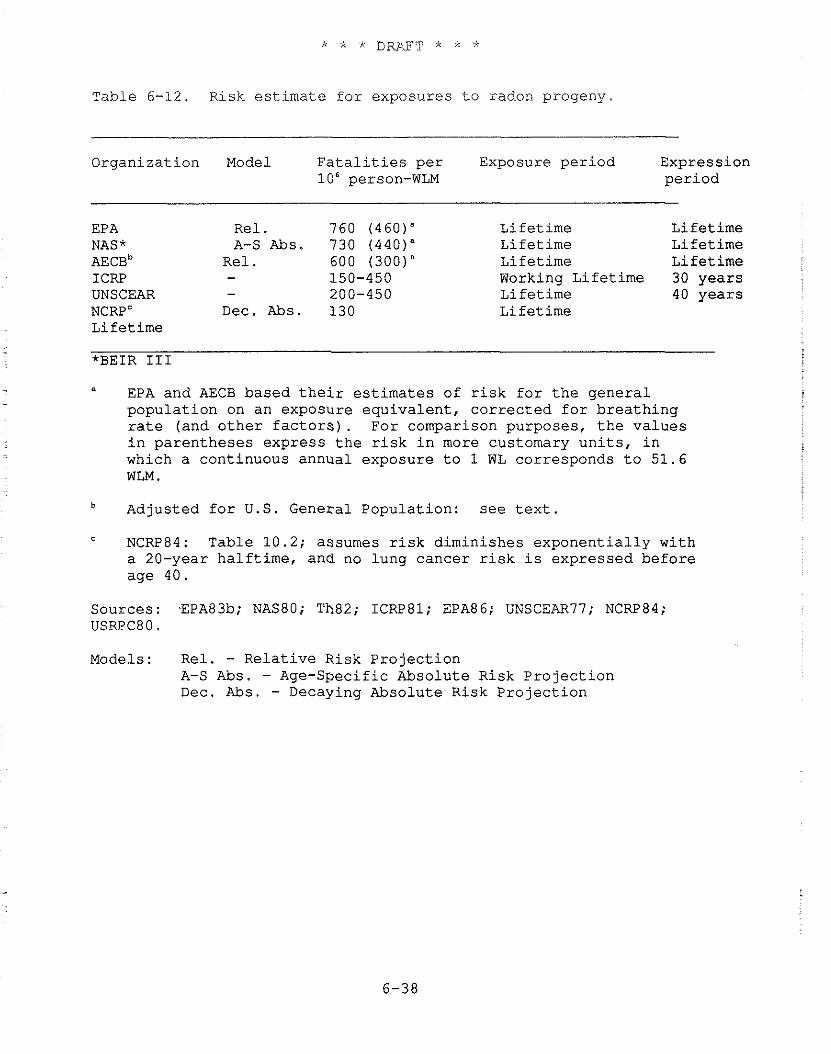
Table 6-12. Risk estimate for exposures to radon progeny
Organization Model Fatalities per Exposure period Expression lo6 person-WLM period
EPA Rel. 760 (460)" Lifetime Lifetime NAS* A-S Abs. 730 (440)" Lifetime Lifetime AECB~ Re1 . 600 (300)" Lifetime Lifetime ICRP - 150-450 Working Lifetime 30 years UNSCEAR - 200-450 Lifetime 40 years NCRP' Dec. Abs. 130 Lifetime Lifetime
" EPA and AECB based their estimates of risk for the general population on an exposure equivalent, corrected for breathing rate (and other factors). For comparison purposes, the values in parentheses express the risk in more customary units, in which a continuous annual exposure to 1 WL corresponds to 51.6 WLM.
Adjusted for U.S. General Population: see text.
NCRP84: Table 10.2; assumes risk diminishes exponentially with a 20-year halftime, and no lung cancer risk is expressed before age 40.
Sources: EPA83b; NAS80; Th82; 1CRP81; EPA86; UNSCEAR77; NCRP84; USRPC80.
Models: Rel. - Relative Risk Projection A-S Abs. - Age-Specific Absolute Risk Projection Dec. Abs. - Decaying Absolute Risk Projection
6.4.4 Recent Radon Risk Estimates
6.4.4.1 BEIR IV
At the beginning of 1988, the National Academy of Sciences released the BEIR IV Committee report, reviewing information on the risks from radon and other alpha-emitting radionuclides (NAS88). With the cooperation of the principal investigators, BEIR IV examined in detail the mortality experience of four cohorts of underground miners (the U.S., Ontario, and Eldorado uranium miners and the Malmberget iron miners) and how the mortality related to radon daughter exposure. The Committee calculated the relationship of age-specific relative risk to exposure level and time-since- exposure (TSE) in two analyses. The first used internal cohort comparisons and was a grouped-data analog of a Cox relative-risk regression (NAS88). The second analysis compared the cohorts with external rates and was a generalization of standard SMR methods. Separate parallel analyses were carried out to establish a single combined value for each parameter.
The mathematical form of the Committee's preferred TSE model for the radon related age-specific mortality rate at age a is
where r,(a) = age-specific lung cancer mortality rate
y(a) = 1.2, if a is less than 55 years 1.0, if a is between 55 and 64 years 0.4, if a is greater than 64 years
W, = WLM incurred between 5 and 15 years prior to age a
W, = WLM incurred more than 15 years prior to age a
The Committee model is, therefore, an age-specific, relative-risk projection model with a 5-year latent period prior to expression of risk.
The BEIR IV Committee also estimated what the lung cancer risk coefficient would be for an age-constant, relative-risk model. The results of this analysis are summarized below:
Cohort Excess Risk per WLM
95% Confidence Limits
u. S. Ontario Eldorado Malmberget Combined
In its analysis, the BEIR IV Committee identified two major areas of uncertainty affecting its conclusions: (1) uncertainty related to the Committee's analysis of cohort data and (2) uncertainty related to projection of the risk to other groups. The Committee's TSE model uses risk coefficients derived from analysis of data from four miner cohorts. Random or systematic errors, particularly systematic errors, could bias the conclusions. Sources of error in addition to basic sampling variation include: (1) errors in exposure estimates, particularly since the magnitude of error may differ among the studies; (2) errors of misclassification of cause of death; (3) errors in smoking status of individual miners, and (4) modeling uncertainty--i.e., does the model properly address all parameters that are determinants of risk?
Having developed the TSE model for miners, the Committee anticipated the folLowing sources of uncertainty in projecting the model across other groups: (1) effect of gender (miner data all for males); (2) effect of age (miner data contain no information on exposures before about age 20); (3) effect of smoking (miner data contain poor information on smoking status); (4) temporal expression of risk (not enough miners have died to establish accurately the pattern of lifetime risk from radon exposure), and (5) extrapolation from mining to indoor envirenments (what are significant differences in the air in mines compared to air indoors?). After reviewing the various sources of uncertainty, the BEIR IV Committee concluded [p42]," . . . The imprecision that results from sampling variation can be readily quantified, but other sources of variation cannot be estimated in a quantitative fashion. Therefore, the Committee chose not to combine the various uncertainties into a single numerical value" (NAS88) .
The question of errors in exposure estimates is particularly interesting since the modeling is strongly influenced by the U.S. uranium miner data. In fact, the model risk estimates would be 33 percent higher if the U.S. cohort was removed. Exposure in the U.S. - cohort is poorly known: cumulative WLM (CWLM) are calculated from measured radon levels for only 10.3 percent of the miners, varying amounts of estimation are required for about 36.1 percent of the
miners, and guesswork is used for about 53.6 percent of the miners (NAS88, Lu71). Only 26.1 percent of the U.S. uranium miner exposure data are based on measured values (Lu71).
The Ontario cohort exposure estimates also are not well founded. Upper and lower estimates were developed: the Lower from measured values, the upper based on engineering judgment (NAS88). Eldorado cohort estimates of CWLM were based almost entirely on measured values, while Malmberget cohort estimates were based on a reconstruction of past ventilation conditions (NAS88). Of the four cohorts, the United States has one of the poorest bases for CWLM estimates. One serious problem is the potential error due to large excursions in radon daughter concentrations (NIOSH87). The uncertainties in exposure estimates are particularly significant in view of the rather large impact the U.S. cohort has on the form of the model.
When the BEIR IV model is run with the 1980 lifetable and vital statistics at an exposure level of 0.001 WLM per year, the reference risk can be calculated.
BEIR IV Relative Risk Model - Lifetime Exposure and Lifetime Risk
Group Risk (10'6/WLM)
Male Female Combined
6.4.4.2 ICRP 50
The International Commission on Radiological Protection, in its Publication 50, addressed the question of lung cancer risk from indoor radon daughter exposures. The ICRP Task Group took a direction quite different from the BEIR Committee. The Task Group reviewed published data on three miner cohorts: U.S., Ontario, and Czech uranium miners. The estimated risk coefficients by cohort are :
Cohort Follow-up Relative model Absolute model
u.S. 1950-1977 0.3%-1.0% 2-8 cases/106Pw~~~ Czech 1948-1975 1.0%-2.0% 10-25 cases/106 PWLMY Ontario 1958-1981 0.5%-1.3% 3-7 cases/106 PWLMY Average 1 % 10 cases/106 PWLMY
The relative risk model then developed for a constant exposure rate is :
= the mortality rate at age t
where :
h,(t) = the age-specific lung cancer rate at age t
r(t,) = risk coefficient at age of exposure t,
E(t.) = age-dependent exposure rate
7 = time lag (minimal latency) = 10 year
In the case of a constant exposure rate or constant annual exposure, the equation collapses to:
h(t) = h,(t) [l + r E(t - 7)l where:
- r = age averaged relative risk coefficient
= cumulative exposure to radon daughters to age t -7
Since ICRP recommends the use of the relative risk model, the ICRP 50 absolute risk model will not be addressed further in this document.
To adapt the relative risk model derived from studies of underground miners for the general population, the ICRP Task Group introduced several adjustments. The first was to correct for co- carcinogenic influences in mines. To account for unidentified, unproven carcinogens that might be present in mine environments but not elsewhere, only 80 percent of the risk was attributed to radon. The second adjustment was for dosimetric corrections. The dose to bronchial epithelium used by the Task Group for persons indoors was estimated to be only 80 percent as large as that for persons in - mines; therefore, the risk to the public from radon was considered
to be 80 percent of the risk of miners.
Adjusting the average relative risk coefficient of 1 percent per WLM by these two factors gives a risk coefficient of 0.64 percent per WLM:
The third adjustment made by the Task Group is related to age. Since reports of Japanese A-bomb survivors and some other radiation- exposed groups support an elevated estimate of risk in children compared to adults, the Task Group increased the risk coefficient of persons between birth and age 20 by a factor of 3.
The final relative risk coefficients in the ICRP 50 model are: 1.9 percent per WLM if the age at time of exposure is between birth and 20 years, and 0.64 percent per WLM if age at time of exposure exceeds 20 years.
When the ICRP 50 relative risk model is run with 1980 U.S. lifetable and vital statistics at an exposure level of 0.001 WLM per year, the reference risk calculated is:
Group
Male Female Combined
Risk (10-6/~LM)
6.4.5 Selection of Risk Coefficients
To estimate the range of reasonable risks from exposure to Rn- 222 progeny for use in the Background Information Document for Underground Uranium Mines (EPA85), EPA averaged the estimates of BEIR 111, the EPA model, and the AECB to establish an upper bound of the range. The lower bound of the range was established by averaging the UNSCEAR and ICRP estimates. The Agency chose not to include the NCRP estimate in its determination of the lower bound because this estimate was believed to be outside the lower bound. With this procedure, the EPA arrived at relative risk coefficients of 1.2 percent to 2.8 percent per WLM exposure equivalent (300 to 700 fatalities per million person-WLM exposure equivalent) as estimates of the possible range of effects from inhaling Rn-222 progeny for a full lifetime. Although these risk estimates did not encompass the full range of uncertainty, they seemed to illustrate the breadth of much of current scientific opinion.
The lower limit of the range of 1985 EPA relative risk coefficients, 1.2 percent per effective WLM, was similar to that derived by the Ad Hoc Working Group to Develop Radioepidemiological Tables, which also used 1.2 percent per WLM (NIH85). However, some other estimates based only on U.S. and Czech miner data averaged 1 percent per WLM (Ja85) or 1.1 percent per WLM (St85). On the
o t h e r hand, t h r e e s t u d i e s - two on miners (Ra84, Ho86) and one on r e s i d e n t i a l exposure (Ed83, 84) - i n d i c a t e d a r e l a t i v e r i s k c o e f f i c i e n t g r e a t e r t h a n 3 p e r c e n t p e r WLM, perhaps a s l a r g e a s 3 . 6 p e r c e n t .
The EPA t h e r e f o r e i n c r e a s e d t h e upper l i m i t of i t s e s t i m a t e d range of r e l a t i v e r i s k c o e f f i c i e n t s . To e s t i m a t e t h e r i s k due t o Rn-222 progeny, t h e EPA used t h e range of r e l a t i v e r i s k c o e f f i c i e n t s of 1 t o 4 p e r c e n t p e r WLM. (See EPA86 f o r a more d e t a i l e d d i s c u s s i o n . ) Based on 1980 v i t a l s t a t i s t i c s , t h i s y i e lded , f o r members of t h e g e n e r a l p u b l i c , a range of l i f e t i m e r i s k s from 380 t o 1,520 f a t a l c a s e s p e r l o 6 WLM (expressed i n exposure e q u i v a l e n t s ) . I n s t a n d a r d exposure u n i t s , uncor rec t ed f o r b r e a t h i n g r a t e and age, t h i s cor responds t o 230 t o 920 c a s e s p e r l o 6 W L M . Co inc iden ta l ly , t h e geometr ic mean e s t i m a t e o b t a i n e d i n t h i s way wi th 1980 v i t a l s t a t i s t i c s , 4.6xlO-'/~LM i n s t a n d a r d u n i t s of exposure, i s numer ica l ly t h e same a s t h a t ob ta ined us ing a 3 p e r c e n t r e l a t i v e r i s k c o e f f i c i e n t and 1970 v i t a l s t a t i s t i c s ( s e e Table 6-9) .
.
However, i n l i g h t of t h e two r e c e n t l y pub l i shed consensus- based r e p o r t s , BEIR I V and ICRP 50, and a r e c e n t r e p o r t on t h e Czech miner groups (Se88) , t h e Agency has reviewed i t s b a s i s f o r radon . r i s k e s t i m a t i o n . Comparable r e l a t i v e r i s k c o e f f i c i e n t s f o r miners (age-constant r e l a t i v e r i s k ) y i e l d a c o e f f i c i e n t of around 1 p e r c e n t
. i n I C R P 50, 1 .34 p e r c e n t i n BEIR I V , and 1 . 5 p e r c e n t i n t h e Czechs. This sugges t s t h a t t h e range, 1 p e r c e n t t o 4 p e r c e n t , used by EPA may be t o o wide. Never the less , n o t e t h a t on ly 5 of t h e 20 o r s o s t u d i e s f o r which t h e r e a r e some d a t a a r e inc luded i n t h e s e e s t i m a t e s .
The BEIR I V Committee noted and modeled a drop i n r e l a t i v e r i s k wi th i n c r e a s i n g t ime of exposure and a d e c r e a s i n g r e l a t i v e r i s k wi th i n c r e a s i n g age a f t e r exposure (NAS88). The Czech miners show a s i m i l a r response p a t t e r n (Se88) . Though t h e Committee d i d no te a dose r a t e e f f e c t i n t h e U.S. uranium miner cohor t , i . e . , a dec rease i n r i s k p e r u n i t exposure a t high dose r a t e s , it was n o t i nc luded i n t h e model (NAS88). The p o s s i b i l i t y of a similar dose - ra t e e f f e c t was found r e c e n t l y i n a s tudy on P o r t Radium uranium miners (Ho87).
The ICRP 50 Task Group worked from a d i f f e r e n t da t abase and developed a s imple r model w i th fewer age- and time-dependent parameters . The Task Group provided a 3 t imes h ighe r r i s k f o r exposure between b i r t h and 20 y e a r s of age t h a n a f t e r 20 y e a r s of age (ICRP87). The f i n d i n g i n t h e r e c e n t Czech r e p o r t t h a t r i s k p r i o r t o age 30 i s 2 t o 2 .5 t imes g r e a t e r t h a n a f t e r age 30 l e n d s some suppor t t o t h e ICRP conc lus ions (Se88) .
Both B E I R I V and ICRP 50 models treat radon and smoking r i s k s - a s m u l t i p l i c a t i v e . Th i s conclus ion i s based p r i m a r i l y on d a t a from
t h e U.S. uranium miner c o h o r t . Although a p p a r e n t l y based on weaker ev idence , t h e r e p o r t on Malmberget miners and t h e r e c e n t r e p o r t on
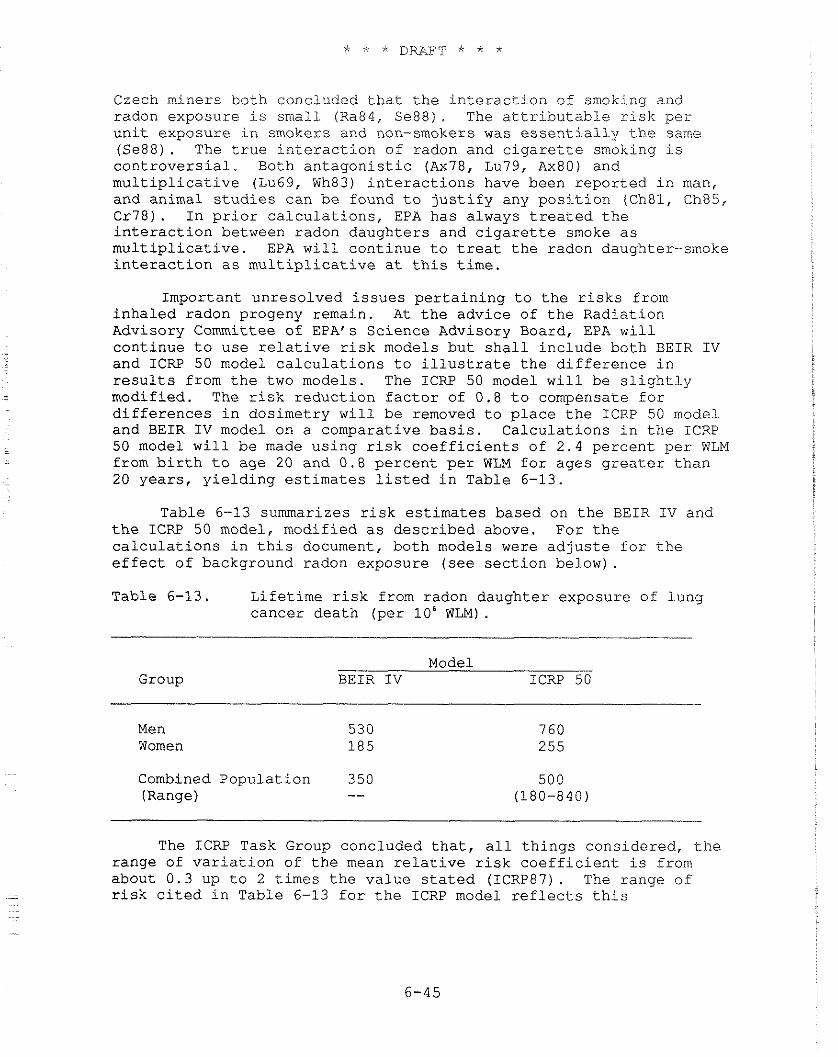
Czech miners both concluded that the interaction of smoking and radon exposure is small (Ra84, Se88). The attributable risk per unit exposure in smokers and non-smokers was essentially the same (Se88). The true interaction of radon and cigarette smoking is controversial. Both antagonistic (Ax78, Lu79, Ax80) and multiplicative (Lu69, Wh83) interactions have been reported in man, and animal studies can be found to justify any position (Ch81, Ch85, Cr78). In prior calculations, EPA has always treated the interaction between radon daughters and cigarette smoke as multiplicative. EPA will continue to treat the radon daughter-smoke interaction as multiplicative at this time.
Important unresolved issues pertaining to the risks from inhaled radon progeny remain. At the advice of the Radiation Advisory Committee of EPA's Science Advisory Board, EPA will continue to use relative risk models but shall include both BEIR IV and ICRP 50 model calculations to illustrate the difference in results from the two models. The ICRP 50 model will be slightly modified. The risk reduction factor of 0.8 to compensate for differences in dosimetry will be removed to place the ICRP 50 model and BEIR IV model on a comparative basis. Calculations in the ICRP 50 model will be made using risk coefficients of 2.4 percent per WLM from birth to age 20 and 0.8 percent per WLM for ages greater than 20 years, yielding estimates listed in Table 6-13.
Table 6-13 summarizes risk estimates based on the BEIR IV and the ICFiP 50 model, modified as described above. For the calculations in this document, both models were adjuste for the effect of background radon exposure (see section below).
Table 6-13. Lifetime risk from radon daughter exposure of lung cancer death (per 106 WLM) .
Model Group BEIR IV ICRP 50
Men Women
Combined Population 350 (Range) --
The ICRP Task Group concluded that, all things considered, the range of variation of the mean relative risk coefficient is from about 0.3 up to 2 times the value stated (ICRP87). The range of risk cited in Table 6-13 for the ICRP model reflects this
The Committee analyzed the A-bomb survivor data in two separate sets: (1) leukemia and (2) all cancers excluding leukemia (solid cancers). Its treatment of these two cases was not equivalent. The analysis of leukemia considered the Nagasaki and Hiroshima data separately. The Committee's regression analysis of the leukemia mortality data provided stable values for all of the coefficients in Equation 6-3, and hence for the neutron RBE and the ratio of linear to dose-squared terms for leukemia induction by gamma rays, as a function of dose. Estimating the linear-quadratic response coefficients for solid cancers proved to be less straightforward, however, and it was decided that the observations on solid cancers were "not strong enough to provide stable estimates of low dose, low-LET cancer risk when analyzed in this fashion" (NAS80,p.186). The Committee decided to use a constrained regression analysis, carrying over some of the parameters for Equation 6- 3 found in its analysis of leukemia deaths to the regression analysis of the dose response for solid cancers. Specifically, both the neutron RBE at low dose (the ratio of the coefficient K, to C,) and the ratio of C, to C,, as estimated from the leukemia data, were assumed to apply to the induction of fatal solid cancers. These estimates became the basis for the "preferred" linear-quadratic (LQ-L) risk estimates for solid cancers presented in BEIR I11 (NAS80, p. 187).
6.5.2 Uncertainty in the Dose Response Models Due to Bias in the A-bomb Dosimetry
Investigators from Oak Ridge National Laboratory carried out careful state-of-the-art evaluation of the dose to A-bomb survivors in the early 1960s (Au67, Au77). The results of these studies resulted in a "T65" dose being assigned to the dose (kerma) in free air at the location of each survivor for both gamma rays and neutrons. A major conclusion of the ORNL study was that the mix of gamma ray and neutron radiations was quite different in the two cities where A-bombing occurred. These results indicated that at Hiroshima the neutron dose was more important than the gamma dose when the greater biological efficiency of the high- LET radiations produced by neutrons was taken into account. Conversely, the neutron dose at Nagasaki was shown to be negligible compared to the gamma dose for that range of doses where there were significant numbers of survivors. Therefore, the 1980 BEIR Committee evaluated the cancer risks to the survivors at Hiroshima on the assumption that the combined effects of gamma rays and particularly neutrons caused the observed cancer response.
Serious inadequacies in the T65 dosimetry system were discovered in the late 1970s. A comprehensive reevaluation of the doses to survivors was carried out under the auspices of the U.S.-Japan Joint Committee for Reassessment of Atomic Bomb Dosimetry in Hiroshima and Nagasaki. In 1986, this committee provided results to the Radiation Effects Research Foundation (RERF) from which a revised dosimetry system, termed "DS86," was developed. Although work on the DS86 is largely complete, small adjustments in dose estimates are anticipated over the next few years (Pr87). In addition, about 1,000 survivors from Nagasaki, who were shielded by terrain or were in factories, have so far been excluded from
* * * DRAFT * * *
the analysis because of difficulties in estimating their doses. It is anticipated that dose estimates for some of these survivors will be forthcoming in the near future (Pr87).
The major differences between T65 and DS86 are: (1) the neutron dose in DS86 is decreased to 10 percent of its former value in Hiroshima and 30 percent in Nagasaki (as a result, neutrons now contribute relatively little to the estimated excess of cancers in the two cities); (2) the DS86 free-in-air gamma dose increases somewhat in Hiroshima but decreases in Nagasaki relative to T65; (3) transmission of gamma rays through wooden structures is decreased by about a factor of 2 in DS86; and (4) Transmission of gamma rays through the body to internal organs is generally increased, partially nullifying the change associated with the decreased transmission through structures (Pr87, Sh87).
Analysis of the A-bomb survivor data using the DS86 dosimetry is continuing. Preliminary indications are that risk estimates corresponding to a given dose-response model (linear or linear quadratic) will be increased by more than a factor of 2 as compared to BEIR I11 estimates. This increase arises not only from changes in dosimetry, but also from further epidemiological follow-up and new statistical procedures employed (Pr87, 88). A preliminary estimate of low-LET radiation risk to the general population based on DS86 dosimetry and the linear, relative risk model is 1.2 x 10-"atal cancers per rad (Pr88) - approximately 3 times the corresponding BEIR 111 estimate.
It appears that either a linear or linear-quadratic dose response is consistent with the survivor data, analyzed according to DS86 (Pr87). It would also appear that the residual difference in risk per unit dose between Hiroshima and Nagasaki is no longer statistically significant under DS86 dosimetry (Sh87) .
From the standpoint of estimating risks from low-level, low-LET radiation, however, the most important result of the new dosimetric calculations may be in helping to determine which models best describe the data on human radiation carcinogenesis. After all, the greatest uncertainties in radiation risk estimation generally reflect model uncertainties, not uncertainties in the magnitude of risk coefficients.
6.5.3 Sampling Variation
Besides the systematic bias in the BEIR I11 risk estimates for low- LET radiation outlined above, the precision of the estimated linear and linear-quadratic risk coefficients in the BEIR I11 report is limited by statistical fluctuations due to sample size. The uncertainty bounds (2 1 SD) attached to the gamma-ray risk coefficient in the BEIR 111 linear model are about +25 percent, for either leukemia (Table V-8) or for all other cancers able V-11). For the latter groups of cancers, however, the neutron RBE was constrained to the value obtained from analysis of the leukemia data. If this constraint is removed, the uncertainty in the estimate increases to +I50 percent (Table V-9). This increase reflects the large uncertainty associated with the neutron contribution in the analysis and the strong correlation between neutron and gamma-ray doses.
Following the dosimetry reassessment, neutron doses will decrease markedly but will remain correlated with gamma-ray doses.
Finally, it should be noted that random errors in dosimetry tend to bias the slope of the dose response curve downward, reducing the estimate of risk (Da75, Gi84, Ma59). The amount of bias introduced depends on the size of the random errors in the dose estimates and their distribution, which are unknown at present.
6.5.4 Low Dose Extrapolation
Results from animal and cellular studies often show decreasing effects (e.g., cancers, mutations, or transformations) per rad of low-LET radiation at low doses and dose rates. Based on a review of this literature, the National Council on Radiation Protection (NCRP80) has concluded that "linear interpolation from high doses (150 to 350 rads) and dose rates (>5 rads min-') may overestimate the effects of either low doses (0-20 rads or less) or of any dose delivered at dose rates of 5 rad y-l or less by a factor of 2 to 10." Judged solely from laboratory experiments, therefore, about a factor of 10 reduction from the linear prediction would seem to constitute a plausible lower limit on the effectiveness of low-LET radiation under chronic low dose conditions. Epidemiological evidence, however, would seem to argue against such a large DREF for human cancer induction.
Data on the A-bomb survivors and patients irradiated for medical reasons indicate that excess breast cancer incidence is proportional to dose and independent of dose fractionation (NAS80, NIH85). The evidence regarding thyroid cancer induction is less firm, but the data would again suggest a linear dependence on dose (NASBO, NIH85). Another cancer for which human data provide a test of dose response models is leukemia. An analysis of the A-bomb survivor data based on T65 dosimetry suggests a quadratic component. The simple linear model, however, fits much better under DS86 than T65 (Sh87). The best estimate of the linear coefficient obtained from the linear quadratic fit to the data, under either T65 or DS86, is only about a factor of 2.5 less than the coefficient derived from the linear model. Thus, while the animal data indicate a reduced effectiveness of radiation at low doses and. low dose rates, the available human data would suggest that the linear dose response model does not overestimate the risk by more than about a factor of 3 under these conditions.
6.5.5 Other Uncertainties Arising from Model Selection
In addition to a dose response model, a "transportation model" is needed to apply the risks from an observed irradiated group to another population having different demographic characteristics. A typical example is the application of the Japanese data for A-bomb survivors to Western people. Seymour Jablon (Director of the Medical Follow-up Agency of the National Research Council, NAS) has called this the "transportation problem," a helpful designation because it is often confused with the risk projection problem described below. However, there is more than a geographic aspect to the "transportation problem,"
Risk estimates for one sex must sometimes be based on data for the other. In transporting risk estimates from one group to another, one may have to consider habits influencing health statcs, such as differences between smokers and nonsmokers, as described in Section 6.4 for the case of risk estimates for radon progeny.
The BEIR 111 Committee addressed this problem in its 1980 report and concluded, based largely on the breast cancer evidence, that the appropriate way to transport the Japanese risk to the U.S. population was to assume that the absolute risk over a given observation period was transferrable but that relative risk was not. Therefore, the Committee calculated what the relative risk would be if the same number of excess cancer deaths was observed in a U.S. population having the same age characteristics as the A-bomb survivors. A constant absolute risk model, as postulated by the Committee, would imply that, whatever the factors are that cause Japanese and U.S. baseline cancer rates to differ, they have no effect on the incidence of radiation-induced cancers; i.e., the effects of radiation and these factors are purely additive.
An alternative approach to the "transportation problem" is that of the 1972 NAS BEIR-I Committee. This Committee assumed relative risks would be the same in the United States and Japan and transferred the observed percentage increase directly to the U.S. population. Since the U.S. and Japanese baseline rates differ drastically with respect to mortality from specific cancers, this approach implies some large differences in the predicted number of specific cancers resulting from a given dose of radiation in the two countries. The most important differences relate to cancers of the breast, lung, and stomach. Baseline rates of breast and lung cancers are higher in the United States by factors of about 4 and 2, respectively, while the risk of stomach cancer is about 8 times higher in Japan (Gi85). As noted above, it now appears that the absolute risk should be transported for breast cancer. Evidence is lacking regarding the other diseases, however. If lung cancer risk were to be transported with a relative risk model, retaining the absolute model for other cancers, the estimated risk from a whole-body exposure would increase by about 20 percent; on the other hand, applying the relative risk model to stomach cancer alone would lower the whole-body risk by about 8 percent. Based on these considerations, including the tendency for changes in specific cancers to cancel one another, EPA believes that using the absolute risk "transportation model" is unlikely to cause errors of more than +20 percent in the total risk estimate. Thus, in the case of uniform whole-body doses, the amount of uncertainty introduced by transporting cancer risks observed in Japan to the U.S. population appears to be small compared to other sources of uncertainty in this risk assessment.
Also needed to estimate risk is a risk projection model. As outlined in Section 6.2, such models are used to project future risks as an exposed population ages. For leukemia and bone cancer, where the expression time is not for a full lifetime but rather 25 years, absolute and relative risk projection models yield the same number of radiogenic cancers, but would distribute them somewhat differently by time after exposure, and hence by age. For solid cancers or other than bone, the
BEIR ZII Committee assumed that radiogenic cancers would occur throughout the estimated lifetime. This makes the choice of projection model more critical because the relative risk projection yields estimated risks about three times larger than those obtained with an absolute risk projection, as shown in Table 6-2. Recent follow-up of the A-bomb survivor population strongly suggests that the relative risk projection model better describes the variation in risk of solid tumors over time (NIH85). However, there may be some cancers, apart from leukemia and bone cancers, for which the absolute risk projection model is a better approximation to reality. For other cancers, the relative risk may have been roughly constant for the current period of follow-up but may eventually decrease over time. Thus, while the relative risk model was used in this report for calculating a "best estimate" of the lifetime risk of solid tumors, it may overestimate the risk by as much as a factor of 2.
Similarly, there is as yet insufficient information on -
radiosensitivity as a function of the age at exposure. The age-dependent risk coefficients used here are those presented in the BEIR 111 report. - As yet, there is little information on the ultimate effects of exposure during childhood. As the A-bomb survivor population ages, more information will become available on the cancer mortality of persons irradiated when they were young. Table 6-2 indicates that the more conservative BEIR-I assumption for the effect of childhood exposures would increase BEIR I11 risk estimates by about 40 percent. Recent
- follow-up supports the view that relative risks are highest in those aged 0-9 yr at exposure. Full inclusion of the projected effects on this group was a major contributor to the increase in risk found with the recent analysis based on DS86 dosimetry (Pr87, 88). The BEIR I11 Committee did not include -- in utero exposures when calculating population risks for radiogenic cancer because it felt the estimate of the effect of in utero radiation is highly uncertain. EPA has deferred to the -- committee's judgment in this regard. The BEIR-I report did include in utero cancer risk, but this had little effect (1 to 10 percent) on t s lifetime risk of cancer from lifetime exposure. An effect thls small is not significant relative to other sources of uncertainty in the risk assessment.
6.5.6 Summary and Conclusions Regarding Uncertainties in Cancer Risk Estimates
The most important uncertainties in estimating risk from whole body, low-LET radiation appear to relate to: (1) the extrapolation of risks observed in populations exposed to relatively high doses, delivered acutely, to populations receiving relatively low dose chronic exposures and (2) the projection of risk over a full lifespan - most critically, the extent to which high relative risks seen over a limited follow-up period among individuals exposed as children carry over into later years of life when baseline cancer incidence rates are high.
The EPA central estimate of average lifetime risk, approximately 400 fatal cancers per l o 6 person-rad, is taken from the NAS BEIR 111 Committee report (NAS1980), incorporating the most conservative model assumptions
utilized by the Committee - i.e., a linear dose response and age-specific relative risks projected over a lifetime for solid tumors (L-RR model). For reasons discussed above, it would now appear that estimates of average lifetime risk based on the L-RR model assumptions must be revised upwards - to roughly 1,200 fatal cancers/106 person-rad. Although further analysis of the A-bomb survivor data may increase this estimate, the conservatism inherent in the model's assumption supports the view that the 1,200/1O6 value is an upper bound, pending release of NAS BEIR V report now in preparation.
Animal data would suggest that the linear dose response may overestimate risk by roughly a factor of 3. Likewise, while the epidemiological data clearly indicate an increase in risk with age at expression, the (age-specific) constant relative risk projection may overstate lifetime risk by about a factor of 2 or 3. Allowing even for additional sources of uncertainty discussed above, it would appear that the upper bound (L-RR) model estimate may be high by a factor of 5 to 10. Therefore, as a lower bound estimate of the average lifetime risk, a value which is one-tenth the upper bound, or 120 fatal cancers/106 person- rad, has been adopted.
The L-RR model estimate from BEIR 111, about 400 fatal cancers/106 person-rad, falls near the geometric mean of what tentatively appears to be a reasonable range for the estimate of risk, based on current information. EPA has chosen the BEIR 111, L-RR model value as its "central estimate." It should be emphasized that this estimate cannot be regarded as conservative in the sense of providing any significant margin of safety with respect to public health protection. The decision by EPA to employ the central estimate of 400 fatalities/106 person-rad and a range of 120-1,200 fatalities/106 person-rad was reviewed and approved by a special panel set up by the Agency's outside Radiation Advisory Committee and by the Committee itself, as an interim measure for this proposed rulemaking.
The uncertainty in risks for specific cancer sites may be substantially larger than the uncertainty in the whole-body risk. One reason is that the epidemiological data pertaining to some sites may be very sparse. In addition, the uncertainty in projecting risk from one population to another (e.g., Japanese to U.S.) is important at sites for which incidence rates differ markedly between populations.
The uncertainties in risk associated with internally deposited alpha emitters are often greater than for low-LET radiation. Human epidemiological data on the risks from alpha emitters are largely confined to: (1) lung cancer induced by radon decay products (see below); (2) bone cancer induced by radium; and (3) liver cancer induced by injected thorotrast (thorium). Many of the risk estimates presented here for alpha irradiation are extrapolated from those for low-LET irradiation, assuming an RBE of 8, as determined from high dose experiments on animals. The available evidence on cells, animals, and humans points to a linear dose response relationship for the risk from alpha emitters (NAS88). The extrapolation to low doses is therefore considered to be less important as a source of uncertainty for alpha
irradiation than for low-LET irradiation. There is, however, considerable variability in the RBE determined from animal studies; the extrapolation of these results to humans is also problematic.
For many alpha-emitting radionuclides, the most important source of uncertainty in the risk estimate is the uncertainty in dose to target cells. Contributing to this uncertainty is uncertainty in the location of these cells, ignorance regarding the metabolism of the radionuclide, uniformity of radionuclide deposition in an organ, and the short range of alpha particles in tissue (see Chapter 5).
In the case of alpha irradiation of the lung by radon decay products, there are human epidemiological data that allow direct estimation of the risk per unit exposure. Knowledge of RBE and the actual dose to target cells is therefore not important except as the dose per unit exposure might differ between mine and indoor environments. As a consequence, the estimated uncertainty in average radon risk estimates is similar to that for low-LET radiation. As discussed in Section 6.4.5, the EPA is employing a central risk estimate for excess radon exposure of 360 fatal lung cancers/106 WLM and an uncertainty range of 160-720 fatal lung cancers/106 WLM.
6.6 OTHER RADIATION-INDUCED HEALTH EFFECTS
The earliest report of radiation-induced health effects was in 1896 (Mo67), and it dealt with - acute effects in skin generally caused by very large x-ray exposures. Within the six-year period following, 170 radiation-related skin damage cases had been reported. Such injury, like many other acute effects, is the result of exposure to hundreds or thousands of rads. Under normal situations, environmental exposure does not cause such large doses, so possible acute effects will not need to be considered in assessing the risk to the general population from routine radionuclide emissions.
Radiation-induced carcinogenesis was the first delayed health effect described: the first case was reported in 1902 (Vo02), and 94 cases of skin cancer and 5 of leukemia were reported by 1911 (Up75). Radiation- induced genetic changes were noted soon afterward. In 1927, H.J. Muller described x-ray-induced mutations in animals (in the insect, Drosophila), and in 1928, L.J. Stadler reported a similar finding in plants (Ki62). At about the same time, radiation effects on the developing human embryo were observed. Case reports in 1929 showed a high rate of microcephaly (small head size) and central nervous system disturbance and one case of skeletal defects in children irradiated -- in utero (UNSCEAR69). These effects, at unrecorded but high exposures and at generally unrecorded gestational ages, appeared to produce central nervous system and eye defects similar to those reported in rats as early as 1922 (Ru50).
For purposes of assessing the risks of environmental exposure to radionuclide emissions, the genetic effects and -- in utero developmental effects are the only health hazards other than cancer that are addressed in this Background Information Document (BID).
6.6.1 Types of Genetic iiarm and Duration of Expression
Genetic harm (or the genetic effects) of radiation exposure is defined as stable, heritable changes induced in the germ cells (eggs or sperm) of exposed individuals, which are transmitted to and expressed only in their progeny and in future generations.
Of the possible consequences of radiation exposure, the genetic risk is more subtle than the somatic risk, since it affects not the persons exposed, but relates only to subsequent progeny. Hence, the time scales for expression of the risk are very different. Somatic effects are expressed over a period on the order of a lifetime, while about 30 subsequent generations (nearly 1,000 years) are needed for near comp1.ete expression of genetic effects. Genetic risk is incurred by fertile people when radiation damages the nucleus of the cells which become their eggs or sperm. The damage, in the form of a mutation or a chromosomal aberration, is transmitted to, and may be expressed in, a child conceived after the radiation exposure. However, the damage may also be expressed in subsequent generations or only after many generations. Alternatively, it may never be expressed because of failure to reproduce or failure of the chance to reproduce.
EPA treats genetic risk as independent of somatic risk even though somatic risk may be caused by mutations in somatic cells because, whereas somatic risk is expressed in the person exposed, genetic risk is expressed only in progeny and, in general, over many subsequent generations. Moreover, the types of damage incurred often differ in kind from cancer and cancer death. Historically, research on genetic effects and development of risk estimates have proceeded independently of the research on carcinogenesis. Neither the dose response models nor the risk estimates of genetic harm are derived from data on studies of carcinogenesis.
Although genetic effects may vary greatly in severity, the genetic risks considered by the Agency in evaluating the hazard of radiation exposure include only those "disorders and traits that cause a serious handicap at some time during lifetime" (NAS80). Genetic risk may result from one of several types of damage that ionizing radiation can cause in the DNA within eggs and sperm. The types of damage usually considered are: dominant and recessive mutations in autosomal chromosomes, mutations in sex-linked (x-linked) chromosomes, chromosome aberrations (physical rearrangement or removal of part of the genetic message on the chromosome or abnormal numbers of chromosomes), and irregularly inherited disorders (genetic conditions with complex causes, constitutional and degenerative diseases, etc.).
Estimates of the genetic risk per generation are conventionally based on a 30-yr reproductive generation. That is, the median parental age for production of children is defined as age 30 (one-half the children are produced by persons less than age 30, the other half by persons over age 30). Thus, the radiation dose accumulated up to age 30 is used to estimate the genetic risks. EPA assessment of risks of
genetic effects includes both first generation estimates and total genetic burden estimates.
In the EPA Background Information Document for Radionuclides (EPA84), direct and indirect methods for obtaining genetic risk coefficients are described, and some recent estimates based on these methods are tabulated. Briefly, the direct method takes the frequency of mutation or occurrence of a heritable defect per unit exposure observed in animal studies and extrapolates to what is expected for humans. Direct estimates are usually used for first generation effects estimates. The indirect method, on the other hand, uses animal data in a different way. The estimated human spontaneous mutation rate per gene site is divided by the average radiation-induced mutation rate per gene observed in mouse studies, to obtain the relative radiation mutation risk in humans. The inverse of this relative radiation mutation risk is the expected "doubling dose" for radiation-induced mutations in man. The doubling dose is the exposure in rads which will double the current genetic malformation level in man and usually is used to estimate equilibrium effects or all future generation effects.
A doubling dose estimate assumes that the total population of both sexes is equally irradiated, as occurs from background radiation, and that the population exposed is large enough so that all genetic damage can be expressed in future offspring. Although it is basically an estimate of the total genetic burden across all future generations, it can also provide an estimate of effects that occur in the first generation. Usually a fraction of the total genetic burden for each type of damage is assigned to the first generation using population genetics data as a basis to determine the fraction. For example, the BEIR 111 Committee geneticists estimated that one-sixth of the total genetic burden of x-linked mutations would be expressed in the first generation and five-sixths across all subsequent generations. EPA assessment of risks of genetic effects includes both first generation estimates and total genetic burden estimates.
6.6.2 Estimates of Genetic Harm Resulting from Low-LET Radiations
A number of committees have addressed the question of genetic risk coefficient (NAS72,80; UNSCEAR 58,62,66,72,77,82; Of80) . The detailed estimates of the BEIR I11 Committee (NAS80) are listed in Table 6-17, and a summary of estimates of the various committees is listed in Table 6-18.
Although all of the reports cited above used somewhat different sources of information, there is reasonable agreement in the estimates. However, all these estimates have a a considerable margin of error, both inherent in the original observations and in the extrapolations from experimental species to man. Some of the committee reports assessing the situation have attempted to indicate the range of uncertainty; others have simply used a central estimate (see Table 6-18). The same uncertainties exist for the latter (central estimates) as for the former.
Most of the difference is caused by the newer information used in each report. Note that all of these estimates are based on the
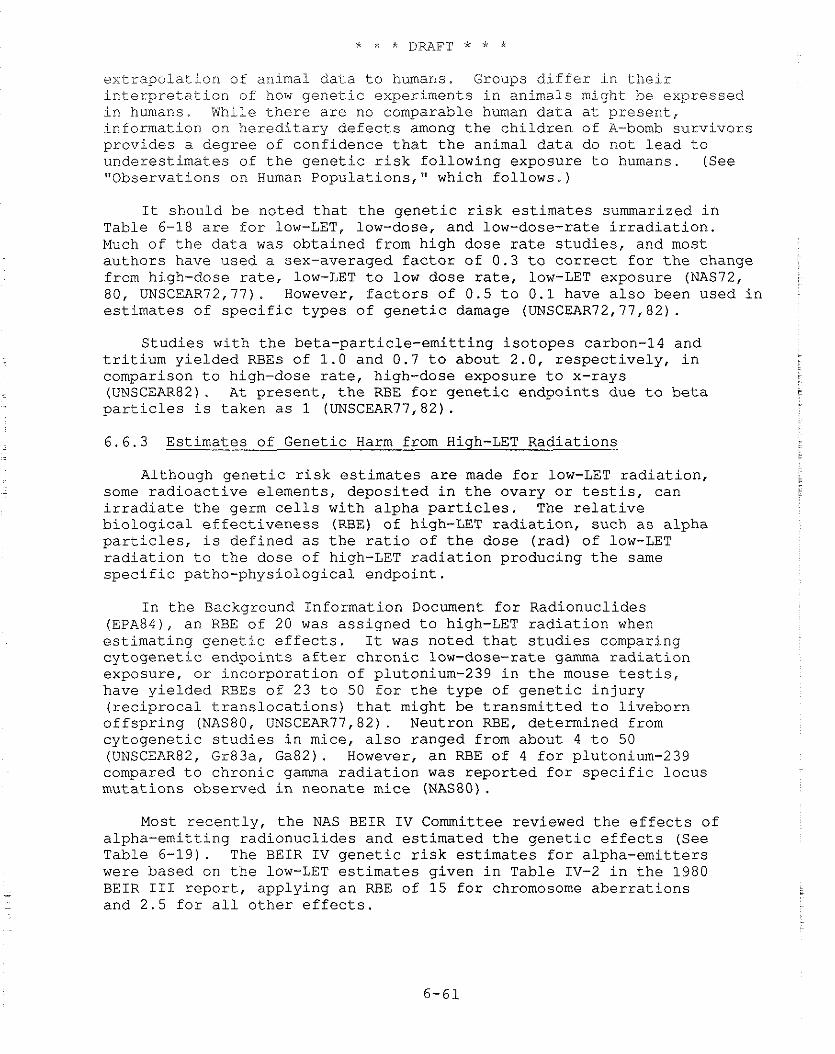
extrapolation of animal data to humans. Groups differ in their interpretation of how genetic experiments in animals might be expressed in humans. While there are no comparable human data at present, information on hereditary defects among the children of A-bomb survivors provides a degree of confidence that the animal data do not lead to underestimates of the genetic risk following exposure to humans. (See "Observations on Human Populations," which follows.)
It should be noted that the genetic risk estimates summarized in Table 6-18 are for low-LET, low-dose, and low-dose-rate irradiation. Much of the data was obtained from high dose rate studies, and most authors have used a sex-averaged factor of 0.3 to correct for the change from high-dose rate, low-LET to low dose rate, low-LET exposure (NAS72, 80, UNSCEAR72,77). However, factors of 0.5 to 0.1 have also been used in estimates of specific types of genetic damage (UNSCEAR72,77,82).
Studies with the beta-particle-emitting isotopes carbon-14 and tritium yielded RBEs of 1.0 and 0.7 to about 2.0, respectively, in comparison to high-dose rate, high-dose exposure to x-rays (UNSCEAR82). At present, the RBE for genetic endpoints due to beta particles is taken as 1 (UNSCEAR77,82).
6.6.3 Estimates of Genetic Harm from High-LET Radiations
Although genetic risk estimates are made for low-LET radiation, some radioactive elements, deposited in the ovary or testis, can irradiate the germ cells with alpha particles. The relative biological effectiveness (RBE) of high-LET radiation, such as alpha particles, is defined as the ratio of the dose (rad) of low-LET radiation to the dose of high-LET radiation producing the same specific patho-physiological endpoint.
In the Background Information Document for Radionuclides (EPA84), an RBE of 20 was assigned to high-LET radiation when estimating genetic effects. It was noted that studies comparing cytogenetic endpoints after chronic low-dose-rate gamma radiation exposure, or incorporation of plutonium-239 in the mouse testis, have yielded RBEs of 23 to 50 for the type of genetic injury (reciprocal translocations) that might be transmitted to liveborn offspring (NAS80, UNSCEAR77,82). Neutron RBE, determined from cytogenetic studies in mice, also ranged from about 4 to 50 (UNSCEAR82, Gr83a, Ga82). However, an RBE of 4 for plutonium-239 compared to chronic gamma radiation was reported for specific locus mutations observed in neonate mice (NASBO).
Most recently, the NAS BEIR IV Committee reviewed the effects of alpha-emitting radionuclides and estimated the genetic effects (See Table 6-19). The BEIR IV genetic risk estimates for alpha-emitters were based on the low-LET estimates given in Table IV-2 in the 1980 BEIR I11 report, applying an RBE of 15 for chromosome aberrations and 2.5 for all other effects.
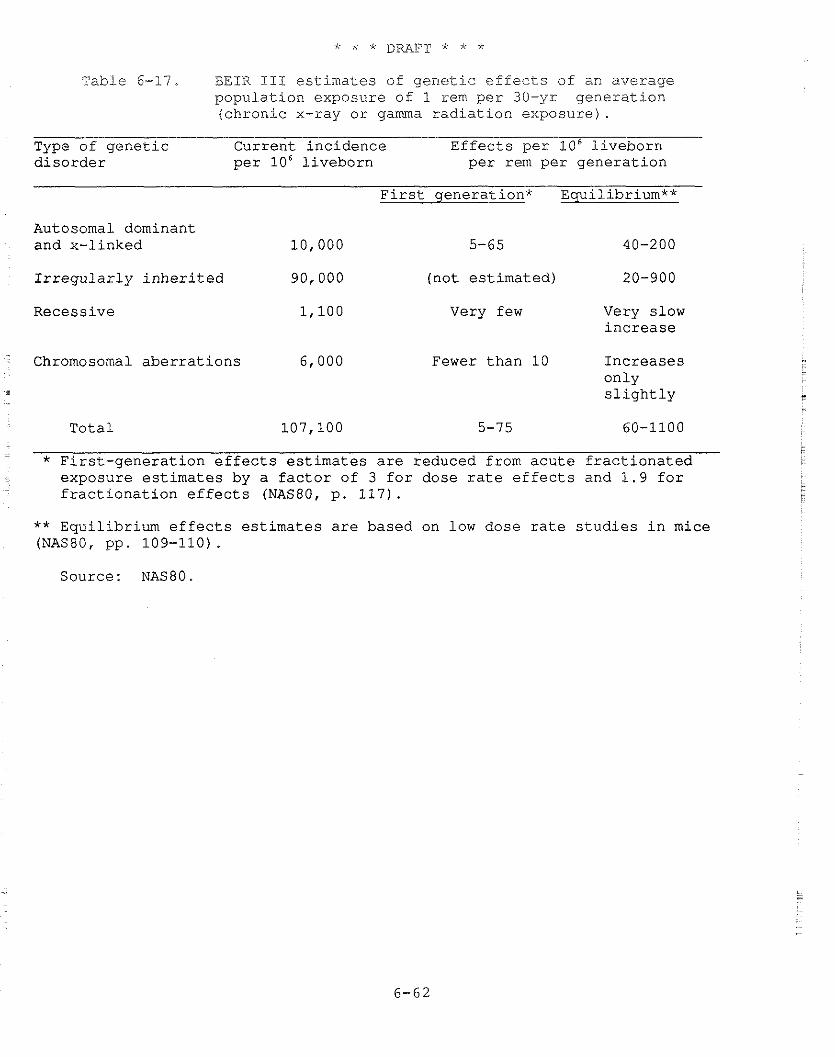
Table 6-17. BEIR 111 estimates of genetic effects of an average population exposure of 1 rem per 30-yr generation (chronic x-ray or gamma radiation exposure).
Type of genetic Current incidence Effects per lo6 liveborn disorder per 10' liveborn per rem per generation
First generation* Equilibrium**
Autosomal dominant and x-linked 10,000 5-65 40-200
Irregularly inherited 90,000 (not estimated) 20-900
Recessive Very few Very slow increase
Chromosomal aberrations 6,000 Fewer than 10 Increases only - slightly
Total 107,100 5-75 60-1100
* First-generation effects estimates are reduced from acute fractionated exposure estimates by a factor of 3 for dose rate effects and 1.9 for
- fractionation effects (NAS80, p. 117).
** Equilibrium effects estimates are based on low dose rate studies in mice (NAS80, pp. 109-110) .
Source: NAS80.
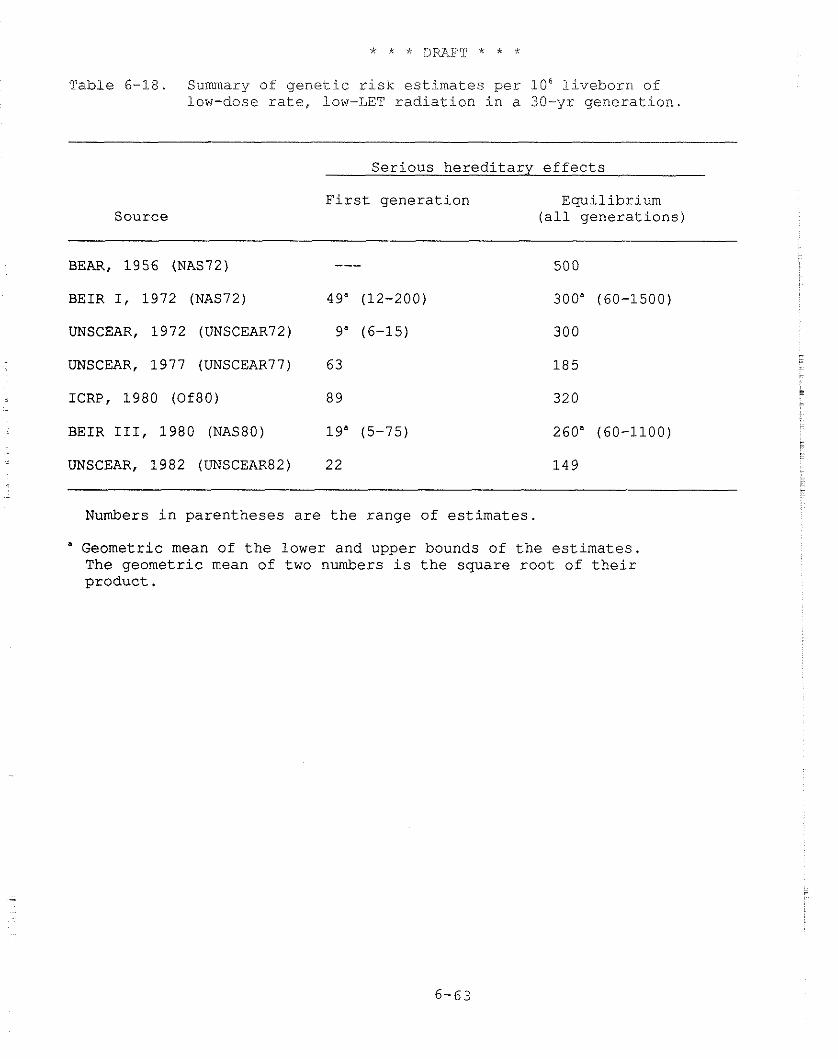
Table 6-18. Summary of genetic zisk estimates per l o 6 liveborn of low-dose rate, low-LET radiation in a 30-yr generation.
Source
Serious hereditary effects
First generation Equilibrium (all generations)
BEAR, 1956 (NAS72) ---
BEIR I, 1972 (NAS72) 49" (12-200)
UNSCEAR, 1972 (UNSCEAR72) 9" (6-15)
UNSCEAR, 1977 (UNSCEAR77) 6 3
ICRP, 1980 (Of80) 8 9
BEIR 111, 1980 (NAS80) 19" (5-75)
UNSCEAR, 1982 (UNSCEAR82) 22
Numbers in parentheses are the range of estimates.
" Geometric mean of the lower and upper bounds of the estimates The geometric mean of two numbers is the square root of their product.
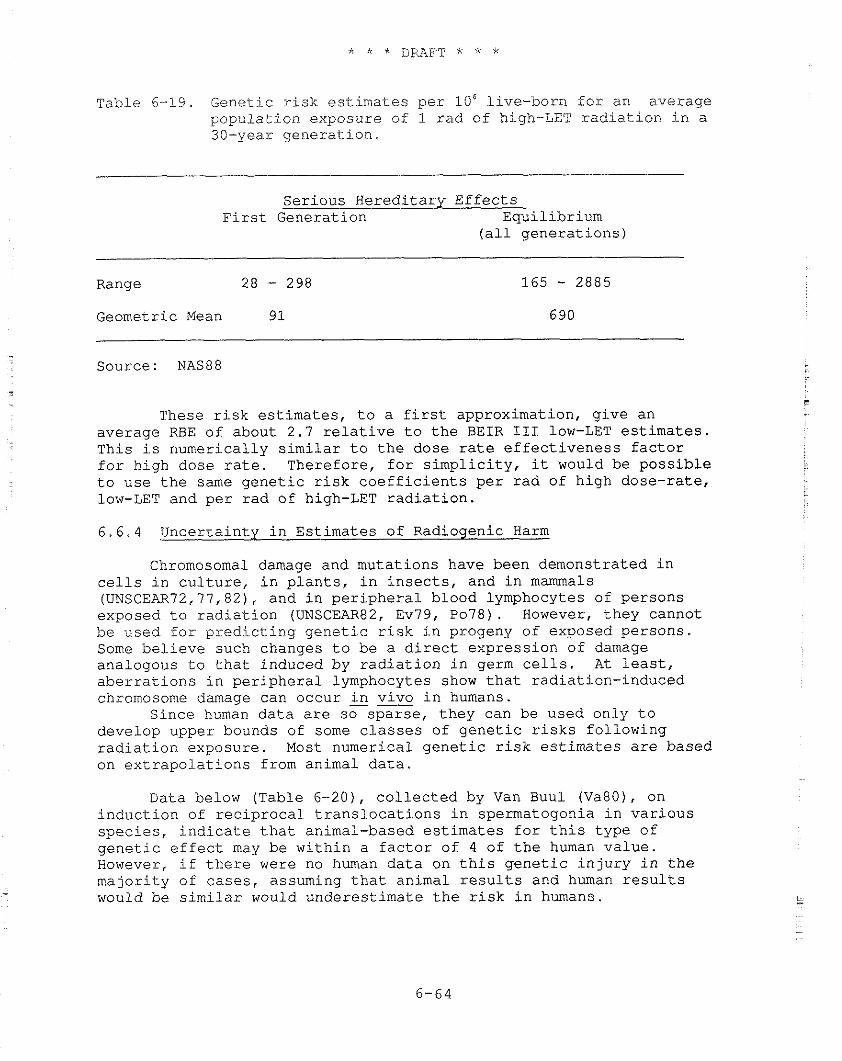
Table 6-19. Genetic risk estimates per 106 live-born for an average population exposure of 1 rad of high-LET radiation in a 30-year generation.
Serious Hereditary Effects First Generation Equilibrium
(all generations)
Range 28 - 298 Geometric Mean 9 1
- -
Source: NAS88
These risk estimates, to a first approximation, give an average RBE of about 2.7 relative to the BEIR I11 low-LET estimates. This is numerically similar to the dose rate effectiveness factor for high dose rate. Therefore, for simplicity, it would be possible to use the same genetic risk coefficients per rad of high dose-rate, low-LET and per rad of high-LET radiation.
6.6.4 Uncertainty in Estimates of Radiogenic Harm
Chromosomal damage and mutations have been demonstrated in cells in culture, in plants, in insects, and in mammals (UNSCEAR'72,77,82), and in peripheral blood lymphocytes of persons exposed to radiation (UNSCEAR82, Ev79, Po78). However, they cannot be used for predicting genetic risk in progeny of exposed persons. Some believe such changes to be a direct expression of damage analogous to that induced by radiation in germ cells. At least, aberrations in peripheral lymphocytes show that radiation-induced chromosome damage can occur in vivo in humans.
Since human data are so sparse, they can be used only to develop upper bounds of some classes of genetic risks following radiation exposure. Most numerical genetic risk estimates are based on extrapolations from animal data.
Data below (Table 6-20), collected by Van Buul (Va80), on induction of reciprocal translocations in spermatogonia in various species, indicate that animal-based estimates for this type of genetic effect may be within a factor of 4 of the human value. However, if there were no human data on this genetic injury in the majority of cases, assuming that animal results and human results would be similar would underestimate the risk in humans.
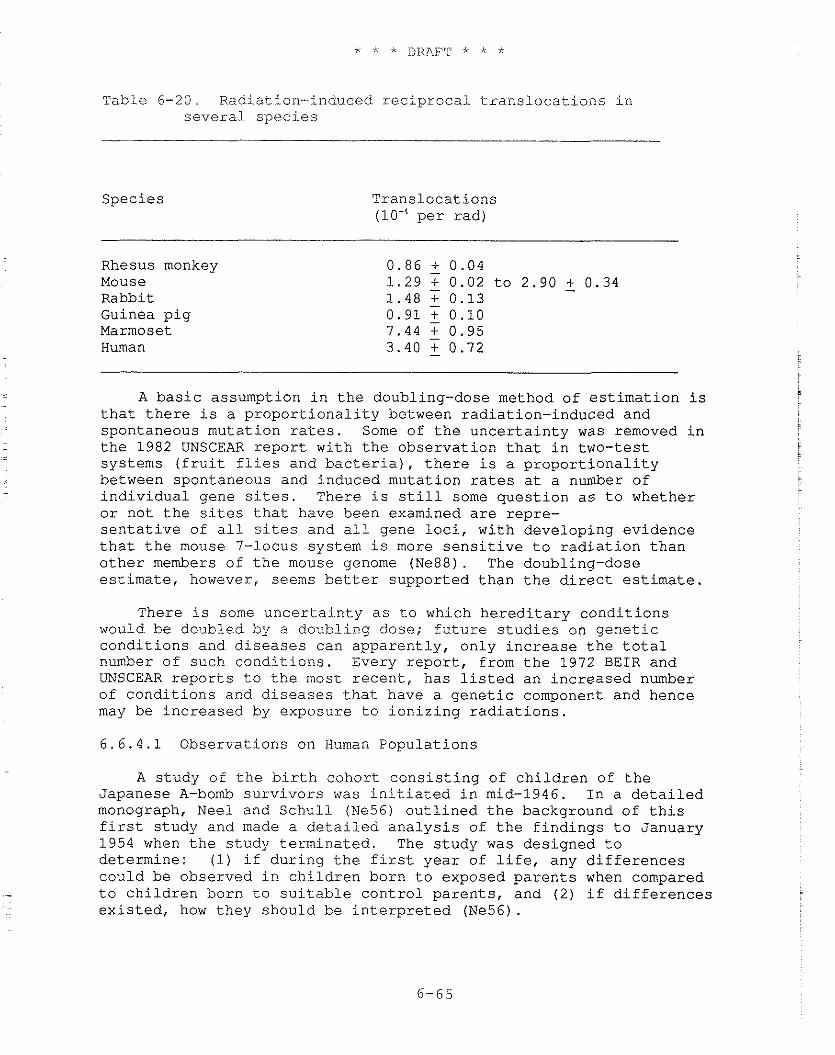
Table 6-20. Radiat ion-induced r e c i p r o c a l t r a n s l o c a t i o n s i n s e v e r a l s p e c i e s
Spec ie s Trans loca t ions (lo-' p e r r a d )
Rhesus monkey 0.86 + 0.04 Mouse 1 .29 7 0.02 t o 2 .90 + 0.34 - Rabbit 1 .48 T 0.13 Guinea p i g 0.91 7 0.10 Marmoset 7.44 T 0.95 Human 3.40 - 0.72
A b a s i c assumption i n t h e doubling-dose method of e s t i m a t i o n i s t h a t t h e r e i s a p r o p o r t i o n a l i t y between rad ia t ion- induced and spontaneous muta t ion r a t e s . Some of t h e u n c e r t a i n t y was removed i n t h e 1982 UNSCEAR r e p o r t wi th t h e obse rva t ion t h a t i n two- tes t systems ( f r u i t f l i e s and b a c t e r i a ) , t h e r e i s a p r o p o r t i o n a l i t y between spontaneous and induced muta t ion r a t e s a t a number of i n d i v i d u a l gene si tes. There i s s t i l l some q u e s t i o n a s t o whether o r no t t h e s i t e s t h a t have been examined a r e repre- s e n t a t i v e of a i l s i t e s and a11 gene l o c i , wi th deve loping ev idence t h a t t h e mouse 7-locus system i s more s e n s i t i v e t o r a d i a t i o n t h a n o t h e r members of t h e mouse genome (Ne88). The doubling-dose e s t i m a t e , however, seems b e t t e r suppor ted t h a n t h e d i r e c t estimate.
There i s some u n c e r t a i n t y a s t o which h e r e d i t a r y c o n d i t i o n s would be doubled by a doubl ing dose; f u t u r e s t u d i e s on g e n e t i c c o n d i t i o n s and. d i s e a s e s can appa ren t ly , on ly i n c r e a s e t h e t o t a l number of such c o n d i t i o n s . Every r e p o r t , from t h e 1972 B E I R and UNSCEAR r e p o r t s t o t h e most r e c e n t , has l i s t e d an i n c r e a s e d number of c o n d i t i o n s and d i s e a s e s t h a t have a g e n e t i c component and hence may be i n c r e a s e d by exposure t o i o n i z i n g r a d i a t i o n s .
6 . 6 . 4 . 1 Observa t ions on Human Popu la t ions
A s tudy of t h e b i r t h cohor t c o n s i s t i n g of c h i l d r e n of t h e Japanese A-bomb s u r v i v o r s was i n i t i a t e d i n mid-1946. I n a d e t a i l e d monograph, Nee1 and S c h u l l (Ne56) o u t l i n e d t h e background of t h i s f i r s t s tudy and made a d e t a i l e d a n a l y s i s of t h e f i n d i n g s t o January 1954 when t h e s tudy t e rmina ted . The s tudy was des igned t o de te rmine : (1) if d u r i n g t h e f i r s t y e a r of l i f e , any d i f f e r e n c e s cou ld be observed i n c h i l d r e n born t o exposed p a r e n t s when compared t o c h i l d r e n born t o s u i t a b l e c o n t r o l p a r e n t s , and (2 ) i f d i f f e r e n c e s e x i s t e d , how they should be i n t e r p r e t e d (Ne56).
'This study addressed a number of endpoints, inclridirlg sex rati.0, malformations, perinatal data, and anthropometric data; subsequent studies have addressed other endpoints. Recent reports on this birth cohort of 70,082 persons have reported data on si.x endpoints. Frequency of stillbirths, major congenital defects, prenatal death, and frequency of death prior to age 17 have been examined in the entire cohort. Frequency of cytogenetic aberrations (sex chromosome aneuploidy) and frequency of biochemical variants (a variant enzyme or protein electrophoresis pattern) have been measured on large subsets of this cohort.
There were small but statistically insignificant differences between the number of effects in the children of the proximally and distally exposed with respect to these various indicators. These differences are in the direction of the hypothesis that mutations were produced by the parental exposure. Taking these differences then as the point of departure for an estimate of the human doubling dose, an estimated doubling dose for low-LET radiation at high doses and dose rates for human genetic effects of about 156 rem (Sc81) or 250 rem (Sa82) was obtained as an unweighted average. When each individual estlmate was weighted by the inverse of its variance, an average of 139 rem was found (Sc84). Because of the assumptions necessary for these calculations, as well as the Inherent statistical errors, the errors associated with these estimates are rather large. As a result, a reasonable lower bound to the human estimate overlaps much of the range based on extrapolation from mouse data.
The most recent report evaluated the following possible genetic effects: (1) .untoward pregnancy outcomes, (2) all causes of early mortality, (3) balanced chromosomal exchanges, (4) sex-chromosome aneuploids, (5) early onset cancer, and (6) protein mutations. On the basis of the findings of the study, the authors concluded that the gametic doubling dose measured in humans for acute penetrating radiation exposure from atomic bombs is 150 rem to 190 rem (Ne88).
The EPA is using the geometric mean of the BEIR 111 range of doubling doses: about 110 rads. EPA believes thLs estimate of doubling dose probably overstates the risk; however, it is compatible with both human and mouse data and should not be changed ac this time. EPA estimates of genetic risks will be reviewed and revised, if necessary, when more complete reports on the Japanese A- bomb survivors are published.
6.6.4.2 Ranges of Estimates Provided by Various Models
Following recommendations of the 1980 BEIR I11 and earlier committees, EPA has continued to use a linear nonthreshold model for estimating genetic effects, although some data on specific genetic
- endpoints obtained with acute low-LET exposures are equally well described by a linear-quadratic function. Moreover, in some of these cases, it has been found that a reduction in dose rate (or fractionation of dose) produced a reductjon in the quadratic term
seen at high doses with little or no effect on the linear component. Such observations can be quali-tatively explained, as previously discussed in reference to somatic effects (Section 6.2.21, in terms of the dual radiation action theory of Kellerer and Rossi (Ke72), as well as alternative theories, e.g., one involving enzyme saturation (Go80, Ru58).
Even though genetic risk estimates made by different committees based on the linear non-threshold model vary, the agreement is reasonably good. Some of the committees made estimates in terms of a range. These ranges are expressed as a single value by taking the geometric mean of the range. This method was recommended and first used by UNSCEAR (UNSCEAR58) for purposes of expressing genetic risk estimates. While the authors of the reports used different animal models, interpreted them in different ways, and had different estimates of the level of human genetic conditions in the population, the range of risk coefficients is about an order of magnitude (see Table 6-18). For the most recent, more comparable estimates, the range is a factor of 2 to 4 (see ICRP, BEIR 111, and UNSCEAR 1982 in Table 6-18) . 6.6.5 The EPA Genetic Risk Estimates
EPA has used the estimates from BEIR 111 (NAS80) based on a "doubling dose" range with a lower bound of 50 rem and an upper bound of 250 rem. The reasons are as follows: mutation rates for all gene loci affected by ionizing radiation are not known nor have all loci associated with "serious" genetic conditions been identified. Because the risk estimated by the direct method is incomplete, even for the subject animal species, and does not include the same types of damage estimated by doubling doses, EPA does not consider it further. Moreover, the BEIR 111 genetic risk estimates provide a better estimate of uncertainty than the UNSCEAR 1982 and ICRP estimates because the BEIR I11 Committee assigned a range of uncertainty for multifactorial diseases (1 5 percent to < 50 percent) that reflects the uncertainty in the numbers better than the other estimates (5 percent and 10 percent, respectively).
The BEIR 111 estimates for low-LET radiations give a considerable range. To express the range as a single estimate, the geometric mean of the range is used, a method first recommended by UNSCEAR (UNSCEAR58) for purposes of calculating genetic risk. The factor of 3 increase in risk for high-dose rate, low-LET radiation, noted earlier, is also used. The weighted RBE for high-LET radiation as estimated in BEIR IV is about 3, which is numerically the same as the dose rate factor noted above.
Genetic risk estimates used by EPA for high- and low-LET radiations are listed in Table 6-23.. As noted above (Section 6.6.1), EPA uses the dose received before age 30 in assessing genetic risks.
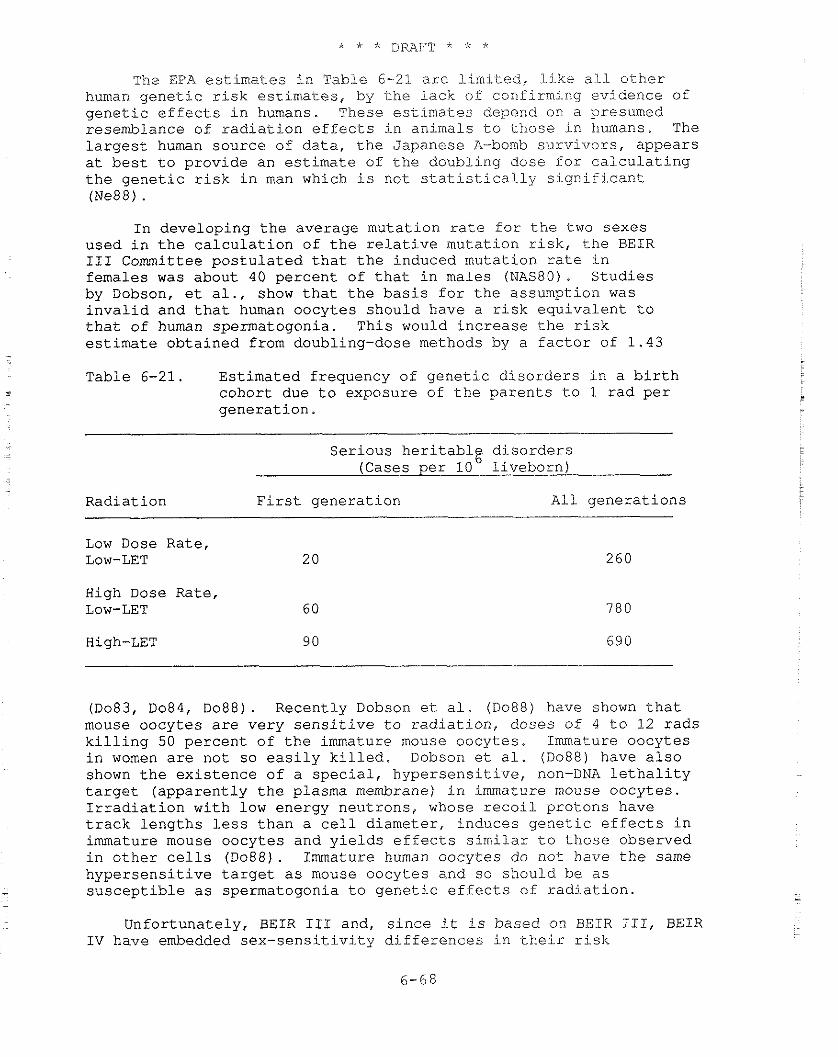
The EPA e s t i m a t e s i n Table 6-21 a r e l i m i t e d , l i k e a l l o t h e r human g e n e t i c r i s k e s t i m a t e s , by t h e l a c k of confirming ev idence of g e n e t i c e f f e c t s i n humans. These e s t i m a t e s depend on a presumed resemblance of r a d i a t i o n e f f e c t s i n animals t o t h o s e i n humans. The l a r g e s t human source of d a t a , t h e Japanese A-bomb s u r v i v o r s , appears a t b e s t t o p rov ide an e s t i m a t e of t h e doubl ing dose f o r c a l c u l a t i n g t h e g e n e t i c r i s k i n man which i s not s t a t i s t i c a l . 1 y s i g n i f i c a n t (Ne88) .
I n deve loping t h e average muta t ion r a t e f o r t h e two sexes used i n t h e c a l c u l a t i o n of t h e r e l a t i v e muta t ion r i s k , t h e BEIR I11 Committee p o s t u l a t e d t h a t t h e induced muta t ion r a t e i n females was about 40 pe rcen t of t h a t i n males (NAS80). S t u d i e s by Dobson, e t a l . , show t h a t t h e b a s i s f o r t h e assumption was i n v a l i d and t h a t human oocy tes should have a r i s k e q u i v a l e n t t o t h a t of human spermatogonia. This would i n c r e a s e t h e r i s k e s t i m a t e o b t a i n e d from doubling-dose methods by a f a c t o r of 1 . 4 3 - Table 6-21. Es t imated frequency of g e n e t i c d i s o r d e r s i n a b i r t h - cohor t due t o exposure of t h e p a r e n t s t o 1 r a d p e r
. g e n e r a t i o n .
Se r ious h e r i t a b l g d i s o r d e r s -
(Cases p e r 10 l i v e b o r n ) .
Radia t ion F i r s t g e n e r a t i o n A l l g e n e r a t i o n s
Low Dose Rate , Low-LET 20
High Dose Rate, Low-LET 60
(Do83, Do84, D088) . Recent ly Dobson e t a l . (Do88) have shown t h a t mouse oocy te s a r e ve ry s e n s i t i v e t o r a d i a t i o n , doses of 4 t o 12 r a d s k i l l i n g 50 p e r c e n t of t h e immature mouse oocy te s . Immature oocy te s i n women a r e not so e a s i l y k i l l e d . Dobson e t a l . (Do88) have a l s o shown t h e e x i s t e n c e of a s p e c i a l , h y p e r s e n s i t i v e , non-DNA l e t h a l i t y t a r g e t ( a p p a r e n t l y t h e plasma membrane) i n immature mouse oocy te s . I r r a d i a t i o n wi th low energy neut rons , whose r e c o i l p ro tons have t r a c k l e n g t h s l e s s t h a n a c e l l d iameter , induces g e n e t i c e f f e c t s i n immature mouse oocy te s and y i e l d s e f f e c ~ s s i m i l a r t o t h o s e observed i n o t h e r c e l l s (Do88). Immature human oocy tes do not have t h e same h y p e r s e n s i t i v e t a r g e t a s mouse oocy te s and so should be a s
- s u s c e p t i b l e a s spermatogonia t o g e n e t i c e f f e c t s of r a d i a t i o n .
Unfor tuna te ly , B E I R 111 and, s i n c e i t i s based on B G I R 111, BEIR I V have embedded sex - sens i t . i v3 . t~ d i f f e r e n c e s i n t h e i r r i s k
estimates. In BEIR 111: (1) autosomal dominants and X-iinked effects are based on a lower estimate where the oocyte has zero sensitivity and an upper estimate where the oocyte is 44 percent as sensitive as spermatogonia (p. 118); (2) irregularly inherited effects are based on an estimate where the oocyte is 44 percent as sensitive as spermatogonia (pp. 114 and 110); and (3) chromosomal aberrations estimates are based on oocytes and spermatogonia of equal sensitivity (p. 123, NASBO) .
Since the sex-specific differences are in both BEIR I11 and BEIR IV, no attempt is made at this time to correct them. After BEIR V is published, EPA's genetic risk estimates will be reviewed and may then be revised.
The combined uncertainties in doubling-dose estimates and the magnitude of genetic contributions to various disorders probably introduce an overall uncertainty of about an order of magnitude in the risk estimates. Moreover, the BEIR Committee, in deriving its estimate, has assumed that almost all of the risk was due to irregularly inherited mutations which would be eliminated slowly. They may include mild mutations which are but slightly detrimental in their heterozygous state. However, they may be sustained by advances in medical science, thus persisting and accumulating for generations. To what extent this occurs will depend on medical practices in the future.
6.6.6 Effects of Multigeneration Exposures
As noted earlier, while the somatic effects (cancer) occur in persons exposed to ionizing radiation, the genetic effects occur in progeny, perhaps generations later. The number of effects appearing in the first generation is based on direct estimates of the mutations induced by irradiation and should not change appreciably regardless of the background or "spontaneous" mutation rate in the exposed population. The estimate for total genetic effects, or the equilibrium estimate, is based on the doubling-dose concept. For these estimates, the background mutation rate is important: it is the background rate that is being "doubled."
If there is long-lived environmental contamination, such that 30 generations or more are exposed (N1000 years), the background mutation rate will change and come into equilibrium with the new level of radiation background. There will be an accumulation of new radiation-induced mutations until the background mutation rate has reached equilibrium with this continued insult.
While predicting 1,000 years in the future is chancy at best, if it is assumed that there are no medical advances, and no changes in man or his environment, then an estimate can be made. In Table 6-
- 21, it is estimated that exposure to 1 rad per generation of low- dose-rate, low-LET radiation will induce 260 cases of serious heritable disorders per lo6 live births in all generations. This is for a background mutation rate leading to 29,120 cases of serious
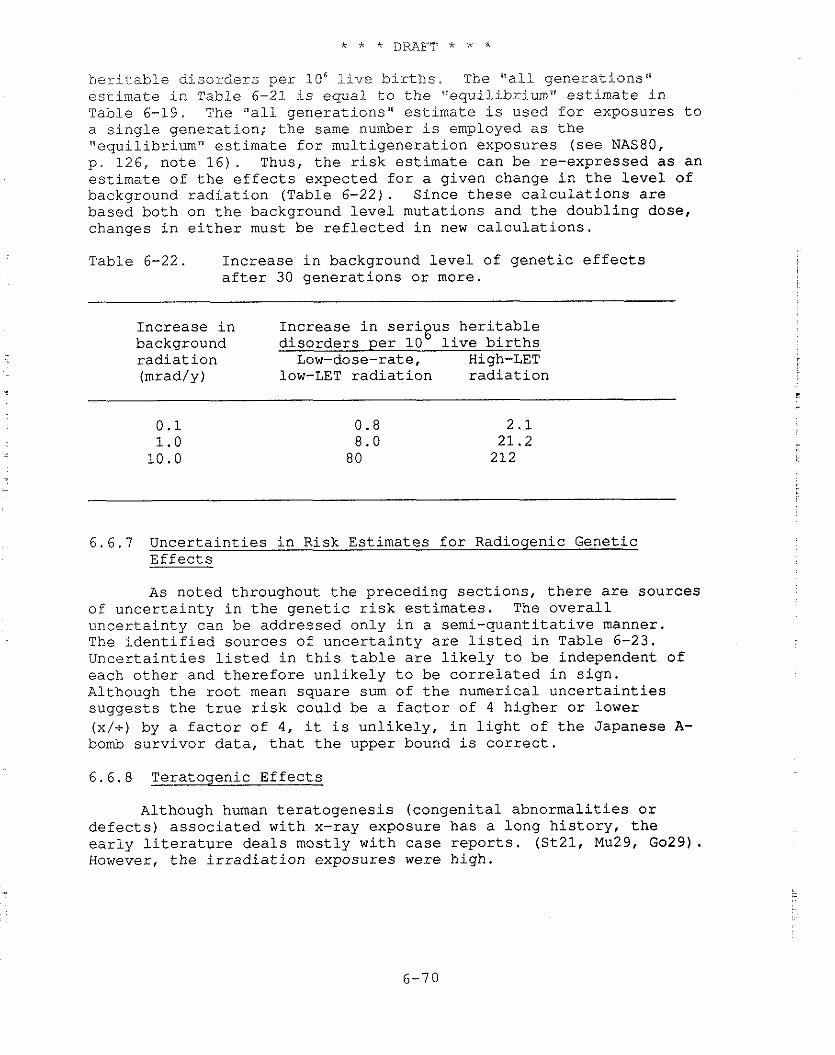
heritable disorders per 106 Live births. The "all generations'" estimate in Table 6-21 is equal to the "equilibrium" estimate in Table 6-19. The "all generations" estimate is used for exposures to a single generation; the same number is employed as the "equilibrium" estimate for multigeneration exposures (see NAS80, p. 126, note 16). Thus, the risk estimate can be re-expressed as an estimate of the effects expected for a given change in the level of background radiation (Table 6-22). Since these calculations are based both on the background level mutations and the doubling dose, changes in either must be reflected in new calculations.
Table 6-22. Increase in background level of genetic effects after 30 generations or more.
Increase in Increase in serious heritable background disorders per lob live births radiation Low-dose-rate, High-LET (mrad/y) low-LET radiation radiation
6.6.7 Uncertainties in Risk Estimates for Radiogenic Genetic Effects
As noted throughout the preceding sections, there are sources of uncertainty in the genetic risk estimates. The overall uncertainty can be addressed only in a semi-quantitative manner. The identified sources of uncertainty are listed in Table 6-23. Uncertainties listed in this table are likely to be independent of each other and therefore unlikely to be correlated in sign. Although the root mean square sum of the numerical uncertainties suggests the true risk could be a factor of 4 higher or lower (x/t) by a factor of 4, it is unlikely, in light of the Japanese A- bomb survivor data, that the upper bound is correct.
6.6.8 Teratogenic Effects
Although human teratogenesis (congenital abnormalities or defects) associated with x-ray exposure has a long history, the early literature deals mostly with case reports. (St21, Mu29, Go29). However, the irradiation exposures were high.
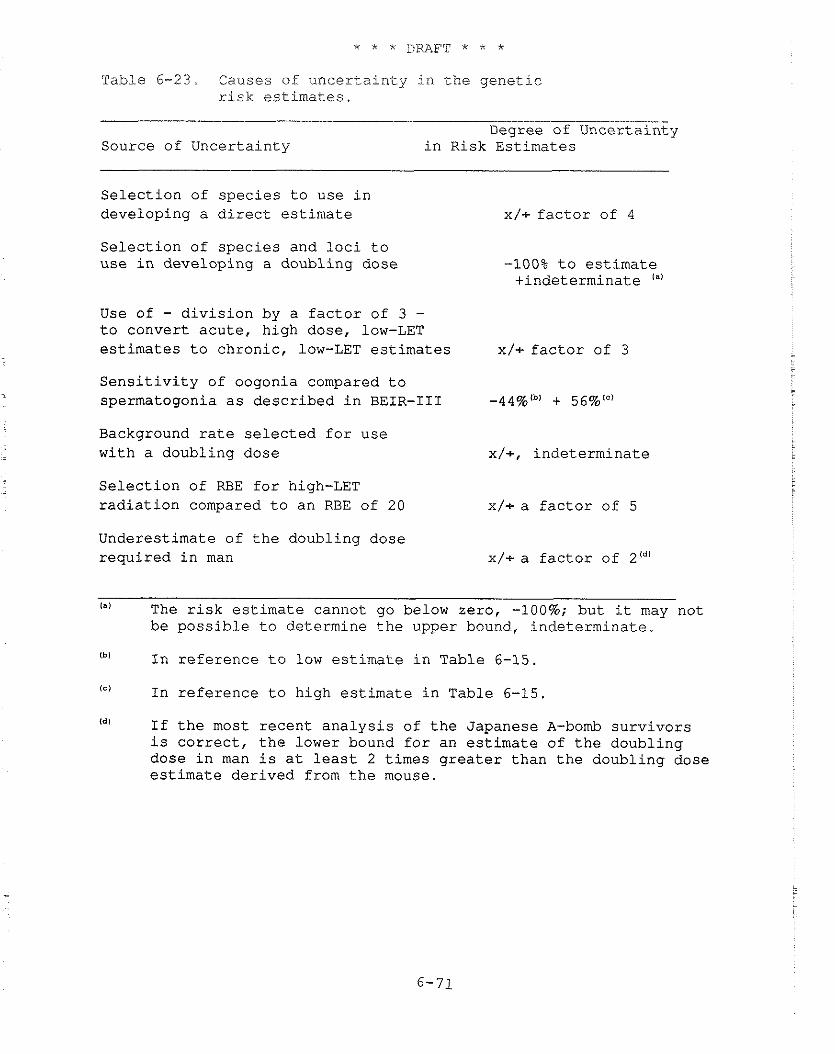
Table 6-23. Causes of uncertainty in the genetic risk estimates.
Degree of Uncertainty Source of Uncertainty in Risk Estimates
Selection of species to use in developing a direct estimate x/+ factor of 4
Selection of species and loci to use in developing a doubling dose -100% to estimate
+indeterminate ''I
Use of - division by a factor of 3 - to convert acute, high dose, low-LET estimates to chronic, low-LET estimates x/+ factor of 3
Sensitivity of oogonia compared to spermatogonia as described in BEIR-I11 -44%Ib' + 56%"'
Background rate selected for use with a doubling dose x/+, indeterminate
Selection of RBE for high-LET radiation compared to an RBE of 20 x/+ a factor of 5
Underestimate of the doubling dose required in man x/+ a factor of 2Id'
la) The risk estimate cannot go below zero, -100%; but it may not
be possible to determine the upper bound, indeterminate.
(bl In reference to low estimate in Table 6-15
(El In reference to high estimate in Table 6-15.
Id) If the most recent analysis of the Japanese A-bomb survivors is correct, the lower bound for an estimate of the doubling dose in man is at least 2 times greater than the doubling dose estimate derived from the mouse.
In 1930, Murphy exposed rats to x-rays at doses of 200 R to 1,600 R. Of 120 exposed females, 34 had litters, and five of the litters had animals with developmental defects (Mu30). He felt that this study confirmed his clinical observations and earlier reports of animal studies. Although there were additional studies of radiation-induced mammalian teratogenesis before 1950, the majority of the studies were done after that time (see Ru53 for a review), perhaps reflecting concerns about radiation hazards caused by the explosion of nuclear weapons in 1945 (Ja70).
Much of the work done after World War I1 used mice (Ru50, Ru54, Ru56) or rats (Wi54, Hi54). Early studies, at relatively high radiation exposures, 25 R and above, established some dose-response relationships. More important, they established the timetable of sensitivity of the developing rodent embryo and fetus to radiation effects (Ru54, Hi53, Se69, Hi66).
Rugh, in his review of radiation teratogenesis (Ru70), listed the reported mammalian anomalies and the exposures causing them. The lowest reported exposure was 12.5 R for structural defects and 1 R for functional defects. He also suggested human exposure between ovulation and about 7 weeks gestational age could lead to structural defects, and exposures from about 6 weeks gestational age until birth could lead to functional defects. In a later review (Ru71), Rugh suggested structural defects in the skeleton might be induced as late as the 10th week of gestation and functional defects as early as the 4th week. It should be noted that the gestation period in mice is much shorter than that in humans and that weeks of gestation referred to above are in terms of equivalent stages of mouse-human development. However, estimates of equivalent gestational age are not very accurate.
Rugh (Ru71) suggested there may be no threshold for radiation- induced congenital effects in the early human fetus. In the case of human microcephaly (small head size) and mental retardation, at least, some data support this theory (Ot83, 84).
However, for most teratogenic effects, the dose response at low doses is not known. In 1978, Michel and Fritz-Niggli (Mi78) reported induction of a significant increase in growth retardation, eye and nervous system abnormalities, and post-implantation losses in mice exposed to 1 R. The increase was still greater if there was concurrent exposure to radiosensitizing chemicals such as iodoacetimide or tetracycline (Mi78).
In other reports of animal studies, it appeared as if teratologic effects, other than perhaps growth retardation, had a threshold for induction of effects (Ru54, Ru53, Wi54). However, Ohzu (Oh65) showed that doses as low as 5 R to preimplantation mouse
- embryos caused increased resorption of implanted embryos and structural abnormalities in survivors. Then in 1970, Jacobsen (Ja70) reported a study in which mice were exposed to 5, 20, or 100 R on the eighth day of pregnancy. He concluded that the dose
response function for induction of skeletal effects was Linear, or nearly linear, with no observable threshold. This appears consistent with a report by Russell ( R u 5 7 ) , which suggested a threshold for some effects whereas others appeared to be linearly proportional to dose.
One of the problems with the teratologic studies in animals is the difficulty of determining how dose response data should be interpreted. Russell (Ru54) pointed out some aspects of the problem: (1) although radiation is absorbed throughout the embryo, it causes selective damage that is consistently dependent on the stage of embryonic development at the time of irradiation, and (2) the damaged parts respond, in a consistent manner, within a narrow time range. However, while low-dose irradiation at a certain stage of development produces changes only in those tissues and systems that are most sensitive at that time, higher doses may induce additional abnormalities in components that are most sensitive at other stages of development, and may further modify expression of the changes induced in parts of the embryo at maximum sensitivity during the time of irradiation. In the first case, damage may be to primordial cells themselves, while in the second, the damage may lead indirectly to the same or different endpoints.
The human embryo/fetus starts as a single, fertilized egg and divides and differentiates to produce the normal infant at term. (The embryonic period, when organs develop, is the period from conception through 7 weeks gestational age. The fetal period, a time of -- in utero growth, is the period from 8 weeks gestational age to birth.) The different organ and tissue primordia develop independently and at different rates. However, they are in contact through chemical induction or evocation (Ar54). These chemical messages between cells are important in bringing about orderly development and the correct timing and fitting together of parts of organs or organisms. While radiation can disrupt this pattern, interpretation of the response may be difficult. Since the cells in the embryo/fetus differentiate, divide, and proliferate at different times during gestation and at different rates, gestational times when cells of specific organs or tissues reach maximum sensitivity to radiation are different. Each embryo/fetus has a different timetable. In fact, each half (left/right) of an embryo/fetus may have a slightly different timetable.
In addition, there is a continuum of variation from the hypothetical normal to the extreme deviant which is obviously recognizable. There is no logical place to draw a line of separation between normal and abnormal. The distinction between minor variations of normal and frank malformation, therefore, is an arbitrary one, and each investigator must establish his or her own criteria and apply them to spontaneous and induced abnormalities alike (HWC73).
The limitations of the human data available make the use of animals in both descriptive and experimental studies inevitable. However, this gives rise to speculation about the possible relevance
of such studies to man. There are species differences in development attributable partly to the differj-ng complexity of the adu3.t organs, but especially to differences in growth :rates and timing of birth in relation to the developmental events. For example, the histological structure of the brain is, in general, surprisingly similar, both in composition and in function, from one mammalian species to another, and the sequence of events is also similar (Do73). However, the processes of brain development that occur from conception to about the second year of life in man are qualitatively similar to those seen in the rat during the first six weeks after conception (Do79, 81) .
For example, a major landmark, the transition from the principal phase of multiplication of the neuronal precursors to that of glial multiplication, occurs shortly before mid-gestation in man, but at about the time of birth in the rat (Do73). In thls respect, then, the rat is much less neurologically mature at birth than the newborn human infant. Many other species are more mature at birth; the spectrum ranges from the late-maturing mouse and rat to the early-maturing guinea pig, with non-human primates much closer to the guinea pig than to man (Do79, 81). As a consequence, it is unreasonable to compare a newborn rat's brain, which has not begun to myelinate, with that of a newborn human which has, or with that of a newborn guinea pig in which myelination has been completed (Do79, 81).
Nevertheless, in the study of teratogenic effects of prenatal exposure to ionizing radiation, in which the timing of the exposure in relation to the program of developmental events dictates the consequences of that insult, it is necessary only to apply the experimental exposure at the appropriate stage (rather than at a similar age) of embryonic or fetal development in any species to produce similar results in all (Do79, 81). The duration of exposure must, however, match the different time scales in the different species. Unless these elementary rules of cross-species adjustments are followed, extrapolation of even qualitative estimates of effects will be of dubious relevance and worth.
Because of the problems in interpretation listed above, a pragmatic approach to evaluation of studies is useful. The dose response should be given as the simplest function that fits the data (often linear or linear with a threshold). No attempt should be made to develop complex dose response models unless the evidence is unequivocal.
6.6.8.1 Teratologic Effects: Mental Retardation in Humans
The first report of congenital abnormalities in children exposed in utero to radiation from atomic bombs was that of Plumer (Pl52). -- Twelve children with microcephaiy, of which ten also had mental retardation, had been identified in Hiroshima in a small set of the in .- utero exposed survivors. They were found as part of a program
started in I.950 i.o st.udy chi]-dren exposed in the first. trimester of gestati.on. However, not all of the in utero exposed survivors were examined. In 1955, the program was expanded to j.ncl.ude all survivors exposed in utero. --
Studies initiated during the program have shown radiation- related (I) growth retardation; (2) increased microcephaly; (3) increased mortality, especially i-nfant mortality; (4) temporary suppression of antibody production against influenza; and (5) increased frequency of chromosomal aberrations in peripheral lymphocytes (Ka.13).
Although there have been a number of studies of Japanese A-bomb survivors, including one showing a dose- and gestational age- related increase in postnatal mortality (Ka73), only the incidences of microcephaly and mental. retardation have been investigated to any great extent. In the most recent report, Otake and Schull (Ot83, 84) showed that mental retardation was particularly associated with exposure between 8 and 15 weeks of gestation (10 to 17 weeks of gestation if counted from the last menstrual period). They further found the data suggested little, if any, non-linearity and were consistent with a linear dose-response relationship for induction of mental retardation that yielded a probability of occurrence of severe mental retardation of 4.16t0.4 cases per 1,000 live births per rad of exposure (Ot84). A child was classified as severely mentally retarded if he or she was "unable to perform simple calculations, to make simple conversation, to care for himself or herself, or if he or she was completely unmanageable or had been insti.tutionalized" (Ot83, 84) . There was, however, no evidence of an effect in those exposed at 0 to 7 weeks of gestation (Ot83). Exposure at 16 weeks or more of gestation was about a factor of 4 less effective, with only a weak relationship between exposure and risk, and with few cases below 50 rads exposure (Ot84).
Mental retardation can be classified as mild (IQ 50-70), moderate (IQ 35-49), severe (IQ 20-341, and profound (IQ < 20) (WH075). However, some investigators use only mild mental retardation (IQ 50-70) and severe mental retardation (IQ < 50) as classes (Gu77b, HaBla, St84). Mental retardation is not usual1.y diagnosed at birth but at some later time, often at school age. Since the mental retardation may have been caused before or during gestation, at the time of birth, or at some time after birth, that fraction caused before or during gestation must be estimated. In like manner, since mental retardation caused before birth may be due to genetic conditions, infections, physiologic conditions, etc., the fraction related to unknown causes during gestation must be estimated. Thi-s is the fraction that might possibly be related to radiation exposure.
Estimates of the risk of mental retardation for a rad of embryo/fetus exposure in the U.S. population can be derived using the absolute risk calculated by Otake and Schull for the Japanese survivors (0t84). Otake and Schull (0t84) gave an estiinate foi: one
case e n t i t l e d , "The R e l a t i o n s h i p of Mental Re ta rda t ion t o Absorbed F e t a l Exposure i n t h e T e n s i t i v e ' Pe r iod When A 1 1 'Contro1s"re Combined." This e s t i m a t e oE frequency of mental r e t a r d a t i o n , 0.416 p e r LOO r a d s , could be d i r e c t l y a p p l i c a b l e t o a U.S. popu la t ion . I n t h i s case , t h e r i s k e s t i m a t e would be about f o u r c a s e s of s e v e r e mental r e t a r d a t i o n p e r 1,000 l i v e b i r t h s p e r r a d of exposure d u r i n g t h e 8 t h and 1 5 t h week of g e s t a t i o n .
The ICRP pub l i shed an e x c e l l e n t review of b io logy and p o s s i b l e mechanisms o f occur rence of rad ia t ion- induced b r a i n damage, -- i n u t e r o (ICRP86). ICRP e s t i m a t e s : (1) f o r exposures from t h e 8 t h through t h e 1 5 t h week a f t e r concept ion, t h e r i s k of s e v e r e mental r e t a r d a t i o n i s 4 x p e r r ad , wi th a confidence i n t e r v a l of 2 . 5 x
t o 5 .5 x l om3 , and ( 2 ) f o r exposures from t h e 1 6 t h through t h e 25th week a f t e r concept ion, t h e r i s k of s e v e r e mental r e t a r d a t i o n i s 1 x p e r r a d . However, a t h r e s h o l d below 50 r a d cannot be excluded (ICRP86).
I f t h e e s t i m a t e i s a p p l i c a b l e , t h e low-LET background r a d i a t i o n .
(about 15 mrads) d e l i v e r e d d u r i n g t h e 8- t o 15-week g e s t a t i o n a l age- - s e n s i t i v e p e r i o d could induce a r i s k of 6 x 10" c a s e s of s e v e r e mental r e t a r d a t i o n p e r l i v e b i r t h . Th i s can be compared t o an e s t i m a t e of a spontaneous occurrence of 0 . 6 x 10" t o 3 . 1 x c a s e s
-
of i d i o p a t h i c s e v e r e mental r e t a r d a t i o n p e r l i v e b i r t h (EPA84).
- 6 . 6 . 8 . 2 T e r a t o l o g i c E f f e c t s : Microcephaly i n Humans
Plumrner (P152) r e p o r t e d microcephaly a s s o c i a t e d w i t h mental r e t a r d a t i o n i n Japanese A-bomb s u r v i v o r s exposed -- i n u t e r o . Wood (Wo65, 66) r e p o r t e d both were i n c r e a s e d . The d i a g n o s i s of reduced head c i rcumference was based on "normal d i s t r i b u t i o n " s t a t i s t i c a l t h e o r y (Wo66); i . e . , i n a popu la t ion , t h e p r o b a b i l i t y of having a g iven head c i rcumference i s expec ted t o be normally d i s t r i b u t e d around t h e mean head c i rcumference f o r t h a t popu la t ion .
For example, i n a popu la t ion of l ive-born c h i l d r e n , 2.275 p e r c e n t w i l l have a head circumference 2 s t a n d a r d d e v i a t i o n s o r more sma l l e r t han t h e mean, 0.621 p e r c e n t w i l l have a head c i rcumference 2 . 5 s t a n d a r d d e v i a t i o n s o r more s m a l l e r t h a n t h e mean, and 0.135 p e r c e n t w i l l have a head c i rcumference 3 s t a n d a r d d e v i a t i o n s o r more sma l l e r t h a n t h e mean ( s t a t i s t i c a l e s t i m a t e s based on a normal d i s t r i b u t i o n ) .
For most of t h e s t u d i e s of t h e Japanese A-bomb s u r v i v o r s exposed i n u t e r o , i f t h e head c i rcumference w a s two o r more s t a n d a r d -- d e v i a t i o n s s m a l l e r t h a n t h e mean f o r t h e a p p r o p r i a t e c o n t r o l s i n t h e unexposed popu la t ion , t h e c a s e was c l a s s i f i e d a s having reduced head c i rcumference even i f t h e d a t a had n o t been a d j u s t e d f o r d i f f e r e n c e s i n s t a t u r e (Ta67, Mi72, Wo65). While a d e f i n i t i v e r e l a t i o n s h i p between reduced head c i rcumference and mental r e t a r d a t i o n has not been e s t a b l i s h e d , t h e r e i s ev idence t h a t t h e y a r e r e l a t e d .
Studies of the Japanese survivors show a re1ationshj.p between reduced head size and mental retardation, but all these studies are based on subsets of the total -- in utero population. The fraction of mentally retarded with reduced head circumference has been reported as 50 percent (RERF78) to 70 percent (Wo66), while the fraction of those selected for reduced head circumference who had mental retardation has been reported as 11 percent (Wo66) to 22 percent (Mi72). Thus, while the relationship appears to exist, it has not been quantified.
The majority of the cases of reduced head size are observed in those exposed in the first trimester of gestation, particularly the 6th or 7th to 15th weeks of gestation (Mi59, Wo66, Mi72, Wo65, Ta67). Most recently, it has been shown that reduction in head circumference was a linear function of dose (1~84). However, the authors noted that the analysis was based on T65 dosimetry, and the data should be reanalyzed after completion of the dosimetry reassessment currently in progress.
These findings of reduction in head circumference, with a window of effect in the same time period of gestation as mental retardation, help support the observations on mental retardation. Although the exact dose response functions are still uncertain, data on both types of effects have so far been consistent with a linear, no-threshold dose response during the critical period.
6.6.8.3 Other Teratologic Effects
Japanese A-bomb survivors exposed -- in utero also showed a number of structural abnormalities and, particularly in those who were microcephalic, retarded growth (Wo65). No estimate has been made of the radiation-related incidence or dose-response relationships for these abnormalities. However, UNSCEAR (UNSCEAR77) made a very tentative estimate based on animal studies that the increased incidence of structural abnormalities in animals may be 0.005 cases per R per live born, but stated that projection to humans was unwarranted. In 1986, UNSCEAR assumed the risk of an absolute increase of malformed fetuses of the order of 5E-3 per rad seen in animals might apply to the human species as well, for exposure over the period from 2 to 8 weeks post-conception (UNSCEAR86). In any event, the available human data cannot show whether the risk estimates derived from high-dose animal data overestimate the risk in humans or if a threshold can be excluded.
It should be noted that all of the above estimates are based on high-dose-rate, low-LET exposure. In 1977, UNSCEAR also investigated the dose rate question and stated:
"In conclusion, the majority of the data available for most species indicate a decrease of the cellular and malformature effects by lowering the dose rate or by fractionating the dose. However, deviations from this trend have been well documented in a few instances and are not inconsistent with
the knowledge about mechanisms of the teratogenic effects. It is therefore impossible to assume that dose rate and fractionation factors have the same influence on all teratological effects." (UNSCEAR77).
6.6.9 Nonstochastic Effects
Nonstochastic effects, those effects that increase in severity with increasing dose and have a threshold, have been reviewed in the 1982 UNSCEAR report (UNSCEAR82). Nonstochastic effects following in utero exposure were reviewed in the 1986 UNSCEAR report ( U N S C E A R ~ ~ ~ In general, acute doses of 10 rads low-LET radiation and higher are required to induce these effects in animals. It is possible that some of the observed effects of in utero exposure are nonstochastic: e.g., the risk of embryonic loss, estimated to be 10.' per R (UNSCEAR77) or per rad (UNSCEAR86) following radiation exposure soon after fertilization. However, there are no data to address the question of similar effects in humans. Usually, nonstochastic effects are not expected at environmental levels of radiation exposure.
In 1986, the United Nations Scientific Committee on the Effects of Atomic Radiation also reviewed the question of mental retardation as a part of the overall review of the biological effects of prenatal radiation exposure (UNSCEAR86). UNSCEAR, like the ICRP, concluded there was a risk of severe mental retardation of 4 x lo-' per rad over the period of 8 to 15 weeks after conception and of 1 x
per rad over the period 16-25 weeks after conception (UNSCEAR86). UNSCEAR also estimated (1) a pre-implantation loss of 1 x per rad during the first two weeks after conception, (2) a malformation risk of 5 x lo-' per rad during weeks 2 to 8 after conception, and (3) a risk of leukemia and solid tumors expressed during the first 10 years of life of 2 x per rad (UNSCEAR86).
EPA has adopted similar conclusions for estimating prenatal carcinogenic, teratologic, and nonstochastic effects in man (Table 6-24) . 6.7 Summary of EPA's Radiation Risk Factors - A Perspective
Table 6-25 summarizes EPAts estimate of risk from lifetime whole-body exposures to high- and low-LET radiation and to radon decay products. The nominal risk factors reflect EPA's best judgment as to the relationship between dose and risk based on review of all relevant information available to the Agency. Likewise the cited ranges reflect EPA's current best judgment as to the uncertainties in these risk factors.
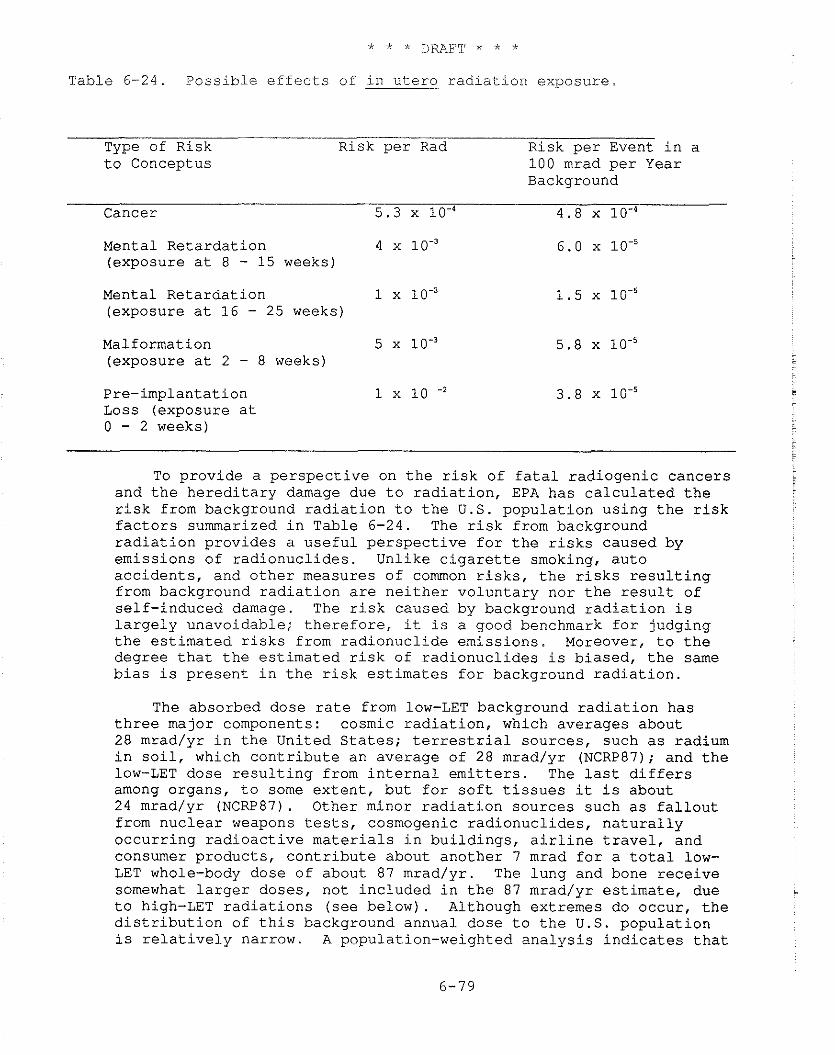
* * * DRAFT * * *
Table 6 -24 . P o s s i b l e e f f e c t s of i n u t e r o r a d i a t i o n exposure
Type of R i s k Risk p e r Rad Risk p e r Event i n a t o Conceptus 100 mrad p e r Year
Background
Cancer 5 . 3 l o 4 4 .8 x lo- '
Mental Re ta rda t ion 4 (exposure a t 8 - 15 weeks)
Mental Re ta rda t ion 1 (exposure a t 16 - 25 weeks)
Malformation 5 x 5 . 8 x 10.' (exposure a t 2 - 8 weeks)
Pre- implanta t ion 1 x 10 -2 3 .8 x Loss (exposure a t 0 - 2 weeks)
To p rov ide a p e r s p e c t i v e on t h e r i s k of f a t a l r a d i o g e n i c cance r s and t h e h e r e d i t a r y damage due t o r a d i a t i o n , EPA has c a l c u l a t e d t h e r i s k from background r a d i a t i o n t o t h e U.S. popu la t ion u s i n g t h e r i s k f a c t o r s summarized i n Table 6-24. The r i s k from background r a d i a t i o n p rov ides a u s e f u l p e r s p e c t i v e f o r t h e r i s k s caused by emiss ions of r a d i o n u c l i d e s . Unlike c i g a r e t t e smoking, a u t o a c c i d e n t s , and o t h e r measures of common r i s k s , t h e r i s k s r e s u l t i n g from background r a d i a t i o n a r e n e i t h e r v o l u n t a r y nor t h e r e s u l t of s e l f - induced damage. The r i s k caused by background r a d i a t i o n i s l a r g e l y unavoidable; t h e r e f o r e , it i s a good benchmark f o r judging t h e e s t i m a t e d r i s k s from r a d i o n u c l i d e emis s ions . Moreover, t o t h e degree t h a t t h e e s t i m a t e d r i s k of r a d i o n u c l i d e s i s b i a sed , t h e same b i a s i s p r e s e n t i n t h e r i s k e s t i m a t e s f o r background r a d i a t i o n .
The absorbed dose r a t e from low-LET background r a d i a t i o n has t h r e e major components: cosmic r a d i a t i o n , which averages about 28 mrad/yr i n t h e United S t a t e s ; t e r r e s t r i a l sources , such a s radium i n s o i l , which c o n t r i b u t e an average of 28 mrad/yr (NCRP87); and t h e low-LET dose r e s u l t i n g from i n t e r n a l e m i t t e r s . The l a s t d i f f e r s among organs , t o some e x t e n t , bu t f o r s o f t t i s s u e s it i s about 24 mrad/yr (NCRP87). Other minor r a d i a t i o n sources such a s f a l l o u t from n u c l e a r weapons tests, cosmogenic r a d i o n u c l i d e s , n a t u r a l l y o c c u r r i n g r a d i o a c t i v e m a t e r i a l s i n b u i l d i n g s , a i r l i n e t r a v e l , and consumer p roduc t s , c o n t r i b u t e about ano the r 7 mrad f o r a t o t a l low- LET whole-body dose of about 87 mrad/yr . The lung and bone r e c e i v e somewhat l a r g e r doses , no t i nc luded i n t h e 87 mrad/yr e s t i m a t e , due t o high-LET r a d i a t i o n s ( s e e be low) . Although extremes do occur , t h e d i s t r i b u t i o n of t h i s background annual dose t o t h e U.S. popu la t ion i s r e l a t i v e l y narrow. A populat ion-weighted a n a l y s i s i n d i c a t e s t h a t
K O p e r c e n t of t h e U,S, popuiati .on wou1.d r e c e i v e annual. doses t h a t a r e between 75 rnrad/gr and 115 rnrad/yr (EPA8ll.
A s o u t l i n e d i n Sec t ion 6 . 2 , t h e B E I R 111 l i n e a r , r e l a t i v e r i s k models y i e l d , f o r 1-ifetirne exposure t o low-LET r a d i a t i o n , an average l i f e t i m e r i s k o f f a t a l r ad iogen ic cance r of 3 . 9 ~ 1 0 . ~ p e r r a d . Note t h a t t h i s average i s f o r a group having t h e age- and s e x - s p e c i f i c m o r t a l i t y r a t e s of t h e 1.970 U.S. popu la t ion . Th i s r i s k e s t i m a t e can be used t o c a l c u l a t e t h e ave rage l i f e t i m e r i s k due t o low-LET background r a d i a t i o n a s fo l lows . The average d u r a t i o n of exposure i n t h i s group i s 70.7 y r , and a t 90 mrad/yr, t h e average l i f e t i m e dose i s 6.4 r a d s . The r i s k of f a t a l cancer p e r person i n t h i s group i s :
o r about 0 .24 p e r c e n t of a l l d e a t h s . The v i t a l s t a t i s t i c s used i n EPArs r a d i a t i o n r i s k a n a l y s e s i n d i c a t e t h a t t h e p r o b a b i l i t y of dying from cance r i n t h e United S t a t e s from a l l causes is about 0 .16, i . e . , 16 p e r c e n t . Thus, t h e 0.24 p e r c e n t r e s u l t f o r t h e BEIR I11 l i n e a r dose response model. i n d i c a t e s t h a t about 1 . 5 p e r c e n t of a l l U.S. cancer i s due t o low-LET background r a d i a t i o n . The BEIR 111 l i n e a r - q u a d r a t i c model i n d i c a t e s t h a t about 0 . 1 p e r c e n t of a l l dea ths a r e due t o low-LET background r a d i a t i o n o r about 0 .6 p e r c e n t of a l l cance r d e a t h s .
Table 6-11 i n d i c a t e s a r i s k of 5.6xlO-'rad-' f o r a lpha e m i t t e r s i n lung t i s s u e . UNSCEAR es t ima ted t h a t i n "normal" a r e a s t h e annual absorbed dose i n t h e lungs from a lpha e m i t t e r s o t h e r t h a n radon decay p roduc t s would be about 0 . 5 1 mrad (UNSCEAR77). The i n d i v i d u a l l i f e t i m e cance r r i s k from t h i s exposure i s :
which i s about 1/100 of t h e r i s k due t o low-LET background r a d i a t i o n c a l c u l a t e d by means of t h e B E I R I11 l i n e a r model.
The 1982 UNSCEAK r e p o r t i n d i c a t e s t h a t t h e average annual absorbed dose t o t h e e n d o s t e a l s u r f a c e s of bone due t o n a t u r a l l y occur r ing , high-LET a lpha r a d i a t i o n i s about 6 mrad/yr, based on a q u a l i t y f a c t o r of 20 and an absorbed dose e q u i v a l e n t of 120 mrem/yr (UNSCEAR82). Table 6 -11 i n d i c a t e s t h a t t h e i n d i v i d u a l l i f e t i m e r i s k of f a t a l bone cancer due t o t h i s p o r t i o n of t h e n a t u r a l l y o c c u r r i n g r a d i a t i o n background is:
The exposure due t o n a t u r a l l y o c c u r r i n g background radon-222 progeny i n t h e indoor environment i s not w e l l known. The 1982 UNSCEAR r e p o r t l i s t s f o r t h e United S t a t e s an indoor c o n c e n t r a t i o n of about 0.004 worlcing l e v e l s (15 Bq/m3) (UNSCEAR82) . This e s t i m a t e i s not based on a n a t i o n a l survey and i s known t o be exceeded by a s much a s a f a c t o r of 10 o r more i n some houses . However, a s p o i n t e d
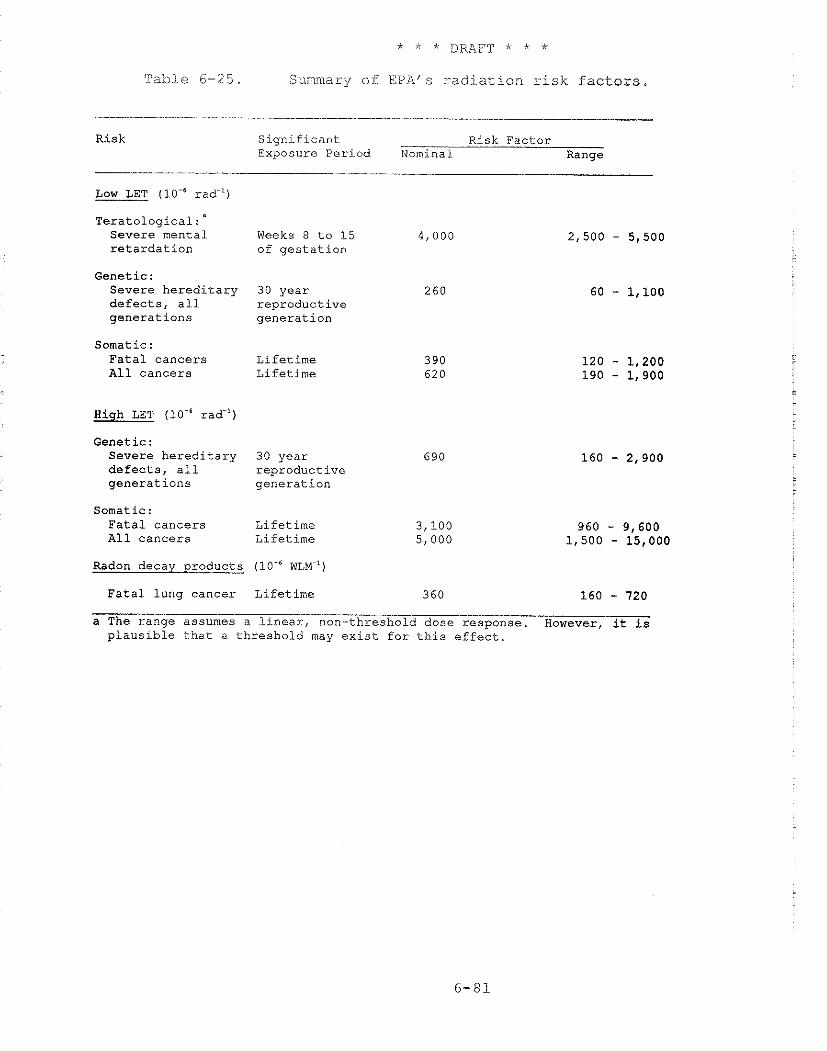
Table 6-25. Summary o f EPAQ r ad i a t i on risk factors
Risk Significant Risk. Factor Exposure Period Nominal Range
Low LET (10-"ad-'i
~eratolo~ical:~ Severe mental Weeks 8 to 15 4,000 retardation of gestation
Genetic : Severe hereditary 30 year 260 defects, all reproductive generations generation
Somatic : Fatal cancers Lifetime All cancers Lifetime
Hiqh LET (10.' rad-')
Genetic : Severe hereditary 30 year 690 defects, a11 reproductive generations generation
Somatic : Fatal cancers Lifetime All cancers Lifetime
Radon decay products (10-"LM-')
Fatal lung cancer Lifetime 360 160 - 720 a The range assumes a linear, non-threshold dose response. However, it is plausible that a threshold may exist for this effect.
out in UNSCEAR82, the national collective exposure may not be too dependent on exceptions to the mean concentration. The UNSCEAR estimate for the United States now appears low (Ne86); the average residential exposure is probably 0.2-0.3 WLM/yr (in standard exposure units).
Assuming 0.25 WLM/yr is a reasonable estimate for indoor exposure to radon-222 progeny in this country, the mean lifetime exposure, indoors, is about 18 WLM. Based on the geometric mean lifetime risk coefficient from Section 6.4.5, 360 cases/106 WLM, a lifetime risk of 0.64 percent is estimated. For comparison, roughly 5 percent of all deaths in 1980 were due to lung cancer. Based on these assumptions, therefore, about one of eight lung cancer deaths may be attributable to background radon exposure. This would correspond to about 4 percent of all cancer deaths. This is 2.5 times the 1.61 percent of all cancer fatalities estimated above for low-LET background radiation. The reader is cautioned, however, that this risk estimate applies only to the United States population taken as a whole, i.e., men and women, smokers and nonsmokers. Since the vast majority of the 1980 lung cancer mortality occurred in male smokers, this risk estimate cannot be applied indiscriminately to women or nonsmokers (see Section 6.4).
The spontaneous incidence of serious congenital and genetic abnormalities has been estimated to be about 105,000 per lo6 live births, about 10.5 percent of live births (NAS80, UNSCEAR82). The low-LET background radiation dose of about 87 mrad/year in soft tissue results in a genetically significant dose of 2.6 rads during the 30-year reproductive generation. Since this dose would have occurred in a large number of generations, the genetic effects of the radiation exposure are thought to be at an equilibrium level of expression. Since genetic risk estimates vary by a factor of 20 or more, EPA uses a log mean of this range to obtain an average value for estimating genetic risk. Based on this average value, the background radiation causes about 680 genetic effects per 10' live births (see Section 6.6). This result indicates that about 0.6 percent of the current spontaneous incidence of serious congenital and genetic abnormalities may be due to the low-LET background radiation.
REFERENCES
Archer, V.E., Health Concerns in Uranium Mining and Milling, J. Occup. Med., - 23, 502-505, 1981.
Arey, L.B., Developmental Anatomy, 6th ed., W.B. Saunders, Philadelphia, 1954.
Auxier, J.A., Cheka, J.S., Haywood, F.F., Jones, T.D. and J.H. Thorngate, Free-Field Radiation Dose Distributions from the Hiroshima and Nagasaki Bombings, Health Phys. 12(3):425-429, 1967. -
Auxier, J.A., Ichiban - Radiation Dosimetry for the Survivors of the Bombings of Hiroshima and Nagasaki, TID 27080, Technical Information Center, Energy Research and Development Administration, National Technical Information Service, Springfield, Virginia, 1977.
Baum, J.W., Population Heterogeneity Hypothesis on Radiation Induced Cancer, Health Phys., - 25(1):97-104, 1973.
Baverstock, K.F., Papworth, D. and J. Vennart, Risks of Radiation at Low Dose Rates, Lancet, 430-433, Feb. 21, 1981.
Beebe, G.W., Kato, H. and C.E. Land, Studies of the Mortality of A-bomb Survivors, 6: Mortality and Radiation Dose, 1950-74, Rad. Res., - 75: 138-201 (RERF TR 1-77, Life Study Report 8), 1978.
Bond, V.P. and J.W. Thiessen, Reevaluations of Dosimetric Factors, Hiroshima and Nagasaki, DOE Symposium Series 55, CONF-810928, Technical Information Center, U.S. Department of Energy, Washington, D.C., 1982.
Bunger, B., Cook, J.R. and M.K. Barrick, Life Table Methodology for Evaluating Radiation Risk: An Application Based on Occupational Exposure, Health Phys., s ( 4 ) :439-455.
Chameaud, J., Perraud, R., Chretien, J., Masse, R. and J. Lafuma, Contribution of Animal Experimentation to the Interpretation of Human Epidemiological Data, in: Proc. Int. Conf. on Hazards in Mining: Control, Measurement, and Medical Aspects, October 4-9, 1981, Golden, Colorado, pp. 228-235, edited by Manual Gomez, Society of Mining Engineers, New York, 1981.
Charles, M.E., Lindop, P.J. and K . J . Mill, A Pragmatic Evaluation of the Repercussions for Radiological Protection of the Recent Revisions in Japanese A-bomb Dosimetry, IAEA SM-266/52, Proceedings, International Symposium on the Biological Effects of Low-Level Radiation with Special Regard to Stochastic and Non-stochastic Effects, Venice, IAEA, Vienna, April 11-15, 1983.
Chameaud J., Masse R., Morin M., and Lafuma J., Lung Cancer Induction by Radon Daughters in Rats, in: Occupational Radiation Safety in Mining, Vol. 1, H. Stokes, editor, Canadian Nuclear Assoc., Toronto, Canada, pp. 350-353, 1985.
Cook, J.R., Bunger, B.M. and M.K. Barrick, A Computer Code for Cohort Analysis of Increased Risks of Death (CAIRD), ORP Technical Report 520/4-78-012, U.S. Environmental Protection Agency, Washington, D.C., 1978.
Cuddihy, R.G., McClellan, R.O., and Griffith, W.C. Varability in Target Deposition Among Individuals Exposed to Toxic Substances, Toxicol. Appl. Pharmacol. - 49: 179-187, 1979.
Davies, R.B. and B. Hulton, The Effects of Errors in the Independent Variables in a Linear Regression, Biometrika, %:383-391, 1975.
Darby, S.C., Epidemiological Evaluation of Radiaiton Risk Using Populations Exposed at High Doses, Health Phys. - 51 (3): 269-281, 1986.
Dobbing, J. and J. Sands, Quantitative Growth and Development of the Human Brain. Arch. Dis. Child., 48:757-767 (1973). -
Dobbing, J. and J. Sands, Comparative Aspects of the Brain Growth Spurt, Early Humin Dev., - 3:?09-126 (1979).
Dobbing, J., The later development of the brain and its vulnerability, pp. 744-758, in: Scientific Foundations of Pediatrics, 2nd edition, J.A. Davis and J. Dobbing, editors, William Heinemann Medical Books Ltd., London, 1981.
Dobson, R.L. and J.S. Felton, Female Germ Cell Loss from Radiation and Chemical Exposures, Amer. J. Ind. Med., 4: 175-190, 1983.
Dobson, R.L. and T. Straume, Mutagenesis in Primordial Mouse 0ocgt:es Could Be Masked by Cell Killing: Monte Carlo Analysis, Environ. Mutagen. - 6, 393, (1984) [Abstract].
Dobson, L., Straume T. and Kwan C., The Problem of Genetically Meaningful Dose and Hypervulnerable Lethality Targets in Certain Oocytes. Thirty-Sixth Annual Meeting of the Radi-ation Research Society, Philadelphia, 1988, Book of Abstracts, p 137 Abstract EK-3.
Edling C., Kling H., and Axel-son O., Radon in Homes - A Possible Cause of Lung Cancer, in: Lung Cancer and Radon Daughter Exposure in Mines and Dwellings. Linkoping University Medical Dissertations No. 157, by Christer Edling, Department of Occupational Medicine, Linkoping University, Linkoping, Sweden, pp. 123-149, 1983.
Edling C., Wingren G., and Axelson, O., Radon Daughter Exposure in Dwellings and Lung Cancer, in: Indoor Air, Volume 2: Radon, Passive Smoking, Particulates and Housing Epidemiology, B. Berglund, T. Lindvall and J. Sundell, editors, Swedish Council for Building Research, Stockholm, Sweden, pp. 29-34, 1984.
Ellett, W.H. and A.C.B. Richardson, Estimates of the Cancer Risk Due to Nuclear Electric Power Generation, pp. 511-527, in Origins of Human Cancer, Rook A., H. H. Hiatt et al., eds., Cold Spring Harbor Laboratory, 1977.
Ellett, W. H. and Nelson, N. S . , Environmental Hazards From Radon Daughter Radiation, in: Conference/Workshop on Lung Cancer Epidemiology and Industrial Applications of Sputum Cytology, Colorado School of Mines Press, Goiden, Colorado, pp. 114-148, 1979.
U.S. Environmental Protection Agency, Response to Comments: Guidance on Dose Limits for Persons Exposed to Transuranium Elements in the General Environment, EPA Report 520/4-78-010, Office of Radiation Programs, Washington, D.C., 1978.
U.S. Environmental Protection Agency, Indoor Radiation Exposure Due to Radium-226 in Fl-orida Phosphate Lands, EPA Report 520/4-78-013, Office of Radiation Programs, Washington, D.C., revised printing, July 1979.
EPAO l
EPA82
U.S. Environmental Protection Agency, Population Exposure to External Natural Radiation Background in the United States, Technical Note ORP/SEPD-80-12, Office of Radiation Programs, Washington, D.C., 1981.
U.S. Environmental Protection Agency, Final Environmental Impact Statement for Remedial Action Standards for Inactive Uranium Processing Sites (40 CFR 192), Volume I, EPA Report 520/4-82-013-1, Office of Radiation Programs, Washington, D.C., 1982.
U.S. Environmental Protection Agency, Draft Background Information Document, Proposed Standards for Radionuclides, EPA Report 520/1-83-001, Office of Radiation Programs, Washington, D.C., 1983.
U.S. Environmental Protection Agency, Final Environmental Impact Statement for Standards for the Control of Byproduct Materials from Uranium Ore Processing (40 CFR 192), Volume I, EPA Report 520/1- 83-008-1, Office of Radiation Programs, Washington, D.C., 1983.
Environmental Protection Agency, Radionuclides Background Information Document for Final Rules. Volume I, EPA Report 520/1-84-022-1, US EPA, Office of Radiation Programs.
Environmental Protection Agency, Background Information Document--Standard for Radon-222 Emissions from Underground Uranium Mines. EPA 502/1-85-010, Office of Radiation Programs, USEPA, Washington, D.C., 1985.
Environmental Protection Agency, Final Rule for Radon-222 Emissions from Licensed Uranium Mill Tailings, Background Information Document, EPA 520/1-86-009, Office of Radiation Programs, Washington, DC, 1986.
Evans, H. J., Buckton, K.E., Hamilton, G.E.,et al.,Radiation-induced Chromosome Aberrations in Nuclear Dockyard Workers, Nature, - 277, 531-534, 1979.
Federal Radiation Council, Radiation Guidance for Federal Agencies, Memorandum for the President, July 21, 1967, Fed. Reg., - 32, 1183-84, August 1, 1967.
Garriott, M.L. and D. Grahn, Neutron and Gamma-Ray Effects Measured by the Micronucleus Test, Mut. Res. Let., - 105, 157-162, 1982.
Gilbert, E.S., Some Effects of Random Dose Measurements Errors on Analyses of Atomic Bomb Survivor Data, Rad. Res., 98, 591-605, 1984.
Gilbert, E.S., Late Somatic Effects, in: Health Effects Model for Nuclear Power Plant Accident Consequence Analysis by J.S. Evans, D.W. Cooper and D.W. Moeller, NUREG/CR-4214, U.S. Nuclear Regulatory Commission, 1985.
Goldstein, L. and D.P. Murphy, Etiology of Ill-health of Children Born After Maternal Pelvic Irradiation: 11, Defective Children Born After Post Conception Pelvic Irradiation, Amer. J. Roentgenol. Rad. Ther., 22: 322-331, 1929. -
Goodhead, D.T., Models of Radiation Interaction and Mutagenesis, pp. 231-247, in Radiation Biology in Cancer Research, R.E. Meyn and H. R. Withers, eds., Raven, New York, 1980.
Goodhead, D.T., An Assessment of the Role of Microdosimetry in Radiobiology, Rad. Res., - 91, 45-76, 1982.
Grahn, D., et al., Interpretation of Cytogenetic Damage Induced in the Germ Line of Male Mice Exposed for Over 1 Year to 239P~ Alpha Particles, Fission
60 Neutrons, or Co Gamma Rays, Rad. Res., 95, 566-583, 1983.
Grahn, D., Genetic Risks Associated with Radiation Exposures During Space Flight, Adv. Space Res., 3(8), 161-170, 1983.
Gustavson, K.H, Hagberg, B., Hagberg, G. and K. Sars, Severe Mental Retardation in a Swedish County, I, Epidemiology, Gestational Age, Birth Weight and Associated CNS Handicaps in Children Born 1959-70, Acta Paediatr. Scand., - 66, 373-379, 1977.
Gustavson, K.-H., Hagberg, B., Hagberg, G. and K. Sars, Severe Mental Retardation in a Swedish County, 11. Etiologic and Pathogenetic Aspects of Children Born 1959-70, Neuropadiatrie, - 8:293-304 (1977).
Hagberg, B., Hagberg, G., Lewerth, A. and U. Lindberg, Mild Mental Retardation in Swedish School Children, I. Prevalence, Acta Paediatr. Scand., 70, 441-444, 1981.
Bagberg, B., Hagberg, G., Lewerth, A. and U. Lindberg, Mild Mental Retardation in Swedish School Children, 11. Etiologic and Pathogenetic Aspects, Acta Paediatr. Scand., - 70:445-452, 1981.
Harley, N.H. and B.S. Pasternak, Environmental Radon Daughter Alpha Dose Factors in a Five-Lobed Human Lung, Health Phys., - 42, 789-799, 1982.
Herbert, D.E., Model or Metaphor? More Comments on the BEIR I11 Report, pp. 357-390, in Epidemiology Applied to Health Phys., CONE--830101, DE-83014383, NTIS, Springfield, Virginia, 1983.
Hicks, S.P., Developmental Malformations Produced by Radiation, A Timetable of Their Development, Amer. J. Roentgenol. Radiat. Thera., 69, 272-293, 1953.
Hicks, S.P., The Effects of Ionizing Radiation, Certain Hormones, and Radiomimetic Drugs on the Developing Nervous System, J. Cell. Comp. Physiol., 43 (Suppl. I), 151-178, 1954.
Hicks, S.P. and C.J. DrAmato, Effects of Ionizing Radiations on Mammalian Development, Adv. Teratol., 1, 195-266, 1966. -
Hofmann, W. and E. Steinhausler, Dose Calculations for Infants and Youths Due to the Inhalation of Radon and Its Decay Products in the Normal Environment, in: Proceedings of the 4th International Congress of the International Radiation Protection Association, Paris, - 2, 497-500, 1977.
Hornung, R. W. and S. Samuels, Survivorship Models for Lung Cancer Mortality in Uranium Miners - Is Cumulative Dose an Appropriate Measure of Exposure?, in: Proc. Int. Conf. on Hazards in Mining: Control, Measurement, and Medical Aspects, October 4-9, 1981, Golden, Colorado, 363-368, edited by Manuel Gomez, Society of Mining Engineers, New York, 1981.
Howe, G.R., Epidemiology of Radiogenic Breast Cancer, in: Radiation Carcinogenesis: Epidemiology and Biological Significance, 119-129, edited by J.D. Boice, Jr. and J.F. Fraumeni, Jr., Raven Press, New York, 1984.
Howe, G.R., Nair, R.C., Newcornb, H.B., Miller, A.B. and J.D. Abbatt, Lung Cancer Mortality (1950-1980) in Relation to Radon Daughter Exposure in a Cohort of Workers at the Eldorado Beaver Lodge Uranium Mine, JtgCI, - 77, 357-362, 1986.
Howe, G.R, Nair, R.C, Newcombe, H.R, Miller, A.B, Burch, J.D and Abbott, J.D. Lung Cancer Mortali,ty (1950-80) in Relation to Radon Daughter Exposure in a Cohort of Workers at the Eldorado Port Radium Uranium Mine: Possible Modification of Risk by Exposure Rate. JNCI, - 79: 1255-1260 (1987).
Health and Welfare Canada, The Testing of Chemicals for Carcinogenicity, Mutagenicity and Teratogenicity, Health Protection Branch, HWC, Ottawa, 1973.
International Commission on Radiological Protectio'n, Committee I1 on Permissible Dose for Internal Radiation, Task Group on Reference Man, ICRP Publ. 23, Pergamon Press, 1975.
International Commission on Radiological Protection, Recommendations of the International Commission on Radiological Protection, ICRP Publ. 26, Ann. ICRP, - 1, (I), Pergamon Press, 1977.
International Commission on Radiological Protection, Limits for Intakes of Radionuclides by Workers, ICRP Publication 30, Part 1, Ann. ICRP, - 2 (3/4), Pergamon Press, New York, 1979.
International Commission on Radiological Protection, Effects of Inhaled Radionuclides, ICRP Publication 31, Pergamon Press, 1980.
International Commission on Radiological Protection, Limits for Intakes of Radionuclides by Workers, ICRP Publication 32, Part 3, Ann. ICRP, - 6 (2/3), Pergamon Press, 1981.
International Commission on Radiological Protection, Lung Cancer Risk from Indoor Exposures to Radon Daughters, ICRP Publication 50, Pergamon Press, NY, 1987.
Ishimaru, T., Nakashima, E. and S. Kawamoto, Relationship of Height, Body Weight, Head Circumference and Chest Circumference to Gamma and Neutron Doses Among In Utero Exposed Children, Hiroshima and Nagasaki. Technical Report RERF TR 19- 84, Radiation Effects Research Foundation, Hirsohima, 1984.
J'acobi, W. and K. Eisfeld, Dose to Tissue and Effective Dose Equivalent by Inhalation of Radon-222 and Radon-220 and Their Short-Lived Daughters, GFS Report S-626, Gesellschaft fuer Strahlen und Unweltforschung mbH, Munich, 1980.
Jacobi W., Paretzke H. G. and Schindel F., Lung Cancer Risk Assessment of Radon-Exposed Miners on the Basis of a Proportional Hazard Model, in: Occupational Radiation Safety in Mining, Volume 1, H. Stocker, editor, Canadian Nuclear Association, Toronto, Ontario, Canada, pp. 17-24, 1985.
Jacobsen, L., Radiation Induced Fetal Damage, Adv. Teratol., 4, 95-124, 1970.
James, A. C. et al., Respiratory Tract Dosimetry of Radon and Thoron Daughters: The State-of-the-Art and Implications for Epidemiology and Radiobiology, in: Proc. Int. Conf. on Hazards in Mining: Control, Measurement, and Medical Aspects, October 4-9, 1981, Golden, Colorado, 42-54, edited by Manuel Gomez, Society of Mining Engineers, New York, 1981.
Kato, H., Late Effects in Children Exposed to the Atomic Bomb While In Utero, Technical Report 18-73, Atomic Bomb Casualty Commission, Hiroshima, 1973.
Kato, H, and W.J. Schull, Studies of the Mortality of A-bomb Survivors, 7. Mortality, 1950-1978: Part I, Cancer Mortality, Rad. Research 90, 395-432, 1982, (Also published by the ~adiationxffect Research Foundation as: RERF TR 12-80, Life Span Study Report 9, Part 1.)
Kellerer, A.M. and H.M. Rossi, The Theory of Dual Radiation Action, Curr. Topics Rad., Res. Quart., 8, 85-158, 1972.
Kerr, G.D., Review of Dosimetry for the Atomic Bomb Survivors, in: Proceedings of the Fourth Symposium on Neutron Dosimetry, Gessellschaft fur Strahlen- und Umweltforschung, Munich-Neuherberg, Federal Republic of Germany, June 1-5, 1, 501, Office for Official Publications of the ~ u r o ~ e a n Communities, Luxembourgh, 1981.
Kerr, G.D., Findings of a Recent ORNL Review of Dosimetry for the Japanese Atomic Bomb Survivors, ORNL/TM-8078, Oak Ridge National Laboratory, Oak Ridge, Tennessee, 1981.
King, R.C., Genetics, Oxford University Press, New York, 1962.
Land, C.E. and J.E. Norman, Latent Periods of Radiogenic Cancers Occurring Among Japanese A-bomb Survivors, in: Late Biological Effects of Ionizing Radiation, - I, 29-47, IAEA, Vienna, 1978.
Land, C.E., Boice, J.D., Shore, R.E., Norman, J.E. and M. Tokunaga, et al., Breast Cancer Risk from Low- Dose Exposures to Ionizing Radiation: Results of Parallel Analysis of Three Exposed Populations of Women, J. Natl. Canc. Inst., 65, 353-376, 1980.
Land, C.E. and D.A. Pierce, Some Statistical Considerations Related to the Estimation of Cancer Risk Following Exposure to Ionizing Radiation, pp. 67-89, in Epidemiology Applied to Health Phys., CONF- 830101, DE83014383, NTIS, Springfield, Virginia, 1983.
Lea, D.E., Actions of Radiations on Living Cells, 2nd edition, Cambridge University Press, 1962.
Loewe, W.E. and E. Mendelsohn, Revised Dose Estimates at Hiroshima and Nagasaki, Health Phys., - 41, 663-666, 1981.
Lundin, F E Jr., Wagoner, J K and Archer, V E Radon Daughter Exposure and Respiratory Cancer. Quantitative and Temporal Aspects, Joint Monograph No. 1, NlOSH-NIEHS, USPHS, DHEW, Washington, DC, 1971.
Mandansky, A., The Fitting of Straight Lines When Both Variables Are Subject to Error, J. Amer. Statis. Assoc., 54, 173-205, 1959.
Mays, C.W. and H. Spiess, Epidemiological Studies in German Patients Injected with Ra-224, pp. 159-266, in: Epidemiology Applied to Health Physics, CONF- 830101, DE-83014383, NTIS, Springfield, Virginia, 1983.
McDowell, E.M., McLaughlin, J.S., Merenyi, D.K., Kieffer, R.F., Harris, C.C. and B.F. Trump, The Respiratory Epithelium V. Histogenesis of Lung Carcinomas in Humans, J. Natl. Cancer Inst., - 61, 587- 606, 1978.
Michel C. and H. Fritz-Niggii, Radiation--Induced Developmental Anomalies in Mammalian Embryos by Low Doses and Interaction with Drugs, Stress and Genetic Factors, pp. 399-408, in: Late Bioiogical Effects of Ionizing Radiation, Vol. 11, IAEA, Vienna, 1978.
Miller, R.W., Delayed Effects Occurring Within the First Decade After Exposure of Young Individuals to the Hiroshima Atomic Bomb, Technical Report 32-59, Atomic Bomb Casualty Commission, Hiroshima, 1959.
Miller, R.W. and W.J. Blot, Small Head Size Following In Utero Exposure to Atomic Radiation, Hiroshima and Nagasaki, Technical Report 35-72, Atomic Bomb Casualty Commission, Hiroshima, 1972.
Morgan, K.Z. and J.E. Turner, Principles of Radiation Protection, John Wiley and Sons, Inc., New York, 1967.
Mole, R.H., Carcinogenesis by Thorotrast and Other Sources of Irradiation, Especially Other Alpha- Emitters, Environ. Res., 18, 192-215, 1979.
Murphy, D.P., The Outcome of 625 Pregnancies in Women Subject to Pelvic Radium or Roentgen Irradiation, Amer. J. Obstet. Gyn., 18, 179-187, 1929.
Murphy, D.P. and M. DeRenyi, Postconception Pelvic Irradiation of the Albino Rat (Mus Norveqieus): Its Effects Upon the Offspring, Surg. Gynecoi. Obstet . , 50, 861-863, 1930. -
Muller, J., Wheeler, W.C., Gentleman, J.F., Suranyi, G. and R.A. Kusiak, Study of Mortality of Ontario Miners, 1955-1977, Part I, Ontario Ministry of Labor, Ontario, May 1983.
National Academy of Sciences - National Research Council, The Effects on Populations of Exposures to Low Levels of Ionizing Radiation, Report of the Committee on the Biological Effects of Ionizing Radiations (BEIR I Report), Washington, D.C., 1972.
National Academy of Sciences - National Research Council, The Effects on Populations of Exposure to Low Levels of Ionizing Radiation, Committee on the Biological Effects of Ionizing Radiation, (BEIR 111), Washington, D.C., 1980.
National Academy of Sciences - National Research
NCRP 8 0
NCRP 8 4
NCRP 85
NCRP87
Council,. ~ealth Risks of Radon and Other Internally Deposited Alpha-Emitters, BEIR IV, National Academy Press, Washington, DC, 1988.
National Aeronautics and Space Administration, Bioastronautics Data Book, NASASP-3006, 2nd Edition, edited by J. R. Parker and V. R. West, Washington, D.C., 1973.
National Center for Health Statistics, Public Use Tape, Vital Statistics - Mortality Cause of Death Summary - 1970, PB80-133333, Washington, D.C., 1973.
National Center for Health Statistics, U.S. Decennial Life Tables for 1969-71, 1(1), DHEW Publication No. (HRA) 75-1150, U.S. Public Health Service, Rockville, Maryland, 1975.
National Council on Radiation Protection and Measurement, Natural Background Radiation in the United States, NCRP Report No. 45, Washington, D.C., 1975.
National Council on Radiation Protection and Measurements, Protection of the Thyroid Gland in the Event of Releases of Radioiodine, Report No. 55, Washington, D.C., 1977.
National Council on Radiation Protection and Measurements, Influence of Dose and Its Distribution in Time on Dose-Response Relationships for Low-LET Radiation, NCRP Report No. 64, Washington, D.C., 1980.
National Council on Radiation Protection and Measurements, Evaluation of Occupational and Environmental Exposures to Radon and Recommendations, NCRP Report No. 78, Washington, D.C., 1984.
National Council on Radiation Protection and Measurements, Induction of Thyroid Cancer by Ionizing Radiation, NCRP Report No. 80, Washington, D.C., 1985.
National Council on Radiation Protection and Measurements, Ionizing Radiation Exposure of the Population of the United States, NCRP Report No. 93, Bethesda, MD, 1987.
ORNL 8 4
Of 80
Neel, J.V. and W . J . Schull, The Effect of Exposure to the Atomic Bombs on Pregnancy Termination in Hiroshima and Nagasaki, National Academy of Sciences, Publ. 461, Washington, D.C., 1956.
Nelson, K.B. and J. Deutschberger, Head Size at One Year as a Predictor of Four-Year I.Q., Develop. Med. Child Neurol., 12, 487-495, 1970.
Nero, A.V., Schwehr, M.B., Nazaroff, W.W. and K.L. Revzan, Distribution of Airborne Radon-222 Concentrations in U.S. Homes, Science, 234, 992-997, 1986.
Neel, J. V., Schull, W. J., Awa, A. A., Satoh, C., Otake, M., Kato, H, and Yoshimato, Y., Implications of the Hiroshima - Nagasaki Genetic Studies for the Estimation of the Human "Doubling Dose" of Radiation. Presentation at XVI the International Congress of Genetics, Toronto, 1988.
National Institutes of Health, Report of the National Institutes of Health Ad Hoc Working Group to Develop Radioepidemiological Tables, NIH Publication No. 85-2748, U.S. Government Printing Office, Washington, DC 20402, p 92, 1985.
National Institute for Occupational Safety and Health. Radon Progeny in Underground Mines, DHHS (NIOSH) Publication NO. 88-101, USPHS, CDC, NIOSH, Cincinnati, Ohio, 1987
Nuclear Regulatory Commission, Health Effects Model for Nuclear Power Plant Accident Consequence Analysis. NUREG/CR-4214. U.S. Nuclear Regulatory Commission, Washington, DC, 1985.
Oak Ridge National Laboratory, Age Dependent Estimation of Radiation Dose, [in press], 1984.
Oftedal, P. and A.G. Searle, An Overall Genetic Risk Assessment for Radiological Protection Purposes, J. Med. Genetics, - 17, 15-20, 1980.
Ohzu, E., Effects of Low-Dose X-Irradiation on Early Mouse Embryos, Rad. Res. - 26, 107-113, 1965.
Otake, M. and W.H. Schull, Mental Retardation in Children Exposed In Utero to the Atomic Bombs: A Reassessment, Technical Report RERFTR 1-83, Radiation Effects Research Foundation, Hiroshima, 1983.
RERF 8 3
Otake, M. and W.J. Schull, In Utero Exposure to A- bomb Radiation and Mental Retardation: A Reassessment, Brit. J. Radiol., 57, 409-414, 1984.
Plummer, G.W., Anomalies Occurring in Children Exposed In Utero to the Atomic Bomb in Hiroshima, Pediat., 10, 687-692, 1952.
Pohl-Ruling, J., Fischer, P. and E. Pohl, The Low- Level Shape of Dose Response for Chromosome Aberration, pp. 315-326, in: Late Biological Effects of Ionizing Radiation, Volume 11, International Atomic Energy Agency, Vienna, 1978.
Prentice, R.L., Yoshimoto, Y. and M.W. Mason, Relationship of Cigarette Smoking and Radiation Exposure to Cancer Mortality in Hiroshima and Nagasaki, J. Nat. Cancer Inst., - 70, 611-622, 1983.
Preston, D.L. and D.A. Pierce, The Effect of changes in Dosimetry on Cancer Mortality Risk Estimates in the Atomic Bomb Survivors. RERF 9- 87, Radiation Effects Research Foundation, Hiroshima, 1987.
Preston, D.L. and D.A. Pierce, The Effect of Changes in Dosimetry on Cancer Mortality Risk Estimates in the Atomic Bomb Survivors, Rad. Res. 114, 437-466, 1988. -
Radford, E,P. and K.G. St. C1. Renard, Lung Cancer in Swedish Iron Miners Exposed to Low Doses of Radon Daughters, N. Engl. J. Med., 310, 1485-1494, 1984.
Radiation Effects Research Foundation. Radiation Effects Research Foundation, 1 April 1975 - 31 March 1978. RERF Report 75-78, Hiroshima, 1978.
Radiation Effects Research Foundation, Reassessment of Atomic Bomb Radiation Dosimetry in Hiroshima and Nagasaki, Proc. of the U.S.-Japan Joint Workshop, Nagasaki, Japan, Feb. 16-17, 1982, Radiation Effects Research Foundation, Hiroshima, 730, Japan, 1983.
Spiers, F.W., Lucas, H.F., Rundo, J. and G.A. Anast, Leukemia Incidence in the U.S. Dial Workers, in: Conference Proc. on Radiobiology of Radium and the Actinides in Man, October 11-16, 1981, Health Phys., - 44 (Suppl. 1) :65-72, 1983.
Stettner, E., Ein weiterer Fall einer Schadingung einer menschichen Frucht durch Roentgen Bestrahlung., Jb. Kinderheilk. Phys. Erzieh., 95, 43-51, 1921.
Straume, T. and R. L. Dobson, Implications of New Hiroshima and Nagasaki Dose Estimates: Cancer Risks and Neutron RBE, Health Phys., - 41 (4) : 666- 671, 1981.
Stein, Z.A. and M.W. Susser, The Epidemiology of Mental Retardation, in: Epidemiology of Pediatric Neurology, B. Schoenberg, editor, Marcel Dekker, Inc., New York, [in press], 1984.
Steinhausler F., and Hofmann W., Inherent Dosimetric and Eipdemiological Uncertainties Associated with Lung Cancer Risk Assessment in Mining Populations, in: Occupational Radiation Safety in Mining, Volume 1, H. Stocker, editor, Canadian Nuclear Association, Toronto, Ontario, Canada, pp. 327-334, 1985.
Tabuchi, A., Hirai, T., Nakagawa, S., Shimada, K. and J. Fugito, Clinical Findings on In Utero Exposed Microcephalic Children, Technical Report 28-67, Atomic Bomb Casualty Commission, Hiroshima, 1967.
Thomas, D.C. and K.G. McNeill, Risk Estimates for the Health Effects of Alpha Radiation, Report INFO-0081. Atomic Energy Control Board, Ottawa, 1982.
Tobias, C. A. et al., The Repair-Misrepair Model, pp. 195-230, in: R. E. Meyn and H. R. Withers, eds., Raven, New York, 1980.
Tokunaga, M., Land, C.E., Yamamoto, T., Asano, M., Takioka, S., Ezaki, E. and I. Nishimari, Incidences of Female Breast Cancer Among Atomic Bomb Survivors, Hiroshima and Nagasaki, 1950-1980, RERF TR 15-84, Radiation Effects Research Foundation, Hiroshima, 1984.
Ullrich, R.L., Lung Tumor Induction in Mice: Neutron RBE at Low Doses, NTIS-DE 82009642, National Technical Information Service, Springfield, Virginia, 1982.
UNSCEAR58 United Nations, Report of the United Nations Scientific Committee on the Effects of Atomic Radiation, Official Records: Thirteenth Session, Supplement No. 17 (A/3838), United Nations, New York, 1958.
UNSCEAR62 United Nations, Report of the United Nations Scientific Committee on the Effects of Atomic Radiation, Official Records: Seventeenth Session, Supplement No. 16 (A/5216), United Nations, New York, 1962.
UNSCEAR6 6 United Nations, Report of the United Nations Scientific Committee on the Effects of Atomic Radiation, Official Records: Twenty-First Session, Supplement No. 14 (A/6314), United Nations, New York, 1966.
UNSCEAR69 United Nations, Report of the United Nations Scientific Committee on the Effects of Atomic Radiation, Supplement No. 13 (A/7613), United Nations, New York, 1969.
UNSCEAR72 United Nations Scientific Committee on the Effects of Atomic Radiation, Ionizing Radiation: Levels and Effects, Volume 11: Effects, Report to the General Assembly. Sales No. E. 72. IX.18., United Nations, New York, 1972.
UNSCEAR77 United Nations Scientific Committee on the Effects of Atomic Radiation, Sources and Effects of Ionizing Radiation, Report to the General Assembly, with Annexes, Sales No. E.77 IX.l., United Nations, New York, 1977.
UNSCEAR82 United Nations Scientific Committee on the Effects of ~tomic Radiation, Ionizing Radiation: Sources and Biological Effects, 1982 Report to the General Assembly, Sales No. E.82. IX.8, United Nations, New York, 1982.
Up75 Upton, A.C., Physical Carcinogenesis: Radiation-- History and Sources, pp. 387-403, in: Cancer 1, F.F. Becker, editor. Plenum Press, New York, 1975.
USRPC80 U.S.Radiation Policy Council, Report of the Task Force on Radon in Structures, USRPC-80-002, Washington, D.C., 1980.
Van Buul, P.P.W., Dose-response Relationship for X-ray Induced Reciprocal Translocations in Stem Cell Spermatogonia of the Rhesus Monkey (Macaca mulatta) , Mutat. Res., 2, 363-375, 1980. (Cited in UNSCEAR82. )
Von Frieben, A., Demonstration lines cancroids des rechten Handruckens das sich nach lang dauernder Einwirkung von Rontgenstrahlen entwickelt hatte. Fortschr. Geb. Rontgenstr., - 6:106 (1902) cited in up75.
Wakabayashi, T., Kato, H., Ikeda, T. and W.J. Schull, Studies of the Mortality of A-bomb Survivors, Report 7, Part 111, Incidence of Cancer in 1959-78 Based on the Tumor Registry Nagasaki, Radiat. Res., - 93, 112-142, 1983.
Whittemore, A.S. and A. McMillan, A Lung Cancer Mortality Among U.S. Uranium Miners: A Reappraisal, Technical Report No. 68, SIAM Inst. Math. Soc., Stanford University, Stanford, 1983.
World Health Organization, International Statistical Classification of Diseases, Injuries, and Causes of Death, 9th Revision, Geneva, 1975.
Wilson, J.G., Differentiation and the Reaction of Rat Embryos to Radiation, J. Cell. Comp. Physiol., 43 (Suppl. I), 11-37, 1954.
Wood, J.W., Johnson, K.G. and Y. Omari, In Utero Exposure to the Hiroshima Atomic Bomb: Follow-up at Twenty Years, Technical Report 9-65, Atomic Bomb Casualty Commission, Hiroshima, 1965.
Wood, J W Johnson, K.G., Omaci, Y., Kawamoto, S. and R.J. Keehn, Mental Retardation in Children Exposed In Utero to the Atomic Bomb--Hiroshima and Nagasaki, Technical Report 10-66, Atomic Bomb Casualty Commission, Hiroshima, 1966.

7. SUMMARY OF UNCERTAINTIES IN DOSES AND RISKS
7.1 INTRODUCTION
The purpose of this chapter is to provide insight into the uncertainty associated with the dose and risk estimates for the nearby individuals and the U.S. population for each of the twelve emission source categories. For each of these categories and their subcategories the calculation of doses and risks involves the following steps:
o calculation of the radionuclide release rate to the environment,
o calculation of atmospheric transport and depletion,
o calculation of the radionuclide concentration in the environment accessible to the general population in the vicinity of the release,
o calculation of the doses to the exposed individuals from the various external, ingestion, and inhalation pathways, and
o calculation of the health risks due to the doses received.
Accompanying the calculational methods described in Chapters 4, 5, and 6 of this volume is a discussion of the uncertainties associated with each of these calculational steps:
o The uncertainty in the average annual atmospheric dispersion factors for any given location can range from about a factor of 2 to 10, depending on distance from the release point and complexity of the release and terrain. For population exposures, uncertainty in the atmospheric dispersion factors is smaller due to the effects of averaging (see Section 4.2). Since dispersion modeling is applicable to all categories, radionuclides, and pathways of exposure, this parameter is an important source of uncertainty.
o For particulate emissions, the rate of deposition of particulates at a given location can vary by over a factor of 10 (see Section 4.3). However, the total deposition over an extended time period or over a large area is less uncertain due to the effects of time and spacial averaging. In addition, since the principal risk from many source categories is due to inhalation, this source of uncertainty is not highly significant.
o The uncertainty in the food chain transfer factors, which describe the uptake of radionuclides by vegetation from soil and subsequent transfer to meat, milk, and produce, is large and varies substantially from site to site, by pathway, and by radionuclide (see Section 4.4). However, direct deposition onto plant surfaces generally contributes more to the radionuclide concentrations in foods than does uptake from soil, which tends to reduce the importance of this source of uncertainty.
0 The uncertainty in the dose conversion factors (DCFs), which relate exposure to dose, is small for external exposures but variable for internal exposures, depending on the radionuclide. Key sources of uncertainty in internal DCFs are (1) individual variability, (2) uncertainty in particle size and clearance class, and (3) uncertainties in the model formulation and the values of the parameters for a given particle size and clearance class (see Chapter 5).
o The uncertainty in risk conversion factors, which relate dose or exposure to risk, is estimated to be a factor of about 3 for the average member of the population. For any one individual, the uncertainties cannot be meaningfully defined (see Chapter 6).
The important contributors to uncertainty, and therefore the overall uncertainty in calculated doses and risks, can differ significantly among the release categories because of differences in the important radionuclides, pathways, and environmental settings among the different categories.
A number of approaches may be used to describe and quantify uncertainty (Mo78, He79, Cr88, Sc80). One method to assess uncertainty is to assign probability distributions to each of the parameters and then to propagate the uncertainties through the dose and risk calculations. These approaches are currently being evaluated by EPA with the intent to apply them to the risk assessments; the results to be published as a supplement to this report. Appendix C to this volume presents a summary of the uncertainty analysis techniques under consideration.
For the purpose of this report, a semiquantitative characterization of uncertainty is provided, whereby the uncertainty in the key calculational parameters for each category is described. No attempt is made to establish probability distributions for the parameters or to propagate rigorously the uncertainties. Instead, approximate ranges of doses and risks are provided. The ranges are
based on inspection of the important contributors to risk and the discussion of uncertainties provided in Chapters 4, 5, and 6. This approach is appropriate when deterministic calculations are employed, and when explicit distributions for the input parameters cannot be readily developed.
Throughout the following discussion, a distinction is made between the uncertainties in the individual and population doses and risks. This distinction is significant. By their very nature, population doses and risks have much less inherent uncertainty because the uncertainty is only in the average value of a given parameter, as opposed to the range of possible values for the parameter. For example, the soil to plant transfer factor (B,,, see Chapter 4) for any particular radionuclide can vary by several orders of magnitude depending on the soil conditions and the type of plant. These characteristics can vary widely within the vicinity of a facility, and, therefore, the Biv values could also vary widely. However, population doses are the sum of the individual doses at a site. Accordingly, it is the average value of the B, at the site which is needed to calculate population doses, and the individual differences among Biv values at specific locations at the site average out of the calculation.
7.2 INACTIVE URANIUM MILLS
The radiation exposures attributable to air emissions from each of the 24 inactive uranium mill tailing sites are due to the windblown resuspension of uranium series radionuclides, the emission of radon from the piles, and their subsequent transport to nearby members of the population. Numerous evaluations of these sources of exposure have demonstrated that the offsite exposures are dominated by radon and its progeny (DOE86). Accordingly, the uncertainty analysis is limited to radon exposures.
Each of the 24 sites differs to varying degrees in the size and characteristics of the pile, meteorological conditions, and population density and distribution. Accordingly, the exposures and risks to the maximum individual and to the 80-km population differ substantially among the 24 sites. Due to this variability and the availability of site-specific information, the radon exposures were evaluated for each site.
The uncertainty in the individual and population risks for each site arises from the uncertainties in (1) the average annual radon emanation rate from the pile, (2) the average annual atmospheric dispersion factors to the nearby residents, (3) the average resident occupancy time, and (4) the assumed risk factor for radon exposure. The following discusses the uncertainties in each of these calculational parameters as they apply to the maximum individual and population doses and risks.
'7.2.1 Radon Emanation Rates
The radon emanation rates from the piles are expressed in units of Ci/yr. This is a calculated value based on the area of the pile, the average Ka-226 concentration in the pile, and the assumption that the radon emanation rate is 1 pCi/m2-sec per pCi/g of Ra-226 in the tailings. The concentrations of Ra-226 in the piles have been extensively studied, and their uncertainty is not an important contributor to the overall uncertainty in the source term.
The assumed emanation rate per unit area is based on empirical data which vary substantially as a function of time and location on the pile and numerous physical and chemical parameters (La87, Mo87, Ha86). However, since the quantity of interest is average annual release rate over the entire pile, the uncertainty is reduced due to averaging.
For the five piles that have been stabilized, the radon emanation rate is assumed to be at the regulatory limit of 20 pCi/m2-sec. This is a conservative assumption, since remedial designs typically exceed their design objectives. Post-remediation radon flux measurements have not been routinely made on the piles, and the actual flux for these piles may be comparable to natural background, i.e., 1-5 pCi/m2-sec.
In conclusion, the average annual radon emanation rate for the limiting pile used in the calculations for the maximally exposed individual is realistic. For the population doses, there is a small uncertainty in the effective area of the piles. A great deal of the uncertainty typically associated with predicting radon emanation is eliminated because the parameters of interest are average or integrated values. For the stabilized piles, the radon emanation rate may be overestimated if design objectives are exceeded.
7.2.2 Atmospheric Transport
The product of the average annual source term with appropriate average annual atmospheric dispersion factors yields the average annual radionuclide concentrations at the locations of interest. The dispersion factors used in the risk assessments were obtained using site-specific meteorological data. These data are used as input to the standard Gaussian dispersion model for area sources.
Gaussian dispersion modeling has been found to be reliable for near-field, average annual conditions in relatively flat terrain (Mu85). For the maximum individual doses, these conditions hold. For the 80-km population doses, these conditions do not hold due to the distances involved. However, since the population doses are integrated over space and time, the uncertainties average out, resulting in an acceptable estimate of integrated dose.
I n conclus ion , though t h e u n c e r t a i n t i e s i n c a l c u l a t i n g an atmospheric d i s p e r s i o n f a c t o r a t a s p e c i f i c l o c a t i o n and p o i n t i n t ime may be l a r g e (Mi88), when a p p l i e d t o average annual c o n d i t i o n s , a s i s t h e c a s e f o r t h e maximum i n d i v i d u a l doses , o r when i n t e g r a t e d over t ime and space, a s i s t h e case f o r t h e popu la t ion doses , t h e d i s p e r s i o n f a c t o r s a r e more r e l i a b l e . A s d i s c u s s e d i n Chapter 4 , v a l i d a t i o n s t u d i e s f o r Gaussian d i s p e r s i o n models i n d i c a t e an u n c e r t a i n t y of approximately a f a c t o r of 2 f o r average annual c o n c e n t r a t i o n s f o r l o c a t i o n s w i t h i n 10 km of t h e r e l e a s e and a f a c t o r of 4-10 f o r l o c a t i o n s between 30-140 km of a r e l e a s e .
7 . 2 . 3 Locat ion of t h e Maximum I n d i v i d u a l
One of t h e l a r g e s t sou rces of u n c e r t a i n t y i n c a l c u l a t i n g t h e maximum i n d i v i d u a l doses and r i s k s i s u n c e r t a i n t y i n t h e l o c a t i o n of t h e maximum i n d i v i d u a l and t h e d u r a t i o n of exposure. The l o c a t i o n of t h e maximum i n d i v i d u a l was determined through s i t e u n i t s . The Agency's ground-rule when e s t i m a t i n g r i s k i s t h a t i n d i v i d u a l s remain a t t h e s e l o c a t i o n s throughout t h e i r l i v e s . There i s a c e r t a i n degree of i n h e r e n t u n c e r t a i n t y a s s o c i a t e d wi th t h i s assumption; however, it ensu res t h a t t h o s e i n d i v i d u a l s t h a t may r e s i d e a t one l o c a t i o n f o r t h e i r e n t i r e l i v e s a r e g iven a p p r o p r i a t e c o n s i d e r a t i o n .
7 . 2 . 4 Risk F a c t o r
The r i s k f a c t o r f o r exposure t o radon daugh te r s used i n t h i s r i s k assessment i s 360 lung cance r f a t a l i t i e s p e r 1.OE+6 WLM. The u n c e r t a i n t i e s a s s o c i a t e d wi th t h e r i s k f a c t o r f o r exposure t o radon have been thoroughly reviewed and d i s c u s s e d (BEIR88, ICRP87, NCRP85) . Based on t h e ICRP 50 (ICRP87) r e p o r t f i n d i n g s , an u n c e r t a i n t y range of 160-720 f a t a l lung cance r s p e r 1 . O E + 6 WLM i s a r r i v e d a t i n Chapter 6 . These v a l u e s r e p r e s e n t e s t i m a t e s f o r t h e average i n d i v i d u a l f o r t h e c a s e of c o n s t a n t l i f e t i m e exposure . The ques t ion of s e n s i t i v e subgroups i s n o t addressed .
Major sou rces of u n c e r t a i n t y i n radon r i s k f a c t o r s f o r t h e g e n e r a l p u b l i c i n c l u d e : (1) u n c e r t a i n t i e s i n t h e ep idemiologica l d a t a on miners ( e s p e c i a l l y w i t h r e s p e c t t o exposure e s t i m a t i o n ) ; ( 2 ) u n c e r t a i n t i e s i n t h e sex, age and t ime dependencies of t h e r i s k ; ( 3 ) u n c e r t a i n t i e s i n how d i f f e r e n c e s i n exposure c o n d i t i o n s between mines and homes, p a r t i c u l a r l y wi th r e s p e c t t o una t t ached f r a c t i o n , a f f e c t r i s k ; and ( 4 ) u n c e r t a i n t i e s r ega rd ing t h e p o s s i b l e s y n e r g i s t i c e f f e c t s of radon and c i g a r e t t e smoke i n caus ing lung cance r .
7 . 3 DOE RADON
F ive s i t e s a r e inc luded i n t h e DOE radon ca t egory : a m i l l t a i l i n g s s i t e i n Mont ice l lo , Utah, t h e Middlesex Sampling P l a n t s i t e i n Middlesex, N . J . , t h e Weldon Spr ing s i t e i n Weldon Spr ing , MO, t h e Niagara F a l l s S to rage S i t e i n Niagara F a l l s , N Y , and t h e Feed
Materials Production Center in Fernald, Ohio, As is the case for the uranium mill tailings, the risks associated with these facilities are due to exposure to radon and radon progeny. ~ccordingly, the uncertainties are similar to those described for mill tailings. The following discussion is therefore limited to uncertainties unique to each facility.
The tailings at the Monticello site are covered with a thin layer of earth to control the resuspension of particulates. The degree to which this retards the emanation of radon from the pile is not addressed. A site visit confirmed the location of the maximum individual, which reduces this source of uncertainty.
The Weldon Springs site contains an old stone quarry and a former chemical processing plant that are sources of radon emission. DOE has measured the radon emission rates from these sources. Accordingly, the source terms are well characterized. One source of additional uncertainty is dispersion of radon from the quarry. The geometry of the release from a quarry may tend to increase turbulence and reduce exposures. The effect may be likened to building wake effects which can reduce near-field concentrations by about a factor of two.
7.4 LICENSED URANIUM MILL TAILINGS FACILITIES
Site-specific risk assessments have been performed for each of the 26 uranium mills licensed as of August 1988. The uncertainties in this assessment are similar to those described for inactive facilities. However, large portions of active mill tailings are moistened or are under water. These areas do not contribute significantly to the radon source term, but uncertainties in the assumptions regarding the portions of the piles that are dry contribute significantly to the uncertainty in the source term. In addition, there is evidence that the dry areas contain fewer slimes which tends to reduce the Ra-226 concentration in the dry areas.
7.5 UNDERGROUND URANIUM MINES
The doses and risks associated with airborne emissions from underground uranium mines are due to the high volume of mine exhaust air and the high concentrations of radon in the air. Though the radionuclide of concern is radon, there are many important differences in the uncertainties between mines and tailings. These differences are primarily related to the source term and the atmospheric dispersion factors.
For three of the six mines, the radon release rate was calculated based on monitored levels of radon daughters. The radon concentration was estimated assuming a daughter equilibrium fraction of 0.07 observed at other mines. As applied to any one mine, this approach introduces a large uncertainty since the degree
of equilibrium is mine specific, based on the residence time of air in the mine and the rate of deposition of the daughters in transit in the mine. For the three mines where the radon concentrations were measured directly, the uncertainty in the source term is negligible.
The second important source of uncertainty is the near-field atmospheric dispersion factors for mines with rugged terrain. For these mines, the Industrial Source Complex Dispersion (ICS) model was used. Though this model is widely used for complex terrain and release configurations, the results may be uncertain by a factor of 2 or more.
7.6 PHOSPHOGYPSUM STACKS
Like uranium mill tailings, the exposures from phosphogypsum stacks are due to radon emanation and resuspended particulates. Accordingly, the uncertainties in exposures are similar. However, unlike the uranium mill tailings, the radon flux from each individual stack was not directly estimated. Instead, the measured flux from one stack was used as the basis for calculating the flux from the other stacks in the region by applying corrections for dimensions, design, and use of the stack. Flux measurements for all the piles would have been preferable, but the large number and size of the piles made this impractical.
Particulate emissions from the stacks were assumed to be entirely from vehicular fugitive emissions. These were calculated using an empirical model which considers vehicle speed, rainfall, and particle size. Each of these parameters varies in time and space. As a result, such models must be used discriminantly and, when possible, should be supplemented with field measurements (Be76, Mi75).
Dispersion modeling of radon and particulates from phosphogypsum stacks is difficult due to the aerial extent and height of the stacks and the variability of the emission rates as a function of location. For a maximum individual close to the pile, the calculated airborne concentrations are highly uncertain because of these factors, and it is preferable to perform field measurements at the maximum individual location to confirm predicted values. For population exposures, the uncertainties are smaller because the pile behaves effectively as a point source.
For particulate radionuclides, the uncertainties are further increased due to uncertainties in the dose conversion factors (DCFs) (Ga80, Me82). As discussed in Chapter 5, these uncertainties are due to uncertainty in the physical (i.e., particle size) and chemical (i.e., solubility) properties of the radionuclide, as well as uncertainties in dosimetric model formulation and the values of the model input parameters.
7.7 ELEMENTAL PHOSPHORUS PLANTS
Site-specific risk assessments were performed for each of the eight phosphate plants. Because site-specific meteorology and demography were employed and site visits were made to identify the locations of the maximum individual, these sources of uncertainty are small.
The radionuclide emission rates from three of the eight operating phosphate plants have been extensively characterized in terms of radionuclide content and physical and chemical form. Accordingly, the uncertainty in the source term, which is dominated by Po-210 and Pb-210, is not an important source of uncertainty.
Dispersion of the emissions is modeled for a buoyant, elevated release using Gaussian modeling. The uncertainty in the dispersion factor for near-field and far-field dispersion, described above, is an important contributor to uncertainty.
Because the physical and chemical form of the release is well characterized, the uncertainty in the DCFs is limited to the inherent uncertainty of the dose conversion factors (DCFs) and the effects of individual variability. Both these apply primarily to the maximum individual dose.
A major source of uncertainty is the risk factor used to convert dose to risk. As discussed in Chapter 6, the risk factor has an estimated uncertainty of about a factor of 3 for population exposures. Risk estimates reported for the maximum individual are based on the assumption that the maximum individual is similar to the average members of the population with regard to sensitivity to the potential carcinogenic effects of exposure to ionizing radiation.
7.8 INACTIVE SURFACE URANIUM MINES
Due to the large number of surface mines, it was necessary to establish categories of mines which were used to identify reference mines for use in the risk assessment. One reference mine in each of five regions was selected for detailed characterization. The principal measurements made were radon flux and Ra-226 concentrations in soil. The source terms obtained for the reference mines were then scaled for use at other mines.
In a similar manner, regional land use and demographic data were reviewed to define a representative site for each region. These data, along with the reference and scaled source terms, were used to calculate maximum individual and population doses. As applied to population doses, the uncertainties are small because individual site variabilities are averaged out. With regard to the
maximum individual doses, the site and source terms were selected in order to ensure that the doses were not significantly underestimated. As a result, the basic approach used to characterize sites and land use is believed to contribute little to the overall uncertainty in dose and risk.
The important sources of uncertainty are the methods used to model source terms and the inherent uncertainties in pathway, dose, and risk modeling. For surface mines, the critical radionuclides are radon and Ra-226, and the critical exposure pathways are the inhalation of radon daughters and Ra-226. The uncertainties are therefore similar to those described above.
The uncertainty in the radon source terms is small since radon flux was measured directly. The uncertainty in the particulate source term is large because it was based on resuspension models which are subject to large uncertainties (Mi76, Be76). The variability in resuspension factors can be several orders of magnitude, depending on soil properties and weather. Because of this uncertainty, conservative assumptions were used to model resuspension which likely resulted in an overestimate of exposures from this pathway.
7.9 URANIUM FUEL CYCLE FACILITIES
The uranium fuel cycle facilities evaluated include uranium mills, conversion facilities, fuel fabrication facilities, and power reactors.
7.9.1 Uranium Mills
Site-specific impacts for each currently licensed uranium mill were evaluated. Site-specific source terms, meteorology, and demography were used. Because of the site specific nature of the analysis, uncertainties are reduced.
The radionuclides and pathways contributing to dose are inhalation of Pb-210, Th-230, Ra-226, and U-238. Accordingly, uncertainty in particle size and solubility, along with the inherent uncertainty in the inhalation DCFs for these radionuclides, are important contributors to uncertainty (DOE75; Me82, Wr86).
7.9.2 Uranium Conversion Facilities
Separate assessments were performed for the two uranium conversion facilities. Site-specific source terms, meteorology, demography, and land use were used. Accordingly, the uncertainties associated with using model or reference facilities were avoided. The limiting pathways of exposure are the inhalation of Ra-226, Th- 230, and U-238. The important sources of uncertainty are as described for uranium mills.
- 1 . 9 . 3 Fuel Fabrication Facilities
The five operating fuel fabrication facilities each have well- characterized source terms and site characteristics. The dose and risk assessments were performed for the most limiting facility. Accordingly, the maximum individual and population doses and risks are well-represented for the industry as a whole, but may overestimate risks for some specific facilities.
The limiting pathway is inhalation of uranium. The important contributors to uncertainty are as discussed above for the inhalation of particulates (Fi86).
7.9.4 Nuclear Power Plants
There are over 100 commercial nuclear power plants in the United States. The radionuclide emissions and site characteristics of each facility are well defined and maintained current in accordance with regulatory requirements. In addition, each facility is required to demonstrate semiannually that its offsite impacts are maintained within the guidelines set forth in Appendix I to 10 CFR 50. In brief, these guidelines are 5 mrem/yr to the whole body or any organ and 25 mrem/yr to the thyroid. As a result, this places an upper limit on the maximum individual doses and risks. A review of the reported impacts reveals that the doses are typically maintained at a fraction of a mrem/yr to a few mrem/yr. The populati.on impacts are reported to be about 1 to 10 person rems/yr per plant.
For the purpose of this assessment, average annual source terms for BWRs and PWRs were used. A reference site with a generally high popul.ation density was selected so that the calculated doses would represent typical values for the higher populated sites. The upper bound doses for the maximally exposed individuals, based on values reported by each utility, were less than Appendix I guidelines. Because of the reference site selected, the population doses calculated are higher than the actual doses at most sites.
The calculations revealed that for PWRs the limiting exposure pathway is external exposure to noble gases. Except for uncertainty in atmospheric dispersion, the uncertainties in these exposures are small. (It should be emphasized that, not withstanding these uncertainties, the maximum individual doses are all below the Appendix I limits.) The uncertainties in risk are due to the uncertainties in the risk factor, as described above.
For BWRs, in addition to external exposures to noble gases, internal exposures from the ingestion of Sr-90 also contribute to dose. Thus, uncertainties in the environmental transfer factors and
DCF for Sr-90 also contribute to uncertainty. Numerous studies have been published describing the uncertainties in ingestion pathway exposures (Jo88, Tr83, NUREG81, Sc80, Ng82, Ng77, NUREG79, Du81, Sh85, Ib88, Wh88, Li88). For example, the soil to plant concentration factor for Sr-90 was reported in NUREG/CR-2612 (NUREG81) to have a geometric mean of 0.33 and a geometric standard deviation of 3.3. The basic data used to develop this distribution comes from the work of Ng (1982). The distribution incorporates radioactive and stable data for crops grown in both laboratory and field conditions and in soil of virtually every texture classification.
7.10 NRC-LICENSED FACILITIES AND NON-DOE FEDERAL FACILITIES
7.10.1 NRC-Licensed Facilities - Hospitals
The number and types of NRC and NRC Agreement State licensees are large and highly varied. For the purpose of evaluating the uncertainties in the risks of airborne emissions from these facilities, hospitals are selected as conservatively representative of this source category. Hospitals handle relatively large quantities of volatile radionuclides and are usually located in populated areas. Accordingly, their potential for offsite exposure from airborne radionuclide emissions is relatively large.
Section 3.2 of Volume 11 characterizes the number and types of sources of airborne emissions of radionuclides from hospitals. Because of the large numbers of facilities and varied practices, along with minimal routine reporting requirements, the offsite doses and risks attributable to any one hospital or to the entire category are highly uncertain.
Because of the complexity of this category, and the limited data available, a set of model facilities was defined in Section 3.2.2, which is used to extrapolate to the category as a whole. This is the first source of significant uncertainty, especially in terms of the representativeness of the model facilities for any one hospital. The representativeness issue is significant when attempting to characterize the doses and risks to the offsite maximum individual at any one facility, and, as is discussed below, the approach selected is likely to overestimate the doses and risks at most facilities.
The representativeness issue is of less concern when considering the population doses and risks associated with the entire category because individual differences among hospitals tend to average out. However, as discussed below, the model facilities are fairly conservative representatives.
The first and perhaps the most important source of uncertainty is the radionuclide emission rates. Source term data were obtained
from surveys of 100 hospitals (performed by tlie Conference of Radiation Control Program Directors [CRCPD] and using data available from the DOE/EG&G database). These data are used to represent 3,680 hospitals in the United States that handle diagnostic or therapeutic amounts of radiopharmaceuticals. Based on these data, the largest reported emissions were used to represent large hospitals, and the average of the reported emissions was used as representative of typical hospitals.
The uncertainties in these emissions are difficult to estimate since they are based on periodic grab samples taken from effluent release points and analyses designed to ensure that the discharges do not exceed the offsite maximum permissible concentrations (MPC) set forth in Appendix B to 10 CFR 20. As a result, the precision of the estimate is not required to be high, and non-monitored release points are not addressed. Another source of uncertainty is the absence of C-14 and H-3 in the estimate of release. Hospitals, especially research hospitals, handle large quantities of these radionuclides which can be readily discharged in the gaseous effluents. It is difficult to address the uncertainties in the dose and risk estimates due to these considerations.
The second source of uncertainty is the assumed location of the maximum individual. The analysis is based on the assumption that the nearest individual is 100 meters away. This is a reasonable assumption for most facilities; however, for some facilities this assumption may be highly conservative.
For populations, the assessment divided the category into urban and rural locations, each with markedly different demographic and land use characteristics. In the aggregate, the dose estimates are likely to be reasonable. However, not including C-14 and H-3 releases could result in an underestimate in the population doses because these are long-lived radionuclides.
Given the uncertainty in the location of the nearby individual and land use patterns, the uncertainties associated with atmospheric dispersion, the exposure pathways (including food), and the dose conversion factors are not likely to contribute significantly to the uncertainty in risk. The external and internal dosimetry and environmental behavior of the radionuclides considered e , Xe-133 and 1-131) are well understood. Finally, the uncertainty in risk, due to uncertainty in the risk factor, is about a factor of three.
In summary, the uncertainties in the doses and risks to individuals and the populations in the vicinity of hospitals is dominated by uncertainty in the source term. In addition, uncertainties in demographic characteristics and the risk factor are important contributors to uncertainty.
These observations also apply to most other NRC-licensed
facilities and Agreement State licensees, since the types of radionuclides emitted in the gaseous effluents (i.e., 1-131, Xe-133, H-3, and C-14) are similar for these licensees. In addition, the regulatory requirements, including reporting and record-keeping requirements, are similar. The types of facilities include radiopharmaceutical manufacturers, laboratories, and universities.
7.10.2 NRC-Licensed Facilities - Research and Test Reactors
Research and test reactors are NRC-licensed facilities that differ significantly from hospitals and require separate consideration. The source terms from these facilities are better characterized and are limited to radionuclides that are relatively easy to model; i.e. Ar-41 and H-3. The approach used in Section 3.5 of Volume I1 to assess risk is to select the four largest emitters of the 70 facilities, and estimate doses and risks for these facilities. The potential for the doses and risks being greater than the indicated values is small.
The population risk was estimated by prorating by the total source term for the entire category. Accordingly, the source term is likely to be fairly accurate. However, demographic patterns at different sites may be quite different than the four reference sites. Since the reference sites are in highly populated urban areas, the population risks are appropriate for the reference sites but are conservative as applies to the category as a whole.
As a final point, since the key radionuclide emissions in this category are H-3 and Ar-41, dose conversion factors do not contribute significantly to uncertainty. In addition, the food ingestion pathway is not significant. As a result, uncertainties due to these factors are small.
7.10.3 NRC Licensed Facilities-Source Material Licensees
Sections 3.7 and 3.8 of Volume 11 discuss emissions from NRC licensed facilities that fabricate fuel for research reactors or are licensed to handle source material. These facilities primarily emit uranium and thorium. Accordingly, the discussion provided in Section 7.9 on fuel fabrication facilities for the uranium fuel cycle is applicable to this category also.
These facilities maintain effluent records and, therefore, the source terms are well defined. Because the number of such facilities is limited, the analyses were performed for individual facilities or a conservatively selected number of reference facilities. Accordingly, representativeness is not an important source of uncertainty. However, the environmental behavior and internal dosimetry of uranium and thorium is uncertain because the particle size and chemical composition of the emissions are not well
defined. Nevertheless, conservative assumptions were used which provides assurance that the doses and risks were not underestimated.
7.10.4. Non-DOE Federal Facilities
As discussed in Section 3.10 of Volume 11, this category consists primarily of shipyards and naval bases and DOD research reactors. The research reactors are similar to the research and test reactor category discussed above. Accordingly, this discussion emphasizes the shipyards and naval bases.
The airborne emissions from the shipyards are upper bound estimates based on many years of monitoring. Using these source terms, the doses are risks at a reference site were calculated. Because of the conservative source terms and the highly populated west coast reference site used in the analysis, the doses and risks represent upper bound estimates.
7.11 COAL-FIRED BOILERS
The dose and risk assessment provided in Section 7 of Volume I1 attempted to account for all the important variables in selecting a set of reference facilities and sites for both utility and industrial boilers. In order to calculate the risks to the maximum individual, utility boilers were grouped into four categories according to demography. For each category, the largest boilers were identified to calculate the doses to the maximum individuals. For the population doses, the facilities with the average emissions for each category were used as reference facilities. This approach places an upper bound on the individual risks and may overestimate individual risks for some facilities.
Another important source of uncertainty for individual risk is the dose conversion factor. The particle size and the chemical composition of the inhaled radionuclides are variable among sites and as a function of time. The doses to individuals from the food ingestion pathways are also highly uncertain due to uncertainty in the environmental transport parameters for long lived naturally occurring radionuclides. For population doses, these uncertainties are markedly reduced due to the effects of averaging.
The uncertainties in the doses and risks associated with airborne radionuclide emissions from industrial boilers are similar to those for utility boilers. For the purpose of the risk assessment, the industrial boiler with the largest particulate release was selected as the reference plant. The radionuclide concentration in the particulate emissions from industrial boilers was estimated indirectly based on the utility boiler experience. Since the largest industrial boiler was used as the reference facility, and since assumptions applicable to utility boiler emissions are conservative as applied to industrial boilers, the
source term is a generally conservative vaiue for most fncil~ities.
The actual site data at the reference plants were used. As a result, some plants have higher or lower population densities and land use characteristics. It is not possible to judge the degree of representatives associated with the reference sites. However, given the conservative source term assumptions, it is likely that the population doses and risks are reasonable values, if not soniewhat conservative.
7.12 DOE FACILITIES
As indicated in Chapter 2 of Volume 11, there are a large number of diverse DOE facilities with highly varied site characteristics. It is not possible to discuss the important sources of uncertainty for this category in the aggregate. Instead, a site specific assessment of each facility is required. In order to provide insight into the nature and extent of the uncertainties, a discussion of two of the facilities is provided.
7.12.1 Reactive Metals, Inc.
As indicated in Section 2.2 of Volume 11, Reactive Metals, Inc. processes uranium ingots and releases particulate uranium, probably uranium oxide, in its multiple stack effluents at the site. The emissions are monitored; however, the particle size and solubility is not monitored. As a result, the environmental behavior of the uranium and its inhalation dose conversion factors are uncertain. Another source of uncertainty is due to the method used to model dispersion. The uranium is discharged at three stacks, but is modeled as a single source.
Due to the lack of onsite meteorological data, data from the nearest airport were used. Nevertheless, as discussed above in Chapter 4, uncertainty in the average annual atmosphere dispersion factors do not contribute significantly to overall uncertainty as long as the location of this maximum individual is well defined. In this case, site specific information was available which reduces this source of uncertainty.
Since the facility is located in an urban area, the food pathway is not an important contribution to dose or risk.
7.12.2 Hanford Reservation
As discussed in Section 2.3 of Volume 11, the airborne emissions from the Hanford Reservation originate from several different sources located in each of four separate production areas. The risk assessment, however, assumed that the releases were all from the fuel processing area of the reservation, which is the largest source of release. This is a somewhat conservative
assumption since the cioses from one point source is usually larger than the dose from multiple sources with the same total release quantity. Offsetting this conservatism is the possibility that some receptor locations many be closer to one of the release sources than the 15 Km assumed in the analyses. Without a more refined analysis of individual sources and receptors, it is difficult to assess whether overall these factors contribute to an overestimate or underestimate of the dose. However, as indicated below, assuming the entire release is from the reprocessing area tends to place an upper bound on the individual doses due to its location relative to the nearby populations.
The emissions from the facility are well characterized but default particle size and solubility assumptions were used for particulates, resulting in a possible overestimate of the inhalation dose. However, since less than 50 percent of the calculated dose was due to particulates (most of the dose was due to Ar-41), any overestimate in dose due to these assumptions is less than a factor of 2.
Since the doses are dominated by external exposure to Ar-41, the uncertainty in the dose conversion factors is not an important contribution to the uncertainty in dose. In addition, Ar-41 is primarily emitted from the N-Reactor, and not from the reprocessing area. This assumption tends to overestimate dose because the reprocessing area is closer to the populated areas and in the more predominant wind direction.
7.13 HIGH-LEVEL WASTE DISPOSAL FACILITIES
No operational high-level waste (HLW) disposal facilities are operating in the United States, nor are any routine air emissions anticipated from planned facilities. Nevertheless, estimates of radionuclide emissions were made for the planned Monitored Retrievable Storage (MRS) facility, the Waste Isolation Pilot Program (WIPP), and the commercial HLW disposal facility planned for Yucca Mountain. The source terms were estimated assuming a waste or spent fuel handling accident which releases radionuclides in accord with a defined set of conservative assumptions.
The inhalation pathway was found to be the critical pathway. The critical radionuclides are H-3, Kr-85 and 1-129 for the MRS and Yucca, and Pu-239 and Am-241 for WIPP. The most important source of uncertainty in these calculations is the assumption made with respect to the likelihood of accidents occurring and releasing the defined types and quantities of radionuclides.
REFERENCES
Boone, F.W., et al. "Residence Times of 1-129 in Undisturbed Surface Soils Based on Measured Soil Concentration Profiles", Health Physics, 48 (4) :401, April 1985.
National Research Council, Health Risks of Radon and Other Internally Deposited Alpha Emitters, BEIR IV, National Academy Press, Washington, D.C., 1988.
Bennett, B.G., "Transuranic Element Pathways to Man", in Transuranium Nuclides in the Environment, IAEA, Vienna, STI/PUB/410, p.367-382, 1976.
Crick, M.J., et al., Uncertainty Analysis of the Foodchain and Atmospheric Dispersion Modules of MARC, NRPB-R184,. May 1988
Department of Energy, FEIS, Remedial Actions at the Former Climax Uranium Company, Uranium Mill Site, Grand Junction, Mesa County, Colorado, UMTRA-DOE/AL, DOE/EIS- 0126-F, December 1986.
Department of Energy, Environmental Assessment, Remedial Action at the Tuba City Uranium Mill Tailings Site, Tuba City, Arizona, DOE/EA- 0317, November 1986.
Dunning, D.E., Jr., and Schwarz, G, "Viability of human thyroid characteristics and estimated dose from ingested I-131t', Health Physics 40 (5) : 625-642.
Fisher, D.L., et al, "The Solubility and Particle Size Distribution of Uranium Oxide Aerosols Associated with Uranium Metal Fabrication Facilities", Abstracts from the 31st Annual Meeting of the Health Physics Society. Pittsburgh, Pa, June 29 - July 3, 1986, pg S85.
Garten, C.T. 1978. "A review of parameter values used to assess the transport of plutonium, uranium and thorium in terrestrial food chains", Environ. Res, 17(3): 437-452.
Garten, C.T., Jr., "Statistical uncertainties in predicting plutonium dose to lung and bone from contaminated soils", Health Physics, 39(1): 99-103, 1980.
XaDG Hart, K.P., and Levins, D.M., "Steady State Rn Diffusion Through Tailings and Multiple Layers of Covering Material", Health Physics, 50(3):369. March 1986.
Ibrahim, S.A., and Wicker, F.W., "Comparative Uptake of U and Th by Native Plants at a U. Production Site", Health Physics, 54(4):413, April 1988.
International Commission on Radiological Protection, Lung Cancer Risks from Inhalation Exposure to Radon Daughters, ICRP 50, 1987.
Johnson, J.E., et al., "Transfer Coefficients of Selected Radionuclides to Animal Products. I. Comparison of Milk and Meat from Dairy Cows and Goats", Health Physics, 54 (2) : 161, February 1988.
Landa, E.R, "Radium-226 Contents and Rn Emanation Coefficients of Particle-Size Fractions of Alkaline, acid and Mixed U. Mill Tailings", Health Physics, 52(3):303, March 1987.
Linsalata, P., Eisenbud, M., and Penna Franca, P., "Soil-to-Edible Vegetable and Soil-to-Farm Animal Tissue Concentration Ratios for Ra, Th, U and Rare Earth Elements", Abstracts of the 33rd Annual Meeting of the Health Physics Society, Boston, Mass., July 4 - 8, 1988, pg S51.
McDowell-Bayer, L.M., and Travis, C.C., "A Review of parameters describing terrestrial food-chain transport of Lead-210 and Radium-226", Nuclear Safety 21 (4) : 486-495, 1980.
Mewhinney, J.A., Griffith, W.C., and Muggenburg, B.A., "The influence of aerosol size on retention and translocation of 241 Am following inhalation of 24AM02 by beagles", Health Physics, 42 (5) : 611-627, 1982.
Milhorn, R.C., et al., "Measured Plutonium Resuspension and Resulting Dose from Agricultural Aerations of an Old Field at Savannah River Plant in S.E. USA", IAEA, Vienna, STI/PUB/410, p. 409, 1975.
Miller, C.W., et al., "Examination of the Uncertainty in Air Concentration Prediction Using the Hanford Field Data", Health Physics, 55(2) :443, 1988.
Morgan, M.G., et al., "Technical Uncertainty in Policy Analysis," Chapter 6 in Final Report to Division of Policy Research and Analysis, NSF Grant PRA-7913070, 1982.
Morris, R.C., and Fraley, L Jr.,"Environmental Effects of Rn-222 Fluence Rate from Unreclaimed Uranium Tailings," Health Physics, 52(Suppl 1) :550, Abstract of Papers presented at the 32nd Annual Meeting of the HPS, Salt Lake City, Utah, July 5 - 9, 1987.
Morgan, M.G., et al., "A probabilistic methodology for estimating air pollution health effects from coal fired power plants," Energy System and Policy 2(3) :287, 1978.
Murphy, B.D., and Ohr, S.Y., "The Limitations of Atmospheric Dispersion Data and Their Contribution to Uncertainties in Dose Assessment." Health Physics 48(3) :315, March 1985.
NCRP 8 5 National Council on Radiation Protection and ~~~~ ~ ~ - ~ .
Measurements, Evaluation of Occupational and Environmental Exposures to Radon and Radon Daughters, NCRP Report No. 78, May 31, 1984.
Ng82 Ng, Y.C. "A review of transfer factors for assessing the dose from radionuclides in agricultural products," Nuclear Safety 23(1) : 57 - 71, 1982.
Ng77 Ng, Y.C., et al., "Transfer coefficients for the prediction of the dose to man via the forage-cow-milk pathway from radionuclides released to the biosphere," U.S. DOE Report UCRL-51939, 1977.
NUREG79 U.S. Nuclear Regulatory Commission, A statistical analysis of selected parameters for predicting food chain transport and internal dose of radionuclides. Hoffman, F.O., and Baes, C.F., I11 (eds), NUREG/CR-1004, 1979.
NUREG81 U.S. Nuclear Regulatory Commission, Variability in dose estimate associated with food chain transport and inqestion of selected radionuclides, by F.O. Hoffman, R.H. Gardner, and K.F. Eckerman,
Schwarz, G., and iioffnan, F.O., "Imprecision of dose predictions for radionuclides released to the environment: an application of a Monte-Carlo simulation technique." Environment International, 4: 280-297, 1980.
Schwarz, G., and Dunning, D.E., Jr.,"Imprecision in estimates of dose from ingested 137 Cs due to variability in human biological characteristics." Health Physics, 43 (5) : 631-646, 1982.
Sheppard, M.I.,"Radionuclide Partitioning Coefficients in Soil and Plants and Their Correlation." Health Physics, 49 (1) :106, July 1985.
Sykes, R.I., and Lewellen, W.S., "Results from Two Model Evaluation Studies", abstract from the 31st Annual Meeting of the HPS, Pittsburgh, Pa., June 29 - July 3, 1986, Health Physics, 5(Supp 1) :S32, June 1986.
Tadmor, J. "Sensitivity Analysis of the Influence of Source Term and Environmental Parameters on the Radiological Risk of Coal-Fired Plants," Health Physics, 51(1) :61, July 1986.
Tracy, B.L., Prantl, F.A., and Quinn, J.M., "Transfer of 226Ra, 210Pb and uranium from soil to garden produce: assessment of risk," Health Physics, 44(5): 469-477, 1983.
Whicker, F.W., and Kirchner, T.B., "Uncertainty Analysis of Predicted 1-131 and Cs-137 Concentrations in Milk from Fallout," abstracts from the 33rd Annual Health Physics Society Meeting, Boston, Mass., July 4 - 8, 1988, Vol. 54 (Supp 1):S20.
Wrenn, M.E.,"Metabolism and Toxicity of Uranium," ibid. S82.
APPENDIX A
ASSESSMENT METHODOLOGY

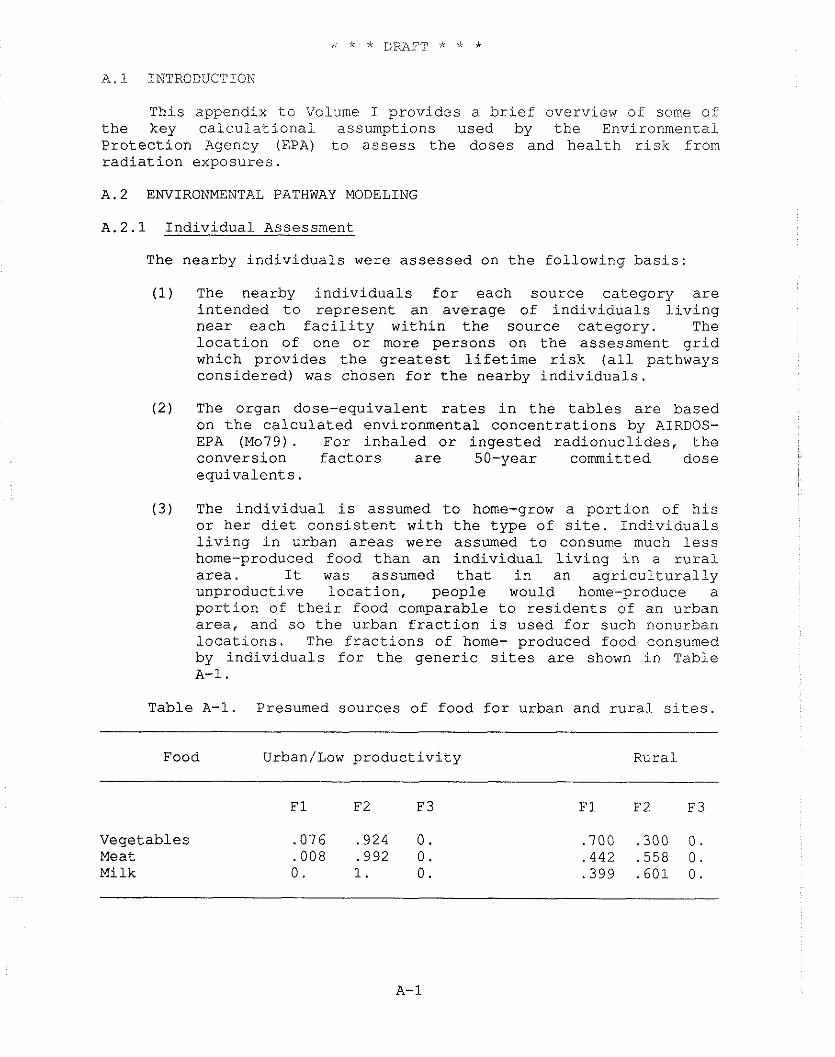
A.1 INTRODUCTION
This appendix to Volume I provides a brief overview of some of the key calculational assumptions used by the Environmental Protection Agency (EPA) to assess the doses and health risk from radiation exposures.
A.2 ENVIRONMENTAL PATHWAY MODELING
A.2.1 Individual Assessment
The nearby individuals were assessed on the following basis:
(1) The nearby individuals for each source category are intended to represent an average of individuals living near each facility within the source category. The location of one or more persons on the assessment grid which provides the greatest lifetime risk (all pathways considered) was chosen for the nearby individuals.
( 2 ) The organ dose-equivalent rates in the tables are based on the calculated environmental concentrations by AIRDOS- EPA (Mo79). For inhaled or ingested radionuclides, the conversion factors are 50-year committed dose equivalents.
(3) The individual is assumed to home-grow a portion of his or her diet consistent with the type of site. Individuals living in urban areas were assumed to consume much less home-produced food than an individual living in a rural area. It was assumed that in an agriculturally unproductive location, people would home-produce a portion of their food comparable to residents of an urban area, and so the urban fraction is used for such nonurban locations. The fractions of home- produced food consumed by individuals for the generic sites are shown in Table A-1 .
Table A-1. Presumed sources of food for urban and rural sites.
Food Urban/Low productivity Rural
Vegetables Meat Milk
F1 and F2 are the home-produced fractions at the i.ndividualsn location and within the 80 km assessment area, respectively. The balance of the diet, F3, is considered to be imported from outside the assessment area, with negligible radionuclide concentrations due to the assessed source. If there is insufficient production of a food category within the assessment area to provide the non house- produced fraction for the population, F2 is reduced and F3 is increased accordingly. Fractions are based on an analysis of household data from the USDA 1965-1966 National Food Consumption Survey (USDA72) . A.2.2 Collective Assessment
The collective assessment to the population within an 80 km radius of the facility under consideration was performed as follows:
(1) The population distribution around the generic site was based on the 1980 census. The population was assumed to remain stationary in time.
(2) Average agricultural production data for the state in which the generic site is located were assumed for all distances greater than 500 meters from the source. For distance less than 500 meters, no agricultural production is calculated.
(3) The population in the assessment area consumes food from the assessment area to the extent that the calculated production allows. Any additional food required is assumed to be imported without contamination by the assessment source. Any surplus is not considered in the assessment.
(4) The collective organ dose-equivalent rates are based on the calculated environmental concentrations. Fifty-year dose commitment factors (as for the individual case) are used for ingestion and inhalation. The collective dose equivalent rates in the tables can be considered to be either the dose commitment rates after 100 years of plant operation, or equivalently, the incurred doses that will be for up to 100 years from the time of release. Tables A-2 and A-3 summarizes AIRDOS-EPA parameters used for the assessments (Sj84).
Table A-2 summarizes agricultural model parameters, usage factors, and other AIRDOS-EPA parameters which are independent of the released radionuclides. Table A-3 tabulates element dependent data. These include the default inhalation clearance class and, the fraction of the stable element reacting body fluids after ingestion. Inhaled clearance classes D, W and Y correspond to those materials which clear from the lung over periods of days, weeks, and years respectively. Class * is for gases. Biv, and Biv, are the soil to pasture and soil to produce concentration factors respectively.
Both factors are for soil concentration on a dry weight basis. The pasture and produce concentrations are on dry and fresh weight bases respectively.
Fm and Ff relate the stable element intake rate to the concentration in milk and meat, respectively. The values for the factors in this table are maintained in the PREPAR file ACCRAD (S j84) . A.2.3 Dairy and Beef Cattle
Dairy and beef cattle distributions are part of the AIRDOS-EPA input. A constant cattle density is assumed except for the area closest to the source or stack in the case of a point source, i.e., no cattle within 500 m of the source. These densities were derived from data developed by NRC (NRC75). Milk production density in units of liters/day-square mile was converted to number of dairy cattle/square kilometer by assuming a milk production rate of 11.0 liters/day per dairy cow. Meat production density in units of kilograms/day-square mile was changed to an equivalent number of beef cattle/square kilometer by assuming a slaughter rate of .00381 day-1 and 200 kilograms of beef/animal slaughtered. A 180-day grazing period was assumed for dairy and beef cattle.
A.2.4 Vegetable Crop Area
A certain fraction of the land within 80 km of the source is used for vegetable crop production and is assumed to be uniformly distributed throughout the entire assessment area with the exception of the first 500 meters from the source. Information on the vegetable production density in terms of kilograms (fresh weight)/day-square mile was obtained from NRC data (NRC75). The vegetable crop fractions by state were obtained from the production densities by assuming a production rate of 2 kilograms (fresh weight)/year-square meter (NRC77).
A.2.5 Population
The population data for each generic site were generated by a computer program, SECPOP (At74). which utilizes an edited and compressed version of the 1980 United States Census Bureau's MARF data containing housing and population counts for each census enumeration district (CED) and the geographic coordinates of the population centroid for the district. In the Standard Metropolitan Statistical Areas (SMSA), the CED is usually a "block group" which consists of a physical city block. Outside the SMSAs, the CED is an "enumeration district," which may cover several square miles or more in a rural area.
There are over 250,000 CEDs in the United States with a typical population of about 800 persons. The position of the population centroid for each CED was marked on the district maps by the individual census official responsible for each district and is
based only on personal judgrnerlt from inspection of the population distribution 011 a map. The CED entries are sorted i.s ascending order by longitude on the final. data tape.
The resolution of a calculated population distribution cannot be better than the distribution of the CEDs. Hence, in a metropolitan area the resolution is often as small as one block, but in rural areas it may be on the order of a mile or more.
A.2.6 Risk Conversion Factors
Table A-5 summarizes the average lifetime risk per unit intake or exposure for most of the radionuclides considered in the assessments. Note that the external exposure factors do not include the contribution from any decay products. For example, the external risk factors for cesium-137 have values of 0. since there is no photon released in its decay. Hence, the exposure due to the cesium-137 decay product barium-137m must be considered in assessing cesium-137. The clearance class and gut-to-blood transfer factor, f,, values are shown in Table A-3.
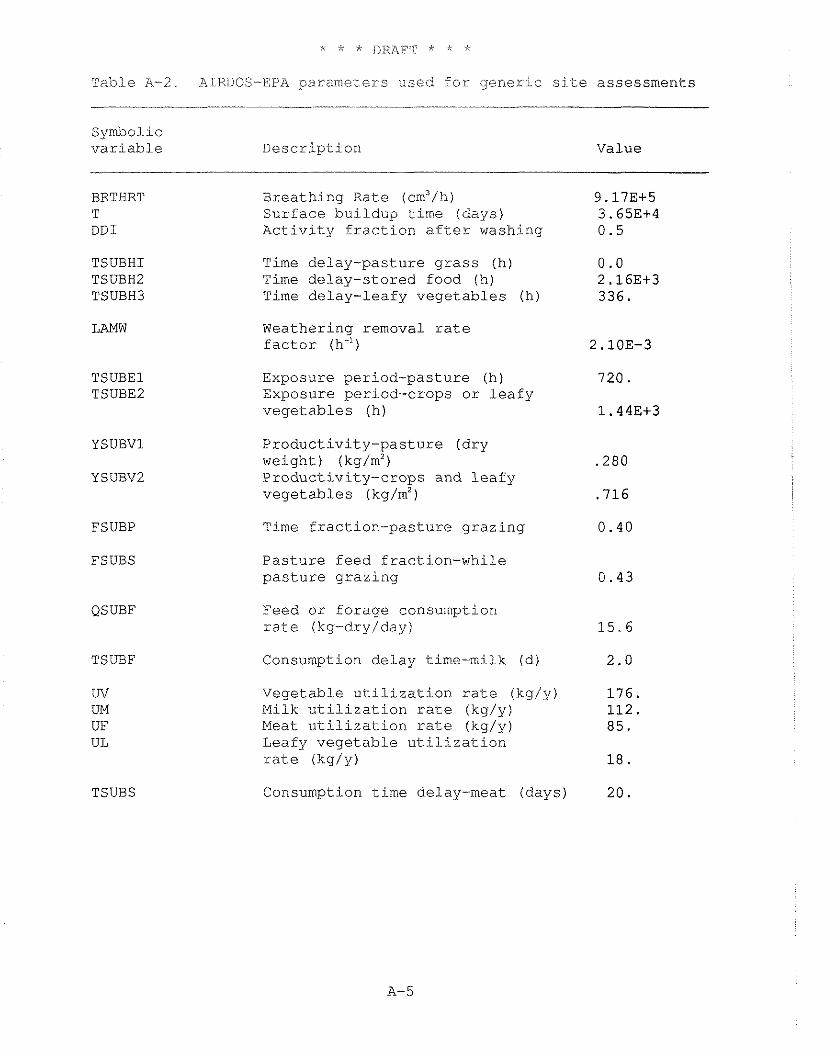
Tab1.e A-2. A:illDOS-E:PA parameters used for gener:lc site assessments
Symbo1.i~ variable Description Value
BRTHRT T DDI
Breathing Rate (cm3/h) Surface buildup time (days) Activity fraction after washing
TSUBHI TSUBHZ TSUBH3
Time delay-pasture grass (h) Time delay-stored food ( h ) Time delay-leafy vegetables (h)
Weathering removal rate factor (h")
Exposure period-pasture (h) Exposure period-crops or leafy vegetables (h)
Productivity-pasture (dry weight) (kg/m2) Productivity-crops and leafy vegetables (kg/m2)
FSUBP
FSUBS
Time fraction-pasture grazing
Pasture feed f raction-while pasture grazing
QSUBF Feed or forage consumption rate (kg-dry/day)
TSUBF Consumption delay time-milk (d)
Vegetable utilization rate (kg/y) Milk utilization rate (kg/y) Meat utilization rate (kg/y) Leafy vegetable utilization rate ikg/y)
Consumption time delay-meat (days) TSUBS
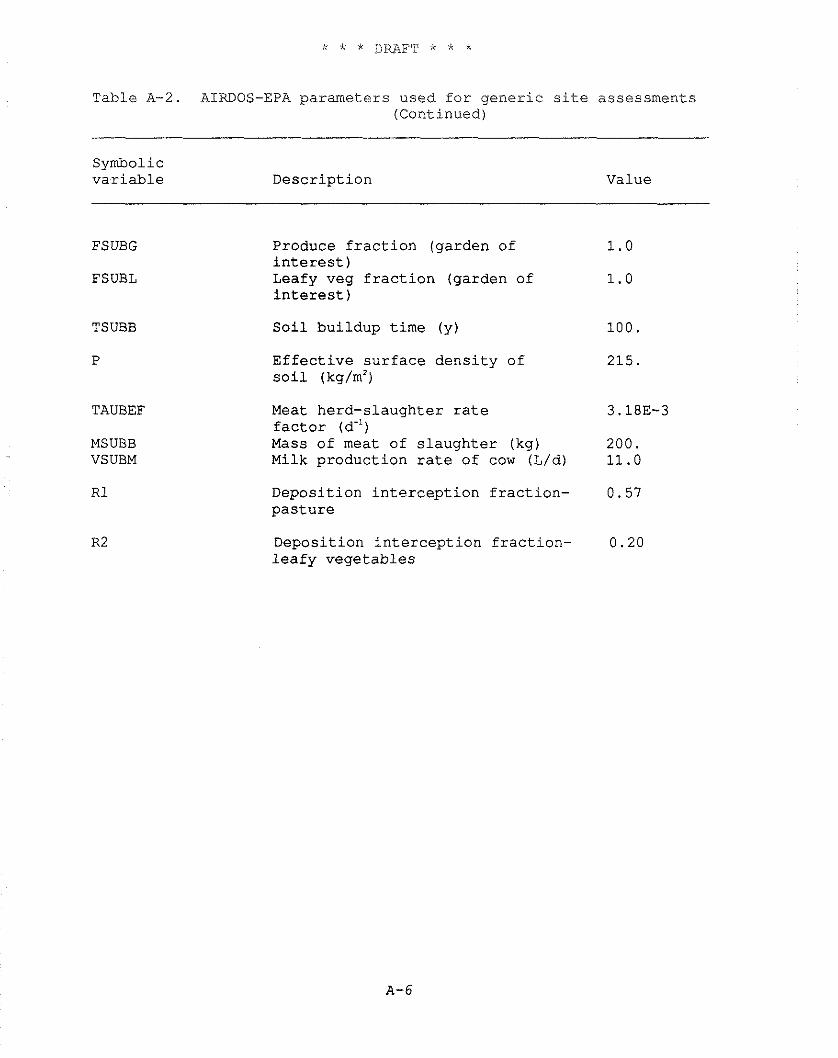
Table A-2. AIRDOS-EPA parameters used f o r g e n e r i c s i t e assessments (Continued)
Symbolic v a r i a b l e Desc r ip t ion Value
FSUBG
FSUBL
TSUBB
P
TAUBEF
MSUBB VSUBM
Produce f r a c t i o n (garden of i n t e r e s t ) Leafy veg f r a c t i o n (garden of i n t e r e s t )
S o i l bu i ldup t ime (y )
E f f e c t i v e s u r f a c e d e n s i t y o f s o i l (kg/m2)
Meat herd-s laughter r a t e f a c t o r (d") Mass o f meat of s l a u g h t e r (kg) Milk p roduc t ion r a t e of cow (L/d)
Depos i t ion i n t e r c e p t i o n f r a c t i o n - p a s t u r e
Depos i t ion i n t e r c e p t i o n f r a c t i o n - l e a f y v e g e t a b l e s
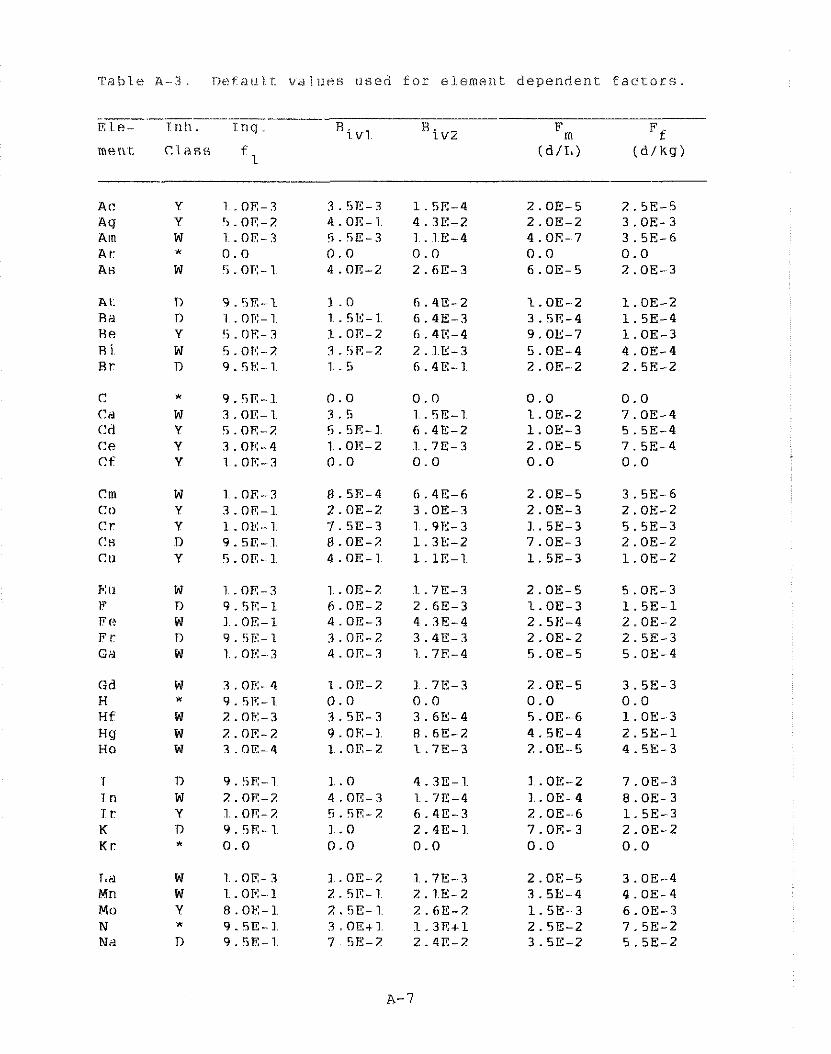
Table? A - - 3 . nt!faii I t v a l l i i ? s i i eed f o r elemerit dependen t f a c t o r s
m e r \ t C l a s s f l
W 1 . OE- 3 Y 3 . 0 E - 1 Y I . ok:-1 n 9 . 5 ~ - 1 Y 5 . OR- I
0.0 0.0 1.OE-2 7.OE-4 1.OE-3 5.5E-4 2. OE- 5 7.5E-4 0.0 0.0
1.. OE-2 7.OE-3 I.. OE-4 8.OE-3 2.OE--6 1.5E-3 7. OE- 3 2.OE-2 0.0 0.0
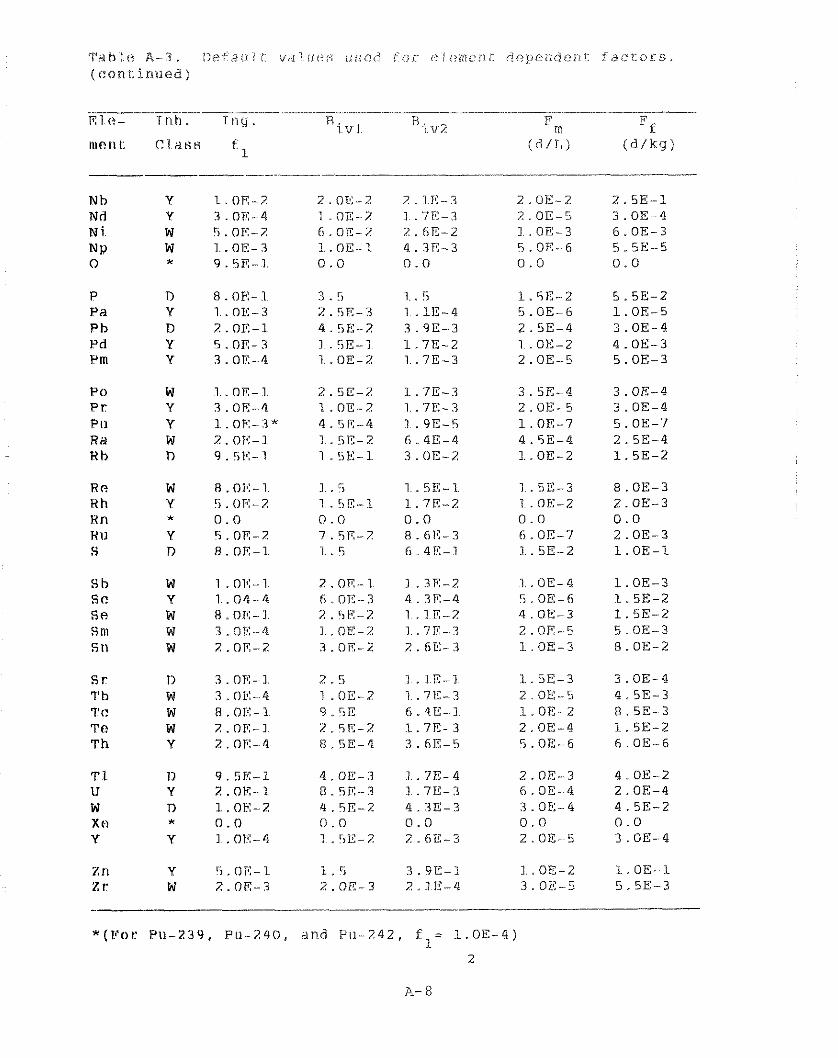
a t . A - i ,~ : t ,~ i i i i v~iiric!:; iisiiii fox. e ? i < i n t e i i L dependen?. f a c t o r s . ( ( ? a n i : i r r t ~ e d )
Nb Y I.. OE-7 Nd Y 3 . O K 4 N i. W 5. OF-? NP W I..OE-Z 0 I 9.5E-1.
P 0 W 1 .OR-1 P r Y ?.OR-4 PI1 Y I . OR-?* RH W 7 . OE-I K h n 9 . 5 ~ - 1
R (? W R .OF:-1 Hh Y !i . ()I?-2 Hn X 0.0 HI1 Y 5 . or-2 S r) 8 . OR-I.
S h W 1 .O1!-1 S C Y 1 .O4-4 Sf? W R .OR-] s n~ w ?.RE-4 S t l W ?.OR-2
s r n 3. OTC- I 1" h W 3 . OK-4 7'C W 8 .OX-] Tf? W 2. OE-I T h Y 2.0ii:- 4
3.5 1. . 5 l.5E-Z 2.5K-3 1 .1E-4 5.OE-6 4.5E-2 3.90-3 2.5E-4 I .5E-I 1.7E-2 1.. OE- 2 1.. OE-Z 1 .7E-3 2.OE-5
Z. SE-Z 1.7E-3 3.5E-4 1.0E-2 1.7E-3 2. OE- 5 4.5R-4 1 .9E-5 1.. OE-7 I .5E-2 6.4E-4 4.5E-4 1 .5E-1. 3.OE-2 I.. OE-2
Z.OR--l 1.3E-2 1. . OE- 4 6.0E-3 4.3R-4 5. OE-6 2. SE-Z 1 . I E-2 4.OE-3 1 . OK-2 1 .7E- 3 2.OE-5 3.0E-2 2.6E-3 I.OE--3
2.5 1 . IR-I. 1.5E-3 1 . OE-Z 1 .7E-3 2.OE-5 9. !iE 6.41:- I L.0E-Z 2 . 5A-Z I.. 71?- 3 2.0E-4 R . 5E-4 3.6E-5 S.OE--6
1 . 5 3.9E-1 I.. OE-2 2.OE-3 2.10-4 3.OE-5
3. OE- 4 4.5E-3 8.5E-3 1.5E-2 6. OE--6
1. OE-I 5.5E-3
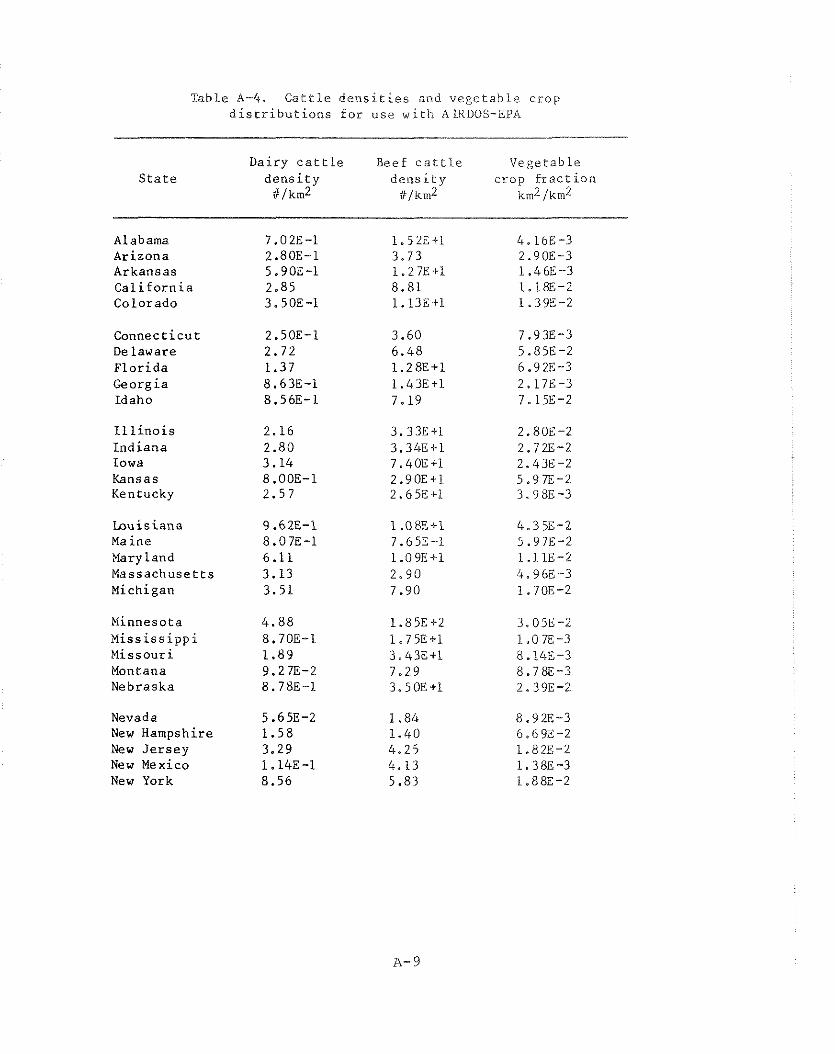
Table A-4. C a t t l e d e n s i t i e s and v e g e t a b l e crop d i s t r i b u t i o n s f o r use w i t h AIKDOS-EPA
Dairy c a t t l e S t a t e d e n s i t y
iil km2
Alabama 7.02E-1 Arizona 2.80E-1 Arkansas 5.90E-1 C a l i f o r n i a 2.85 Colorado 3.50E-1
Connec t i cu t 2.50E-1 Delaware 2.72 F l o r i d a 1.37 Georgia 8.63E-1 Idaho 8.56E-1
I l l i n o i s 2.16 I n d i a n a 2.80 Iowa 3.14 Kansas 8.00E-1 Kentucky 2.57
Lou is iana 9.62E-1 Maine 8.07E-1 Mary l a n d 6.11 Massachuse t t s 3.13 Michigan 3.51
Minnesota 4 .88 H i s s i s s i p p i 8.70E-1 Missour i 1.89 Montana 9.27E-2 Nebraska 8.78E-1
Nevada 5.65E-2 New Hampshire 1 .58 New J e r s e y 3.29 New Mexico 1.14E-1 New York 8.56
Beef c a t t l e Vege tab le d e n s i t y c rop f r a c t i o n
iilkm2 kin2 /km2
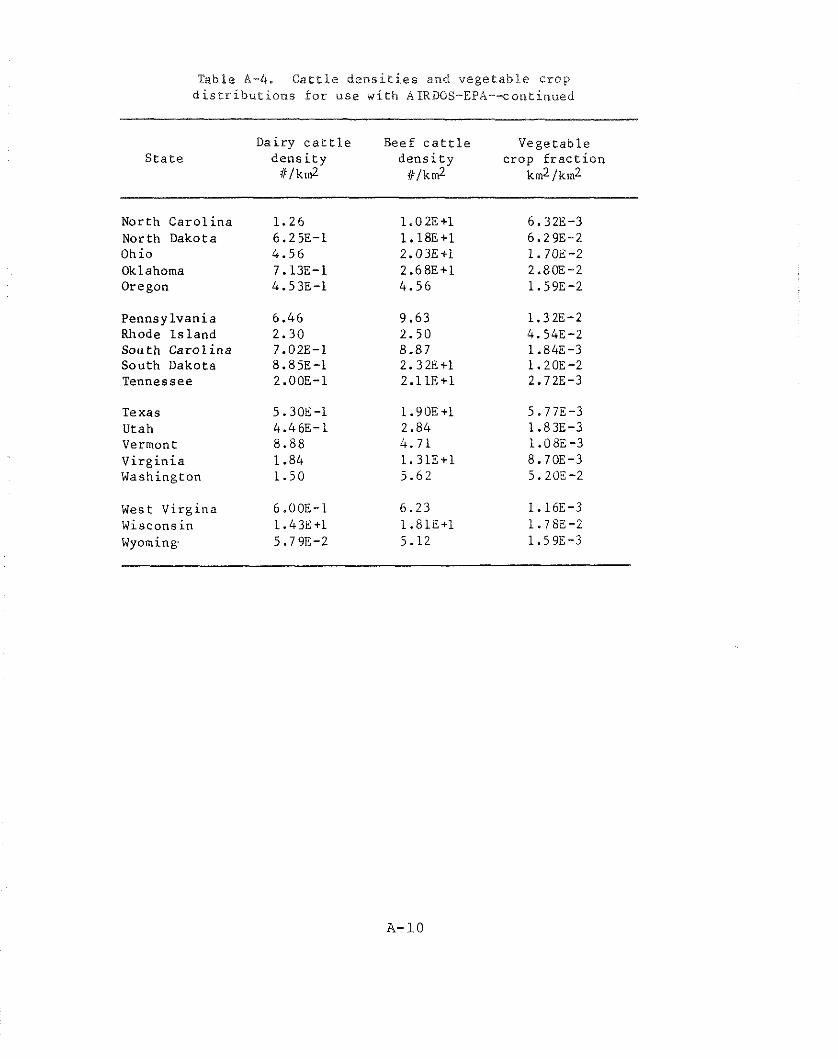
Table A-4. C a t t l e d e n s i t i e s and v e g e t a b l e c r o p d i s t r i b u t i o n s f o r u s e w i t h ALRDOS-EPA--continued
Dairy c a t t l e Beef c a t t l e Vege tab le S t a t e d e n s i t y d e n s i t y crop f r a c t i o n
i//km2 # l k d km2jkm2
North C a r o l i n a 1 .26 1.02E+1 6.32E-3 North Dakota 6.25E-1 1.18E+1 6.29E-2 Ohio 4.56 2.03E+1 1.70E -2 Oklahoma 7.13E-1 2.68E+l 2.8OE-2 Oregon 4.53E-1 4 .56 1.59E-2
Pennsy lvan ia 6.46 9.63 1.32E-2 Rhode I s l a n d 2.30 2 .50 4.54E-2 S o u t h C a r o l i n a 7.02E-1 8.87 1.84E-3 South Dakota 8.85E-1 2.32E+1 1.2OE-2 Tennessee 2.OOE-1 2.11E+1 2.72E-3
Texas 5.30E-1 1.90E+1 5.77E-3 Utah 4.46E-1 2.84 1.83E-3 Vermont 8.88 4.71 l.08E-3 V i r g i n i a 1.84 1.31E+1 8.7OE-3 Washington 1 .50 5.62 5.2OE-2
West Vi rg ina 6.00E-1 6.23 1.16E-3 Wisconsin 1.43E+1 1.81E+1 1.7BE-2 Wyoming. 5.79E-2 5.12 1.59E-3
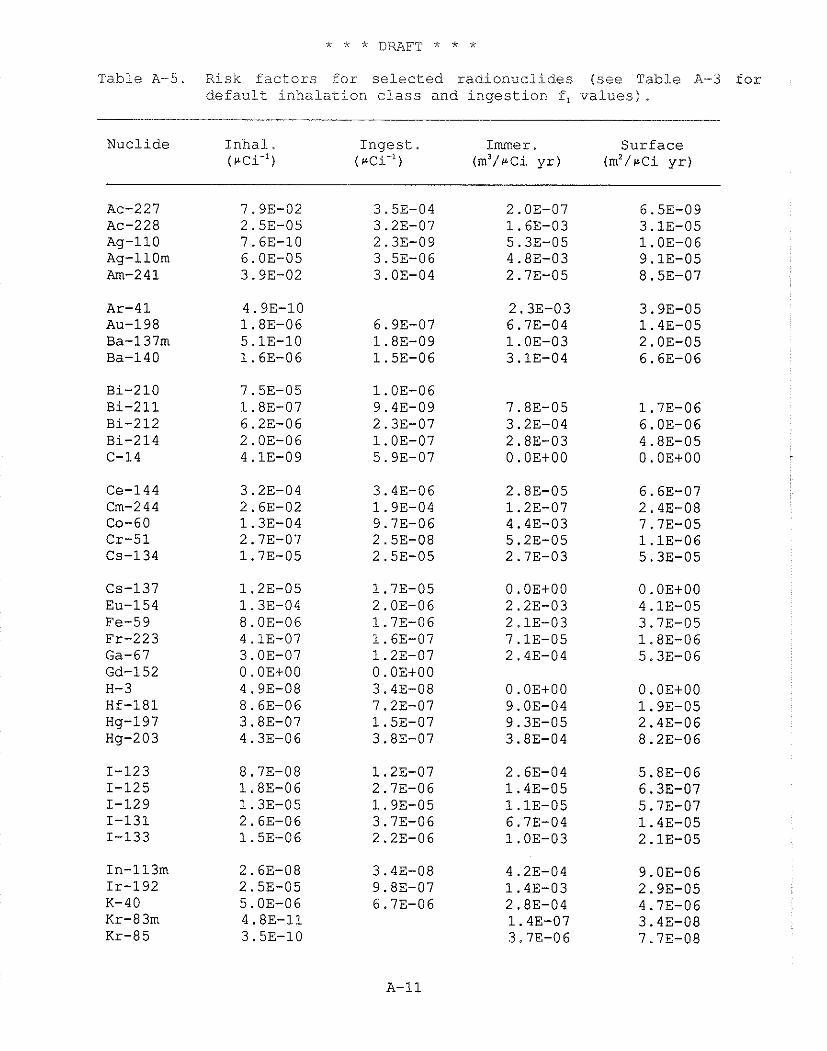
* * * DRAFT * * *
Table A-5. Risk f a c t o r s f o r s e l e c t e d r a d i o n u c l i d e s (see Table A-3 for d e f a u l t i n h a l a t i o n c l a s s and i n g e s t i o n f , v a l u e s ) .
Nuclide I n h a l . I n g e s t . Immer . Sur face ( P C ~ . ' ) (rCi-') (m3/rci y r ) (mz/rCi y r )
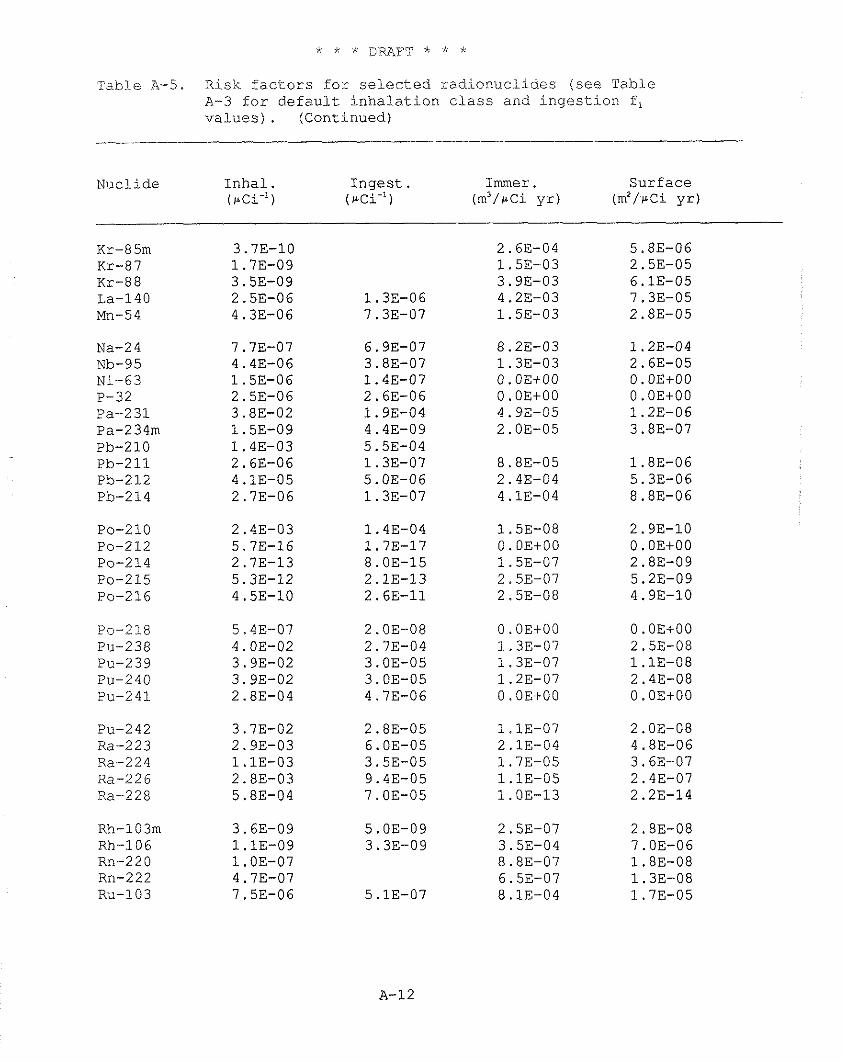
Risk f a c t o r s f o r s e l e c t e d r a d i o n u c l i d e s (see Table A-3 f o r d e f a u l t i n h a l a t i o n c l a s s and i n g e s t i o n f , v a l u e s ) . (Continued)
Table A-5.
Nucl ide I n h a l . I n g e s t . Immer . Surface (rCi-') ( r ~ i - ' ) ( m 3 / @ C i y r ) (m2/rci y r )
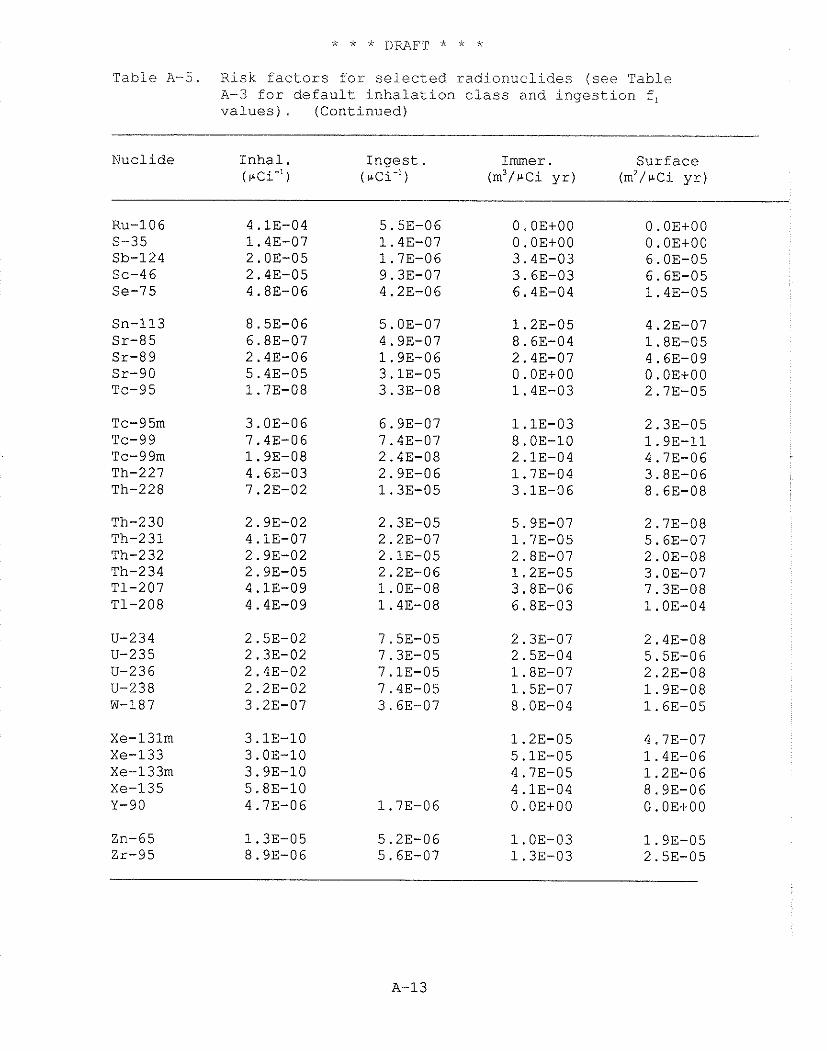
Table A-5. Risk factors for selected radionuclides (see Table A-3 for default inhalation class and ingestion f, values) . (Continued)
Nuclide Inhal. Ingest. Immer . Surface (pCim') (~ci-') (m3/pci yr) (rn2/u-~i yr)
O.OE+OO 0. OEtOO 3.43-03 3.63-03 6.43-04
O.OE+OO 0. OEtOO 6.03-05 6.63-05 1.4E-05
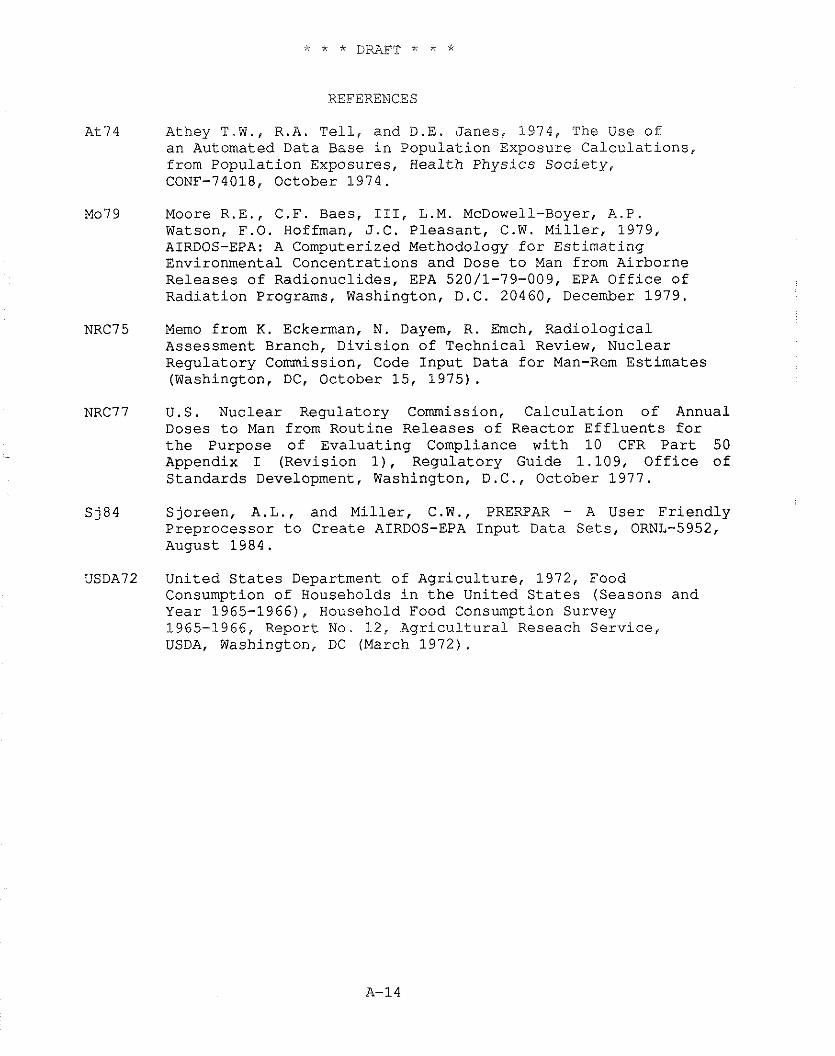
REFERENCES
At74 Athey T.W., R.A. Tell, and D.E. Janes, 1974, The Use of an Automated Data Base in Population Exposure Calculations, from Population Exposures, Health Physics Society, CONF-74018, October 1974.
Mo79 Moore R.E., C.F. Baes, 111, L.M. McDowell-Boyer, A.P. Watson, F.O. Hoffman, J.C. Pleasant, C.W. Miller, 1979, AIRDOS-EPA: A Computerized Methodology for Estimating Environmental Concentrations and Dose to Man from Airborne Releases of Radionuclides, EPA 520/1-79-009, EPA Office of Radiation Programs, Washington, D.C. 20460, December 1979.
NRC7 5 Memo from K. Eckerman, N. Dayem, R. Emch, Radiological Assessment Branch, Division of Technical Review, Nuclear Regulatory Commission, Code Input Data for Man-Rem Estimates (Washington, DC, October 15, 1975).
NRC77 U.S. Nuclear Regulatory Commission, Calculation of Annual Doses to Man from Routine Releases of Reactor Effluents for the Purpose of Evaluating Compliance with 10 CFR Part 50 Appendix I (Revision I), Regulatory Guide 1.109, Office of Standards Development, Washington, D.C., October 1977.
S j84 Sjoreen, A.L., and Miller, C.W., PRERPAR - A User Friendly Preprocessor to Create AIRDOS-EPA Input Data Sets, ORNL-5952, August 1984.
USDA72 United States Department of Agriculture, 1972, Food Consumption of Households in the United States (Seasons and Year 1965-1966), Household Food Consumption Survey 1965-1966, Report No. 12, Agricultural Reseach Service, USDA, Washington, DC (March 1972).
APPENDIX B
MECHANICS OF THE LIFE TABLE IMPLEMENTATION OF THE RISK ESTIMATES

B.1 INTRODUCTION
This appendix describes the mechanics of the life table implementation of the risk estimates derived in Chapter 6.
B.2 LIFE TABLE ANALYSIS TO ESTIMATE THE RISK OF EXCESS CANCER
Radiation effects can be classified as stochastic or nonstochastic (NAS80, ICRP77). For stochastic effects, the probability of occurrence of the effect, as opposed to the severity, is a function of dose; induction of cancer, for example, is considered a stochastic effect. Nonstochastic effects are those health effects for which the severity of the effect is a function of dose; examples of nonstochastic effects include cell killing, suppression of cell division, cataracts, and nonmalignant skin damage. At the low levels of radiation exposure attributed to radionuclides in the environment, the principal health detriment is the induction of cancers (solid tumors and leukemia) and the expression, in later generations, of genetic effects. In order to estimate these effects, instantaneous dose rates for each organ at specified times are sent to a subroutine adaptation of CAIRD (Co78) contained in the RADRISK code. This subroutine uses annual doses derived from the transmitted dose rates to estimate the number of incremental fatalities in the cohort due to radiation induced cancer in the reference organ. The calculation of incremental fatalities is based on estimated annual incremental risks, computed from annual doses to the organ, together with radiation risk factors, such as those given in tha 1980 NAS report BEIR-3 (NASBO). Derivation of the risk factors in current use is discussed in Chapter 6.
An important feature of this methodology is the use of actuarial life tables to account for the time dependence of the radiation insult and to allow for competing risks of death in the estimation of risk due to radiation exposure. A life table consists of data describing age-specific mortality rates from all causes of death for a given population. This information is derived from data obtained on actual mortality rates in a real population. Mortality data for the U.S. population during the years 1969-1971 (HEW75) are used throughout this study.
The use of life tables in studies of risk due to low-level radiation exposure is important because of the time delay inherent in radiation risk. After a radiation dose is received, there is a minimum induction period of several years (latency period) before a cancer is clinically observed. Following the latency period, the probability of occurrence of a cancer during a given year is assumed
to be constant for a specified period, called a plateau period. The length of both the latency and plateau periods depends upon the type of cancer. During or after radiation exposure, a potential cancer victim may experience years of life in which he is continually exposed to risk of death from causes other than incremental radiation exposure. Hence, some individuals will be lost from the population due to competing causes of death and are not potential victims of incremental radiation-induced cancer.
It is assumed that each member of the hypothetical cohort is exposed to a specified activity of a given radionuclide. In this analysis, each member of the cohort annually inhales or ingests 1 pCi of the nuclide, or is exposed to a constant external concentration of 1 pCi/cm3 in air or 1 pCi/cm2 on ground surfaces. Since the models used in RADRISK are linear, these results may be scaled to evaluate other exposure conditions. The cohort consists of an initial population of 100,000 persons, all of whom are simultaneously liveborn. In the scenario employed here, the radiation exposure is assumed to begin at birth and continue throughout the entire lifetime of each individual. No member of the cohort lives more than 110 years. The span from 0 to 110 years is divided into nine age intervals, and dose rates to specified organs at the midpoints of the age intervals are used as estimates of the annual dose during the age interval. For a given organ, the incremental probability of death due to radiation-induced cancer is estimated for each year using radiation risk factors and the calculated doses during that year and relevant preceding years.
The incremental probabilities of death are used in conjunction with the actuarial life tables to estimate the incremental number of radiation-induced deaths each year. The estimation of the number of premature deaths proceeds in the following manner. At the beginning of each year, m, there is a proba- bility, P, of dying during that year from nonradiological causes, as calculated from the life table data, and an estimated incremental probability PR of dying during that year due to radiation-induced cancer of the given organ. In general, for the m-th year, the calculations are:
M (m) = total number of deaths in cohort during year m,
= [PN (m) + PR (m) x N (m) Q (m)
= incremental number of deaths during year m due to radiation-induced cancer of a given organ
N ( m + l ) = number of s u r v i v o r s a t t h e beginning of y e a r m i l
= N ( r n ) - M (m) (N( l )=100,000) . PR i s assumed t o be sma l l r e l a t i v e t o PN, an assumption which
i s r easonab le only f o r low-level exposures (BuEl) , such a s t h o s e cons ide red h e r e . The t o t a l number of incrementa l d e a t h s f o r t h e cohor t i s then ob ta ined by summing Q ( m ) ove r a l l o rgans f o r 1 1 0 y e a r s .
I n a d d i t i o n t o p rov id ing an e s t i m a t e of t h e incrementa l number of dea ths , t h e l i f e t a b l e methodology can be used t o e s t i m a t e t h e t o t a l number o f y e a r s of l i f e l o s t t o t h o s e dying o f r ad ia t ion - induced cancer , t h e average number of y e a r s o f l i f e l o s t p e r incrementa l m o r t a l i t y , and t h e dec rease i n t h e p o p u l a t i o n ' s l i f e expectancy. The t o t a l number of y e a r s o f l i f e l o s t t o t h o s e dying of rad ia t ion- induced cance r i s computed a s t h e d i f f e r e n c e between t h e t o t a l number of y e a r s of l i f e l i v e d by t h e cohor t assuming no inc remen ta l r a d i a t i o n r i s k , and t h e t o t a l number of y e a r s of l i f e l i v e d by t h e same cohor t assuming t h e incrementa l r i s k from r a d i a t i o n . The dec rease i n t h e p o p u l a t i o n ' s l i f e expectancy can be c a l c u l a t e d a s t h e t o t a l y e a r s of l i f e l o s t d i v i d e d by t h a o r i g i n a l cohor t s i z e (N(1)=100,000) ,
E i t h e r a b s o l u t e o r r e l a t i v e r i s k f a c t o r s can be used. Absolute r i s k f a c t o r s , g iven i n terms of d e a t h s p e r u n i t dose, a r e based on t h e assumption t h a t t h e r e i s some a b s o l u t e number of dea ths i n a popu la t ion exposed a t a g iven age p e r u n i t of dose . R e l a t i v e r i s k f a c t o r s , t h e pe rcen tage i n c r e a s e i n t h e ambient cance r dea th r a t e p e r u n i t dose, a r e based on t h e assumption t h a t t h a annual r a t e of rad ia t ion- induced excess cance r dea ths , due t o a. s p e c i f i c t y p e of cancer , i s p r o p o r t i o n a l t o t h e ambient r a t e of occur rence of f a t a l cance r s of t h a t t y p e . E i tBer t h e a b s o l u t e o r t h e r e l a t i v e r i s k f a c t o r i s assumed t o apply uniformly du r ing a p l a t e a u pe r iod , beginning a t t h e end of t h e l a t e n t p e r i o d .
The e s t i m a t e s of i nc remen ta l dea ths i n t h e cohor t from ch ron ic exposure a r e i d e n t i c a l t o t h o s e o b t a i n e d i f a cor responding s t a t i o n a r y popu la t ion ( i . e . , a popu la t ion i n which equal numbers of persons a r e born and d i e i n each y e a r ) i s s u b j e c t e d t o an a c u t e r a d i a t i o n dose of t h e same magnitude. S ince t h e t o t a l person-years l i v e d by t h e cohor t i n t h i s s tudy i s approximately 7.07 m i l l i o n , t h e e s t i m a t e s of incrementa l m o r t a l i t y i n t h e cohor t from ch ron ic i r r a d i a t i o n a l s o app ly t o a one-year dose of t h e same magnitude t o a
popillati.on of this size, age distribution, and age-specific mortality rates. More precise life table estimates for a specific popu:l.ation can be obtained by altering the structure of the cohort to reflect the age distribution of a particular population at risk.
In addition, since the stationary population is formed by superposition of all age groups in the cohort, each age group corresponds to a segment of the stationary population with the total population equal to the sum of all the age groups. Therefore, the number of excess fatal cancers calculated for lifetime exposure of the cohort at a constant dose rate would be numerically equal to that calculated for the stationary population exposed to an annual dose of the same magnitude. Thus, the risk estimates may be reported as a lifetime risk (the cohort interpretation) or as the risk ensuing from an annual exposure to the stationary population. This equivalence is particularly useful in analyzing acute population exposures. For example, estimates for a stationary population exposed to annual doses that vary from year to year may be obtained by summing the results of a series of cohort calculations at various annual dose rates.
REFERENCES
Bunger, B.M., Cook, J.R., and Barrick, M.K.,"Life Table Methodoloav for Evaluatina Radiation Risk: An - >
Application Based on Occupational Exposures," Health 40, 439-455.
Cook, J.R., Bunger, B., and Barrick, M . K . , A Computer Code for Cohort Analysis of Increased Risks of Death (CAIRD), EPA 520/4-78-012, 1978.
U.S. Department of Health Education and Welfare, "U.S. Decennial Life Tables for 1969-1971," Vol. l., No. I., DHEW Publication No. (HRA) 75-1150, Public Health & Service, Health Resources Administration, National Center for Health Statistics, Rockville, Maryland, 1975.
ICRP77 International Commission on Radiological Protection, "Recommendations of the International Commission on Radiological Protection," Ann. ICRP, Vol. 1, No. 1, Pergamon Press, 1977.
National Academv of Sciences - National Research Council, - The Effects on Population of Exposure to Low Levels of Ionizing Radiation, Committee on the Biological Effects of Ionizing Radiation, Washington, D.C., 1980.

APPENDIX C
9VERVIEW C? '?k'cl!Xl(~L'Es USED TO QUANTIFY UNCEKTAINTY IN EKVIR3NMENTAL RISK ASSESSI<EN'I'S
C.l INTRODUCTION
The doses and risks attributable to airborne emissions from the various facilities and categories of facilities addressed in Volume I1 have been estimated using the models and assumptions described in this volume. The calculational methods use monitored data characterizing airborne emissions and then apply mathematical models to estimate the radionuclide concentrations and radiation fields in the environment. These calculated values are then used to derive radiation doses to individuals exposed to these radionuclides. The final products of this exercise are the doses to individuals and populations, expressed in units of mrem/yr and person-rem/yr, respectively. In addition, cancer risks, expressed in terms of the additional lifetime risk to individuals and the number of additional cancer fatalities in the exposed populations, are also estimated.
Rather than using mathematical models to assess impacts, it would be preferable to measure the actual impacts directly; i.e., radionuclide concentrations and radiation fields in the environment, radionuclide concentrations in the various organs of the exposed populations, and the increased incidence of cancer, if any, due to the exposures. However, this is not possible because the radionuclide releases do not generally result in detectable levels in the environment or in the exposed members of the population. Accordingly, the actual or potential impacts of the emissions must be predicted using calculational models.
The dose and risk estimates provided in this BID for each facility or release category should be considered a reasonable assessment which does not significantly underestimate or grossly overestimate impacts and is of sufficient accuracy to support decisionmaking. Since each facility is unique, the models used to calculate doses and risks are generalizations and simplifications of the processes which result in exposure and risk. In addition, our ability to model the processes is also limited to a degree by the availability of data characterizing each site and our understanding of the processes.
In Volume 11, doses and risks for each category are presented as discrete values; i.e., mrem/yr; person-rem/yr; individual probability of a fatal cancer, and number of cancer fatalities per year in a population. Each of these calculated values is an expression of impact on an individual or small group of individuals or on a population as a whole. The values presented, however, are
of more use to decision-makers when there is some characterization of their uricerta-inty. For exampl-e, a srnall impact may be calculated; i.e., 1.OE-6 Lifetime risk of cancer for an individual.. However, if the uncertainty in this number is several orders of magnitude, the real risk of this source of emission may in fact be higher than another source of emission which has a calculated risk of 1.OE-5 lifetime risk of cancer but has a small degree of uncertainty. Alternatively, an upper bound risk of 1.OE-2 lifetime risk may be calculated and appear to represent an unacceptable risk. However, the actual risk may be an order of magnitude smaller. This situation often occurs when, due to limited information and uncertainty in the calculational parameters, conservative assumptions are used throughout the calculation in order to ensure that the risks are not underestimated.
The Office of Radiation Programs has initiated a quantitative uncertainty analysis to supplement the semiquantitative analysis provided in Volume I of the BID. This appendix summarizes the quantitative uncertainty analysis techniques currently under review by the Office.
C.2 QUANTITATIVE UNCERTAINTY ANALYSIS
The use of quantitative uncertainty analysis to address environmental risks became widespread following the Reactor Safety Study (NRC751, and was recommended by the Agency in support of environmental risk assessments in 1984 (EPA84). The technique results in a range of values of impact rather than a discrete value by using a range of values for the calculational input parameters. In this way,, the impacts of a given technological activity can be bounded and different technologies can be intercompared. In cases where probability distributions can be assigned to the value of a given set of calculational parameters, the results are expressed as probability distributions. Risks can thereby be expressed as "best estimate" values, 90 percentile values or 99 percentile values, etc. Figure C-l presents an example of the output of such an analysis. The results are expressed as a cumulative probability distribution. Inspection of the distribution reveals that, in this case, there is about a 90 percent level of confidence that the technological activity will result in less than 1 mortality per 10,000 years, and that the best estimate (i.e., the 50 percentile value) is less than 0.1 fatality per 10,000 years.
Though the concept is simple, the implementation and interpretation of uncertainty analyses performed in support of environmental risk assessment has evolved into an area of specialization founded in work performed at Carnegie Mellon University (Mo78). The use of quantitative uncertainty analyses in support of environmental radiological risk assessment has been steadily increasing since its use in the Reactor Safety Study (NRC75). Selected uncertainty analyses, which are especially
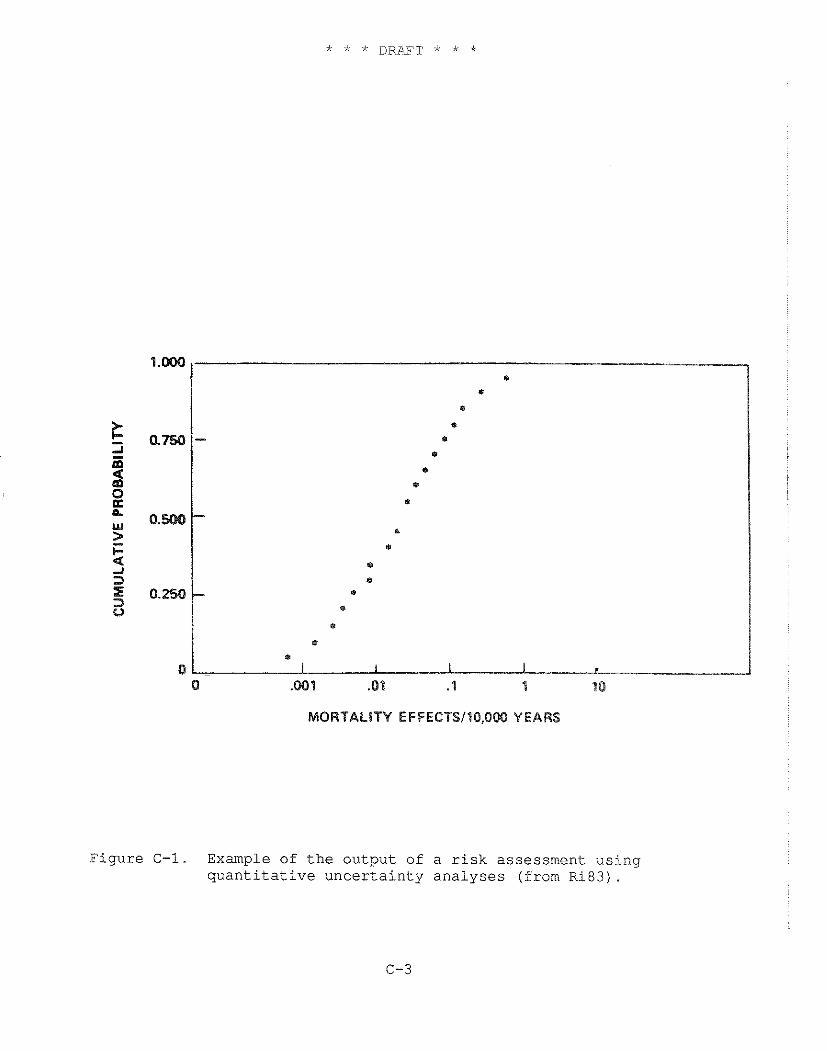
* . 8
8
I
I
1
a
. *
0
I
0 ,081 .01 .1 1 10
MORTALITY EFFECTS110.000 YEARS
F i g u r e C-1. Example of t h e o u t p u t of a r i s k a s s e s s m e n t u s i n g q u a n t i t a t i v e u n c e r t a i n t y a n a l y s e s (from R i 8 3 ) .
relevant to this Background Information Document, include work performed by Hoffman (NUKEG79, NUREG81), Rish (Ri03), and Crick (Cr88).
These applications of uncertainty analysis are currently undergoing review to identify the approach most appropriately applied to the analyses presented in Volume I1 of this B I D . Each application uses a somewhat different calculational approach and set of input data. The appropriateness of the approaches depends on types of risks being calculated and on the level of analysis required to support rulemaking. The following describes the different approaches being considered and the data requirements.
C.3 LEVEL OF ANALYSIS
The results of any risk assessment are uncertain due to the following three sources of uncertainty (Cr88):
(1) Modeling uncertainties (2) Completeness uncertainties (3) Parameter uncertainties
Modeling uncertainties pertain to the formulation of mathematical models used to predict risk and the degree to which they accurately represent reality. One way to address this source of uncertainty is to perform the analysis using a set of feasible alternative model structures.
In general, modeling uncertainty is the most difficult component to assess since it is often impossible to justify a set of plausible alternative models in light of the available data and to assign probabilities to these alternatives. To an extent, modeling uncertainty is incorporated into the estimates of uncertainty, e.g., the uncertainty in risk factors for low-LET radiation includes a consideration of the uncertainty in the form of the dose-response and risk projection models. On the other hand, as noted in Chapter 5, the uncertainty in formulation of metabolic models is a serious problem in estimating dose conversion factors for many radionuclides. Modeling uncertainty for dispersion and pathway calculations pose similar problems. As a result, the Agency's estimates of uncertainty in radiological risk do not fully reflect the contribution of modeling uncertainty.
Completeness uncertainties are applicable to this BID, as they are to all risk assessments. The issue has to do with whether all significant radionuclides and pathways of exposure have been addressed. For most facilities addressed in this BID, the source terms are well characterized and there is little likelihood that a significant undetected radionuclide release is occurring. With regard to pathways of exposure, the analyses assume that all the major pathways of exposure are present at all sites, and it is more
likely that a pathway has been assumed to be present which in fact is not. Accordingly, except for some specific categories of emissions, such as C-14 and H-3 emissions from research hospitals, this source of uncertainty is not expected to be an important contributor to overall uncertainty.
Uncertainties in the values of the calculational input
y in input parameters, such as dose and risk ion of both parameter and modeling of a quantitative uncertainty analysis, ined and will be treated in subsequent
t parameter uncertainty.
UE TO PARAMETER UNCERTAINTY
ranges or a set of discrete are characterized, their e models using a simulation ibution representing ode1 results. To describe
est calculated the vicinity of
o, Florida. The wer is what is the
(2) the atmospheric dispersion factor, which is used to calculate the average annual airborne radon concentration at the receptor location,
(3) the radon daughter conversion factor, which converts the calculated airborne radon concentration to radon daughter concentration in working levels (WL), which is the parameter that is directly related to risk,
(4) exposure duration in hours per year, and
(5) the risk conversion factor, which converts risk expressed in WL to probability of cancer.
The product of each of these parameters, along with appropriate unit conversions, results in an estimate of lifetime cancer risk due to exposure. Each of the five parameters has some degree of uncertainty, which contributes to the uncertainty in the calculated risk.
The source term (Ci/yr) is itself an estimated value which varies as a function of time. However, since this is a lifetime risk, it is necessary to estimate the uncertainty in the average annual release rate over many years. This distinction is important because it virtually eliminates the need to explicitly consider uncertainties associated with the time-varying nature of the source term. If the concern was with the maximum risk to an individual in any one year, the time-varying nature of the source term would need to be expiicitly addressed.
Ideally, based on extensive measurements made over the area of the stack over prolonged periods of time, the source term could be accurately defined. However, the source term has been approximated using a limited number of samples and a conservative set of assumptions which provides assurance that the real source term has not been underestimated. In a quantitative uncertainty analysis, a source term probability distribution would be constructed based on a close inspection of the measurements and assumptions used in the analysis.
The second calculational parameter is the atmospheric dispersion factor, which is used to derive the average annual radon concentration at the receptor location. The dispersion factor is expressed in units of sec/m3, so that when it is multiplied by the release rate in Ci/yr, along with the appropriate unit conversion, the result is the average annual radon concentration at the receptor location. Uncertainty in the actual location of the nearest resident is an important source of uncertainty.
A second important, and less obvious source of uncertainty, is the method used to estimate dispersion. The accuracy of this method is provided in Chapter 4. As applied to this particular problem, the uncertainties increase due to the non-uniformity of the area source term. This could either increase or decrease the risk estimate, depending on the location of the receptor relative to areas of the pile that are the major contributors to the source term. Note that the magnitude of this source of uncertainty is much smaller when performing population doses since, as the distance from the receptor to the pile increases, the source term behaves more and more as a point source relative to the receptor.
Considering all of these factors, an uncertainty distribution is developed for the atmospheric dispersion factor. Note that the distribution of the atmospheric dispersion factors for the maximum individual and the population risk assessments will differ.
The third parameter converts radon concentration to radon daughter concentration, which is the parameter of interest. The uncertainty in this value is well characterized, and constructing a reasonable probability distribution for this parameter will be a relatively straight forward exercise.
The fourth parameter, occupancy time, is the fraction of the time the individual is located at the receptor location. For purposes of this BID, the individual at maximum risk is presumed to be a lifetime resident at the presently occupied location that results in the greatest lifetime risk. HenEe the value of this factor is the average fraction of each day that a resident is expected to be within his or her home. The presumption of lifetime residence does not have any uncertainty; it is a given condition for the assessment.
The last parameter, the risk factor, relates exposure to risk. As discussed in Chapter 6, values for this parameter are based on epidemiological data and only apply to large populations. It is assumed that the maximum individual has the average radiosensitivity, and a risk factor probability distribution is developed based on uncertainty in the average risk factor.
It is apparent from this discussion that in order to perform an uncertainty analysis, it is necessary to clearly define the risk that is being estimated. Is the risk for a real or hypothetical person, is it the maximum or the average risk, and is it the current or possible future risk that is of concern? The individuals constructing the distributions must clearly understand the objectives of the analysis or the resulting distributions will be incompatible.
Upon completion of this exercise, each of the calculational parameters will have been assigned probability distributions. These
distributions are used as input to models that propagat.e the uncertainties.
C.5 TECHNIQUES FOR PROPAGATING UNCERTAINTIES
The basic approaches used to propagate uncertainties are method of moments techniques, or Monte Carlo techniques. Method of moments is the standard method for propagating error described in fundamental texts on statistics. This method propagates errors by calculating a linear combination of the moments for each model factor. Since these coefficients depend on the values of the parameters, the method is only useful when the range of each parameter is small enough that it will not significantly perturb the coefficients. Even if these conditions are not met, it is possible to establish reasonable estimates of uncertainty using this technique.
The alternative to the method of moments is the use of a Monte Carlo, or Monte Carlo type, analysis. This approach can consume considerable computer resources but has the potential to yield more satisfying results. The technique calculates risk in the same manner as described above, except it performs the calculation many times, each time randomly selecting an input value from each of the probability distributions representing each parameter. The output is a risk distribution. The more times the calculation is performed, the more complete the results. The number of repetitions will determine the precision of the output. The more repetitions and the larger the number of calculational parameters treated as distributions in the model, the greater the computer resource requirements.
By controlling how the values are sampled from each distribution, parameters that are directly or indirectly correlated can also be modeled. In addition, by selectively fixing the value of individual parameters, the parameters that are important contributors to uncertainty can be identified.
A number of computerized techniques are available to perform quantitative uncertainty analysis. Descriptions of these methods, provided by Crick (Cr88) and Hofer (Ho85), are being reviewed in order to determine which methods are most appropriate for quantifying the uncertainty in the risk estimates provided in the BID. In addition, a comprehensive guide on uncertainty analysis is scheduled for publication in the spring of 1989 (Mo89). The publication will be the first comprehensive treatment of this subject.
C.6 PARAMETER DISTRIBUTIONS
The final and by far the most important issue pertinent to the implementation of a quantitative uncertainty analysis is the
completeness and reliability of the data characterizing the distributions of each of the calculational parameters. The number of radionuclides, pathways and parameters used in the risk assessments (see the AIRDOS input sheets in the Appendix to Volume 11) is very large. However, through a screening process, the number of radionuclides and pathways that require explicit analysis can be sharply reduced.
Once the parameters of interest are identified, it is necessary to evaluate how each parameter is used in the risk calculations; that is, is it used to calculate risks to a population or an individual; and is it used to calculate annual or lifetime risk?
Once this is determined, probability distributions for each parameter, as it is used in the risk calculations, are constructed. A number of such distributions have been constructed in the past which will facilitate this process (NUREG79, NUREG81, Ri83). In addition, it will likely be necessary to elicit subjective probability distributions for specific parameters by interviewing researchers specializing in each parameter. In order to obtain unbiased distributions, formal elicitation techniques, as described by Hogarth (Ho75), may be required.
REFERENCES
Crick, M.J., et al., Uncertainty Analysis of the Foodchain and Atmospheric Dispersion Modules of MARC, NRPB-R184, May 1988 - U.S. Environmental Protection Agency, Proposed Guidelines for Exposure Assessment, Request for Comments, 49 FR 46304, November 23, 1984.
Hogarth, R.M., "Cognitive Processes and the Assessment of Subjective Probability Distributions", J. of the Am. Statistical Assoc., 70(350), 271, June 1975.
Hofer, E., and Krzykacz, B., CEC Study Contract: Uncertainty analysis of the computational assessment of the radiological consequences of nuclear accidents. Final Report to Part I (October 1984) and to Part I1 (July 1985).
Morgan, M. G., et al., "Sulfur control in coal-fired power plants: A probabilistic approach to policy analysis," APCA Journal, 28(10) 993, 1978.
Moraan, M.G., and Henrion, M., Uncertainty: A d .
Guide to Dealing with Uncertainty in Quantitative Risk and Policy Analysis, Cambridge University Press (scheduled for publication in the summer of 1989).
U.S. Nuclear Regulatory Commission, Reactor Safety Study: An Assessment of Accident Risks in United States Commercial Nuclear Power Plants, WASH-1400, October 1975.
NUREG79 u.S. Nuclear Regulatory Commission, A statistical analysis of selected parameters for predicting food chain transport and internal dose of radionuclides, Hoffman, F .O., and Baes, C. F., I11 (eds. ) ,
NUREG81 U.S. Nuclear Regulatory Commission, Variability in dose estimate associated with food chain transport and ingestion of selected radionuclides, by F.O. Hoffman, R.H. Gardner, and K.F. Eckerman,
Rish, W.R., Mauro, J . M . , and Schaffer, S.A., "Analyses of Uncertainties in the EPA Ore Body Release and River Mode Exposure Pathway Models Used as the Bases for Proposed Geologic Repository Release Limits", Final Report to Battelle Project Manager Division (BPMD) for the Department of Energy, June 10, 1983.


![Atlantic Station Health Consultation Final3ed...a construction worker risk assessment, the PIA was cleaned up [3]. The Phase II Investigation Report, using EPA risk assessment methodology,](https://img.pdfslide.us/doc/110x75/5fa49c51d7c4443fd54077f4/atlantic-station-health-consultation-final3ed-a-construction-worker-risk-assessment.jpg)