Embed Size (px)
Citation preview
Copy ENTIAL;:. RM L54G09
NACA
RESEARCH MEMORANDUM
A FLIGHT STUDY OF COMPRESSIBILITY EFFECTS ON THE--f
GUST LOADS OF A 350 SWEPTBACK-WING AIRPLANE
By Harry C. Miceboro and Jack Funk
Langley Aeronautical Laboratory Langley Field, Va.
Li)
CLASSIFIED DOCUMENT
This material contains information affecting the National Defense of the United States within the meaning -, of the espionage laws, Title 18, U.S.C., Secs. 79 and 794, the transmission or revelation of which in any ( manner to an unauthorized person is prohibited by law. (4
NATIONAL ADVISORY COMMITTEE", FOR AERONAUTICS
WASHINGTON August 30, 1954
c.fricENflAL
https://ntrs.nasa.gov/search.jsp?R=19930088396 2018-05-05T20:47:19+00:00Z
NACA RM L54G09a CONFIDENTIAL
NATIONAL ADVISORY COMMITTEE FOR AERONAUTICS
RESEARCH MEMORANDUM
A FLIGHT STUDY OF COMPRESSIBILITY EFFECTS ON THE
GUST LOADS OF A 350 SWEPTBACK-WING AIRPLANE
By Harry C. Mickleboro and Jack Funk
SUMMARY
A jet-propelled swept-wing airplane was flown at different speeds in rough air in order to investigate the effects of compressibility or Mach number on gust loads. Data were obtained at a constant altitude over a Mach number range from 0.4 to 0.8 corresponding to flight speeds from 300 to 645 miles per hour. The results indicate that, for the test air-plane, the measured gust loads increased more rapidly than a direct (one to one) variation with forward speed. For the test airplane flying at a Mach number of 0.85 without external tanks, the increment of load sso-dated with compressibility amounted to about 7 percent. The experimental results for the variation of loads with Mach number for the airplane with-out external tanks were in agreement with calculated results based on lift-curve slopes corrected for compressibility and the two-dimensional unsteady-lift functions for compressible flow. The addition of external tanks caused a greater increase in gust loads with Mach number than for the test airplane without tanks, and the increment of load associated with compressibility was about 16 percent at a Mach number of 0.8.
INTRODUCTION
The effects of compressibility or Mach number on gust loads have not been resolved at present. It has generally been assumed that the lift-curve slope was the parameter most susceptible to compressibility effects, and that the gust loads would vary accordingly. Reference 1 suggested that the lift-curve slope under unsteady flow conditions of gusts might, as in the steady case, follow the Glauert-Prandtl factor up to the crit-ical Mach number. It was also indicated that the effect of compressi-bility on unsteady-lift functions may be of importance to the gust-load problem, but little or no information on that subject was available at that time. Subsequent theoretical analyses (refs. 2 and 3) have indi-cated that the rate of transient lift development becomes appreciably
CONFIDENTIAL
2 CONFIDENTIAL NACA RM L54G09a
slower at high subsonic Mach numbers resulting in some possible compensa-tion for the expected increase in gust loads due to the higher lift-curve slope. Therefore, in most cases, the overall effect of compressibility may be small.
Some experimental flight-test data concerning the overall effects of compressibility on gust loads are available from a systematic series of flights with a jet-propelled fighter airplane at Mach numbers of 0.28 and 0.68 (ref. 4). Although there appear to be some inconsistencies in the test results for the various flight conditions, the gust loads were almost directly proportional to forward velocity, indicating little or no overall effects due to compressibility. This apparent lack of an overall compressibility effect on the gust loads for this airplane is not what would have been expected from the above-noted considerations of the influ-ence of compressibility on the lift-curve slope and the unsteady-lift functions, as has also been noted by Zbrozek in reference 5. The reason for this difference is not apparent at the present time.
In order to provide additional flight data in continuous rough air on the effects of compressibility on gust loads for another airplane, a cooperative flight investigation was undertaken by the NACA and the Directorate of Flight and All-Weather Testing, Wright Air Development Center, Air Research and Development Command, U. S. Air Force. The test airplane was a present-day, swept-wing, jet fighter supplied by the Air Force. Flights in the vicinity of Dayton, Ohio, were made in clear-air turbulence both with and without external tanks. The tests covered a Mach number range from O.-i- to 0.85 corresponding to speeds from 500 to 645 miles per hour. This report presents the results obtained from the flight tests and some comparisons with calculated results.
SYMBOLS
A aspect ratio
an normal acceleration, g units
aload ratio
anM
c mean aerodynamic chord, ft
g acceleration due to gravity, ft/sec2
Kg gust factor (see ref. 6)
CONFIDENTIAL
NACA BM L511.G09a CONFIDENTIAL 3
M Mach number
M0 reference Mach number (0.4)
m slope of lift curve per radian
m0 incompressible lift-curve slope per radian
S wing area, sq ft
U gust velocity, ft/sec
V forward velocity, ft/sec
W airplane weight, lb
w/s wing loading, lb/sq ft
A sweep angle of quarter chord, deg
P air density, slugs/cu ft
APPARATUS
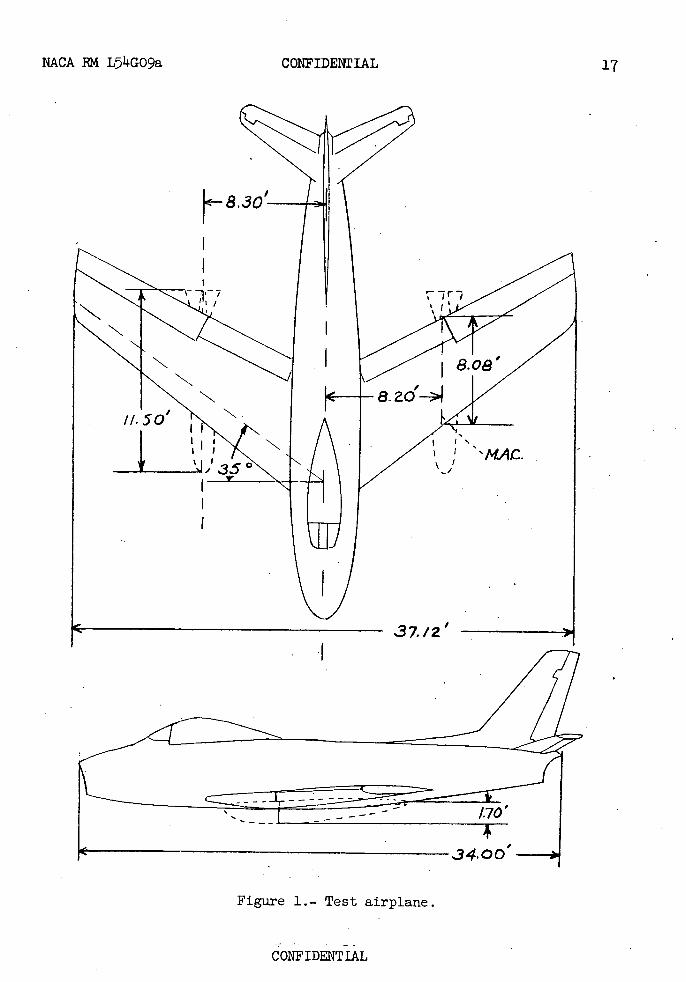
A two-view drawing of the test airplane with the external tanks indicated by dashed lines is shown in figure 1. The characteristics of the airplane as flown are given in table I. The external tanks used in the test were of a fantail type having a capacity of 120 gallons each and mounted on pylons underneath the wing at approximately 45 percent semi span.
The following instruments were installed in the airplane to obtain information pertinent to the gust loads:
(a) NACA recording accelerometer (magnetically damped)
(b) NACA airspeed-altitude recorder
(c) NACA synchronous timer (1-sec interval)
The recording accelerometer was damped to 0.7 of critical and had a natural vane frequency of about 19 cycles per second. Its range for a full-scale film deflection of 2 inches was from 39 to -1g. Because of space limitations, the accelerometer was located approximately 2 feet forward of the normal center of gravity of the airplane. The effect of this location is discussed in the "Precision!' section of the paper. The
CONFIDENTIAL
4 - CONFIDENTIAL NACA RN L54G09a
instruments were supplied with film drums having a 70-foot capacity and operating at 1/4 inch per second. The pressures for both airspeed and altitude records were obtained from the service system of the airplane.
TEST PROCEDURE
The general procedure consisted of successive flight runs through clear-air turbulence at various test speeds over a fixed course in a manner similar to reference 4. The test procedures used attempted to eliminate all test variables from the data with the exception of those associated with airspeed. All runs were made at an altitude of 1,700 feet above terrain. Since it was desirable to minimize any variations in tur-bulence between the runs in any one flight, the runs of each flight were made in rapid succession over an approximate 45-minute period during midday. Also, the flights were not made whenever changing..weather con-ditions were expected. -
In all, the tests consisted of 33 flights over a fixed course of about 22 miles in length. The flights were subdivided into two test con-figurations: external fuel tanks on and external fuel tanks off. The differences in performance capabilities and range of the airplane in the two configurations limited the test speeds and number of runs that could be made on any one flight. As a result, the data were obtained in four groups as indicated by the following table:
GroupNo. of flights
External tanks
Number of runs per flight at - Flight miles for each speed
______
300 mph, 14-50 mph, 600 mph, 614-7 mph, M=O. 14. M=O.6 M=O.8 M=o.85
I 14 On 2 2 2 0 589
II 12 Off 2 2 0 0 720
iii 6 Off 2 0 2 0 258
IV 1 Off 2 0 0 2 42
A single pilot was used for all flights in each test group, and the sequence of runs was varied so that no consistent combination of condi-tions might affect the results. On all runs the pilot used a minimum of control with all corrective measures being made very slowly. A flight consisted of runs at 300 miles per hour (M = 0.4), designated as the
CONFIDENTIAL
NACA RM L54GO9a CONFIDENTIAL 5
reference speed, and at one or more of the other test speeds. For each test condition, two runs at each speed were made, one in each flight direction in order to neutralize any possible effects of wind direction on the gust loads. It will be noted that with the external tanks on each flight covered three airspeeds, but without the tanks each flight covered only two airspeeds, thus necessitating two groups in the latter condition to cover the three airspeeds. One special flight was made without external tanks in which a relatively high test speed of 645 miles per hour, M = 0.85, was used. In addition to the regular test flights, several other flights were made to calibrate the airspeed-altitude system of the test airplane.
EVALUATION AND RESULTS
The acceleration records for data groups I, II, and III were evalu-ated to obtain counts of peak values of acceleration between any two consecutive intersections of the record line with the lgreference. The evaluation was confined to thresholds of acceleration greater than 0.2g, 0. 39, and 0.4g for the low, medium, and high-speed runs, respectively. These thresholds of acceleration correspond roughly to a constant "derived" gust velocity (ref. 6) of about 6 feet per second for each speed.
For the test condition of group IV which covered the extreme Mach number range of the tests, data were available from only one flight. Because of limited flight miles in this high Mach number condition, a different and more detailed method of data evaluation was employed. The acceleration records were evaluated along the time history at 0.2-second intervals for the runs at 300 miles per hour (M = 0.4) and at 0.1-second intervals for the runs at 615 miles per hour (M = 0.85), thus providing approximately the same number of readings per flight distance. Although this procedure involved a more time-consuming evaluation than was used for groups I, II, and III, it had the advantage of yielding better sta-tistical reliability for such a limited number of flight miles of data.
The airspeed-altitude records of all flights were evaluated to obtain the average airspeed and altitude, and the total flight distance in air miles for each run. Corrections were made to the airspeed-altitude data according to the calibration runs. Within each data group, the accelera- tions were adjusted to a standard condition (wing loading of 50 pounds per square foot for the data with external tanks, 45 pounds per square foot for-the data without tanks, and a forward velocity of 300, 450, 600 2 or 64 miles per hour) on the basis of the assumption that the acceleration varies directly as the forward speed and inversely as the
CONFIDENTIAL
6 CONFIDENTIAL NACA EM L74G09a
wing loading. These small corrections were made to eliminate any effects resulting from minor variations in these quantities which occurred from
run to run.
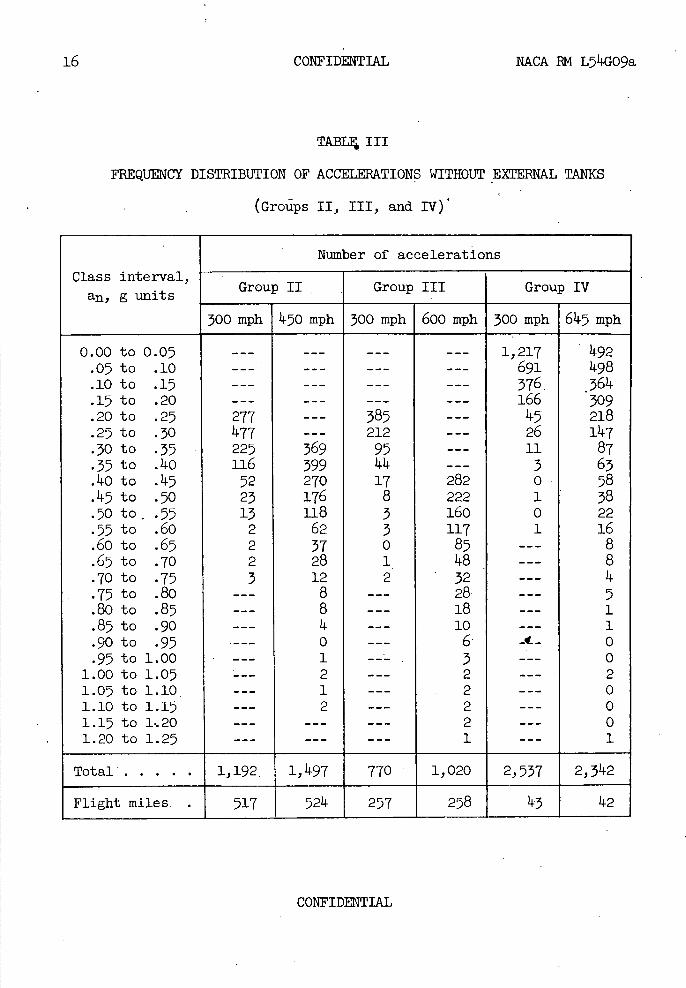
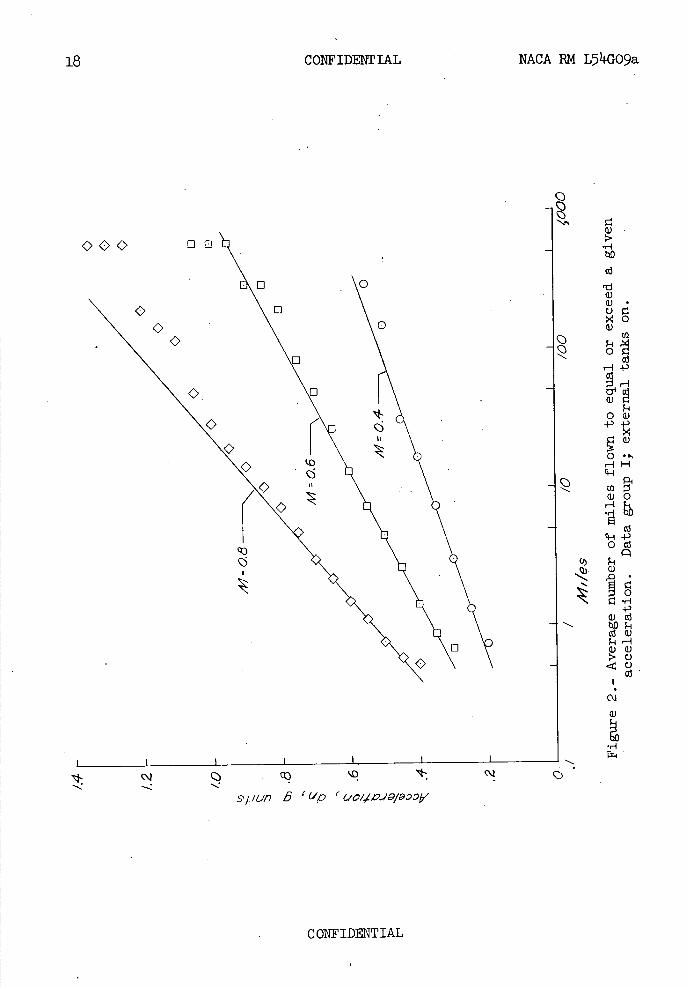
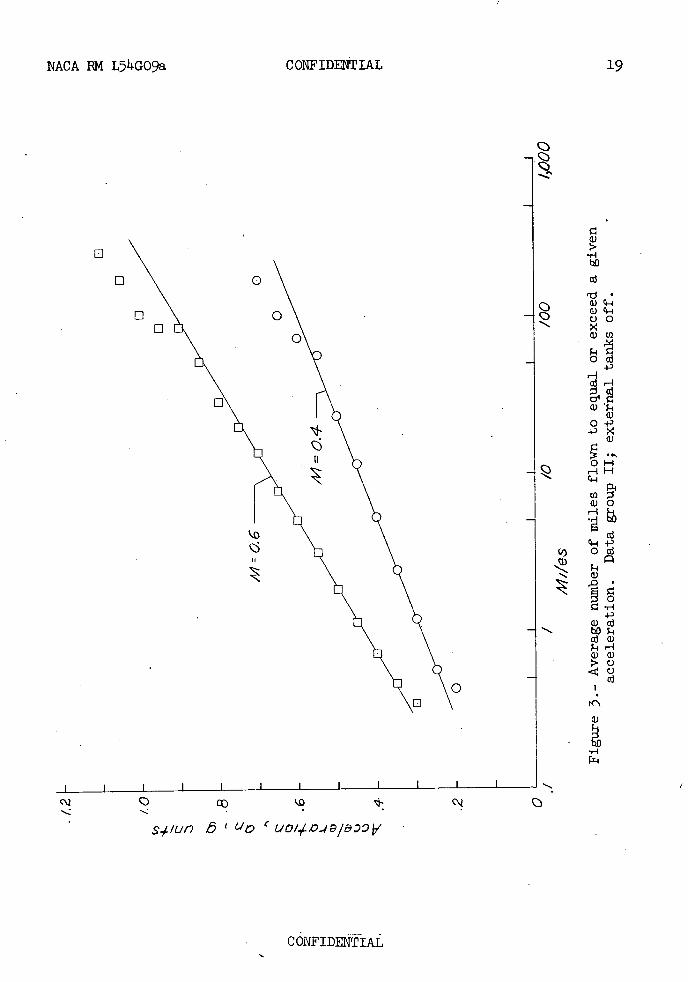
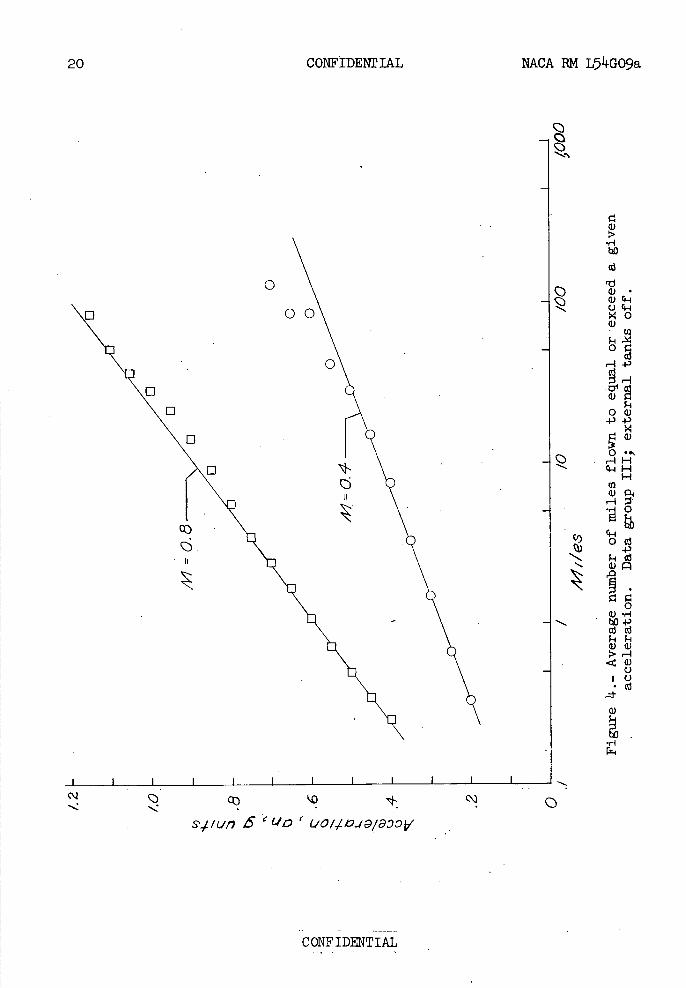
The adjusted acceleration data were'sorted into frequency distribu-tions with class intervals of 0 .05g and are tabulated by forward speed and external tank configuration in tables II and III. Also included in tables II and III are the total number of flight miles for each test condition. A cumulative frequency distribution was then obtained for the acceleration data of each test condition by successive addition of the frequencies of tables II and III. The cumulative frequency distri-butions of the data of groups I, II, and III were divided into the total flight miles to obtain the average number of miles flown to equal or exceed a given acceleration. These results are shown plotted in fig-
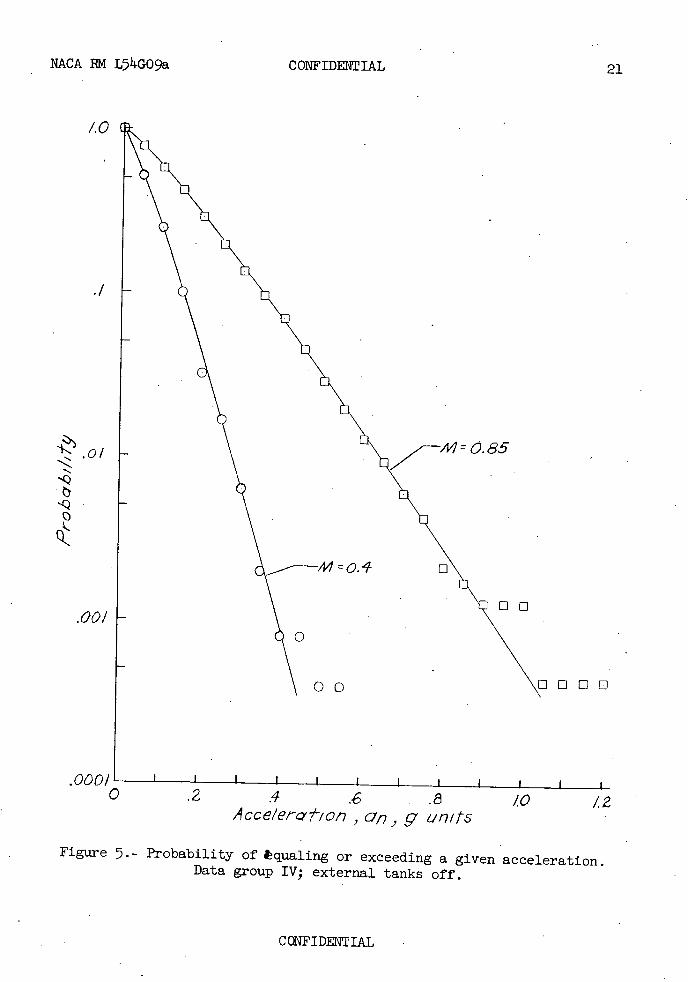
ures 2, 3, and i-. Because of the method of evaluation discussed earlier, the data of group IV could not be presented on a miles-to-exceed basis. The cumulative frequency distributions of this flight of data were, there-fore, divided by the total number of acceleration occurrences for each speed condition to obtain the probability of equaling or exceeding a given acceleration during the flight. The probability distributions for the data of group IV are shown in figure 7.
The data points shown in figures 2, 3, and 4 are very nearly linear, especially at the lower end of the curves. Therefore, in order tb describe the test results simply, an exponential curve (straight line on a semilogaritbmic plot) was fitted to each frequency distribution by means of least-squares solution, with the data points weighted in accord-ance with the number of accelerations in the class intervals. This proc-ess tended to minimize the effects of the larger acceleration values which represented only a small number of occurrences. It should be noted that the data points representing the lowest class interval in figures 2and 3 were not used in determining the least-square solutions since the accel- erätion counts were incomplete in these intervals owing to the thresholds not having been set quite low enough. For the probability plot of fig-ure 5, a curve was simply faired through the data points.
In order to indicate the variation of gust loads with Mach number, the data for all runs at 300 miles per hour (M = 0.4) were utilized as a reference condition, and the accelerations at the other test speeds were normalized to the values obtained at this datum speed for an equal number of flight miles. The ratios thus obtained are simply called load ratios. The average load ratios for the data in groups I, II, and III
(figs. 2, 3, and 1i) were determined in the region of greatest confidence (from about 1 to 10 miles per acceleration count). The apparent change in the acceleration variation with flight miles at high acceleration values is not considered of significance since these values are based on relatively few acceleration occurrences. The load ratios for the data
CONFIDENTIAL
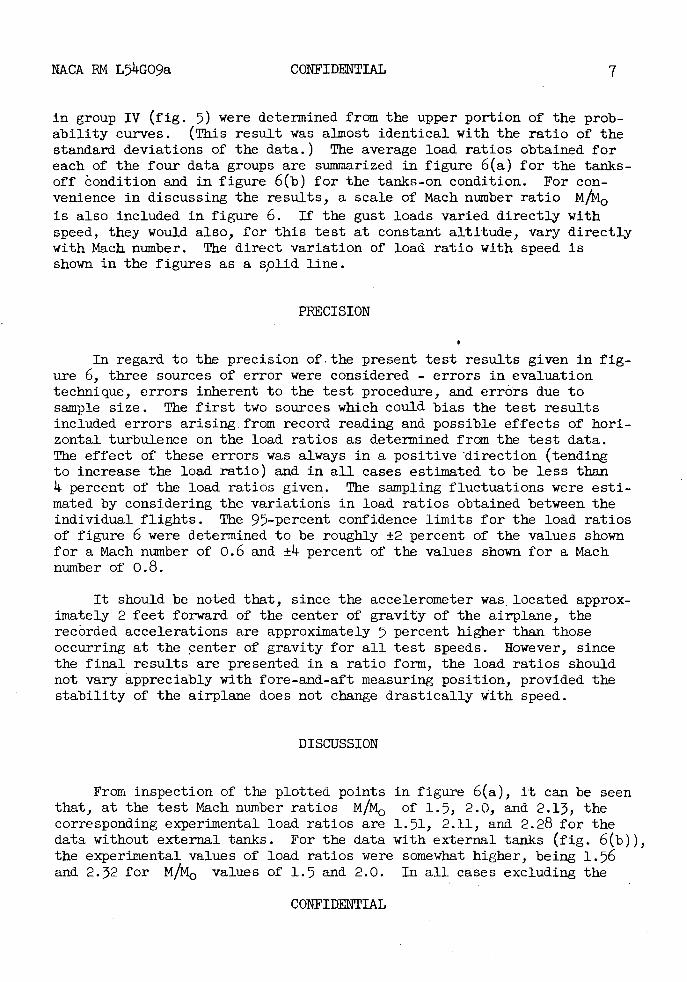
NACA EM L54GO9a CONFIDENTIAL 7
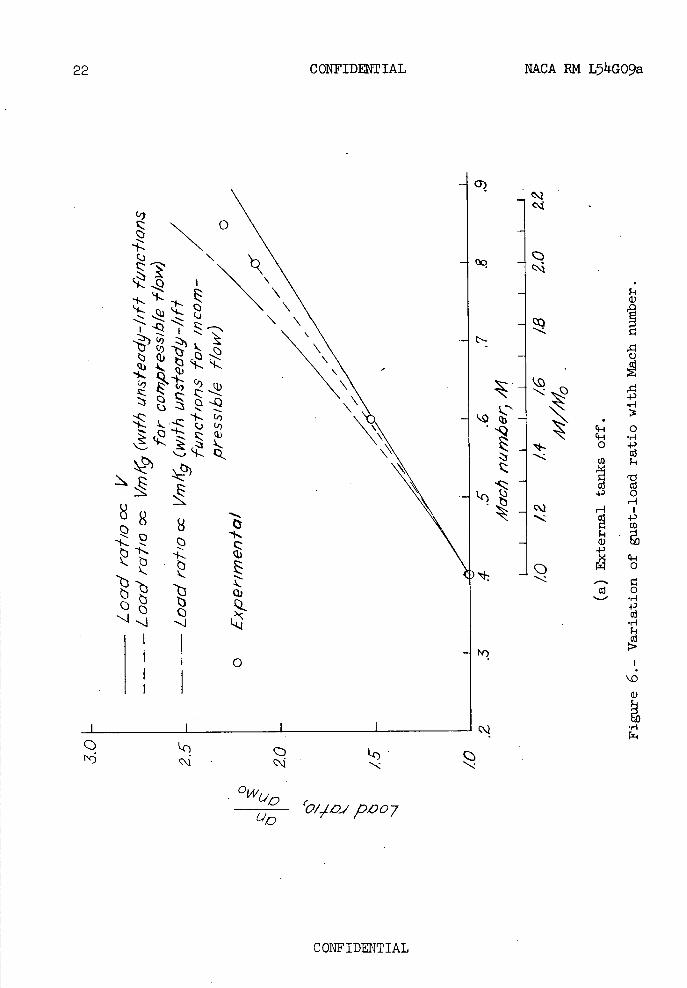
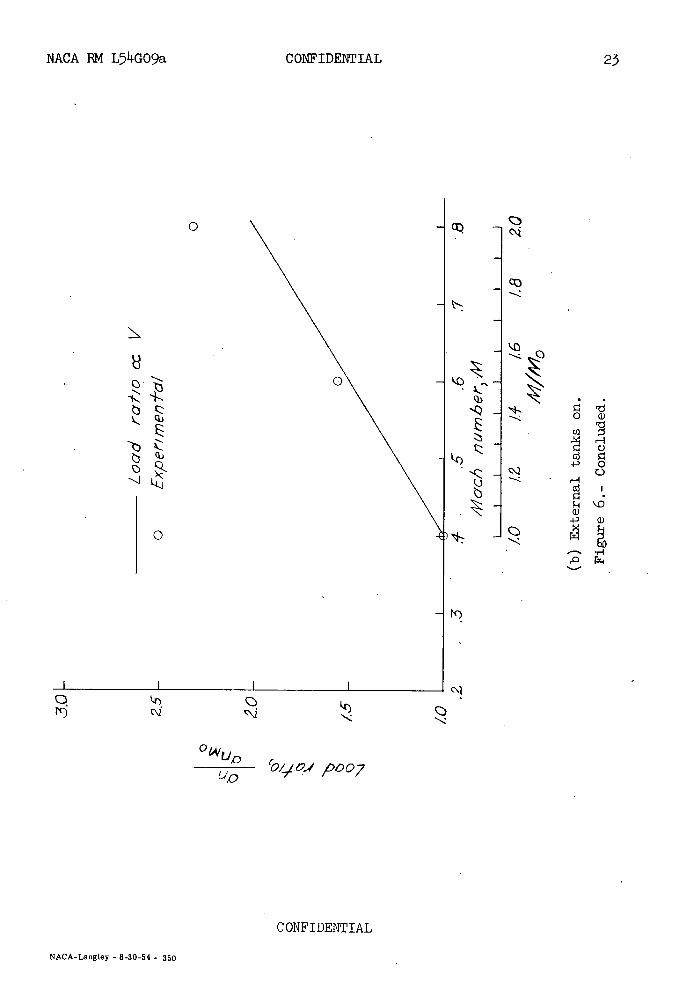
in group IV (fig. 5) were determined from the upper portion of the prob-ability curves. (This result was almost identical with the ratio of the standard deviations of the data.) The average load ratios obtained for each of the four data groups are summarized in figure 6(a) for the tanks-off èondition and in figure 6(b) for the tanks-on condition. For con-venience in discussing the results, a scale of Mach number ratio M,/M0 is also included in figure 6. If the gust loads varied directly with speed, they would also, for this test at constant altitude, vary directly with Mach number. The direct variation of load ratio with speed is shown in the figures as a splid line.
PRECISION
In regard to the precision of the present test results given in fig-ure 6, three sources of error were considered - errors in evaluation technique, errors inherent to the test procedure, and errors due to sample size. The first two sources which could bias the test results included errors arising from record reading and possible effects of hori-zontal turbulence on the load ratios as determined from the test data. The effect of these errors was always in a positive direction (tending to increase the load ratio) and in all cases estimated to be less than 4 percent of the load ratios given. The sampling fluctuations were esti-mated by considering the variations in load ratios obtained between the individual flights. The 95-percent confidence limits for the load ratios of figure 6 were determined to be roughly ±2 percent of the values shown for a Mach number of 0.6 and ±1 percent of the values shown for a Mach number of 0.8.
It should be noted that, since the accelerometer was , located approx-imately 2 feet forward of the center of gravity of the airplane, the recorded accelerations are approximately 5 percent higher than those occurring at the center of gravity for all test speeds. However, since the final results are presented in a ratio form, the load ratios should not vary appreciably with fore-and-aft measuring position, provided the stability of the airplane does not change drastically with speed.
DISCUSSION
From inspection of the plotted points in figure 6(a), it can be seen that, at the test Mach number ratios M/M0 of 1.5, 2.0, and 2.1, the corresponding experimental load ratios are 1.51, 2.11, and 2.28 for the data without external tanks. For the data with external tanks (fig. 6(b)), the experimental values of load ratios were somewhat higher, being 1.56 and 2.2 for M/MO values of 1.5 and 2.0. In all cases excluding the
CONFIDENTIAL
8 CONFIDENTIAL NACA RM L54GO9a
reference condition, the expreimental results were significantly higher than a linear variation with forward velocity, or Mach number, since the tests were at a constant altitude.
The foregoing deviation of the gust-load ratios from a linear varia-tion with forward velocity could presumably be the result of a number of factors. The primary factors which deserve consideration are the varia-tion with Mach number of the slope of the lift curve, rate of transient lift development, airplane flexibility effects, and airplane stability. The effects of flexibility and stability are difficult to assess precisely for the gust case. The available information, however, suggests that these effects might well be negligible for the present tests. In regard to flexibility, the records showed no evidence of an appreciable bending mode which is as might be expected since the test airplane was of a short span and relatively 6tiff. In assessment of dynamic-stability effects, two stability parameters considered important to airplane loads in gusts are the wave lengths of the short-period oscillation and the damping. The results of a flight test of the same model of airplane as used in the present test (ref. 7) indicate that, up to the limit Mach number of the test, there was no significant change in either the wave length in feet or chords of the short-period oscillation or the number of cycles to damp to 1/10 amplitude.
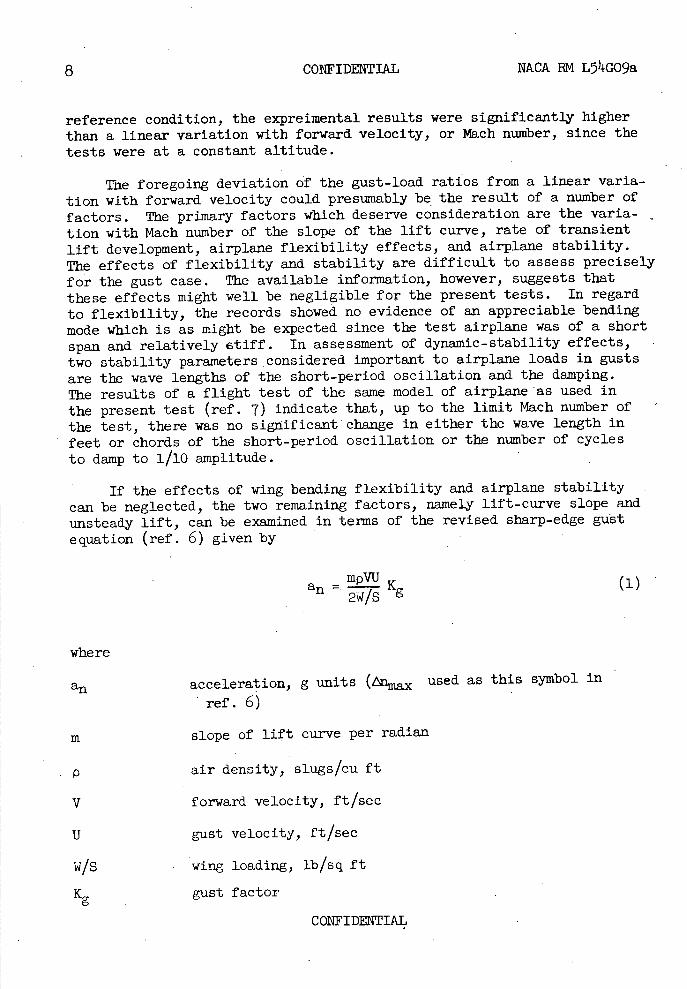
If the effects of wing bending flexibility and airplane stability can be neglected, the two remaining factors, namely lift-curve slope and unsteady lift, can be examined in terms of the revised sharp-edge gust equation (ref. 6) given by
mpVU an = K
2W/S g
where
an acceleration, g units (inmax used as this symbol in
ref. 6)
M slope of lift curve per radian
P air density, slugs/cu ft
V forward velocity, ft/sec
U gust velocity, ft/sec
w/s wing loading, lb/sq ft
Kg gust factor
(1)
CONFIDENTIAL
NCA RM L5 1-G09a CONFIDENTIAL 9
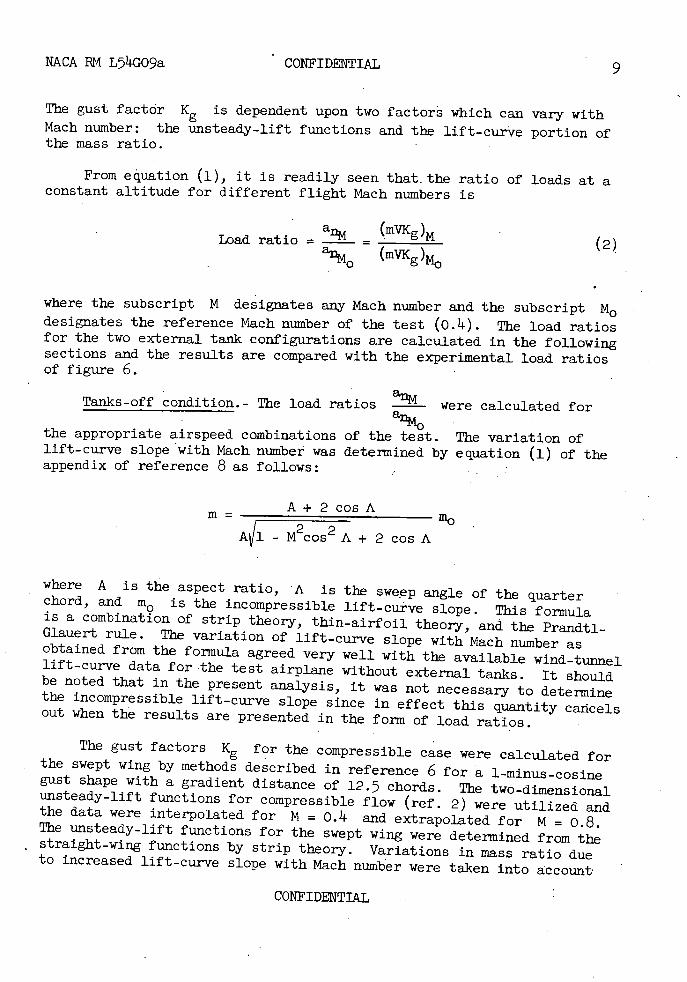
The gust factor Kg is dependent upon two factors which can vary with Mach number: the unsteady-lift functions and the lift-curve portion of the mass ratio.
From euation (1), it is readily seen that, the ratio of loads at a constant altitude for different flight Mach numbers is
Load ratio = a = (mvKg)
anM (mVKg)
where the subscript M designates any Mach number and the subscript M0 designates the reference Mach number of the test (oi '-). The load ratios for the two external tank configurations are calculated in the following sections and the results are compared with the experimental load ratios of figure 6.
Tanks-off condition.- The load ratios were pn1r'i]1f 'Prr
(2)
the appropriate airspeed combinations lift-curve slope 'with Mach number was appendix of reference 8 as follows:
a%
of the test. The variation of determined by equation (1) of the
A + 2 cos A
Al - M2cos2A + 2 cos A
where A is the aspect ratio, A is the sweep angle of the quarter chord, and m0 is the incompressible lift-curve slope. This formula is a combination of strip theory, thin-airfoil theory, and. the Prandtl-Glauert rule. The variation of lift-curve slope with Mach number as obtained from the formula agreed very well with the available wind-tunnel lift-curve data for the test airplane without external tanks. It should be noted that in the present analysis, it was not necessary to determine the incompressible lift-curve slope since in effect this quantity cancels out when the results are presented in the form of load ratios.
The gust factors Kg for the compressible case were calculated for the swept wing by methods described in reference 6 for a 1-minus-cosine gust shape with a gradient distance of 12.7 chords. The two-dimensional unsteady-lift functions for compressible flow (ref. 2) were utilized and the data were interpolated for M = 0 • 14 and extrapolated for M = 0.8. The unsteady-lift functions for the swept wing were determined from the straight-wing functions by strip theory. Variations in mass ratio due to increased lift-curve slope with Mach number were taken into account'
CONFIDENTIAL
10 CONFIDENTIAL NCA BM L54GO9a
in the calculations. Calculated load ratios were not determined for a Mach number of 0.85 since it was felt that the unsteady-lift curves of reference 2 could not be extrapolated to that Mach number with any degree of certainty. The load ratios were calculated for Mach numbers of 0.4,
0.6, and o.8, and the results are shown in figure 6(a) as the dashed line. It can be seen that the load ratios based on a lift-curve slope and gust factor both corrected for compressibility are in good agreement with the test results for the airplane without external tanks up to a Mach number of 0.8.
In order to show the respective contributions of lift-curve slope and unsteady-lift functions to the load ratios, the ratios were calcu- lated as before except that it was assumed the unsteady-lift functions did not vary with Mach number. The same variation of lift-curve slope with Mach number and the same mass-ratio values were used as before while the unsteady-lift functions for incompressible flow replaced those used previously. The load ratios thus obtained are shown in figure 6(a) as a dot-dashed line. It is obvious from these results that the neglect of the variation of the unsteady-lift functions with Mach number leads to an overestimation of the loads.
Effect of external tanks.- As previously mentioned, the load ratios for the tanks-on condition were somewhat higher than for the tanks-off condition. Unfortunately, information on the variation of the slope of the lift curve with Mach number for the present tanks-on configuration was not available. The results of reference 9, however, indicate that, for similar types of tanks, the slope of the lift curve increased more rapidly with Mach number for the tanks-on case than for the tanks-off case. Although the lack of information does not permit a detailed assessment similar to the one given for the tanks-off condition, the results for the tanks-on condition (fig. 6(b)) appear qualitatively con-sistent with indications from the tanks-off data, with an additional increase in the gust loads due to the external tanks.
General observations.- In all cases investigated, the increase in gust loads with Mach number was greater than a direct (one to one) vari-ation with forward speed, reflecting the influence of compressibility effects. For the test airplane flying at a Mach number of 0.85 without external tanks, the increment of load associated with compressibility effects amounted to 7 percent. The experimental load ratios were in agreement with the results calculated as a function of forward speed, a lift-curve slope variable with Mach number, and the. gust factor which included the unsteady-lift functions for compressible flow.
It is also indicated from the test results that large external stores such as fuel tanks can have considerable effect on the gust loads partic-ularly at high subsonic Mach numbers. For the test airplane with external
CONFIDENTIAL
NACA RM L54GO9a CONFIDENTIAL 11
tanks and flying at a Mach number of 0.8, the increment of load associ-ated with compressibility effects was about 16 percent, as contrasted to about 6 percent without external tanks. However, lift-curve-slope information was not available to permit calculations for this configuration.
Although no verification with calculations could be made for theY tanks-on data, the foregoing results for the tanks-off condition (in the cases where calculations could be made) are in agreement with the conclu-sions of reference 5 that the gust load may be calculated by using the compressible gust factor and the compressible lift-curve slope. However, the good agreement between the calculated and measured loads obtained in the present investigation could not be duplicated when similar calcula-tions were made for the test airplane of reference 1. The results from the test airplane of reference i. without external tanks showed an increase in gust load proportional to the increase in forward speed, whereas the calculated results for a Mach number of 0.68 were about 8. percent higher. The reasons for the differences in the results for the two airplanes are not known at present and will require further investigation in order to resolve completely the question of compressibility effects on gust loads.
CONCLUDING REMARKS
A flight investigation to determine the effects of compressibility or Mach number on gust loads has been made. A 350 swept-wing airplane flying at a constant altitude and covering a Mach number range from 0.4 to 0.85 was used, and the results of the investigation indicated that:
1. With increasing Mach number, the measured gust loads increased more rapidly than a direct (one to one) variation with forward speed, reflecting effectsof compressibility. For the test airplane flying at a Mach number of 0.85 without external tanks, the increment of load associated with compressibility amounted to about 7 percent.
2. In regard to the airplane without external tanks, the experi-mental results for the variation of gust loads with Mach number were in agreement with the calculated results based on lift-curve slopes cor-rected for compressibility and the two-dimensional unsteady-lift func-tions for compressible flow up to a Mach number of 0.8, the limit of the calculations.
CONFIDENTIAL
12 CONFIDENTIAL NACA RM L714GO9a
5. The addition of external fuel tanks caused a greater increase in gust loads with Mach number for the test airplane than in the case of tanks-off. At a Mach number of 0.8, the increment of load associated with compressibility effects was about 16 percent.
Langley Aeronautical Laboratory, National Advisory Committee for Aeronautics,
Langley Field, Va., June 2, 1974.
CONFIDENTIAL
NACA EM L54GO9a CONFIDENTIAL 15
IN
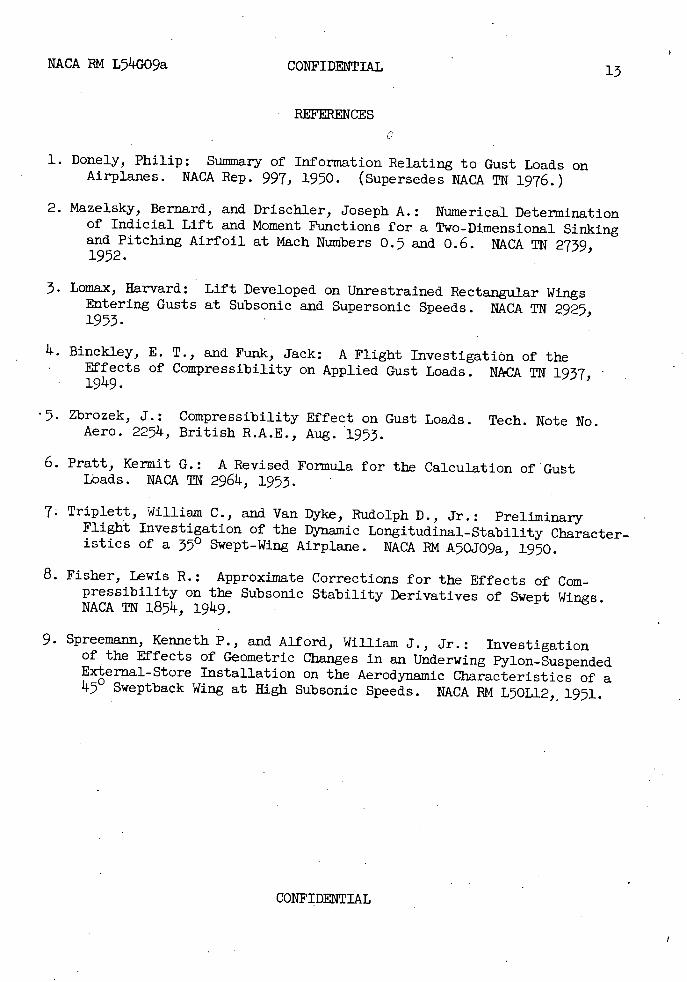
1. Donely, Philip: Summary of Information Relating to Gust Loads on Airplanes. NACA Rep. 997, 1970. (Supersedes NACA TN 1976.)
2. Mazeisky, Bernard, and Drischler, Joseph A.: Numerical Determination of Indicial Lift and Moment Functions for a Two-Dimensional Sinking and Pitching Airfoil at Mach Numbers 0.5 and 0.6. NACA TN 2759, 1952.
3. Lomax, Harvard: Lift Developed on Unrestrained Rectangular Wings Entering Gusts at Subsonic and Supersonic Speeds. NACA TN 2927, 1953.
4 • Binckley, E. T., and Funk, Jack: A Flight Investigation of the Effects of Compressibility on Applied Gust Loads. NkCA TN 1937, 1949.
5. Zbrozek, J.: Compressibility Effect on Gust Loads. Tech. Note No. Aero. 2254, British R.A.E., Aug. 1973.
6. Pratt, Kermit G.: A Revised Formula for the Calculation of'Gut LOads. NACA TN 2964, 1953.
7 Triplett, William C., and Van Dyke, Rudolph D., Jr.: Preliminary Flight Investigation of the Dynamic Longitudinal-Stability Character-istics of a 350 Swept-Wing Airplane. NACA EM A7OJO9a , 1950.
8. Fisher, Lewis R.: Approximate Corrections for the Effects of Com-pressibility on the Subsonic Stability Derivatives of Swept Wings. NACA TN 1854, 1949.
9. Spreemann, Kenneth P., and Afford, William J., Jr.: Investigation of the Effects of Geometric Changes in an Underwing Pylon-Suspended External-Store Installation on the Aerodynamic Characteristics of a 11.7° Sweptback Wing at High Subsonic Speeds. NACA EM L70L12, 1931.
CONFIDENTIAL

14 CONFIDENTIAL NACA 1RM L74GO9a
TABLE I
AIRPLANE CHARACTERISTICS
ItemWith
external tanks
Without external tanks
8.08 8.08 Mean aerodynamic chord, c, ft ........
Wing area, 5, sq ft .............288 288
Average test weight, W, lb .........l4,lO0 12,800
Average wing loading, W/S, lb/sq ft . . . 49.0 14.5
37.1 37.1 Wing span, ft ................
1..79
Center-of-gravity position,22.1 21.9
Aspect ratio, A ...............
Pitching moment of inertia, slug-ft2 . . . . 17,500 17,500
percent M.A.0................
Sweep angle of quarter chord, A, deg . . . 35 35
Incompressible lift-curve slope, m0 . . . . 3.8
Average air density, p, slugs/cu ft . . . . 0.00222 0.00222
Average mass ratio, at M = 0 . . . 42.0 pgcm
CONFIDENTIAL
NACA RM L54G09a CONFIDENTIAL 15
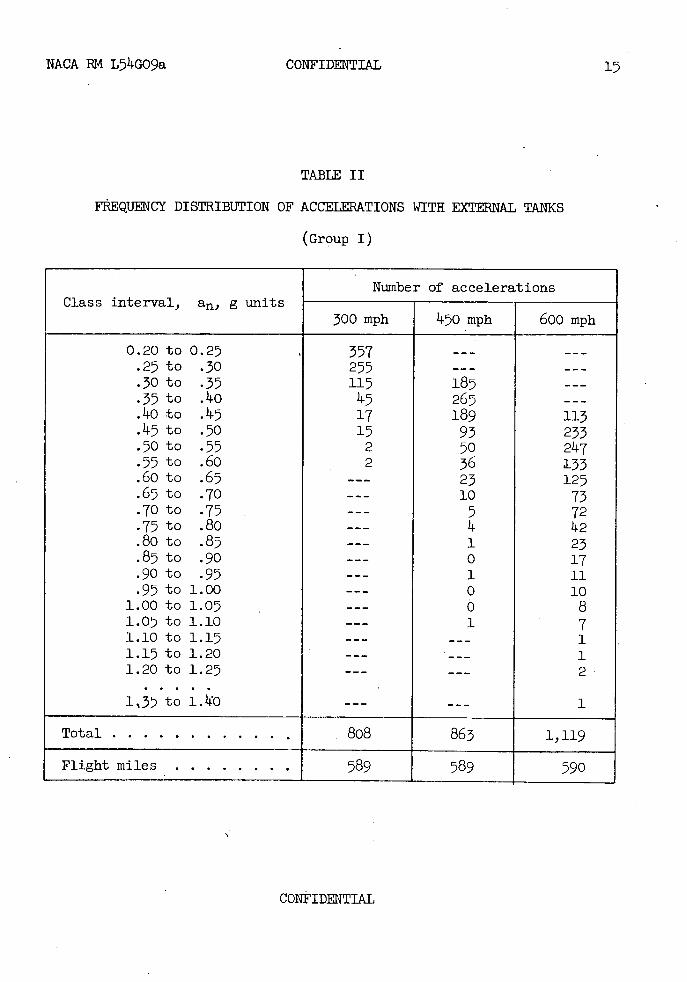
TABLE II
FREQUENCY DISTRIBUTION OF ACCELERATIONS WITH EXTERNAL TANKS
(Group I)
Number of accelerations Class interval, a, g units
300 mph 45O mph 600 mph
0.20 to 0.27 . 357 .25 to .30 255 . 30 to .35 117 185 .35 to .40 45 267 .40 to .4 17 189 113 .45 to . 50 15 93 233 . 50 to .55 2 50 247 .55 to .60 2 36 133 .60 to .65 23 125 .65 to . 70 10 73 .70 to .75 5 72 . 75 to .80 14. .80 to .85 1 23 .85 to . 90 --- 0 17 . 90 to .95 --- 1 11 .95 to 1.00 --- 0 10
1.00 to 1.05 --- b 8 1.05 to 1.10 1 7 1.10 to 1.15 --- --- 1 1.15 to 1.20 --- 1 1.20 to 1.25 --- 2
1
Total ........... 808 863 1,119
Flight miles 589 589 590
CONFIDENTIAL
16 CONFIDENTIAL NACA RM L54GO9a
TABL1 III
FREQUENCY DISTRIBUTION OF ACCELERATIONS WITHOUT EXTERNAL TANKS
(Groups II, III, and IVY
Number of accelerations
Class interval, a, gunits Group II Group III Group IV
300 mph 450 mph 300 mph 600 mph 300 mph 645 mph
0.00 to 0.07 --- --- --- 1,217 492 .07 to .10 --- --- 691 +98 .10 to .17 --- --- 376. 364 .15 to .20 --- 166 309 .20 to .27 277 585 45 218 .25 to .30 11.77 --- 212 26 111.7
.30 to .35 225 369 95 11 87
.35 to .11.0 116 399 44 3 63
.40 to .45 72 270 17 282 0 58
.45 to .70 23 176 8 222 1 38
.50 to. .55 13 118 5 160 0 22
.55 to .60 2 62 5 117 1 16
.60 to .65 2 37 0 8 8
.65 to .70 2 28 1 48 8
. 70 to .75 3 12 2 32 ---
.75 to .80 8 --- 28 --- 5
.80 to .85 8 --- 18 --- 1
.85 to .90 --- 10 1
.90 to .95 --- 0 --- 6 -t-. 0
.95 to 1.00 --- 1 ---- . 3 --- 0 1.00 to 1.05 2 --- 2 2 1.05 to 1.10 1 --- . 2 --- 0 1.10 to 1.15 --- 2 2 --- 0 1.15 to 1 .. 20 --- --- --- 2 --- 0 1.20 to 1.25 --- --- 1 --- 1
1,192. 1,11.97 770 1,020 2,557 2,311.2 Total* ......
Flight miles. . 517 524 257 258 113 42
CONFIDENTIAL
NACA BM L74G09a CONFIDENTIAL 17
Figure 1.- Test airplane.
CONFIDENT LAL
r4
cd
rd
c3 cd
oc)
o HF-I
r-4 t6
o'3 p
cd
cd
(1) -i Qi
.s
a5Q)
18 CONFIDENTIAL NACA RN L54GO9a
I'll Ni
0
S/Uf? 5 Qlo (JC/91a2fr'
CONFIDENTIAL
NACA RM L54G09a CONFIDENTIAL 19
c'z 0 co 0 s,t/'Jn 5 (w
4)
cc
rd
00
045 +)
—1
(1) 04-i
Cd
ro-
-1-i cDci
454)
4)4)
Cd
I
CONFIDENTIAL
20 CONFIDENTIAL NACA RM L5GO9a
a)
0
a) CH
o
a) 00)
a) o
0 rIH
H cJ a)p4
rl 0
C))
c)
0) •-1 -
0)0)
IC-) .'3
F in
0
sv/UI1 15 'L/L '
CONFIDENTIAL
.4 £ /0 /2 Acce/ei-af,o a/7 1 g Units
rr
to
/
- .0/
-Q
0
NACA RN L74GO9a CONFIDENTIAL 21
Figure 5.- Probability of iqua1ing or exceeding a given acceleration. Data group IV; external tanks off.
CONFIDENTIAL
22
0 N
CONFIDENTIAL NACA RN L74G09a
—0)
:z N 0
klD
-
a) -\ \
.—t:0 b
- - CH
0
\\..-Q •H o
' r
- H I
(I) 8 8 -ci) )
0 0cd
-
0
cd
LID
—N I 0
1
L 0
OW00 /J
POO 7
CONFIDENTIAL
0 N) 0
N
CID
o ci
C)
+' 0 C.)
I. '.0
ci) 4.) C])
LI0O/7/O/ /07
CONFIDENTIAL
NACA RN L74GO9a CONFIDENTIAL 23
NACA-Langley - 8-30-54 - 350

CONFIDENTIAL
CON Fl DENTIAL


![Low-Speed Aerodynamic Characteristics of NACA 0012 …naca.central.cranfield.ac.uk/reports/arc/rm/3726.pdf · · 2013-12-05Low-Speed Aerodynamic Characteristics of NACA 0012 Aerofoi]](https://img.pdfslide.us/doc/110x75/5aa786827f8b9a50528c845f/low-speed-aerodynamic-characteristics-of-naca-0012-naca-aerodynamic-characteristics.jpg)