Embed Size (px)
Citation preview

8/9/2019 NAB Quarterly Australian Residential Property Survey Q4 2014
http://slidepdf.com/reader/full/nab-quarterly-australian-residential-property-survey-q4-2014 1/9
National Australia Bank - Group Economics
NAB Residential Property Survey: Q4 2014by NAB Group Economics Embargoed until: 11.30am Wednesday 21 January 2015
NAB Residential Property Index falls as house price expectations
pared back and rents weaken. Sentiment softer in all states (and
still deeply negative in WA). Almost 10% of all property is being
purchased by first home buyers as an “investment”. Foreign
buyers less active all states except VIC (now 1 in 3 of all new
property sales). Over half of all foreign transactions are
apartments, one-third houses and the balance re-development.
Around 70% of all foreign purchases are properties valued less
than 1mn; 5% in excess of 5mn.
Survey highlights
NAB Residential Property Index fell to +12 points in Q4 (+19 inQ3). NSW overtook QLD as strongest state; sentiment notablylower in SA/NT and still deeply negative in WA. QLD and VIC mostoptimistic looking forward and WA weakest by some margin.
Outlook for house prices over next 1-2 years pared back in all states (NAB also expects price growth to slow). Expectationsfor rents unchanged, with mildly stronger expectations in VIC and QLD masking softer outlooks in NSW and SA/NT.
Foreign buyers in new property markets less active in all states, except VIC where they accounted for 32.5% (or 1 in 3) ofall sales - a new high. Around 17% of FHBs in the new property market were for owner occupation and 8% for investment.
Around 53% of foreign purchases were for apartments, 31% for houses and 16% for re-development. By price point, 40%of purchases were between $500k to <$1mn and 29% less than $500k. Around 5% were for premium property (+$5mn).
Housing affordability, construction costs and a lack of development sites seen as the biggest constraints in new housingmarket, while employment security and price levels the biggest impediment to buying established property.
Established property dominated by owner occupiers (42.6%). Local investors account for 22% of total demand, with FHBs(owner occupier) 16.1% with FHBs (investor) 9.3%. Foreign buyers more active (8.7%), led by NSW (11.3%) and VIC (12.8%).
Prospects for capital growth over the next 12 months were pared back at all price ranges in both the established housingand apartment markets in Q4, except for apartments valued between $1-2mn.
House price expectations weaken NAB also expects house prices to cool
NAB Property Survey - House Price Expectations ( )
-4.0
-2.0
0.0
2.0
4.0
Q 1 ' 1 1
Q 2 ' 1 1
Q 3 ' 1 1
Q 4 ' 1 1
Q 1 ' 1 2
Q 2 ' 1 2
Q 3 ' 1 2
Q 4 ' 1 2
Q 1 ' 1 3
Q 2 ' 1 3
Q 3 ' 1 3
Q 4 ' 1 3
Q 1 ' 1 4
Q 2 ' 1 4
Q 3 ' 1 4
Q 4 ' 1 4
N e x t Q t r
N e x t 1 2 m o n t h s
N e x t 2 y e a r s
Australia Victoria NSW Qld SA/NT WA
Expectations...Estimated price growth in relevant s urvey period...
%
NAB House Price Forecasts
-10
-5
0
5
10
15
20
2011 2012 2013 2014 2015f 2016f
Capital City Average Sydney Melbourne Brisbane Adelaide Perth
%
percentage changes represent through the year growth rates to Q4
NAB Residential Property Index
Foreign buyers less active in new housing markets
Q2
2014
Q3
2014
Q4
2014
Next
Qtr
Next
1 yr
Next
2 yrs
VIC 36 36 21 30 51 49
NSW 32 30 29 29 37 32
QLD 27 37 28 46 58 58
SA/NT 18 29 -25 13 31 44
WA -29 -39 -34 -20 -3 16
Index 19 19 12 22 37 39
Share of Demand for New & Existing Properties from
Overseas Buyers
0
2
4
6
8
10
12
14
16
18
Q 2 ' 1 0
Q 3 ' 1 0
Q 4 ' 1 0
Q 1 ' 1 1
Q 2 ' 1 1
Q 3 ' 1 1
Q 4 ' 1 1
Q 1 ' 1 2
Q 2 ' 1 2
Q 3 ' 1 2
Q 4 ' 1 2
Q 1 ' 1 3
Q 2 ' 1 3
Q 3 ' 1 3
Q 4 ' 1 3
Q 1 ' 1 4
Q 2 ' 1 4
Q 3 ' 1 4
Q 4 ' 1 4
New Properties Established Properties
%
Alan Oster, Chief Economist Robert De Iure, Senior Economist - Industry Analysis Dean Pearson, Head of Industry Analysis
| 1
(03) 8634 2927 0414 444 652 (mobile) (03) 8634 4611 0477 723 769 (mobile) (03) 8634 2331 0457 517 342 (mobile)

8/9/2019 NAB Quarterly Australian Residential Property Survey Q4 2014
http://slidepdf.com/reader/full/nab-quarterly-australian-residential-property-survey-q4-2014 2/9
NAB Residential Property Survey Q4 2014
National Australia Bank - Group Economics
y - Mark
Residential Propert et Performance
House price expectations Rental expectations
The housing market is loosing steam as house price Overall expectations for rents improved a little in Q4,expectations soften in all states. National house prices but are still fundamentally weak. National rents now
now expected to grow just 1.5% in the next year (2.1% tipped to rise 0.8% next year (0.7% in Q3), led by mildlyin Q3). Outlook strongest in VIC (2.2%), QLD (2.1%) and stronger expectations in VIC (1.4%) and QLD (1.3%).NSW (1.5%), with prices flat in SA/NT and falling in WA Prospects weakest in SA/NT (0.2%) and WA (-0.7%).(-0.2%). Average national house prices to grow 1.8% in 2 National outlook for rents in next 2 years unchanged atyears time (2.4% in Q3), with best prospects in QLD 1.2%, with improvements in VIC (2%) and QLD (1.8%)(2.7%), VIC (2.2%) and NSW (1.9%). House prices tipped masking softer outlooks in NSW (1%) and SA/NT (0.7%),to rise just 0.6% in WA and fall -0.2% in SA/NT. and negative returns in WA (-0.1%).
Rental Expectations ( )
-2.0
-1.0
0.0
1.0
2.0
3.0
4.0
V i c
Q l d
N S W
A u s t r a l i a
S A / N T
W A
V i c t o r i a
Q l d
A u s t r a l i a
N S W
S A / N T
W A
Q4'13 Q3'14 Q4'14
%
Next 12 months Next 2 years
House Price Expectations ( )
-1.0
0.0
1.0
2.0
3.0
4.0
5.0
V i c
Q l d
N S W
A u s t r a l i a
S A / N T
W A
Q l d V
i c
N S W
A u s t r a l i a
W A
S A / N T
| 2
Q4'13 Q3'14 Q4'14
%
Next 12 months Next 2 years
NAB Residential Property Index
With house prices weakening and rental growth sitting at its lowest level since the survey was first compiled, theNAB Residential Property Index fell to +12 points in Q4 (+19 points in Q3) to now sit below its long-term average
(+14 points). Market sentiment weakened in all states in Q4, but was overall strongest in NSW (+29 points), QLD(+28 points) and VIC (+21 points). Sentiment weakened notably in SA/NT (-25 points) and is still deeply negative inWA (-34 points). The NAB Residential Property Index is expected to rise to +37 points next year and +39 points in 2years time. Respondents from QLD and VIC are still the most optimistic overall, with sentiment among propertyprofessionals in WA tipped to remain weakest in the country - and by some margin.
NAB Residential Property Index
-50
-40
-30-20
-10
0
10
20
30
40
50
60
NSW Queensland Victoria Australia SA/NT WA
Q4'13 Q3'14 Q4'14
Index
NAB Residential Property Index
-60
-40
-20
0
20
40
60
80
Q 1 ' 1 1
Q 2 ' 1 1
Q 3 ' 1 1
Q 4 ' 1 1
Q 1 ' 1 2
Q 2 ' 1 2
Q 3 ' 1 2
Q 4 ' 1 2
Q 1 ' 1 3
Q 2 ' 1 3
Q 3 ' 1 3
Q 4 ' 1 3
Q 1 ' 1 4
Q 2 ' 1 4
Q 3 ' 1 4
Q 4 ' 1 4
N e x t Q t r
N e x t 1 2 m o n t h s
N e x t 2 y e a r s
Australia Victoria NSW Qld SA/NT WA
Index
Index value in...Index value in relevant survey period...

8/9/2019 NAB Quarterly Australian Residential Property Survey Q4 2014
http://slidepdf.com/reader/full/nab-quarterly-australian-residential-property-survey-q4-2014 3/9
NAB Residential Property Survey Q4 2014
National Australia Bank - Group Economics
Residential Property - New Developments
Demand for new properties by buyer
Foreign buyers less prevalent in new housing markets in Q4. Foreign buyers accounted for 14.8% of demand(16.8% in Q3) with this share to remain broadly unchanged at 15% over the next year. Foreign buyers less activein all states, except VIC where they accounted for a record high 32.5% (or 1 in 3) of all sales - a new high. For thefirst time, we have split first home buyers (FHBs) into owner occupiers and investors. While around 17% of FHBsin new property were for owner occupation, around 8% (o t.r about 1 in 12) of FHB purchases were for investmen
Percentage Share of Buyers - New Developments
40
50
Share of Demand for New Properties from
Overseas Buyers ( )
30
35
| 3
0
10
20
30
F H B s ( o w
n e r o c c u p i e r )
F H
B s ( i m v e s t o r )
R e s i d e n t O w n e r
O c c u p i e r s
A u s t r a
l i a n I n v e s t o r s
O v e r s e a s B u y e r s
O t h e r
F H B s ( o w
n e r o c c u p i e r )
F H
B s ( i m v e s t o r )
R e s i d e n t O w n e r
O c c u p i e r s
A u s t r a
l i a n I n v e s t o r s
O v e r s e a s B u y e r s
O t h e r
%
Current Quarter Next 12 months %
0
5
10
15
20
25
Q 2 ' 1 0
Q 3 ' 1 0
Q 4 ' 1 0
Q 1 ' 1 1
Q 2 ' 1 1
Q 3 ' 1 1
Q 4 ' 1 1
Q 1 ' 1 2
Q 2 ' 1 2
Q 3 ' 1 2
Q 4 ' 1 2
Q 1 ' 1 3
Q 2 ' 1 3
Q 3 ' 1 3
Q 4 ' 1 3
Q 1 ' 1 4
Q 2 ' 1 4
Q 3 ' 1 4
Q 4 ' 1 4
Q4'13 Q3'14 Q4'14 Australia Victoria NSW Qld WA
Type of Property Purchased by Foreign Buyers
In this survey, we asked what type of property foreigners were buying. Nationally, 53% of foreign purchaseswere apartments, 31% houses and 16% for re-development. Interestingly, apartments made up just 44% of allpurchases in VIC (54-57% in other states), with foreigners buying more houses in VIC (38%) than in other states.
Type of Property Purchased by Foreign Investors
( share of total)
Dwelling/Land for
Re-Development16%
Apartments
53%
Type of Property Purchased by Foreign Investors by
State ( share of total)
30
40
50
60
%
0
10
20
Vic NSW Qld SA/NT WAHouses
31%
Apartments Houses Dwelling/Land for Re-Development
Price Range of Property Purchased by Foreign Buyer
The majority of foreign buyers (40%) bought properties between $500k to <$1 million, with 29% buyingproperties less than <$500k. Around 5% of all sales were for premium property (+$5 million). There was howeversome variance between states. Whereas 18% of all sales nationally were in the $1-2 million range, it was as highas 25% in NSW. Also notable was the higher proportion of top end (+$5mn) property bought in QLD (7.6%).
Price Range of Property Purchased by Foreign
Investors ( share of total)
$1mn to <$2mn
18%
$500k to <$1mn
40%
<$500k29%
$5mn+5%
$2mn to <$5mn8%
Price Range of Property Purchased by Foreign
Investors by State ( share of total)
0
10
20
30
40
50
60
Vic NSW Qld SA/NT WA
<$500k $500k to <$1mn $1mn to <$2mn $2mn to <$5mn $5mn+
%

8/9/2019 NAB Quarterly Australian Residential Property Survey Q4 2014
http://slidepdf.com/reader/full/nab-quarterly-australian-residential-property-survey-q4-2014 4/9
NAB Residential Property Survey Q4 2014
National Australia Bank - Group Economics
Demand for new property by type and location
National demand for all types of new property softened in Q4, with a notable weakening in demand for new innerc low rise apartments (VIC and WA) and for houses in the middle/outerity houses (especially in VIC and WA) andring (VIC). Overall demand for new property was strongest for inner city high rise apartments (led by NSW andQLD), marginally ahead of inner city houses (NSW and QLD) and CBD apartments (NSW). Overall demand remainsweakest for new high rise apartments located in the middle/outer rings, with demand for this property type
especially weak in VIC. Looking forward, property professionals are anticipating a further softening in nationaldemand for all types of new property next year. However, overall demand is still expected to remain “good” acrossall new property types and locations. More detail is available in the individual State reports.
Demand for New Residential Developments
(current)
0.50 1.50 2.50 3.50 4.50 5.50
Middle/Outer Ring High Rise Apts
Middle/Outer RingLow Rise Apts
Middle/Outer Ring Houses
Inner City Low Rise Apts
CBD Apartments
Inner City Houses
Inner City High Rise Apts
Q4'13 Q3'14 Q4'14
Poor Fair Good Very Good Excellent
Demand for New Residential Developments
(next 12 months)
0.50 1.50 2.50 3.50 4.50 5.50
Middle/Outer Ring High Rise Apts
Inner City Low Rise Apts
Middle/Outer Ring Houses
Middle/Outer RingLow Rise Apts
CBD Apartments
Inner City High Rise Apts
Inner City Houses
Q4'13 Q3'14 Q4'14
Poor Fair Good Very Good Excellent
Constraints on new housing development
Housing affordability continues to be identified as the biggest constraint in new housing markets nationally,although slightly less so than in Q3. Construction costs (especially in NSW and to a lesser extent VIC) and a lack ofdevelopment sites (mainly in NSW) are also considered to be “significant” constraints. With house prices slowing,concern over the sustainability of house price gains has moderated somewhat, although it is still a “significant”issue in NSW and VIC where median house prices are also highest in the country. Also notable was the “significant”
and growing concern over the level of interest rates in VIC and labour availability in NSW.
Constraints on New Housing Developments Constraints on New Housing Developments by State
| 4
0.50 1.50 2.50 3.50 4.50 5.50
Housing Affordability
Construction Costs
Lack of Development Sites
Sustainability of House Price Gains
Tight Credit for New Residential Development
Rising Interest Rates
Labour Availability
Q4'13 Q3'14 Q4'14
Not at all
Significant
Not Very
Significant
Somewhat
SignificantSignificant
Very
Significant
0.50 1.50 2.50 3.50 4.50 5.50
Rising Interest Rates
Tight Credit for New Residential Development
Lack of Development Sites
Sustainability of House Price Gains
Housing Affordability
Construction Costs
Labour Availability
Victoria NSW Qld SA/NT WA
Not at all
Significant
Not Very
Significant
Somewhat
Significant Signific
ant
Very
Significant
8/9/2019 NAB Quarterly Australian Residential Property Survey Q4 2014
http://slidepdf.com/reader/full/nab-quarterly-australian-residential-property-survey-q4-2014 5/9
NAB Residential Property Survey Q4 2014
National Australia Bank - Group Economics
Residential Property - Existing Developments
Demand for existing property
Resident owner occupiers continue to dominate demand for established property with a market share of 42.6%(48.1% in Q3), followed by local investors, with a market share of 22% (25.2% in Q3). Although lower than our
previous survey, these results may have been influenced by the split of FHBs into owner occupiers and investors.Property professionals estimate that FHBs (owner occupier) accounted for 16.1% of total demand for establishedproperty in Q4, with FHBs (investor) making up 9.3%. Foreign buyers were also slightly more active in establishedproperty markets in Q4, with their share of total national demand inching up to 8.7% (8.2% in Q3). Foreign buyerdemand fell in QLD (6.1%) and WA (5.1%), but climbed to 11.3% in NSW and reached a new high of 12.8% in VIC.
Percentage Share of Buyers - Existing Properties Share of Demand for Existing Properties from
Overseas Buyers ( )
0
10
20
30
40
F H B s ( o w n e r o c c u p i e
r )
F H B s ( i n v e s t o
r )
s i d e n t O w n e r O c c u p i e r s
A u s t r a l i a n I n v e s t o r s
O v e r s e a s B u y e r s
O t h e r
F H B s ( o w n e r o c c u p i e
r )
F H B s ( i n v e s t o
r )
s i d e n t O w n e r O c c u p i e r s
A u s t r a l i a n I n v e s t o r s
O v e r s e a s B u y e r s
O t h e r
50
60
| 5
R e
R e
Q4'13 Q3'14 Q4'14
%
Current Quarter Next 12 months
0
2
4
6
8
10
12
14
' 1 0
' 1 0
' 1 0
' 1 1
' 1 1
' 1 1
' 1 1
' 1 2
' 1 2
' 1 2
' 1 2
Q 2
Q 3
Q 4
Q 1
Q 2
Q 3
Q 4
Q 1
Q 2
Q 3
Q 4
Q 1 ' 1 3
Q 2 ' 1 3
Q 3 ' 1 3
Q 4 ' 1 3
Q 1 ' 1 4
Q 2 ' 1 4
Q 3 ' 1 4
Q 4 ' 1 4
Australia Victoria NSW Qld WA
%
Demand for existing property by type
At the national level, demand for all types of established property was assessed as “good” in Q4 and broadlyunchanged from Q3, with demand strongest for established houses located in the inner city and middle/outer ring.Demand for existing residential property is expected to weaken across all market segments next year, with demandexpected to soften most for houses in the middle/outer ring and inner city apartments.
By state, demand for all types of established property continues to be “very good” in NSW, led by inner city houses,low and high rise apartments and CBD apartments. In contrast, demand for all types of established property in WAwas assessed as only “fair”, mirroring very weak sentiment also seen in that state.
Demand for Existing Residential Property
(current)
0.50 1.50 2.50 3.50 4.50 5.50
Demand for Existing Residential Property by State
(current)
0.50 1.50 2.50 3.50 4.50 5.50
Middle/Outer Ring High Rise Apts
Middle/Outer Ring High Rise Apts
Middle/Outer RingLow Rise Apts
Inner City Houses
Middle/Outer Ring Houses
Inner City Low Rise Apts
Inner City High Rise Apts
Middle/Outer Ring Low Rise Apts
CBD Apartments
CBD Apartments
Inner City Houses
Inner City High Rise Apts
Inner City Low Rise Apts
Middle/Outer Ring Houses
Q4'13 Q3'14 Q4'14
Poor Fair Good Very Good Excellent
Victoria NSW Qld WA
Poor Fair Good Very Good Excellent
Demand for Existing Residential Property
(next 12 months)
0.50 1.50 2.50 3.50 4.50 5.50
Inner City Houses
Middle/Outer Ring Houses
Inner City Low Rise Apts
CBD Apartments
Inner City High Rise Apts
Middle/Outer Ring Low Rise Apts
Middle/Outer Ring High Rise Apts
Q4'13 Q3'14 Q4'14
Poor Fair Good Very Good Excellent
Demand for Existing Residential Property by State
(next 12 months)
0.50 1.50 2.50 3.50 4.50 5.50
CBD Apartments
Inner City Houses
Inner City High Rise Apts
Inner City Low Rise Apts
Middle/Outer Ring Houses
Middle/Outer Ring High Rise Apts
Middle/Outer RingLow Rise Apts
Victoria NSW Qld WA
Poor Fair Good Very Good Excellent

8/9/2019 NAB Quarterly Australian Residential Property Survey Q4 2014
http://slidepdf.com/reader/full/nab-quarterly-australian-residential-property-survey-q4-2014 6/9
NAB Residential Property Survey Q4 2014
National Australia Bank - Group Economics
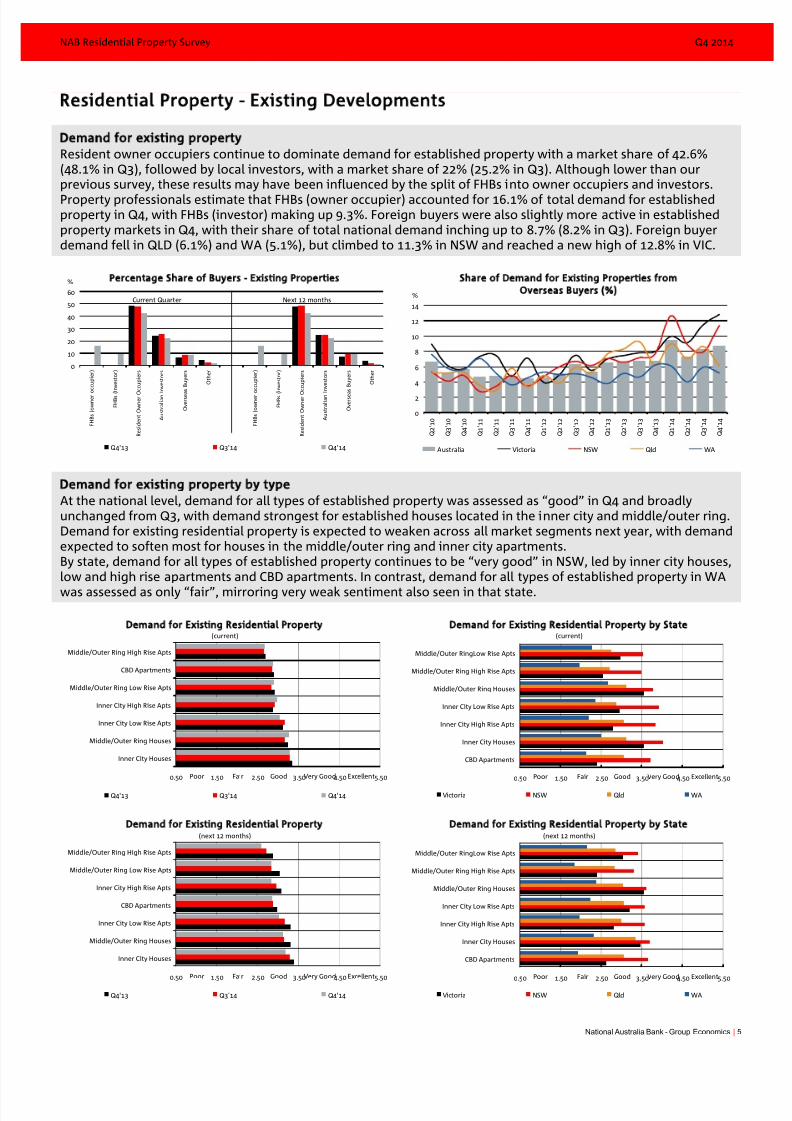
Capital growth expectations
At the national level, capital growth expectations for the next 12 months were pared back at all price ranges inboth housing and apartment markets in Q4, except for apartments valued at between $1-2 million where theyimproved slightly. Capital growth expectations were assessed as “good” for all houses <$1million and forapartments <$750k. Expectations for capital growth at all other price points were assessed as “fair”.By state, expectations for capital growth remain strongest in NSW across all price ranges, and significantly so in the
apartment market. In contrast, capital growth prospects are now clearly weakest in WA at all price points,especially houses above $1 million and for apartments above $2 million, where prospects are considered “poor”.
Capital Growth by Price - Established Houses
(next 12 months)
0.50 1.50 2.50 3.50 4.50 5.50
Less than $250,000
$250,001 - $500,000
$500,001 - $750,000
$750,001 - $1,000,000
$1,000,001 - $2,000,000
$2,000,001 - $5,000,000
$5,000,001+
Q4'13 Q3'14 Q4'14
Poor Fair Good Very Good Excellent
Capital Growth by Price - Apartments
(next 12 months)
0.50 1.50 2.50 3.50 4.50 5.50
Less than $250,000
$250,001 - $500,000
$500,001 - $750,000
$750,001 - $1,000,000
$1,000,001 - $2,000,000
$2,000,001 - $5,000,000
$5,000,001+
Q4'13 Q3'14 Q4'14
Poor Fair Good Very Good Excellent
Capital Growth: Established Houses by State
(next 12 months)
0.50 1.50 2.50 3.50 4.50 5.50
Less than $250,000
$250,001 - $500,000
$500,001 - $750,000
$750,001 - $1,000,000
$1,000,001 - $2,000,000
$2,000,001 - $5,000,000
$5,000,001+
Victoria NSW Qld WA
Poor Fair Good Very Good Excellent
Capital Growth: Established Apartments by State
(next 12 months)
0.50 1.50 2.50 3.50 4.50 5.50
Less than $250,000
$250,001 - $500,000
$500,001 - $750,000
$750,001 - $1,000,000
$1,000,001 - $2,000,000
$2,000,001 - $5,000,000
$5,000,001+
Victoria NSW Qld WA
Poor Fair Good Very Good Excellent
Constraints on existing property
With unemployment climbing and the economy slowing, employment security continues to be viewed as biggest(and growing) impediment to buying existing property nationally and in most states, especially in SA/NT and WA.NSW was the exception, with house price levels identified as the biggest impediment to buying an existingproperty. House price levels were also a “significant” factor nationally, led by NSW, VIC and QLD. In contrast, thelevel of constraint imposed on the market from a lack of stock was scaled back to “somewhat significant” in Q4,
although it was still seen as a “significant” in NSW. The impact on the market from rising interest rates wasunchanged in Q4, but property professionals saw relative returns from other investments as a bigger obstacle,especially in QLD.
Major Constraints on Existing Property
0.50 1.50 2.50 3.50 4.50 5.50
Rising Interest Rates
Lack of Stock
Relative Returns on
Other Investments
Access to Credit
Level of Prices
Employment Security
Q4'13 Q3'14 Q4'14
Not At All Significant
Not VerySignificant
SomewhatSignificant
SignificantVery
Significant
Major Constraints on Existing Property by State
0.50 1.50 2.50 3.50 4.50 5.50
Rising Interest Rates
Access to Credit
Lack of Stock
Level of Prices
Employment Security
Relative Returns on
Other Investments
Victoria NSW Qld SA/NT WA
Not At All Significant
Not VerySignificant
SomewhatSignificant
SignificantVery
Significant
| 6
8/9/2019 NAB Quarterly Australian Residential Property Survey Q4 2014
http://slidepdf.com/reader/full/nab-quarterly-australian-residential-property-survey-q4-2014 7/9
NAB Residential Property Survey Q4 2014
National Australia Bank - Group Economics
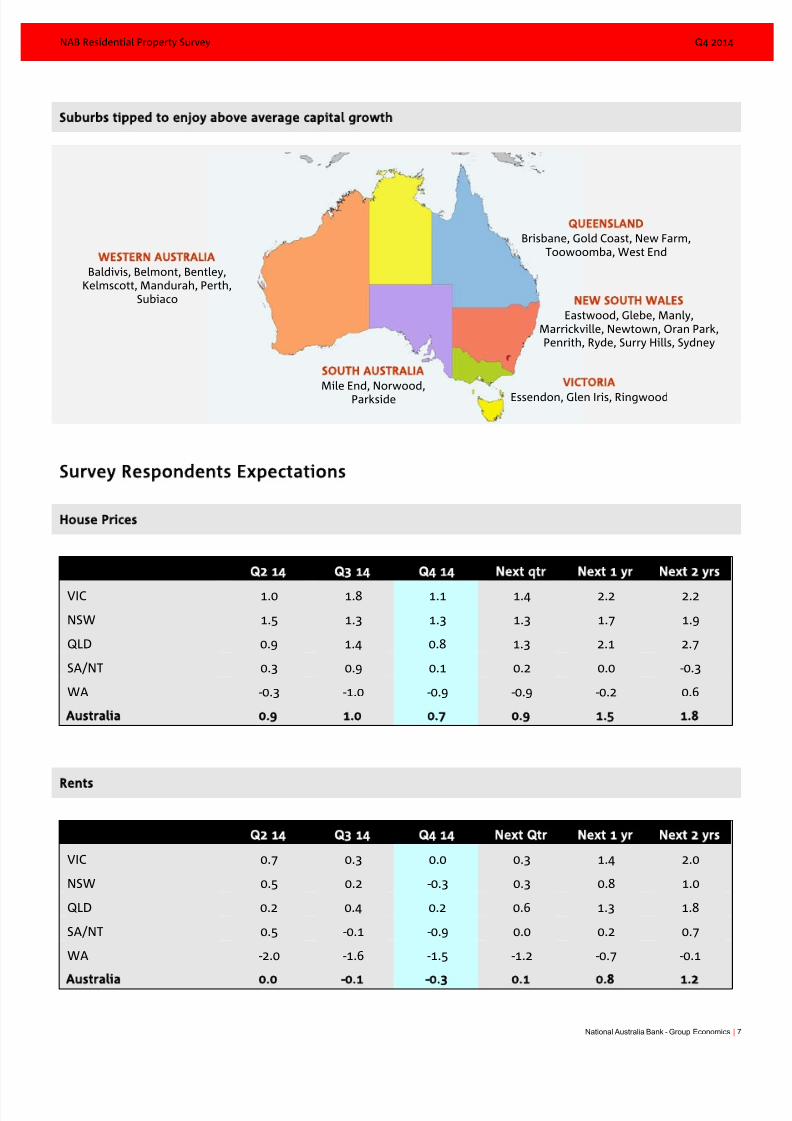
Suburbs tipped to enjoy above average capital growth
| 7
espondents Expectationsurvey R
House Prices
Q2 14 Q3 14 Q4 14 Next qtr Next 1 yr Next 2 yrs
VIC 1.0 1.8 1.1 1.4 2.2 2.2
NSW 1.5 1.3 1.3 1.3 1.7 1.9
QLD 0.9 1.4 0.8 1.3 2.1 2.7
SA/NT 0.3 0.9 0.1 0.2 0.0 -0.3
WA -0.3 -1.0 -0.9 -0.9 -0.2 0.6
Australia 0.9 1.0 0.7 0.9 1.5 1.8
Rents
Q2 14 Q3 14 Q4 14 Next Qtr Next 1 yr Next 2 yrs
VIC 0.7 0.3 0.0 0.3 1.4 2.0
NSW 0.5 0.2 -0.3 0.3 0.8 1.0
QLD 0.2 0.4 0.2 0.6 1.3 1.8
SA/NT 0.5 -0.1 -0.9 0.0 0.2 0.7
WA -2.0 -1.6 -1.5 -1.2 -0.7 -0.1
Australia 0.0 -0.1 -0.3 0.1 0.8 1.2
WESTERN AUSTRALIA
Baldivis, Belmont, Bentley,Kelmscott, Mandurah, Perth,
Subiaco
SOUTH AUSTRALIAMile End, Norwood,Parkside
NEW SOUTH WALES
Eastwood, Glebe, Manly,Marrickville, Newtown, Oran Park,Penrith, Ryde, Surry Hills, Sydney
VICTORIA
Essendon, Glen Iris, Ringwood
QUEENSLAND
Brisbane, Gold Coast, New Farm,Toowoomba, West End

8/9/2019 NAB Quarterly Australian Residential Property Survey Q4 2014
http://slidepdf.com/reader/full/nab-quarterly-australian-residential-property-survey-q4-2014 8/9
NAB Residential Property Survey Q4 2014
National Australia Bank - Group Economics
ntial House PricesAB’s View of Reside
With more signs emerging that the residential housing market is loosing steam, NAB Economics expects averagecapital city house prices to cool to around 4% over the year to end-2015 and 2% over the year to end-2016. Ourassessment of the market remains that house price growth will continue to moderate because of rising
unemployment, sluggish household income growth, affordability concerns, cost of living pressures and high levelsof household debt. We are also forecasting two further interest rates cuts of 25 bps in March and 25 bps in August2015 (bringing the official cash rate down to 2%) which should support house prices a little more than previouslyexpected.Brisbane (5.7%) and Sydney (4.1%) are expected to lead the market for capital growth over the year to end-2015,followed by Melbourne (2.7%), Adelaide (2.1%) and Perth (1.8%). Brisbane (3.8%), Sydney (2.3%) and Melbourne(2.3%) are forecast to remain the best cities for capital gains in the year to end-2016, with house prices rising by
just 2.2% in Adelaide and 1% in Perth.
NAB Capital City House Price Forecasts*
Year to end-December
2011 2012 2013 2014e 2015f 2016f
| 8
Sydney -3.2 4.6 16.0 10.7 4.1 2.3
Melbourne -5.6 0.0 10.0 5.1 2.7 2.3
Brisbane -5.4 1.6 5.7 6.8 5.7 3.8
Adelaide -4.5 -0.2 5.1 4.9 2.1 2.2
Perth -4.1 6.2 8.3 2.7 1.8 1.0
Capital City Average -4.4 2.6 10.5 6.4 3.9 2.1
*percentage changes represent through the year growth rates
About the Survey
In April 2010, NAB launched the inaugural NAB Quarterly Australian Commercial Property Survey with the aim ofdeveloping Australia’s pre-eminent survey of market conditions in the Commercial Property market.The large external panel of respondents consisted of Real Estate Agents/Managers, Property Developers,Asset/Fund Managers and Owners/Investors.Given the large number of respondents who are also directly exposed to the residential market, NAB expanded thesurvey questionnaire to focus more extensively on the Australian Residential market.Around 300 panellists participated in the Q4 2014 Survey and the breakdown of our Survey respondents - bylocation, property sector and business type - are shown below.
Respondents by State
SA/NT
8%
Western Australia17%
Tasmania1%
ACT
3% Victoria
24%
New South Wales
29%
Queensland
20%
Respondents by Property Sector
Other
8%
Retail Property
14%
Infrastructure
3%
Residential Property
43%
Industrial Property
13%
Office Property
16%
Hotels/
Entertainment
3%
Respondents by Business Type
Property Developers
14%
Other3%
Owners/Investors
in Real Property16%
Fund Managers
(Real Estate)1%
Valuers7% Real Estate Agents
and Managers
41%
AssetManagers/Property
Operators 14%

8/9/2019 NAB Quarterly Australian Residential Property Survey Q4 2014
http://slidepdf.com/reader/full/nab-quarterly-australian-residential-property-survey-q4-2014 9/9
NAB Residential Property Survey Q4 2014
National Australia Bank - Group Economics | 9
Group Economics
Alan Oster
Group Chief Economist
+61 3 8634 2927
Jacqui Brand
Personal Assistant
+61 3 8634 2181
Australian Economics
and Commodities
Rob BrookerHead of Australian Economics
+61 3 8634 1663
James Glenn
Senior Economist - Australia
+(61 3) 9208 8129
Vyanne Lai
Economist - Australia
+(61 3) 8634 0198
Phinn Ziebell
Economist - Agribusiness
+(61 4) 75 940 662
Industry Analysis
Dean Pearson
Head of Industry Analysis
+(61 3) 8634 2331
Robert De Iure
Senior Economist - Industry
Analysis
+(61 3) 8634 4611
Brien McDonald
Economist - Industry Analysis
+(61 3) 8634 3837
Amy Li
Economist - Industry Analysis
+(61 3) 8634 1563
Karla Bulauan
Economist - Industry Analysis
+(61 3) 8641 4028
International Economics
Tom Taylor
Head of Economics, International
+61 3 8634 1883
Tony Kelly
Senior Economist - International
+(61 3) 9208 5049
Gerard Burg
Senior Economist - Asia
+(61 3) 8634 2788
John Sharma
Economist - Sovereign Risk
+(61 3) 8634 4514
Global Markets Research Peter Jolly
Global Head of Research
+61 2 9237 1406
Australia
Economics
Spiros Papadopoulos
Senior Economist
+61 3 8641 0978
David de Garis
Senior Economist
+61 3 8641 3045
FX Strategy
Ray Attrill
Global Co-Head of FX Strategy
+61 2 9237 1848
Emma Lawson
Senior Currency Strategist
+61 2 9237 8154
Interest Rate Strategy
Skye Masters
Head of Interest Rate Strategy
+61 2 9295 1196
Rodrigo Catril
Interest Rate Strategist
+61 2 9293 7109
Credit Research
Michael BushHead of Credit Research
+61 3 8641 0575
Simon Fletcher
Senior Credit Analyst - FI
+61 29237 1076
Equities
Peter Cashmore
Senior Real Estate Equity Analyst
+61 2 9237 8156
Distribution
Barbara Leong
Research Production Manager
+61 2 9237 8151
New Zealand
Stephen ToplisHead of Research, NZ
+64 4 474 6905
Craig Ebert
Senior Economist
+64 4 474 6799
Doug Steel
Senior Economist
+64 4 474 6923
Kymberly Martin
Senior Market Strategist
+64 4 924 7654
Raiko Shareef
Currency Strategist
+64 4 924 7652
Yvonne Liew
Publications & Web Administrator
+64 4 474 9771
UK/Europe
Nick ParsonsHead of Research, UK/Europe,
and Global Co-Head of FX Strategy
+44207710 2993
Gavin Friend
Senior Markets Strategist
+44 207 710 2155
Derek Allassani
Research Production Manager
+44 207 710 1532
Asia
Christy Tan
Head of Markets
Strategy/Research, Asia
+852 2822 5350
Important Notice
This document has been prepared by National Australia Bank Limited ABN 12 004 044 937 AFSL 230686 ("NAB"). Any advice contained in thisdocument has been prepared without taking into account your objectives, financial situation or needs. Before acting on any advice in thisdocument, NAB recommends that you consider whether the advice is appropriate for your circumstances.NAB recommends that you obtain and consider the relevant Product Disclosure Statement or other disclosure document, before making anydecision about a product including whether to acquire or to continue to hold it.
Please click here to view our disclaimer and terms of use.