Embed Size (px)
Citation preview
NAB ONLINE RETAIL SALES INDEX IN-DEPTH REPORT – JUNE 2017
Embargoed until: 11:30am Thursday 3rd August 2017

ALAN OSTER Group Chief Economist, National Australia Bank
In total, we estimate the Australian online retail market was worth $22.74bn in the 12 months to June 2017.
Sales growth slowed in month-on-month (mom) terms to 0.7% in June, seasonally adjusted (s.a.) after rapid growth in May. Homewares and appliances, Electronic Games and Toys, and Media led monthly growth, while Fashion, Grocery and Liquor, and takeaway food contracted.
Online sales in the large eastern states continued to grow, along with the NT. Conversely sales in TAS, SA, ACT and WA contracted in the month. Annual growth remains strongest in VIC, NSW, and QLD.
While monthly growth at SME retailers contracted in June (-1.6), they have outpaced corporates over the year (+17.6%).
I hope you enjoy our latest insights into this rapidly evolving sector.
RICHARD COATH General Manager, Consumer, Health, Agri & TMI Global Institutional Banking, National Australia Bank
Small and medium sized enterprises (SMEs) played a key role, representing 36% of all online purchases.
From our latest figures it’s clear that Games and Toys enjoyed strong growth in June, as did Media – thanks in part to continued buoyancy in streaming video and music services.
Context is everything however. For instance, while SME monthly sales contracted in June, it’s worth knowing that they are still outpacing corporate sales year on year.
This month’s negative growth in Fashion – the first since the index began – also benefits from further insight. We believe this apparent slump may not be a fair representation of the sector. In all likelihood the emergence of ‘buy now pay later’ brands is temporarily skewing the numbers. Certainly we will monitor this development going forward with a view to establishing what is driving performance in this sector.
We hope the NAB Online Retail Sales Index provides you with the critical information and understanding you need to guide and support your business plans over the coming months.
NAB Online Retail Sales Index 2
INTRODUCTION
CONTENTS
NAB Online Retail Sales Index 3
At a Glance 4
The Online Retail Market 6 Overall Index 7
Online Categories 8 Category performance 9 Category growth and share of spending 10
International vs Domestic 11 International vs domestic performance 12 International vs domestic - by category 13
Age Groups 15 Performance of age groups 16 Age groups by category 17 Age groups - international / domestic 18
States and Territories 19 State performance 20 Spending by state 21
Metropolitan vs Regional 22 Metropolitan & regional performance 23
Small Online Retailers 24 A new series 25 Small Online Retailers by category 26

THE ONLINE RETAIL MARKET

In seasonally adjusted terms, at 0.7%, growth in online retail sales slowed in June. Looking through the month to month volatility, the trend is still positive. After exceptionally strong growth monthly growth in May, online sales for SMEs contracted in June.
The revised estimate for trend online retail sales growth was 0.3%. While this is lower than May (0.4%), it remains positive. ABS data showed growth of comparable traditional retailers in May of 0.7% (mom, s.a.) when compared to April.
In the 12 months to June, we estimate that Australians spent an estimated $22.74 billion on online retail – a level that is equivalent to around 7.4% of the traditional bricks and mortar retail sector (which totalled $306.9 billion in the year to May 2017 according to the Australian Bureau of Statistics).
In year on year terms (June 2017 v June 2016), online sales grew by 7.6%, down slightly from the 8.2% year-on-year growth rate in May. This is much slower than the growth recorded when the index was established. In June 2011 for example, year on year growth was around 34%. Growth has clearly flattened as shown in the trend line (see chart 1). Conversely, sales growth (17.6% yoy) at SMEs has been much stronger than earlier periods.
GROWTH IN ONLINE RETAIL (% monthly)
KEY RETAIL STATISTICS
OVERALL INDEX
NAB Online Retail Sales Index
5
Chart 1
Apr-17 May-17 Jun-17
Monthly growth (%)
Corporate -0.7 1.4 0.7
SMEs -2.0 11 -1.6
Annual growth (%)
Corporate 7.6 8.2 7.6
SMEs 9.4 22.2 17.6
Note: Expanding coverage to include food and smaller online retailers has caused seasonal adjustment factor constraints. In addition the series has a shorter history. Accordingly, as an interim measure, we are using the seasonally adjusted NORSI Corporate series as a proxy for the total online index
-6
-2
2
6
10
Jun-12 Jun-13 Jun-14 Jun-15 Jun-16 Jun-17
Online Retail Sales Growth (% mom, s.a.)
Online Retail Sales Growth (% mom, Trend*)
ONLINE CATEGORIES

Media contributed the most to growth in the year to June, and also had the fastest growth over the year. Homewares and appliances retains the largest share of spend.
Over the year to June, at 16.7% (yoy), Media had the fastest annual online sales growth. Online sales of Media, which represents things like streaming services, has generally higher, less volatile monthly growth than other categories. This more consistent growth has kept media in its high spend share spot.
The largest spend share category, Homewares and appliances, grew fastest in monthly growth rate terms in June (3.4% mom), followed by Toys (2.6%), Media(0.7%), Daily deals (0.6%), and Department stores (0.3%). Personal and recreational goods were flat(0.0%). The large spend share category of Groceries and Liquor contracted in June (-0.9%), from strong growth in May (5.7%), along with Food (-0.1%), and sharper falls in Fashion (-1.5%).
For the first time in the series history, Fashion also recorded negative year on year growth. This category is being impacted by recent trends in payment methods that mask purchase category identifiers. We suggest this number be used with caution.
ANNUAL GROWTH OF SPENDING, BY CATEGORY (% yoy)
MONTHLY GROWTH OF SPENDING, BY CATEGORY (% mom, s.a.)
CATEGORY PERFORMANCE
NAB Online Retail Sales Index 7
Chart 2
Chart 3
-20
-10
0
10
20
30
40
50
Jul-16 Nov-16 Mar-17 Oct-16 Feb-17 Jun-17
Fashion Daily DealsDepartment HomewareMedia PersonalGroceries ToysFood
-15
-10
-5
0
5
10
15
Jul-16 Nov-16 Mar-17 Oct-16 Feb-17 Jun-17
Fashion Daily DealsDepartment HomewareMedia PersonalGroceries ToysFood

In year on year terms, large spend shares Media, and Homewares and appliances have expanded rapidly. While Daily deals recorded sales growth in June, its contribution to annual online spend growth is nil.
CATEGORY GROWTH AND SHARE OF SPENDING
NAB Online Retail Sales Index 8
% Monthly growth
Annual growth
Share of total
spending
Contribution to annual
total spending growth
May-17
Jun-17
May-17
Jun-17
Fashion* 2.9 -1.5 2.1 -2.6 15.5 11.6
Daily Deals 1.5 0.6 4.0 3.1 2.3 0.0
Department 3.4 0.3 6.5 8.4 8.2 3.0
Homeware 1.5 3.4 11.6 13.8 20.1 22.1
Media 0.7 0.7 15.2 16.7 17.2 26.3
Personal 1.9 0.0 6.2 1.7 9.6 14.2
Groceries 5.7 -0.9 7.4 3.5 16.6 7.3
Toys -1.2 2.6 -0.3 11.9 3.8 2.4
Food 0.4 -0.1 12.4 9.6 6.7 13.0
Total 1.4 0.7 8.2 7.6 100 100
Note: Daily deal sites release for sale a single product or range of products each day. Media comprises movies, books and music.
*Use with Caution – see notes page, new payments methods.
“THE ARRIVAL OF NEW INTERNATIONAL PLAYERS HAS THE POTENTIAL TO CREATE A SECOND
WAVE OF DISRUPTION FOR ESTABLISHED AUSTRALIAN BRICKS AND MORTAR RETAILERS IN KEY
CATEGORIES .”
Wade Tubman, Quantium

INTERNATIONAL VS DOMESTIC

Both Domestic and international online sales slowed in the month. In June just under 80% of spending was domestic.
Domestic online sales growth slowed in June(0.8%, mom) compared to May(1.4%). International sales also slowed in the month (0.6%), much slower than May(2.2%). Looking at the year-on-year growth rates, domestic online sales growth (7.6%) and International (7.7%) are much closer than the comparable June result in 2016 where domestic sales (19.9% yoy) far outpaced international (6.8%).
As shown in chart 4, the relatively unchanged position of online retail shares has coincided with a relatively unchanged position of the Australian dollar since July 2016.
SHARE OF INTERNATIONAL AND DOMESTIC ONLINE SALES VS USD/AUD EXCHANGE RATE
GROWTH OF ONLINE SALES, BY RETAIL LOCATION (% mom)
INTERNATIONAL VS DOMESTIC PERFORMANCE
NAB Online Retail Sales Index 10
Chart 4
Chart 5
0.18
0.23
0.28
0.33
0.38
0.43
0.48
0.6
0.7
0.8
0.9
1.0
1.1
Jun-14 Jun-15 Jun-16 Jun-17
Exchange rate USD/AUD (LHS)
Domestic (LHS)
International (RHS)
-10-8-6-4-202468
1012
Jun-14 Jun-15 Jun-16 Jun-17
Domestic (s.a.)
International (s.a.)
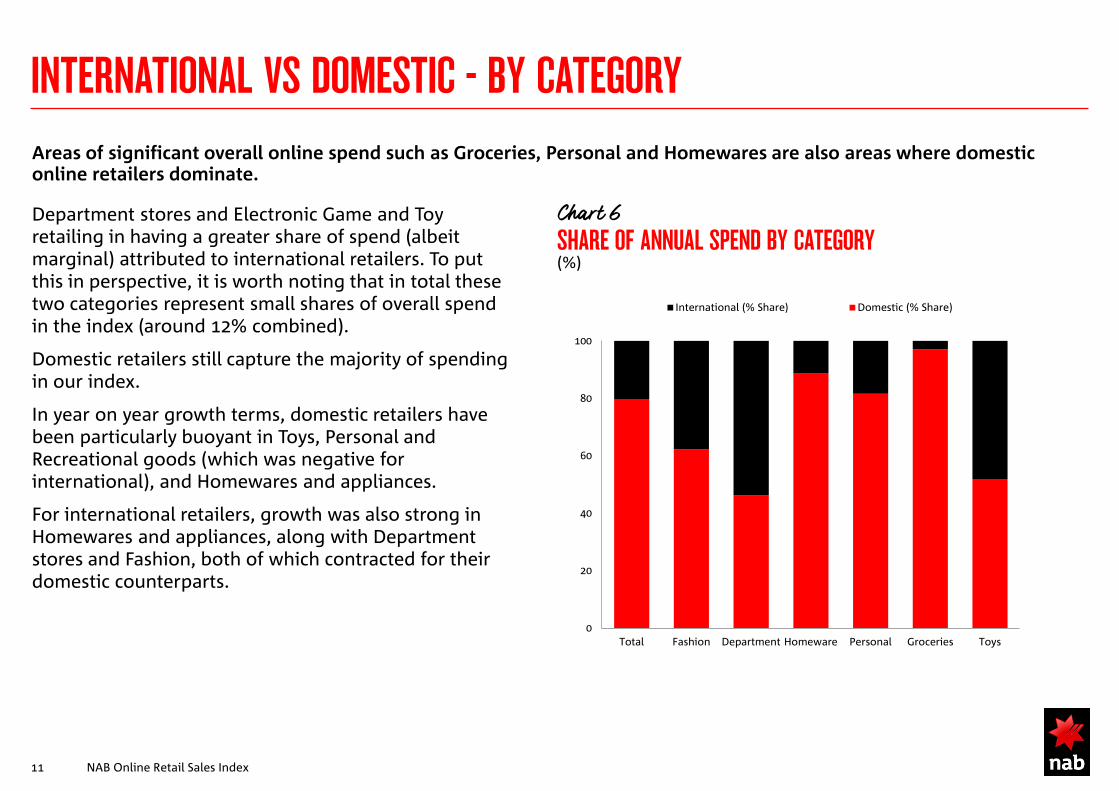
Areas of significant overall online spend such as Groceries, Personal and Homewares are also areas where domestic online retailers dominate.
Department stores and Electronic Game and Toy retailing in having a greater share of spend (albeit marginal) attributed to international retailers. To put this in perspective, it is worth noting that in total these two categories represent small shares of overall spend in the index (around 12% combined).
Domestic retailers still capture the majority of spending in our index.
In year on year growth terms, domestic retailers have been particularly buoyant in Toys, Personal and Recreational goods (which was negative for international), and Homewares and appliances.
For international retailers, growth was also strong in Homewares and appliances, along with Department stores and Fashion, both of which contracted for their domestic counterparts.
SHARE OF ANNUAL SPEND BY CATEGORY (%)
INTERNATIONAL VS DOMESTIC - BY CATEGORY
NAB Online Retail Sales Index 11
Chart 6
0
20
40
60
80
100
Total Fashion Department Homeware Personal Groceries Toys
International (% Share) Domestic (% Share)
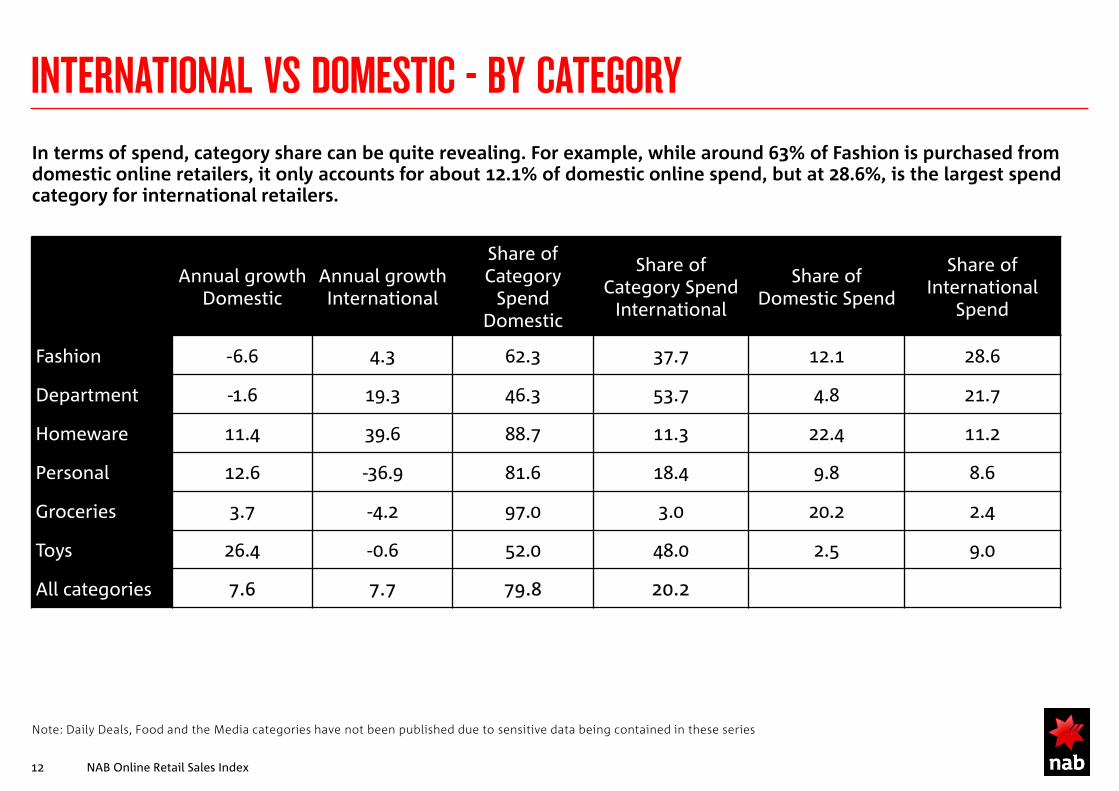
In terms of spend, category share can be quite revealing. For example, while around 63% of Fashion is purchased from domestic online retailers, it only accounts for about 12.1% of domestic online spend, but at 28.6%, is the largest spend category for international retailers.
Annual growth Domestic
Annual growth International
Share of Category
Spend Domestic
Share of Category Spend
International
Share of Domestic Spend
Share of International
Spend
Fashion -6.6 4.3 62.3 37.7 12.1 28.6
Department -1.6 19.3 46.3 53.7 4.8 21.7
Homeware 11.4 39.6 88.7 11.3 22.4 11.2
Personal 12.6 -36.9 81.6 18.4 9.8 8.6
Groceries 3.7 -4.2 97.0 3.0 20.2 2.4
Toys 26.4 -0.6 52.0 48.0 2.5 9.0
All categories 7.6 7.7 79.8 20.2
Note: Daily Deals, Food and the Media categories have not been published due to sensitive data being contained in these series
INTERNATIONAL VS DOMESTIC - BY CATEGORY
NAB Online Retail Sales Index 12
AGE GROUPS
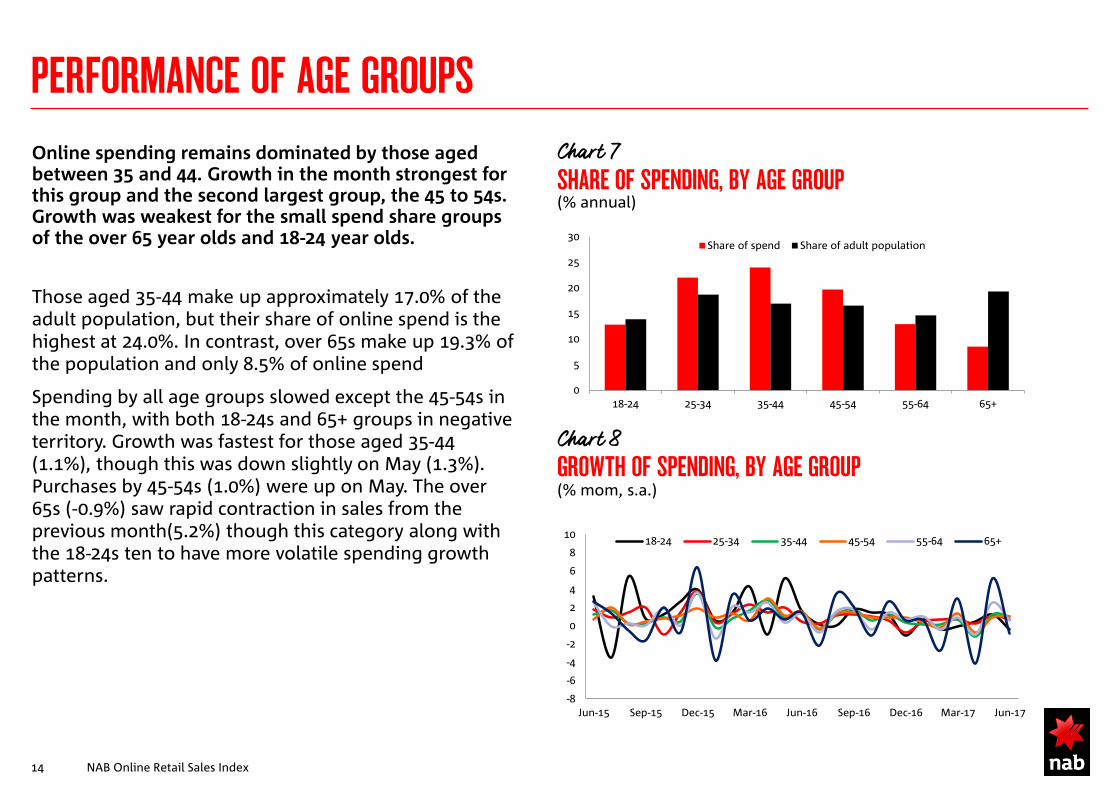
Online spending remains dominated by those aged between 35 and 44. Growth in the month strongest for this group and the second largest group, the 45 to 54s. Growth was weakest for the small spend share groups of the over 65 year olds and 18-24 year olds.
Those aged 35-44 make up approximately 17.0% of the adult population, but their share of online spend is the highest at 24.0%. In contrast, over 65s make up 19.3% of the population and only 8.5% of online spend
Spending by all age groups slowed except the 45-54s in the month, with both 18-24s and 65+ groups in negative territory. Growth was fastest for those aged 35-44 (1.1%), though this was down slightly on May (1.3%). Purchases by 45-54s (1.0%) were up on May. The over 65s (-0.9%) saw rapid contraction in sales from the previous month(5.2%) though this category along with the 18-24s ten to have more volatile spending growth patterns.
SHARE OF SPENDING, BY AGE GROUP (% annual)
GROWTH OF SPENDING, BY AGE GROUP (% mom, s.a.)
PERFORMANCE OF AGE GROUPS
NAB Online Retail Sales Index 14
Chart 7
Chart 8
0
5
10
15
20
25
30
18-24 25-34 35-44 45-54 55-64 65+
Share of spend Share of adult population
-8
-6
-4
-2
0
2
4
6
8
10
Jun-15 Sep-15 Dec-15 Mar-16 Jun-16 Sep-16 Dec-16 Mar-17 Jun-17
18-24 25-34 35-44 45-54 55-64 65+
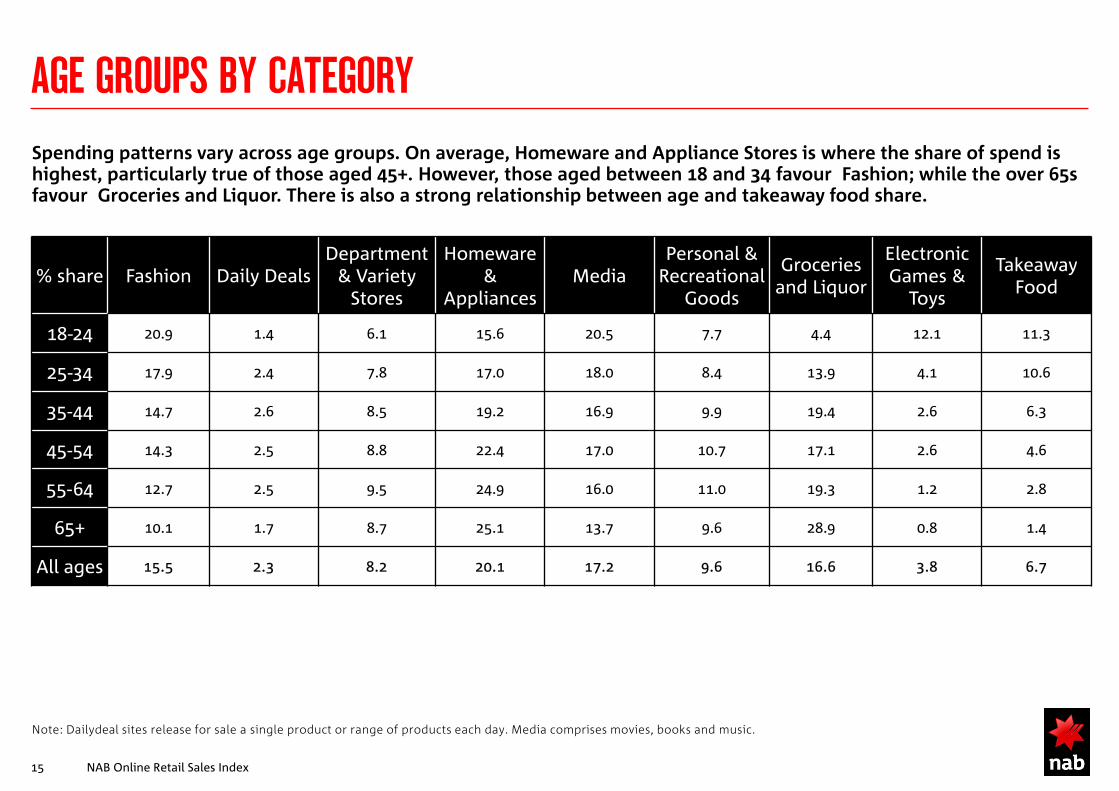
Spending patterns vary across age groups. On average, Homeware and Appliance Stores is where the share of spend is highest, particularly true of those aged 45+. However, those aged between 18 and 34 favour Fashion; while the over 65s favour Groceries and Liquor. There is also a strong relationship between age and takeaway food share.
% share Fashion Daily Deals Department
& Variety Stores
Homeware &
Appliances Media
Personal & Recreational
Goods
Groceries and Liquor
Electronic Games &
Toys
Takeaway Food
18-24 20.9 1.4 6.1 15.6 20.5 7.7 4.4 12.1 11.3
25-34 17.9 2.4 7.8 17.0 18.0 8.4 13.9 4.1 10.6
35-44 14.7 2.6 8.5 19.2 16.9 9.9 19.4 2.6 6.3
45-54 14.3 2.5 8.8 22.4 17.0 10.7 17.1 2.6 4.6
55-64 12.7 2.5 9.5 24.9 16.0 11.0 19.3 1.2 2.8
65+ 10.1 1.7 8.7 25.1 13.7 9.6 28.9 0.8 1.4
All ages 15.5 2.3 8.2 20.1 17.2 9.6 16.6 3.8 6.7
Note: Dailydeal sites release for sale a single product or range of products each day. Media comprises movies, books and music.
AGE GROUPS BY CATEGORY
NAB Online Retail Sales Index 15
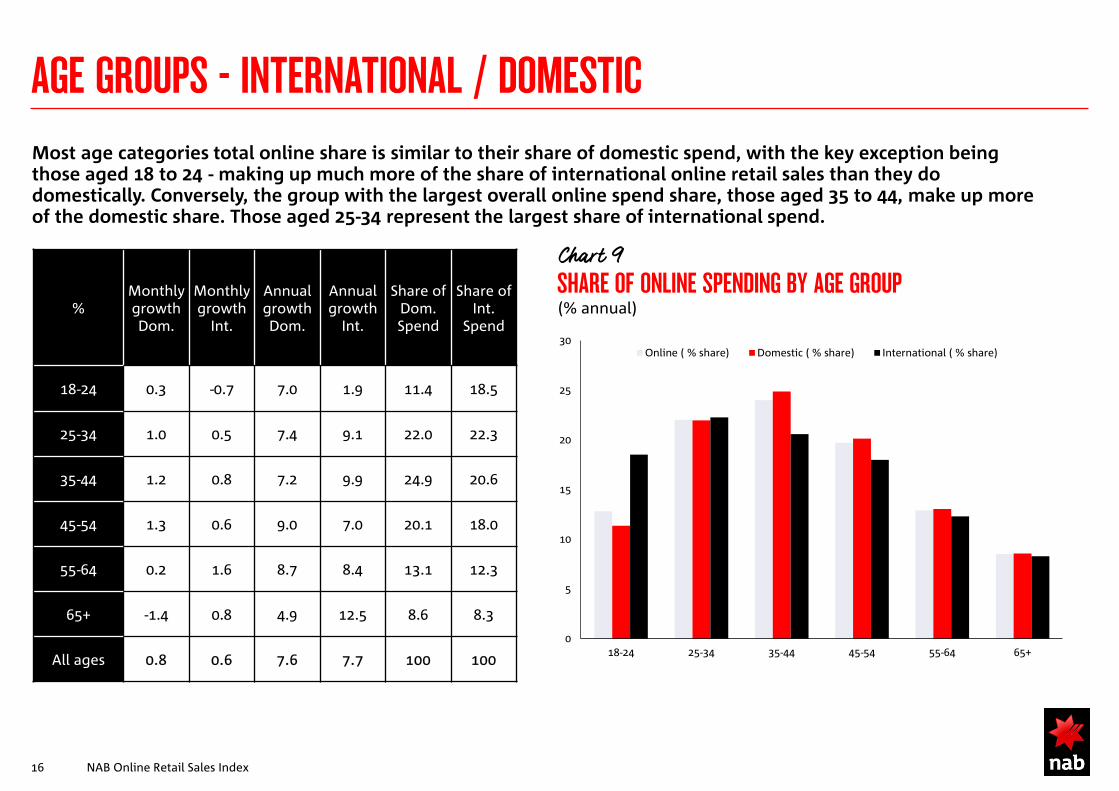
Most age categories total online share is similar to their share of domestic spend, with the key exception being those aged 18 to 24 - making up much more of the share of international online retail sales than they do domestically. Conversely, the group with the largest overall online spend share, those aged 35 to 44, make up more of the domestic share. Those aged 25-34 represent the largest share of international spend.
AGE GROUPS - INTERNATIONAL / DOMESTIC
NAB Online Retail Sales Index 16
SHARE OF ONLINE SPENDING BY AGE GROUP (% annual)
Chart 9
% Monthly growth Dom.
Monthly growth
Int.
Annual growth Dom.
Annual growth
Int.
Share of Dom. Spend
Share of Int.
Spend
18-24 0.3 -0.7 7.0 1.9 11.4 18.5
25-34 1.0 0.5 7.4 9.1 22.0 22.3
35-44 1.2 0.8 7.2 9.9 24.9 20.6
45-54 1.3 0.6 9.0 7.0 20.1 18.0
55-64 0.2 1.6 8.7 8.4 13.1 12.3
65+ -1.4 0.8 4.9 12.5 8.6 8.3
All ages 0.8 0.6 7.6 7.7 100 100
0
5
10
15
20
25
30
18-24 25-34 35-44 45-54 55-64 65+
Online ( % share) Domestic ( % share) International ( % share)

STATES AND TERRITORIES
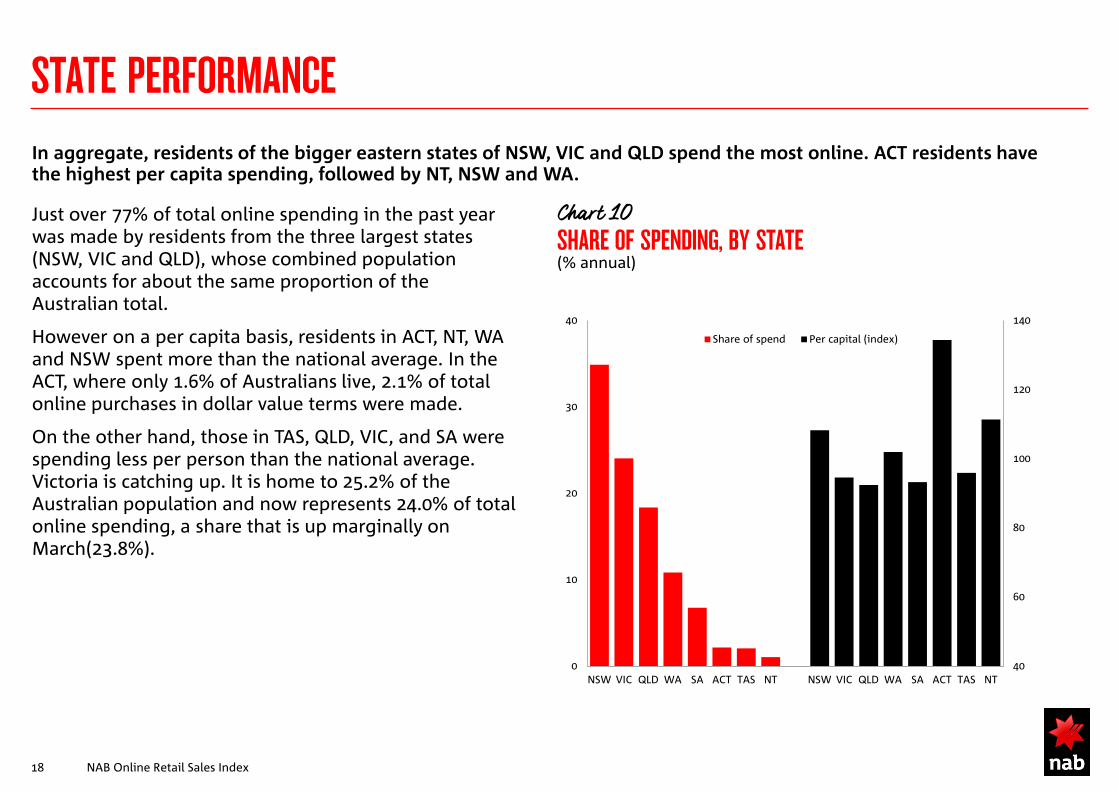
In aggregate, residents of the bigger eastern states of NSW, VIC and QLD spend the most online. ACT residents have the highest per capita spending, followed by NT, NSW and WA.
Just over 77% of total online spending in the past year was made by residents from the three largest states (NSW, VIC and QLD), whose combined population accounts for about the same proportion of the Australian total.
However on a per capita basis, residents in ACT, NT, WA and NSW spent more than the national average. In the ACT, where only 1.6% of Australians live, 2.1% of total online purchases in dollar value terms were made.
On the other hand, those in TAS, QLD, VIC, and SA were spending less per person than the national average. Victoria is catching up. It is home to 25.2% of the Australian population and now represents 24.0% of total online spending, a share that is up marginally on March(23.8%).
SHARE OF SPENDING, BY STATE (% annual)
STATE PERFORMANCE
NAB Online Retail Sales Index 18
Chart 10
40
60
80
100
120
140
0
10
20
30
40
NSW VIC QLD WA SA ACT TAS NT NSW VIC QLD WA SA ACT TAS NT
Share of spend Per capital (index)
GROWTH OF SPENDING, BY STATE (% yoy)
GROWTH OF SPENDING, BY STATE (% mom, s.a.)
SPENDING BY STATE
NAB Online Retail Sales Index 19
Chart 11 Chart 12
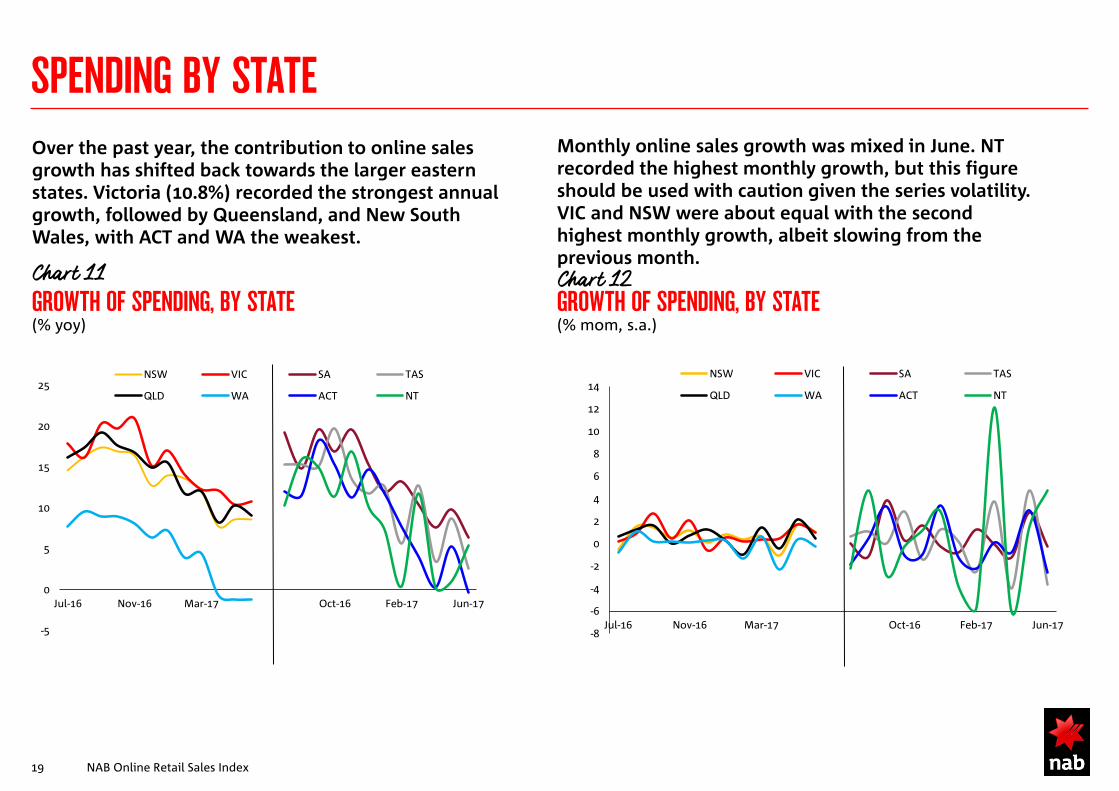
Over the past year, the contribution to online sales growth has shifted back towards the larger eastern states. Victoria (10.8%) recorded the strongest annual growth, followed by Queensland, and New South Wales, with ACT and WA the weakest.
Monthly online sales growth was mixed in June. NT recorded the highest monthly growth, but this figure should be used with caution given the series volatility. VIC and NSW were about equal with the second highest monthly growth, albeit slowing from the previous month.
-5
0
5
10
15
20
25
Jul-16 Nov-16 Mar-17 Oct-16 Feb-17 Jun-17
NSW VIC SA TAS
QLD WA ACT NT
-8
-6
-4
-2
0
2
4
6
8
10
12
14
Jul-16 Nov-16 Mar-17 Oct-16 Feb-17 Jun-17
NSW VIC SA TAS
QLD WA ACT NT

METROPOLITAN VS REGIONAL

Growth in Metro areas continued in June, albeit at a slower pace compared to May, while regional growth contracted slightly after rapid growth in May. Metropolitan residents bought 74% of online purchases in the past year and also spent more on average in most states, with the key exception of WA.
Growth in Metro areas (0.9%) remained positive in June, while online spend in Regional areas contracted slightly (-0.1%).
Metropolitan residents retain the largest share of spend, and spent on average around 17.3% more than those residing in regional Australia. However, those living in regional Western Australia spent about 5% more than the average Australian. With the slow down in the west, WA metropolitan residents are now about on par with the Australian average. With recent Victorian growth, the gap in metro spend of that state to the Australian average is closing.
Having said that, regional Victorian and regional Queensland residents remain below the national average.
GROWTH OF SPENDING, BY REGION (% mom)
PER CAPITA SPENDING INDEX (Australia = 100)
METROPOLITAN & REGIONAL PERFORMANCE
NAB Online Retail Sales Index 21
Chart 13
Chart 14
-10.0
-5.0
0.0
5.0
10.0
Jun-14 Jun-15 Jun-16 Jun-17
Metro (s.a.) Regional (s.a.)
80
90
100
110
120
NSW & ACT WA QLD VIC Other Australia
Metro (per capita) Regional (per capita)
SMALL ONLINE RETAILERS
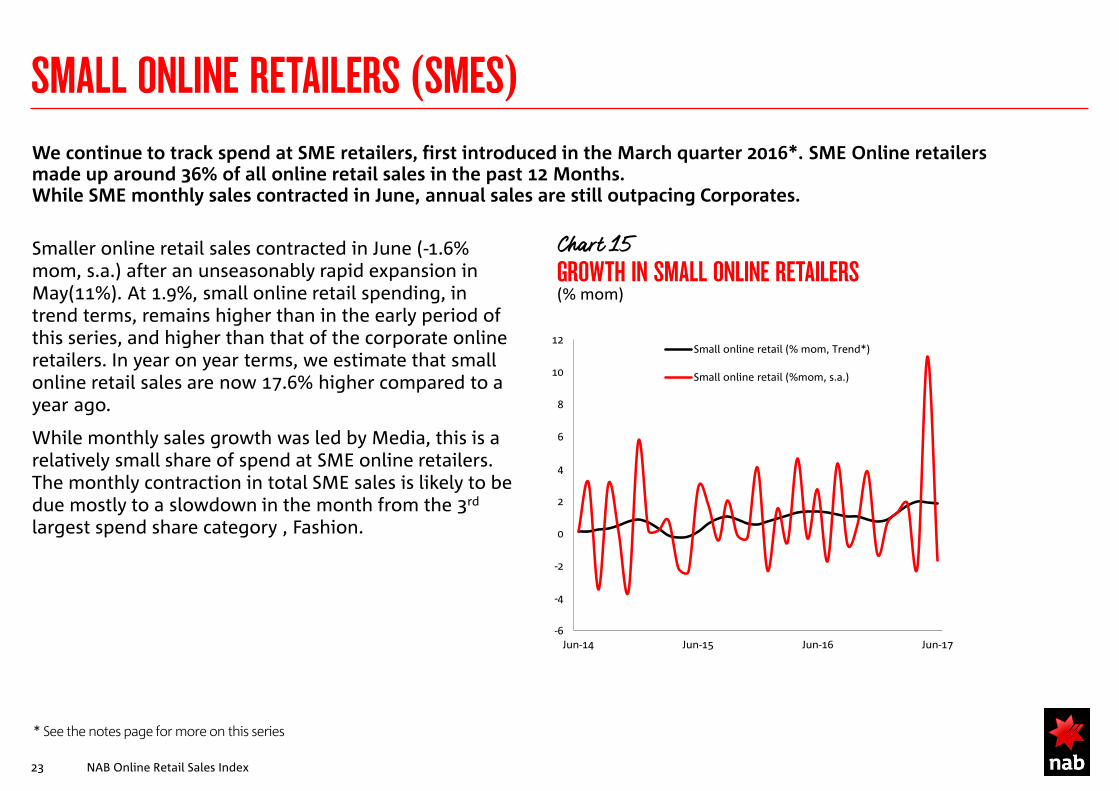
We continue to track spend at SME retailers, first introduced in the March quarter 2016*. SME Online retailers made up around 36% of all online retail sales in the past 12 Months. While SME monthly sales contracted in June, annual sales are still outpacing Corporates.
Smaller online retail sales contracted in June (-1.6% mom, s.a.) after an unseasonably rapid expansion in May(11%). At 1.9%, small online retail spending, in trend terms, remains higher than in the early period of this series, and higher than that of the corporate online retailers. In year on year terms, we estimate that small online retail sales are now 17.6% higher compared to a year ago.
While monthly sales growth was led by Media, this is a relatively small share of spend at SME online retailers. The monthly contraction in total SME sales is likely to be due mostly to a slowdown in the month from the 3rd largest spend share category , Fashion.
GROWTH IN SMALL ONLINE RETAILERS (% mom)
SMALL ONLINE RETAILERS (SMES)
NAB Online Retail Sales Index 23
Chart 15
* See the notes page for more on this series
-6
-4
-2
0
2
4
6
8
10
12
Jun-14 Jun-15 Jun-16 Jun-17
Small online retail (% mom, Trend*)
Small online retail (%mom, s.a.)

Small online retailers are overwhelmingly represented by Homeware and Appliances, Personal and Recreational, and Fashion (making up nearly 85% of spend). These categories have contributed the vast bulk of spend. While Homeware and Appliances represents 30.5% of spending at small online retailers, this category contributed 40.4% to small online retail sales growth.
% Monthly growth - May
Monthly growth – Jun
Annual growth – May
Annual growth – Jun
Share of Small spending
Contribution to annual Small spending growth
Fashion 20.0 -8.6 34.4 11.9 25.4 28.4
Daily Deals -28.9 -90.2 -86.1 -98.1 0.0 -0.2
Department 6.9 -0.2 24.6 24.5 3.2 3.7
Homeware 11.0 5.4 27.3 34.4 30.5 40.4
Media 4.3 7.4 5.0 11.2 3.1 0.2
Personal 4.9 -0.5 12.7 8.9 28.8 23.0
Groceries 5.4 4.3 3.3 5.8 3.7 -0.3
Toys 2.6 -3.2 6.5 -1.1 3.7 1.8
Food 9.9 0.2 24.8 15.1 1.7 3.0
Total 11.0 -1.6 22.2 17.6 100 100
SMALL ONLINE RETAILERS BY CATEGORY
NAB Online Retail Sales Index 24
What’s NORSI Corporate and NORSI SMEs? NORSI Corporate are major online retailers with more than $2.5M annual online revenue while Online SMEs are smaller brands and retailers with annual online revenue less than $2.5M. What’s the improvement brought by the inclusion of NORSI SMEs? With NORSI SMEs supplementing NORSI Corporate, revised NORSI will be more representative of the online market, providing a more comprehensive valuation of the market which takes into account the differential growth of major online players and smaller brands. What’s the effect in the category distribution? Online Marketplaces, which was classified as part of Department and Variety Store, serve as a platform for consumers to purchase goods from a collection of small retailers. Under the revised NORSI definition, Online Marketplaces have been disaggregated into its small retail components, thereby becoming part of NORSI SMEs. Such reclassification has resulted in the reduction of Department and Variety Store’s share of total spend and Homewares and Appliances has become the largest category. Note: Expanding coverage to include food and smaller online retailers has caused seasonal adjustment factor constraints. In addition, the series has a shorter history. Accordingly, as an interim measure, we are using the seasonally adjusted NORSI Corporate series as a proxy for the total online index What’s the effect of new payment methods on category distribution? The impact of some recent payment methods is masking the ability to track spend at retailers. These new payment options are particularly popular at Fashion retailers. How do we define Domestic and International? NORSI defines retailers that do not charge GST as international retailers
NOTES
NAB Online Retail Sales Index 25

Please click here to view our disclaimer and terms of use.
TO DISCUSS THIS REPORT IN MORE DETAIL PLEASE SPEAK WITH YOUR NAB RELATIONSHIP MANAGER
ALAN OSTER RICHARD COATH WADE TUBMAN Group Chief Economist Group Economics National Australia Bank +61 (0) 3 8634 2927 [email protected]
General Manager, Consumer, Health, Agri & TMI Global Institutional Banking National Australia Bank +61 (0) 3 8641 2918 [email protected]
Group Executive Quantium +61 (0) 2 9292 6400 [email protected]
ABOUT QUANTIUM Quantium is Australia’s leading data analytics and marketing strategy firm. Quantium has worked with NAB for more than six years, assessing de-identified transaction data to derive insights, trends and shopping habits of different customer groups. The resulting analysis forms Market Blueprint and is used by NAB and other businesses to drive innovation and business performance through customer, distribution and marketing strategies.
IMPORTANT NOTICE This document has been prepared by National Australia Bank Limited ABN 12 004 044 937 AFSL 230686 (“NAB”). Any advice contained in this document has been prepared without taking into account your objectives, financial situation or needs. Before acting on any advice in this document, NAB recommends that you consider whether the advice is appropriate for your circumstances. NAB recommends that you obtain and consider the relevant Product Disclosure Statement or other disclosure document, before making any decision about a product including whether to acquire or to continue to hold it.
Visit nab.com.au/onlineretailsales or contact:
www.quantium.com.au