Embed Size (px)
Citation preview
N5402A Automotive Serial Data Analysis Software for Infiniium 8000 Series Oscilloscopes
Data Sheet
2
• Protocol decode of the CAN and FlexRay serial buses
• Extensive search capability of CAN and FlexRay frames
• FlexRay jitter and eye-diagram measurements with automatic mask testing
• FlexRay mask failure analysis using eye unfolding
The event-driven CAN (Controller
Area Network) serial bus has become
the backbone for communication
among many separate controllers,
sensors, actuators, and ECUs located
throughout automotive and industrial
designs. The time-triggered FlexRay
serial bus is gaining rapid adoption for
more safety-critical and drive-by-wire
applications where higher baud rates
and a deterministic architecture are
required.
Software engineers typically use
dedicated protocol analyzers for
higher-level abstract observation of
the data layer information of these
Features
buses – but without seeing the
physical/signal layer characteristics.
Hardware engineers often use
traditional oscilloscopes to view
the physical layer characteristics of
automotive serial bus signals, but
without being able to easily decipher
protocol level information.
The Agilent Technologies N5402A
Automotive Serial Data Analysis
software allows engineers to view
both the protocol layer information and
physical layer signal characteristics
inside a single instrument – the
Infiniium oscilloscope.
3
The N5402A’s Automotive analysis
software package extends Infiniium’s
ease-of-use advantages to serial
data analysis. The dialog box makes
the setup process to perform CAN
and FlexRay serial decode easy. CAN
analysis supports CAN 2.0A and
CAN 2.0B compliant messages with
user-selectable standard data rates
from 10 kHz to 1 MHz. In addition, CAN
analysis supports single-ended probing
CAN and FlexRay protocol decode analysis
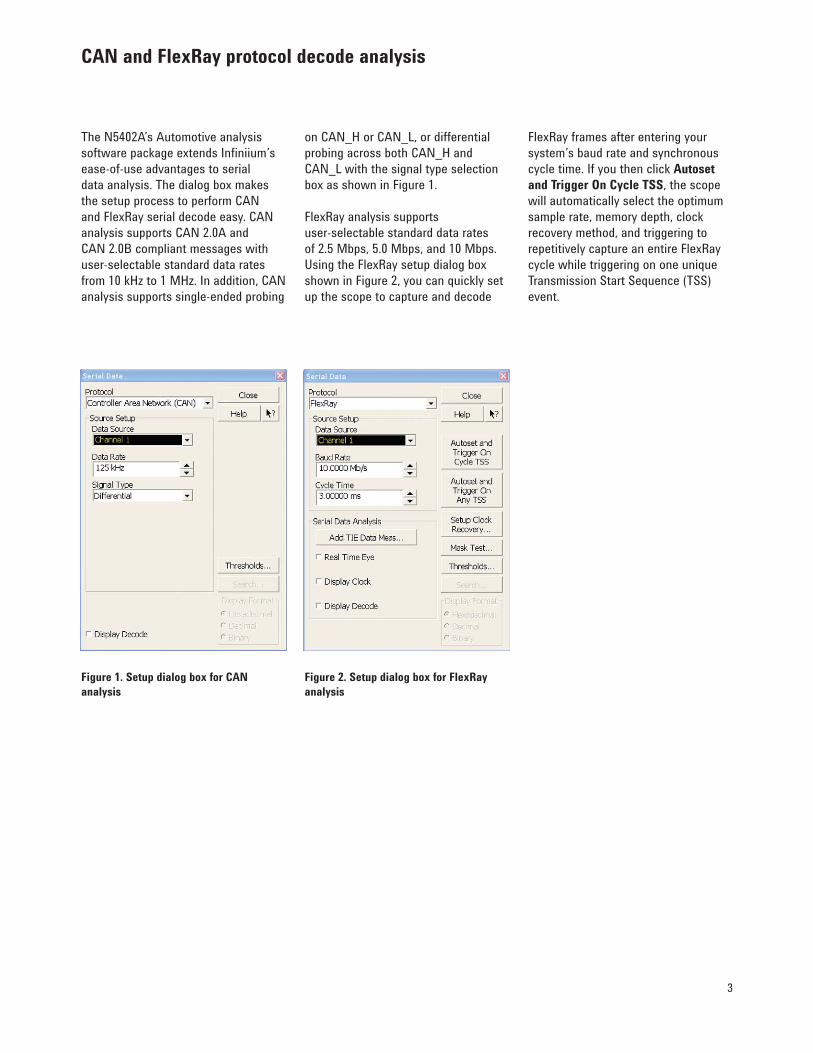
on CAN_H or CAN_L, or differential
probing across both CAN_H and
CAN_L with the signal type selection
box as shown in Figure 1.
FlexRay analysis supports
user-selectable standard data rates
of 2.5 Mbps, 5.0 Mbps, and 10 Mbps.
Using the FlexRay setup dialog box
shown in Figure 2, you can quickly set
up the scope to capture and decode
FlexRay frames after entering your
system’s baud rate and synchronous
cycle time. If you then click Autoset
and Trigger On Cycle TSS, the scope
will automatically select the optimum
sample rate, memory depth, clock
recovery method, and triggering to
repetitively capture an entire FlexRay
cycle while triggering on one unique
Transmission Start Sequence (TSS)
event.
Figure 1. Setup dialog box for CAN
analysis
Figure 2. Setup dialog box for FlexRay
analysis
4
CAN and FlexRay decode analysis
features a time-correlated decode
trace with tic marks, as well as a
listing window view with automatic
click and zoom capability. When either
CAN or FlexRay decode analysis
has been turned on, a sliding tab is
available to either show or hide a
protocol decode list of all frames that
have been captured in an acquisition
including the index number and time
stamp value of each frame. For CAN
signals, the window also shows the
Data/Remote/Error frame type, ID,
and data content of each CAN packet
in the list. For FlexRay signals, the
window shows the frame ID, cycle
number, and the payload.
Listing window with automatic click and zoom
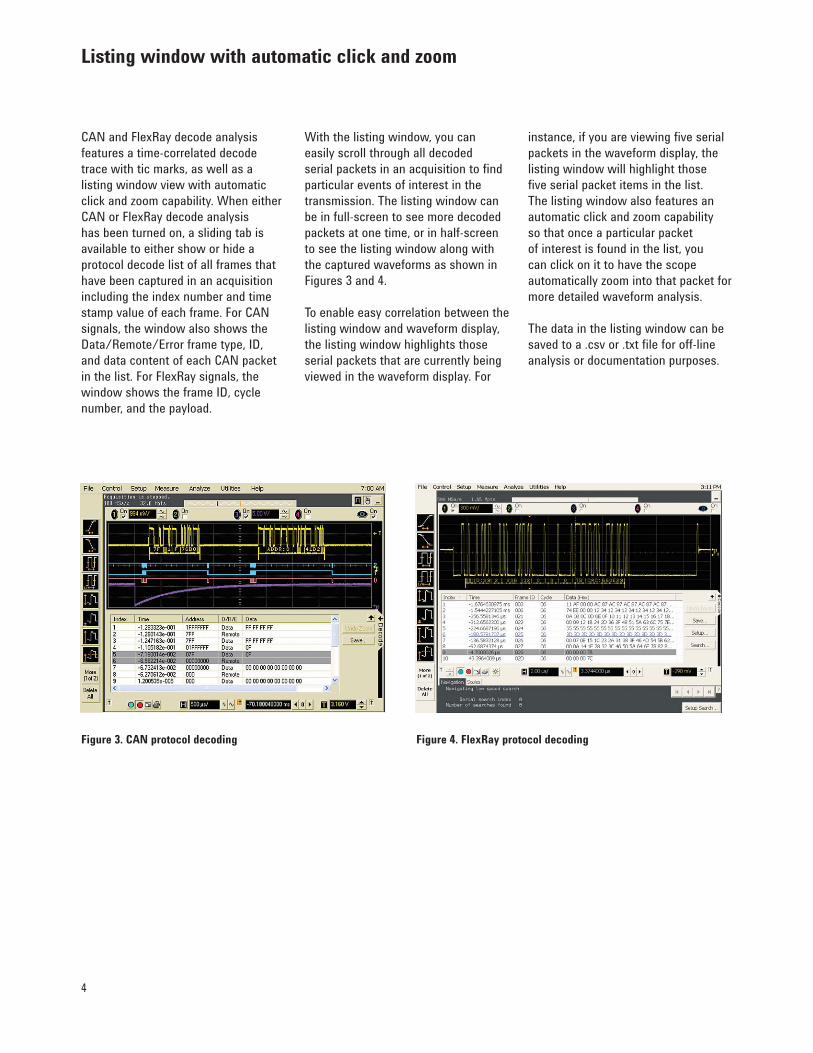
With the listing window, you can
easily scroll through all decoded
serial packets in an acquisition to find
particular events of interest in the
transmission. The listing window can
be in full-screen to see more decoded
packets at one time, or in half-screen
to see the listing window along with
the captured waveforms as shown in
Figures 3 and 4.
To enable easy correlation between the
listing window and waveform display,
the listing window highlights those
serial packets that are currently being
viewed in the waveform display. For
instance, if you are viewing five serial
packets in the waveform display, the
listing window will highlight those
five serial packet items in the list.
The listing window also features an
automatic click and zoom capability
so that once a particular packet
of interest is found in the list, you
can click on it to have the scope
automatically zoom into that packet for
more detailed waveform analysis.
The data in the listing window can be
saved to a .csv or .txt file for off-line
analysis or documentation purposes.
Figure 3. CAN protocol decoding Figure 4. FlexRay protocol decoding
5
Eye-diagram measurements have
traditionally been performed on
oscilloscopes by triggering on
an explicit clock signal while
accumulating multiple/repetitive
overlaid waveforms (infinite
persistence) of a data signal. However,
many of today’s serial buses, such
as FlexRay, are based on signals
with embedded clocks (non-explicit).
Creating eye-diagram displays on these
types of serial buses requires that the
scope be able to extract and recover
the clock from real-time acquisitions
of the signal. The recovered clock is
then used to “slice” the waveform into
multiple bit segments (Unit Intervals)
that are then overlaid – or folded – into
an eye-diagram display.
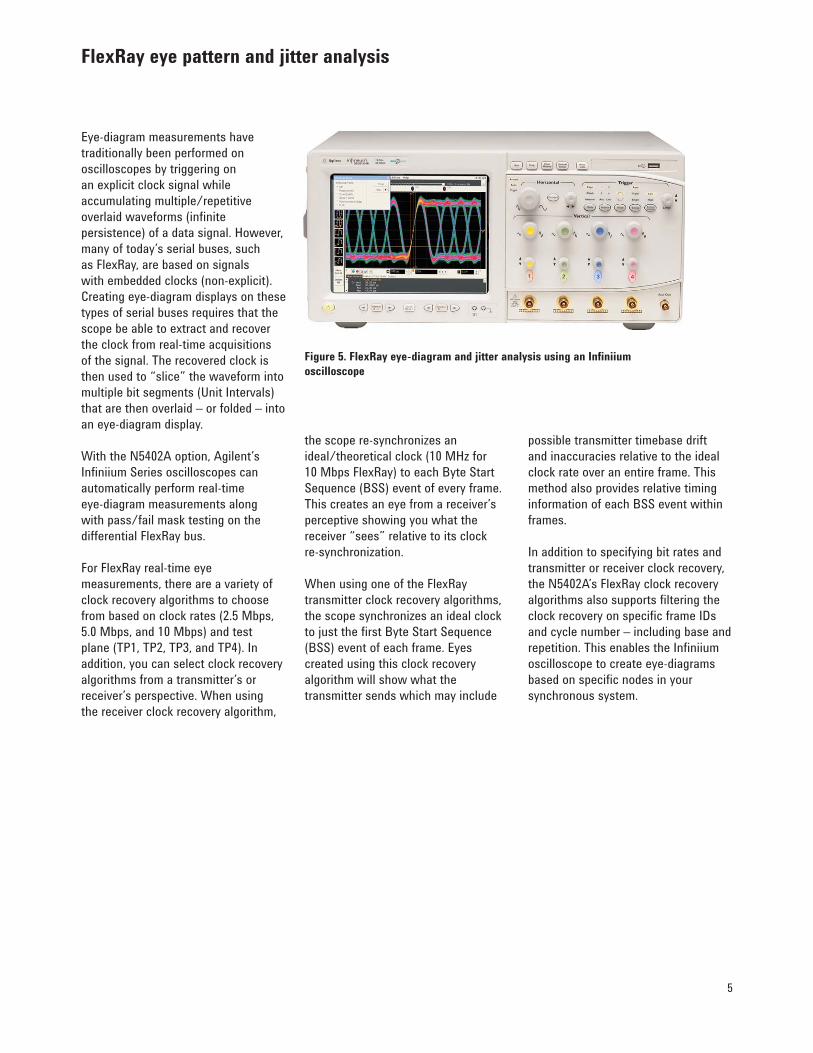
With the N5402A option, Agilent’s
Infiniium Series oscilloscopes can
automatically perform real-time
eye-diagram measurements along
with pass/fail mask testing on the
differential FlexRay bus.
For FlexRay real-time eye
measurements, there are a variety of
clock recovery algorithms to choose
from based on clock rates (2.5 Mbps,
5.0 Mbps, and 10 Mbps) and test
plane (TP1, TP2, TP3, and TP4). In
addition, you can select clock recovery
algorithms from a transmitter’s or
receiver’s perspective. When using
the receiver clock recovery algorithm,
FlexRay eye pattern and jitter analysis
the scope re-synchronizes an
ideal/theoretical clock (10 MHz for
10 Mbps FlexRay) to each Byte Start
Sequence (BSS) event of every frame.
This creates an eye from a receiver’s
perceptive showing you what the
receiver “sees” relative to its clock
re-synchronization.
When using one of the FlexRay
transmitter clock recovery algorithms,
the scope synchronizes an ideal clock
to just the first Byte Start Sequence
(BSS) event of each frame. Eyes
created using this clock recovery
algorithm will show what the
transmitter sends which may include
possible transmitter timebase drift
and inaccuracies relative to the ideal
clock rate over an entire frame. This
method also provides relative timing
information of each BSS event within
frames.
In addition to specifying bit rates and
transmitter or receiver clock recovery,
the N5402A’s FlexRay clock recovery
algorithms also supports filtering the
clock recovery on specific frame IDs
and cycle number – including base and
repetition. This enables the Infiniium
oscilloscope to create eye-diagrams
based on specific nodes in your
synchronous system.
Figure 5. FlexRay eye-diagram and jitter analysis using an Infiniium
oscilloscope
6
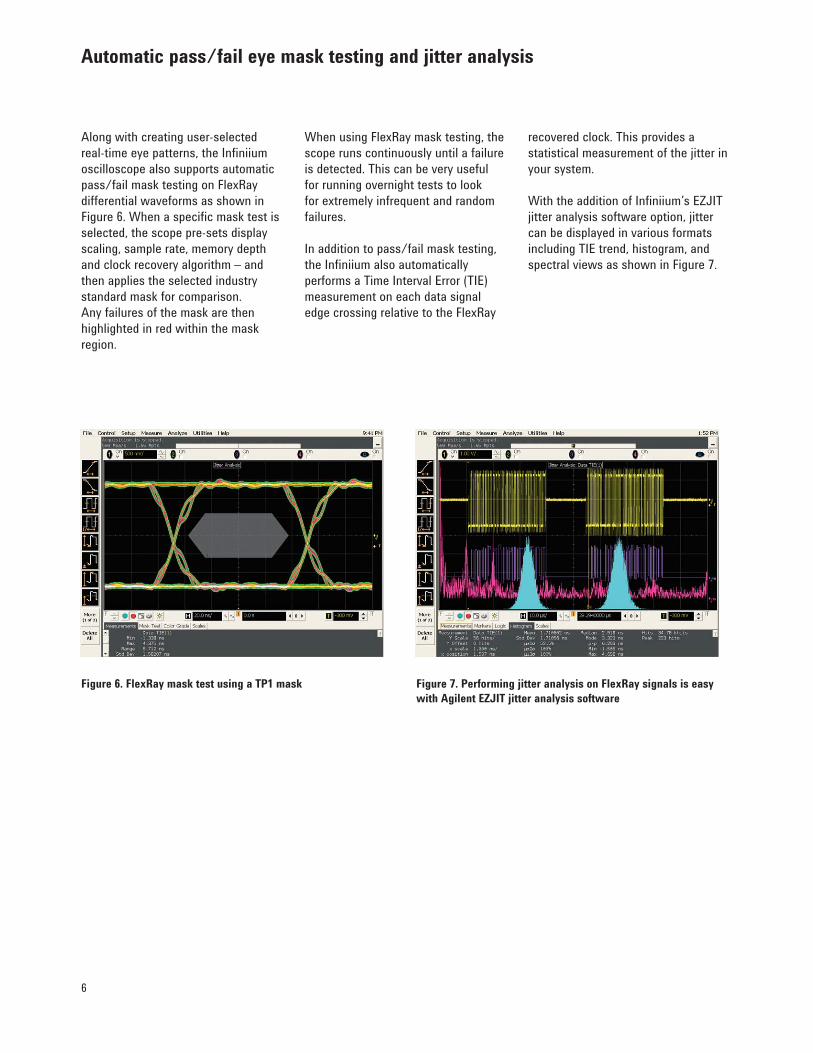
Along with creating user-selected
real-time eye patterns, the Infiniium
oscilloscope also supports automatic
pass/fail mask testing on FlexRay
differential waveforms as shown in
Figure 6. When a specific mask test is
selected, the scope pre-sets display
scaling, sample rate, memory depth
and clock recovery algorithm – and
then applies the selected industry
standard mask for comparison.
Any failures of the mask are then
highlighted in red within the mask
region.
Automatic pass/fail eye mask testing and jitter analysis
Figure 6. FlexRay mask test using a TP1 mask Figure 7. Performing jitter analysis on FlexRay signals is easy
with Agilent EZJIT jitter analysis software
When using FlexRay mask testing, the
scope runs continuously until a failure
is detected. This can be very useful
for running overnight tests to look
for extremely infrequent and random
failures.
In addition to pass/fail mask testing,
the Infiniium also automatically
performs a Time Interval Error (TIE)
measurement on each data signal
edge crossing relative to the FlexRay
recovered clock. This provides a
statistical measurement of the jitter in
your system.
With the addition of Infiniium’s EZJIT
jitter analysis software option, jitter
can be displayed in various formats
including TIE trend, histogram, and
spectral views as shown in Figure 7.
7
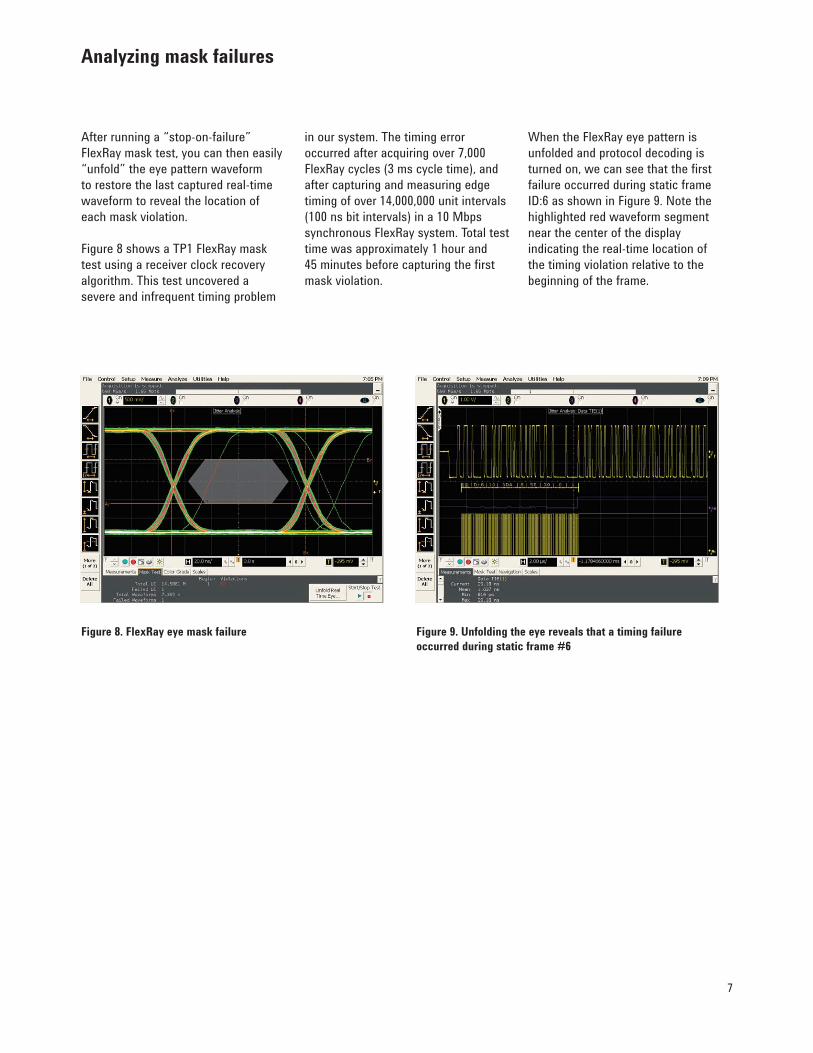
After running a “stop-on-failure”
FlexRay mask test, you can then easily
“unfold” the eye pattern waveform
to restore the last captured real-time
waveform to reveal the location of
each mask violation.
Figure 8 shows a TP1 FlexRay mask
test using a receiver clock recovery
algorithm. This test uncovered a
severe and infrequent timing problem
Analyzing mask failures
in our system. The timing error
occurred after acquiring over 7,000
FlexRay cycles (3 ms cycle time), and
after capturing and measuring edge
timing of over 14,000,000 unit intervals
(100 ns bit intervals) in a 10 Mbps
synchronous FlexRay system. Total test
time was approximately 1 hour and
45 minutes before capturing the first
mask violation.
When the FlexRay eye pattern is
unfolded and protocol decoding is
turned on, we can see that the first
failure occurred during static frame
ID:6 as shown in Figure 9. Note the
highlighted red waveform segment
near the center of the display
indicating the real-time location of
the timing violation relative to the
beginning of the frame.
Figure 8. FlexRay eye mask failure Figure 9. Unfolding the eye reveals that a timing failure
occurred during static frame #6
8
Analyzing mask failures
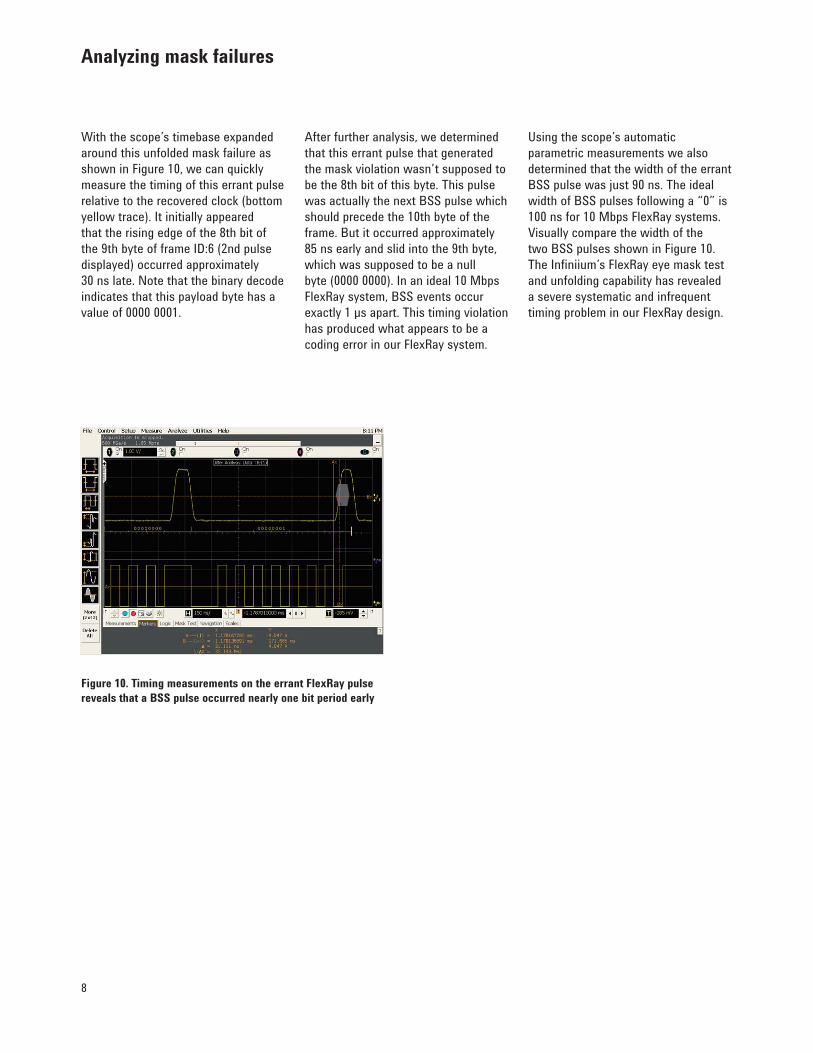
With the scope’s timebase expanded
around this unfolded mask failure as
shown in Figure 10, we can quickly
measure the timing of this errant pulse
relative to the recovered clock (bottom
yellow trace). It initially appeared
that the rising edge of the 8th bit of
the 9th byte of frame ID:6 (2nd pulse
displayed) occurred approximately
30 ns late. Note that the binary decode
indicates that this payload byte has a
value of 0000 0001.
Figure 10. Timing measurements on the errant FlexRay pulse
reveals that a BSS pulse occurred nearly one bit period early
After further analysis, we determined
that this errant pulse that generated
the mask violation wasn’t supposed to
be the 8th bit of this byte. This pulse
was actually the next BSS pulse which
should precede the 10th byte of the
frame. But it occurred approximately
85 ns early and slid into the 9th byte,
which was supposed to be a null
byte (0000 0000). In an ideal 10 Mbps
FlexRay system, BSS events occur
exactly 1 µs apart. This timing violation
has produced what appears to be a
coding error in our FlexRay system.
Using the scope’s automatic
parametric measurements we also
determined that the width of the errant
BSS pulse was just 90 ns. The ideal
width of BSS pulses following a “0” is
100 ns for 10 Mbps FlexRay systems.
Visually compare the width of the
two BSS pulses shown in Figure 10.
The Infiniium’s FlexRay eye mask test
and unfolding capability has revealed
a severe systematic and infrequent
timing problem in our FlexRay design.
9
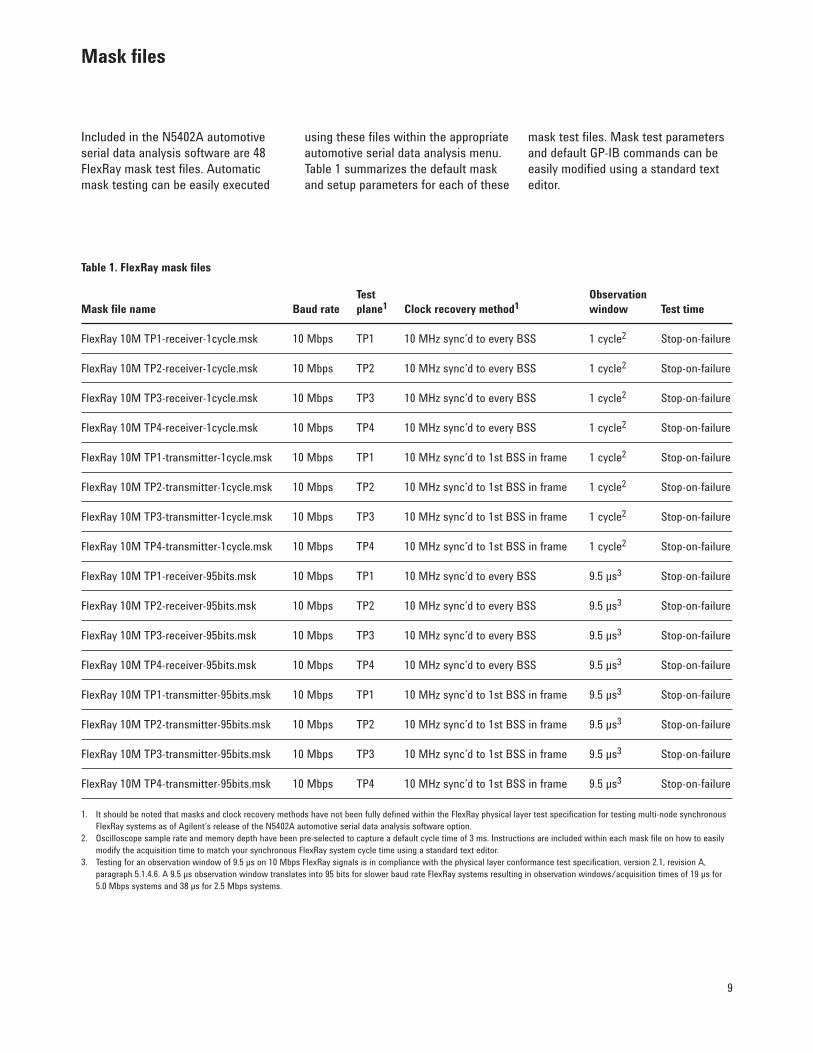
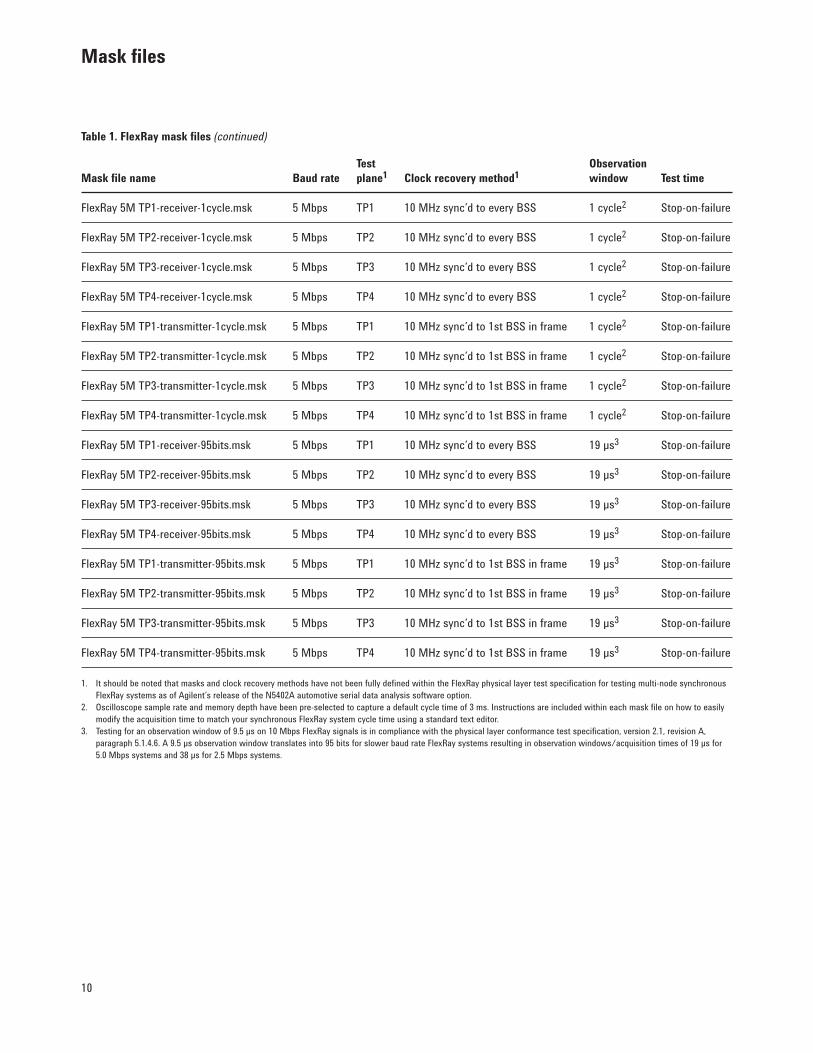
Included in the N5402A automotive
serial data analysis software are 48
FlexRay mask test files. Automatic
mask testing can be easily executed
Mask files
using these files within the appropriate
automotive serial data analysis menu.
Table 1 summarizes the default mask
and setup parameters for each of these
mask test files. Mask test parameters
and default GP-IB commands can be
easily modified using a standard text
editor.
Table 1. FlexRay mask files
Mask file name Baud rate
Test
plane1 Clock recovery method1Observation
window Test time
FlexRay 10M TP1-receiver-1cycle.msk 10 Mbps TP1 10 MHz sync’d to every BSS 1 cycle2 Stop-on-failure
FlexRay 10M TP2-receiver-1cycle.msk 10 Mbps TP2 10 MHz sync’d to every BSS 1 cycle2 Stop-on-failure
FlexRay 10M TP3-receiver-1cycle.msk 10 Mbps TP3 10 MHz sync’d to every BSS 1 cycle2 Stop-on-failure
FlexRay 10M TP4-receiver-1cycle.msk 10 Mbps TP4 10 MHz sync’d to every BSS 1 cycle2 Stop-on-failure
FlexRay 10M TP1-transmitter-1cycle.msk 10 Mbps TP1 10 MHz sync’d to 1st BSS in frame 1 cycle2 Stop-on-failure
FlexRay 10M TP2-transmitter-1cycle.msk 10 Mbps TP2 10 MHz sync’d to 1st BSS in frame 1 cycle2 Stop-on-failure
FlexRay 10M TP3-transmitter-1cycle.msk 10 Mbps TP3 10 MHz sync’d to 1st BSS in frame 1 cycle2 Stop-on-failure
FlexRay 10M TP4-transmitter-1cycle.msk 10 Mbps TP4 10 MHz sync’d to 1st BSS in frame 1 cycle2 Stop-on-failure
FlexRay 10M TP1-receiver-95bits.msk 10 Mbps TP1 10 MHz sync’d to every BSS 9.5 µs3 Stop-on-failure
FlexRay 10M TP2-receiver-95bits.msk 10 Mbps TP2 10 MHz sync’d to every BSS 9.5 µs3 Stop-on-failure
FlexRay 10M TP3-receiver-95bits.msk 10 Mbps TP3 10 MHz sync’d to every BSS 9.5 µs3 Stop-on-failure
FlexRay 10M TP4-receiver-95bits.msk 10 Mbps TP4 10 MHz sync’d to every BSS 9.5 µs3 Stop-on-failure
FlexRay 10M TP1-transmitter-95bits.msk 10 Mbps TP1 10 MHz sync’d to 1st BSS in frame 9.5 µs3 Stop-on-failure
FlexRay 10M TP2-transmitter-95bits.msk 10 Mbps TP2 10 MHz sync’d to 1st BSS in frame 9.5 µs3 Stop-on-failure
FlexRay 10M TP3-transmitter-95bits.msk 10 Mbps TP3 10 MHz sync’d to 1st BSS in frame 9.5 µs3 Stop-on-failure
FlexRay 10M TP4-transmitter-95bits.msk 10 Mbps TP4 10 MHz sync’d to 1st BSS in frame 9.5 µs3 Stop-on-failure
1. It should be noted that masks and clock recovery methods have not been fully defined within the FlexRay physical layer test specification for testing multi-node synchronous
FlexRay systems as of Agilent’s release of the N5402A automotive serial data analysis software option.
2. Oscilloscope sample rate and memory depth have been pre-selected to capture a default cycle time of 3 ms. Instructions are included within each mask file on how to easily
modify the acquisition time to match your synchronous FlexRay system cycle time using a standard text editor.
3. Testing for an observation window of 9.5 µs on 10 Mbps FlexRay signals is in compliance with the physical layer conformance test specification, version 2.1, revision A,
paragraph 5.1.4.6. A 9.5 µs observation window translates into 95 bits for slower baud rate FlexRay systems resulting in observation windows/acquisition times of 19 µs for
5.0 Mbps systems and 38 µs for 2.5 Mbps systems.
10
Table 1. FlexRay mask files (continued)
Mask file name Baud rate
Test
plane1 Clock recovery method1Observation
window Test time
FlexRay 5M TP1-receiver-1cycle.msk 5 Mbps TP1 10 MHz sync’d to every BSS 1 cycle2 Stop-on-failure
FlexRay 5M TP2-receiver-1cycle.msk 5 Mbps TP2 10 MHz sync’d to every BSS 1 cycle2 Stop-on-failure
FlexRay 5M TP3-receiver-1cycle.msk 5 Mbps TP3 10 MHz sync’d to every BSS 1 cycle2 Stop-on-failure
FlexRay 5M TP4-receiver-1cycle.msk 5 Mbps TP4 10 MHz sync’d to every BSS 1 cycle2 Stop-on-failure
FlexRay 5M TP1-transmitter-1cycle.msk 5 Mbps TP1 10 MHz sync’d to 1st BSS in frame 1 cycle2 Stop-on-failure
FlexRay 5M TP2-transmitter-1cycle.msk 5 Mbps TP2 10 MHz sync’d to 1st BSS in frame 1 cycle2 Stop-on-failure
FlexRay 5M TP3-transmitter-1cycle.msk 5 Mbps TP3 10 MHz sync’d to 1st BSS in frame 1 cycle2 Stop-on-failure
FlexRay 5M TP4-transmitter-1cycle.msk 5 Mbps TP4 10 MHz sync’d to 1st BSS in frame 1 cycle2 Stop-on-failure
FlexRay 5M TP1-receiver-95bits.msk 5 Mbps TP1 10 MHz sync’d to every BSS 19 µs3 Stop-on-failure
FlexRay 5M TP2-receiver-95bits.msk 5 Mbps TP2 10 MHz sync’d to every BSS 19 µs3 Stop-on-failure
FlexRay 5M TP3-receiver-95bits.msk 5 Mbps TP3 10 MHz sync’d to every BSS 19 µs3 Stop-on-failure
FlexRay 5M TP4-receiver-95bits.msk 5 Mbps TP4 10 MHz sync’d to every BSS 19 µs3 Stop-on-failure
FlexRay 5M TP1-transmitter-95bits.msk 5 Mbps TP1 10 MHz sync’d to 1st BSS in frame 19 µs3 Stop-on-failure
FlexRay 5M TP2-transmitter-95bits.msk 5 Mbps TP2 10 MHz sync’d to 1st BSS in frame 19 µs3 Stop-on-failure
FlexRay 5M TP3-transmitter-95bits.msk 5 Mbps TP3 10 MHz sync’d to 1st BSS in frame 19 µs3 Stop-on-failure
FlexRay 5M TP4-transmitter-95bits.msk 5 Mbps TP4 10 MHz sync’d to 1st BSS in frame 19 µs3 Stop-on-failure
1. It should be noted that masks and clock recovery methods have not been fully defined within the FlexRay physical layer test specification for testing multi-node synchronous
FlexRay systems as of Agilent’s release of the N5402A automotive serial data analysis software option.
2. Oscilloscope sample rate and memory depth have been pre-selected to capture a default cycle time of 3 ms. Instructions are included within each mask file on how to easily
modify the acquisition time to match your synchronous FlexRay system cycle time using a standard text editor.
3. Testing for an observation window of 9.5 µs on 10 Mbps FlexRay signals is in compliance with the physical layer conformance test specification, version 2.1, revision A,
paragraph 5.1.4.6. A 9.5 µs observation window translates into 95 bits for slower baud rate FlexRay systems resulting in observation windows/acquisition times of 19 µs for
5.0 Mbps systems and 38 µs for 2.5 Mbps systems.
Mask files
11
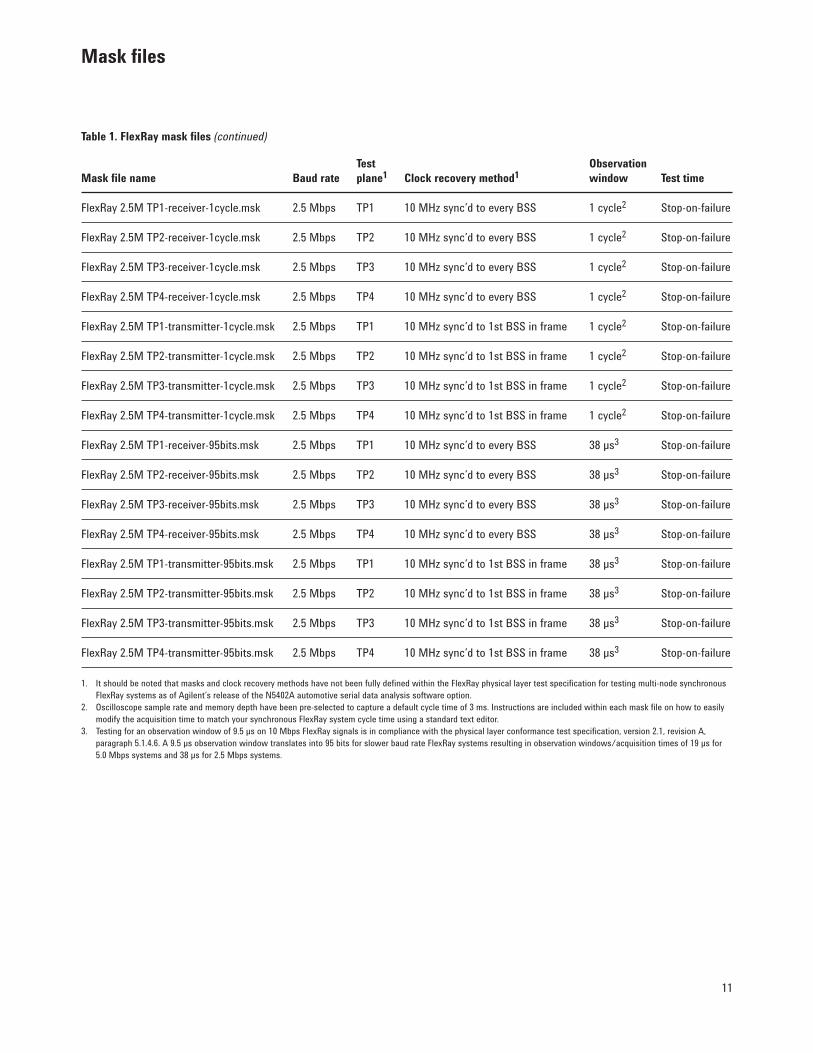
Table 1. FlexRay mask files (continued)
Mask file name Baud rate
Test
plane1 Clock recovery method1Observation
window Test time
FlexRay 2.5M TP1-receiver-1cycle.msk 2.5 Mbps TP1 10 MHz sync’d to every BSS 1 cycle2 Stop-on-failure
FlexRay 2.5M TP2-receiver-1cycle.msk 2.5 Mbps TP2 10 MHz sync’d to every BSS 1 cycle2 Stop-on-failure
FlexRay 2.5M TP3-receiver-1cycle.msk 2.5 Mbps TP3 10 MHz sync’d to every BSS 1 cycle2 Stop-on-failure
FlexRay 2.5M TP4-receiver-1cycle.msk 2.5 Mbps TP4 10 MHz sync’d to every BSS 1 cycle2 Stop-on-failure
FlexRay 2.5M TP1-transmitter-1cycle.msk 2.5 Mbps TP1 10 MHz sync’d to 1st BSS in frame 1 cycle2 Stop-on-failure
FlexRay 2.5M TP2-transmitter-1cycle.msk 2.5 Mbps TP2 10 MHz sync’d to 1st BSS in frame 1 cycle2 Stop-on-failure
FlexRay 2.5M TP3-transmitter-1cycle.msk 2.5 Mbps TP3 10 MHz sync’d to 1st BSS in frame 1 cycle2 Stop-on-failure
FlexRay 2.5M TP4-transmitter-1cycle.msk 2.5 Mbps TP4 10 MHz sync’d to 1st BSS in frame 1 cycle2 Stop-on-failure
FlexRay 2.5M TP1-receiver-95bits.msk 2.5 Mbps TP1 10 MHz sync’d to every BSS 38 µs3 Stop-on-failure
FlexRay 2.5M TP2-receiver-95bits.msk 2.5 Mbps TP2 10 MHz sync’d to every BSS 38 µs3 Stop-on-failure
FlexRay 2.5M TP3-receiver-95bits.msk 2.5 Mbps TP3 10 MHz sync’d to every BSS 38 µs3 Stop-on-failure
FlexRay 2.5M TP4-receiver-95bits.msk 2.5 Mbps TP4 10 MHz sync’d to every BSS 38 µs3 Stop-on-failure
FlexRay 2.5M TP1-transmitter-95bits.msk 2.5 Mbps TP1 10 MHz sync’d to 1st BSS in frame 38 µs3 Stop-on-failure
FlexRay 2.5M TP2-transmitter-95bits.msk 2.5 Mbps TP2 10 MHz sync’d to 1st BSS in frame 38 µs3 Stop-on-failure
FlexRay 2.5M TP3-transmitter-95bits.msk 2.5 Mbps TP3 10 MHz sync’d to 1st BSS in frame 38 µs3 Stop-on-failure
FlexRay 2.5M TP4-transmitter-95bits.msk 2.5 Mbps TP4 10 MHz sync’d to 1st BSS in frame 38 µs3 Stop-on-failure
1. It should be noted that masks and clock recovery methods have not been fully defined within the FlexRay physical layer test specification for testing multi-node synchronous
FlexRay systems as of Agilent’s release of the N5402A automotive serial data analysis software option.
2. Oscilloscope sample rate and memory depth have been pre-selected to capture a default cycle time of 3 ms. Instructions are included within each mask file on how to easily
modify the acquisition time to match your synchronous FlexRay system cycle time using a standard text editor.
3. Testing for an observation window of 9.5 µs on 10 Mbps FlexRay signals is in compliance with the physical layer conformance test specification, version 2.1, revision A,
paragraph 5.1.4.6. A 9.5 µs observation window translates into 95 bits for slower baud rate FlexRay systems resulting in observation windows/acquisition times of 19 µs for
5.0 Mbps systems and 38 µs for 2.5 Mbps systems.
Mask files
12
Signal integrity measurements
on automotive differential signals
such as CAN and FlexRay require
differential active probing. Agilent
offers a range of differential active
probes for various bandwidths and
dynamic range applications. For
the most accurate measurements
in automotive embedded systems,
Agilent recommends the 1130
Series InfiniiMax active probes for
either single-ended or differential
applications. This family of active
probes comes with a variety of
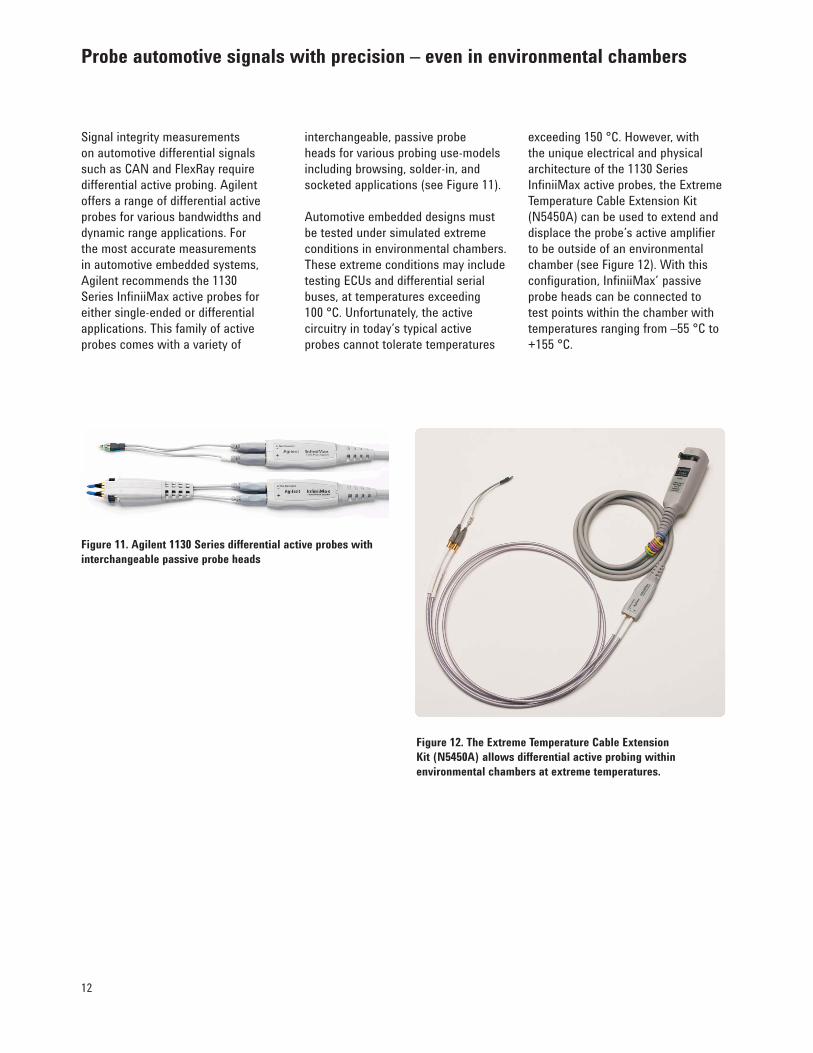
Probe automotive signals with precision – even in environmental chambers
Figure 11. Agilent 1130 Series differential active probes with
interchangeable passive probe heads
Figure 12. The Extreme Temperature Cable Extension
Kit (N5450A) allows differential active probing within
environmental chambers at extreme temperatures.
interchangeable, passive probe
heads for various probing use-models
including browsing, solder-in, and
socketed applications (see Figure 11).
Automotive embedded designs must
be tested under simulated extreme
conditions in environmental chambers.
These extreme conditions may include
testing ECUs and differential serial
buses, at temperatures exceeding
100 °C. Unfortunately, the active
circuitry in today’s typical active
probes cannot tolerate temperatures
exceeding 150 °C. However, with
the unique electrical and physical
architecture of the 1130 Series
InfiniiMax active probes, the Extreme
Temperature Cable Extension Kit
(N5450A) can be used to extend and
displace the probe’s active amplifier
to be outside of an environmental
chamber (see Figure 12). With this
configuration, InfiniiMax’ passive
probe heads can be connected to
test points within the chamber with
temperatures ranging from –55 °C to
+155 °C.
13
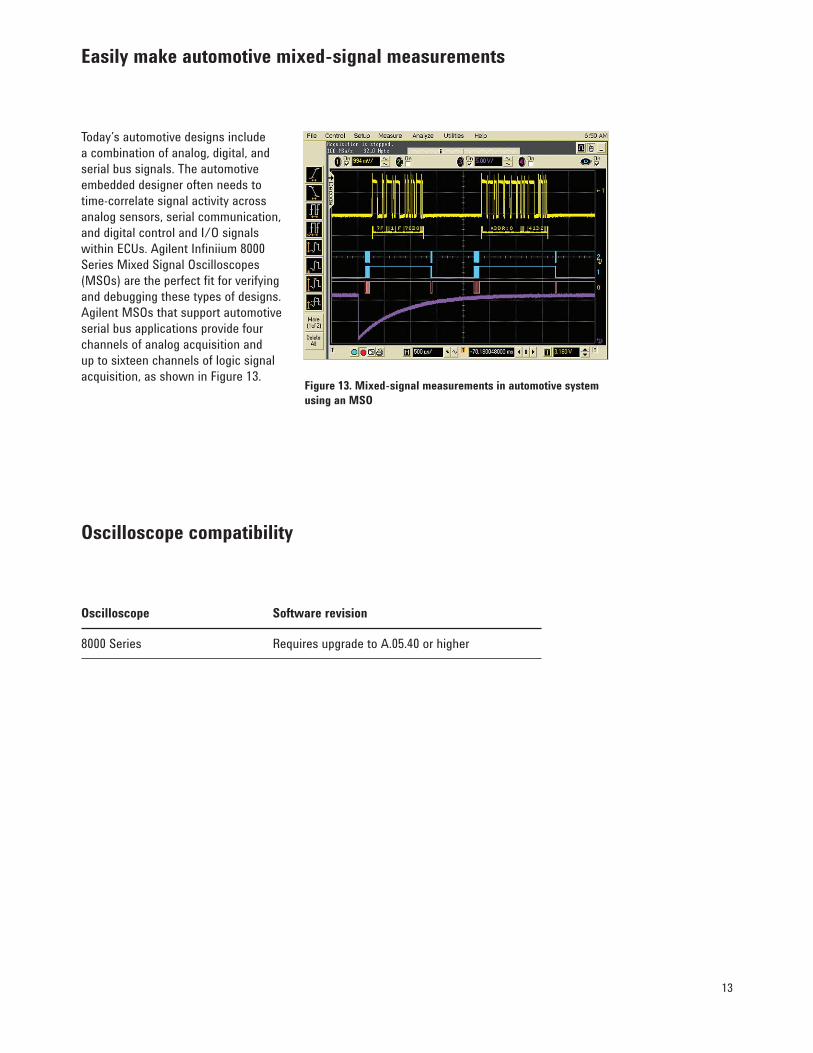
Today’s automotive designs include
a combination of analog, digital, and
serial bus signals. The automotive
embedded designer often needs to
time-correlate signal activity across
analog sensors, serial communication,
and digital control and I/O signals
within ECUs. Agilent Infiniium 8000
Series Mixed Signal Oscilloscopes
(MSOs) are the perfect fit for verifying
and debugging these types of designs.
Agilent MSOs that support automotive
serial bus applications provide four
channels of analog acquisition and
up to sixteen channels of logic signal
acquisition, as shown in Figure 13.
Easily make automotive mixed-signal measurements
Figure 13. Mixed-signal measurements in automotive system
using an MSO
Oscilloscope compatibility
Oscilloscope Software revision
8000 Series Requires upgrade to A.05.40 or higher
14
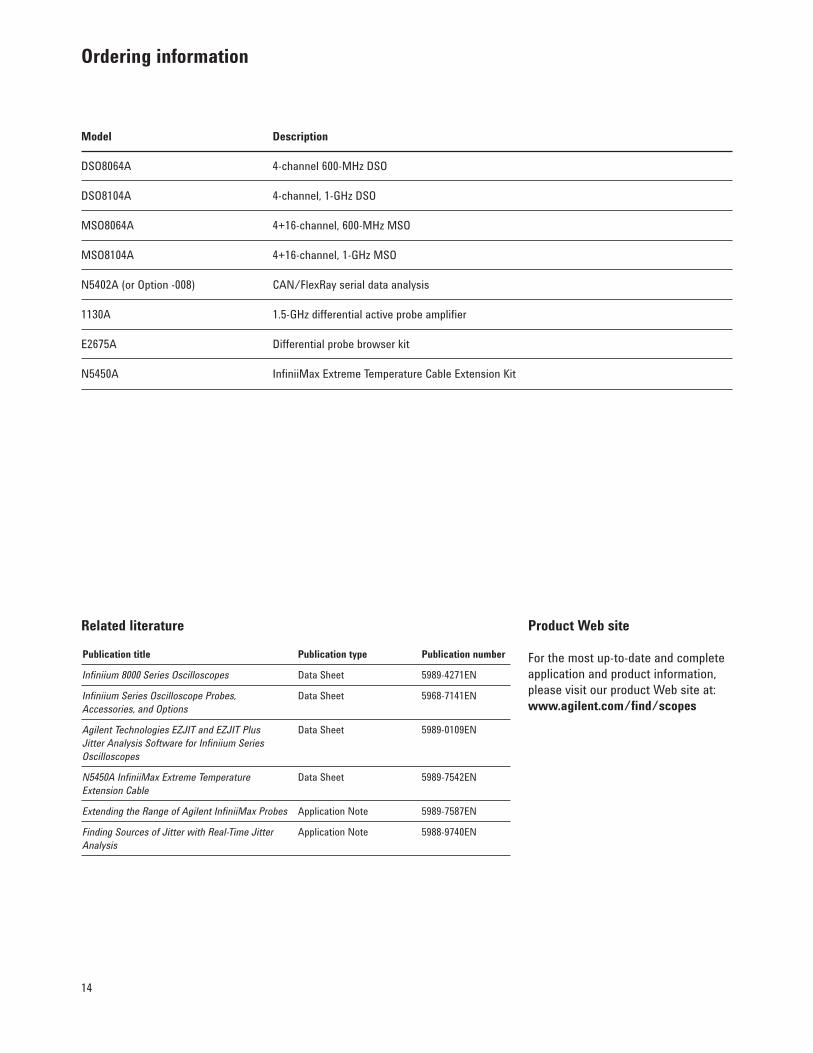
Product Web site
For the most up-to-date and complete
application and product information,
please visit our product Web site at:
www.agilent.com/find/scopes
Related literature
Publication title Publication type Publication number
Infiniium 8000 Series Oscilloscopes Data Sheet 5989-4271EN
Infiniium Series Oscilloscope Probes,
Accessories, and Options
Data Sheet 5968-7141EN
Agilent Technologies EZJIT and EZJIT Plus
Jitter Analysis Software for Infiniium Series
Oscilloscopes
Data Sheet 5989-0109EN
N5450A InfiniiMax Extreme Temperature
Extension Cable
Data Sheet 5989-7542EN
Extending the Range of Agilent InfiniiMax Probes Application Note 5989-7587EN
Finding Sources of Jitter with Real-Time Jitter
Analysis
Application Note 5988-9740EN
Ordering information
Model Description
DSO8064A 4-channel 600-MHz DSO
DSO8104A 4-channel, 1-GHz DSO
MSO8064A 4+16-channel, 600-MHz MSO
MSO8104A 4+16-channel, 1-GHz MSO
N5402A (or Option -008) CAN/FlexRay serial data analysis
1130A 1.5-GHz differential active probe amplifier
E2675A Differential probe browser kit
N5450A InfiniiMax Extreme Temperature Cable Extension Kit
15
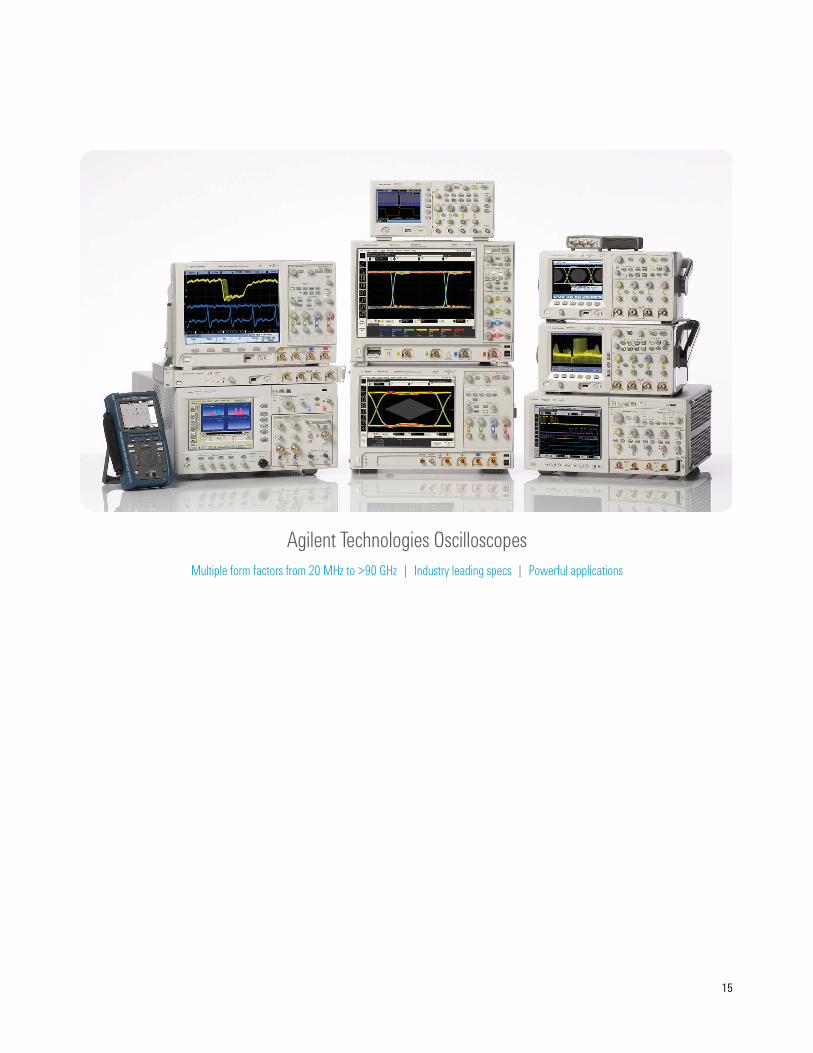
Agilent Technologies Oscilloscopes
Multiple form factors from 20 MHz to >90 GHz | Industry leading specs | Powerful applications
Windows is a U.S. registered trademark of
Microsoft Corporation.
www.agilent.com/find/scopes
Remove all doubt
Our repair and calibration services
will get your equipment back to you,
performing like new, when promised.
You will get full value out of your Agilent
equipment throughout its lifetime. Your
equipment will be serviced by Agilent-
trained technicians using the latest
factory calibration procedures, automated
repair diagnostics and genuine parts. You
will always have the utmost confidence
in your measurements.
Agilent offers a wide range of additional
expert test and measurement services
for your equipment, including initial
start-up assistance, onsite education
and training, as well as design, system
integration, and project management.
For more information on repair and
calibration services, go to:
www.agilent.com/find/removealldoubt
www.agilent.com/find/open
Agilent Open simplifies the process of
connecting and programming test systems
to help engineers design, validate and
manufacture electronic products. Agilent
offers open connectivity for a broad range
of system-ready instruments, open industry
software, PC-standard I/O and global
support, which are combined to more
easily integrate test system development.
www.agilent.com/find/emailupdates
Get the latest information on the products
and applications you select.
www.agilent.com/find/agilentdirect
Quickly choose and use your test
equipment solutions with confidence.
Agilent Email Updates
Agilent Direct
AgilentOpen
www.lxistandard.org
LXI is the LAN-based successor to GPIB,
providing faster, more effi cient connectivity.
Agilent is a founding member of the LXI
consortium.
www.agilent.comwww.agilent.com/fi nd/n5402a
For more information on Agilent Technologies’
products, applications or services, please
contact your local Agilent office. The
complete list is available at:
www.agilent.com/fi nd/contactus
Americas
Canada (877) 894-4414
Latin America 305 269 7500
United States (800) 829-4444
Asia Pacifi c
Australia 1 800 629 485
China 800 810 0189
Hong Kong 800 938 693
India 1 800 112 929
Japan 0120 (421) 345
Korea 080 769 0800
Malaysia 1 800 888 848
Singapore 1 800 375 8100
Taiwan 0800 047 866
Thailand 1 800 226 008
Europe & Middle East
Austria 01 36027 71571
Belgium 32 (0) 2 404 93 40
Denmark 45 70 13 15 15
Finland 358 (0) 10 855 2100
France 0825 010 700
Germany 07031 464 6333
Ireland 1890 924 204
Israel 972-3-9288-504/544
Italy 39 02 92 60 8484
Netherlands 31 (0) 20 547 2111
Spain 34 (91) 631 3300
Sweden 0200-88 22 55
Switzerland 0800 80 53 53
United Kingdom 44 (0) 118 9276201
Other European Countries:
www.agilent.com/fi nd/contactus
Revised: October 1, 2008
Product specifi cations and descriptions
in this document subject to change
without notice.
© Agilent Technologies, Inc. 2009
Printed in USA, June 1, 2009
5989-3632EN