Embed Size (px)
Citation preview
N318b Winter 2002 Nursing Statistics
Specific statistical tests: Correlation
Lecture 10
Nur 318b 2002 Lecture 10: page 2
School ofNursing
Institute for Work & Health
Today’s Class Brief discussion about issues related to
term paper and research paper Correlation lecture
<< 10 min break >> Applying knowledge to assigned reading Turk et al. (1995)
Followed by small groups 12-2 PMFocus on interpreting correlation results
Nur 318b 2002 Lecture 10: page 3
School ofNursing
Institute for Work & Health
Class Website
http://instruct.uwo.ca/nursing/318b
Lectures now online and can be printed using web browser (e.g. MS Explorer)Use the “Handout” and “pure black and white” options for printing, at 3 per page as this will allow you to put notes on them.
E-mail address: [email protected]
Exam questions and answers to be put online
Nur 318b 2002 Lecture 10: page 4
School ofNursing
Institute for Work & Health
“In Group” Session
Focuses on 1 assigned reading.Q1. Chance to interpret correlation resultsQ2. Know difference between “R2” and “r”
Key points about correlation workshop will be covered in the 2nd part of the lecture
Nur 318b 2002 Lecture 10: page 5
School ofNursing
Institute for Work & Health
Term papers
Both are due by April 11th (not April 4)
If there are questions about how to approach either type of paper don’t wait until last minute – get it sorted out ASAP
Research experience – emphasis is on describing experience and what YOU learned
Research Critique – emphasis is on showing that YOU understand what has happened in the paper, especially the results section
Nur 318b 2002 Lecture 10: page 6
School ofNursing
Institute for Work & Health
Statistical Tests – Review
How do you known when to use which test?
Helps to ask some basic questions:1. What kind of data are used?
2. What kind of relationship is of interest?
3. How many groups (samples) involved?- one, two, or more than two
- prediction, association or difference?
- ratio/interval or categorical (ordinal/nominal)- dependent (e.g. follow-up) or independent
Nur 318b 2002 Lecture 10: page 7
School ofNursing
Institute for Work & Health
Correlation (Pearson product)How do you known when to use correlation?
1. What kind of data are used?
2. What kind of relationship is of interest?
3. How many groups (samples) involved?
- usually numeric/continuous (ratio/interval)- two different variables from SAME subjects
- direction and strength
- (usually) one sample, with 2 variables
Referring back to the 3 “basic questions”:
Nur 318b 2002 Lecture 10: page 8
School ofNursing
Institute for Work & Health
Correlation - assumptions
1. The relationship under study is linear – important non-linear relationships can be overlooked with simple correlation analysis
2. Data are (approximately) normally distributed
3. Data in the two variables have roughly equal range of variability (i.e. homoscedasticity)
e.g. see Figure 10-1 in textbook
Nur 318b 2002 Lecture 10: page 9
School ofNursing
Institute for Work & Health
Why is correlation a parametric statistical test?
Correlation
1) assumes data are normally distributed (this should be checked before using it)
2) continuous (ratio/interval) data are used
3) involves a population characteristic
Nur 318b 2002 Lecture 10: page 10
School ofNursing
Institute for Work & Health
For situations where there are non-normal data or with ordinal data
Kendall’s Tau or Spearman’s Rho – like tests with ANOVA and t-test, assigns ranks to ordinal levels and then compares relationship between variables
Non-Parametric Equivalent for correlation
e.g. Pain score (extreme no pain) with breast CA tumour grade (I-IV)
Nur 318b 2002 Lecture 10: page 11
School ofNursing
Institute for Work & Health
Why not just use a scatter plot (e.g. Fig. 10-1)?
Plot is an important first step but correlation takes next step and statistically quantifies strength of relationship between variables
Test statistic is “r”, the correlation coefficient, that ranges from –1.0 to +1.0, with larger values indicating stronger relationship
Correlation – cont’d
Correlation does not equal causation !
Nur 318b 2002 Lecture 10: page 12
School ofNursing
Institute for Work & Health
Correlation – directionCan be either positive or negative, as coefficient “r” ranges from –1.0 to +1.0
As “r” 0, strength of relationship 0
What does a negative value of “r” mean?
As one variable increases the other decreases
What does a positive value of “r” mean?
As one variable increases the other increases
Nur 318b 2002 Lecture 10: page 13
School ofNursing
Institute for Work & Health
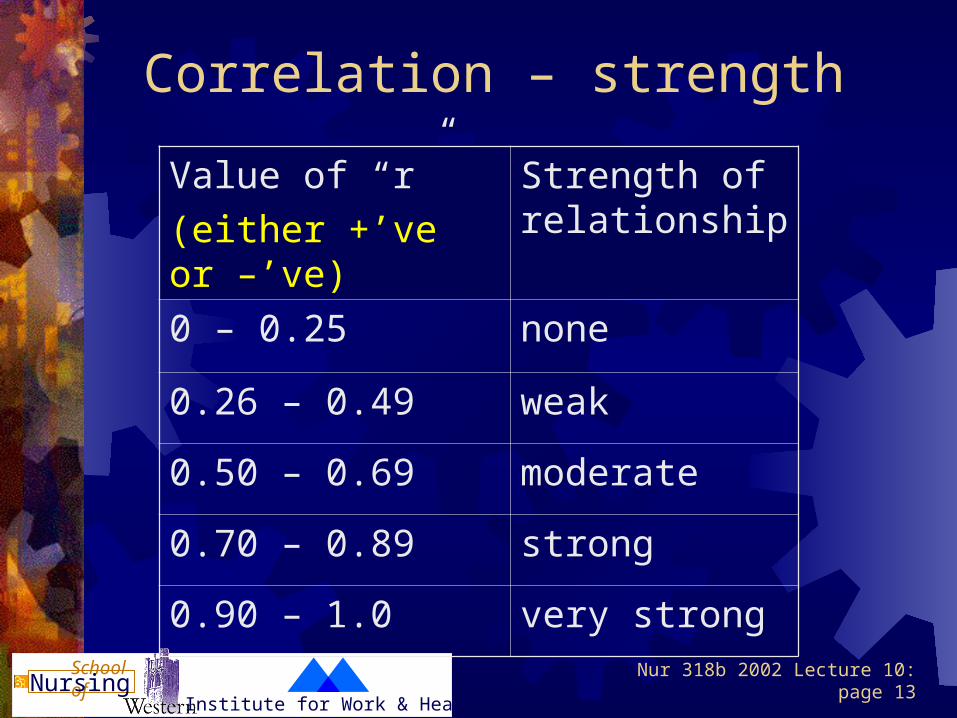
Correlation – strength
Value of “r”
(either +’ve or –’ve)
Strength of relationship
0 – 0.25 none
0.26 – 0.49 weak
0.50 – 0.69 moderate
0.70 – 0.89 strong
0.90 – 1.0 very strong
Nur 318b 2002 Lecture 10: page 14
School ofNursing
Institute for Work & Health
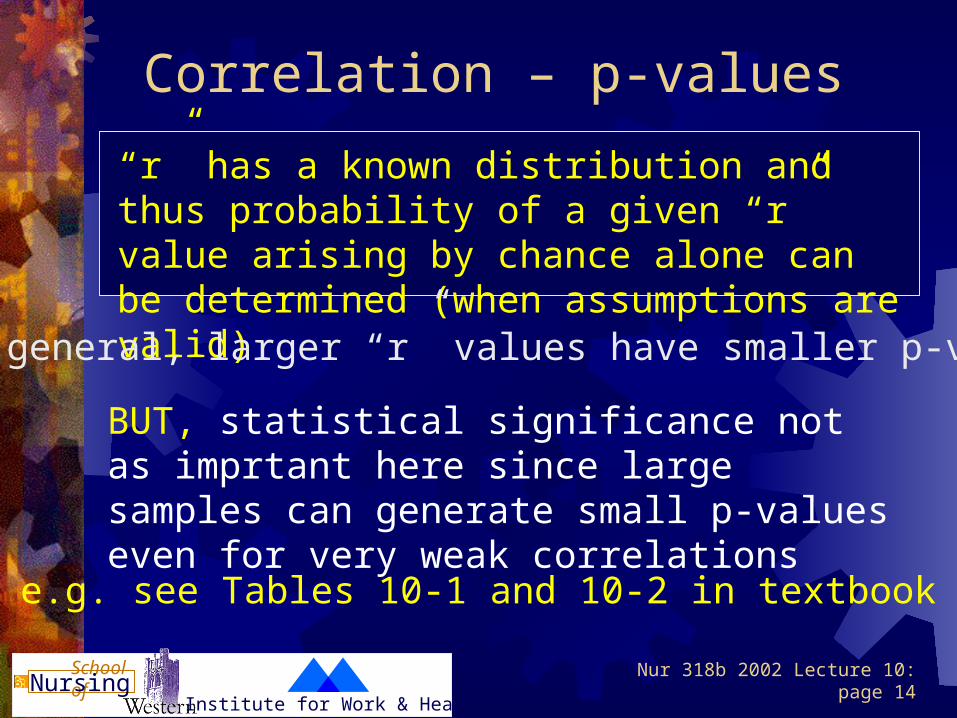
“r” has a known distribution and thus probability of a given “r” value arising by chance alone can be determined (when assumptions are valid)
BUT, statistical significance not as imprtant here since large samples can generate small p-values even for very weak correlations
In general, larger “r” values have smaller p-values
Correlation – p-values
e.g. see Tables 10-1 and 10-2 in textbook
Nur 318b 2002 Lecture 10: page 15
School ofNursing
Institute for Work & Health
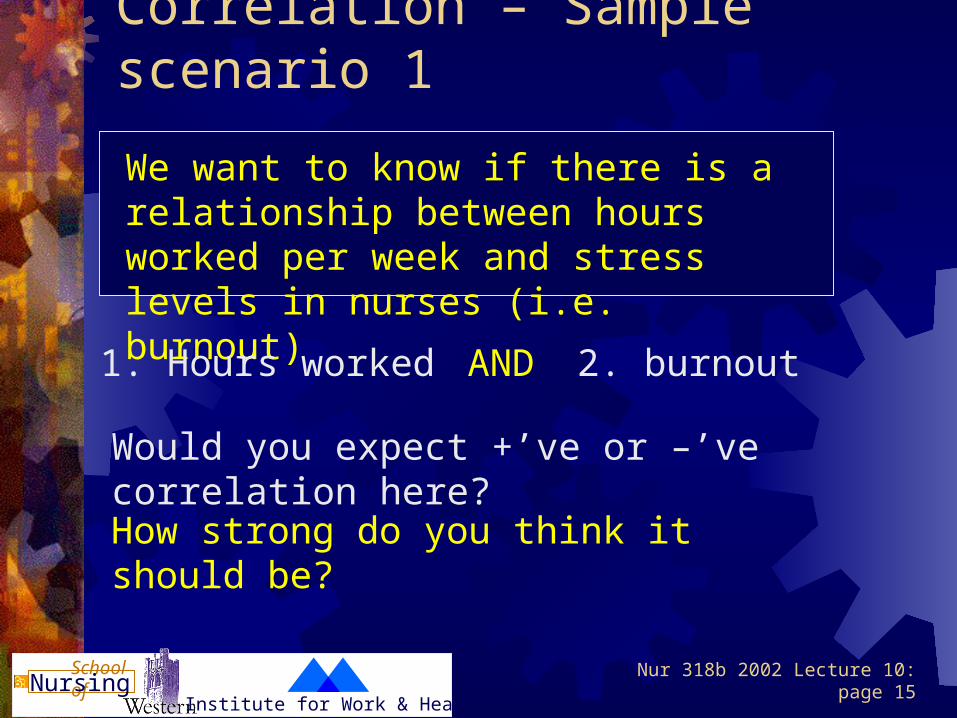
Correlation – Sample scenario 1
We want to know if there is a relationship between hours worked per week and stress levels in nurses (i.e. burnout)
How strong do you think it should be?
1. Hours worked
Would you expect +’ve or –’ve correlation here?
AND 2. burnout
Nur 318b 2002 Lecture 10: page 16
School ofNursing
Institute for Work & Health
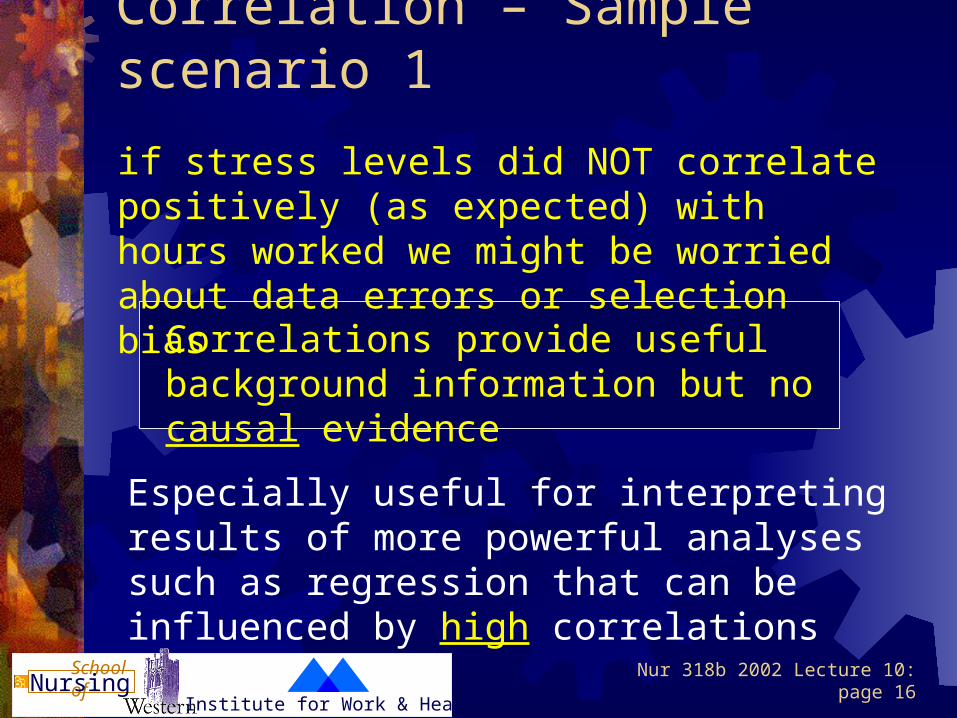
Correlations provide useful background information but no causal evidence
if stress levels did NOT correlate positively (as expected) with hours worked we might be worried about data errors or selection bias
Correlation – Sample scenario 1
Especially useful for interpreting results of more powerful analyses such as regression that can be influenced by high correlations

Nur 318b 2002 Lecture 10: page 17
School ofNursing
Institute for Work & Health
10 minute break !
Nur 318b 2002 Lecture 10: page 18
School ofNursing
Institute for Work & Health
Part 2: Application to the
Assigned Readings
Nur 318b 2002 Lecture 10: page 19
School ofNursing
Institute for Work & Health
Turk et al. (1995)
Quick summary of the paper: – a cross-sectional study examining the cognitive-behavioral mediation model of depression in chronic pain patients– 100 chronic pain subjects divided into two groups: 73 randomly chosen younger (<70); and 27 older (70 yrs) patients– found a strong link between pain and depression for older subjects but not for younger ones (i.e. an age effect)
Nur 318b 2002 Lecture 10: page 20
School ofNursing
Institute for Work & Health
Some design issues?
Do you have any concerns with design of the study – e.g. using a cross-sectional design to examine chronic pain and depression?
Can a correlation analysis address this problem adequately?
Which came first (“chicken-and-egg”)?
NO ! It looks only at relationship between two variables (typically at one point in time)
Nur 318b 2002 Lecture 10: page 21
School ofNursing
Institute for Work & Health
Interpreting Correlations …Correlation is rarely the main analytic tool for a research paper, thus correlation results are typically used to provide context or “help” with interpreting other results (especially regression)
Why did they split the old and “young” groups?
See Figure 2 page 98 of Turk et al. paper
What do these two diagrams illustrate?
This was part of their main hypothesis !
Nur 318b 2002 Lecture 10: page 22
School ofNursing
Institute for Work & Health
When interpreting results of Turk et al. paper for workshop …
3. How strong were the correlations?
2. Were they in the expected direction?
1. Any statistically significant correlations?
General questions to ask about correlations …
Interpreting Correlations - cont’d
4. How do the correlation results relate back to the study hypothesis?
Nur 318b 2002 Lecture 10: page 23
School ofNursing
Institute for Work & Health
Next Week: Regression
For next week’s class please review:1. Page 18 (top) in syllabus2. Textbook Chapter 11 (see syllabus) 3. Syllabus paper: Ferketich & Mercer
(1995)