Embed Size (px)
Citation preview
N S L L t d a n n u a l r e p o r t 2 0 0 9

Contents
1 Corporate Profile
2 Corporate Information
3 Group Financial Highlights
4 Letter to Shareholders
6 Board of Directors
7 Corporate Research & Development Advisory Panel
8 Profile of COO and Key Business Managers
9 Significant Events in 2009
10 Review of Operations
14 5-Year Financial Summary
16 Corporate Directory
19 Financial Review
N S L Lt d a n n u a l r e p o r t 2 0 0 9 | 1

Corporate profile
NSL Ltd and its group of companies is a leading industrial group in the Asia Pacific. The Group has three main businesses: Chemicals, Engineering and Construction Products.
The Chemicals group is a regional leader in lime manufacturing with specialised refractory products and environmental services. The Engineering group is one of the world’s leading manufacturers of container spreaders. The Construction Products group is a key player in precast concrete, premix mortar and building-related products in the region.
The Group is widely recognised as an extensive user of technology to provide innovative solutions to industries. It partners eminent local industry and tertiary institutions to develop industrial best practices and leading technologies in its fields.
The Group has operations and joint ventures in 8 countries. The Company has been listed on the Singapore Exchange since 1964.
engineering
Constructionproducts
Chemicals
N S L Lt d a n n u a l r e p o r t 2 0 0 9 | 1
Financial CalendarAnnouncement of Quarterly Results 2009
1st Quarter - 13 May 20092nd Quarter - 12 August 2009
3rd Quarter - 11 November 2009
Financial Year-end 31 December 2009
Announcement of Unaudited Results 200923 February 2010
2010 Annual General Meeting21 April 2010
Corporate DataRegistered Office
77 Robinson Road #27-00 Robinson 77, Singapore 068896Tel: 6536 1000 Fax: 6536 1008
www.nsl.com.sg
Company SecretaryLim Su-Ling
Share RegistrarM & C Services Private Limited
138 Robinson Road #17-00 The Corporate Office, Singapore 068906
AuditorsPricewaterhouseCoopers LLP
8 Cross Street #17-00 PWC Building, Singapore 048424Certified Public Accountants
Audit Partner: Sim May Ling Theresa(Appointed in: Year 2007)
BanksDBS Bank Ltd
Malayan Banking BerhadOversea-Chinese Banking Corporation Limited
United Overseas Bank Limited
Corporate information
N S L Lt d a n n u a l r e p o r t 2 0 0 9 | 2 N S L Lt d a n n u a l r e p o r t 2 0 0 9 | 3

2005 2006 2007 2008 2009For the Year (S$’000)
Turnover from continuing operations 303,614 319,786 345,570 357,834 352,424
Profit before taxation from continuing operations 102,592 137,264 106,942 79,778 72,972
Total group profit attributable to shareholders 69,934 132,134 109,379 76,745 66,136
At Year-end (S$’000)
Shareholders’ funds 424,892 451,323 520,021 500,315 495,283
Total assets 722,445 688,407 689,534 688,487 642,495
Per Share
Basic earnings per share (cents) 18.7 35.3 29.3 20.5 17.7
Dividends (exempt - one tier, cents per share) interim & final - 10 10 20 10 special 167 29 - 10 -
Others
No. of employees 4,366 2,685 2,026 2,230 2,113
Group finanCial HiGHliGHts
N S L Lt d a n n u a l r e p o r t 2 0 0 9 | 2 N S L Lt d a n n u a l r e p o r t 2 0 0 9 | 3

letter to sHareHolders
Dear Shareholders
PerformanceAmidst the challenging global and domestic environment in 2009, the Group reported a turnover of $352.4m and profit before tax of $57.9m.
Compared to 2008, Group turnover decreased 2% and Group profit before tax declined 23%. The slight decrease in Group turnover was mainly due to lower turnover from its Chemicals and Engineering Divisions. This was however partially offset by higher turnover from the Construction Products Division.
The decline in Group profit before tax from $75.3m to $57.9m was largely attributable to the lower profit contribution from its petrochemical associate in Thailand, Bangkok Synthetics Co., Ltd (“BST”). Excluding BST, the profit before tax increased 63% year-on-year on the back of improved operating performance across all its three core business divisions. The improved performance is the result of its focus on cost management and strengthening competitiveness last year.
After taking into account the exceptional items and income tax expenses, profit attributable to shareholders dipped 14% from $76.7m in 2008 to $66.1m in 2009.
2009 In ReviewDuring the year, the Group continued to divest its non-core businesses and focused its resources on the development and expansion of its core businesses.
In July 2009, NSL Properties Pte Ltd, entered into a sale and purchase agreement with PT Ciputra Property Tbk to divest its entire stake in PT Ciputra Adigraha. In second half of 2009, the Group disposed of its investments in CapitaLand China Residential Fund Ltd. Both disposals contributed to an exceptional gain of $14.8m in 2009.
In September 2009, NSL Chemicals Ltd, a wholly-owned subsidiary of NSL Ltd, disposed of its entire stake in Guizhou Dazhong Rubber Co., Ltd for US$1.24m.
In 2009, the Construction Products Division injected an additional $26m in Dubai Precast L.L.C. (“Dubai Precast”), its 45% joint venture company in Dubai, to finance the expansion of Dubai Precast into the fast growing construction markets in Abu Dhabi.
The Engineering Division completed a new range of “Green” Yard and Quay Crane spreaders which are fully electric driven. Thermal insulating plasters which improve energy efficiency in buildings were developed by the Construction Products Division and have been certified and sold in the regional markets. Together with its environmental chemicals and services businesses in the Chemicals Division, the initiatives in developing environmentally friendly products and services further affirms the Group’s commitment in conducting business in an environmentally responsible way.
N S L Lt d a n n u a l r e p o r t 2 0 0 9 | 4 N S L Lt d a n n u a l r e p o r t 2 0 0 9 | 5

letter to sHareHolders
Looking AheadWhile the Construction Products Division has a healthy order book, keener competition in Singapore and the region may impact its performance in 2010.
For Chemicals Division, the demand for its environmental chemicals and services is expected to remain stable in 2010. Global demand and prices of key petrochemical products, which is expected to improve in tandem with the recovery of the global economy, will determine the performance of its Thai petrochemical associate.
The performance of the Engineering Division in 2010 is expected to be adversely affected by the continuing weakness in the global container trade.
DividendSubject to the approval of shareholders at the annual general meeting of the Company to be held on 21 April 2010, the Board is recommending a final dividend of $0.10 per share for the financial year ended 31 December 2009 to be paid on or about 25 May 2010 or such other date to be determined by the Directors.
A Note Of ThanksFinally, on behalf of the Board, I would like to thank our shareholders, customers, business partners and staff for their loyalty, unwavering support and contributions throughout a very difficult 2009.
Prof Cham Tao SoonChairman 10 March 2010
400
350
300
250
200
150
100
50
Group turnover(S$million)
0 20092008
352.4357.8
Group profit Before tax (exCludinG exCeptional items)
(S$million)
80
70
60
50
40
30
20
10
20092008
75.3
57.9
0
N S L Lt d a n n u a l r e p o r t 2 0 0 9 | 4 N S L Lt d a n n u a l r e p o r t 2 0 0 9 | 5

Board of direCtors
Chairman
Prof Cham Tao Soon
Chairman Singapore Symphonia Co Ltd
Chancellor & Chairman SIM University
Director MFS Technology Ltd Singapore Press Holdings Limited Soup Restaurant Group Ltd United Overseas Bank Ltd WBL Corporation Limited
Executive Director
Ang Kong Hua Director DBS Bank Limited Government of Singapore
Investment Corporation Private Limited
Sembcorp Industries Limited
Directors
Ban Song LongDirector Excel Partners Pte Ltd 98 Holdings Pte Ltd
David Fu Kuo ChenDirector Hotel Properties Ltd 98 Holdings Pte Ltd
John Koh Tiong LuDirector Mapletree Industrial Fund Ltd Singapore Arts School Ltd
Dr Tan Tat WaiGroup Managing Director Southern Steel Berhad
Director Malayan Banking Berhad Shangri-La Hotels (Malaysia) Berhad Titan Chemicals Corp. Bhd
N S L Lt d a n n u a l r e p o r t 2 0 0 9 | 6 N S L Lt d a n n u a l r e p o r t 2 0 0 9 | 7

Chairman
Prof Cham Tao Soon
Members
Ang Kong Hua
David Fu Kuo Chen
Lam Siew WahDeputy CEO(Industry & Corporate Development) Building and Construction Authority (BCA)
Director BCA International Pte Ltd
Adjunct Associate Professor Nanyang Technological University School of Civil and Environmental
Engineering
Lim Swee CheangDirector / CEO National University of Singapore Institute of Systems Science
Dr Tan Tat Wai
Prof Tay Joo Hwa
Professor Nanyang Technological University School of Civil and Environmental
Engineering
Corporate researCH & development advisory panel
N S L Lt d a n n u a l r e p o r t 2 0 0 9 | 6 N S L Lt d a n n u a l r e p o r t 2 0 0 9 | 7
profile of Coo and Key Business manaGers
Key Business ManagersChong Wai SiakRichard Sia Kim Siong
Chief Operating OfficerDr Josephine Kwa Lay Keng
Dr Josephine Kwa Lay Keng was appointed Chief Operating Officer of the Company on 1 July 2005. She is responsible for the operational matters in the NSL Group. Prior to this, she was in charge of NSL Group’s Technology Division and NSL Chemicals Ltd. Dr Kwa joined NSL Ltd in 1988 and holds a Bachelor of Science (Honours) in Mechanical Engineering and a Ph.D from the University of Leeds, United Kingdom. Prior to joining the NSL Group, she was with the Singapore Economic Development Board.
Mr Chong Wai Siak is currently the President of the Company’s construction subsidiary, Eastern Industries Group of Companies. He joined the Group as Chief Executive Officer of Eastern Industries Pte Ltd in 1989 and then as Deputy President of NSL Ltd from December 1998 to 2005. Prior to joining the NSL Group, he was the General Manager of a construction-related technology company and also a Senior Principal Engineer in HDB. He is a Chartered Engineer (United Kingdom) and a registered Professional Engineer with the Singapore Engineers Board. Mr Chong holds a Bachelor of Science (Honours) in Civil Engineering as well as a Master of Science in Structural Engineering from University of Manchester, Institute of Science and Technology, United Kingdom.
Mr Richard Sia Kim Siong is concurrently the Chief Executive Officer of NSL Chemicals Ltd and NSL Engineering Pte Ltd. Prior to heading the Chemicals and Engineering businesses, he was with the Group’s Corporate Development Division spearheading the Group’s investments. He joined NSL Ltd in 1987 and holds a Bachelor of Science (Honours) in Mechanical Engineering from the University of Leeds and Master in Business Administration from University of Sheffield, United Kingdom. Before joining the NSL Group, he was with the Singapore Economic Development Board.
N S L Lt d a n n u a l r e p o r t 2 0 0 9 | 8 N S L Lt d a n n u a l r e p o r t 2 0 0 9 | 9
siGnifiCant events in 2009
May
Payment of final dividend of $0.10 per share and special dividend of $0.10 per share for financial year ended 31 December 2008.
June
The registered capital of Changshu RAM Engineering Co., Ltd, a wholly-owned subsidiary of NSL Engineering Pte Ltd, was increased by US$1.44m to US$6.74m.
July
NSL Properties Pte. Ltd. entered into a conditional sale and purchase agreement with PT Ciputra Property Tbk to divest its entire stake in PT Ciputra Adigraha for a total cash consideration of US$7.6m.
Eastern Pretech Pte Ltd, a wholly-owned subsidiary of NSL Ltd, subscribed for a further 36,000 shares in its joint venture company in Dubai, United Arab Emirates namely Dubai Precast L.L.C. The additional share subscription was initiated as part of the company’s investment in a new precast manufacturing plant.
September
Eastern Gotech (China) Limited, a subsidiary of NSL Ltd, incorporated a wholly-owned subsidiary, Eastern Pretech (Guangzhou) Limited in Guangzhou, the People’s Republic of China with a registered capital of RMB 26m. The principal activity of this subsidiary is to manufacture high value-added plasters and mortar materials.
NSL Chemicals Ltd, a wholly-owned subsidiary of NSL Ltd, disposed of its entire stake in Guizhou Dazhong Rubber Co., Ltd for US$1.24m.
December
Eastern Pretech (Malaysia) Sdn Bhd completed phase 1 of its precast manufacturing plant in Seelong, Johor and commenced production.
N S L Lt d a n n u a l r e p o r t 2 0 0 9 | 8 N S L Lt d a n n u a l r e p o r t 2 0 0 9 | 9
review of operations
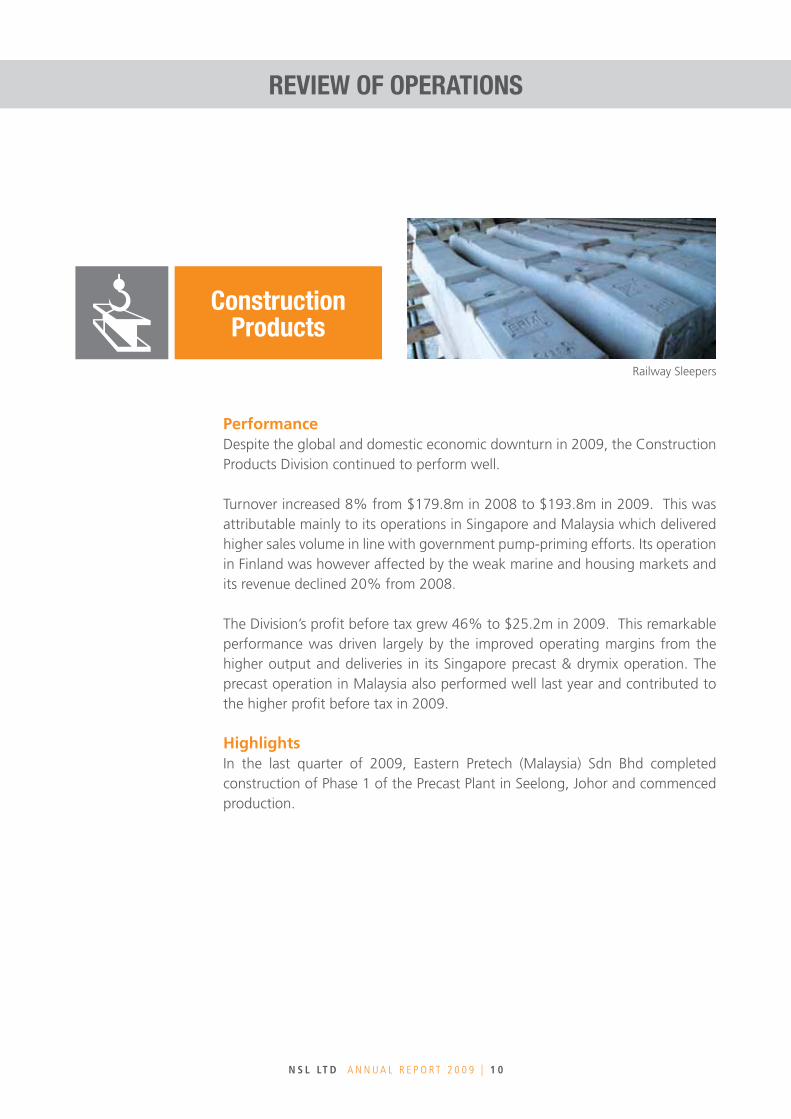
PerformanceDespite the global and domestic economic downturn in 2009, the Construction Products Division continued to perform well.
Turnover increased 8% from $179.8m in 2008 to $193.8m in 2009. This was attributable mainly to its operations in Singapore and Malaysia which delivered higher sales volume in line with government pump-priming efforts. Its operation in Finland was however affected by the weak marine and housing markets and its revenue declined 20% from 2008.
The Division’s profit before tax grew 46% to $25.2m in 2009. This remarkable performance was driven largely by the improved operating margins from the higher output and deliveries in its Singapore precast & drymix operation. The precast operation in Malaysia also performed well last year and contributed to the higher profit before tax in 2009.
HighlightsIn the last quarter of 2009, Eastern Pretech (Malaysia) Sdn Bhd completed construction of Phase 1 of the Precast Plant in Seelong, Johor and commenced production.
Constructionproducts
Railway Sleepers
N S L Lt d a n n u a l r e p o r t 2 0 0 9 | 1 0 N S L Lt d a n n u a l r e p o r t 2 0 0 9 | 1 1

30
27
24
21
18
9
15
6
12
3
review of operations
During the year, this Division contributed its proportionate share in enlarged paid-up capital of its joint venture company in Dubai, United Arab Emirates namely Dubai Precast L.L.C. The additional share subscription was initiated as part of the company’s investment in a new precast manufacturing plant in Abu Dhabi which has since been completed and commissioned.
Going ForwardLast year, the Singapore operations benefited from the delivery of its products from orders secured earlier in 2008 at stronger product prices. The demand and pricing of the construction products have since weakened with the slow down of government-led projects.
Whilst the order book for 2010 remains healthy, keener competition in Singapore and the region may result in lower prices which may impact its performance going forward.
ConstruCtion produCts division turnover & profit Before tax
(exCludinG exCeptional items) (S$million)
200
180
160
140
120
60
100
40
80
20
0 0020092008
turnover profit before tax
turn
over
profit Before tax (excluding exceptional Items)
179.8
17.3
25.2
193.8
Precast Facade Wall
N S L Lt d a n n u a l r e p o r t 2 0 0 9 | 1 0 N S L Lt d a n n u a l r e p o r t 2 0 0 9 | 1 1
review of operations
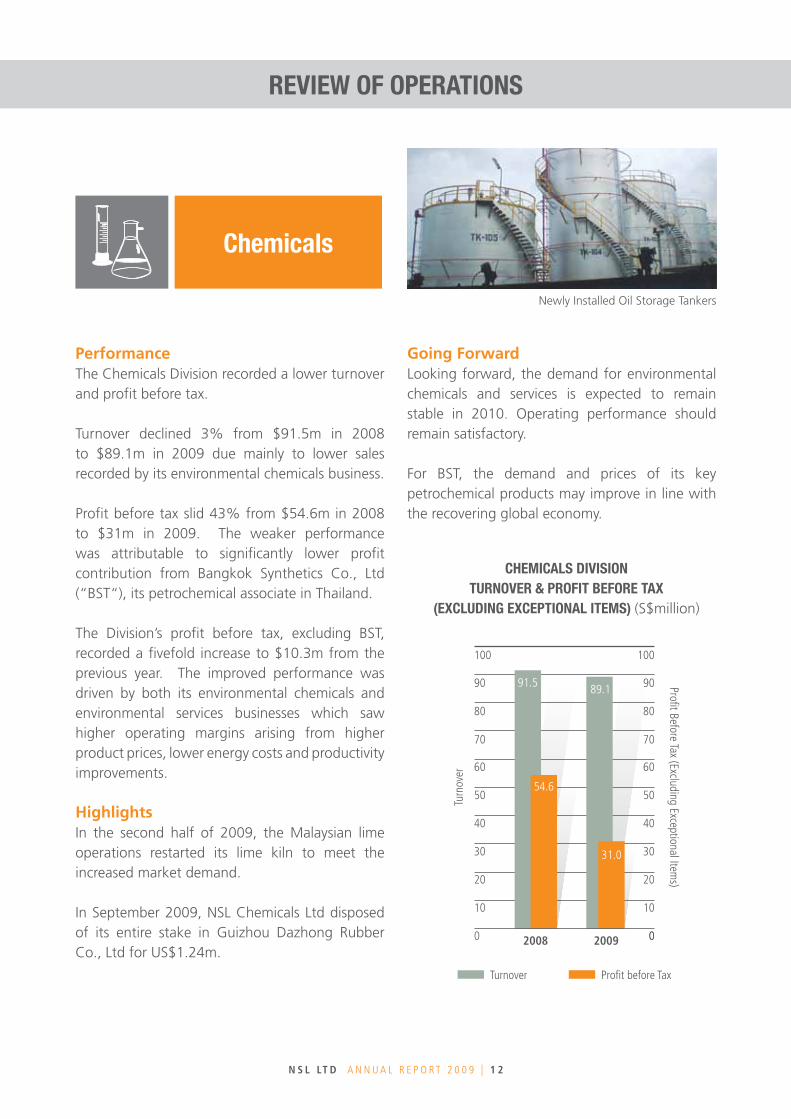
PerformanceThe Chemicals Division recorded a lower turnover and profit before tax.
Turnover declined 3% from $91.5m in 2008 to $89.1m in 2009 due mainly to lower sales recorded by its environmental chemicals business.
Profit before tax slid 43% from $54.6m in 2008 to $31m in 2009. The weaker performance was attributable to significantly lower profit contribution from Bangkok Synthetics Co., Ltd (“BST“), its petrochemical associate in Thailand.
The Division’s profit before tax, excluding BST, recorded a fivefold increase to $10.3m from the previous year. The improved performance was driven by both its environmental chemicals and environmental services businesses which saw higher operating margins arising from higher product prices, lower energy costs and productivity improvements.
HighlightsIn the second half of 2009, the Malaysian lime operations restarted its lime kiln to meet the increased market demand. In September 2009, NSL Chemicals Ltd disposed of its entire stake in Guizhou Dazhong Rubber Co., Ltd for US$1.24m.
Going Forward Looking forward, the demand for environmental chemicals and services is expected to remain stable in 2010. Operating performance should remain satisfactory.
For BST, the demand and prices of its key petrochemical products may improve in line with the recovering global economy.
CHemiCals division turnover & profit Before tax
(exCludinG exCeptional items) (S$million)
100
90
80
70
60
30
50
20
40
10
0 00
100
90
80
70
60
30
50
20
40
10
20092008
turnover profit before tax
turn
over
profit Before tax (excluding exceptional Items)
91.5
54.6
31.0
89.1
Chemicals
Newly Installed Oil Storage Tankers
N S L Lt d a n n u a l r e p o r t 2 0 0 9 | 1 2 N S L Lt d a n n u a l r e p o r t 2 0 0 9 | 1 3

80
PerformanceThe Engineering Division closed the year with a higher profit before tax despite a lower turnover.
Turnover decreased 22% from $70.9m in 2008 to $55.2m in 2009 largely due to lower spreader deliveries. Profit before tax increased 15% from $5.5m in 2008 to $6.3m in 2009. The improved performance was largely attributable to operational streamlining and lower provision for trade receivables.
HighlightsIn the second half of 2009, ChangShu Ram Engineering Co., Ltd, a wholly-owned subsidiary of NSL Engineering Pte Ltd, commenced full production at its Phase 2 plant which was commissioned about a year ago.
During the year, the Division further affirmed the Group’s commitment to conducting business in an environmentally friendly way by developing a range of fully electric Yard and Quay Crane spreaders. Together with its traditional hydraulic spreaders, the “Green“ electric spreaders offer its customers eco-friendly choices.
review of operations
Going Forward The performance of the Engineering Division in 2010 is expected to be adversely affected by the continuing weakness in the global container trade.
engineering
enGineerinG division turnover & profit Before tax
(exCludinG exCeptional items) (S$million)
8
70
660
50
440
10
30
220
000 20092008
turnover profit before tax
turn
over
profit Before tax (excluding exceptional Items)
70.9
5.5
6.355.2
All-Electric Quay Crane Spreader
N S L Lt d a n n u a l r e p o r t 2 0 0 9 | 1 2 N S L Lt d a n n u a l r e p o r t 2 0 0 9 | 1 3

5-year finanCial summary
Financial Profile (S$’000) 2005 2006 2007 2008 2009Continuing OperationsTurnover 303,614 319,786 345,570 357,834 352,424
Profit before share of results of associated companies and joint venture 20,887 5,822 20,189 22,251 35,059
Share of results of associated companies and joint venture, net of tax 49,256 48,445 31,402 53,010 22,859
Profit before tax and exceptional items 70,143 54,267 51,591 75,261 57,918 Exceptional items 32,449 82,997 55,351 4,517 15,054 Profit before tax 102,592 137,264 106,942 79,778 72,972 Taxation (4,657) 3,260 (6,470) (4,393) (6,080)Profit after tax 97,935 140,524 100,472 75,385 66,892
EBITDA before exceptional items 78,881 70,689 65,649 90,272 74,330
Profit / (Loss) after tax from discontinued operations (25,959) (5,126) 9,733 - - Total group profit attributable to shareholders 69,934 132,134 109,379 76,745 66,136Dividends (exempt - one tier)
- Interim & final - 37,356 37,356 74,712 37,356- Special 623,842 108,332 - 37,356 -
Share capital 186,779 193,839 193,839 193,839 193,839Share premium and reserves 238,113 257,484 326,182 306,476 301,444Dividend cover 0.1x 0.9x 2.9x 0.7x 1.8x
Financial Position (S$’000)What we ownedProperty, plant and equipment 148,285 136,584 138,484 138,944 135,645Associated companies & joint venture 115,651 109,465 147,852 144,853 171,943Investment properties 10,264 4,483 4,296 4,109 3,920Long-term receivables & investments 60,985 41,330 43,215 23,076 38,960Intangible assets 9,610 9,678 9,654 9,760 9,559Deferred tax assets 2,505 1,415 1,651 1,195 1,728Current assets 375,145 385,452 344,382 366,550 280,740
722,445 688,407 689,534 688,487 642,495
What we owed and EquityShareholders’ funds 424,892 451,323 520,021 500,315 495,283Minority interests 26,477 29,243 14,016 13,184 13,727Long term liabilities 93,856 53,328 38,245 42,514 41,364Current liabilities 177,220 154,513 117,252 132,474 92,121
722,445 688,407 689,534 688,487 642,495
Cash & Debt PositionGroup borrowings (S$’000) 112,503 82,501 41,074 47,636 32,644Group net cash (cash less borrowings) (S$’000) 46,436 103,980 157,760 123,816 113,876
Per Share DataBasic earnings per share (cents) 18.7 35.3 29.3 20.5 17.7Net tangible assets per share (S$) 1.11 1.18 1.37 1.31 1.30
DividendsDividends (exempt - one tier, cents per share)
- Interim & final - 10 10 20 10- Special 167 29 - 10 -
N S L Lt d a n n u a l r e p o r t 2 0 0 9 | 1 4 N S L Lt d a n n u a l r e p o r t 2 0 0 9 | 1 5

5-year finanCial summary
Group turnover (From C ontinuing Operations)
400
300
200
100
0 2005
304
2006
320
2007
346
2008
358
2009
352
(S$m
illio
n)
30
20
10
BasiC earninGs per sHare
40
0 2005
18.7
2006
35.3
2007
29.3
2008
20.5
2009
17.7
(cen
ts)
sHareHolders’ funds & total assets
600
400
200
total assets Shareholders' Funds
800
0 2005
722
425 451
520500 495
2006
688
2007
690
2008
688
2009
642
(S$m
illio
n)
Group profit Before tax (From C ontinuing Operations)
90
120
60
30
Group profitBefore tax
Group profit Before tax(excluding exceptional Items)
150
0 2005
103
70
54 52
75
58
2006
137
2007
107
2008
80
2009
73(S$m
illio
n)
N S L Lt d a n n u a l r e p o r t 2 0 0 9 | 1 4 N S L Lt d a n n u a l r e p o r t 2 0 0 9 | 1 5

Corporate direCtory
Chemicals
NSL Chemicals Ltd 26 Tanjong Kling RoadSingapore 628051Tel : (65) 6513 6900Fax : (65) 6265 9942www.nslchemicals.com.sg
NSL Chemicals (M) Sdn Bhd LimeTreat (M) Sdn. Bhd.Lot 38046, Mukim Sg. Raia,Batu 5, Jalan Gopeng,31300 Kg. Kepayang,Perak Darul RidzuanMalaysiaTel : (60-5) 357 2351Fax : (60-5) 357 2397
NSL OilChem Services Pte Ltd 23 Tanjong Kling RoadSingapore 628049Tel : (65) 6513 3999Fax : (65) 6265 8900www.nsloilchem.com.sg
ChangShu NSL Calcific Products Co LtdMeli Town East, ChangShu City,Jiangsu Province, ChinaPostal Code : 215511Tel : (86-512) 522 61885Fax : (86-512) 526 69979
ZhenJiang ZhongDa Calcific Products Co Ltd6, Heng Shan Road,Mechanical and ElectricalIndustrial Park, Dagang Town,Zhenjiang City,Jiangsu Province, ChinaPostal Code : 212132Tel : (86-511) 83377 548Fax : (86-511) 83377 848
Bangkok Synthetics Co LtdOffice:22nd Floor, Sathorn City Tower175 South Sathorn RoadTungmahamek, Sathorn,Bangkok 10120, ThailandTel : (66-2) 679 5120Fax : (66-2) 679 5119www.bst.co.th
Plant:Map Ta Phut Industrial Estate5, I-7 Road, Muang DistrictRayong 21150, ThailandTel : (038) 683 314Fax : (038) 683 315
Eastech Steel Mill Services (M) Sdn BhdLot 38046, Mukim Sg. Raia, Batu 5, Jalan Gopeng, 31300 Kg. Kepayang,Perak Darul RidzuanMalaysiaTel : (60-5) 357 6872Fax : (60-5) 357 6977
PT Eastech IndonesiaKd. Kedep RT. 02/RW. 17 Ds. Tlajung Udik, Kecamatan Gunung Putri, Kabupaten Dati II Bogor 16962 IndonesiaTel : (62-21) 867 3482, 867 3483Fax : (62-21) 867 3480
RST Teknologi Sdn BhdPlant:Plot P512, Lorong Perusahaan 1013600, Prai Industrial EstatePulau Pinang, MalaysiaTel : (60-4) 380 5080Fax : (60-4) 380 5082
Office:2723, Lorong Perusahaan 12Prai Industrial Estate13600, Pulau Pinang, Malaysia
Engineering
NSL Engineering Pte Ltd26 Tanjong Kling RoadSingapore 628051Tel : (65) 6265 2877Fax : (65) 6261 1300www.ramspreaders.com
NSL Engineering (UK) Limited6, Selby Place, StanleySkelmersdaleLancs WN8 8EFEnglandTel : (44-1695) 556 355Fax : (44-1695) 556 356
ChangShu RAM Engineering Co. LtdJiangsu ChangShu Economic Development ZoneRiverside Industrial ParkPostal Code : 215513ChangShu, ChinaTel : (86-512) 522 97222Fax : (86-512) 522 97223
N S L Lt d a n n u a l r e p o r t 2 0 0 9 | 1 6 N S L Lt d a n n u a l r e p o r t 2 0 0 9 | 1 7

Corporate direCtory
Construction Products
Eastern Pretech Pte Ltd15 Sungei Kadut Street 2Singapore 729234Tel : (65) 6368 1366Fax : (65) 6368 2256www.easternpretech.com.sg
Eastern Pretech (Malaysia) Sdn Bhd28 Jalan 7/108CTaman Sungai Besi57100 Kuala LumpurMalaysiaTel : (60-3) 7980 2728Fax : (60-3) 7980 5663www.epmsb.com.my
EI Resources Sdn Bhd6A Jalan Kebudayaan 1ATaman Universiti81300 Skudai, JohorMalaysiaTel : (60-7) 520 5066Fax : (60-7) 521 5625
Emix Services Pte Ltd15 Sungei Kadut Street 2Singapore 729234Tel : (65) 6368 1366Fax : (65) 6365 3520
Eastern Pretech (HK) LtdEastern Gotech (HK) LtdEastern Gotech (China) LimitedRoom 804-5, 8/F, AXA Centre151 Gloucester RoadWanchaiHong KongTel : (852) 2866 9199Fax : (852) 2865 0321www.emix.com.hk
Eastern Gotech (Guangzhou) LimitedRoom 1003-5DongBao BuildingNo. 767 Dongfengdong RoadGuangzhouChinaTel : (020) 3821 0811Fax : (020) 3821 0873
Parmarine LtdMurrontie 8PO BOX 95FIN - 30101 ForssaFinlandTel : (358) 377 77400Fax : (358) 341 27395www.parmarine.fi
Dubai Precast LLCPost Box 61055Jebel AliIndustrial Area No. 3Dubai, UAETel : (971) 4 8802671Fax : (971) 4 8802159www.dubaiprecast.ae
Properties & Investments
NSL Properties Pte LtdNSL Resorts International Pte LtdRaffles Marina Holdings LtdTimaru Pte Ltd77 Robinson Road#27-00 Robinson 77Singapore 068896Tel : (65) 6536 1000Fax : (65) 6536 1008
Raffles Marina Ltd10 Tuas West DriveSingapore 638404Tel : (65) 6861 8000Fax : (65) 6861 1020www.rafflesmarina.com.sg
N S L Lt d a n n u a l r e p o r t 2 0 0 9 | 1 6 N S L Lt d a n n u a l r e p o r t 2 0 0 9 | 1 7

20 Directors’ Report
22 Statement by Directors
23 Statement of Corporate Governance
31 Independent Auditor’s Report
33 Consolidated Income Statement
34 Consolidated Statement of Comprehensive Income
35 Balance Sheets
36 Consolidated Statement of Changes in Equity
38 Consolidated Statement of Cash Flows
40 Notes to the Financial Statements
105 Analysis of Shareholdings
107 Notice of Annual General Meeting
Proxy Form
finanCial review
N S L Lt d A N N U A L R E P O R T 2 0 0 9 | 2 0 N S L Lt d A N N U A L R E P O R T 2 0 0 9 | 2 1
The Directors present their report to the members together with the audited financial statements of the Group for the financial year ended 31 December 2009 and the balance sheet of the Company at 31 December 2009.
1. DIRECTORS OF THE COMPANY
The Directors of the Company in office at the date of this report are:
Prof CHAM Tao Soon ANG Kong Hua BAN Song Long David FU Kuo Chen John KOH Tiong Lu Dr TAN Tat Wai Pursuant to Article 86 of the Company’s Articles of Association,
(a) Mr Ang Kong Hua retires and being eligible, offers himself for re-election; and
(b) Mr Ban Song Long retires and being eligible, offers himself for re-election.
Pursuant to Section 153 (6) of Companies Act, Chapter 50:
Prof Cham Tao Soon, who has attained the age of 70 years, is required to retire but is eligible to stand for re-election, and offers himself for re-election.
2. ARRANGEMENTS TO ENABLE DIRECTORS TO ACQUIRE SHARES AND DEBENTURES
Neither at the end of nor at any time during the financial year was the Company a party to any arrangement whose object was to enable the Directors of the Company to acquire benefits through the acquisition of shares in, or debentures of, the Company or any other body corporate.
3. DIRECTORS’ INTERESTS IN SHARES AND DEBENTURES
According to the Register of Directors’ Shareholdings kept by the Company for the purpose of Section 164 of the Companies Act, none of the Directors of the Company at the beginning and at the end of the financial year and as at 21 January 2010 had any interest in the shares and debentures of the Company and its related corporations except, as follows:
Name of directors and corporations in Deemed Interestwhich interest held At 21.01.2010 At 31.12.2009 At 01.01.2009
NSL LtdOrdinary sharesProf Cham Tao Soon * 10,000 10,000 -
* Prof Cham Tao Soon is deemed to have an interest in the NSL Ltd shares held by his spouse.
DIRECTORS’ REPORT DIRECTORS’ REPORT

N S L Lt d A N N U A L R E P O R T 2 0 0 9 | 2 0 N S L Lt d A N N U A L R E P O R T 2 0 0 9 | 2 1
4. DIRECTORS’ CONTRACTUAL BENEFITS
Since the end of the previous financial year, no Director of the Company has received or become entitled to receive a benefit (other than as disclosed in the financial statements, Statement of Corporate Governance and paragraph 5 below) which is required to be disclosed by Section 201(8) of the Companies Act, being a benefit by reason of a contract made by the Company or a related corporation with the Director, or with a firm of which he is a member, or with a company in which he has a substantial financial interest, except that Mr Ang Kong Hua has an employment relationship with the Company and has received remuneration in that capacity.
5. MATERIAL CONTRACTS
Except as disclosed in the Statement of Corporate Governance and the financial statements, no material contract (including loans) of the Company or its subsidiaries involving the interests of the chief executive officer or any director or controlling shareholders subsisted at the end of the financial year or has been entered into since the end of the financial year or has been entered into since the end of the previous financial year.
6. SHARE OPTIONS
The NATSTEEL LTD Share Option Scheme expired on 19 September 2008.
7. AUDIT COMMITTEE
The Board of Directors has reviewed and is satisfied with the adequacy of internal controls which comes under the supervision of the Audit Committee. The details and function of the Audit Committee are set out in the Statement of Corporate Governance.
8. INDEPENDENT AUDITORS
PricewaterhouseCoopers LLP, being eligible, have expressed their willingness to accept re-appointment at the Annual General Meeting.
On behalf of the Directors
Prof CHAM Tao Soon ANG Kong HuaDirector Director
Singapore10 March 2010
DIRECTORS’ REPORT DIRECTORS’ REPORT

N S L Lt d A N N U A L R E P O R T 2 0 0 9 | 2 2 N S L Lt d A N N U A L R E P O R T 2 0 0 9 | 2 3
We do hereby state that, in the opinion of the Directors, the balance sheet of the Company and the consolidated financial statements of the Group as set out on pages 33 to 104 are drawn up so as to give a true and fair view of the state of affairs of the Company and of the Group at 31 December 2009, and of the results of the business, changes in equity and cash flows of the Group for the financial year then ended, and at the date of this statement, there are reasonable grounds to believe that the Company will be able to pay its debts as and when they fall due.
On behalf of the Directors
Prof CHAM Tao Soon ANG Kong HuaDirector Director
Singapore10 March 2010
STATEMENT BY DIRECTORS STATEMENT OF CORPORATE GOVERNANCE
N S L Lt d A N N U A L R E P O R T 2 0 0 9 | 2 2 N S L Lt d A N N U A L R E P O R T 2 0 0 9 | 2 3
The Board recognises that it is the focal point of corporate governance of NSL Ltd and its group of companies and believes that good corporate governance will, in the long term enhance return on capital through increased accountability. The Group had in 1998 adopted an internal Corporate Governance Guide which has been updated from time to time to reflect, as far as practicable, the changes to the Code of Corporate Governance issued by the Ministry of Finance (“2005 Code”) and the listing manual of the Singapore Exchange Securities Trading Limited (“SGX-ST”) and the Singapore Companies Act. NSL Ltd’s Corporate Governance Guide (2009) contains, inter alia, matters relating to code of conduct for employees, whistle-blower provisions, terms of reference for Audit Committee, Nominating Committee and Remuneration Committee and reporting procedures for interested person transactions, disclosure of directors’ interest and dealings in the Company’s securities.
The following describes the Company’s corporate governance practices with specific reference to the 2005 Code.
BOARD OF DIRECTORS
(Principles 1 to 6)
The Board charts the strategic course for NSL Ltd and its group of companies in its Chemicals, Engineering and Construction Products businesses.
The Board comprises the following members as at the date of this report:
Prof CHAM Tao Soon Non-Executive Chairman, IndependentANG Kong Hua ExecutiveBAN Song Long Non-Executive David FU Kuo Chen Non-Executive John KOH Tiong Lu Non-Executive, Independent Dr TAN Tat Wai Non-Executive, Independent
The Board, of which half comprise independent non-executive directors, is able to exercise its powers objectively and independently from Management.
The Board meets regularly to oversee the business affairs of the Group, approves financial objectives, annual budgets, investment and divestment proposals, business strategies and monitors standards of performance of the Group.
Board members are provided with adequate and timely information prior to board meetings and on an ongoing basis; and have separate and independent access to the Company’s senior management.
The Board has adopted an orientation programme for new directors.
Key information on the directors is set out on page 30.
STATEMENT BY DIRECTORS STATEMENT OF CORPORATE GOVERNANCE
N S L Lt d A N N U A L R E P O R T 2 0 0 9 | 2 4 N S L Lt d A N N U A L R E P O R T 2 0 0 9 | 2 5
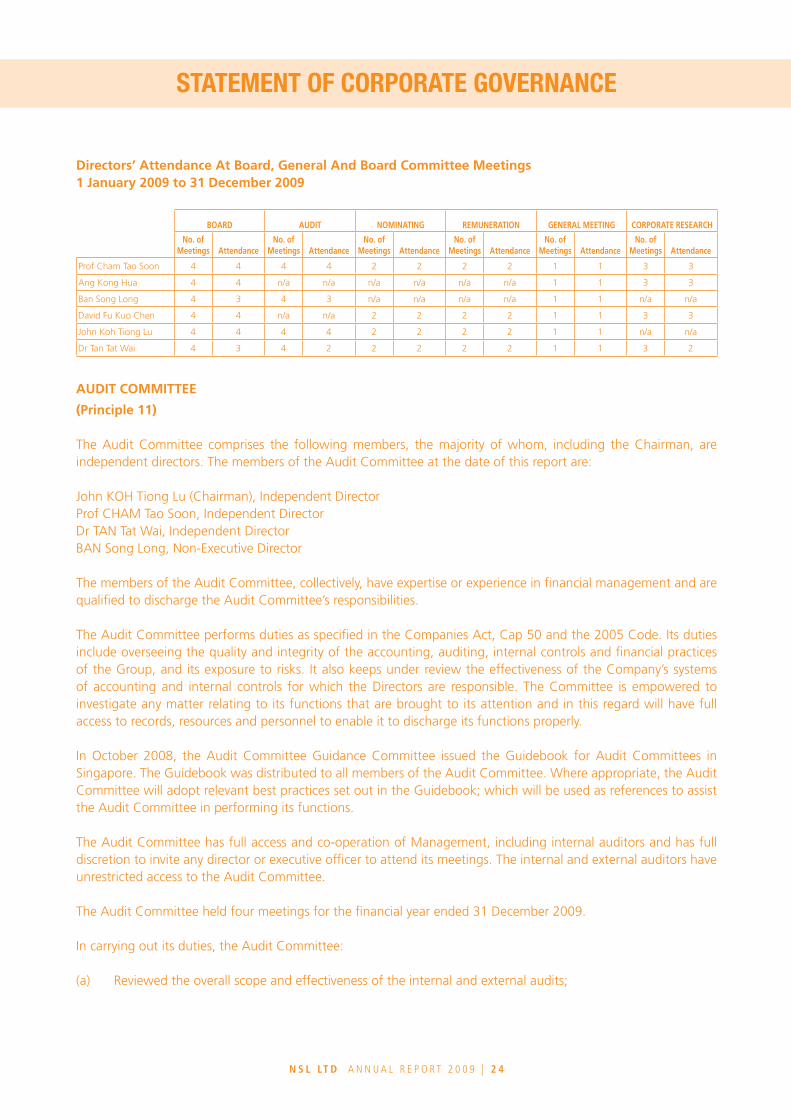
Directors’ Attendance At Board, General And Board Committee Meetings1 January 2009 to 31 December 2009
BOARD AUDIT NOMINATING REMUNERATION GENERAL MEETING CORPORATE RESEARCH
No. of Meetings Attendance
No. of Meetings Attendance
No. of Meetings Attendance
No. of Meetings Attendance
No. of Meetings Attendance
No. of Meetings Attendance
Prof Cham Tao Soon 4 4 4 4 2 2 2 2 1 1 3 3
Ang Kong Hua 4 4 n/a n/a n/a n/a n/a n/a 1 1 3 3
Ban Song Long 4 3 4 3 n/a n/a n/a n/a 1 1 n/a n/a
David Fu Kuo Chen 4 4 n/a n/a 2 2 2 2 1 1 3 3
John Koh Tiong Lu 4 4 4 4 2 2 2 2 1 1 n/a n/a
Dr Tan Tat Wai 4 3 4 2 2 2 2 2 1 1 3 2
AUDIT COMMITTEE
(Principle 11)
The Audit Committee comprises the following members, the majority of whom, including the Chairman, are independent directors. The members of the Audit Committee at the date of this report are:
John KOH Tiong Lu (Chairman), Independent DirectorProf CHAM Tao Soon, Independent DirectorDr TAN Tat Wai, Independent DirectorBAN Song Long, Non-Executive Director
The members of the Audit Committee, collectively, have expertise or experience in financial management and are qualified to discharge the Audit Committee’s responsibilities.
The Audit Committee performs duties as specified in the Companies Act, Cap 50 and the 2005 Code. Its duties include overseeing the quality and integrity of the accounting, auditing, internal controls and financial practices of the Group, and its exposure to risks. It also keeps under review the effectiveness of the Company’s systems of accounting and internal controls for which the Directors are responsible. The Committee is empowered to investigate any matter relating to its functions that are brought to its attention and in this regard will have full access to records, resources and personnel to enable it to discharge its functions properly.
In October 2008, the Audit Committee Guidance Committee issued the Guidebook for Audit Committees in Singapore. The Guidebook was distributed to all members of the Audit Committee. Where appropriate, the Audit Committee will adopt relevant best practices set out in the Guidebook; which will be used as references to assist the Audit Committee in performing its functions.
The Audit Committee has full access and co-operation of Management, including internal auditors and has full discretion to invite any director or executive officer to attend its meetings. The internal and external auditors have unrestricted access to the Audit Committee.
The Audit Committee held four meetings for the financial year ended 31 December 2009.
In carrying out its duties, the Audit Committee:
(a) Reviewed the overall scope and effectiveness of the internal and external audits;
STATEMENT OF CORPORATE GOVERNANCE STATEMENT OF CORPORATE GOVERNANCE

N S L Lt d A N N U A L R E P O R T 2 0 0 9 | 2 4 N S L Lt d A N N U A L R E P O R T 2 0 0 9 | 2 5
(b) Met with the internal and external auditors to discuss the results of their audits and their evaluation of the Company’s system of internal controls during the course of their audit. As a good practice, the Committee also met the internal and external auditors separately in the absence of Management;
(c) Reviewed the quarterly and annual financial statements and related SGXNET announcements before submission to the Board for approval;
(d) Reviewed, on an annual basis, non-audit services rendered to the Company by the external auditors to ascertain that the nature and extent of such services will not prejudice the independence and objectivity of the external auditors; and
(e) Being satisfied with the independence and objectivity of the external auditors, recommended to the Board of Directors the re-appointment of PricewaterhouseCoopers LLP as auditors of the Company at the forthcoming annual general meeting. The Committee also reviewed and approved the remuneration and terms of engagement of the external auditors.
The Audit Committee undertakes to investigate complaints of suspected fraud, unlawful business practices and unsafe working conditions in an objective manner and the Company has put in place a whistle-blower policy and procedures which provide employees with direct access to the Audit Committee Chairman.
NomiNatiNg Committee
(Principles 4 & 5)
The Nominating Committee (“NC”) comprises the following members:
Prof CHAM Tao Soon (Chairman), Independent Director Dr TAN Tat Wai, Independent DirectorJohn KOH Tiong Lu, Independent DirectorDavid FU Kuo Chen, Non-Executive Director
Under its terms of reference, the principal duties of the NC are:
• TomakerecommendationstotheBoardonallBoardappointmentsandre-nominations.
• ToproposeobjectiveperformancecriteriatoevaluatetheBoard’sperformance.
• Toassessanddetermineannuallytheindependenceofthedirectors.
The Company has in place a process for assessing the effectiveness of the Board as a whole.
RemuNeRatioN Committee
(Principles 7 to 9)
The Remuneration Committee (“RC”) comprises the following members:
Prof CHAM Tao Soon (Chairman), Independent Director Dr TAN Tat Wai, Independent DirectorJohn KOH Tiong Lu, Independent DirectorDavid FU Kuo Chen, Non-Executive Director
STATEMENT OF CORPORATE GOVERNANCE STATEMENT OF CORPORATE GOVERNANCE

N S L Lt d A N N U A L R E P O R T 2 0 0 9 | 2 6 N S L Lt d A N N U A L R E P O R T 2 0 0 9 | 2 7
Under its terms of reference, the principal duties of the RC include:
• Torecommendexecutiveandnon-executivedirectors’remunerationtotheBoardinaccordancewiththeapproved remuneration policies and processes of the Company.
• ToreviewandapproveChiefExecutiveOfficerandseniormanagement’sremuneration.
• Toreviewallbenefitsandlong-termincentiveschemes(includingshareoptionschemes)andcompensationpackages for the Board and senior management.
In reviewing and determining the remuneration packages of the executive directors and senior executives, the RC shall consider, amongst other things, their responsibilities, skills, expertise and contribution to the Company’s performance and if the remuneration packages are competitive and sufficient to ensure that the Company is able to attract and retain the best available executive talent.
REMUNERATION AND BENEFITS OF DIRECTORS AND KEY ExECUTIvES
The level and mix of each of the directors’ remuneration, and that of each of the Key Executives (who are not also Directors), in bands of S$250,000 are set out below:
(a) Directors
Remuneration Band & Name of Director
Base / Fixed
Salary(1)
variable or Performance-
related Income / Bonuses(1)
Directors’ Fees
Benefits-in-kind
Share Options
Granted(2)
Total Compensation
% % % % % %
S$750,000 to S$999,999ANG Kong Hua 38.6 53.7 5.7 2.0 - 100
Below S$250,000 - - 100 - - 100Prof CHAM Tao Soon - - 100 - - 100BAN Song Long - - 100 - - 100David FU Kuo Chen - - 100 - - 100John KOH Tiong Lu - - 100 - - 100Dr TAN Tat Wai - - 100 - - 100
(1) The salary and performance bonus amounts shown are inclusive of allowances, leave pay and CPF. (2) The NATSTEEL LTD Share Option Scheme expired on 19 September 2008.
STATEMENT OF CORPORATE GOVERNANCE STATEMENT OF CORPORATE GOVERNANCE

N S L Lt d A N N U A L R E P O R T 2 0 0 9 | 2 6 N S L Lt d A N N U A L R E P O R T 2 0 0 9 | 2 7
(b) Key Executives
The table below shows the level and mix of gross remuneration received by the top 5 executives (excluding executive directors) of the Group:
Remuneration Band & Name of Key Executive
Base / FixedSalary(1)
variable or Performance-
related Income / Bonuses(1)
Benefits-in-kind
Share Options
Granted(2)
Total Compensation
% % % % %
S$750,000 to S$999,999
Dr Josephine KWA Lay Keng 50.9 48.9 0.2 - 100
S$500,000 to S$749,999
CHONG Wai Siak 78.4 19.6 2.0 - 100
S$250,000 to S$499,999
Andy IP Kam Wa 79.3 20.7 - - 100Robert Arthur MILLS 46.8 53.2 - - 100Richard SIA Kim Siong 71.4 28.3 0.3 - 100
(1) The salary and performance bonus amounts shown are inclusive of allowances, leave pay and CPF. (2) The NATSTEEL LTD Share Option Scheme expired on 19 September 2008.
There is no employee whose remuneration exceeds $150,000 during the financial year who is an immediate family member of any Director or the major shareholder of the Company.
CORPORATE RESEARCH AND DEvELOPMENT ADvISORY PANEL
The Corporate Research and Development Advisory Panel (“CRD”) as at the date of this report comprises the following members:
Prof CHAM Tao Soon (Chairman)ANG Kong HuaDavid FU Kuo ChenLAM Siew WahLIM Swee CheangDr TAN Tat WaiProf TAY Joo Hwa
The CRD serves as a forum for open discussion between the academic circle, government bodies and the Group. Members comprise senior management, scientists and academicians from Universities and Government bodies. CRD usually meets 2 to 3 times a year.
STATEMENT OF CORPORATE GOVERNANCE STATEMENT OF CORPORATE GOVERNANCE
N S L Lt d A N N U A L R E P O R T 2 0 0 9 | 2 8 N S L Lt d A N N U A L R E P O R T 2 0 0 9 | 2 9
INTERNAL CONTROLS
(Principle 12)
The Board of Directors, with the assistance of the Audit Committee, ensures that the Management maintains an adequate system of internal controls to safeguard shareholders’ investment and the Company’s assets.
Management regularly reviews the Group’s business and operational activities to identify areas of significant risks as well as implement appropriate measures to control and mitigate these risks. These measures provide reasonable, but not absolute, assurance against material misstatements or loss, as well as ensure the safeguarding of assets, maintenance of proper accounting records and reliable financial information, and compliance with applicable law and regulations.
The nature and management of financial risks are discussed in Note 37 to the Financial Statements.
Review and tests of internal control procedures are carried out by the Company’s internal auditors. Significant internal control weaknesses noted by the internal auditors (if any) together with their recommendations, are included in their reports which are submitted to the Audit Committee.
INTERNAL AUDIT FUNCTION
(Principle 13)
The Company has an in-house internal audit department with a round-the-year internal audit program for the Group. The role of the internal auditors is to assist the Audit Committee to ensure that the Company maintains a sound system of internal controls and may undertake investigations as directed by the Audit Committee.
Internal Audit prepares an annual audit plan. The Audit Committee reviews and approves the annual internal audit plan, which complements that of the external auditors, so as to review the adequacy and effectiveness of the system of internal controls of the Group. The external auditors will highlight any material internal control weaknesses which have come to their attention in the course of their statutory audit. All audit findings and recommendations raised by the internal and external auditors are reported to the Audit Committee. Internal Audit follows up on all recommendations by internal and external auditors to ensure management has implemented these in a timely and appropriate manner and reports the results to the Audit Committee every quarter.
Staffed by suitably qualified executives, Internal Audit has unrestricted direct access to the Audit Committee. The Head of Internal Audit’s primary line of reporting is to the Chairman of the Audit Committee.
As a corporate member of the Singapore branch of the Institute of Internal Auditors Incorporated, USA (“IIA”), Internal Audit is guided by the Standards for the Professional Practice of Internal Auditing set by the IIA. These standards consist of attribute standards and performance standards.
STATEMENT OF CORPORATE GOVERNANCE STATEMENT OF CORPORATE GOVERNANCE
N S L Lt d A N N U A L R E P O R T 2 0 0 9 | 2 8 N S L Lt d A N N U A L R E P O R T 2 0 0 9 | 2 9
COMMUNICATION wITH SHAREHOLDERS
(Principles 10,14 & 15)
The Company makes all necessary disclosures to the public via SGXNET. When material information is disseminated to SGX-ST, such information is simultaneously posted on the Company’s website at www.nsl.com.sg.
The Board, endeavours, by the release of quarterly and full year results, to provide shareholders with a balanced and understandable assessment of the Company’s performance and prospects.
Shareholders of the Company receive the notice of the Annual General Meeting. The notice is also advertised in the newspapers. At annual general meetings, shareholders are given the opportunity to seek clarification from directors and management on the financial affairs of the Company. External auditors will be present to assist the directors in addressing relevant queries by shareholders.
The Company’s Articles of Association allows a member to appoint not more than 2 proxies to attend and vote instead of the member.
SECURITIES TRANSACTIONS
The Company has issued a policy on dealings in the securities of the Company to its Directors, employees and directors of its subsidiaries, setting out the implications of insider trading and guidance on such dealings.
STATEMENT OF CORPORATE GOVERNANCE STATEMENT OF CORPORATE GOVERNANCE

N S L Lt d A N N U A L R E P O R T 2 0 0 9 | 3 0 N S L Lt d A N N U A L R E P O R T 2 0 0 9 | 3 1
Name of DirectorAcademic & Professional
QualificationsBoard Committee as Chairman or Member
Directorship Date First Appointed
Date Last Re-Elected
Board Appointment
whether Executive or
Non-Executive
Due for Re-Election at AGM on 21 April 2010
Prof Cham Tao Soon • BachelorofEngineeringdegree from Malaya University
• BachelorofSciencedegreefrom University of London
• DoctorateofPhilosophydegree from University of Cambridge
• FellowoftheInstitutionofEngineers, Singapore
• FellowoftheInstitutionofMechanical Engineers, UK
Chairman:Nominating Committee
Remuneration Committee Corporate Research and Development Advisory Panel Member: Audit Committee
26 May 198816 April 2007
Non-Executive / Independent
Re-appointment pursuant to S153 (6) of the Companies Act, Chapter 50
Ang Kong Hua Bachelor of Science (Economics) (Honors) degree from University of Hull, United Kingdom
Member:Corporate Research and Development Advisory Panel
1 January 198116 April 2007
Executive (policy and strategy)
Retirement by Rotation (Article 86)
Ban Song Long Associate of the Institute of Bankers, London
Member: Audit Committee
25 January 2003 16 April 2008
Non-Executive Retirement by Rotation (Article 86)
David Fu Kuo Chen Bachelor of Science degree in Engineering from University of Southern California
Member:Nominating Committee
Remuneration Committee Corporate Research and Development Advisory Panel
25 January 2003 16 April 2008
Non-Executive N/A
John Koh Tiong Lu • LLMdegreefromHarvardLaw School
• BAandMAdegree(Economics and Law) from Trinity College, University of Cambridge
Chairman: Audit Committee Member:Nominating Committee
Remuneration Committee
30 January 2003 22 April 2009
Non-Executive / Independent
N/A
Dr Tan Tat Wai • BachelorofSciencedegrees in Electrical Engineering and Economics from Massachusetts Institute of Technology
• Master’sdegreesinEconomics from the University of Wisconsin (Madison) and Harvard University
• DoctorofPhilosophydegree in Economics from University of Harvard
Member:Audit Committee
Nominating Committee
Remuneration Committee Corporate Research and Development Advisory Panel
15 February 1993 22 April 2009
Non-Executive / Independent
N/A
STATEMENT OF CORPORATE GOVERNANCE INDEPENDENT AUDITOR’S REPORTPARTICULARS OF DIRECTORS AS AT 10 MARCH 2010

N S L Lt d A N N U A L R E P O R T 2 0 0 9 | 3 0 N S L Lt d A N N U A L R E P O R T 2 0 0 9 | 3 1
STATEMENT OF CORPORATE GOVERNANCE INDEPENDENT AUDITOR’S REPORTTO THE MEMBERS OF NSL LTD (formerly known as NATSTEEL LTD) (Incorporated in Singapore)
We have audited the accompanying financial statements of NSL Ltd (the “Company”) and its subsidiaries (the “Group”) set out on pages 33 to 104, which comprise the balance sheets of the Company and of the Group as at 31 December 2009, and the consolidated income statement, the consolidated statement of comprehensive income, the consolidated statement of changes in equity and the consolidated cash flow statement of the Group for the financial year then ended, and a summary of significant accounting policies and other explanatory notes.
MANAGEMENT’S RESPONSIBILITY FOR THE FINANCIAL STATEMENTS
Management is responsible for the preparation and fair presentation of these financial statements in accordance with the provisions of the Singapore Companies Act (Cap 50) (the “Act”) and Singapore Financial Reporting Standards. This responsibility includes:
a) devising and maintaining a system of internal accounting control sufficient to provide a reasonable assurance that assets are safeguarded against loss from unauthorised use or disposition; and transactions are properly authorised and that they are recorded as necessary to permit the preparation of true and fair profit and loss accounts and balance sheets and to maintain accountability of assets;
b) selecting and applying appropriate accounting policies; and
c) making accounting estimates that are reasonable in the circumstances.
AUDITOR’S RESPONSIBILITIES
Our responsibility is to express an opinion on these financial statements based on our audit. We conducted our audit in accordance with Singapore Standards on Auditing. Those Standards require that we comply with ethical requirements and plan and perform the audit to obtain reasonable assurance as to whether the financial statements are free from material misstatement.
An audit involves performing procedures to obtain audit evidence about the amounts and disclosures in the financial statements. The procedures selected depend on the auditor’s judgement, including the assessment of the risks of material misstatement of the financial statements, whether due to fraud or error. In making those risk assessments, the auditor considers internal control relevant to the entity’s preparation and fair presentation of the financial statements in order to design audit procedures that are appropriate in the circumstances, but not for the purpose of expressing an opinion on the effectiveness of the entity’s internal control. An audit also includes evaluating the appropriateness of accounting policies used and the reasonableness of accounting estimates made by the management, as well as evaluating the overall presentation of the financial statements.
We believe that the audit evidence we have obtained is sufficient and appropriate to provide a basis for our audit opinion.
N S L Lt d A N N U A L R E P O R T 2 0 0 9 | 3 2 N S L Lt d A N N U A L R E P O R T 2 0 0 9 | 3 3
OPINION
In our opinion,
(a) the balance sheet of the Company and consolidated financial statements of the Group are properly drawn up in accordance with the provisions of the Act and Singapore Financial Reporting Standards so as to give a true and fair view of the state of affairs of the Company and of the Group as at 31 December 2009, and the results, changes in equity and cash flows of the Group for the financial year ended on that date; and
(b) the accounting and other records required by the Act to be kept by the Company and by those subsidiaries incorporated in Singapore of which we are the auditor, have been properly kept in accordance with the provisions of the Act.
PricewaterhouseCoopers LLPPublic Accountants and Certified Public Accountants
Singapore, 10 March 2010
CONSOLIDATED INCOME STATEMENTINDEPENDENT AUDITOR’S REPORTTO THE MEMBERS OF NSL LTD (formerly known as NATSTEEL LTD) (Incorporated in Singapore)
N S L Lt d A N N U A L R E P O R T 2 0 0 9 | 3 2 N S L Lt d A N N U A L R E P O R T 2 0 0 9 | 3 3
CONSOLIDATED INCOME STATEMENTINDEPENDENT AUDITOR’S REPORTFor the financial year ended 31 December 2009
The GroupNote 2009
S$’0002008
S$’000
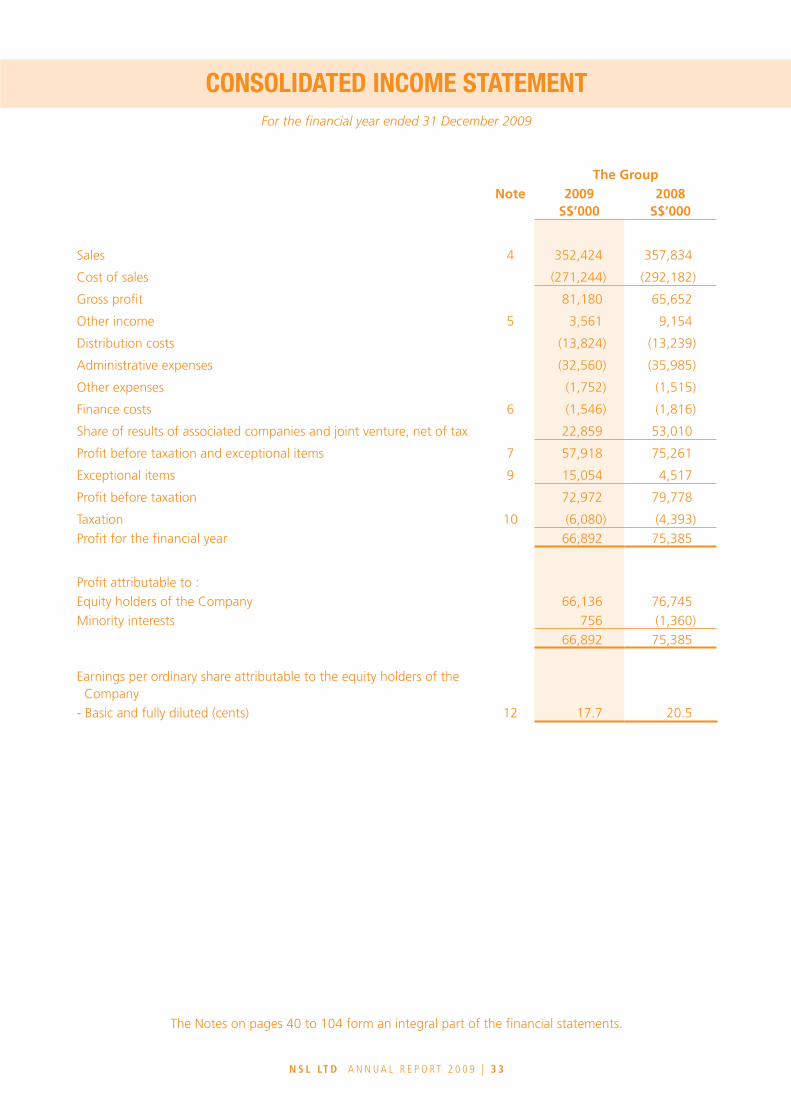
Sales 4 352,424 357,834
Cost of sales (271,244) (292,182)
Gross profit 81,180 65,652
Other income 5 3,561 9,154
Distribution costs (13,824) (13,239)
Administrative expenses (32,560) (35,985)
Other expenses (1,752) (1,515)
Finance costs 6 (1,546) (1,816)
Share of results of associated companies and joint venture, net of tax 22,859 53,010
Profit before taxation and exceptional items 7 57,918 75,261
Exceptional items 9 15,054 4,517
Profit before taxation 72,972 79,778
Taxation 10 (6,080) (4,393)Profit for the financial year 66,892 75,385
Profit attributable to :Equity holders of the Company 66,136 76,745Minority interests 756 (1,360)
66,892 75,385
Earnings per ordinary share attributable to the equity holders of the Company
- Basic and fully diluted (cents) 12 17.7 20.5
The Notes on pages 40 to 104 form an integral part of the financial statements.

N S L Lt d A N N U A L R E P O R T 2 0 0 9 | 3 4 N S L Lt d A N N U A L R E P O R T 2 0 0 9 | 3 5
The Group
Note 2009S$’000
2008S$’000
Profit for the financial year 66,892 75,385
Other comprehensive income:Exchange differences on translating foreign operations- Add: gains / (losses) arising during the year 1,327 (10,255)- Less: (gains) / losses included in profit or loss on disposal of
associated / subsidiary companies (91) 2,024
Available-for-sale financial assets- Add: gains / (losses) arising during the year 2,779 (2,464)- Less: (gains) / losses included in profit or loss (6,970) 1,595
Share of other comprehensive income of an associated company 7,219 (14,119)
Income tax relating to components of other comprehensive income 10 (757) 1,392
Other comprehensive income for the year, net of tax 3,507 (21,827)
Total comprehensive income for the year, net of tax 70,399 53,558
Total comprehensive income attributable to:Equity holders of the Company 69,680 55,006Minority interests 719 (1,448)
70,399 53,558
The Notes on pages 40 to 104 form an integral part of the financial statements.
BALANCE SHEETSCONSOLIDATED STATEMENT OF COMPREHENSIVE INCOMEFor the financial year ended 31 December 2009

N S L Lt d A N N U A L R E P O R T 2 0 0 9 | 3 4 N S L Lt d A N N U A L R E P O R T 2 0 0 9 | 3 5
The Group The Company
Note2009
S$’0002008
S$’0002009
S$’0002008
S$’000
SHARE CAPITAL 13 193,839 193,839 193,839 193,839RESERVES 14 301,444 306,476 90,287 130,826SHAREHOLDERS’ EQUITY 495,283 500,315 284,126 324,665MINORITY INTERESTS 13,727 13,184 - -TOTAL EQUITY 509,010 513,499 284,126 324,665
CURRENT ASSETSInventories 15 53,514 69,730 - -Receivables and prepayments 16 76,924 107,198 43,370 74,355Tax recoverable 2,655 2,461 1,544 1,544Available-for-sale financial assets 17 543 15,709 - -Cash and bank balances 18 146,520 171,452 52,437 88,882Other assets 584 - - -
280,740 366,550 97,351 164,781
NON-CURRENT ASSETSProperty, plant and equipment 19 135,645 138,944 95 67Investment properties 20 3,920 4,109 - -Subsidiaries 21 - - 73,402 73,402Associated companies and joint venture 22 171,943 144,853 - -Long term receivables 23 24,366 6,629 121,366 93,440Available-for-sale financial assets 17 14,435 15,852 14,139 14,814Intangible assets 24 9,559 9,760 - -Deferred tax assets 29 1,728 1,195 273 -Other non-current assets 159 595 - -
361,755 321,937 209,275 181,723TOTAL ASSETS 642,495 688,487 306,626 346,504
CURRENT LIABILITIESAmounts due to bankers 25 12,387 26,604 - -Trade and other payables 26 69,375 96,757 18,942 18,048Provision for other liabilities and charges 27 1,950 1,792 - -Current income tax liabilities 8,068 6,980 3,271 2,984Deferred income 31 341 341 - -
92,121 132,474 22,213 21,032
NON-CURRENT LIABILITIESProvision for retirement benefits 28 287 293 287 293Deferred tax liabilities 29 17,815 17,471 - 514Long term bank loans 30 16,958 20,591 - -Deferred income 31 3,326 3,458 - -Other non-current liabilities 32 2,978 701 - -
41,364 42,514 287 807TOTAL LIABILITIES 133,485 174,988 22,500 21,839
NET ASSETS 509,010 513,499 284,126 324,665
The Notes on pages 40 to 104 form an integral part of the financial statements.
BALANCE SHEETSCONSOLIDATED STATEMENT OF COMPREHENSIVE INCOMEAs at 31 December 2009
N S L Lt d A N N U A L R E P O R T 2 0 0 9 | 3 6 N S L Lt d A N N U A L R E P O R T 2 0 0 9 | 3 7
Attributable to equity holders of the Company Attributable to equity holders of the CompanyMinority Interests Total Equity
Note Share RevenueForeign Currency
Translation Capital Revaluation General Fair valueCapital Reserve Reserve Reserve Reserve Reserve Reserve TotalS$’000 S$’000 S$’000 S$’000 S$’000 S$’000 S$’000 S$’000 S$’000 S$’000
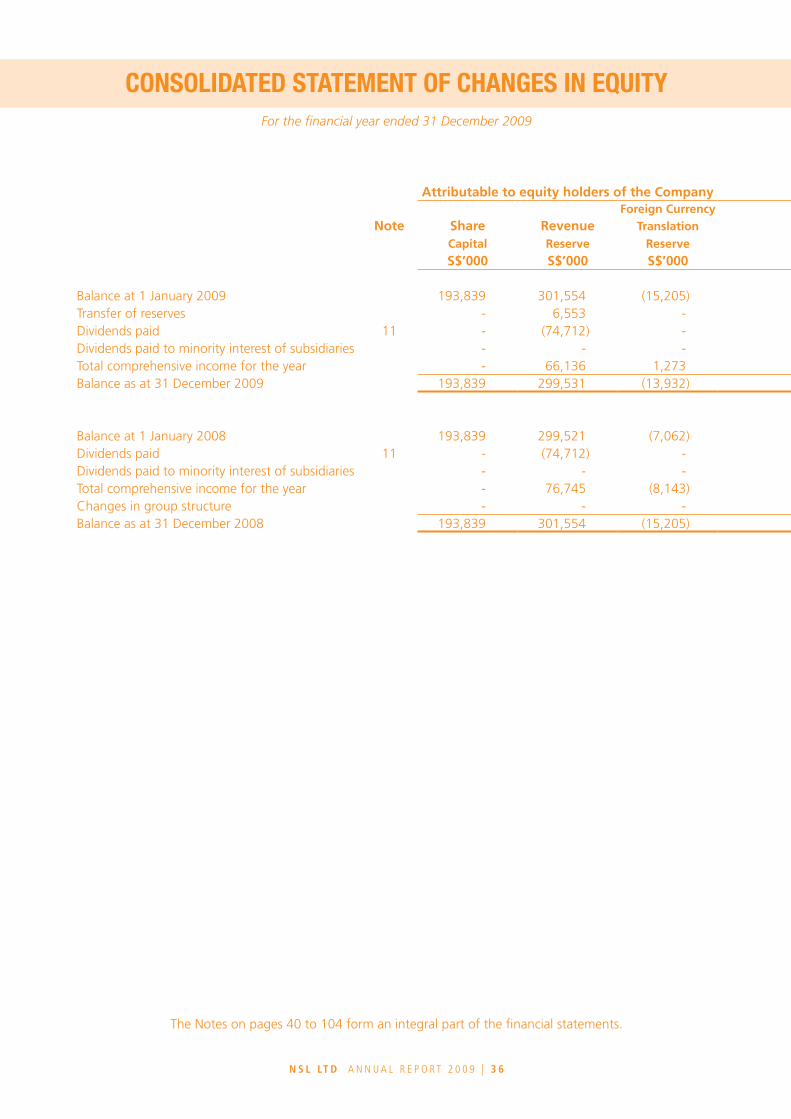
Balance at 1 January 2009 193,839 301,554 (15,205) 6,853 1,946 - 11,328 500,315 13,184 513,499Transfer of reserves - 6,553 - (6,853) - 300 - - - -Dividends paid 11 - (74,712) - - - - - (74,712) - (74,712)Dividends paid to minority interest of subsidiaries - - - - - - - - (176) (176)Total comprehensive income for the year - 66,136 1,273 - - - 2,271 69,680 719 70,399Balance as at 31 December 2009 193,839 299,531 (13,932) - 1,946 300 13,599 495,283 13,727 509,010
Balance at 1 January 2008 193,839 299,521 (7,062) 6,853 1,946 - 24,924 520,021 14,016 534,037Dividends paid 11 - (74,712) - - - - - (74,712) - (74,712)Dividends paid to minority interest of subsidiaries - - - - - - - - (128) (128)Total comprehensive income for the year - 76,745 (8,143) - - - (13,596) 55,006 (1,448) 53,558Changes in group structure - - - - - - - - 744 744Balance as at 31 December 2008 193,839 301,554 (15,205) 6,853 1,946 - 11,328 500,315 13,184 513,499
The Notes on pages 40 to 104 form an integral part of the financial statements. The Notes on pages 40 to 104 form an integral part of the financial statements.
CONSOLIDATED STATEMENT OF CHANGES IN EQUITYCONSOLIDATED STATEMENT OF CHANGES IN EQUITYFor the financial year ended 31 December 2009

N S L Lt d A N N U A L R E P O R T 2 0 0 9 | 3 6 N S L Lt d A N N U A L R E P O R T 2 0 0 9 | 3 7
Attributable to equity holders of the Company Attributable to equity holders of the CompanyMinority Interests Total Equity
Note Share RevenueForeign Currency
Translation Capital Revaluation General Fair valueCapital Reserve Reserve Reserve Reserve Reserve Reserve TotalS$’000 S$’000 S$’000 S$’000 S$’000 S$’000 S$’000 S$’000 S$’000 S$’000
Balance at 1 January 2009 193,839 301,554 (15,205) 6,853 1,946 - 11,328 500,315 13,184 513,499Transfer of reserves - 6,553 - (6,853) - 300 - - - -Dividends paid 11 - (74,712) - - - - - (74,712) - (74,712)Dividends paid to minority interest of subsidiaries - - - - - - - - (176) (176)Total comprehensive income for the year - 66,136 1,273 - - - 2,271 69,680 719 70,399Balance as at 31 December 2009 193,839 299,531 (13,932) - 1,946 300 13,599 495,283 13,727 509,010
Balance at 1 January 2008 193,839 299,521 (7,062) 6,853 1,946 - 24,924 520,021 14,016 534,037Dividends paid 11 - (74,712) - - - - - (74,712) - (74,712)Dividends paid to minority interest of subsidiaries - - - - - - - - (128) (128)Total comprehensive income for the year - 76,745 (8,143) - - - (13,596) 55,006 (1,448) 53,558Changes in group structure - - - - - - - - 744 744Balance as at 31 December 2008 193,839 301,554 (15,205) 6,853 1,946 - 11,328 500,315 13,184 513,499
The Notes on pages 40 to 104 form an integral part of the financial statements. The Notes on pages 40 to 104 form an integral part of the financial statements.
CONSOLIDATED STATEMENT OF CHANGES IN EQUITYCONSOLIDATED STATEMENT OF CHANGES IN EQUITYFor the financial year ended 31 December 2009

N S L Lt d A N N U A L R E P O R T 2 0 0 9 | 3 8 N S L Lt d A N N U A L R E P O R T 2 0 0 9 | 3 9
Note2009
S$’0002008
S$’000
Cash Flows from Operating ActivitiesProfit after tax for the financial year 66,892 75,385
Adjustments for:Taxation 6,080 4,393Amortisation of intangible assets 522 594Amortisation of deferred income (343) (343)Depreciation of property, plant and equipment and investment properties 15,302 14,811Property, plant and equipment written off 146 425Interest expense 1,546 1,816Interest income (615) (1,867)Dividend income (1,147) (4,981)Gain on sale of property, plant and equipment (net) (67) (644)(Write-back) / provision for retirement benefits (net) (6) 49Share of results of associated companies and joint venture, net of tax (22,859) (53,010)Exceptional items 9 (15,054) (4,517)Exchange differences (458) (1,561)Operating cash flows before working capital changes 49,939 30,550
Inventories 16,216 (17,705)Receivables and prepayments 28,434 (22,524)Intangible assets (326) (726)Deferred income 211 115Trade and other payables (20,166) 14,518Cash generated from operations 74,308 4,228
Income tax paid (5,739) (3,851)Insurance compensation received 783 5,000Net cash generated from operating activities 69,352 5,377
The Notes on pages 40 to 104 form an integral part of the financial statements.
CONSOLIDATED STATEMENT OF CASH FLOWSCONSOLIDATED STATEMENT OF CASH FLOWSFor the financial year ended 31 December 2009
N S L Lt d A N N U A L R E P O R T 2 0 0 9 | 3 8 N S L Lt d A N N U A L R E P O R T 2 0 0 9 | 3 9
Note2009
S$’0002008
S$’000
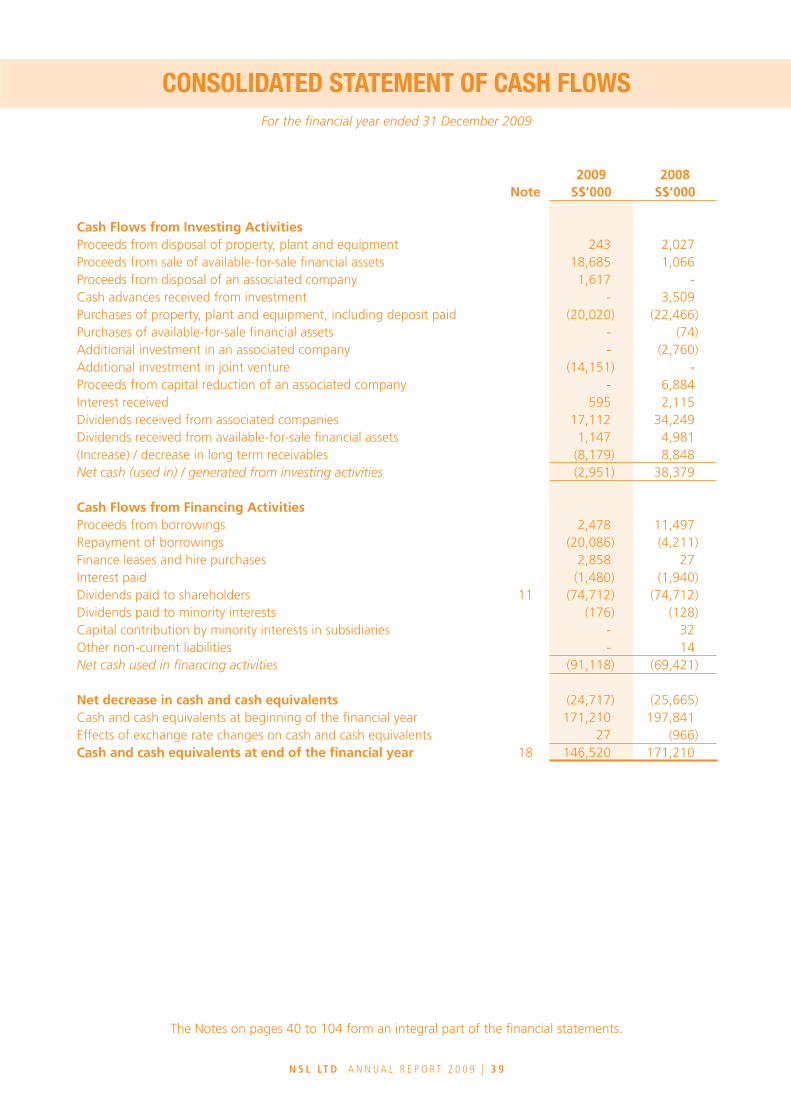
Cash Flows from Investing ActivitiesProceeds from disposal of property, plant and equipment 243 2,027Proceeds from sale of available-for-sale financial assets 18,685 1,066Proceeds from disposal of an associated company 1,617 -Cash advances received from investment - 3,509Purchases of property, plant and equipment, including deposit paid (20,020) (22,466)Purchases of available-for-sale financial assets - (74)Additional investment in an associated company - (2,760)Additional investment in joint venture (14,151) -Proceeds from capital reduction of an associated company - 6,884Interest received 595 2,115Dividends received from associated companies 17,112 34,249Dividends received from available-for-sale financial assets 1,147 4,981(Increase) / decrease in long term receivables (8,179) 8,848Net cash (used in) / generated from investing activities (2,951) 38,379
Cash Flows from Financing ActivitiesProceeds from borrowings 2,478 11,497Repayment of borrowings (20,086) (4,211)Finance leases and hire purchases 2,858 27Interest paid (1,480) (1,940)Dividends paid to shareholders 11 (74,712) (74,712)Dividends paid to minority interests (176) (128)Capital contribution by minority interests in subsidiaries - 32Other non-current liabilities - 14Net cash used in financing activities (91,118) (69,421)
Net decrease in cash and cash equivalents (24,717) (25,665)Cash and cash equivalents at beginning of the financial year 171,210 197,841Effects of exchange rate changes on cash and cash equivalents 27 (966)Cash and cash equivalents at end of the financial year 18 146,520 171,210
The Notes on pages 40 to 104 form an integral part of the financial statements.
CONSOLIDATED STATEMENT OF CASH FLOWSCONSOLIDATED STATEMENT OF CASH FLOWSFor the financial year ended 31 December 2009
N S L Lt d A N N U A L R E P O R T 2 0 0 9 | 4 0 N S L Lt d A N N U A L R E P O R T 2 0 0 9 | 4 1
These notes form an integral part of and should be read in conjunction with the accompanying financial statements.
1. GENERAL
The Company is incorporated and domiciled in Singapore and is listed on the Singapore Exchange Securities Trading Limited. The Company’s registered office is at 77 Robinson Road, #27-00 Robinson 77, Singapore 068896.
The principal activities of the Company are provision of management services and investment holding. The principal activities of its subsidiaries are mainly manufacturing and trading of building materials, lime and refractory products, design and sale of container handling spreaders, as well as provision of environmental services and sale of related products.
2. SIGNIFICANT ACCOUNTING POLICIES
A. Basis of preparation
The financial statements have been prepared in accordance with Singapore Financial Reporting Standards (“FRS”). The financial statements have been prepared under the historical cost convention, except as disclosed in the accounting policies below.
The preparation of financial statements in conformity with FRS requires management to exercise its judgement in the process of applying the Group’s accounting policies. It also requires the use of certain critical accounting estimates and assumptions. The areas involving a higher degree of judgement or complexity, or areas where assumptions and estimates are significant to the financial statements, are disclosed in Note 3.
These financial statements are expressed in thousands of Singapore Dollars.
B. Interpretations and amendments to published standards effective in 2009
On 1 January 2009, the Group adopted the new or amended FRS and Interpretations to FRS (“INT FRS”) that are mandatory for application from that date. Changes to the Group’s accounting policies have been made as required, in accordance with the transitional provisions in the respective FRS and INT FRS.
The following are the new or revised FRS or INT FRS that are relevant to the Group:
(1) FRS 1 (revised) Presentation of financial statements (effective from 1 January 2009). The revised standard prohibits the presentation of items of income and expenses (that is, ‘non-owner changes in equity’) in the statement of changes in equity. All non-owner changes in equity are shown in a performance statement, but entities can choose whether to present one performance statement (the statement of comprehensive income) or two statements (the income statement and statement of comprehensive income). The Group has chosen to adopt the latter alternative. Where comparative information is restated or reclassified, a restated balance sheet is required to be presented at the beginning comparative period. There is no restatement of the balance sheet as at 1 January 2008 in the current financial year.
(2) FRS 108 Operating segments (effective from 1 January 2009) replaces FRS 14 Segment Reporting, and requires a ‘management approach’, under which segment information is presented on the same basis as that used for internal reporting purposes. Segment revenue, segment profits and segment assets are also measured on a basis that is consistent with internal reporting. The adoption of the Standard has no impact to the financial position and results of the Group.
NOTES TO THE FINANCIAL STATEMENTS NOTES TO THE FINANCIAL STATEMENTSFor the financial year ended 31 December 2009

N S L Lt d A N N U A L R E P O R T 2 0 0 9 | 4 0 N S L Lt d A N N U A L R E P O R T 2 0 0 9 | 4 1
2. SIGNIFICANT ACCOUNTING POLICIES (continued)
B. Interpretations and amendments to published standards effective in 2009 (continued)
(3) Amendment to FRS 107 Improving disclosures about financial statements (effective from 1 January 2009). The amendment requires enhanced disclosures about fair value measurement and liquidity risk. In particular, the amendment requires disclosures of fair value measurements by level of a fair value measurement hierarchy (see Note 37e). The adoption of the amendment results in additional disclosures but does not have an impact on the accounting policies and measurement bases adopted by the Group.
C. Revenue recognition
Revenue of the Group comprises the fair value of the consideration received or receivable for the sale of goods and rendering of services and rental income, net of value-added tax, rebates and trade discounts, and after eliminating sales within the Group. Revenue is recognised as follows:
(1) Sale of goods Revenue from the sale of goods is recognised upon delivery to customers when significant risk and
rewards of ownership of the goods are transferred.
(2) Rendering of services
Revenue from rendering of services is recognised when the service is rendered.
This includes entrance fees and membership transfer fees of membership clubs which are recognised in profit or loss on a straight-line basis over the term of membership.
(3) Rental income
Rental income from operating lease on investment properties and property, plant and equipment are recognised on a straight-line basis over the lease term.
(4) Contract revenue
Contract revenue are recognised using the percentage-of-completion method (Note 2S). Contract revenue comprises the initial amount of revenue agreed in the contract and variations in the contract work and claims that can be measured reliably. A variation or a claim is recognised as contract revenue when it is probable that the customer will approve the variation or negotiations have reached an advanced stage such that it is probable that the customer will accept the claim.
(5) Dividend and interest income
Dividend income is recognised when the right to receive payment is established.
Interest income is recognised on a time apportionment basis using the effective interest method.
D. Cost of sales
Cost of sales comprises cost of purchased and manufactured goods sold, other relevant costs attributable to goods sold and costs of rendering services.
NOTES TO THE FINANCIAL STATEMENTS NOTES TO THE FINANCIAL STATEMENTSFor the financial year ended 31 December 2009

N S L Lt d A N N U A L R E P O R T 2 0 0 9 | 4 2 N S L Lt d A N N U A L R E P O R T 2 0 0 9 | 4 3
2. SIGNIFICANT ACCOUNTING POLICIES (continued)
E. Exceptional items Exceptional items are items of income and expense which are of such size, nature or incidence that their
disclosure is relevant to explain the performance of the Group.
F. Group accounting
(1) Subsidiaries
Subsidiaries are entities over which the Group has power to govern the financial and operating policies, generally accompanying a shareholding of more than one half of the voting rights. The existence and effect of potential voting rights that are currently exercisable or convertible are considered when assessing whether the Group controls another entity.
The purchase method of accounting is used to account for the acquisition of subsidiaries. The cost of an acquisition is measured as the fair value of the assets given, equity instruments issued or liabilities incurred or assumed at the date of exchange, plus costs directly attributable to the acquisition. Identifiable assets acquired and liabilities and contingent liabilities assumed in a business combination are measured initially at their fair values on the date of acquisition, irrespective of the extent of any minority interests. Refer to Note 2H for the accounting policy on goodwill on acquisition of subsidiaries.
Subsidiaries are consolidated from the date on which control is transferred to the Group to the date on which that control ceases. In preparing the consolidated financial statements, transactions, balances and unrealised gains on transactions between group companies are eliminated. Unrealised losses are also eliminated unless the transaction provides evidence of an impairment of the assets transferred. Adjustments are made to the financial statements of subsidiaries where necessary to ensure consistency with the policies adopted by the Group.
Minority interests are that part of the net results of operations and of net assets of a subsidiary attributable to interests which are not owned directly or indirectly by the Group. It is measured at the minorities’ share of the fair values of the subsidiaries’ identifiable assets and liabilities at the date of acquisition by the Group and the minorities’ share of changes in equity since the date of acquisition, except when the losses applicable to the minority interests in a subsidiary exceed the minority interests in the equity of that subsidiary. In such cases, the excess and further losses applicable to the minority interests are attributed to the equity holders of the Company, unless the minority interests have a binding obligation to, and are able to, make good the losses. When that subsidiary subsequently reports profits, the profits applicable to the minority interests are attributed to the equity holders of the Company until the minority interests’ share of losses previously absorbed by the equity holders of the Company are fully recovered.
Refer to Note 2K for the Company’s accounting policy on investments in subsidiaries.
(2) Transactions with minority interests
The Group applies a policy of treating transactions with minority interests as transaction with parties external to the Group. Disposal of minority interests, which result in gains and losses for the Group, are recorded in profit or loss. The difference between any consideration paid to minority interests for purchases of additional equity interest in a subsidiary and the incremental share of the carrying value of the net assets of the subsidiary is recognised as goodwill.
NOTES TO THE FINANCIAL STATEMENTS NOTES TO THE FINANCIAL STATEMENTSFor the financial year ended 31 December 2009

N S L Lt d A N N U A L R E P O R T 2 0 0 9 | 4 2 N S L Lt d A N N U A L R E P O R T 2 0 0 9 | 4 3
2. SIGNIFICANT ACCOUNTING POLICIES (continued)
F. Group accounting (continued)
(3) Associated companies and joint ventures
Associated companies are entities over which the Group has significant influence, but not control, generally accompanying a shareholding of between and including 20% and 50% of the voting rights. Joint ventures are entities over which the Group has contractual arrangements to jointly share the control over the economic activity of the entities with one or more parties. Investments in associated companies and joint ventures are accounted for in the consolidated financial statements using the equity method of accounting. Investments in associated companies and joint ventures in the consolidated balance sheet includes goodwill identified (net of accumulated impairment loss) on acquisition. Refer to Note 2H for the Group’s accounting policy on goodwill.
Investments in associated companies and joint ventures are initially recognised at cost. The cost of an acquisition is measured at the fair value of the assets given, equity instruments issued or liabilities incurred or assumed at the date of exchange, plus cost directly attributable to the acquisition.
In applying the equity method of accounting, the Group’s share of its associated companies’ and joint ventures’ post-acquisition profit or losses is recognised in profit or loss and its share of post-acquisition movements in reserves is recognised in equity directly. These post-acquisition movements are adjusted against the carrying amount of the investments. When the Group’s share of losses in an associated company or a joint venture equals or exceeds its investment in the associated company or joint venture, including any other unsecured receivables, the Group does not recognise further losses, unless it has obligations or has made payments on behalf of the associated company or joint venture.
In applying the equity method of accounting, unrealised gains on transactions between the Group and its associated companies or between the Group and its joint ventures are eliminated to the extent of the Group’s interest in the associated companies and joint ventures. Unrealised losses are also eliminated unless the transaction provides evidence of an impairment of the asset transferred. Where necessary, adjustments are made to the financial statements of associated companies and joint ventures to ensure consistency with the accounting policies adopted by the Group.
Refer to Note 2K for the Company’s accounting policy on investments in associated companies and joint ventures.
G. Property, plant and equipment
(1) Measurement
Other than a leasehold building in Singapore, property, plant and equipment are initially recorded at cost, and subsequently carried at cost, less accumulated depreciation and impairment losses (Note 2L). The leasehold building in Singapore was initially stated at cost and subsequently carried at fair value, less accumulated depreciation and impairment losses. The valuation of the leasehold building in Singapore was carried out in 1990 and the revaluation surplus was taken to revaluation reserve. The Group does not have a policy of periodic revaluation of the leasehold building. Accordingly, as the Group had performed a one-off revaluation on its property, plant and equipment between 1st January 1984 and 31st December 1996 (both dates inclusive), the Group is exempted from performing a regular revaluation.
NOTES TO THE FINANCIAL STATEMENTS NOTES TO THE FINANCIAL STATEMENTSFor the financial year ended 31 December 2009

N S L Lt d A N N U A L R E P O R T 2 0 0 9 | 4 4 N S L Lt d A N N U A L R E P O R T 2 0 0 9 | 4 5
2. SIGNIFICANT ACCOUNTING POLICIES (continued)
G. Property, plant and equipment (continued)
(1) Measurement (continued)
The cost of an item of property, plant and equipment includes its purchase price and any cost that is directly attributable to bringing the asset to the location and condition necessary for it to be capable of operating in the manner intended by the management. Cost also include borrowing costs that are directly attributable to the acquisition, construction or production of a qualifying asset (refer to Note 2I on borrowing costs).
(2) Depreciation
Freehold land and capital work-in-progress (“WIP”) are not depreciated. Depreciation of other property, plant and equipment is calculated using the straight-line method to allocate their depreciable amounts over their estimated useful lives as follows:
Leasehold land - over the remaining lease period ranging from 10 to 91 years Buildings - 10 to 50 years Leasehold improvements - 4 to 15 years Plant and machinery - 3 to 20 years Other assets - 2 to 15 years
Other assets comprise furniture and fittings, office appliances and equipment, tooling equipment and motor vehicles.
The residual values, estimated useful lives and depreciation method of property, plant and equipment are reviewed, and adjusted as appropriate, at each balance sheet date. The effects of any revision of the residual values and useful lives are included in profit or loss for the financial year in which the changes arise.
(3) Subsequent expenditure
Subsequent expenditure relating to property, plant and equipment that has already been recognised is added to the carrying amount of the asset only when it is probable that future economic benefits associated with the item, will flow to the Group and the cost can be reliably measured. All other repair and maintenance expense is recognised as an expense in profit or loss when incurred.
(4) Disposal
On disposal of a property, plant and equipment, the difference between the net disposal proceeds and its carrying amount is recognised in profit or loss; any amount in revaluation reserve relating to that asset is transferred to revenue reserve directly.
NOTES TO THE FINANCIAL STATEMENTS NOTES TO THE FINANCIAL STATEMENTSFor the financial year ended 31 December 2009
N S L Lt d A N N U A L R E P O R T 2 0 0 9 | 4 4 N S L Lt d A N N U A L R E P O R T 2 0 0 9 | 4 5
2. SIGNIFICANT ACCOUNTING POLICIES (continued)
H. Intangible assets
(1) Goodwill on acquisitions
Goodwill represents the excess of the cost of an acquisition of subsidiaries, associated companies or joint ventures over the fair value of the Group’s share of the identifiable net assets and contingent liabilities of the acquired subsidiaries, associated companies or joint ventures at the date of acquisition.
Goodwill on acquisition of subsidiaries is included in intangible assets and carried at cost less accumulated impairment losses (Note 2L). Goodwill on acquisition of associated companies and joint ventures are included in the carrying amount of investment in associated companies and joint ventures.
Goodwill on acquisition that occurred prior to 1 January 2001 was adjusted against revenue reserve in the year of acquisition. The Group also had acquisitions where the cost of acquisitions were less than fair value of the identifiable net assets acquired. Such differences (“negative goodwill”) were adjusted against revenue reserve in the year of acquisition. On disposal of the subsidiaries, associated companies or joint ventures, such goodwill and negative goodwill previously adjusted against revenue reserve are not recognised in profit or loss.
Gains and losses on the disposal of the subsidiaries, associated companies and joint ventures include the carrying amount of goodwill relating to the entity sold, but exclude those goodwill previously taken to revenue reserve (pre-January 2001 acquisition).
(2) Acquired intangible assets Acquired intangible assets consist of rights to business names, trademarks, tradenames, technology and licences are stated at cost less accumulated amortisation and accumulated impairment losses (Note 2L). The costs are amortised to profit or loss using the straight-line method over their expected useful life ranging from 3 to 5 years, which is the shorter of their estimated useful lives and period of contractual rights.
The amortisation period and amortisation method of intangible assets other than goodwill are reviewed at least at each balance sheet date. The effects of any revision are recognised in profit or loss when the changes arise.
I. Borrowing costs Borrowing costs are recognised on a time-proportion basis in profit or loss using the effective interest rate
method except for those costs that are directly attributable to the acquisition, construction and production of a qualifying asset which are capitalised into the cost of the qualifying asset. This includes those costs on borrowings acquired specifically, as well as general borrowings used for the purpose of obtaining the qualifying assets.
NOTES TO THE FINANCIAL STATEMENTS NOTES TO THE FINANCIAL STATEMENTSFor the financial year ended 31 December 2009
N S L Lt d A N N U A L R E P O R T 2 0 0 9 | 4 6 N S L Lt d A N N U A L R E P O R T 2 0 0 9 | 4 7
2. SIGNIFICANT ACCOUNTING POLICIES (continued)
J. Investment properties
Investment properties of the Group, principally comprising office and commercial buildings, are held for long term rental yields and capital appreciation and are not occupied by the Group.
Investment properties are initially recognised at cost and subsequently carried at cost less accumulated
depreciation and accumulated impairment losses (Note 2L). Depreciation is calculated using a straight-line method to allocate the depreciable amounts over the estimated useful lives ranging from 10 to 20 years. The residual values, useful lives and depreciation method of investment properties are reviewed, and adjusted as appropriate, at each balance sheet date. The effects of any revision are included in profit or loss when the changes arise.
On disposal of an investment property, the difference between the net disposal proceeds and the carrying amount is recognised in profit or loss.
K. Investments in subsidiaries, associated companies and joint ventures
Investments in subsidiaries, associated companies and joint ventures are stated at cost less accumulated impairment losses (Note 2L) in the Company’s balance sheet.
On disposal of investments in subsidiaries, associated companies and joint ventures, the difference between
net disposal proceeds and carrying amount of the investment is recognised in profit or loss.
L. Impairment of non-financial assets
(1) Goodwill
Goodwill is tested annually for impairment, as well as when there is any indication that the goodwill may be impaired. Goodwill included in the carrying amount of an investment in associated company or joint venture is tested for impairment as part of the investment, rather than separately. For the purpose of impairment testing of goodwill, goodwill is allocated to each of the Group’s cash-generating-unit (CGU) expected to benefit from synergies arising from the business combination.
An impairment loss is recognised in profit or loss when the carrying amount of CGU, including the goodwill, exceeds the recoverable amount of the CGU. Recoverable amount of the CGU is the higher of the CGU’s fair value less costs to sell and value-in-use.
The total impairment loss of a CGU is allocated first to reduce the carrying amount of goodwill allocated to the CGU and then to the other assets of the CGU pro-rata on the basis of the carrying amount of each asset in the CGU.
An impairment loss on goodwill is recognised in profit or loss and is not reversed in a subsequent period.
NOTES TO THE FINANCIAL STATEMENTS NOTES TO THE FINANCIAL STATEMENTSFor the financial year ended 31 December 2009

N S L Lt d A N N U A L R E P O R T 2 0 0 9 | 4 6 N S L Lt d A N N U A L R E P O R T 2 0 0 9 | 4 7
2. SIGNIFICANT ACCOUNTING POLICIES (continued)
L. Impairment of non-financial assets (continued)
(2) Other intangible assets Property, plant and equipment Investment properties Investment in subsidiaries, associated companies and joint ventures
Other intangible assets, property, plant and equipment, investment properties, investment in subsidiaries, associated companies and joint ventures are reviewed for impairment whenever there is objective evidence or indication that the asset may be impaired. If any such indication exists, the recoverable amount (i.e. the higher of the fair value less cost to sell and value-in-use) of the asset is estimated to determine the amount of impairment loss.
For the purpose of impairment testing of these assets, recoverable amount is determined on an individual asset basis unless the asset does not generate cash flows that are largely independent of those from other assets. If this is the case, recoverable amount is determined for the CGU to which the asset belongs to. If the recoverable amount of the assets (or CGU) is estimated to be less than its carrying amount, the carrying amount of the asset (or CGU) is reduced to its recoverable amount. The impairment loss is recognised in profit or loss, unless the asset is carried at revalued amount, in which case, such impairment loss is treated as a revaluation decrease.
An impairment loss for an asset (other than goodwill) is reversed if, and only if, there has been a change in the estimates used to determine the asset’s recoverable amount since the last impairment loss was recognised. The carrying amount of an asset (other than goodwill) is increased to its revised recoverable amount, provided that this amount does not exceed the carrying amount that would have been determined (net of amortisation or depreciation) had no impairment loss been recognised for the asset in prior years. The reversal of impairment loss for the asset (other than goodwill) is recognised in profit or loss, unless the asset is carried at revalued amount, in which case, such reversal is treated as a revaluation increase. However, to the extent that an impairment loss on the same revalued asset was previously recognised in profit or loss, a reversal of that impairment is also recognised in profit or loss.
M. Investments in financial assets (1) Classification
The Group classified its investments in financial assets in the following categories: financial assets at fair value through profit or loss, loans and receivables and available-for-sale financial assets. The classification depends on the purpose for which the assets were acquired. Management determines the classification of its financial assets at initial recognition and re-evaluates this designation at every reporting date, with the exception that the designation of financial assets at fair value through profit or loss is irrevocable.
NOTES TO THE FINANCIAL STATEMENTS NOTES TO THE FINANCIAL STATEMENTSFor the financial year ended 31 December 2009

N S L Lt d A N N U A L R E P O R T 2 0 0 9 | 4 8 N S L Lt d A N N U A L R E P O R T 2 0 0 9 | 4 9
2. SIGNIFICANT ACCOUNTING POLICIES (continued)
M. Investments in financial assets (continued) (1) Classification (continued)
(i) Financial assets at fair value through profit or loss Financial assets at fair value through profit or loss consist of “financial assets held for trading”
and those designated as at fair value through profit or loss at inception. A financial asset is classified as held for trading if acquired principally for the purpose of selling in the short term. Financial assets designated as at fair value through profit or loss at inception are those that are managed, and their performance are evaluated on a fair value basis, in accordance with a documented Group’s investment strategy. Derivatives are also categorised as held for trading unless they are designated as hedges. Assets in this category are classified as current assets if they are either held for trading or are expected to be realised within 12 months after the balance sheet date.
(ii) Loans and receivables Loans and receivables are non-derivative financial assets with fixed or determinable payments
that are not quoted in an active market. They arise when the Group provides money, goods or services directly to a debtor with no intention of trading the receivable. They are included in current assets, except those maturing more than 12 months after the balance sheet date which are classified as non-current assets. Loans and receivables are classified within cash and cash equivalents, receivables and prepayments and long term receivables except for non-current interest free receivables from subsidiary, associated companies and joint venture on the balance sheet which have been accounted for in accordance with note 2K.
(iii) Available-for-sale financial assets
Available-for-sale financial assets are non-derivatives that are either designated in this category or not classified in any of the other categories. They are included in non-current assets unless management intends to dispose of the assets within 12 months after the balance sheet date.
(2) Recognition and derecognition
Regular way purchases and sales of financial assets are recognised on trade date – the date on which the Group commits to purchase or sell the asset. Financial assets are derecognised when the rights to receive cash flows from the financial assets have expired or have been transferred and the Group has transferred substantially all risks and rewards of ownership.
On disposal of a financial asset, the difference between the net sale proceeds and its carrying amount is taken to profit or loss. Any amount in the fair value reserve relating to that asset is also taken to profit or loss.
Trade receivables that are factored out to banks and other financial institutions with recourse to the Group are not derecognised until the recourse period has expired and the risks and rewards of the receivables have been fully transferred. The corresponding cash received from the financial institutions is recorded as borrowings.
NOTES TO THE FINANCIAL STATEMENTS NOTES TO THE FINANCIAL STATEMENTSFor the financial year ended 31 December 2009

N S L Lt d A N N U A L R E P O R T 2 0 0 9 | 4 8 N S L Lt d A N N U A L R E P O R T 2 0 0 9 | 4 9
2. SIGNIFICANT ACCOUNTING POLICIES (continued)
M. Investments in financial assets (continued) (3) Initial measurement
Financial assets are initially recognised at fair value plus transaction costs except for financial assets at fair value through profit or loss, which are recognised at fair value. Transaction costs for financial assets at fair value through profit or loss are recognised immediately in profit or loss.
(4) Subsequent measurement
Available-for-sale financial assets and financial assets at fair value through profit or loss are subsequently carried at fair value. Loans and receivables are carried at amortised cost using the effective interest method.
Realised and unrealised gains and losses arising from changes in fair value of the “financial assets at fair value through profit or loss” including the effects of currency translation, interest and dividends, are recognised in profit or loss in the period in which the changes in fair value arise.
Changes in the fair value of assets, comprising equity securities, classified as available-for-sale are recognised in the fair value reserve within equity, together with the related currency translation differences. Dividend and interest income on available-for-sale equity securities are recognised separately in profit or loss when the Group’s right to receive payment is established. When investments classified as available-for-sale are sold, the accumulated fair value adjustments recognised in the fair value reserve within equity are included in profit or loss as gains and losses from available-for-sale financial assets.
(5) Determination of fair value
The fair values of quoted financial assets are based on current bid prices. If the market for a financial asset is not active, the Group establishes fair value by using valuation technique which is most appropriate in light of the nature, facts and circumstances of the investment (Note 2Q).
(6) Impairment
The Group assesses at each balance sheet date whether there is objective evidence that a financial asset or a group of financial assets is impaired and recognise an allowance for impairment when such evidence exists.
(i) Loans and receivables An allowance for impairment of loans and receivables, including trade and other receivables, is
recognised when there is objective evidence that the Group will not be able to collect all amounts due according to the original terms of the receivables. Significant financial difficulties of the debtor, probability that the debtor will enter bankruptcy or financial reorganisation, and default or delinquency in payments are considered indicators that the receivable is impaired. The amount of the allowance is the difference between the asset’s carrying amount and the present value of estimated future cash flows, discounted at the original effective interest rate. The amount of the allowance is recognised in profit or loss as administrative expenses. When the asset becomes uncollectible, it is written off against the allowance account. Subsequent recoveries of amounts previously written off are recognised against the same line in profit or loss.
NOTES TO THE FINANCIAL STATEMENTS NOTES TO THE FINANCIAL STATEMENTSFor the financial year ended 31 December 2009

N S L Lt d A N N U A L R E P O R T 2 0 0 9 | 5 0 N S L Lt d A N N U A L R E P O R T 2 0 0 9 | 5 1
2. SIGNIFICANT ACCOUNTING POLICIES (continued)
M. Investments in financial assets (continued) (6) Impairment (continued)
(i) Loans and receivables (continued) The allowance of impairment loss account is reduced through profit or loss in a subsequent
period when the amount of impairment loss decreases and the related decrease can be objectively measured. The carrying amount of the assets previously impaired is increased to the extent that the new carrying amount does not exceed the amortised cost had no impairment been recognised in prior periods.
(ii) Available-for-sale financial assets
In the case of equity securities classified as available-for-sale, significant or prolonged decline in the fair value of the securities below its cost and the disappearance of an active trading market for the security are considered in determining whether the securities are impaired. When there is objective evidence that an available-for-sale financial asset is impaired, the cumulative loss that has been recognised directly in the fair value reserve is transferred from the fair value reserve within equity and recognised in profit or loss. The cumulative loss is measured as the difference between the acquisition cost (net of any principal repayments and amortisation) and the current fair value, less any impairment loss on that financial asset previously recognised in profit or loss. Impairment losses recognised in profit or loss on equity instruments are not reversed through profit or loss.
N. Borrowings Borrowings, including non-interest bearing unsecured notes are recognised initially at fair value, net of
transaction costs incurred and subsequently carried at amortised cost. Any difference between the proceeds (net of transaction costs) and the redemption value is taken to profit or loss over the period of the borrowings using the effective interest method.
Borrowings which are due to be settled within 12 months after the balance sheet date are presented as current borrowings in the balance sheet even though the original term was for a period longer than 12 months and an agreement to refinance, or to reschedule payments, on a long-term basis is completed after the balance sheet date and before the financial statements are authorised for issue. Other borrowings due to be settled more than 12 months after the balance sheet date are presented as non-current borrowings in the balance sheet.
O. Trade and other payables
Trade and other payables are initially measured at fair value, and subsequently measured at amortised cost, using the effective interest method.
P. Derivative financial instruments
Forward foreign exchange contracts are classified as derivative financial instruments in the financial statement. Derivative financial instruments are initially recognised at fair value on the date the contracts are entered into and subsequently re-measured at their fair value. The Group does not adopt hedge accounting. Accordingly, changes in fair value of derivative financial instruments are recognised immediately in profit or loss.
NOTES TO THE FINANCIAL STATEMENTS NOTES TO THE FINANCIAL STATEMENTSFor the financial year ended 31 December 2009
N S L Lt d A N N U A L R E P O R T 2 0 0 9 | 5 0 N S L Lt d A N N U A L R E P O R T 2 0 0 9 | 5 1
2. SIGNIFICANT ACCOUNTING POLICIES (continued)
Q. Fair value estimation of financial assets and liabilities The fair values of financial instruments traded in active markets (such as exchange-traded and over-the-
counter securities and derivatives) are based on quoted market prices at the balance sheet date. The quoted market prices used for financial assets held by the Group are the current bid prices; the appropriate quoted market prices for financial liabilities are the current ask prices. The fair values of forward foreign exchange contracts are determined using actively quoted forward currency rates at the balance sheet date.
The fair values of financial instruments that are not traded in an active market are determined by using valuation techniques. The Group uses a variety of methods, and makes assumptions that are based on current market conditions existing at each balance sheet date. These include the use of recent arm’s length transactions, reference to other instruments that are substantially the same and discounted cash flow analysis. The Group also estimates the fair values of the financial assets by reference to the net assets of these equity securities, adjusting where applicable using appropriate measures to fair value the underlying assets and liabilities. In determining these fair values, management evaluates, among other factors, the reliability and appropriateness of the use of the underlying net asset information provided, taking into consideration factors such as industry and sector outlook, other market comparables and other prevailing market conditions.
The fair value of financial liabilities carried at amortised cost are estimated by discounting the future contractual cash flows at the current market interest rates that are available to the Group for similar financial liabilities.
The fair value of current financial assets and liabilities carried at amortised cost approximate their carrying amounts.
R. Inventories
Inventories are carried at the lower of cost and net realisable value. Cost is determined on a weighted average basis.
The cost of finished goods and work-in-progress comprises raw materials, direct labour, other direct costs and related production overheads (based on normal operating capacity) but excludes borrowing costs. Net realisable value is the estimated selling price in the ordinary course of business, less the cost of completion and selling expenses.
S. Construction contracts
When the outcome of a construction contract can be estimated reliably, contract revenue and contract costs are recognised as revenue and expenses respectively by reference to the stage of completion of the contract activity at the balance sheet date (“percentage-of-completion method”). When the outcome of a construction contract cannot be estimated reliably, contract revenue is recognised to the extent of contract costs incurred that are likely to be recoverable. When it is probable that total contract costs will exceed total contract revenue, the expected loss is recognised as an expense immediately.
NOTES TO THE FINANCIAL STATEMENTS NOTES TO THE FINANCIAL STATEMENTSFor the financial year ended 31 December 2009
N S L Lt d A N N U A L R E P O R T 2 0 0 9 | 5 2 N S L Lt d A N N U A L R E P O R T 2 0 0 9 | 5 3
2. SIGNIFICANT ACCOUNTING POLICIES (continued)
S. Construction contracts (continued)
The stage of completion is measured by reference to the contract costs incurred to date to the estimated total costs for the contract or by survey of work done, whichever is relevant to the contract. Costs incurred during the financial year in connection with future activity on a contract are excluded from costs incurred to date when determining the stage of completion of a contract. Such costs are shown as construction contract work-in-progress on the balance sheet unless it is not probable that such contract costs are recoverable from the customers, in which case, such costs are recognised as an expense immediately.
At the balance sheet date, the aggregated costs incurred plus recognised profit (less recognised loss) on each contract is compared against the progress billings. Where costs incurred plus the recognised profits (less recognised losses) exceed progress billings, the balance is included within trade receivables. Where progress billings exceed costs incurred plus recognised profits (less recognised losses), the balance is included within trade and other payables.
Progress billings not yet paid by customers and retentions are included within trade receivables. Advances received are included within trade and other payables.
T. Leases
(1) When a group company is the lessee:
The Group leases certain property, plant and equipment from non-related parties.
Finance leases
Leases of property, plant and equipment where the Group assumes substantially all the risks and rewards of ownership are classified as finance leases.
The leased assets and the corresponding leased liabilities (net of finance charges) under finance lease are recognised on the balance sheet as property, plant and equipment and borrowings respectively at the inception of the lease at the lower of the fair values of the leased assets and the present values of the minimum lease payments.
Each lease payment is apportioned between the finance charges and the reduction of the outstanding lease liability. The finance charge is recognised in profit or loss and allocated to each period during the lease term so as to achieve a constant periodic rate of interest on the remaining balance of the finance lease liability.
The property, plant and equipment acquired under finance leases are depreciated over the shorter of the useful life of the asset or the lease term.
NOTES TO THE FINANCIAL STATEMENTS NOTES TO THE FINANCIAL STATEMENTSFor the financial year ended 31 December 2009
N S L Lt d A N N U A L R E P O R T 2 0 0 9 | 5 2 N S L Lt d A N N U A L R E P O R T 2 0 0 9 | 5 3
2. SIGNIFICANT ACCOUNTING POLICIES (continued)
T. Leases (continued)
(1) When a group company is the lessee: (continued)
Operating leases
Leases of property, plant and equipment where a significant portion of the risks and rewards of ownership are retained by the lessor are classified as operating leases. Payments made under operating leases (net of any incentives received from the lessor) are taken to profit or loss on a straight-line basis over the period of the lease. Contingent rents are recognised as an expense in profit or loss in the financial year in which they are incurred.
When an operating lease is terminated before the lease period has expired, any payment required to be made to the lessor by way of penalty is recognised as an expense in the period in which termination takes place.
(2) When a group company is the lessor:
The Group leases out certain property, plant and equipment and investment properties to non-related parties.
Operating leases
Leases of assets where the Group retains substantially all risks and rewards incidental to ownership are classified as operating leases. Assets leased out under operating leases are included in certain property, plant and equipment and investment properties. The property, plant and equipment and investment properties are depreciated over the useful lives of the assets as set out in Note 2G and 2J. Rental income from operating leases (net of any incentives given to lessees) is recognised in profit or loss on a straight-line basis over the lease term. Contingent rents are recognised as income in profit or loss in the financial year in which they are earned.
Initial direct costs incurred by the Group in negotiating and arranging an operating lease are added to the carrying amount of the leased asset and recognised as an expense in profit or loss over the lease term on the same basis as the lease income.
U. Income taxes
Current income tax liabilities and assets for current and prior periods are recognised at the amounts expected to be paid to or recovered from the tax authorities, using the tax rates and tax laws that have been enacted or substantially enacted by the balance sheet date.
Deferred income tax assets / liabilities are recognised for all temporary differences arising between the tax bases of assets and liabilities and their carrying amounts in the financial statements. However, if the deferred income tax arises from initial recognition of goodwill or an asset or liability in a transaction that is not a business combination and affects neither accounting nor taxable profit or loss, it is not accounted for.
Deferred income tax liabilities are recognised on temporary differences arising on investments in subsidiaries, associated companies and joint ventures, except where the Group is able to control the timing of the reversal of the temporary difference and it is probable that the temporary difference will not reverse in the foreseeable future.
NOTES TO THE FINANCIAL STATEMENTS NOTES TO THE FINANCIAL STATEMENTSFor the financial year ended 31 December 2009

N S L Lt d A N N U A L R E P O R T 2 0 0 9 | 5 4 N S L Lt d A N N U A L R E P O R T 2 0 0 9 | 5 5
2. SIGNIFICANT ACCOUNTING POLICIES (continued)
U. Income taxes (continued)
Deferred income tax assets are recognised to the extent that it is probable that future taxable profit will be available against which the temporary differences and tax losses can be utilised.
Deferred income taxes are measured at:
(i) the tax rates that are expected to apply when the related deferred income tax assets are realised or the deferred income tax liabilities are settled, based on tax rates (and tax laws) that have been enacted or substantially enacted by the balance sheet date; and
(ii) the tax consequence that would follow from the manner in which the Group expects, at the balance sheet date, to cover or settle the carrying amounts of its assets and liabilities.
Current and deferred income taxes are recognised as income or expenses in profit or loss for the period, except to the extent that the tax arises from a business combination or a transaction which is recognised directly in equity. Deferred tax on temporary differences arising from the revaluation gains and losses on land and buildings, fair value gains and losses on available-for-sale financial assets are charged or credited directly to equity in the same period the temporary differences arise. Deferred tax arising from a business combination is adjusted against goodwill on acquisition.
V. Provisions for other liabilities and charges
Provisions for warranty and legal claims, if any, are recognised when the Group has a present legal or constructive obligation as a result of past events, it is more likely than not that an outflow of resources will be required to settle the obligation and a reliable estimate of the amount can be made. Provisions are not recognised for future operating losses.
The Group recognises the estimated liability to repair or replace products still under warranty at the balance sheet date. This provision is calculated based on past historical experience of the levels of repairs and replacements.
Provisions are measured at the present value of the expenditure expected to be required to settle the obligation using a pre-tax discount rate that reflects the current market assessment of the time value of money and the risks specific to the obligation. The increase in the provision due to the passage of time is recognised in profit or loss as interest expense.
Changes in the estimated timing or amount of the expenditure or discount rate are recognised in the profit or loss for the period the changes in estimates arise.
W. Employee compensation
(1) Defined contribution plans
Defined contribution plans are post-employment benefit plans under which the Group pays fixed contributions into separate entities such as Central Provident Fund on a mandatory, contractual or voluntary basis. The Group has no further legal or constructive payment obligations once the contributions have been paid. The Group’s contribution are recognised as employee compensation expense when they are due, unless they can be capitalised as an asset.
NOTES TO THE FINANCIAL STATEMENTS NOTES TO THE FINANCIAL STATEMENTSFor the financial year ended 31 December 2009

N S L Lt d A N N U A L R E P O R T 2 0 0 9 | 5 4 N S L Lt d A N N U A L R E P O R T 2 0 0 9 | 5 5
2. SIGNIFICANT ACCOUNTING POLICIES (continued)
W. Employee compensation (continued)
(2) Provision for retirement benefits The Company and a subsidiary operate separate unfunded defined retirement benefit schemes for certain employees.
Retirement benefits for employees are assessed using the projected unit credit method: the cost of providing retirement benefits is charged to profit or loss so as to spread the regular cost over the service lives of employees in accordance with the advice of the actuaries who carried out a full valuation of the plan at 31 December 2007. Valuations by actuaries are carried out on a triennial basis. The provision for retirement benefit is measured as the present value of the estimated future cash outflows using interest rates of high quality corporate bonds that are denominated in the currency in which the benefits will be paid and which have terms to maturity approximating the terms of the related liability. Actuarial gains and losses are recognised over the average remaining service lives of employees. Such benefits are unfunded.
(3) Employee leave entitlement
Employee entitlements to annual leave are recognised when they accrue to employees. A provision is made for the estimated liability for annual leave as a result of services rendered by employees up to the balance sheet date.
X. Foreign currency translation
(1) Functional and presentation currency
Items included in the financial statements of each entity in the Group are measured using the currency of the primary economic environment in which the entity operates (“functional currency”). The consolidated financial statements are presented in Singapore Dollars, which is the functional and presentation currency of the Company.
(2) Transaction and balances
Transactions in a currency other than the functional currency (“foreign currency”) are translated into the functional currency using the exchange rates prevailing at the date of transactions. Foreign currency monetary assets and liabilities are translated into the functional currency at the rates of exchange prevailing at the balance sheet date. Currency translation gains and losses resulting from the settlement of foreign currency transactions and from the translation of monetary assets and liabilities denominated in foreign currencies at the closing rates at the balance sheet date are recognised in profit or loss, except for currency translation differences on the net investment in foreign operations which are included in the currency translation reserve within equity in the consolidated financial statements and transferred to profit or loss as part of the gain or loss on disposal of the foreign operation.
Currency translation differences on non-monetary items when the gain or loss is recognised in profit
or loss, such as equity investments held at fair value through profit or loss, are reported as part of fair value gain or loss. Currency translation differences on non-monetary items when the gain or loss is recognised directly in equity, such as equity instruments classified as available-for-sale financial assets, are included in the fair value reserve within equity.
NOTES TO THE FINANCIAL STATEMENTS NOTES TO THE FINANCIAL STATEMENTSFor the financial year ended 31 December 2009

N S L Lt d A N N U A L R E P O R T 2 0 0 9 | 5 6 N S L Lt d A N N U A L R E P O R T 2 0 0 9 | 5 7
2. SIGNIFICANT ACCOUNTING POLICIES (continued)
X. Foreign currency translation (continued)
(3) Translation of Group’s entities’ financial statements
The results and financial position of all the group entities (none of which has the currency of a hyperinflationary economy) that have a functional currency other than Singapore Dollars are translated into Singapore Dollars as follows: (i) Assets and liabilities for each balance sheet presented are translated at the closing rate at the
date of that balance sheet; (ii) Income and expenses are translated at average exchange rates (unless this average is not a
reasonable approximation of the cumulative effect of the rates prevailing on the transaction dates, in which case income and expenses are translated using the exchange rates at the dates of the transactions); and
(iii) All resulting translation differences are taken to the foreign currency translation reserve within equity.
Goodwill and fair value adjustments arising on the acquisition of foreign operations on or after 1 January 2005 are treated as assets and liabilities of the foreign operations and translated at the closing rates at the date of the balance sheet. For acquisitions prior to 1 January 2005, the exchange rates at the dates of acquisition were used.
(4) Consolidation adjustments
On consolidation, currency translation differences arising from the translation of the net investment in foreign operations, borrowings in foreign currencies and other currency instruments designated as hedges of such investments, are taken to the foreign currency translation reserve within equity. When a foreign operation is disposed of, such currency translation differences are recognised in profit or loss as part of the gain or loss on disposal.
Y. Segment reporting
Operating segments are reported in a manner consistent with the internal reporting provided to the executive committee whose members are responsible for allocating resources and assessing performance of the operating segments.
Z. Cash and cash equivalents
Cash and cash equivalents include cash on hand, deposits with financial institutions and bank overdrafts. Bank overdrafts are included in current borrowings on the balance sheet.
AA. Share capital
Ordinary shares are classified as equity. Incremental costs directly attributable to the issuance of new ordinary shares are deducted against the share capital account.
AB. Dividends
Interim dividends are recorded in the financial year in which they are declared payable. Final dividends are recorded in the financial year in which the dividends are approved by the shareholders for payment.
NOTES TO THE FINANCIAL STATEMENTS NOTES TO THE FINANCIAL STATEMENTSFor the financial year ended 31 December 2009

N S L Lt d A N N U A L R E P O R T 2 0 0 9 | 5 6 N S L Lt d A N N U A L R E P O R T 2 0 0 9 | 5 7
3. CRITICAL ACCOUNTING ESTIMATES, ASSUMPTIONS AND JUDGEMENTS
Estimates, assumptions and judgements are continually evaluated and are based on historical experience and other factors, including expectations of future events that are believed to be reasonable under the circumstances. The Group makes estimates and assumptions concerning the future. The resulting accounting estimates will, by definition, seldom equal the related actual results. The estimates and assumptions that have a significant risk of causing a material adjustment to the carrying amounts of assets and liabilities within the next financial year are discussed below.
(1) Impairment of goodwill
Goodwill is tested for impairment annually in accordance with the accounting policy stated in Note 2L. The recoverable amounts of cash-generating units have been determined based on value-in-use calculations. These calculations require the use of estimates.
As at 31 December 2009, the Group recorded goodwill arising on consolidation of S$8,876,000 (Note 24a). The key estimates used in the assessment of the carrying value of goodwill relate to the budgeted sales growth and gross margin used. If management’s estimated sales growth rate relating to Construction Products were to decrease to 0.5% or if the discount rate were to increase by 10% from management's estimate, the recoverable amount of the goodwill will equal to its carrying value respectively, assuming the other variables remain unchanged.
(2) Income taxes The Group and the Company are subject to income taxes in numerous jurisdictions. Significant
judgement, including obtaining external tax advice where necessary, is required in determining the deductibility of certain expenses and taxability of certain income (including gain on disposal of subsidiaries and investments) during the estimation of the provision for income taxes. Where the final tax outcome of these matters is different from the amounts that were initially recorded, such differences will impact the income tax expense in the period in which such determination is made.
(3) Impairment of property, plant and equipment
Property, plant and equipment are reviewed for impairment whenever there is indication that the assets are impaired. If any such indication exists, the recoverable amount (i.e. higher of the fair value less cost to sell and value-in-use) of the asset is estimated to determine the impairment loss. These calculations require the use of estimates. For the current financial year, the Group recorded impairment charge of S$4,931,000 to reduce certain property, plant and equipment to its recoverable amount of S$1,814,000 (based on value-in-use calculations). If management’s estimated useful life of the property, plant and equipment were to increase / decrease by 10%, the recoverable amount would have increase / decrease by S$202,000.
(4) Impairment of loans and receivables
Management reviews its loans and receivables for objective evidence of impairment at least quarterly in accordance with the accounting policy stated in Note 2M. Significant financial difficulties of the debtor, the probability that the debtor will enter bankruptcy, and default or significant delay in payments are considered objective evidence that a receivable is impaired. In determining this, management makes judgement as to whether there is observable data indicating that there have been significant changes in the payment ability of the debtor, or whether there have been significant changes with adverse effect in the technological, market, economic or legal environment in which the debtor operates.
NOTES TO THE FINANCIAL STATEMENTS NOTES TO THE FINANCIAL STATEMENTSFor the financial year ended 31 December 2009

N S L Lt d A N N U A L R E P O R T 2 0 0 9 | 5 8 N S L Lt d A N N U A L R E P O R T 2 0 0 9 | 5 9
3. CRITICAL ACCOUNTING ESTIMATES, ASSUMPTIONS AND JUDGEMENTS (continued)
(4) Impairment of loans and receivables (continued)
Where there is objective evidence of impairment, management makes judgements as to whether an impairment loss should be recorded in profit or loss. In determining this, management uses estimates based on historical loss experience for asset with similar risk characteristics. As at 31 December 2009, the Group recorded allowance for impairment of trade receivables and long term receivables amounting to S$7,092,000 and S$988,000 respectively. Please refer to Note 37b for further analysis of the Group’s credit risk profile.
(5) Allowance for inventory write-down The Group carries its inventories at lower of cost and net realisable value. Valuation of inventories
is reviewed on a regular basis and the Group will record an allowance for write-down based on historical trend and estimates of expected and future product demand. As at 31 December 2009, the Group recorded allowance for inventory write-down amounting to S$1,629,000 and the charge for the financial year then ended is S$416,000.
(6) Fair value of available-for-sale financial assets
The available-for-sale financial assets of the Group and the Company comprise unlisted equity securities and other investments. As at 31 December 2009, fair value of available-for-sale financial assets of the Group and the Company amounted to S$14,978,000 and S$14,139,000 respectively (Note 17). The fair value of available-for-sale financial assets that are not traded in an active market (Level 3 fair value measurement) is determined by using valuation techniques in accordance with Note 2Q. The Group and the Company estimates the fair values of these financial assets by reference to the net assets of these unquoted equity securities, adjusting where applicable using appropriate measures to fair value the underlying assets and liabilities. In determining these fair values, management evaluates, among other factors, the reliability and appropriateness of the use of the underlying net asset information provided, taking into consideration factors such as industry and sector outlook, other market comparables and other prevailing market conditions.
NOTES TO THE FINANCIAL STATEMENTS NOTES TO THE FINANCIAL STATEMENTSFor the financial year ended 31 December 2009
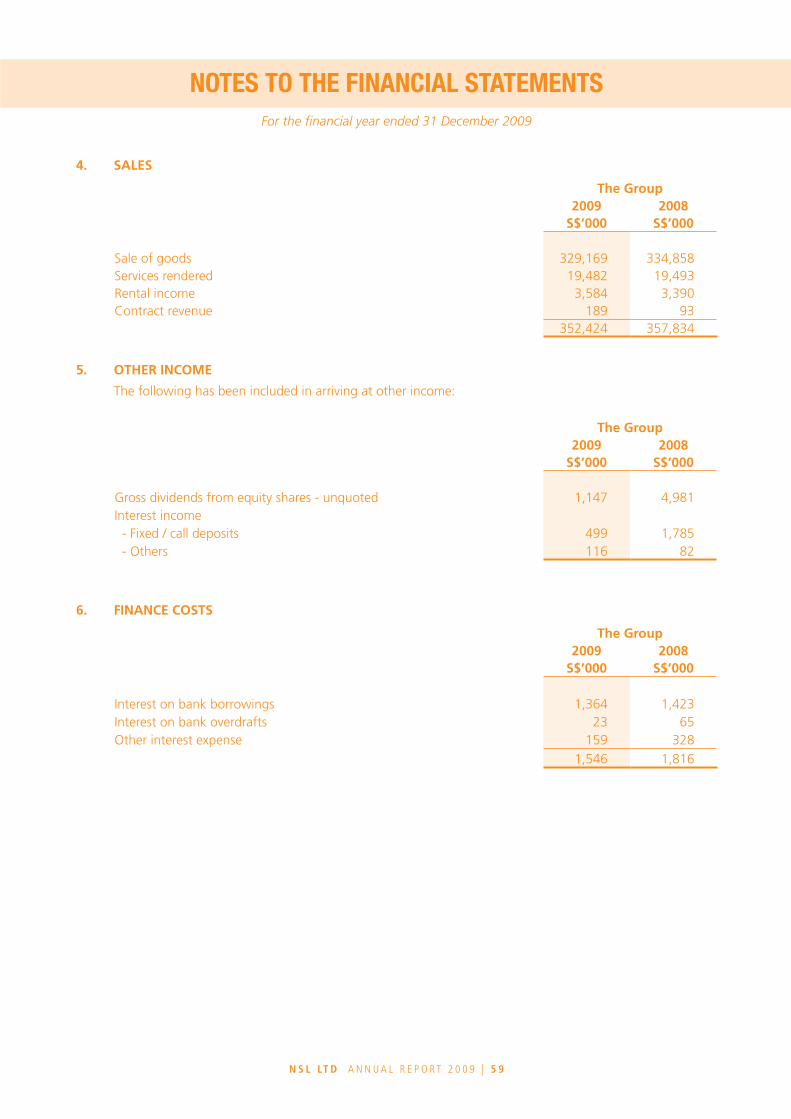
N S L Lt d A N N U A L R E P O R T 2 0 0 9 | 5 8 N S L Lt d A N N U A L R E P O R T 2 0 0 9 | 5 9
4. SALES
The Group2009
S$’0002008
S$’000
Sale of goods 329,169 334,858Services rendered 19,482 19,493Rental income 3,584 3,390Contract revenue 189 93
352,424 357,834
5. OTHER INCOME
The following has been included in arriving at other income:
The Group2009
S$’0002008
S$’000
Gross dividends from equity shares - unquoted 1,147 4,981Interest income - Fixed / call deposits 499 1,785 - Others 116 82
6. FINANCE COSTS
The Group2009
S$’0002008
S$’000
Interest on bank borrowings 1,364 1,423Interest on bank overdrafts 23 65Other interest expense 159 328
1,546 1,816
NOTES TO THE FINANCIAL STATEMENTS NOTES TO THE FINANCIAL STATEMENTSFor the financial year ended 31 December 2009
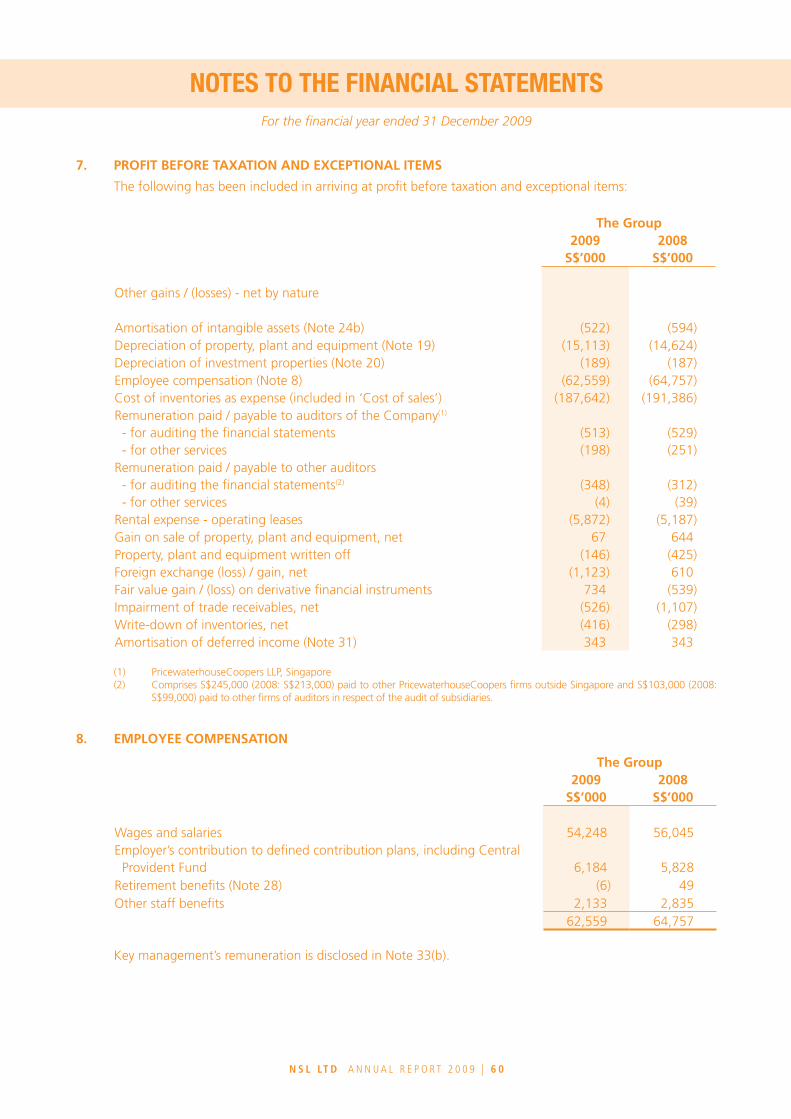
N S L Lt d A N N U A L R E P O R T 2 0 0 9 | 6 0 N S L Lt d A N N U A L R E P O R T 2 0 0 9 | 6 1
7. PROFIT BEFORE TAxATION AND ExCEPTIONAL ITEMS
The following has been included in arriving at profit before taxation and exceptional items:
The Group2009
S$’0002008
S$’000
Other gains / (losses) - net by nature
Amortisation of intangible assets (Note 24b) (522) (594)Depreciation of property, plant and equipment (Note 19) (15,113) (14,624)Depreciation of investment properties (Note 20) (189) (187)Employee compensation (Note 8) (62,559) (64,757)Cost of inventories as expense (included in ‘Cost of sales’) (187,642) (191,386)Remuneration paid / payable to auditors of the Company(1) - for auditing the financial statements - for other services
(513)(198)
(529)(251)
Remuneration paid / payable to other auditors - for auditing the financial statements(2)
- for other services(348)
(4)(312)
(39)Rental expense - operating leases (5,872) (5,187)Gain on sale of property, plant and equipment, net 67 644Property, plant and equipment written off (146) (425)Foreign exchange (loss) / gain, net (1,123) 610Fair value gain / (loss) on derivative financial instruments 734 (539)Impairment of trade receivables, net (526) (1,107)Write-down of inventories, net (416) (298)Amortisation of deferred income (Note 31) 343 343
(1) PricewaterhouseCoopers LLP, Singapore (2) Comprises S$245,000 (2008: S$213,000) paid to other PricewaterhouseCoopers firms outside Singapore and S$103,000 (2008:
S$99,000) paid to other firms of auditors in respect of the audit of subsidiaries.
8. EMPLOYEE COMPENSATION
The Group2009
S$’0002008
S$’000
Wages and salaries 54,248 56,045Employer’s contribution to defined contribution plans, including Central
Provident Fund 6,184 5,828Retirement benefits (Note 28) (6) 49Other staff benefits 2,133 2,835
62,559 64,757
Key management’s remuneration is disclosed in Note 33(b).
NOTES TO THE FINANCIAL STATEMENTS NOTES TO THE FINANCIAL STATEMENTSFor the financial year ended 31 December 2009

N S L Lt d A N N U A L R E P O R T 2 0 0 9 | 6 0 N S L Lt d A N N U A L R E P O R T 2 0 0 9 | 6 1
9. ExCEPTIONAL ITEMS
9a Exceptional items of the Group comprise:
The Group2009
S$’0002008
S$’000
Gain on disposal / liquidation of - subsidiary company - 395 - associated company 22 - - available-for-sale financial assets 19,516 519Reversal of impairment of investment in associated company 104 1,281Reversal of impairment of loan to associated company 447 -Insurance compensation (Note 9b) 213 2,500Reversal of impairment of loans receivable 1,589 7,000Recognition of deferred income upon expiry of options - 868Others 93 97Total gains 21,984 12,660
Loss on disposal of subsidiary company - (712)Loss on disposal of associated company - (288)Impairment of investment in associated companies (Note 22) (1,020) (68)Impairment of property, plant and equipment (Note 19) (4,931) (4,548)Impairment of available-for-sale financial assets (540) (1,595)Loss on disposal of available-for-sale financial assets (16) (98)Loss on cessation of business of a subsidiary - (21)Others (423) (813)Total losses (6,930) (8,143)
Net gains 15,054 4,517
9b Insurance compensation
A subsidiary of the Group had pursued insurance compensation for both material damages from physical loss of assets and consequential loss of income arising from business interruption following a fire accident at its premises in 2007. Insurance payout approved by its insurers (“approved payout”) during the financial year had been recognised as exceptional gain in the consolidated income statement. The subsidiary has not recognised any contingent asset in excess of the approved payout as the inflow and amount of this economic benefit is not virtually certain given that these claims are still under review by the insurers.
NOTES TO THE FINANCIAL STATEMENTS NOTES TO THE FINANCIAL STATEMENTSFor the financial year ended 31 December 2009

N S L Lt d A N N U A L R E P O R T 2 0 0 9 | 6 2 N S L Lt d A N N U A L R E P O R T 2 0 0 9 | 6 3
10. TAxATION
The GroupTaxation charge for the year comprises: 2009
S$’0002008
S$’000
Current taxation - Singapore 4,248 3,945 - Foreign 2,974 4,430Deferred taxation (Note 29) (345) 1,617
6,877 9,992
Over provision in respect of prior years:
- Current taxation (241) (5,154) - Deferred taxation (Note 29) (556) (445)
(797) (5,599)Taxation for the year 6,080 4,393
The Group2009
S$’0002008
S$’000
Deferred tax related to other comprehensive income (Note 29) - Net fair value gain of available-for-sale financial assets 43 17 - Share of associated companies’ net fair value (gain) / loss of available-
for-sale financial assets 714 (1,409)757 (1,392)
The tax expense on profit differs from the amount that would arise using the Singapore corporate income tax rate is as explained below.
The Group2009
S$’0002008
S$’000
Profit before taxation (before share of results of associated companies and joint venture(1)) 50,113 26,768
Tax calculated at a tax rate of 17% (2008: 18%) 8,519 4,818Income not subject to tax (4,966) (2,605)Expenses not deductible for tax purposes 2,073 2,891Effect of changes in tax rates (119) (90)Utilisation of previously unrecognised tax assets (791) (1,096)Tax benefit from current year’s tax losses not recognised 89 717Tax provision on unremitted income of an associated company 2,059 5,129Others 13 228Tax charge 6,877 9,992
(1) Share of results of associated companies and joint venture is net of tax expense of S$4,080,000 (2008: S$8,638,000).
During the financial year, the Singapore corporate rate was reduced from 18% to 17% for the year of
assessment 2010 and onwards.
NOTES TO THE FINANCIAL STATEMENTS NOTES TO THE FINANCIAL STATEMENTSFor the financial year ended 31 December 2009

N S L Lt d A N N U A L R E P O R T 2 0 0 9 | 6 2 N S L Lt d A N N U A L R E P O R T 2 0 0 9 | 6 3
11. DIvIDENDS
The Group and Company2009
S$’0002008
S$’000Ordinary dividends paidFinal / special dividend of 20 cents (2008: 10 cents) per share, exempt –
one tier, in respect of the previous financial year 74,712 37,356Interim dividend of nil cents (2008: 10 cents) per share, exempt – one tier,
in respect of current financial year - 37,35674,712 74,712
Subsequent to the year end, the Directors proposed a final dividend for financial year ended 31 December 2009 of 10 cents (2008: final dividend of 10 cents and special dividend of 10 cents) per share (exempt – one tier) amounting to a total of S$37,356,000 (2008: S$74,712,000). This dividend will be accounted for in the shareholders’ equity as an appropriation of retained earnings in the financial year ending 31 December 2010.
12. EARNINGS PER SHARE
Basic earnings per share is calculated by dividing the net profit attributable to equity holders of the Company by the weighted average number of ordinary shares in issue during the financial year.
For purposes of calculating diluted earnings per share, profit attributable to equity holders of the Company and the weighted average number of ordinary shares outstanding are adjusted for effects of all dilutive potential ordinary shares. The Company does not have any potential ordinary shares with dilutive potential.
The Group2009
S$’000 2008
S$’000
Net profit attributable to equity holders of the Company 66,136 76,745
Shares’000
Shares’000
Weighted average number of ordinary shares in issue used in computing basic earnings per share 373,558 373,558
Basic and fully diluted earnings per share 17.7 cents 20.5 cents
NOTES TO THE FINANCIAL STATEMENTS NOTES TO THE FINANCIAL STATEMENTSFor the financial year ended 31 December 2009
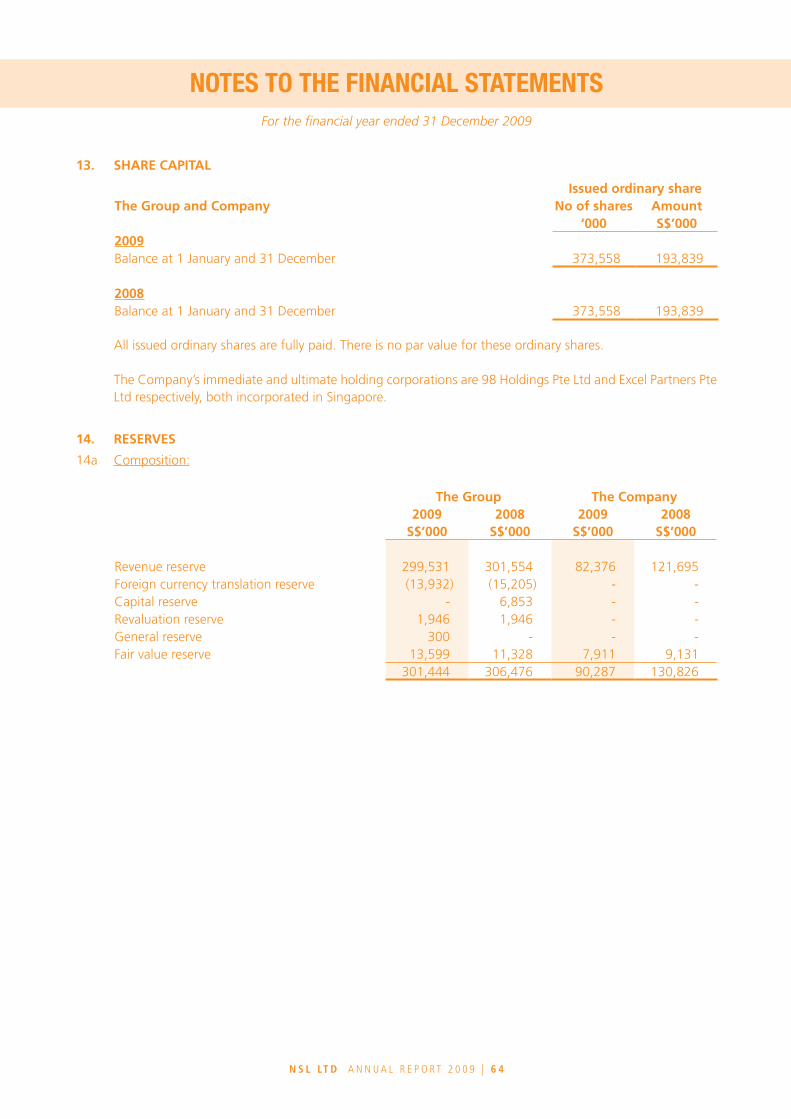
N S L Lt d A N N U A L R E P O R T 2 0 0 9 | 6 4 N S L Lt d A N N U A L R E P O R T 2 0 0 9 | 6 5
13. SHARE CAPITAL
Issued ordinary shareThe Group and Company No of shares Amount
‘000 S$’0002009Balance at 1 January and 31 December 373,558 193,839
2008Balance at 1 January and 31 December 373,558 193,839
All issued ordinary shares are fully paid. There is no par value for these ordinary shares.
The Company’s immediate and ultimate holding corporations are 98 Holdings Pte Ltd and Excel Partners Pte Ltd respectively, both incorporated in Singapore.
14. RESERvES
14a Composition:
The Group The Company2009
S$’0002008
S$’0002009
S$’0002008
S$’000
Revenue reserve 299,531 301,554 82,376 121,695Foreign currency translation reserve (13,932) (15,205) - -Capital reserve - 6,853 - -Revaluation reserve 1,946 1,946 - -General reserve 300 - - -Fair value reserve 13,599 11,328 7,911 9,131
301,444 306,476 90,287 130,826
NOTES TO THE FINANCIAL STATEMENTS NOTES TO THE FINANCIAL STATEMENTSFor the financial year ended 31 December 2009
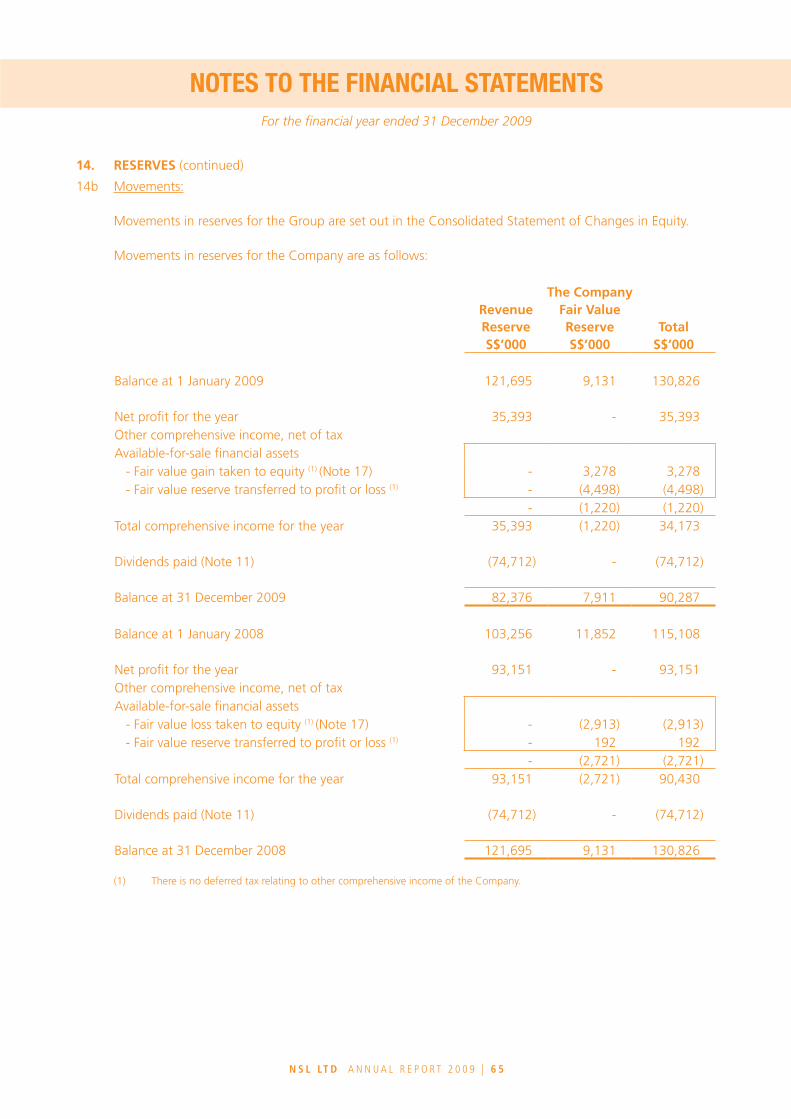
N S L Lt d A N N U A L R E P O R T 2 0 0 9 | 6 4 N S L Lt d A N N U A L R E P O R T 2 0 0 9 | 6 5
14. RESERvES (continued)
14b Movements:
Movements in reserves for the Group are set out in the Consolidated Statement of Changes in Equity.
Movements in reserves for the Company are as follows:
The CompanyRevenue Reserve
Fair value Reserve Total
S$’000 S$’000 S$’000
Balance at 1 January 2009 121,695 9,131 130,826
Net profit for the year 35,393 - 35,393Other comprehensive income, net of taxAvailable-for-sale financial assets - Fair value gain taken to equity (1) (Note 17) - 3,278 3,278 - Fair value reserve transferred to profit or loss (1) - (4,498) (4,498)
- (1,220) (1,220)Total comprehensive income for the year 35,393 (1,220) 34,173
Dividends paid (Note 11) (74,712) - (74,712)
Balance at 31 December 2009 82,376 7,911 90,287
Balance at 1 January 2008 103,256 11,852 115,108
Net profit for the year 93,151 - 93,151Other comprehensive income, net of taxAvailable-for-sale financial assets - Fair value loss taken to equity (1) (Note 17) - (2,913) (2,913) - Fair value reserve transferred to profit or loss (1) - 192 192
- (2,721) (2,721)Total comprehensive income for the year 93,151 (2,721) 90,430
Dividends paid (Note 11) (74,712) - (74,712)
Balance at 31 December 2008 121,695 9,131 130,826
(1) There is no deferred tax relating to other comprehensive income of the Company.
NOTES TO THE FINANCIAL STATEMENTS NOTES TO THE FINANCIAL STATEMENTSFor the financial year ended 31 December 2009

N S L Lt d A N N U A L R E P O R T 2 0 0 9 | 6 6 N S L Lt d A N N U A L R E P O R T 2 0 0 9 | 6 7
15. INvENTORIES
The Group2009
S$’0002008
S$’000
At net realisable value Raw materials 33,124 40,511 Finished goods 15,058 20,110 General stores and consumables 3,032 3,294 Work-in-progress 2,300 5,815
53,514 69,730 The Group reversed inventory write-down of S$22,000 (2008: S$21,000), as the inventories were sold
above the carrying values during the financial year. The reversal has been included in “cost of sales” in the consolidated income statement.
Included in the Group’s inventories is S$621,000 (2008: S$474,000) charged by way of debentures to banks
for banking facilities granted (Note 25 and Note 30).
16. RECEIvABLES AND PREPAYMENTS
The Group The Company2009
S$’0002008
S$’0002009
S$’0002008
S$’000
Trade receivables - Associated companies 694 149 - - - Joint venture - 573 - - - Non-related parties 71,429 98,471 - -
72,123 99,193 - -Less: Allowance for impairment of trade receivables (7,092) (8,989) - -
65,031 90,204 - -Current portion of - Loans receivable (Note 23) - 4,159 - 2,509 - Less: Allowance for impairment of loans
receivable - (1,650) - -- 2,509 - 2,509
Non-trade amounts owing by - subsidiaries - - 42,981 71,571 - minority shareholders 1,819 1,846 - - - joint venture 147 - - -Prepayments 3,531 5,591 125 144Deposits 2,583 2,112 11 11Recoverable expenditure 571 2,171 252 115Insurance compensation receivable - 570 - -Sundry receivables 3,043 2,195 1 5Derivative financial instruments (Note 26) 199 - - -
76,924 107,198 43,370 74,355
NOTES TO THE FINANCIAL STATEMENTS NOTES TO THE FINANCIAL STATEMENTSFor the financial year ended 31 December 2009

N S L Lt d A N N U A L R E P O R T 2 0 0 9 | 6 6 N S L Lt d A N N U A L R E P O R T 2 0 0 9 | 6 7
16. RECEIvABLES AND PREPAYMENTS (continued)
Included in the amounts owing by subsidiaries (non-trade) are interest free amounts of S$14,512,000 (2008: S$42,992,000). The remaining balances (non-trade) bear interest at rates ranging from 2.3% to 3.1% (2008: 2.3% to 3.7%) per annum. Amounts owing by subsidiaries are unsecured and are expected to be repaid within the next 12 months after the balance sheet date.
Included in the amounts owing by joint venture (non-trade) are interest free amounts of S$28,000 (2008: S$nil). The remaining balances bear interest at 6.0% (2008: nil%) per annum. The amounts owing by joint venture are unsecured and are expected to be repaid within the next 12 months after the balance sheet date.
Amount owing from minority shareholders and sundry receivables are interest free, unsecured and are expected to be repaid within the next 12 months after the balance sheet date.
Impairment loss on trade receivables recognised as an expense and included in “administrative expenses” amounted to S$1,045,000 (2008: S$1,513,000).
17. AvAILABLE-FOR-SALE FINANCIAL ASSETS
The Group The Company2009
S$’0002008
S$’0002009
S$’0002008
S$’000
Balance at 1 January 31,561 34,495 14,814 18,274Fair value gain / (loss) taken to equity 2,779 (2,464) 3,278 (2,913)Additions - 74 - -Disposals (19,361) (547) (3,953) (547)Currency realignment (1) 3 - -Balance at 31 December 14,978 31,561 14,139 14,814
Current portion 543 15,709 - -Non-current portion 14,435 15,852 14,139 14,814
14,978 31,561 14,139 14,814
Certain available-for-sale financial assets which are expected to be realised within 12 months from the balance date are classified as current assets in the balance sheet.
Available-for-sale financial assets include the following:
The Group The Company2009
S$’0002008
S$’0002009
S$’0002008
S$’000
Unlisted securities - Equity securities 12,327 27,740 12,031 11,697 - Other investments 2,651 3,821 2,108 3,117
14,978 31,561 14,139 14,814
NOTES TO THE FINANCIAL STATEMENTS NOTES TO THE FINANCIAL STATEMENTSFor the financial year ended 31 December 2009

N S L Lt d A N N U A L R E P O R T 2 0 0 9 | 6 8 N S L Lt d A N N U A L R E P O R T 2 0 0 9 | 6 9
18. CASH AND BANK BALANCES
The Group The Company2009
S$’0002008
S$’0002009
S$’0002008
S$’000
Fixed / call deposits 82,749 113,962 50,683 86,139Cash at bank and on hand 63,771 57,490 1,754 2,743
146,520 171,452 52,437 88,882 The fixed deposits with financial institutions mature on varying dates within 4 months (2008: 3 months)
from the financial year end. The weighted average interest rate of these deposits as at 31 December 2009 was 0.4% (2008: 1.1%) per annum.
For the purpose of the consolidated statement of cash flows, the consolidated cash and cash equivalents comprise the following:
The Group2009
S$’0002008
S$’000
Cash and bank balances (as above) 146,520 171,452Bank overdrafts (Note 25) - (242)Cash and cash equivalents 146,520 171,210
NOTES TO THE FINANCIAL STATEMENTS NOTES TO THE FINANCIAL STATEMENTSFor the financial year ended 31 December 2009
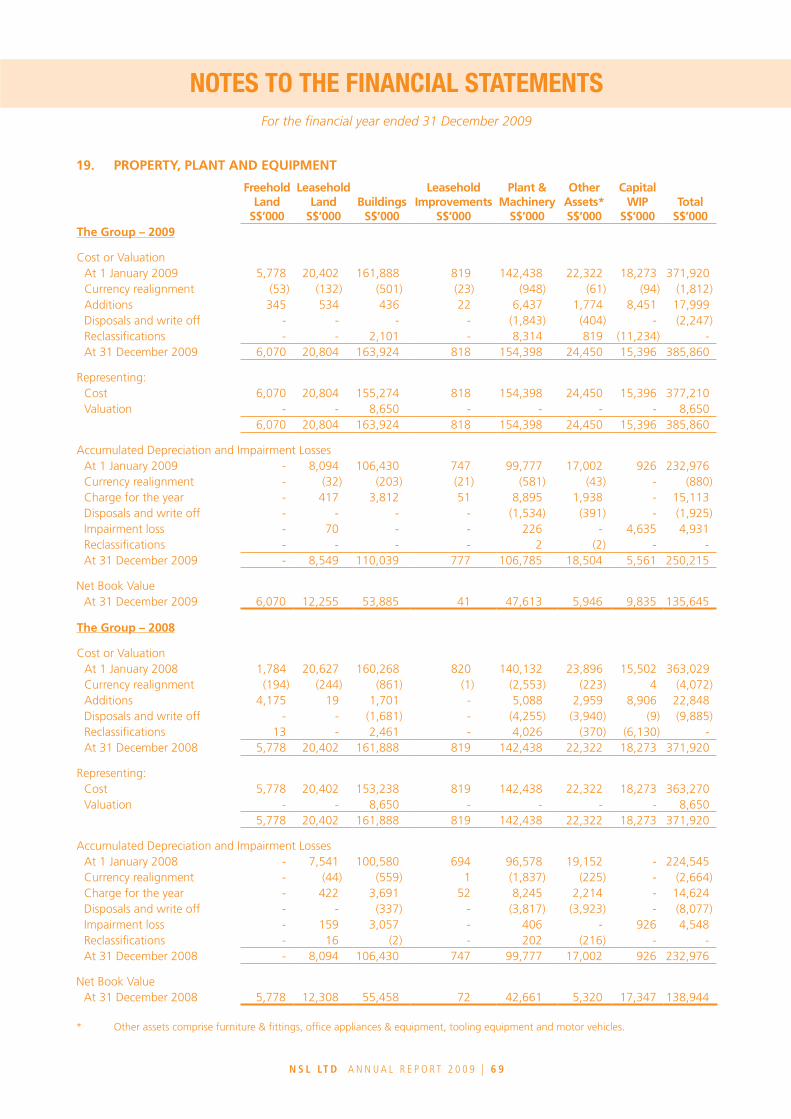
N S L Lt d A N N U A L R E P O R T 2 0 0 9 | 6 8 N S L Lt d A N N U A L R E P O R T 2 0 0 9 | 6 9
19. PROPERTY, PLANT AND EQUIPMENT
FreeholdLand
S$’000
LeaseholdLand
S$’000Buildings
S$’000
LeaseholdImprovements
S$’000
Plant &Machinery
S$’000
OtherAssets*S$’000
CapitalwIP
S$’000Total
S$’000The Group – 2009
Cost or Valuation At 1 January 2009 5,778 20,402 161,888 819 142,438 22,322 18,273 371,920 Currency realignment (53) (132) (501) (23) (948) (61) (94) (1,812) Additions 345 534 436 22 6,437 1,774 8,451 17,999 Disposals and write off - - - - (1,843) (404) - (2,247) Reclassifications - - 2,101 - 8,314 819 (11,234) - At 31 December 2009 6,070 20,804 163,924 818 154,398 24,450 15,396 385,860
Representing: Cost 6,070 20,804 155,274 818 154,398 24,450 15,396 377,210 Valuation - - 8,650 - - - - 8,650
6,070 20,804 163,924 818 154,398 24,450 15,396 385,860
Accumulated Depreciation and Impairment Losses At 1 January 2009 - 8,094 106,430 747 99,777 17,002 926 232,976 Currency realignment - (32) (203) (21) (581) (43) - (880) Charge for the year - 417 3,812 51 8,895 1,938 - 15,113 Disposals and write off - - - - (1,534) (391) - (1,925) Impairment loss - 70 - - 226 - 4,635 4,931 Reclassifications - - - - 2 (2) - - At 31 December 2009 - 8,549 110,039 777 106,785 18,504 5,561 250,215
Net Book Value At 31 December 2009 6,070 12,255 53,885 41 47,613 5,946 9,835 135,645
The Group – 2008
Cost or Valuation At 1 January 2008 1,784 20,627 160,268 820 140,132 23,896 15,502 363,029 Currency realignment (194) (244) (861) (1) (2,553) (223) 4 (4,072) Additions 4,175 19 1,701 - 5,088 2,959 8,906 22,848 Disposals and write off - - (1,681) - (4,255) (3,940) (9) (9,885) Reclassifications 13 - 2,461 - 4,026 (370) (6,130) - At 31 December 2008 5,778 20,402 161,888 819 142,438 22,322 18,273 371,920
Representing: Cost 5,778 20,402 153,238 819 142,438 22,322 18,273 363,270 Valuation - - 8,650 - - - - 8,650
5,778 20,402 161,888 819 142,438 22,322 18,273 371,920
Accumulated Depreciation and Impairment Losses At 1 January 2008 - 7,541 100,580 694 96,578 19,152 - 224,545 Currency realignment - (44) (559) 1 (1,837) (225) - (2,664) Charge for the year - 422 3,691 52 8,245 2,214 - 14,624 Disposals and write off - - (337) - (3,817) (3,923) - (8,077) Impairment loss - 159 3,057 - 406 - 926 4,548 Reclassifications - 16 (2) - 202 (216) - - At 31 December 2008 - 8,094 106,430 747 99,777 17,002 926 232,976
Net Book Value At 31 December 2008 5,778 12,308 55,458 72 42,661 5,320 17,347 138,944
* Other assets comprise furniture & fittings, office appliances & equipment, tooling equipment and motor vehicles.
NOTES TO THE FINANCIAL STATEMENTS NOTES TO THE FINANCIAL STATEMENTSFor the financial year ended 31 December 2009
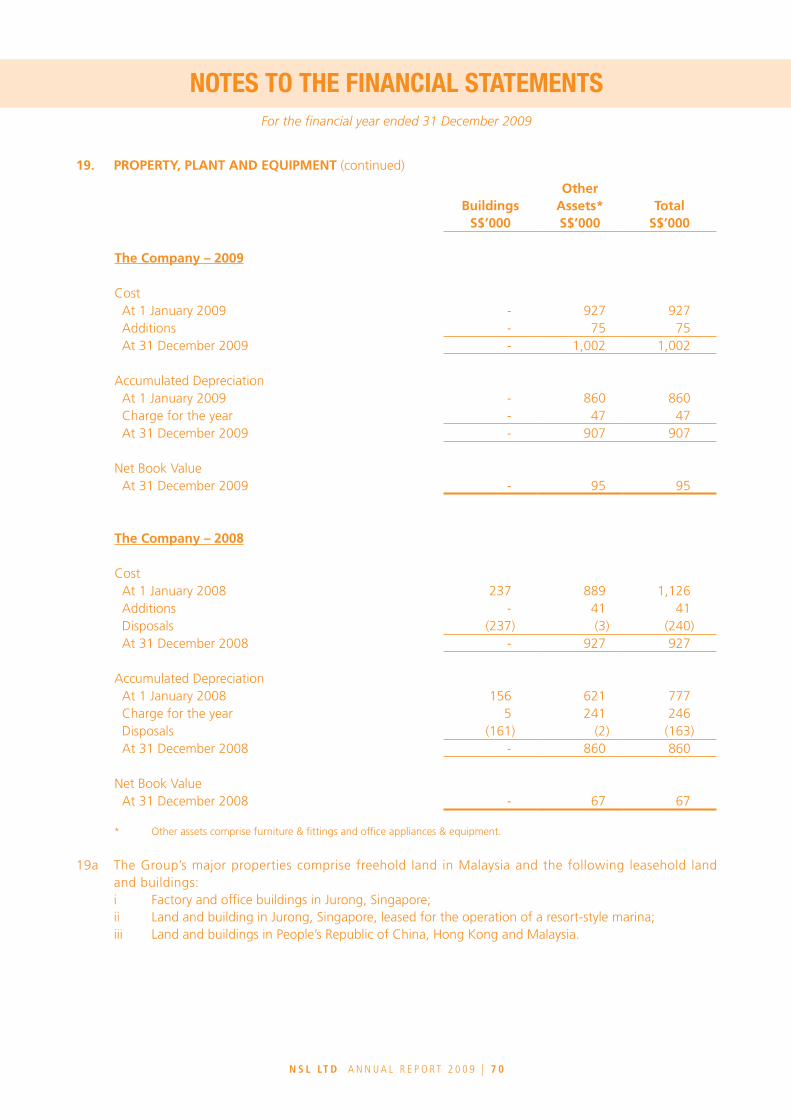
N S L Lt d A N N U A L R E P O R T 2 0 0 9 | 7 0 N S L Lt d A N N U A L R E P O R T 2 0 0 9 | 7 1
19. PROPERTY, PLANT AND EQUIPMENT (continued)
BuildingsS$’000
OtherAssets*S$’000
TotalS$’000
The Company – 2009
Cost At 1 January 2009 - 927 927 Additions - 75 75 At 31 December 2009 - 1,002 1,002
Accumulated Depreciation At 1 January 2009 - 860 860 Charge for the year - 47 47 At 31 December 2009 - 907 907
Net Book Value At 31 December 2009 - 95 95
The Company – 2008
Cost At 1 January 2008 237 889 1,126 Additions - 41 41 Disposals (237) (3) (240) At 31 December 2008 - 927 927
Accumulated Depreciation At 1 January 2008 156 621 777 Charge for the year 5 241 246 Disposals (161) (2) (163) At 31 December 2008 - 860 860
Net Book Value At 31 December 2008 - 67 67
* Other assets comprise furniture & fittings and office appliances & equipment.
19a The Group’s major properties comprise freehold land in Malaysia and the following leasehold land and buildings:
i Factory and office buildings in Jurong, Singapore; ii Land and building in Jurong, Singapore, leased for the operation of a resort-style marina; iii Land and buildings in People’s Republic of China, Hong Kong and Malaysia.
NOTES TO THE FINANCIAL STATEMENTS NOTES TO THE FINANCIAL STATEMENTSFor the financial year ended 31 December 2009

N S L Lt d A N N U A L R E P O R T 2 0 0 9 | 7 0 N S L Lt d A N N U A L R E P O R T 2 0 0 9 | 7 1
19. PROPERTY, PLANT AND EQUIPMENT (continued)
19b Included in the buildings of the Group is a building on leasehold land (situated in Singapore) which was revalued based on an independent valuation on open market basis by a firm of professional valuers at 31 December 1990. The Group does not have a policy of periodic revaluation of property, plant and equipment.
If the building on leasehold land stated at valuation had been included in the financial statements at cost less accumulated depreciation, the net book value would have been as follows:
The Group2009
S$’0002008
S$’000
Building on leasehold land 805 1,097
19c Included in the Group’s property, plant and equipment are property, plant and equipment of subsidiaries of net book value of S$27,559,000 (2008: S$29,715,000) charged by way of debentures to banks for overdraft and banking facilities granted (Note 25 and Note 30).
19d The following are property, plant and equipment acquired under hire purchase and finance leases (Note 26):
The GroupCost
S$’000
Accumulated depreciation
S$’000
Net book valueS$’000
2009
Plant and machinery 3,422 (253) 3,169Other assets 817 (448) 369
4,239 (701) 3,538
2008
Plant and machinery 802 (341) 461Other assets 89 (66) 23
891 (407) 484
19e The Group’s impairment charge of S$4,931,000 (2008: S$4,548,000) comprise: (i) an impairment charge of S$4,635,000 (2008: S$926,000) due to delay in operational commencement
of a subsidiary’s plant under construction. Its recoverable amount of S$1,596,000 (2008: S$6,040,000) is based on value-in-use calculation as at 31 December 2009;
(ii) an impairment charge of S$nil (2008: S$2,190,000) on leasehold land and building of a subsidiary to reduce it to its recoverable amount based on a valuation carried out by an independent professional valuer; and
(iii) an impairment charge of S$296,000 (2008: S$1,432,000) to fully write off idle plant and machinery of subsidiaries as at 31 December 2009.
19f Borrowing costs of S$143,000 (2008: S$195,000), which arise on financing specifically entered into for the construction of property, plant and equipment of the Group, are capitalised during the financial year.
NOTES TO THE FINANCIAL STATEMENTS NOTES TO THE FINANCIAL STATEMENTSFor the financial year ended 31 December 2009

N S L Lt d A N N U A L R E P O R T 2 0 0 9 | 7 2 N S L Lt d A N N U A L R E P O R T 2 0 0 9 | 7 3
20. INvESTMENT PROPERTIES
The Group2009
S$’0002008
S$’000
Cost At 1 January and 31 December 11,421 11,421
Accumulated depreciation and impairment losses At 1 January 7,312 7,125 Depreciation charge for the year 189 187 At 31 December 7,501 7,312
Net book value at 31 December 3,920 4,109
Fair value at 31 December 5,701 6,229
Investment properties of the Group comprise mainly:
Description Location Existing Use Tenure
Office building 118 Joo Chiat Road Singapore 427407 Office Freehold
The Group’s property at Joo Chiat Road with net book value of S$3,719,000 (2008: S$3,880,000) was valued at S$5,500,000 as at 31 December 2009 (2008: S$6,000,000 as at 24 December 2008) based on a valuation carried out by an independent professional valuer.
Investment properties are leased to non-related parties under operating leases (Note 36b).
The following amounts are recognised in the consolidated income statement:
The Group2009
S$’0002008
S$’000
Rental income 347 344
Direct operating expenses arising from investment properties that generated rental income 342 289
Other direct operating expenses arising from investment properties that did not generate rental income 32 36
NOTES TO THE FINANCIAL STATEMENTS NOTES TO THE FINANCIAL STATEMENTSFor the financial year ended 31 December 2009
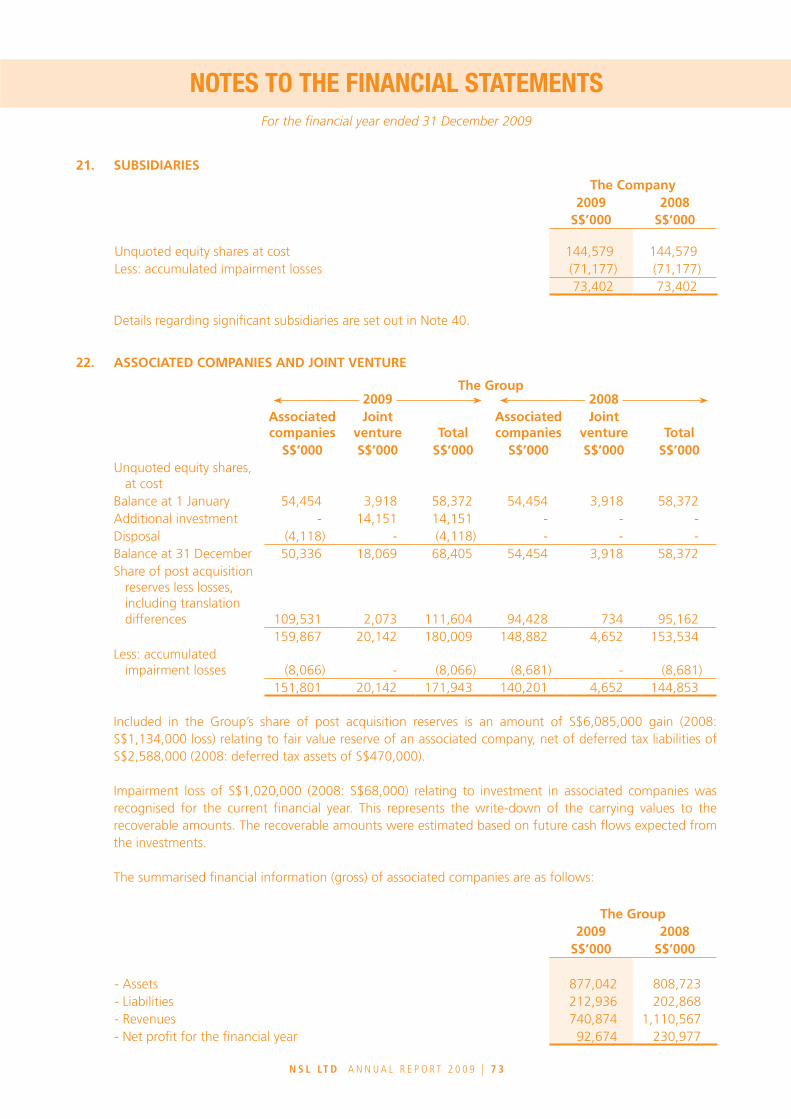
N S L Lt d A N N U A L R E P O R T 2 0 0 9 | 7 2 N S L Lt d A N N U A L R E P O R T 2 0 0 9 | 7 3
21. SUBSIDIARIES
The Company2009
S$’0002008
S$’000
Unquoted equity shares at cost 144,579 144,579Less: accumulated impairment losses (71,177) (71,177)
73,402 73,402
Details regarding significant subsidiaries are set out in Note 40.
22. ASSOCIATED COMPANIES AND JOINT vENTURE
The Group 2009 2008
Associated companies
Joint venture Total
Associated companies
Joint venture Total
S$’000 S$’000 S$’000 S$’000 S$’000 S$’000Unquoted equity shares,
at costBalance at 1 January 54,454 3,918 58,372 54,454 3,918 58,372Additional investment - 14,151 14,151 - - -Disposal (4,118) - (4,118) - - -Balance at 31 December 50,336 18,069 68,405 54,454 3,918 58,372Share of post acquisition
reserves less losses, including translation differences 109,531 2,073 111,604 94,428 734 95,162
159,867 20,142 180,009 148,882 4,652 153,534Less: accumulated
impairment losses (8,066) - (8,066) (8,681) - (8,681)151,801 20,142 171,943 140,201 4,652 144,853
Included in the Group’s share of post acquisition reserves is an amount of S$6,085,000 gain (2008: S$1,134,000 loss) relating to fair value reserve of an associated company, net of deferred tax liabilities of S$2,588,000 (2008: deferred tax assets of S$470,000).
Impairment loss of S$1,020,000 (2008: S$68,000) relating to investment in associated companies was recognised for the current financial year. This represents the write-down of the carrying values to the recoverable amounts. The recoverable amounts were estimated based on future cash flows expected from the investments.
The summarised financial information (gross) of associated companies are as follows:
The Group2009 2008
S$’000 S$’000
- Assets 877,042 808,723- Liabilities 212,936 202,868- Revenues 740,874 1,110,567- Net profit for the financial year 92,674 230,977
NOTES TO THE FINANCIAL STATEMENTS NOTES TO THE FINANCIAL STATEMENTSFor the financial year ended 31 December 2009

N S L Lt d A N N U A L R E P O R T 2 0 0 9 | 7 4 N S L Lt d A N N U A L R E P O R T 2 0 0 9 | 7 5
22. ASSOCIATED COMPANIES AND JOINT vENTURE (continued)
The summarised financial information (proportionate share) of joint venture are as follows:
The Group2009 2008
S$’000 S$’000
- Current assets 20,069 13,875- Non-current assets 33,031 10,713- Current liabilities 11,402 13,367- Non-current liabilities 21,556 6,569- Revenues 25,250 18,950- Expenses 23,346 17,112- Net profit for the financial year 1,904 1,838
The Group has S$1,854,000 (2008: S$nil) unrecognised loss of associated companies during the year. The accumulated losses of associated companies not recognised were S$1,750,000 (2008: S$511,000) at the balance sheet date.
A subsidiary of the Group has provided corporate guarantees for its share of bank loans of S$5,270,000 (2008: S$4,879,000) drawn down by joint venture at the balance sheet date. The fair values of the financial guarantee contracts have not been recognised on the consolidated balance sheet at 31 December 2009 as the management is of the view that the fair values of the corporate guarantees are not significant and that no material losses is expected in respect of these guarantees provided at the date of these financial statements.
Details regarding significant associated companies and joint venture are set out in Note 40.
23. LONG TERM RECEIvABLES
The Group The Company2009
S$’0002008
S$’0002009
S$’0002008
S$’000
Loans receivable 988 5,176 - 2,538Other receivable 5,409 - - -Amounts receivable within 12 months (Note 16) - (4,159) - (2,509)
6,397 1,017 - 29Less: Allowance for impairment of receivables (988) (988) - -Amounts receivable after 12 months 5,409 29 - 29
Amounts owing by subsidiaries - non-trade - - 167,393 141,521Less: Allowance for impairment of receivables - - (46,027) (48,110)
- - 121,366 93,411
Amounts owing by joint venture - non-trade 17,476 5,551 - -Amounts owing by associated companies - non-trade 3,310 3,325 - -Less: Provision for impairment of receivables (1,829) (2,276) - -
1,481 1,049 - -
24,366 6,629 121,366 93,440
NOTES TO THE FINANCIAL STATEMENTS NOTES TO THE FINANCIAL STATEMENTSFor the financial year ended 31 December 2009

N S L Lt d A N N U A L R E P O R T 2 0 0 9 | 7 4 N S L Lt d A N N U A L R E P O R T 2 0 0 9 | 7 5
23. LONG TERM RECEIvABLES (continued)
The amounts owing by subsidiaries (non-trade) are interest free, unsecured and are not expected to be repaid within the next 12 months after the balance sheet date. Settlement of the amounts owing by subsidiary companies is neither planned nor likely to occur in the foreseeable future. As a result, such loans are in substance part of the Company’s net investment in subsidiary companies and accounted for in accordance with Note 2K.
The amounts owing by associated companies and joint venture (non-trade) are interest free, unsecured and have no fixed terms of repayment. Settlement of the amounts owing by associated companies and joint venture is neither planned nor likely to occur in the foreseeable future. As a result, such loans are in substance part of the Group’s net investment in associated companies and joint venture and accounted for in accordance with Note 2K.
Other receivable of S$5,409,000 pertains to receivable from 2nd tranche proceeds in relation to the sale of an available-for-sale asset. It bears interest at 3.0% per annum and the interest is repriced every half yearly. It is unsecured and is not expected to be repaid within the next 12 months after the balance sheet date.
The carrying amounts of non-current loans receivable and other receivable of the Group and Company approximate their fair values.
24. INTANGIBLE ASSETS
The Group2009
S$’0002008
S$’000
Goodwill arising on consolidation (Note 24a) 8,876 8,878Acquired intangible assets (Note 24b) 683 882
9,559 9,760
24a Goodwill arising on consolidation
The Group2009
S$’0002008
S$’000
Cost and Net book value Balance at 1 January 8,878 8,889 Currency realignment (2) (11) Balance at 31 December 8,876 8,878
Impairment tests for goodwill Goodwill is allocated to the Group’s cash-generating units (CGUs) identified according to country of
operation and business segments.
NOTES TO THE FINANCIAL STATEMENTS NOTES TO THE FINANCIAL STATEMENTSFor the financial year ended 31 December 2009
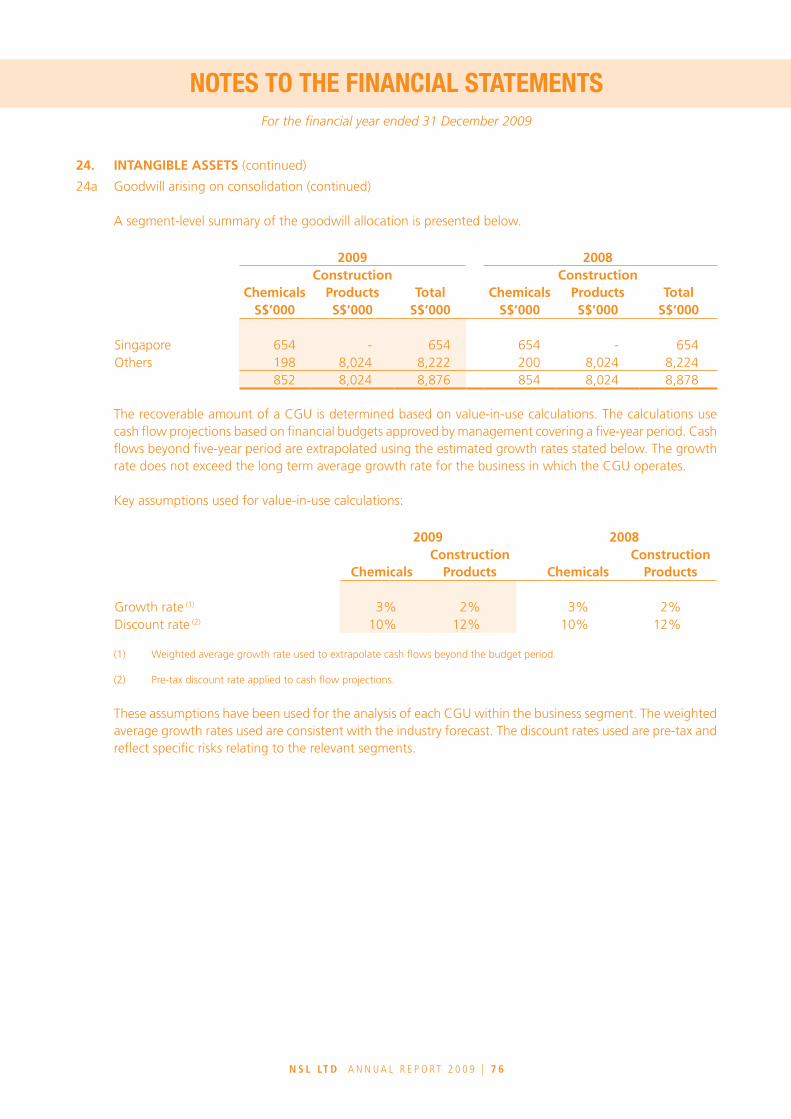
N S L Lt d A N N U A L R E P O R T 2 0 0 9 | 7 6 N S L Lt d A N N U A L R E P O R T 2 0 0 9 | 7 7
24. INTANGIBLE ASSETS (continued)
24a Goodwill arising on consolidation (continued)
A segment-level summary of the goodwill allocation is presented below.
2009 2008
ChemicalsConstruction
Products Total ChemicalsConstruction
Products TotalS$’000 S$’000 S$’000 S$’000 S$’000 S$’000
Singapore 654 - 654 654 - 654Others 198 8,024 8,222 200 8,024 8,224
852 8,024 8,876 854 8,024 8,878
The recoverable amount of a CGU is determined based on value-in-use calculations. The calculations use cash flow projections based on financial budgets approved by management covering a five-year period. Cash flows beyond five-year period are extrapolated using the estimated growth rates stated below. The growth rate does not exceed the long term average growth rate for the business in which the CGU operates.
Key assumptions used for value-in-use calculations:
2009 2008
ChemicalsConstruction
Products ChemicalsConstruction
Products
Growth rate (1) 3% 2% 3% 2%Discount rate (2) 10% 12% 10% 12%
(1) Weighted average growth rate used to extrapolate cash flows beyond the budget period.
(2) Pre-tax discount rate applied to cash flow projections.
These assumptions have been used for the analysis of each CGU within the business segment. The weighted average growth rates used are consistent with the industry forecast. The discount rates used are pre-tax and reflect specific risks relating to the relevant segments.
NOTES TO THE FINANCIAL STATEMENTS NOTES TO THE FINANCIAL STATEMENTSFor the financial year ended 31 December 2009

N S L Lt d A N N U A L R E P O R T 2 0 0 9 | 7 6 N S L Lt d A N N U A L R E P O R T 2 0 0 9 | 7 7
24. INTANGIBLE ASSETS (continued)
24b Acquired intangible assets
The Group2009
S$’0002008
S$’000
Cost Balance at 1 January 5,897 5,302 Additions 326 726 Currency realignment (26) (131) Balance at 31 December 6,197 5,897
Accumulated amortisation Balance at 1 January 5,015 4,537 Amortisation charge 522 594 Currency realignment (23) (116) Balance at 31 December 5,514 5,015
Net book value at 31 December 683 882
Amortisation expense is included in the consolidated income statement as cost of sales.
25. AMOUNTS DUE TO BANKERS
The Group2009
S$’0002008
S$’000
Bank overdrafts (Note 18) - unsecured - 242Short term bank loans - unsecured 4,800 16,553Current portion of long term bank loans (Note 30) - Unsecured 3,200 1,600 - Secured 2,563 3,282Bills payable - Unsecured 1,824 3,673 - Secured - 1,254
12,387 26,604
The secured banking facilities are secured against fixed and floating charge over the assets of a subsidiary and property, plant and equipment of certain subsidiaries (Note 15 and 19). Details of the bank loans are disclosed in Note 30.
NOTES TO THE FINANCIAL STATEMENTS NOTES TO THE FINANCIAL STATEMENTSFor the financial year ended 31 December 2009
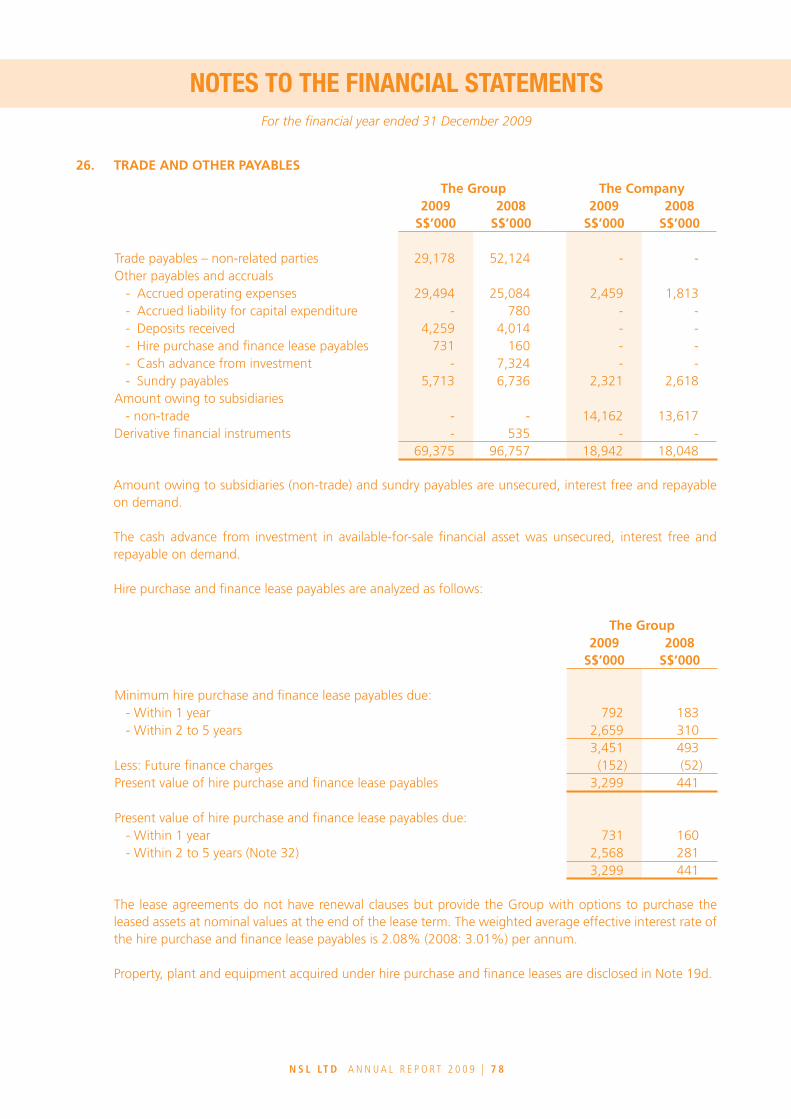
N S L Lt d A N N U A L R E P O R T 2 0 0 9 | 7 8 N S L Lt d A N N U A L R E P O R T 2 0 0 9 | 7 9
26. TRADE AND OTHER PAYABLES
The Group The Company2009
S$’0002008
S$’0002009
S$’0002008
S$’000
Trade payables – non-related parties 29,178 52,124 - -Other payables and accruals
- Accrued operating expenses 29,494 25,084 2,459 1,813 - Accrued liability for capital expenditure - 780 - - - Deposits received 4,259 4,014 - - - Hire purchase and finance lease payables 731 160 - - - Cash advance from investment - 7,324 - - - Sundry payables 5,713 6,736 2,321 2,618Amount owing to subsidiaries - non-trade - - 14,162 13,617Derivative financial instruments - 535 - -
69,375 96,757 18,942 18,048
Amount owing to subsidiaries (non-trade) and sundry payables are unsecured, interest free and repayable on demand.
The cash advance from investment in available-for-sale financial asset was unsecured, interest free and
repayable on demand.
Hire purchase and finance lease payables are analyzed as follows:
The Group2009
S$’0002008
S$’000
Minimum hire purchase and finance lease payables due: - Within 1 year 792 183 - Within 2 to 5 years 2,659 310
3,451 493Less: Future finance charges (152) (52)Present value of hire purchase and finance lease payables 3,299 441
Present value of hire purchase and finance lease payables due: - Within 1 year 731 160 - Within 2 to 5 years (Note 32) 2,568 281
3,299 441
The lease agreements do not have renewal clauses but provide the Group with options to purchase the leased assets at nominal values at the end of the lease term. The weighted average effective interest rate of the hire purchase and finance lease payables is 2.08% (2008: 3.01%) per annum.
Property, plant and equipment acquired under hire purchase and finance leases are disclosed in Note 19d.
NOTES TO THE FINANCIAL STATEMENTS NOTES TO THE FINANCIAL STATEMENTSFor the financial year ended 31 December 2009

N S L Lt d A N N U A L R E P O R T 2 0 0 9 | 7 8 N S L Lt d A N N U A L R E P O R T 2 0 0 9 | 7 9
26. TRADE AND OTHER PAYABLES (continued)
Derivative financial instruments
The Group2009 2008
Contract notional Fair value
Contract notional Fair value
amount Asset Liability amount Asset LiabilityS$’000 S$’000 S$’000 S$’000 S$’000 S$’000
Forward foreign exchange contracts - current 9,360 199 - 31,500 - (535)
27. PROvISION FOR OTHER LIABILITIES AND CHARGES
The provision for other liabilities and charges are provision made for warranties for certain products. The Group gives two to five years warranties on certain products and undertakes to repair or replace items that fail to perform satisfactorily. A provision is recognised at the balance sheet date for expected warranty claims based on past experience of the level of repairs and returns. The movement of the provision are as follows:
The Group2009
S$’0002008
S$’000
Balance at 1 January 1,792 2,519Provision made during the year 926 548Write-back of provision during the year - (180)Provision utilised during the year (772) (1,058)Currency realignment 4 (37)Balance at 31 December 1,950 1,792
28. PROvISION FOR RETIREMENT BENEFITS
The amounts recognised in the balance sheets are as follows:
The Group The Company2009
S$’0002008
S$’0002009
S$’0002008
S$’000
Present value of unfunded obligations 287 293 287 293Liability in the balance sheet 287 293 287 293
The Company and a subsidiary operate separate unfunded defined retirement benefit schemes for certain employees. Benefits are payable based on the last drawn salaries of the respective executives and the number of years of service with the Company and its subsidiary. Provision is made using the projected unit credit method described in Note 2W.
NOTES TO THE FINANCIAL STATEMENTS NOTES TO THE FINANCIAL STATEMENTSFor the financial year ended 31 December 2009

N S L Lt d A N N U A L R E P O R T 2 0 0 9 | 8 0 N S L Lt d A N N U A L R E P O R T 2 0 0 9 | 8 1
28. PROvISION FOR RETIREMENT BENEFITS (continued)
Movement in the liability recognised in the balance sheets:
The Group The Company2009
S$’0002008
S$’0002009
S$’0002008
S$’000
Balance at 1 January 293 326 293 265Net (credit) / expense (6) 49 (6) 28Payment - (81) - -Currency realignment - (1) - -Balance at 31 December 287 293 287 293
The principal actuarial assumptions used were as follows:
The Group The Company2009
%2008
%2009
%2008
%
Discount rate 3 3 3 3 Salary increment rate 3 3 3 3
29. DEFERRED TAxATION
Deferred income tax assets and liabilities are offset when there is a legally enforceable right to set off current income tax assets against current income tax liabilities and when the deferred income taxes relate to the same fiscal authority. The following amounts, determined after appropriate offsetting, are shown in the balance sheets as follows:
The Group The Company2009
S$’0002008
S$’0002009
S$’0002008
S$’000
Deferred tax assets (1,728) (1,195) (273) -
Deferred tax liabilities 17,815 17,471 - 514
The movement in deferred taxation is as follows:
The Group The Company2009
S$’0002008
S$’0002009
S$’0002008
S$’000
Balance at 1 January 16,276 16,561 514 587(Credited) / charged to: - Income statement (Note 10) (901) 1,172 (787) (73) - Equity (Note 10) 757 (1,392) - -Currency realignment (45) (65) - -Balance at 31 December 16,087 16,276 (273) 514
NOTES TO THE FINANCIAL STATEMENTS NOTES TO THE FINANCIAL STATEMENTSFor the financial year ended 31 December 2009

N S L Lt d A N N U A L R E P O R T 2 0 0 9 | 8 0 N S L Lt d A N N U A L R E P O R T 2 0 0 9 | 8 1
29. DEFERRED TAxATION (continued)
Deferred income tax assets are recognised for tax losses carry forward and unutilised capital allowances to the extent that realisation of the related tax benefit through future taxable profits is probable. At 31 December 2009, the Group has estimated tax losses and capital allowances of S$22,448,000 (2008: S$22,942,000) and S$10,818,000 (2008: S$9,342,000) respectively for which deferred tax benefits have not been recognised in the financial statements. These are available for set-off against future taxable profits subject to meeting certain statutory requirements in their respective countries of incorporation by those companies with unrecognised tax losses and capital allowances. These tax losses and unutilised capital allowances do not have expiry dates.
29a Movement in the Group’s deferred tax assets and liabilities (prior to legally enforceable offsetting of balances within same tax authority) are as follows:
The Group – Deferred Tax Liabilities
Accelerated tax depreciation Fair value gains
Unremitted income Total
2009 2008 2009 2008 2009 2008 2009 2008S$’000 S$’000 S$’000 S$’000 S$’000 S$’000 S$’000 S$’000
Balance at 1 January 5,315 5,703 760 826 12,975 13,492 19,050 20,021(Credited) / charged to: - income statement (961) (243) 41 (52) (458) 891 (1,378) 596 - equity - - 43 17 714 (1,409) 757 (1,392)Currency realignment 21 (145) (8) (31) 59 1 72 (175)Balance at 31 December 4,375 5,315 836 760 13,290 12,975 18,501 19,050
The Group – Deferred Tax Assets
Provisions
Unutilised tax losses / capital
allowances Deferred income Total2009 2008 2009 2008 2009 2008 2009 2008
S$’000 S$’000 S$’000 S$’000 S$’000 S$’000 S$’000 S$’000
Balance at 1 January (1,295) (1,310) (823) (1,428) (656) (722) (2,774) (3,460)(Credited) / charged to income
statement (270) 12 646 499 101 65 477 576Currency realignment (80) 3 22 106 (59) 1 (117) 110Balance at 31 December (1,645) (1,295) (155) (823) (614) (656) (2,414) (2,774)
NOTES TO THE FINANCIAL STATEMENTS NOTES TO THE FINANCIAL STATEMENTSFor the financial year ended 31 December 2009

N S L Lt d A N N U A L R E P O R T 2 0 0 9 | 8 2 N S L Lt d A N N U A L R E P O R T 2 0 0 9 | 8 3
29. DEFERRED TAxATION (continued)
29b Movement in the Company’s deferred tax assets and liabilities (prior to legally enforceable offsetting of balances within same tax authority) are as follows: The Company – Deferred Tax Liabilities
Unremitted income Total2009 2008 2009 2008
S$’000 S$’000 S$’000 S$’000
Balance at 1 January 834 1,004 834 1,004Credited to income statement (767) (170) (767) (170)Balance at 31 December 67 834 67 834
The Company – Deferred Tax Assets
Provisions Total2009 2008 2009 2008
S$’000 S$’000 S$’000 S$’000
Balance at 1 January (320) (417) (320) (417)(Credited) / charged to income statement (20) 97 (20) 97Balance at 31 December (340) (320) (340) (320)
30. LONG TERM BANK LOANS
The Group2009
S$’0002008
S$’000
Bank loans - Secured 10,401 11,153 - Unsecured 12,320 14,320
22,721 25,473
Less: Amounts due within 12 months (Note 25) (5,763) (4,882)Amounts due after 12 months 16,958 20,591
The Group’s long term bank loans are charged at floating rates.
The Group’s secured bank loans are secured by fixed and floating charge over the assets of a subsidiary and property, plant and equipment of certain subsidiaries (Note 15 and 19), and comprise:
i) Loan of S$212,000 (EUR105,000) [2008: S$640,000 (EUR315,000)] repayable in half yearly instalments up to June 2010. Interest is charged at rates ranging from 2.8% to 4.6% (2008: 4.8% to 7.1%) per annum.
ii) Loan of S$500,000 (EUR248,000) [2008: S$840,000 (EUR413,000)] repayable in quarterly instalments up to June 2011. Interest is charged at rates ranging from 1.7% to 3.7% (2008: 3.4% to 6.3%) per annum.
NOTES TO THE FINANCIAL STATEMENTS NOTES TO THE FINANCIAL STATEMENTSFor the financial year ended 31 December 2009

N S L Lt d A N N U A L R E P O R T 2 0 0 9 | 8 2 N S L Lt d A N N U A L R E P O R T 2 0 0 9 | 8 3
30. LONG TERM BANK LOANS (continued)
iii) Loan of S$426,000 (RM1,040,000) [2008: S$932,000 (RM2,251,000)] repayable in monthly instalments up to August 2010. Interest is charged at 5.9% (2008: 5.9%) per annum.
iv) Loan of S$886,000 (RM2,161,000) [2008: S$1,257,000 (RM3,037,000)] repayable in monthly instalments up to February 2012. Interest is charged at rates ranging from 6.3% to 7.3% (2008: 7.3% to 7.5%) per annum.
v) Loan of S$57,000 (RM139,000) [2008: S$713,000 (RM1,722,000)] repayable in monthly instalments up to January 2010. Interest is charged at 5.8% (2008: 5.8%) per annum.
vi) Loan of S$587,000 (2008: S$812,000) repayable in monthly instalments up to May 2012. Interest is charged at 5.8% (2008: 5.8%) per annum.
vii) Loan of S$2,317,000 (HKD12,801,000) [2008: S$2,679,000 (HKD14,401,000)] repayable in monthly instalments up to December 2017. Interest is charged at rates ranging from 2.8% to 3.0% (2008: 2.5% to 3.3%) per annum.
viii) Loan of S$2,999,000 (RM7,313,000) [2008: S$3,280,000 (RM7,922,000)] repayable in monthly instalments up to August 2018. Interest is charged at rates ranging from 3.8% to 4.9% (2008: 4.8% to 5.0%) per annum.
ix) Loan of S$2,417,000 (RM5,896,000) [2008: $nil] repayable in monthly instalments up to October 2024. Interest is charged at rates ranging from 1.3% to 3.4% (2008: nil%) per annum.
The Group’s unsecured bank loans comprise:
i) Loan of S$1,200,000 (2008: S$1,599,000) repayable in quarterly instalments up to December 2012. Interest is charged at rates ranging from 2.0% to 2.9% (2008: 2.8% to 4.2%) per annum.
ii) Loan of S$3,520,000 (2008: S$4,721,000) repayable in quarterly instalments up to November 2012. Interest is charged at rates ranging from 2.0% to 3.1% (2008: 2.7% to 4.1%) per annum.
iii) Loan of S$7,600,000 (2008: S$8,000,000) repayable in quarterly instalments up to September 2014. Interest is charged at rates ranging from 2.0% to 2.9% (2008: 2.0%) per annum.
The fair values of non-current borrowings of the Group are S$16,727,000 (2008: S$20,353,000). The fair values are determined from the discounted cash flows analysis, using discount rates ranging from 1.7% to 6.3% (2008: 2.0% to 7.3%) based upon the market interest rate that are available to the Group for similar financial liabilities at the balance sheet date.
NOTES TO THE FINANCIAL STATEMENTS NOTES TO THE FINANCIAL STATEMENTSFor the financial year ended 31 December 2009

N S L Lt d A N N U A L R E P O R T 2 0 0 9 | 8 4 N S L Lt d A N N U A L R E P O R T 2 0 0 9 | 8 5
31. DEFERRED INCOME
Deferred income relates mainly to unearned entrance fees received in respect of club memberships sold. The deferred income is amortised over the remaining membership period.
The Group2009
S$’0002008
S$’000
Balance at 1 January 3,799 4,895Additions 211 115Amortisation during the year (Note 7) (343) (343)Amount recognised in income statement - (868)Balance at 31 December 3,667 3,799
Current portion 341 341Non-current portion 3,326 3,458
3,667 3,799
32. OTHER NON-CURRENT LIABILITIES
The Group2009
S$’0002008
S$’000
Loans from minority shareholders (unsecured) 410 420Hire purchase and finance lease instalments due after 12 months (Note 26) 2,568 281
2,978 701
Loans from minority shareholders bear interest rate of 6.0% (2008: 6.0%) per annum and the loans are not expected to be repaid within the next 12 months after the balance sheet date.
The carrying amounts of other non-current liabilities approximate their fair values.
33. RELATED PARTY TRANSACTIONS
In addition to the related party information disclosed elsewhere in the financial statements, the Group and the Company have the following significant transactions with related parties on terms agreed between the parties:
(a) Sales and purchases of goods and services
The Group2009
S$’0002008
S$’000
Sales to associated companies 9,624 7,483
Sales to associated companies were carried out at market prices.
NOTES TO THE FINANCIAL STATEMENTS NOTES TO THE FINANCIAL STATEMENTSFor the financial year ended 31 December 2009
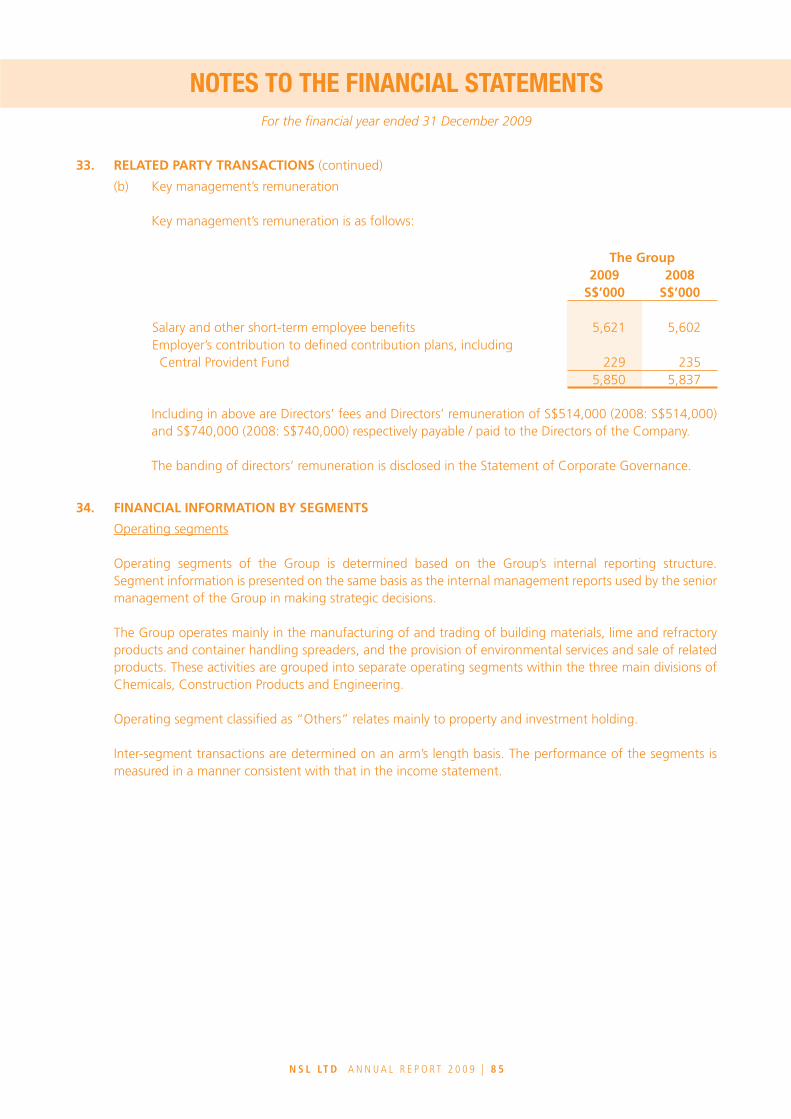
N S L Lt d A N N U A L R E P O R T 2 0 0 9 | 8 4 N S L Lt d A N N U A L R E P O R T 2 0 0 9 | 8 5
33. RELATED PARTY TRANSACTIONS (continued)
(b) Key management’s remuneration Key management’s remuneration is as follows:
The Group2009
S$’0002008
S$’000
Salary and other short-term employee benefits 5,621 5,602Employer’s contribution to defined contribution plans, including Central Provident Fund 229 235
5,850 5,837
Including in above are Directors’ fees and Directors’ remuneration of S$514,000 (2008: S$514,000) and S$740,000 (2008: S$740,000) respectively payable / paid to the Directors of the Company.
The banding of directors’ remuneration is disclosed in the Statement of Corporate Governance.
34. FINANCIAL INFORMATION BY SEGMENTS
Operating segments
Operating segments of the Group is determined based on the Group’s internal reporting structure. Segment information is presented on the same basis as the internal management reports used by the senior management of the Group in making strategic decisions.
The Group operates mainly in the manufacturing of and trading of building materials, lime and refractory
products and container handling spreaders, and the provision of environmental services and sale of related products. These activities are grouped into separate operating segments within the three main divisions of Chemicals, Construction Products and Engineering.
Operating segment classified as “Others” relates mainly to property and investment holding.
Inter-segment transactions are determined on an arm’s length basis. The performance of the segments is measured in a manner consistent with that in the income statement.
NOTES TO THE FINANCIAL STATEMENTS NOTES TO THE FINANCIAL STATEMENTSFor the financial year ended 31 December 2009

N S L Lt d A N N U A L R E P O R T 2 0 0 9 | 8 6 N S L Lt d A N N U A L R E P O R T 2 0 0 9 | 8 7
34. OPERATING SEGMENTS (continued)
The information for the reportable segments for the year ended 31 December 2009 is as follows:
<----------- Construction Products -----------> <----------------------------- Chemicals ------------------------------>
Precast & Plaster
Other Construction
Products TotalEnvironmental
ServicesEnvironmental
Chemicals
Other Chemicals Businesses Total Engineering Others Elimination
Total Consolidated
S$’000 S$’000 S$’000 S$’000 S$’000 S$’000 S$’000 S$’000 S$’000 S$’000 S$’000SalesExternal sales 152,658 41,141 193,799 39,219 49,864 - 89,083 55,210 14,332 - 352,424Inter-segment sales 160 4,981 5,141 620 1,486 - 2,106 51 5 - 7,303Total revenue 152,818 46,122 198,940 39,839 51,350 - 91,189 55,261 14,337 - 359,727Elimination (4,981) (67) - (5) (2,250) (7,303)
193,959 91,122 55,261 14,332 (2,250) 352,424
Profit before Taxation and Exceptional Items 24,314 866 25,180 3,262 6,784 20,971 31,017 6,302 (4,581) 57,918Exceptional items 15,054Profit before taxation 72,972
Depreciation (5,698) (1,803) (7,501) (2,259) (2,996) - (5,255) (1,281) (1,265) (15,302)Amortisation - (119) (119) - - - - (403) 343 (179)Impairment charge of property, plant and equipment - - - (4,635) - - (4,635) (296) - (4,931)Share of results of associated companies and joint venture,
net of tax 1,888 - 1,888 - - 20,971 20,971 - - 22,859
Total Assets 163,461 53,145 216,606 42,728 52,696 148,565 243,989 52,649 129,251 642,495
Total Liabilities 40,489 12,301 52,790 19,807 14,925 13,211 47,943 16,858 15,894 133,485
Total assets include: Investment in associated companies and joint venture 20,143 - 20,143 - - 148,565 148,565 1 3,234 171,943Additions to: - Property, plant and equipment 8,947 4,980 13,927 914 446 - 1,360 2,214 498 17,999 - Intangible assets - 10 10 - - - - 316 - 326
NOTES TO THE FINANCIAL STATEMENTS NOTES TO THE FINANCIAL STATEMENTSFor the financial year ended 31 December 2009
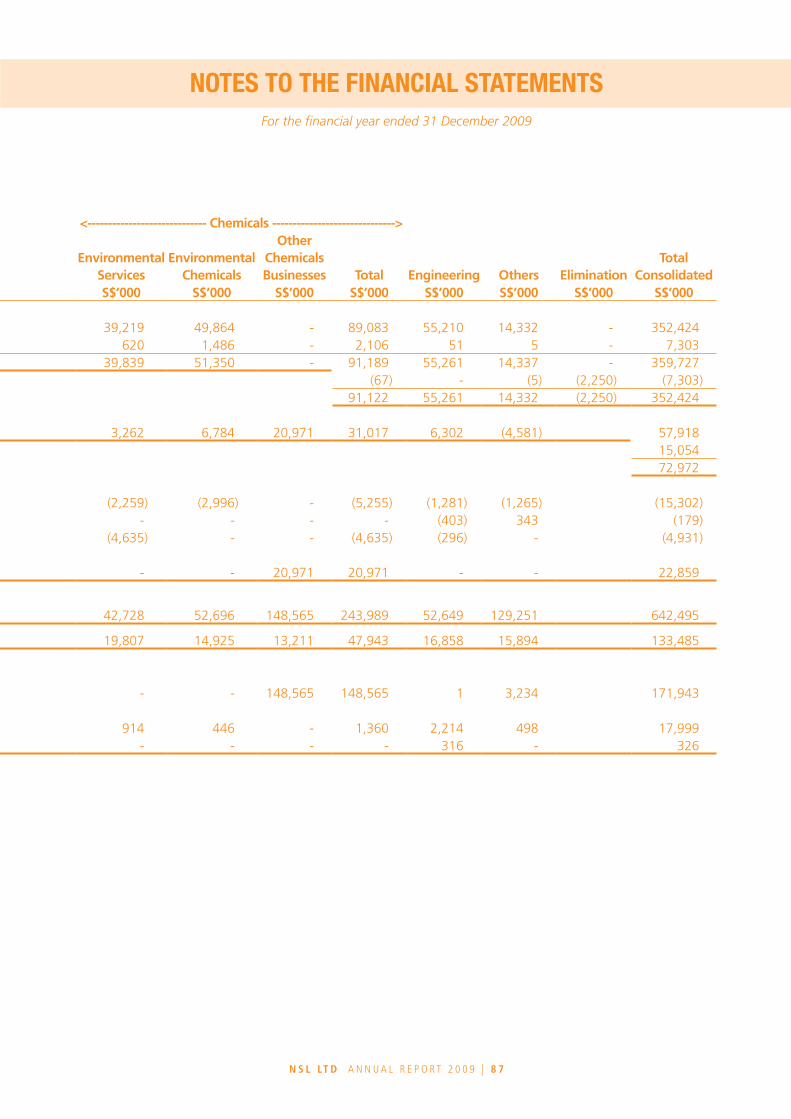
N S L Lt d A N N U A L R E P O R T 2 0 0 9 | 8 6 N S L Lt d A N N U A L R E P O R T 2 0 0 9 | 8 7
34. OPERATING SEGMENTS (continued)
The information for the reportable segments for the year ended 31 December 2009 is as follows:
<----------- Construction Products -----------> <----------------------------- Chemicals ------------------------------>
Precast & Plaster
Other Construction
Products TotalEnvironmental
ServicesEnvironmental
Chemicals
Other Chemicals Businesses Total Engineering Others Elimination
Total Consolidated
S$’000 S$’000 S$’000 S$’000 S$’000 S$’000 S$’000 S$’000 S$’000 S$’000 S$’000SalesExternal sales 152,658 41,141 193,799 39,219 49,864 - 89,083 55,210 14,332 - 352,424Inter-segment sales 160 4,981 5,141 620 1,486 - 2,106 51 5 - 7,303Total revenue 152,818 46,122 198,940 39,839 51,350 - 91,189 55,261 14,337 - 359,727Elimination (4,981) (67) - (5) (2,250) (7,303)
193,959 91,122 55,261 14,332 (2,250) 352,424
Profit before Taxation and Exceptional Items 24,314 866 25,180 3,262 6,784 20,971 31,017 6,302 (4,581) 57,918Exceptional items 15,054Profit before taxation 72,972
Depreciation (5,698) (1,803) (7,501) (2,259) (2,996) - (5,255) (1,281) (1,265) (15,302)Amortisation - (119) (119) - - - - (403) 343 (179)Impairment charge of property, plant and equipment - - - (4,635) - - (4,635) (296) - (4,931)Share of results of associated companies and joint venture,
net of tax 1,888 - 1,888 - - 20,971 20,971 - - 22,859
Total Assets 163,461 53,145 216,606 42,728 52,696 148,565 243,989 52,649 129,251 642,495
Total Liabilities 40,489 12,301 52,790 19,807 14,925 13,211 47,943 16,858 15,894 133,485
Total assets include: Investment in associated companies and joint venture 20,143 - 20,143 - - 148,565 148,565 1 3,234 171,943Additions to: - Property, plant and equipment 8,947 4,980 13,927 914 446 - 1,360 2,214 498 17,999 - Intangible assets - 10 10 - - - - 316 - 326
NOTES TO THE FINANCIAL STATEMENTS NOTES TO THE FINANCIAL STATEMENTSFor the financial year ended 31 December 2009
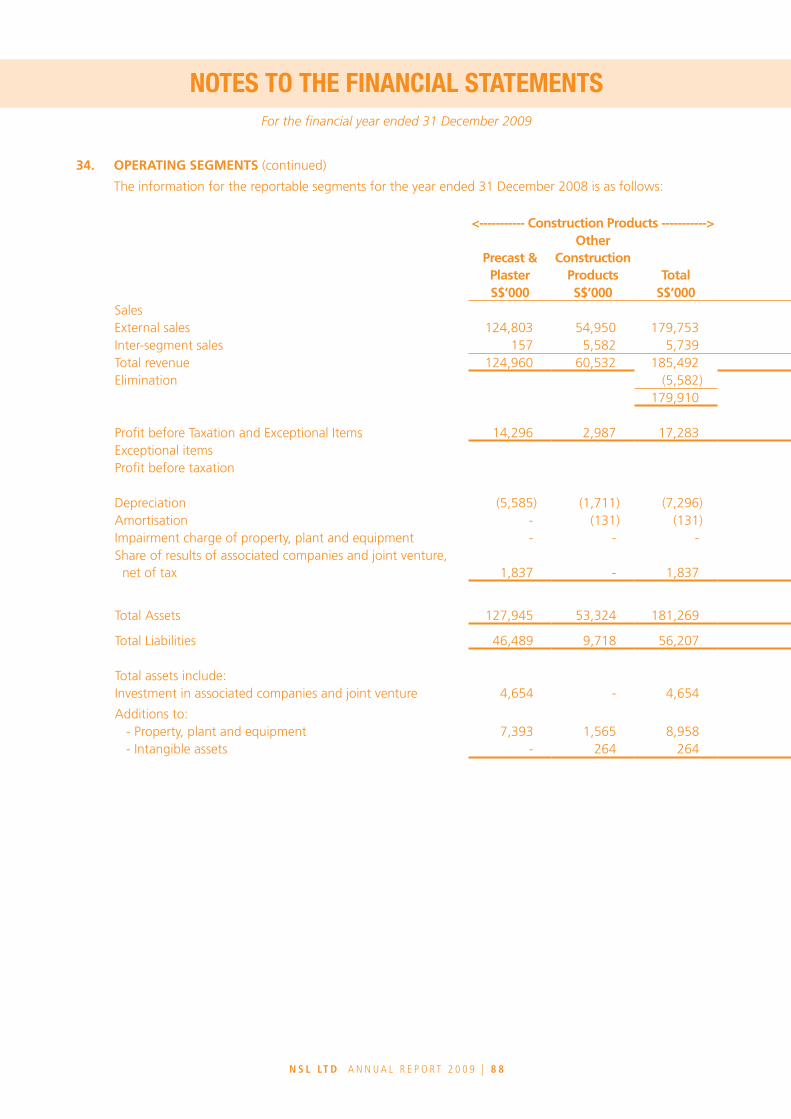
N S L Lt d A N N U A L R E P O R T 2 0 0 9 | 8 8 N S L Lt d A N N U A L R E P O R T 2 0 0 9 | 8 9
34. OPERATING SEGMENTS (continued)
The information for the reportable segments for the year ended 31 December 2008 is as follows:
<----------- Construction Products -----------> <----------------------------- Chemicals ------------------------------>
Precast & Plaster
Other Construction
Products TotalEnvironmental
ServicesEnvironmental
Chemicals
Other Chemicals Businesses Total Engineering Others Elimination
Total Consolidated
S$’000 S$’000 S$’000 S$’000 S$’000 S$’000 S$’000 S$’000 S$’000 S$’000 S$’000SalesExternal sales 124,803 54,950 179,753 37,862 53,681 - 91,543 70,887 15,651 - 357,834Inter-segment sales 157 5,582 5,739 396 577 - 973 83 15 - 6,810Total revenue 124,960 60,532 185,492 38,258 54,258 - 92,516 70,970 15,666 - 364,644Elimination (5,582) (141) - - (1,087) (6,810)
179,910 92,375 70,970 15,666 (1,087) 357,834
Profit before Taxation and Exceptional Items 14,296 2,987 17,283 201 1,414 52,967 54,582 5,474 (2,078) 75,261Exceptional items 4,517Profit before taxation 79,778
Depreciation (5,585) (1,711) (7,296) (1,653) (3,439) - (5,092) (940) (1,483) (14,811)Amortisation - (131) (131) - - - - (463) 343 (251)Impairment charge of property, plant and equipment - - - (926) (1,432) - (2,358) - (2,190) (4,548)Share of results of associated companies and joint venture,
net of tax 1,837 - 1,837 - - 52,967 52,967 - (1,794) 53,010
Total Assets 127,945 53,324 181,269 48,088 77,452 136,049 261,589 65,461 180,168 688,487
Total Liabilities 46,489 9,718 56,207 23,350 24,844 12,140 60,334 34,696 23,751 174,988
Total assets include: Investment in associated companies and joint venture 4,654 - 4,654 - - 136,049 136,049 1 4,149 144,853
Additions to: - Property, plant and equipment 7,393 1,565 8,958 8,875 1,749 - 10,624 2,139 1,127 22,848 - Intangible assets - 264 264 - - - - 462 - 726
NOTES TO THE FINANCIAL STATEMENTS NOTES TO THE FINANCIAL STATEMENTSFor the financial year ended 31 December 2009
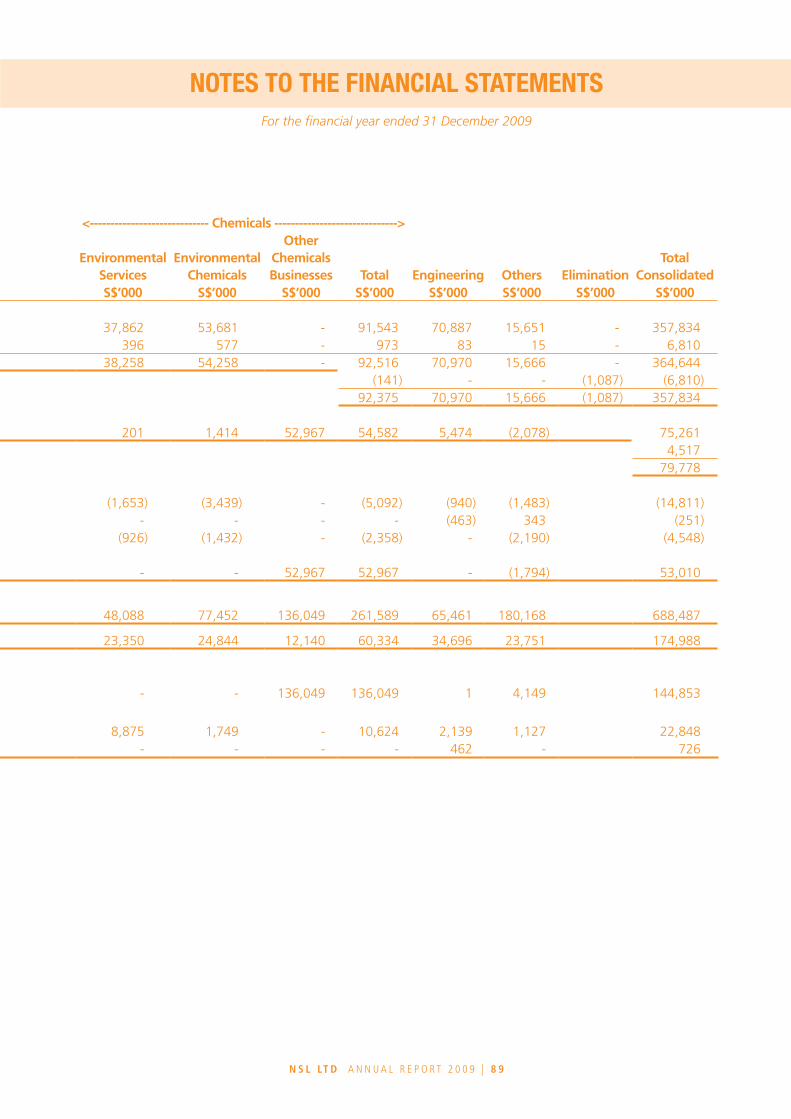
N S L Lt d A N N U A L R E P O R T 2 0 0 9 | 8 8 N S L Lt d A N N U A L R E P O R T 2 0 0 9 | 8 9
34. OPERATING SEGMENTS (continued)
The information for the reportable segments for the year ended 31 December 2008 is as follows:
<----------- Construction Products -----------> <----------------------------- Chemicals ------------------------------>
Precast & Plaster
Other Construction
Products TotalEnvironmental
ServicesEnvironmental
Chemicals
Other Chemicals Businesses Total Engineering Others Elimination
Total Consolidated
S$’000 S$’000 S$’000 S$’000 S$’000 S$’000 S$’000 S$’000 S$’000 S$’000 S$’000SalesExternal sales 124,803 54,950 179,753 37,862 53,681 - 91,543 70,887 15,651 - 357,834Inter-segment sales 157 5,582 5,739 396 577 - 973 83 15 - 6,810Total revenue 124,960 60,532 185,492 38,258 54,258 - 92,516 70,970 15,666 - 364,644Elimination (5,582) (141) - - (1,087) (6,810)
179,910 92,375 70,970 15,666 (1,087) 357,834
Profit before Taxation and Exceptional Items 14,296 2,987 17,283 201 1,414 52,967 54,582 5,474 (2,078) 75,261Exceptional items 4,517Profit before taxation 79,778
Depreciation (5,585) (1,711) (7,296) (1,653) (3,439) - (5,092) (940) (1,483) (14,811)Amortisation - (131) (131) - - - - (463) 343 (251)Impairment charge of property, plant and equipment - - - (926) (1,432) - (2,358) - (2,190) (4,548)Share of results of associated companies and joint venture,
net of tax 1,837 - 1,837 - - 52,967 52,967 - (1,794) 53,010
Total Assets 127,945 53,324 181,269 48,088 77,452 136,049 261,589 65,461 180,168 688,487
Total Liabilities 46,489 9,718 56,207 23,350 24,844 12,140 60,334 34,696 23,751 174,988
Total assets include: Investment in associated companies and joint venture 4,654 - 4,654 - - 136,049 136,049 1 4,149 144,853
Additions to: - Property, plant and equipment 7,393 1,565 8,958 8,875 1,749 - 10,624 2,139 1,127 22,848 - Intangible assets - 264 264 - - - - 462 - 726
NOTES TO THE FINANCIAL STATEMENTS NOTES TO THE FINANCIAL STATEMENTSFor the financial year ended 31 December 2009
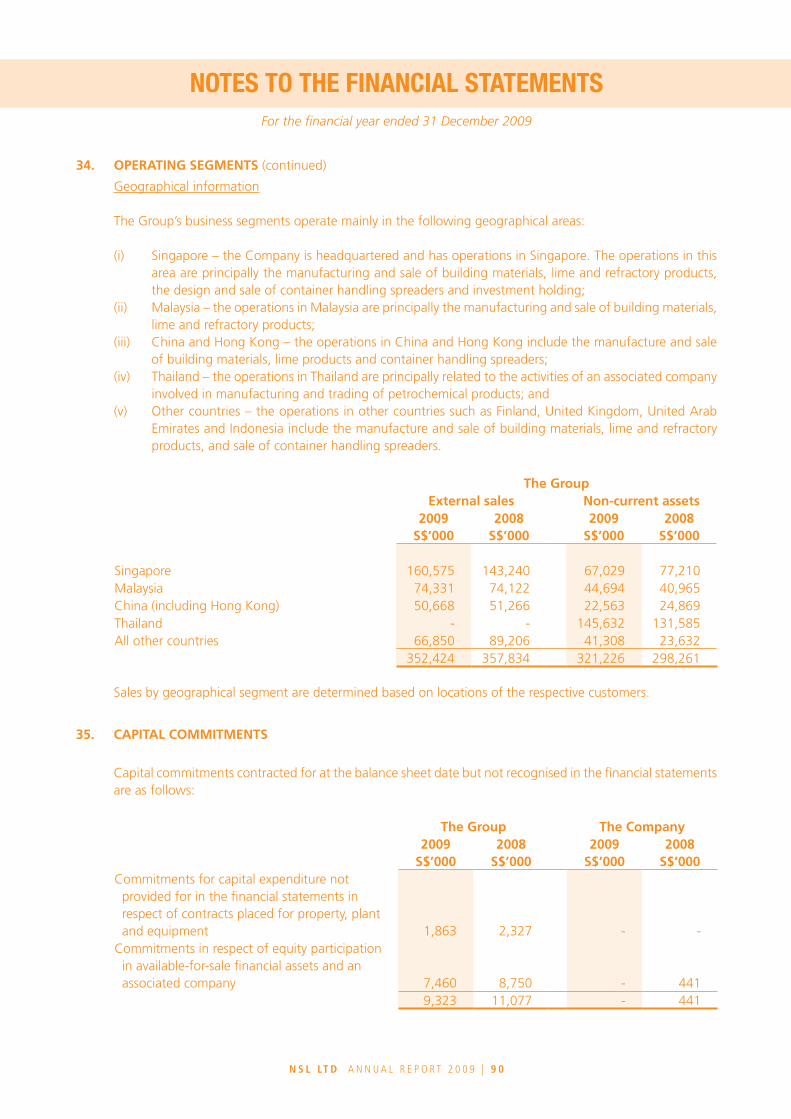
N S L Lt d A N N U A L R E P O R T 2 0 0 9 | 9 0 N S L Lt d A N N U A L R E P O R T 2 0 0 9 | 9 1
34. OPERATING SEGMENTS (continued)
Geographical information The Group’s business segments operate mainly in the following geographical areas:
(i) Singapore – the Company is headquartered and has operations in Singapore. The operations in this area are principally the manufacturing and sale of building materials, lime and refractory products, the design and sale of container handling spreaders and investment holding;
(ii) Malaysia – the operations in Malaysia are principally the manufacturing and sale of building materials, lime and refractory products;
(iii) China and Hong Kong – the operations in China and Hong Kong include the manufacture and sale of building materials, lime products and container handling spreaders;
(iv) Thailand – the operations in Thailand are principally related to the activities of an associated company involved in manufacturing and trading of petrochemical products; and
(v) Other countries – the operations in other countries such as Finland, United Kingdom, United Arab Emirates and Indonesia include the manufacture and sale of building materials, lime and refractory products, and sale of container handling spreaders.
The GroupExternal sales Non-current assets
2009S$’000
2008S$’000
2009S$’000
2008S$’000
Singapore 160,575 143,240 67,029 77,210Malaysia 74,331 74,122 44,694 40,965China (including Hong Kong) 50,668 51,266 22,563 24,869Thailand - - 145,632 131,585All other countries 66,850 89,206 41,308 23,632
352,424 357,834 321,226 298,261
Sales by geographical segment are determined based on locations of the respective customers.
35. CAPITAL COMMITMENTS
Capital commitments contracted for at the balance sheet date but not recognised in the financial statements are as follows:
The Group The Company2009
S$’0002008
S$’0002009
S$’0002008
S$’000Commitments for capital expenditure not
provided for in the financial statements in respect of contracts placed for property, plant and equipment 1,863 2,327 - -
Commitments in respect of equity participation in available-for-sale financial assets and an associated company 7,460 8,750 - 441
9,323 11,077 - 441
NOTES TO THE FINANCIAL STATEMENTS NOTES TO THE FINANCIAL STATEMENTSFor the financial year ended 31 December 2009

N S L Lt d A N N U A L R E P O R T 2 0 0 9 | 9 0 N S L Lt d A N N U A L R E P O R T 2 0 0 9 | 9 1
36. OPERATING LEASE COMMITMENTS
36a Where a group company is a lessee
The Group and Company leases various parcels of land, office space, office equipment and motor vehicles under non-cancellable operating lease agreements. The leases have varying terms, escalation clauses and renewal rights. The lease expenditure charged to income statement during the financial year is disclosed in Note 7.
The future aggregate minimum lease payments under non-cancellable operating leases contracted for at the reporting date but not recognised as liabilities, are as follows:
The Group The Company2009
S$’0002008
S$’0002009
S$’0002008
S$’000Payable:Within 1 year 3,921 3,292 1,199 1,197Within 2 to 5 years 8,104 9,834 948 2,147After 5 years 13,334 14,245 - -
25,359 27,371 2,147 3,344
36b Where a group company is a lessor The Group leases out certain property, plant and equipment and investment properties to non-related
parties under non-cancellable operating leases. The future minimum lease receivables under non-cancellable operating leases contracted for at the reporting date but not recognised as receivables, are as follows:
The Group2009
S$’0002008
S$’000Receivable:Within 1 year 1,148 1,096Within 2 to 5 years 801 988After 5 years 98 -
2,047 2,084
NOTES TO THE FINANCIAL STATEMENTS NOTES TO THE FINANCIAL STATEMENTSFor the financial year ended 31 December 2009

N S L Lt d A N N U A L R E P O R T 2 0 0 9 | 9 2 N S L Lt d A N N U A L R E P O R T 2 0 0 9 | 9 3
37. FINANCIAL RISK MANAGEMENT
The Group’s activities expose it to a variety of financial risks: market risk (including currency risk, price risk and interest rate risk), credit risk and liquidity risk. The Group’s overall risk management programme focuses on the unpredictability of financial markets and seeks to minimise potential adverse effects on the Group’s financial performance. The Group uses derivative financial instruments such as foreign exchange contracts to hedge certain risk exposures.
Financial risk management is carried out and monitored by a central treasury department in accordance with established policies and guidelines.
37a Market risk
(i) Currency risk
The Group operates in various countries, which include Singapore, Malaysia, People’s Republic of China (including Hong Kong), Indonesia, Thailand, United Kingdom and Finland. Certain entities in the Group regularly transact in currencies other than their respective functional currencies (“foreign currencies”) such as United States Dollars (“USD”) and Euro.
Currency risk arises when transactions are denominated in foreign currencies. The Group manages its currency risk through natural hedge and foreign exchange forward contracts. It is the Group’s policy not to enter into forward contracts until a firm commitment is in place.
In addition, the Group is exposed to currency translation risk on the net assets in foreign operations including foreign currency loans to an associated company and joint venture which are part of the net investments in foreign operations and deferred in equity until disposal of the foreign operations. Where appropriate, this exposure is managed through borrowings denominated in the relevant foreign currencies.
NOTES TO THE FINANCIAL STATEMENTS NOTES TO THE FINANCIAL STATEMENTSFor the financial year ended 31 December 2009

N S L Lt d A N N U A L R E P O R T 2 0 0 9 | 9 2 N S L Lt d A N N U A L R E P O R T 2 0 0 9 | 9 3
37. FINANCIAL RISK MANAGEMENT (continued)
37a Market risk (continued)
(i) Currency risk (continued)
The Group’s currency exposure (net of currency forwards) is as follows:
SGD USD RMB MYR EURO THB Others TotalS$’000 S$’000 S$’000 S$’000 S$’000 S$’000 S$’000 S$’000
The GroupAt 31 December 2009Cash and bank
balances 120,144 5,510 1,781 5,538 11,002 - 2,545 146,520Receivables 38,978 6,360 2,758 17,707 4,158 - 3,432 73,393Available-for-sale
financial assets - 2,672 - 296 - 12,010 - 14,978Long term receivables - 5,409 - - - - - 5,409Amount due to bankers (8,233) - - (3,320) (544) - (290) (12,387)Trade and other
payables / provisions (34,811) (2,968) (3,260) (18,853) (8,601) - (2,832) (71,325)Long term bank loans (9,474) - - (5,289) (168) - (2,027) (16,958)Other non-current
liabilities (115) - (410) - (2,453) - - (2,978)Net financial assets /
(liabilities) 106,489 16,983 869 (3,921) 3,394 12,010 828 136,652
Less: net financial (assets) / liabilities denominated in the respective entities' functional currencies (106,448) (929) (871) 4,815 (1,774) - (693)
Add: firm commitments and highly probable forecast transactions in foreign currencies - 3,365 - - - - -
Less: currency forwards - (8,114) - (289) (957) - -
Currency exposure 41 11,305 (2) 605 663 12,010 135
NOTES TO THE FINANCIAL STATEMENTS NOTES TO THE FINANCIAL STATEMENTSFor the financial year ended 31 December 2009

N S L Lt d A N N U A L R E P O R T 2 0 0 9 | 9 4 N S L Lt d A N N U A L R E P O R T 2 0 0 9 | 9 5
37. FINANCIAL RISK MANAGEMENT (continued)
37a Market risk (continued)
(i) Currency risk (continued)
SGD USD RMB MYR EURO THB Others TotalS$’000 S$’000 S$’000 S$’000 S$’000 S$’000 S$’000 S$’000
The GroupAt 31 December 2008Cash and bank balances 144,347 6,614 1,313 7,817 9,005 - 2,356 171,452Receivables 56,748 11,360 2,143 21,423 5,948 - 3,985 101,607Available-for-sale
financial assets - 4,047 15,408 635 - 11,471 - 31,561Long term receivables 29 - - - - - - 29Amount due to bankers (13,014) (289) (5,064) (7,177) (762) - (298) (26,604)Trade and other
payables / provisions (45,766) (6,111) (13,762) (22,990) (7,260) - (2,660) (98,549)Long term bank loans (13,318) - - (4,173) (718) - (2,382) (20,591)Other non-current
liabilities (254) - (420) - - - (27) (701)Net financial assets /
(liabilities) 128,772 15,621 (382) (4,465) 6,213 11,471 974 158,204
Less: net financial (assets) / liabilities denominated in the respective entities' functional currencies (128,687) (1,514) 8,464 8,145 (3,781) - (656)
Add: firm commitments and highly probable forecast transactions in foreign currencies - 20,873 - 3,131 933 - -
Less: currency forwards - (24,630) - (5,115) (1,755) - -
Currency exposure 85 10,350 8,082 1,696 1,610 11,471 318
The Group does not have significant currency exposure arising from its inter-company balances, except for net SGD payables by certain subsidiaries with functional currency in GBP and RMB, amounting to S$1,073,000 (2008: S$4,126,000) and S$12,938,000 (2008: S$5,910,000).
NOTES TO THE FINANCIAL STATEMENTS NOTES TO THE FINANCIAL STATEMENTSFor the financial year ended 31 December 2009
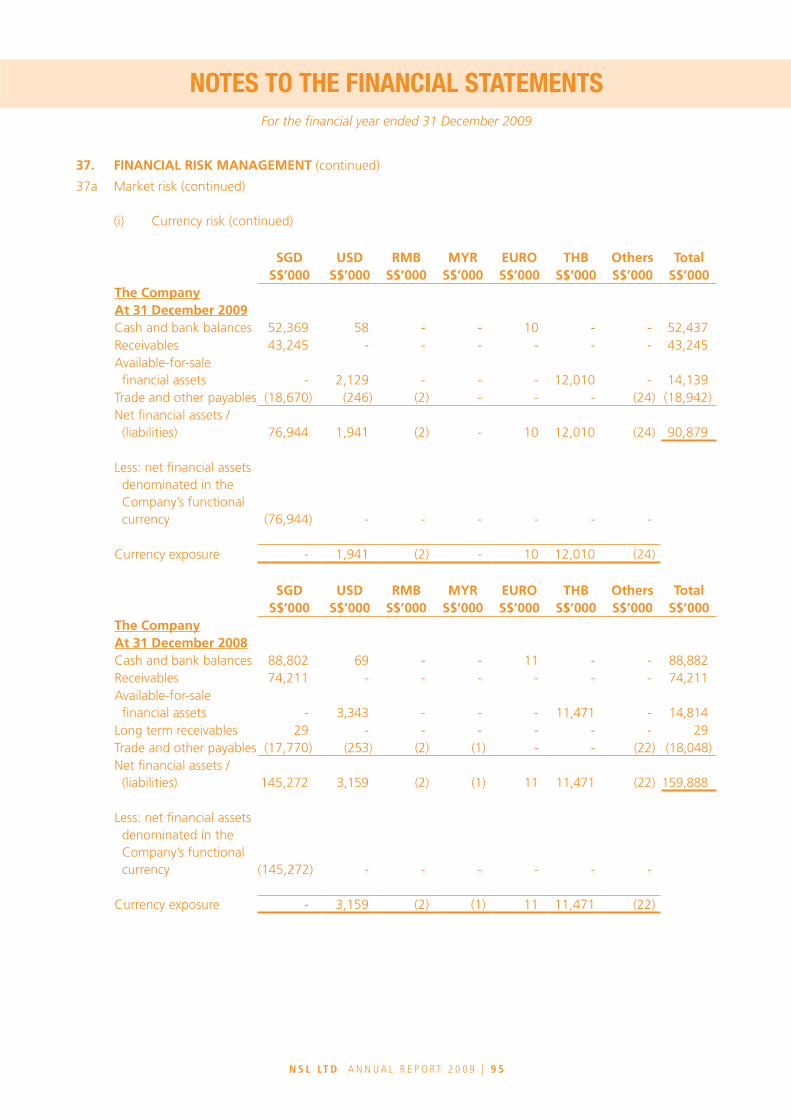
N S L Lt d A N N U A L R E P O R T 2 0 0 9 | 9 4 N S L Lt d A N N U A L R E P O R T 2 0 0 9 | 9 5
37. FINANCIAL RISK MANAGEMENT (continued)
37a Market risk (continued)
(i) Currency risk (continued)
SGD USD RMB MYR EURO THB Others TotalS$’000 S$’000 S$’000 S$’000 S$’000 S$’000 S$’000 S$’000
The CompanyAt 31 December 2009Cash and bank balances 52,369 58 - - 10 - - 52,437Receivables 43,245 - - - - - - 43,245Available-for-sale
financial assets - 2,129 - - - 12,010 - 14,139Trade and other payables (18,670) (246) (2) - - - (24) (18,942)Net financial assets /
(liabilities) 76,944 1,941 (2) - 10 12,010 (24) 90,879
Less: net financial assets denominated in the Company’s functional currency (76,944) - - - - - -
Currency exposure - 1,941 (2) - 10 12,010 (24)
SGD USD RMB MYR EURO THB Others TotalS$’000 S$’000 S$’000 S$’000 S$’000 S$’000 S$’000 S$’000
The CompanyAt 31 December 2008Cash and bank balances 88,802 69 - - 11 - - 88,882Receivables 74,211 - - - - - - 74,211Available-for-sale
financial assets - 3,343 - - - 11,471 - 14,814Long term receivables 29 - - - - - - 29Trade and other payables (17,770) (253) (2) (1) - - (22) (18,048)Net financial assets /
(liabilities) 145,272 3,159 (2) (1) 11 11,471 (22) 159,888
Less: net financial assets denominated in the Company’s functional currency (145,272) - - - - - -
Currency exposure - 3,159 (2) (1) 11 11,471 (22)
NOTES TO THE FINANCIAL STATEMENTS NOTES TO THE FINANCIAL STATEMENTSFor the financial year ended 31 December 2009
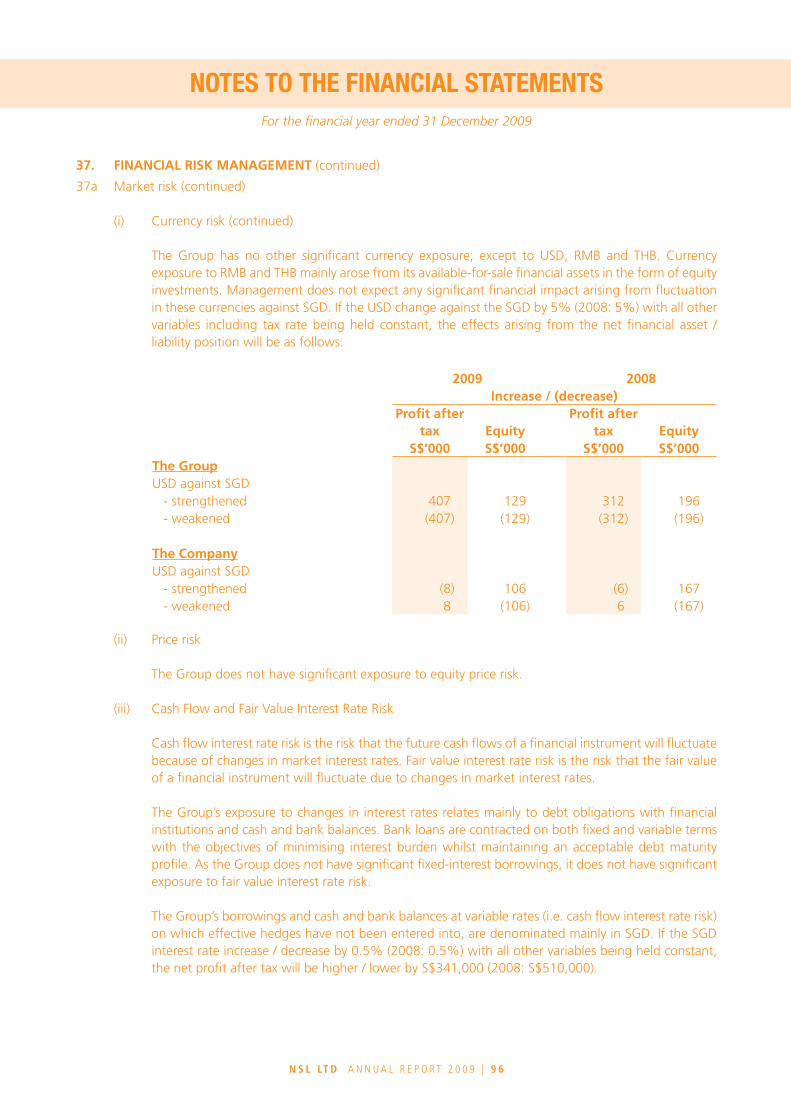
N S L Lt d A N N U A L R E P O R T 2 0 0 9 | 9 6 N S L Lt d A N N U A L R E P O R T 2 0 0 9 | 9 7
37. FINANCIAL RISK MANAGEMENT (continued)
37a Market risk (continued)
(i) Currency risk (continued)
The Group has no other significant currency exposure, except to USD, RMB and THB. Currency exposure to RMB and THB mainly arose from its available-for-sale financial assets in the form of equity investments. Management does not expect any significant financial impact arising from fluctuation in these currencies against SGD. If the USD change against the SGD by 5% (2008: 5%) with all other variables including tax rate being held constant, the effects arising from the net financial asset / liability position will be as follows:
2009 2008Increase / (decrease)
Profit after tax Equity
Profit after tax Equity
S$’000 S$’000 S$’000 S$’000The GroupUSD against SGD - strengthened 407 129 312 196 - weakened (407) (129) (312) (196)
The CompanyUSD against SGD - strengthened (8) 106 (6) 167 - weakened 8 (106) 6 (167)
(ii) Price risk
The Group does not have significant exposure to equity price risk.
(iii) Cash Flow and Fair Value Interest Rate Risk
Cash flow interest rate risk is the risk that the future cash flows of a financial instrument will fluctuate because of changes in market interest rates. Fair value interest rate risk is the risk that the fair value of a financial instrument will fluctuate due to changes in market interest rates.
The Group’s exposure to changes in interest rates relates mainly to debt obligations with financial institutions and cash and bank balances. Bank loans are contracted on both fixed and variable terms with the objectives of minimising interest burden whilst maintaining an acceptable debt maturity profile. As the Group does not have significant fixed-interest borrowings, it does not have significant exposure to fair value interest rate risk.
The Group’s borrowings and cash and bank balances at variable rates (i.e. cash flow interest rate risk) on which effective hedges have not been entered into, are denominated mainly in SGD. If the SGD interest rate increase / decrease by 0.5% (2008: 0.5%) with all other variables being held constant, the net profit after tax will be higher / lower by S$341,000 (2008: S$510,000).
NOTES TO THE FINANCIAL STATEMENTS NOTES TO THE FINANCIAL STATEMENTSFor the financial year ended 31 December 2009

N S L Lt d A N N U A L R E P O R T 2 0 0 9 | 9 6 N S L Lt d A N N U A L R E P O R T 2 0 0 9 | 9 7
37. FINANCIAL RISK MANAGEMENT (continued)
37b Credit risk
Credit risk refers to the risk that a counterpart will default on its contractual obligations resulting in financial loss to the Group. The Group has policies in place to ensure that sales of products and services are made to customers with an appropriate credit history. The Group has no significant concentration of credit risk.
The maximum exposure to credit risk for each class of financial assets is the carrying amount of the class of financial assets presented on the balance sheet, except for banker guarantees of S$2,474,000 (2008: S$621,000) and letters of credit of S$2,828,000 (2008: S$3,458,000) obtained for certain trade receivables.
The Group’s major classes of financial assets are cash and bank balances, trade receivables and long term receivables. The Company’s major classes of financial assets are cash and bank balances and receivables from subsidiaries.
The credit risk of trade receivables and long term receivables by type of customers is as follows:
The Group2009 2008
S$’000 S$’000
Associated companies 694 149Joint venture - 573Non-related parties: Government-link companies and Statutory Boards 654 854 Multinational companies 23,545 28,087 Other companies 44,051 61,346 Sole proprietors and individuals 1,496 1,733
70,440 92,742
(i) Financial assets that are neither past due nor impaired
Bank deposits that are neither past due nor impaired are mainly deposits with reputable banks with high credit ratings.
Trade receivables and long term loan receivables that are neither past due nor impaired are substantially companies with a good collection track record with the Group.
NOTES TO THE FINANCIAL STATEMENTS NOTES TO THE FINANCIAL STATEMENTSFor the financial year ended 31 December 2009

N S L Lt d A N N U A L R E P O R T 2 0 0 9 | 9 8 N S L Lt d A N N U A L R E P O R T 2 0 0 9 | 9 9
37. FINANCIAL RISK MANAGEMENT (continued)
37b Credit risk (continued)
(ii) Financial assets that are past due and / or impaired The age analysis of financial assets that are past due but not impaired relate to trade receivables as
follows:
The Group2009 2008
S$’000 S$’000
Past due up to 3 months 11,416 12,254Past due 3 to 6 months 3,593 4,479Past due over 6 months 1,613 3,727
16,622 20,460
The carrying amount of trade receivables and long term loan receivables (excluding loans which are in substance part of the Group’s net investment in associated companies, joint venture and subsidiaries) individually determined to be impaired and the movement in the related allowance for impairment are as follows:
The Group2009 2008
S$’000 S$’000
Gross amount 8,080 11,720Less: allowance for impairment (8,080) (11,627)
- 93
Allowance for impairmentBalance at 1 January 11,627 11,406Allowance made 1,045 1,513Allowance written back (2,169) (406)Amount written off against allowance (2,561) (681)Currency translation differences 138 (205)Balance at 31 December 8,080 11,627
NOTES TO THE FINANCIAL STATEMENTS NOTES TO THE FINANCIAL STATEMENTSFor the financial year ended 31 December 2009

N S L Lt d A N N U A L R E P O R T 2 0 0 9 | 9 8 N S L Lt d A N N U A L R E P O R T 2 0 0 9 | 9 9
37. FINANCIAL RISK MANAGEMENT (continued)
37c Liquidity risk
In managing liquidity risk, the Group’s policy is to maintain sufficient cash resources and ensure the availability of funding through adequate amounts of committed credit facilities.
The table below analyzes the maturity profile of the Group’s and Company’s non-derivative financial liabilities based on contractual undiscounted cash flows from the remaining period from the balance sheet date to the contractual maturity date.
Less than 1 year
Between 1 to 2 years
Between 2 to 5 years
Over 5 years
S$’000 S$’000 S$’000 S$’000The GroupAt 31 December 2009Trade and other payables 69,375 - - -Amount due to bankers 13,038 - - -Long term bank loans - 5,395 9,650 3,312Other non-current liabilities 86 690 2,069 614
At 31 December 2008Trade and other payables 96,222 - - -Amount due to bankers 27,435 - - -Long term bank loans - 4,737 8,091 9,574Other non-current liabilities 48 235 175 654
The CompanyAt 31 December 2009Trade and other payables 18,942 - - -
At 31 December 2008Trade and other payables 18,048 - - -
In addition to the financial liabilities disclosed above, the Group provided financial guarantees for its share of bank loans of S$5,270,000 (2008: S$4,879,000) (Note 22) drawn down by a joint venture at the balance sheet date. Any liability arising from the financial guarantees is payable upon default of the bank loans of the joint venture.
The table below shows the analysis of maturity profile of the Group’s derivative financial instruments for which contractual maturities are essential for an understanding of the timing of the cash flows. The maturity profile is based on contractual undiscounted cash flows from the remaining period from the balance sheet date to the contractual maturity date.
NOTES TO THE FINANCIAL STATEMENTS NOTES TO THE FINANCIAL STATEMENTSFor the financial year ended 31 December 2009

N S L Lt d A N N U A L R E P O R T 2 0 0 9 | 1 0 0 N S L Lt d A N N U A L R E P O R T 2 0 0 9 | 1 0 1
37. FINANCIAL RISK MANAGEMENT (continued)
37c Liquidity risk (continued)
Less than 1 year
S$’000The GroupAt 31 December 2009Gross-settled currency forwards - Receipts (9,360) - Payments 9,161
At 31 December 2008Gross-settled currency forwards - Receipts (31,500) - Payments 32,035
37d Capital risk
The Group’s objectives when managing capital are to ensure the Group’s ability to continue as a going concern and to maintain an efficient capital structure so as to enhance shareholders value. In order to maintain or achieve a prudent and efficient capital structure, the Group may adjust the amount of dividend payment, issue new shares, obtain new borrowings or sell assets to reduce borrowings.
The total capital of the Group and the Company as at balance sheet dates is represented by the respective “Total equity” as presented on the balance sheets. The Group and the Company monitor capital based on gross debt (Note 25, 26 and 30) and net cash position which is defined as cash less gross debt (Note 18).
As part of the monitoring process of the Group’s borrowings, management performs specific review of the need of individual entity within the Group to obtain external financing, taking into consideration the operating cashflows and gearing ratio of each entity as well as the prevailing market interest rates.
The Group and the Company are in compliance with all externally imposed capital requirements for the financial years ended 31 December 2008 and 2009.
37e Fair value measurements
Effective 1 January 2009, the Group adopted the amendment to FRS 107 which requires disclosure of fair value measurements by level of the following fair value measurement hierarchy:
(i) quoted price in active markets for identical assets or liabilities (Level 1);
(ii) inputs other than quoted prices included within Level 1 that are observable for the asset or liability, either directly (i.e. as prices) or indirectly (i.e. derived from prices) (Level 2); and
(iii) inputs for the asset or liability that are not based on observable market data (unobservable inputs) (Level 3).
NOTES TO THE FINANCIAL STATEMENTS NOTES TO THE FINANCIAL STATEMENTSFor the financial year ended 31 December 2009

N S L Lt d A N N U A L R E P O R T 2 0 0 9 | 1 0 0 N S L Lt d A N N U A L R E P O R T 2 0 0 9 | 1 0 1
37. FINANCIAL RISK MANAGEMENT (continued)
37e Fair value measurements (continued)
The following table presents the assets and liabilities measured at fair value at 31 December 2009.
Level 2 Level 3 TotalS$’000 S$’000 S$’000
The GroupAssetsDerivatives used for hedging 199 - 199Available-for-sale financial assets - 14,978 14,978Total assets 199 14,978 15,177
The CompanyAssetsAvailable-for-sale financial assets - 14,139 14,139
The fair values of derivatives comprising forward foreign exchange contracts are determined using forward currency rates at the balance sheet date obtained from external sources. These instruments are included in Level 2.
The fair values of financial instruments that are not traded in an active market are determined by using valuation techniques. The Group uses a variety of methods, and makes assumptions that are based on current market conditions existing at each balance sheet date. These include the use of recent arm’s length transactions, reference to other instruments that are substantially the same and discounted cash flow analysis. The Group also estimates the fair values of the financial assets by reference to the net assets of these equity securities, adjusting where applicable using appropriate measures to fair value the underlying assets and liabilities. Such instruments are included in Level 3.
The following table presents the changes in Level 3 instruments for the financial year ended 31 December 2009.
TheGroup
The Company
S$’000 S$’000Available-for-sale financial assetsOpening balance 31,561 14,814Disposals of level 3 securities (19,361) (3,953)Total gains in other comprehensive income 2,779 3,278Currency realignment (1) -Closing balance 14,978 14,139
Total (losses) / gains for the year for assets held at the end of the reporting period
- in profit or loss (448) - - in other comprehensive income 2,873 3,372
The carrying value (net) of loans and receivables are assumed to approximate their fair values. The fair values of non-current borrowings of the Group are estimated by discounting the future contractual cash flows at the current market interest rates that are available to the Group for similar financial liabilities. The fair value of current borrowings and other financial liabilities carried at amortised cost approximates their carrying amounts.
NOTES TO THE FINANCIAL STATEMENTS NOTES TO THE FINANCIAL STATEMENTSFor the financial year ended 31 December 2009

N S L Lt d A N N U A L R E P O R T 2 0 0 9 | 1 0 2 N S L Lt d A N N U A L R E P O R T 2 0 0 9 | 1 0 3
38. NEw ACCOUNTING STANDARDS AND FRS INTERPRETATIONS
Certain new standards, amendments and interpretations to existing standards have been published and are mandatory for the Group’s accounting periods beginning on or after 1 January 2010 or later periods and which the Group has not early adopted. The Group’s assessment of the impact of adopting those standards, amendments and interpretations that are relevant to the Group is set out below:
(a) FRS 27 (revised) Consolidated and Separate Financial Statements (effective for annual periods beginning on or after 1 July 2009)
FRS 27 (revised) requires the effects of all transactions with non-controlling interests to be recorded in equity if there is no change in control. These transactions will no longer result in goodwill or gains and losses. The standard also specifies the accounting when control is lost. Any remaining interest in the entity is re-measured to fair value, and a gain or loss is recognised in profit or loss. The Group will apply FRS 27 (revised) prospectively to transactions with minority interests from 1 January 2010.
(b) FRS 103 (revised) Business Combinations (effective for annual periods beginning on or after 1 July 2009)
FRS 103 (revised) continues to apply the acquisition method to business combinations, with some significant changes. For example, all payments to purchase a business are to be recorded at fair value at the acquisition date, with contingent payments classified as debt subsequently re-measured through profit or loss. There is a choice on an acquisition-by-acquisition basis to measure the non-controlling interest in the acquiree either at fair value or at the non-controlling interest’s proportionate share of the acquiree’s net assets. All acquisition-related costs should be expensed. The Group will apply FRS 103 (revised) prospectively to all business combinations from 1 January 2010.
Other new standards and amendments to existing standards and interpretations that are relevant to the Group but not expected to have any significant impact to the Group are as follows:
(a) Amendments to FRS 39 Financial Instruments: Recognition and Measurement – Eligible Hedged Items
(effective for annual periods beginning on or after 1 July 2009) (b) INT FRS 117 Distributions of Non-cash Assets to Owners (effective for annual periods beginning on
or after 1 July 2009) (c) INT FRS 118 Transfer of Assets to Customers (effective for annual periods beginning on or after
1 July 2009)
39. AUTHORISATION OF FINANCIAL STATEMENTS
These financial statements were authorised for issue in accordance with a resolution of the Board of Directors of NSL Ltd on 10 March 2010.
NOTES TO THE FINANCIAL STATEMENTS NOTES TO THE FINANCIAL STATEMENTSFor the financial year ended 31 December 2009

N S L Lt d A N N U A L R E P O R T 2 0 0 9 | 1 0 2 N S L Lt d A N N U A L R E P O R T 2 0 0 9 | 1 0 3
40. SIGNIFICANT COMPANIES IN THE GROUP
The principal activities of the significant companies in the Group, their countries of incorporation and places of business, and the extent of NSL Ltd’s equity interest in significant subsidiaries, associated companies and joint venture are as follows:
Name of company
Country of incorporation and place of
business
Percentage of equity held by
the Group Principal activities2009
%2008
%Significant SubsidiariesHeld by the CompanyUnquotedEastern Industries Private Limited (1) Singapore 100.0 100.0 Investment holdingNSL Chemicals Ltd (1) Singapore 100.0 100.0 Manufacturing and sale of lime and
refractory productsNSL Engineering Pte Ltd (1) Singapore 100.0 100.0 The design and sale of container
handling spreadersNSL Properties Pte Ltd (1) Singapore 100.0 100.0 Investment holdingNSL Resorts International Pte Ltd (1) Singapore 100.0 100.0 Investment holding
Significant Subsidiaries Held by SubsidiariesUnquotedChangShu NSL Calcific Products
Co., Ltd (2)
People’s Republic of
China
60.0 60.0 Manufacturing and sale of calcific products
ChangShu RAM Engineering Co., Ltd (2)
People’s Republic of
China
100.0 100.0 Manufacturing of container handling spreader
Eastech Steel Mill Services (M) Sdn Bhd (2)
Malaysia 100.0 100.0 Manufacturing and sale of monolithic refractories and trading of its related products
Eastern Pretech Pte Ltd (1) Singapore 100.0 100.0 Manufacturing and trading of building materials
Eastern Pretech (HK) Ltd (4) Hong Kong 80.0 80.0 Manufacturing and sale of plastering materials
Eastern Pretech (Malaysia) Sdn Bhd (2) Malaysia 100.0 100.0 Manufacturing and trading of building materials
Hup Eng Tat Enterprises Pte Ltd (1) Singapore 87.7 87.7 Trading in oil products and disposal of oil and chemical wastes
NSL Chemicals (M) Sdn Bhd (2) Malaysia 80.0 80.0 Manufacturing and trading in lime products
NSL Chemicals (Thailand) Pte Ltd (1) Singapore 100.0 100.0 Investment holding
Note: Refer to page 104 for legends
NOTES TO THE FINANCIAL STATEMENTS NOTES TO THE FINANCIAL STATEMENTSFor the financial year ended 31 December 2009
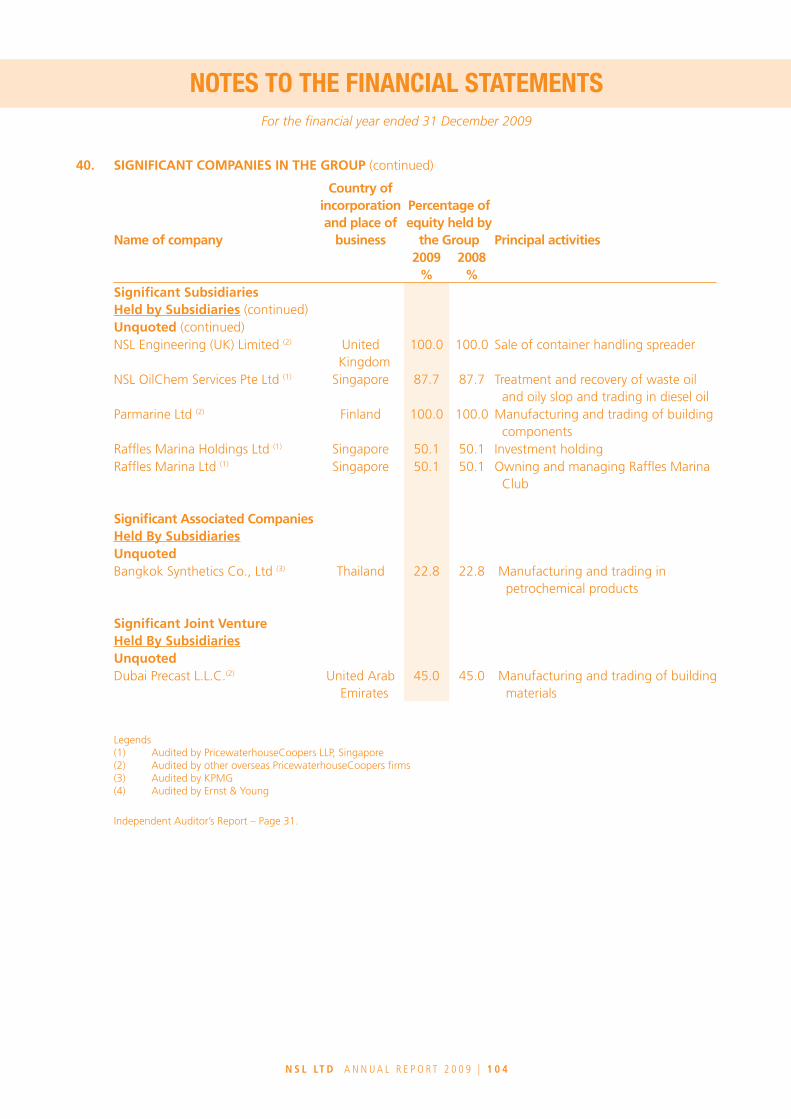
N S L Lt d A N N U A L R E P O R T 2 0 0 9 | 1 0 4 N S L Lt d A N N U A L R E P O R T 2 0 0 9 | 1 0 5
40. SIGNIFICANT COMPANIES IN THE GROUP (continued)
Name of company
Country of incorporation and place of
business
Percentage of equity held by
the Group Principal activities2009
%2008
%Significant SubsidiariesHeld by Subsidiaries (continued)Unquoted (continued)NSL Engineering (UK) Limited (2) United
Kingdom100.0 100.0 Sale of container handling spreader
NSL OilChem Services Pte Ltd (1) Singapore 87.7 87.7 Treatment and recovery of waste oil and oily slop and trading in diesel oil
Parmarine Ltd (2) Finland 100.0 100.0 Manufacturing and trading of building components
Raffles Marina Holdings Ltd (1) Singapore 50.1 50.1 Investment holdingRaffles Marina Ltd (1) Singapore 50.1 50.1 Owning and managing Raffles Marina
Club
Significant Associated Companies Held By SubsidiariesUnquotedBangkok Synthetics Co., Ltd (3) Thailand 22.8 22.8 Manufacturing and trading in
petrochemical products
Significant Joint venture Held By SubsidiariesUnquotedDubai Precast L.L.C.(2) United Arab
Emirates45.0 45.0 Manufacturing and trading of building
materials
Legends (1) Audited by PricewaterhouseCoopers LLP, Singapore (2) Audited by other overseas PricewaterhouseCoopers firms (3) Audited by KPMG (4) Audited by Ernst & Young
Independent Auditor’s Report – Page 31.
ANALYSIS OF SHAREHOLDINGSNOTES TO THE FINANCIAL STATEMENTSFor the financial year ended 31 December 2009
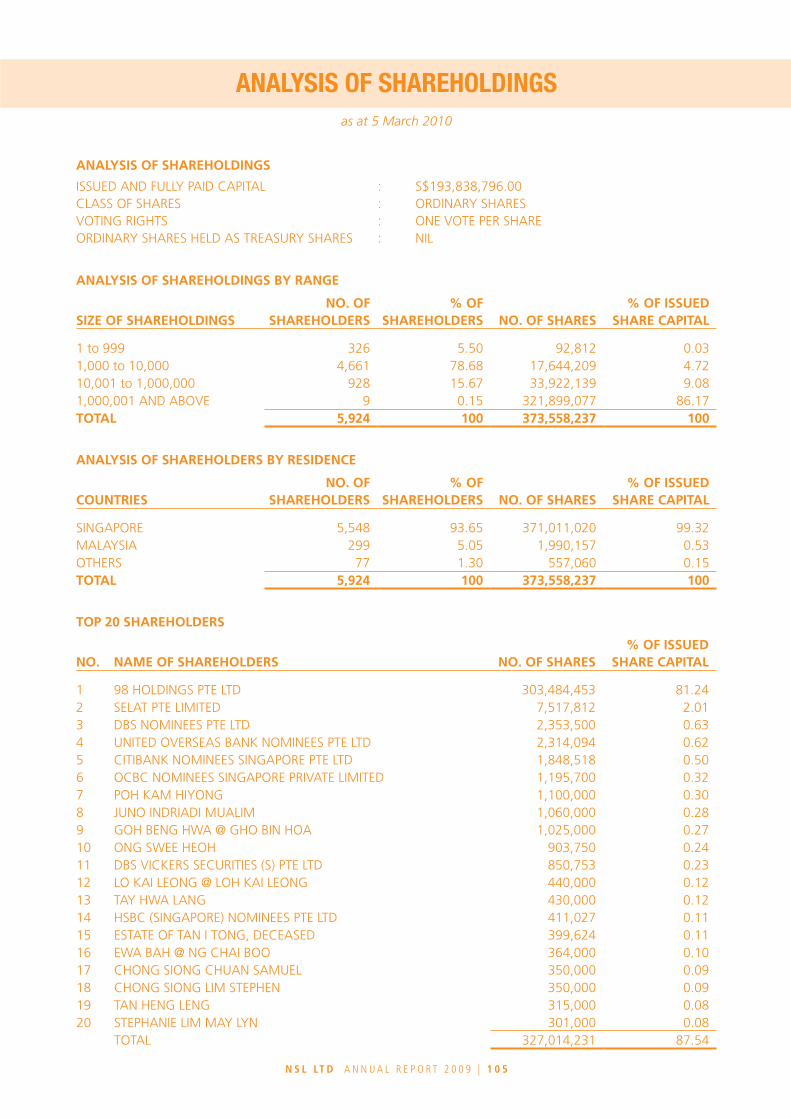
N S L Lt d A N N U A L R E P O R T 2 0 0 9 | 1 0 4 N S L Lt d A N N U A L R E P O R T 2 0 0 9 | 1 0 5
ANALYSIS OF SHAREHOLDINGSas at 5 March 2010
ANALYSIS OF SHAREHOLDINGS
ISSUED AND FULLY PAID CAPITAL : S$193,838,796.00CLASS OF SHARES : ORDINARY SHARESVOTING RIGHTS : ONE VOTE PER SHAREORDINARY SHARES HELD AS TREASURY SHARES : NIL
ANALYSIS OF SHAREHOLDINGS BY RANGE
SIZE OF SHAREHOLDINGSNO. OF
SHAREHOLDERS% OF
SHAREHOLDERS NO. OF SHARES% OF ISSUED
SHARE CAPITAL
1 to 999 326 5.50 92,812 0.031,000 to 10,000 4,661 78.68 17,644,209 4.7210,001 to 1,000,000 928 15.67 33,922,139 9.081,000,001 AND ABOVE 9 0.15 321,899,077 86.17TOTAL 5,924 100 373,558,237 100
ANALYSIS OF SHAREHOLDERS BY RESIDENCE
COUNTRIESNO. OF
SHAREHOLDERS% OF
SHAREHOLDERS NO. OF SHARES% OF ISSUED
SHARE CAPITAL
SINGAPORE 5,548 93.65 371,011,020 99.32MALAYSIA 299 5.05 1,990,157 0.53OTHERS 77 1.30 557,060 0.15TOTAL 5,924 100 373,558,237 100
TOP 20 SHAREHOLDERS
NO. NAME OF SHAREHOLDERS NO. OF SHARES% OF ISSUED
SHARE CAPITAL
1 98 HOLDINGS PTE LTD 303,484,453 81.242 SELAT PTE LIMITED 7,517,812 2.013 DBS NOMINEES PTE LTD 2,353,500 0.634 UNITED OVERSEAS BANK NOMINEES PTE LTD 2,314,094 0.625 CITIBANK NOMINEES SINGAPORE PTE LTD 1,848,518 0.506 OCBC NOMINEES SINGAPORE PRIVATE LIMITED 1,195,700 0.327 POH KAM HIYONG 1,100,000 0.308 JUNO INDRIADI MUALIM 1,060,000 0.289 GOH BENG HWA @ GHO BIN HOA 1,025,000 0.2710 ONG SWEE HEOH 903,750 0.2411 DBS VICKERS SECURITIES (S) PTE LTD 850,753 0.2312 LO KAI LEONG @ LOH KAI LEONG 440,000 0.1213 TAY HWA LANG 430,000 0.1214 HSBC (SINGAPORE) NOMINEES PTE LTD 411,027 0.1115 ESTATE OF TAN I TONG, DECEASED 399,624 0.1116 EWA BAH @ NG CHAI BOO 364,000 0.1017 CHONG SIONG CHUAN SAMUEL 350,000 0.0918 CHONG SIONG LIM STEPHEN 350,000 0.0919 TAN HENG LENG 315,000 0.0820 STEPHANIE LIM MAY LYN 301,000 0.08
TOTAL 327,014,231 87.54
NOTES TO THE FINANCIAL STATEMENTS
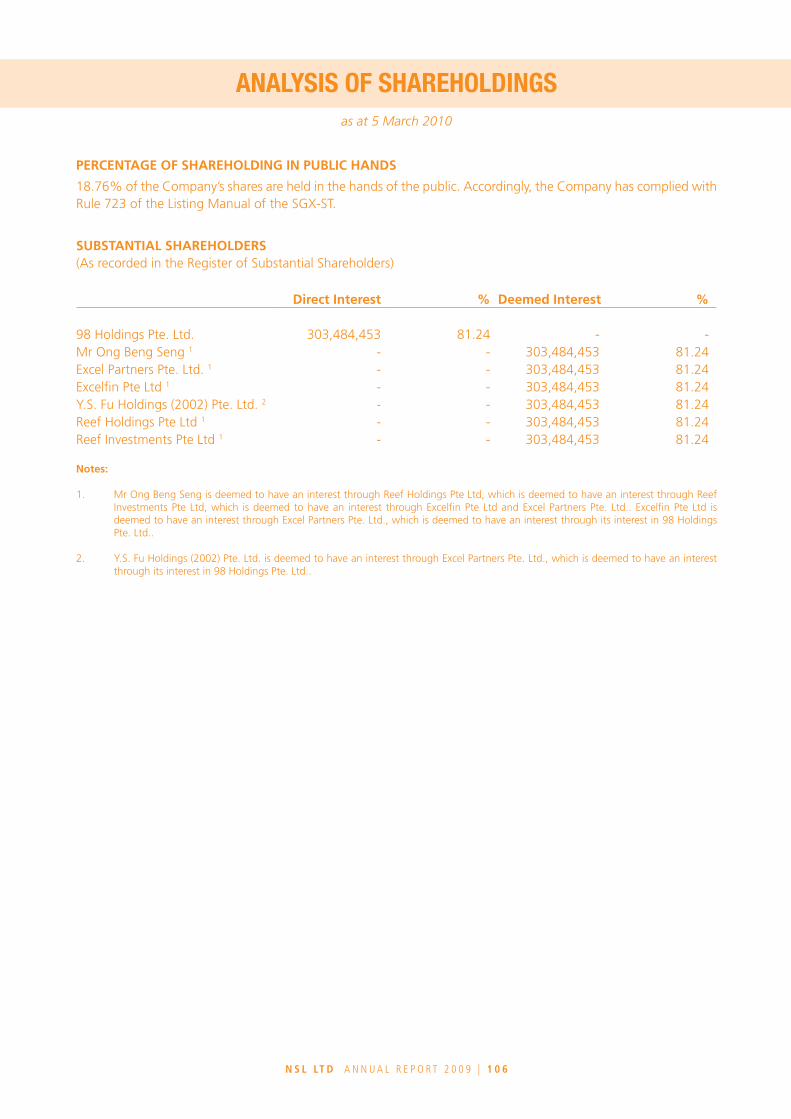
N S L Lt d A N N U A L R E P O R T 2 0 0 9 | 1 0 6 N S L Lt d A N N U A L R E P O R T 2 0 0 9 | 1 0 7
ANALYSIS OF SHAREHOLDINGS NOTICE OF ANNUAL GENERAL MEETINGas at 5 March 2010
PERCENTAGE OF SHAREHOLDING IN PUBLIC HANDS
18.76% of the Company’s shares are held in the hands of the public. Accordingly, the Company has complied with Rule 723 of the Listing Manual of the SGX-ST.
SUBSTANTIAL SHAREHOLDERS(As recorded in the Register of Substantial Shareholders)
Direct Interest % Deemed Interest %
98 Holdings Pte. Ltd. 303,484,453 81.24 - -Mr Ong Beng Seng 1 - - 303,484,453 81.24Excel Partners Pte. Ltd. 1 - - 303,484,453 81.24Excelfin Pte Ltd 1 - - 303,484,453 81.24Y.S. Fu Holdings (2002) Pte. Ltd. 2 - - 303,484,453 81.24Reef Holdings Pte Ltd 1 - - 303,484,453 81.24Reef Investments Pte Ltd 1 - - 303,484,453 81.24
Notes:
1. Mr Ong Beng Seng is deemed to have an interest through Reef Holdings Pte Ltd, which is deemed to have an interest through Reef Investments Pte Ltd, which is deemed to have an interest through Excelfin Pte Ltd and Excel Partners Pte. Ltd.. Excelfin Pte Ltd is deemed to have an interest through Excel Partners Pte. Ltd., which is deemed to have an interest through its interest in 98 Holdings Pte. Ltd..
2. Y.S. Fu Holdings (2002) Pte. Ltd. is deemed to have an interest through Excel Partners Pte. Ltd., which is deemed to have an interest through its interest in 98 Holdings Pte. Ltd..
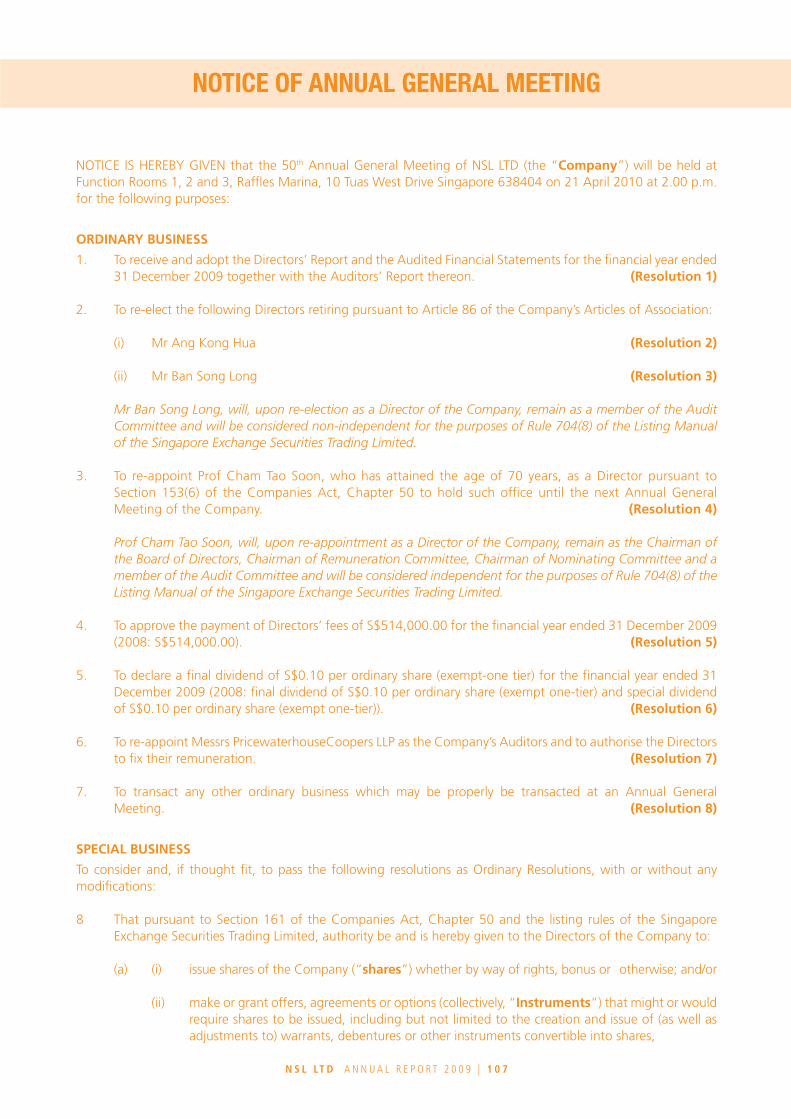
N S L Lt d A N N U A L R E P O R T 2 0 0 9 | 1 0 6 N S L Lt d A N N U A L R E P O R T 2 0 0 9 | 1 0 7
ANALYSIS OF SHAREHOLDINGS NOTICE OF ANNUAL GENERAL MEETING
NOTICE IS HEREBY GIVEN that the 50th Annual General Meeting of NSL LTD (the “Company”) will be held at Function Rooms 1, 2 and 3, Raffles Marina, 10 Tuas West Drive Singapore 638404 on 21 April 2010 at 2.00 p.m. for the following purposes:
ORDINARY BUSINESS
1. To receive and adopt the Directors’ Report and the Audited Financial Statements for the financial year ended 31 December 2009 together with the Auditors’ Report thereon. (Resolution 1)
2. To re-elect the following Directors retiring pursuant to Article 86 of the Company’s Articles of Association:
(i) Mr Ang Kong Hua (Resolution 2)
(ii) Mr Ban Song Long (Resolution 3)
Mr Ban Song Long, will, upon re-election as a Director of the Company, remain as a member of the Audit Committee and will be considered non-independent for the purposes of Rule 704(8) of the Listing Manual of the Singapore Exchange Securities Trading Limited.
3. To re-appoint Prof Cham Tao Soon, who has attained the age of 70 years, as a Director pursuant to Section 153(6) of the Companies Act, Chapter 50 to hold such office until the next Annual General Meeting of the Company. (Resolution 4)
Prof Cham Tao Soon, will, upon re-appointment as a Director of the Company, remain as the Chairman of the Board of Directors, Chairman of Remuneration Committee, Chairman of Nominating Committee and a member of the Audit Committee and will be considered independent for the purposes of Rule 704(8) of the Listing Manual of the Singapore Exchange Securities Trading Limited.
4. To approve the payment of Directors’ fees of S$514,000.00 for the financial year ended 31 December 2009 (2008: S$514,000.00). (Resolution 5)
5. To declare a final dividend of S$0.10 per ordinary share (exempt-one tier) for the financial year ended 31 December 2009 (2008: final dividend of S$0.10 per ordinary share (exempt one-tier) and special dividend of S$0.10 per ordinary share (exempt one-tier)). (Resolution 6)
6. To re-appoint Messrs PricewaterhouseCoopers LLP as the Company’s Auditors and to authorise the Directors to fix their remuneration. (Resolution 7)
7. To transact any other ordinary business which may be properly be transacted at an Annual General Meeting. (Resolution 8)
SPECIAL BUSINESS
To consider and, if thought fit, to pass the following resolutions as Ordinary Resolutions, with or without any modifications:
8 That pursuant to Section 161 of the Companies Act, Chapter 50 and the listing rules of the Singapore Exchange Securities Trading Limited, authority be and is hereby given to the Directors of the Company to:
(a) (i) issue shares of the Company (“shares”) whether by way of rights, bonus or otherwise; and/or
(ii) make or grant offers, agreements or options (collectively, “Instruments”) that might or would require shares to be issued, including but not limited to the creation and issue of (as well as adjustments to) warrants, debentures or other instruments convertible into shares,
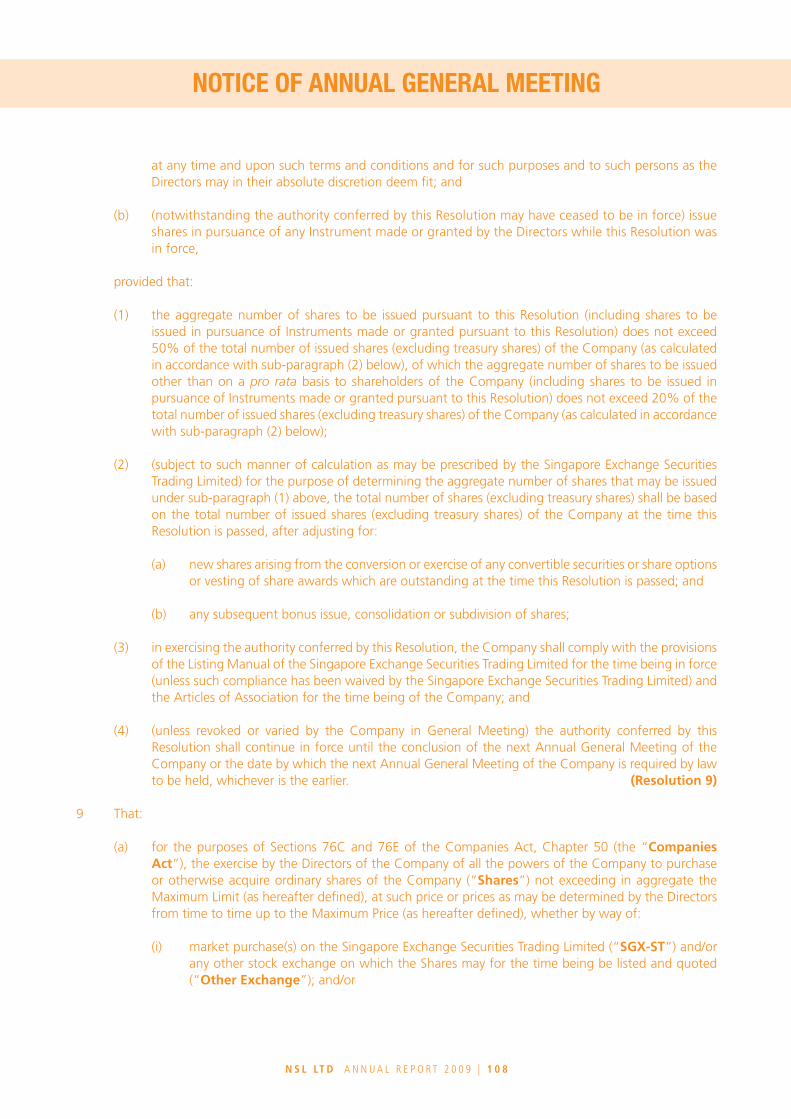
N S L Lt d A N N U A L R E P O R T 2 0 0 9 | 1 0 8 N S L Lt d A N N U A L R E P O R T 2 0 0 9 | 1 0 9
at any time and upon such terms and conditions and for such purposes and to such persons as the Directors may in their absolute discretion deem fit; and
(b) (notwithstanding the authority conferred by this Resolution may have ceased to be in force) issue shares in pursuance of any Instrument made or granted by the Directors while this Resolution was in force,
provided that:
(1) the aggregate number of shares to be issued pursuant to this Resolution (including shares to be issued in pursuance of Instruments made or granted pursuant to this Resolution) does not exceed 50% of the total number of issued shares (excluding treasury shares) of the Company (as calculated in accordance with sub-paragraph (2) below), of which the aggregate number of shares to be issued other than on a pro rata basis to shareholders of the Company (including shares to be issued in pursuance of Instruments made or granted pursuant to this Resolution) does not exceed 20% of the total number of issued shares (excluding treasury shares) of the Company (as calculated in accordance with sub-paragraph (2) below);
(2) (subject to such manner of calculation as may be prescribed by the Singapore Exchange Securities Trading Limited) for the purpose of determining the aggregate number of shares that may be issued under sub-paragraph (1) above, the total number of shares (excluding treasury shares) shall be based on the total number of issued shares (excluding treasury shares) of the Company at the time this Resolution is passed, after adjusting for:
(a) new shares arising from the conversion or exercise of any convertible securities or share options or vesting of share awards which are outstanding at the time this Resolution is passed; and
(b) any subsequent bonus issue, consolidation or subdivision of shares;
(3) in exercising the authority conferred by this Resolution, the Company shall comply with the provisions of the Listing Manual of the Singapore Exchange Securities Trading Limited for the time being in force (unless such compliance has been waived by the Singapore Exchange Securities Trading Limited) and the Articles of Association for the time being of the Company; and
(4) (unless revoked or varied by the Company in General Meeting) the authority conferred by this Resolution shall continue in force until the conclusion of the next Annual General Meeting of the Company or the date by which the next Annual General Meeting of the Company is required by law to be held, whichever is the earlier. (Resolution 9)
9 That: (a) for the purposes of Sections 76C and 76E of the Companies Act, Chapter 50 (the “Companies
Act”), the exercise by the Directors of the Company of all the powers of the Company to purchase or otherwise acquire ordinary shares of the Company (“Shares”) not exceeding in aggregate the Maximum Limit (as hereafter defined), at such price or prices as may be determined by the Directors from time to time up to the Maximum Price (as hereafter defined), whether by way of:
(i) market purchase(s) on the Singapore Exchange Securities Trading Limited (“SGx-ST”) and/or any other stock exchange on which the Shares may for the time being be listed and quoted (“Other Exchange”); and/or
NOTICE OF ANNUAL GENERAL MEETINGNOTICE OF ANNUAL GENERAL MEETING
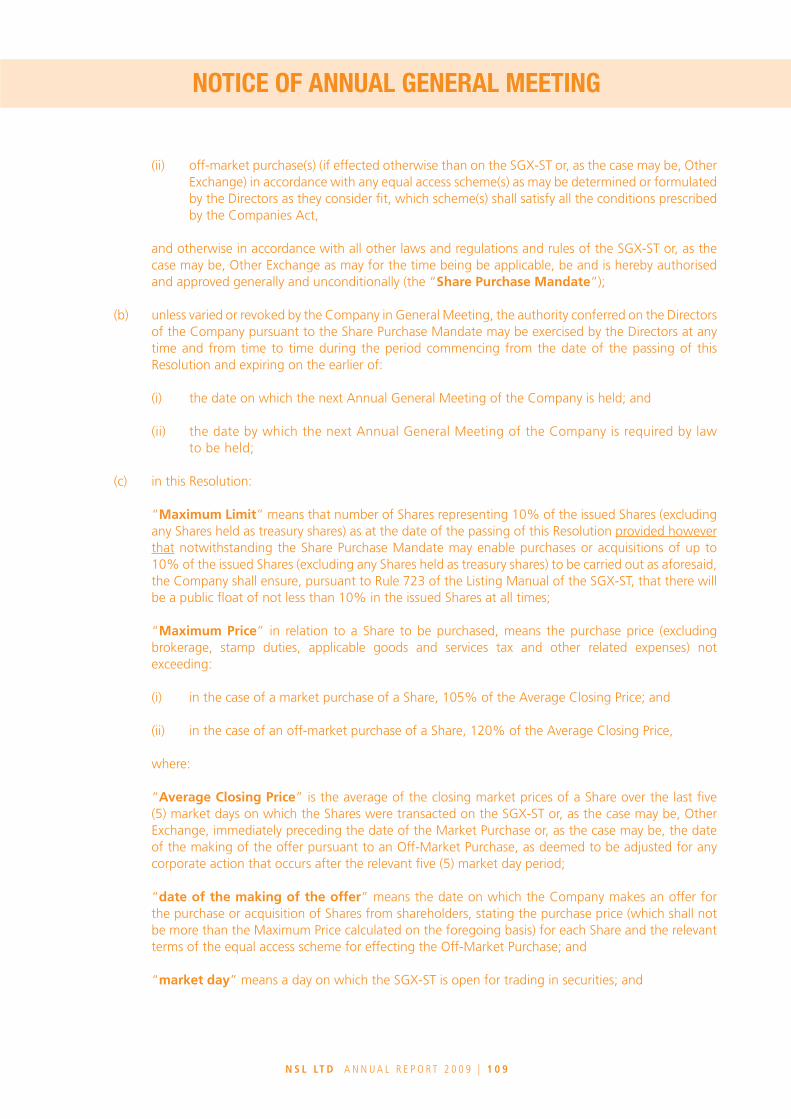
N S L Lt d A N N U A L R E P O R T 2 0 0 9 | 1 0 8 N S L Lt d A N N U A L R E P O R T 2 0 0 9 | 1 0 9
(ii) off-market purchase(s) (if effected otherwise than on the SGX-ST or, as the case may be, Other Exchange) in accordance with any equal access scheme(s) as may be determined or formulated by the Directors as they consider fit, which scheme(s) shall satisfy all the conditions prescribed by the Companies Act,
and otherwise in accordance with all other laws and regulations and rules of the SGX-ST or, as the case may be, Other Exchange as may for the time being be applicable, be and is hereby authorised and approved generally and unconditionally (the “Share Purchase Mandate”);
(b) unless varied or revoked by the Company in General Meeting, the authority conferred on the Directors of the Company pursuant to the Share Purchase Mandate may be exercised by the Directors at any time and from time to time during the period commencing from the date of the passing of this Resolution and expiring on the earlier of:
(i) the date on which the next Annual General Meeting of the Company is held; and
(ii) the date by which the next Annual General Meeting of the Company is required by law to be held;
(c) in this Resolution:
“Maximum Limit” means that number of Shares representing 10% of the issued Shares (excluding any Shares held as treasury shares) as at the date of the passing of this Resolution provided however that notwithstanding the Share Purchase Mandate may enable purchases or acquisitions of up to 10% of the issued Shares (excluding any Shares held as treasury shares) to be carried out as aforesaid, the Company shall ensure, pursuant to Rule 723 of the Listing Manual of the SGX-ST, that there will be a public float of not less than 10% in the issued Shares at all times;
“Maximum Price” in relation to a Share to be purchased, means the purchase price (excluding brokerage, stamp duties, applicable goods and services tax and other related expenses) not exceeding:
(i) in the case of a market purchase of a Share, 105% of the Average Closing Price; and
(ii) in the case of an off-market purchase of a Share, 120% of the Average Closing Price,
where:
“Average Closing Price” is the average of the closing market prices of a Share over the last five (5) market days on which the Shares were transacted on the SGX-ST or, as the case may be, Other Exchange, immediately preceding the date of the Market Purchase or, as the case may be, the date of the making of the offer pursuant to an Off-Market Purchase, as deemed to be adjusted for any corporate action that occurs after the relevant five (5) market day period;
“date of the making of the offer” means the date on which the Company makes an offer for the purchase or acquisition of Shares from shareholders, stating the purchase price (which shall not be more than the Maximum Price calculated on the foregoing basis) for each Share and the relevant terms of the equal access scheme for effecting the Off-Market Purchase; and
“market day” means a day on which the SGX-ST is open for trading in securities; and
NOTICE OF ANNUAL GENERAL MEETINGNOTICE OF ANNUAL GENERAL MEETING

N S L Lt d A N N U A L R E P O R T 2 0 0 9 | 1 1 0 N S L Lt d A N N U A L R E P O R T 2 0 0 9 | 1 1 1
(d) the Directors of the Company and/or any of them be and are hereby authorised to complete and do all such acts and things (including executing such documents as may be required) as they and/or he may consider expedient or necessary to give effect to the transactions contemplated and/or authorised by this Resolution. (Resolution 10)
BY ORDER OF THE BOARD
Lim Su-Ling (Ms)Company Secretary
Singapore 29 March 2010
Explanatory Notes
(i) Ordinary Resolution 9 proposed in item 8 above, if passed, will empower the Directors to issue shares and to make or grant instruments (such as warrants or debentures) convertible into shares and issue shares in pursuance of such instruments, up to the limits specified therein, until the date of the next Annual General Meeting. For the purpose of determining the aggregate number of shares that may be issued, the total number of issued shares (excluding treasury shares) will be calculated based on the total number of issued shares (excluding treasury shares) in the capital of the Company at the time that this Resolution is passed, after adjusting for new shares arising from the conversion or exercise of any convertible securities or share options or vesting of share awards which are outstanding at the time that this Resolution is passed, and any subsequent bonus issue, consolidation or subdivision of shares.
(ii) Ordinary Resolution 10 proposed in item 9 above, if passed, will empower the Directors to exercise the power of the Company to purchase or acquire its issued ordinary shares, until the date of the next Annual General Meeting. The Company intends to use internal sources of funds, external borrowings, or a combination of internal resources and external borrowings, to finance purchases or acquisitions of its shares. The amount of financing required for the Company to purchase or acquire its shares, and the impact on the Company’s financial position, cannot be ascertained as at the date of this Notice as these will depend on, inter alia, whether the shares are purchased or acquired out of capital and/or profits of the Company, the aggregate number of shares purchased or acquired, and the consideration paid at the relevant time. Purely for illustrative purposes only, the financial effects of an assumed purchase or acquisition by the Company of 29,884,658 shares on 17 March 2010 representing 8% of the issued shares (excluding treasury shares) as at that date, at a purchase price equivalent to the Maximum Price per share, in the case of a market purchase and an off-market purchase respectively, based on the audited financial statements of the Group and the Company for the financial year ended 31 December 2009 and certain assumptions, are set out in Paragraph 2.7 of the Company’s letter to shareholders dated 29 March 2010.
Notes:
1. A member of the Company entitled to attend and vote at the Annual General Meeting is entitled to appoint not more than two proxies to attend and vote in his stead.
2. A member of the Company which is a corporation is entitled to appoint its authorised representative or proxy to vote on its behalf. 3. A proxy need not be a member of the Company. 4. The instrument appointing a proxy must be deposited at the registered office of the Company at 77 Robinson Road #27-00
Robinson 77 Singapore 068896, not less than 48 hours before the time set for holding the Annual General Meeting.
NOTICE OF ANNUAL GENERAL MEETING PROXY FORM
N S L Lt d A N N U A L R E P O R T 2 0 0 9 | 1 1 0 N S L Lt d A N N U A L R E P O R T 2 0 0 9 | 1 1 1
NOTICE OF ANNUAL GENERAL MEETING PROXY FORM
NSL LTD(formerly known as NATSTEEL Ltd)(Incorporated in the Republic of Singapore)Company Registration Number 196100107C
IMPORTANT
1. For investors who have used their Central Provident Fund (“CPF”) moneys to buy shares in the capital of NSL LTD, the Annual Report is sent to them at the request of their CPF Approved Nominees and is sent solely FOR INFORMATION ONLY.
2. This Proxy Form is not valid for use by CPF investors and shall be ineffective for all intents and purposes if used or purported to be used by them.
3. CPF investors who wish to attend the Annual General Meeting as observers should register with their respective CPF Agent Banks who must submit their requests to the Company not later than 48 hours before the time set for the Meeting.
I/We (Name)
of (Address)
being a member/members of NSL LTD (the “Company”), hereby appoint the Chairman of the Meeting (Note 2)
Name AddressNRIC/
Passport No.
Proportion ofShareholdings
(%)
and/or (delete as appropriate)
as my/our proxy/proxies to attend and to vote for me/us on my/our behalf and, if necessary, to demand a poll, at the Annual General Meeting of the Company to be held at Function Rooms 1, 2 and 3, Raffles Marina, 10 Tuas West Drive Singapore 638404 on 21 April 2010 at 2.00 p.m. and at any adjournment thereof.
(Please indicate with an “X” in the spaces provided whether you wish your vote(s) to be cast for or against the Resolutions as set out in the Notice of Annual General Meeting. In the absence of specific directions, the proxy/proxies will vote or abstain as he/they may think fit, as he/they will on any other matter arising at the Annual General Meeting).
No Resolutions relating to : For Against Ordinary Business
1 Directors’ Report and Audited Financial Statements for the financial year ended 31 December 2009
2 Re-election of Mr Ang Kong Hua as a Director3 Re-election of Mr Ban Song Long as a Director 4 Re-appointment of Prof Cham Tao Soon as a Director 5 Approval of Directors’ fees amounting to S$514,000.006 Approval of Final Dividend of S$0.10 per ordinary share (exempt-
one tier) for the financial year ended 31 December 20097 Re-appointment of Messrs PricewaterhouseCoopers LLP as
Auditors and authorisation for Directors to fix their remuneration8 Any other ordinary business
Special Business9 To approve the Share Issue Mandate10 To approve the renewal of the Share Purchase Mandate
Dated this day of 2010.
Total Number of Shares Held
Signature(s) of Member(s)/Common Seal
IMPORTANT: PLEASE READ NOTES OvERLEAF

N S L Lt d A N N U A L R E P O R T 2 0 0 9 | 1 1 2
Notes:
1. Please insert the total number of shares held by you. If you have shares entered against your name in the Depository Register (as defined in Section 130A of the Companies Act, Chapter 50 of Singapore), you should insert that number. If you have shares registered in your name in the Register of Members of the Company, you should insert that number. If you have shares entered against your name in the Depository Register and registered in your name in the Register of Members, you should insert the aggregate number. If no number is inserted, this form of proxy will be deemed to relate to all the shares held by you.
2. A member of NSL LTD (the “Company”) entitled to attend and vote at a meeting of the Company is entitled to appoint one or two proxies to attend and vote on his behalf. Such proxy need not be a member of the Company. If any other proxy is to be appointed, please strike out “Chairman of the Meeting” and insert the name(s) and particulars of the proxy or proxies to be appointed in the box provided.
3. If the Chairman of the Meeting is appointed as proxy, this instrument appointing a proxy or proxies shall be deemed to confer on him the right to nominate a person to vote on his behalf on a show of hands.
4. Where a member appoints more than one proxy, the appointments shall be invalid unless he specifies the proportion of his holding to be represented by each proxy.
5. Completion and return of this instrument appointing a proxy shall not preclude a member from attending and voting at the Meeting. Any appointment of a proxy or proxies shall be deemed to be revoked if a member attends the Meeting in person, and in such event, the Company reserves the right to refuse to admit any person or persons appointed under the instrument of proxy, to the Meeting.
6. The instrument appointing a proxy or proxies must be deposited at the Company’s registered office at 77 Robinson Road #27-00 Robinson 77 Singapore 068896 not less than 48 hours before the time set for holding the Meeting.
7. The instrument appointing a proxy or proxies must be under the hand of the appointor or of his attorney duly authorised in writing. Where the instrument appointing a proxy or proxies is executed by a corporation, it must be executed either under its seal or under the hand of a director or an officer or attorney duly authorised.
8. A corporation which is a member may authorise by resolution of its directors or other governing body such person as it thinks fit to act as its representative at the Meeting, in accordance with Section 179 of the Companies Act, Chapter 50 of Singapore.
9. The Company shall be entitled to reject an instrument of proxy which is incomplete, improperly completed, illegible or where the true intentions of the appointor are not ascertainable from the instructions of the appointor specified on the instrument of proxy. In addition, in the case of shares entered in the Depository Register, the Company may reject an instrument of proxy if the member, being the appointor, is not shown to have shares entered against his name in the Depository Register as at 48 hours before the time appointed for holding the Meeting, as certified by The Central Depository (Pte) Limited to the Company.
PROXY FORM

This annual report is printed on Green Forest and Ozone Offset FSC, both labeled as environmentally-friendly papers by Forest Stewardship Council. These two types of paper are produced with a minimum content of 70% virgin fibre.
NSL LTD (formerly known as NATSTEEL LTD)
77 Robinson Road, #27-00 Robinson 77, Singapore 068896Tel: 6536 1000 Fax: 6536 1008
[CO. REG. NO: 196100107C]
www.nsl .com.sg


![Obesity for medical students.ppt [Read-Only] · Obesity rates could double in n 30 30 years n n n n n n l l l l l l t o o u u u u n l o 50 40 30 20 10 0 % o f p o p u l a t i o n](https://img.pdfslide.us/doc/110x75/5f69c2065ed9c21bae08d305/obesity-for-medical-read-only-obesity-rates-could-double-in-n-30-30-years-n-n.jpg)


![PRANCHA A4 - PADRÃO EUA22,4 kg kg kg l bench banco technical drawing dibujo tÉcnico 1'-5" 1.44m] longitudinal section corte longitudinal dwg name amaralina esr-4370 icc-es listed](https://img.pdfslide.us/doc/110x75/60c3f109d9409a1f853fbea9/prancha-a4-padrfo-eua-224-kg-kg-kg-l-bench-banco-technical-drawing-dibujo-tcnico.jpg)