Embed Size (px)
Citation preview
NON CORE BUT
HARD CORE
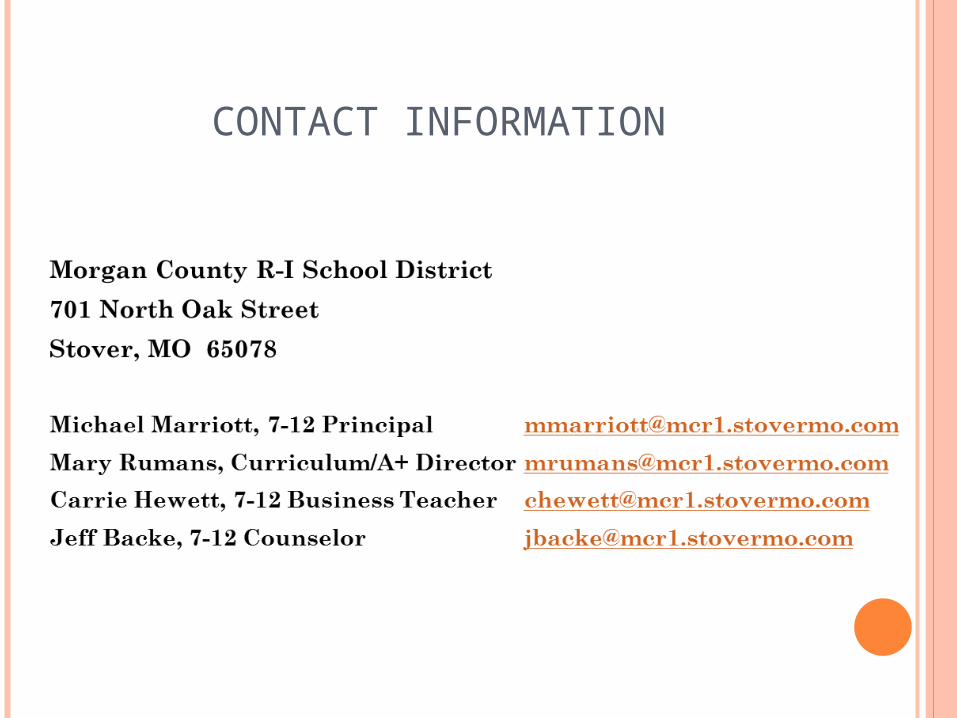
Morgan County R-I School District
701 North Oak Street
Stover, MO 65078
Michael Marriott, 7-12 [email protected]
Mary Rumans, Curriculum/A+ Director [email protected]
Carrie Hewett, 7-12 Business Teacher [email protected]
Jeff Backe, 7-12 Counselor [email protected]
NON CORE TEACHERS AREACTIVE IN OUR PLC
PROCESS
BusinessAG
FACSArtPE
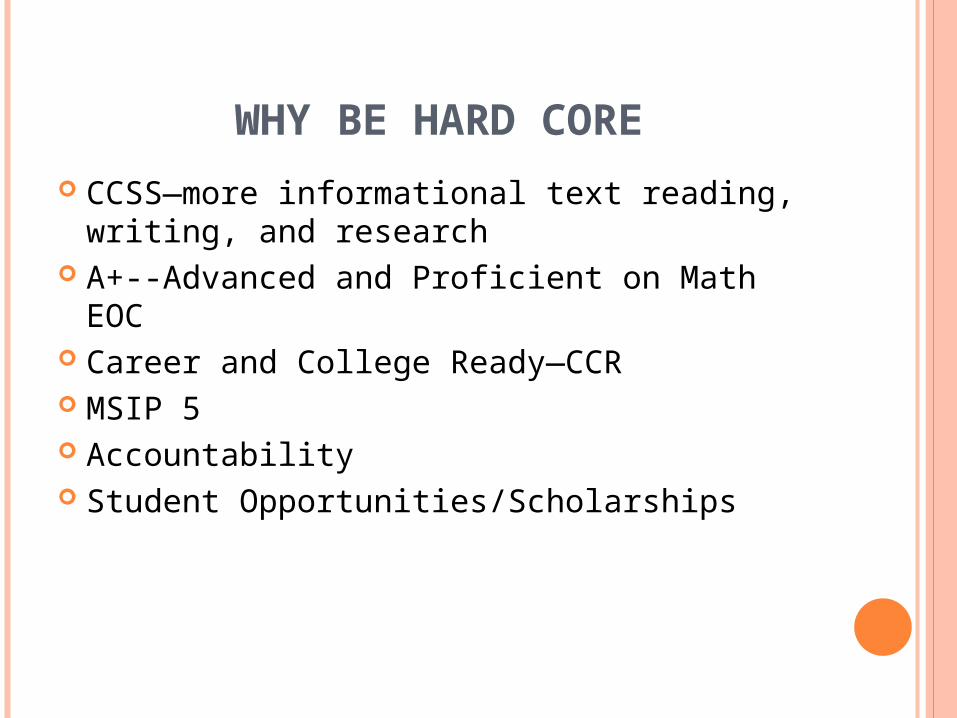
WHY BE HARD CORE CCSS—more informational text reading,
writing, and research A+--Advanced and Proficient on Math EOC Career and College Ready—CCR MSIP 5 Accountability Student Opportunities/Scholarships
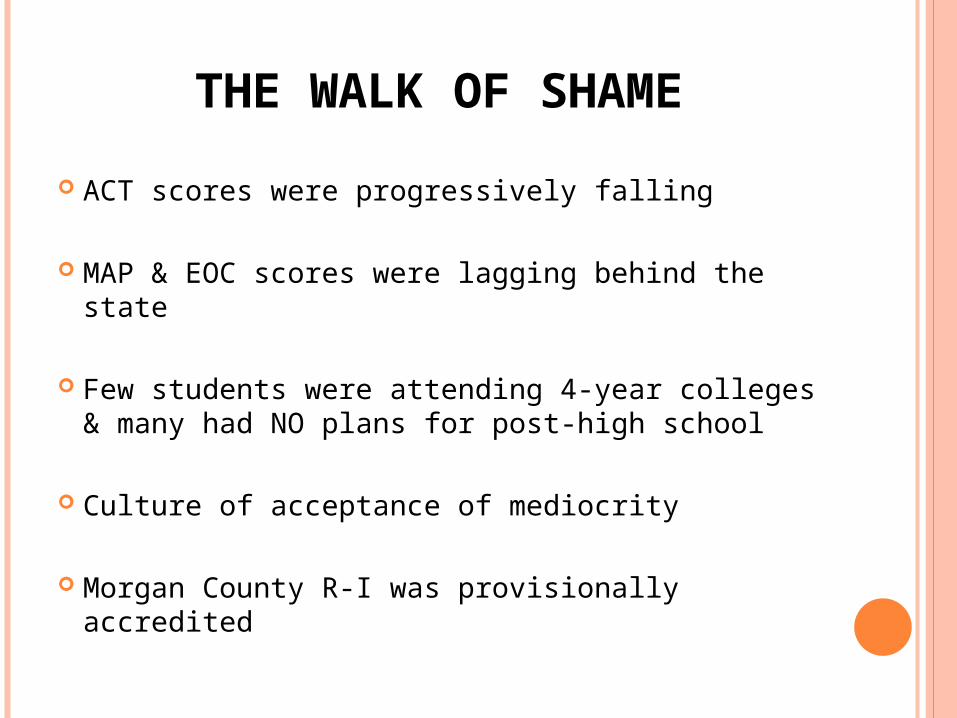
THE WALK OF SHAME
ACT scores were progressively falling
MAP & EOC scores were lagging behind the state
Few students were attending 4-year colleges & many had NO plans for post-high school
Culture of acceptance of mediocrity
Morgan County R-I was provisionally accredited
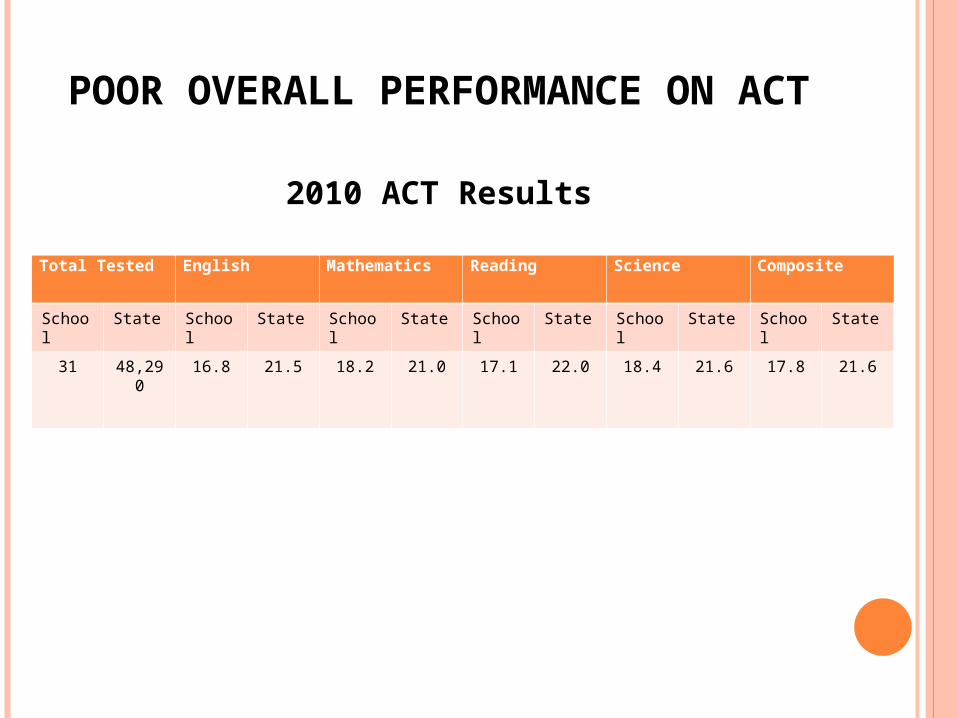
POOR OVERALL PERFORMANCE ON ACT
2010 ACT Results
Total Tested English Mathematics Reading Science Composite
School State School State School State School State School State School State
31 48,290
16.8 21.5 18.2 21.0 17.1 22.0 18.4 21.6 17.8 21.6
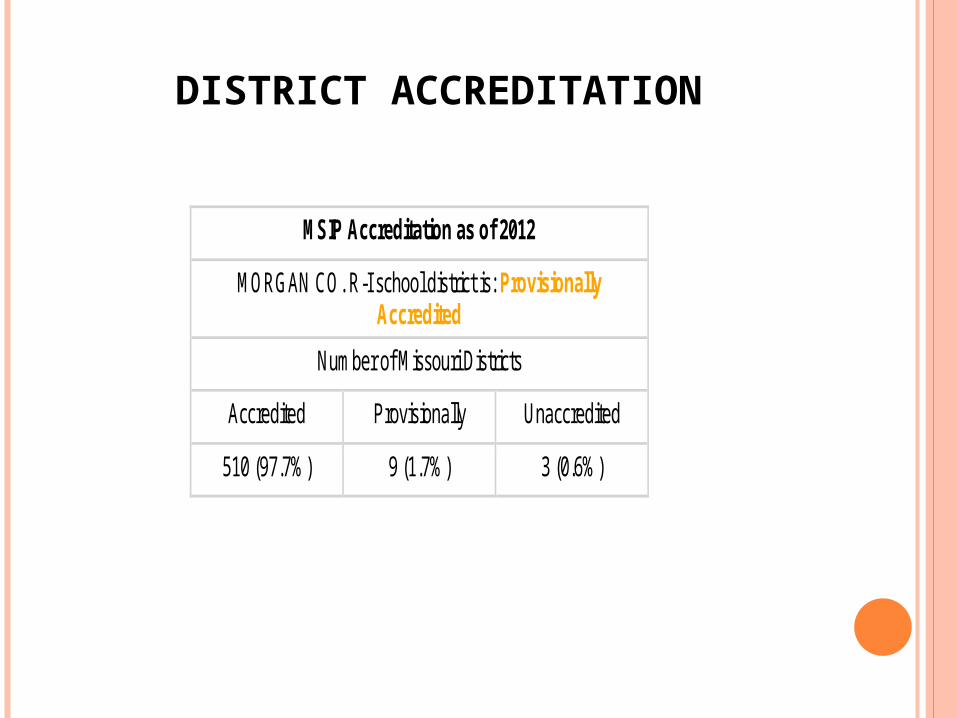
DISTRICT ACCREDITATION
MSIP Accreditation as of 2012
MORGAN CO. R-I school district is: Provisionally Accredited
Number of Missouri Districts
Accredited Provisionally Unaccredited
510 (97.7%) 9 (1.7%) 3 (0.6%)
WE NEEDED INTERVENTIONS
PLC—Professional Learning Community Early release weekly Collaborative Teams Data Analysis SMART Goals Accountability High expectations Change in Culture
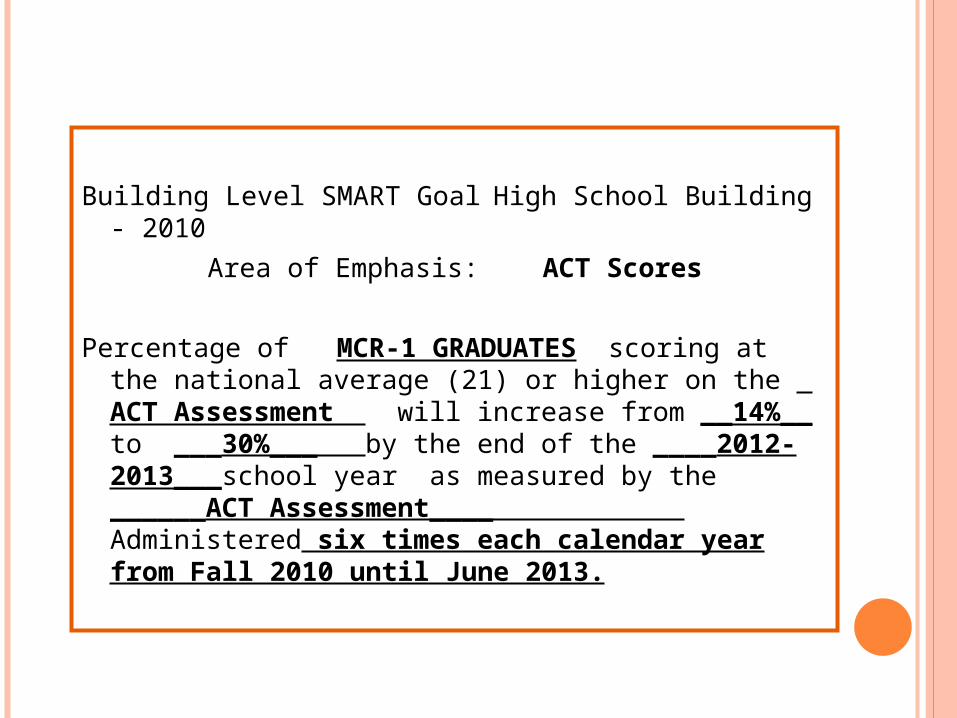
Building Level SMART Goal High School Building - 2010
Area of Emphasis: ACT Scores
Percentage of MCR-1 GRADUATES scoring at the national average (21) or higher on the ACT Assessment will increase from __14%__ to ___30%___ by the end of the ____2012-2013___school year as measured by the ______ACT Assessment____ Administered six times each calendar year from Fall 2010 until June 2013.
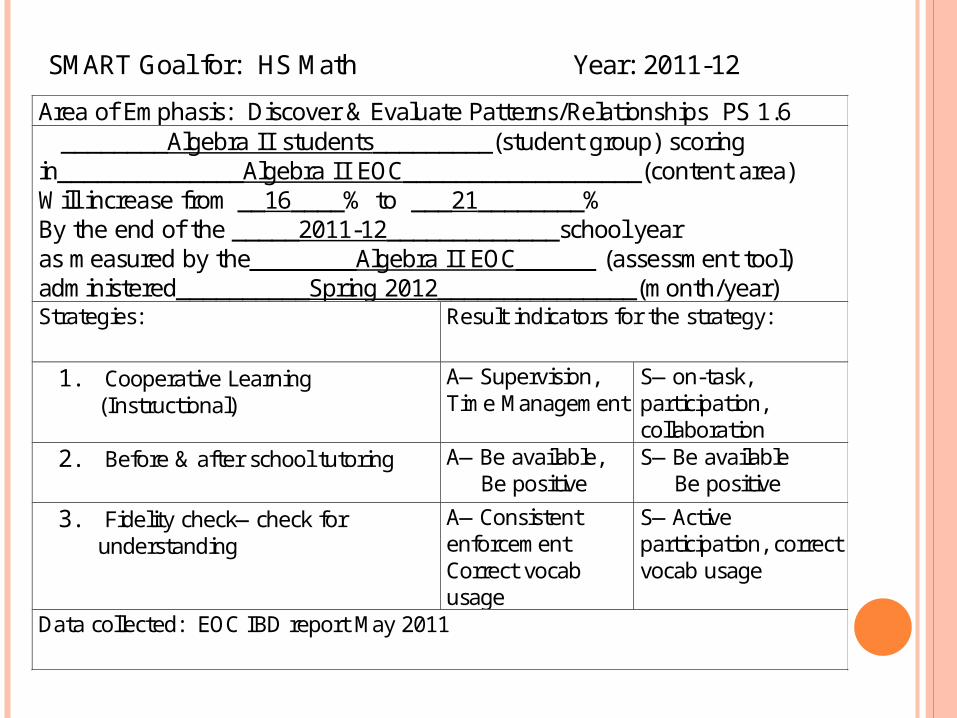
SMART Goal for: HS Math Year: 2011-12
Area of Emphasis: Discover & Evaluate Patterns/Relationships PS 1.6 ________Algebra II students_________(student group) scoring in______________Algebra II EOC__________________(content area) Will increase from __16____% to ___21________% By the end of the _____2011-12_____________school year as measured by the________Algebra II EOC______ (assessment tool) administered__________Spring 2012_______________(month/year) Strategies: Result indicators for the strategy:
1. Cooperative Learning (Instructional)
A—Supervision, Time Management
S—on-task, participation, collaboration
2. Before & after school tutoring A—Be available, Be positive
S—Be available Be positive
3. Fidelity check—check for understanding
A—Consistent enforcement Correct vocab usage
S—Active participation, correct vocab usage
Data collected: EOC IBD report May 2011
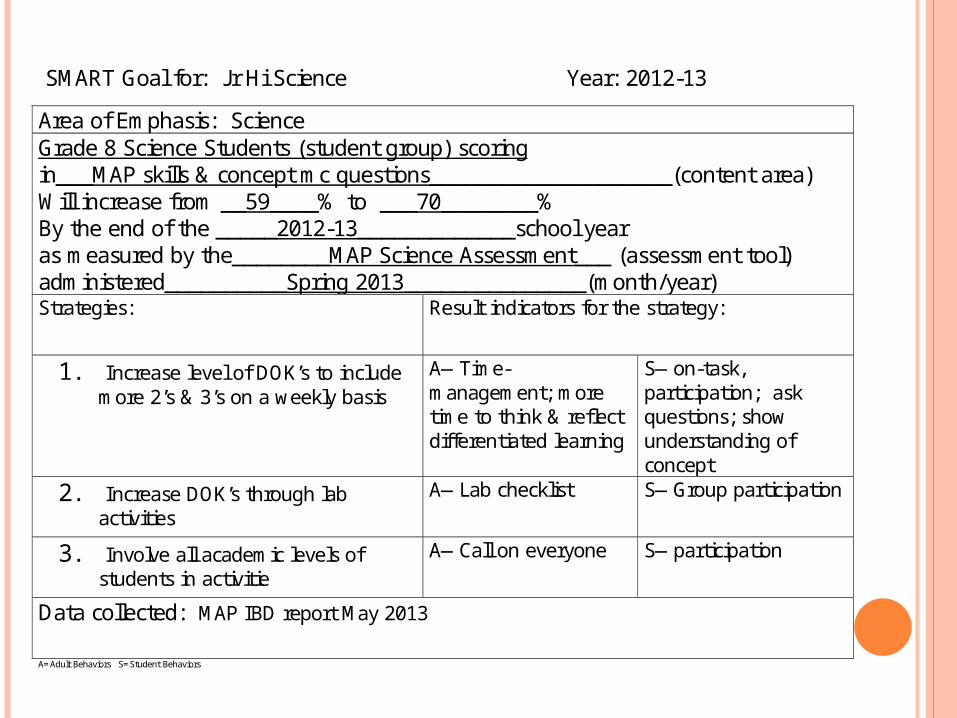
SMART Goal for: J r Hi Science Year: 2012-13
Area of Emphasis: Science Grade 8 Science Students (student group) scoring in___MAP skills & concept mc questions____________________(content area) Will increase from __59____% to ___70________% By the end of the _____2012-13_____________school year as measured by the________MAP Science Assessment___ (assessment tool) administered__________Spring 2013_______________(month/year) Strategies: Result indicators for the strategy:
1. Increase level of DOK’s to include more 2’s & 3’s on a weekly basis
A—Time-management; more time to think & reflect differentiated learning
S—on-task, participation; ask questions; show understanding of concept
2. Increase DOK’s through lab activities
A—Lab checklist S—Group participation
3. Involve all academic levels of students in activitie
A—Call on everyone S—participation
Data collected: MAP IBD report May 2013
A=Adult Behaviors S=Student Behaviors
NON CORE ASKED…
What do we do during PLC early release?
How do we help improve test scores—MAP, EOC, ACT?
What role do we have in changing the school culture?
WHAT MAKES NON CORE HARD CORE?
Increase the rigor in their classes Set high expectations Identify course ELOs Know the results of the CCSS/MAP/EOC tests Identify CCSS (GLE/CLE) that can be reinforced
in their classroom Accountability—both students and teachers Require a research project Increase informational text reading and writing
NON CORE BUT HARD CORE
Set Goals for their classes Non Core classes allow students to see the
relevance/connections of what they are learning
Have a teacher on the PLC Leadership Team Every Class Needs to be Important!
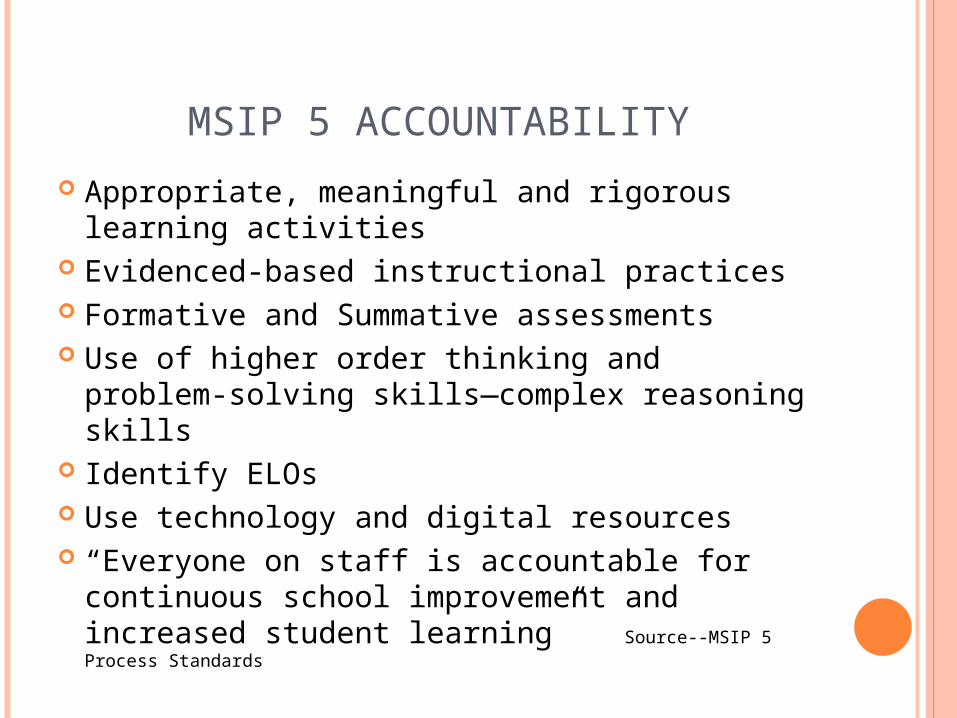
MSIP 5 ACCOUNTABILITY
Appropriate, meaningful and rigorous learning activities
Evidenced-based instructional practices Formative and Summative assessments Use of higher order thinking and problem-
solving skills—complex reasoning skills Identify ELOs Use technology and digital resources “Everyone on staff is accountable for
continuous school improvement and increased student learning”Source--MSIP 5 Process Standards
NON CORE BUT HARD CORE SUBJECTS
Sample Lessons from Business Ag FACS PE Art
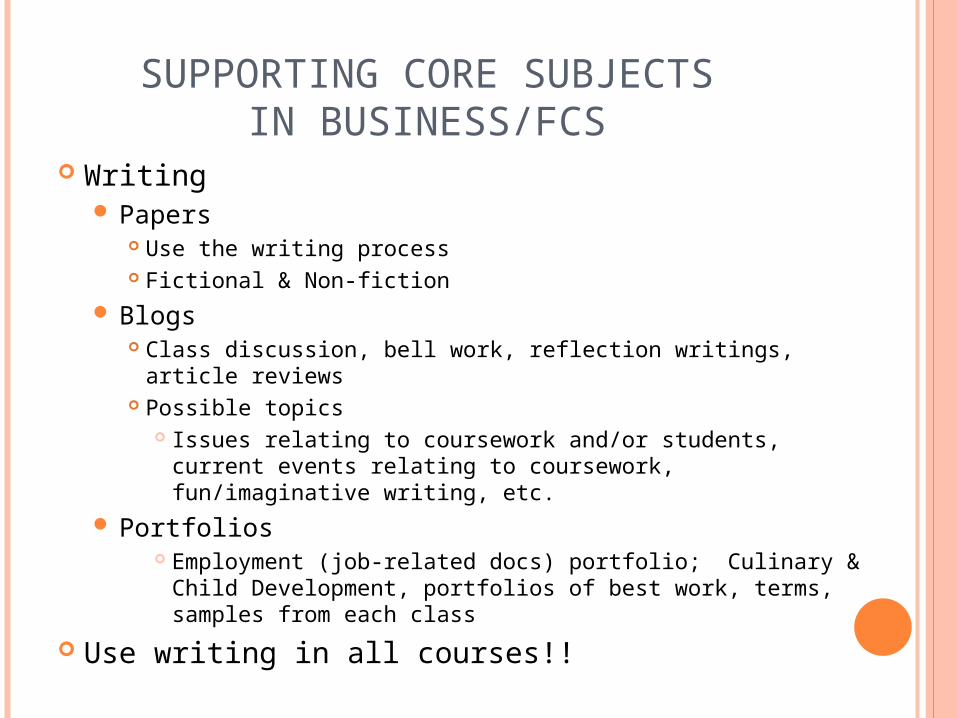
SUPPORTING CORE SUBJECTS IN BUSINESS/FCS
Writing Papers
Use the writing process Fictional & Non-fiction
Blogs Class discussion, bell work, reflection writings, article reviews Possible topics
Issues relating to coursework and/or students, current events relating to coursework, fun/imaginative writing, etc.
Portfolios Employment (job-related docs) portfolio; Culinary & Child
Development, portfolios of best work, terms, samples from each class
Use writing in all courses!!
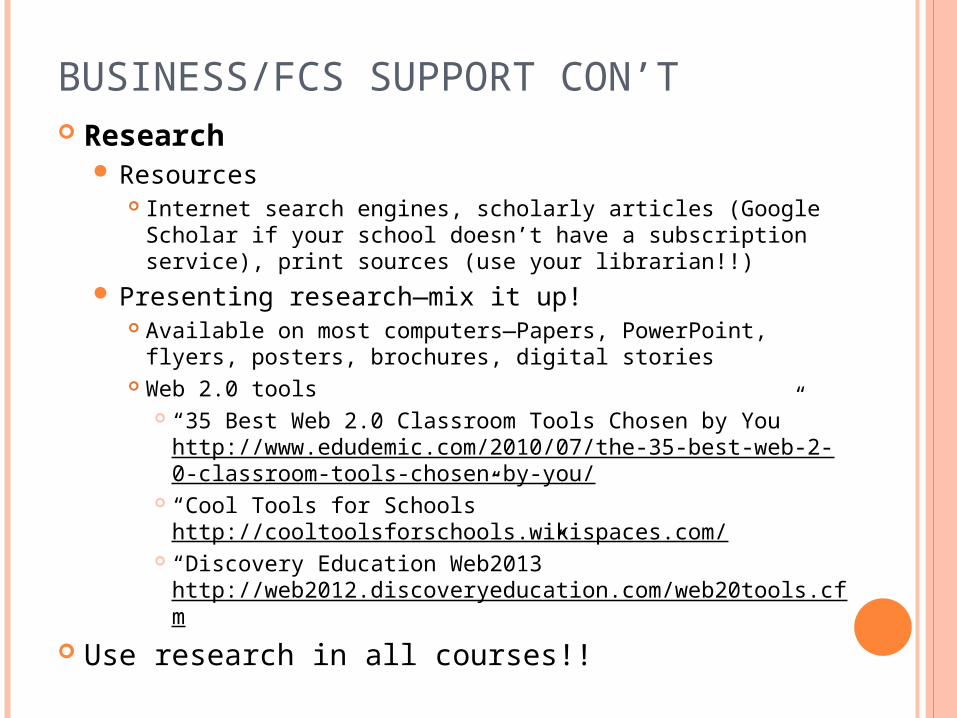
BUSINESS/FCS SUPPORT CON’T Research
Resources Internet search engines, scholarly articles (Google Scholar if
your school doesn’t have a subscription service), print sources (use your librarian!!)
Presenting research—mix it up! Available on most computers—Papers, PowerPoint, flyers,
posters, brochures, digital stories Web 2.0 tools
“35 Best Web 2.0 Classroom Tools Chosen by You” http://www.edudemic.com/2010/07/the-35-best-web-2-0-classroom-tools-chosen-by-you/
“Cool Tools for Schools” http://cooltoolsforschools.wikispaces.com/
“Discovery Education Web2013” http://web2012.discoveryeducation.com/web20tools.cfm
Use research in all courses!!
BUSINESS/FCS SUPPORT CON’T
Reading for Informational Text Demonstrate correct use of course-related
terminology Analyze what is being read
Technology USE IT!!! …as much as you can! Variety—there are tons of tech tools for every
subject area!! Computers, tablets (apps), ect. Web 2.0 (see previous slide)
BUSINESS/FCS SUPPORT CON’T
Math Can integrate in almost every subject area
Editing images Creating page layouts/designs
Margins, font sizes, shapes Manipulating images
Reading the rulers in MS Office/InDesign/Photoshop Analyze relationships of 2D & 3D images Create tables/charts to track data (pre & post-tests,
timed writings, timelines, etc.) Culinary subjects—basic operations, measurements,
proportions, cost/serving, budget Personal Finance—budgets, interest, fees, etc. Entrepreneurship—calculate costs, profits, pricing
AG SUPPORT OF MATH Measurements
Ag Construction, Ag Structures, Exploratory Ag: tape measures
Ag Power: calipers Ag Science II: fertilizer application, seeding rates
Fractions, Decimals and Percents Animal Science, Ag Science I: Pearson Squares Greenhouse: fertilizer and chemical application
ID Pictures Ag Structures, Ag Construction: working drawings
Slope Ag Structures: rafters
AG SUPPORT OF MATH CON’T Conversions
Ag Construction, Ag Structures: measurements (inches to feet)
Greenhouse: pots, fertilizer and chemical application Division
Ag Construction, Ag Structures, Exploratory Ag, Greenhouse: projects
2D/3D Ag Science II: grasslands Ag Power: fluid capacities Greenhouse: pots Ag Structures, Ag Construction: projects
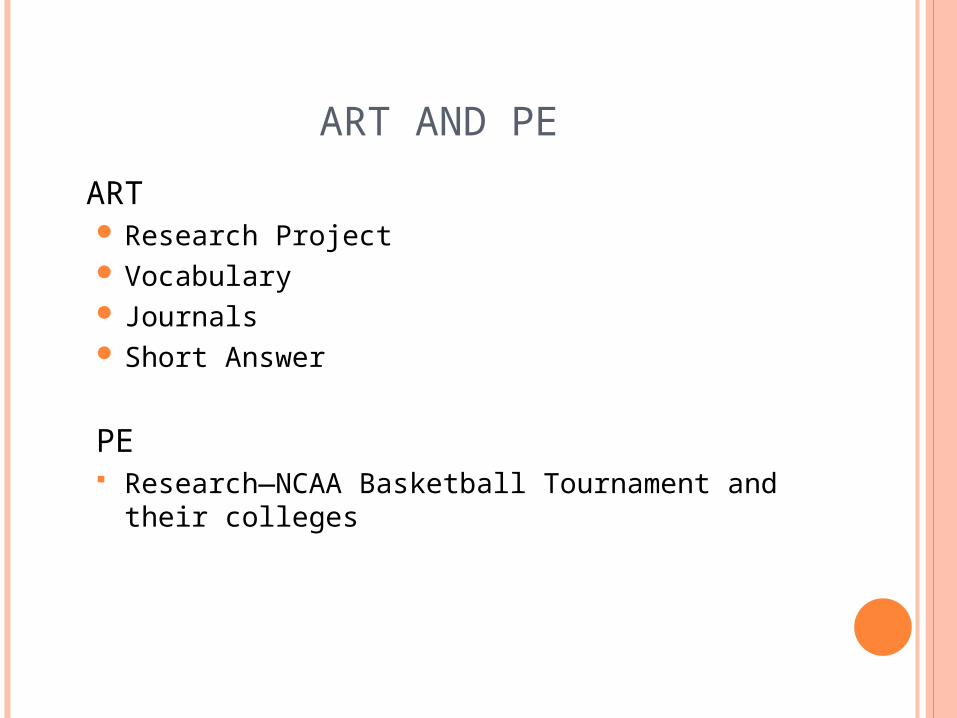
ART AND PE
ART Research Project Vocabulary Journals Short Answer
PE Research—NCAA Basketball Tournament and
their colleges
ADMINISTRATOR’S SUPPORT OF
HARD CORE
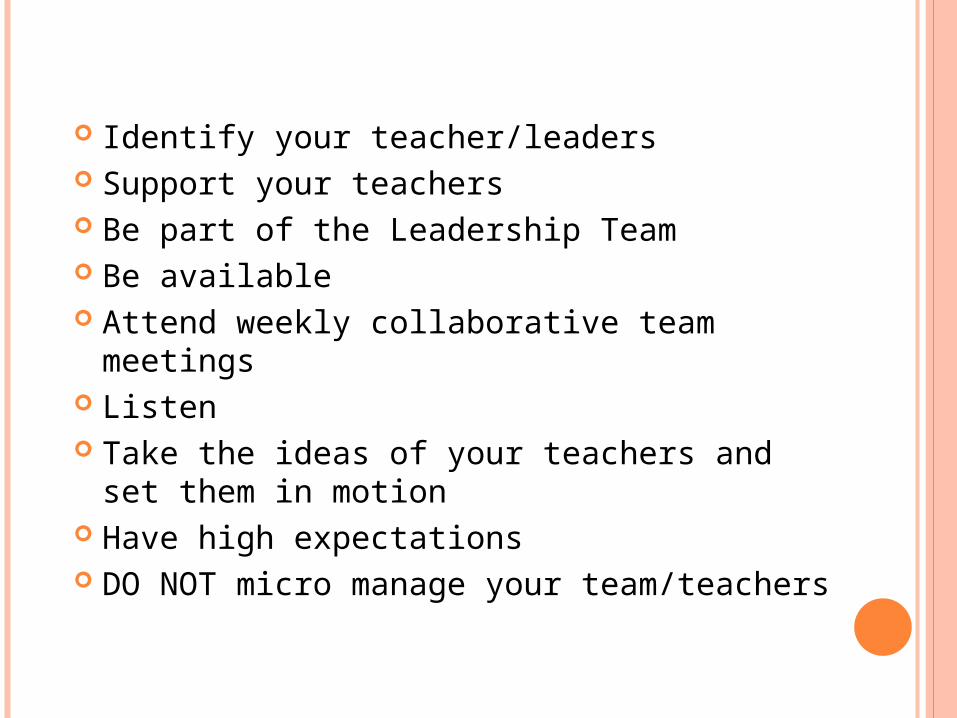
Identify your teacher/leaders Support your teachers Be part of the Leadership Team Be available Attend weekly collaborative team meetings Listen Take the ideas of your teachers and set them
in motion Have high expectations DO NOT micro manage your team/teachers
COUNSELOR’S SUPPORT OF HARD CORE
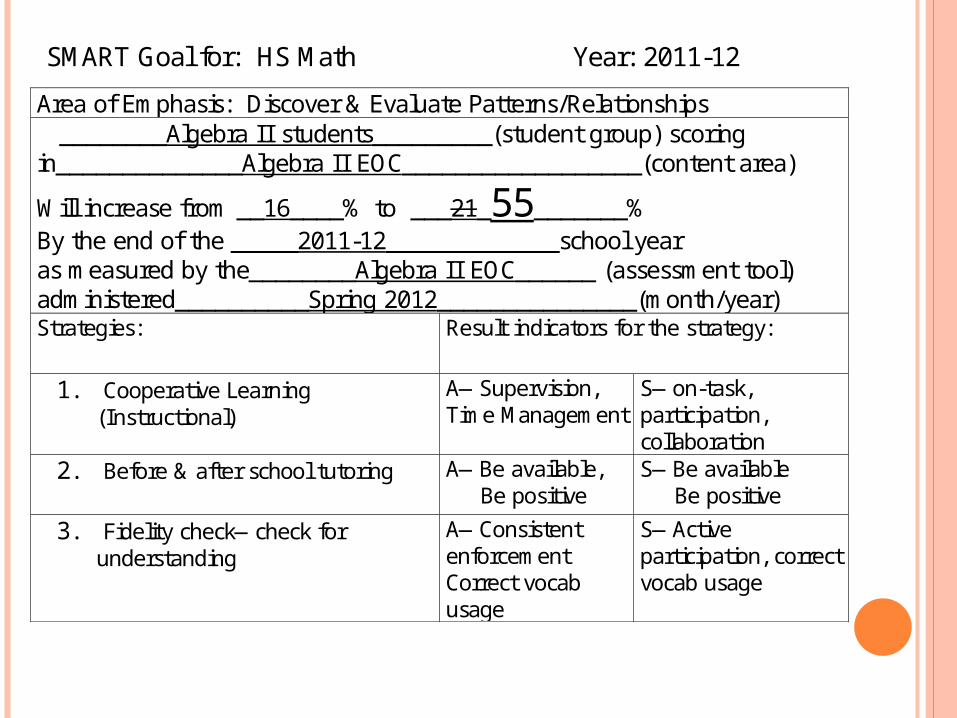
SMART Goal for: HS Math Year: 2011-12
Area of Emphasis: Discover & Evaluate Patterns/Relationships ________Algebra II students_________(student group) scoring in______________Algebra II EOC__________________(content area)
Will increase from __16____% to ___21_55_______% By the end of the _____2011-12_____________school year as measured by the________Algebra II EOC______ (assessment tool) administered__________Spring 2012_______________(month/year) Strategies: Result indicators for the strategy:
1. Cooperative Learning (Instructional)
A—Supervision, Time Management
S—on-task, participation, collaboration
2. Before & after school tutoring A—Be available, Be positive
S—Be available Be positive
3. Fidelity check—check for understanding
A—Consistent enforcement Correct vocab usage
S—Active participation, correct vocab usage
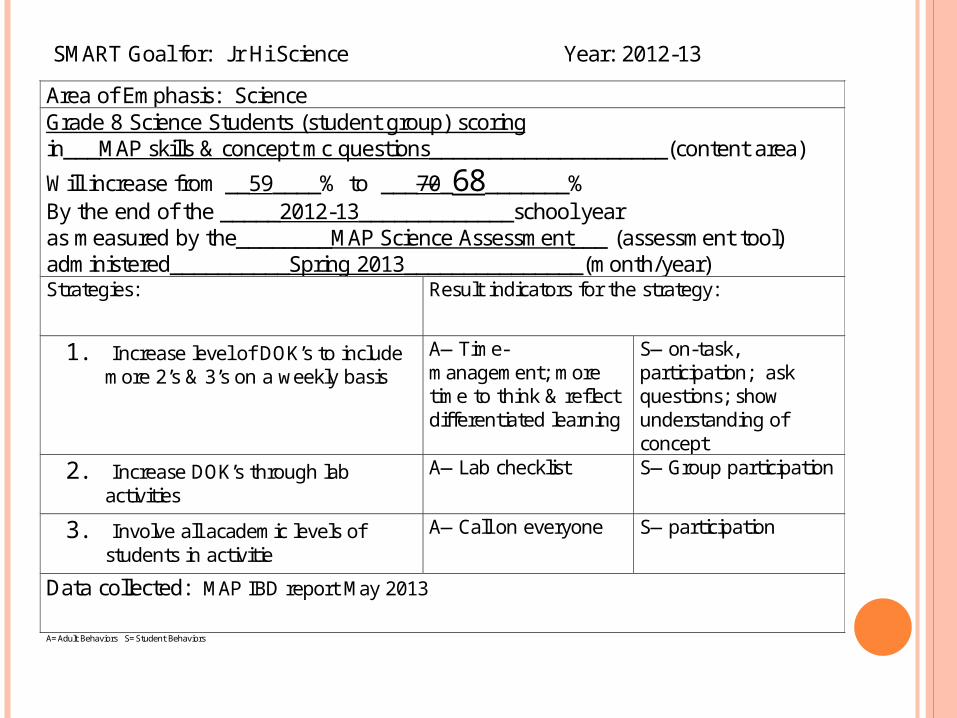
SMART Goal for: J r Hi Science Year: 2012-13
Area of Emphasis: Science Grade 8 Science Students (student group) scoring in___MAP skills & concept mc questions____________________(content area)
Will increase from __59____% to ___70_68_______% By the end of the _____2012-13_____________school year as measured by the________MAP Science Assessment___ (assessment tool) administered__________Spring 2013_______________(month/year) Strategies: Result indicators for the strategy:
1. Increase level of DOK’s to include more 2’s & 3’s on a weekly basis
A—Time-management; more time to think & reflect differentiated learning
S—on-task, participation; ask questions; show understanding of concept
2. Increase DOK’s through lab activities
A—Lab checklist S—Group participation
3. Involve all academic levels of students in activitie
A—Call on everyone S—participation
Data collected: MAP IBD report May 2013
A=Adult Behaviors S=Student Behaviors
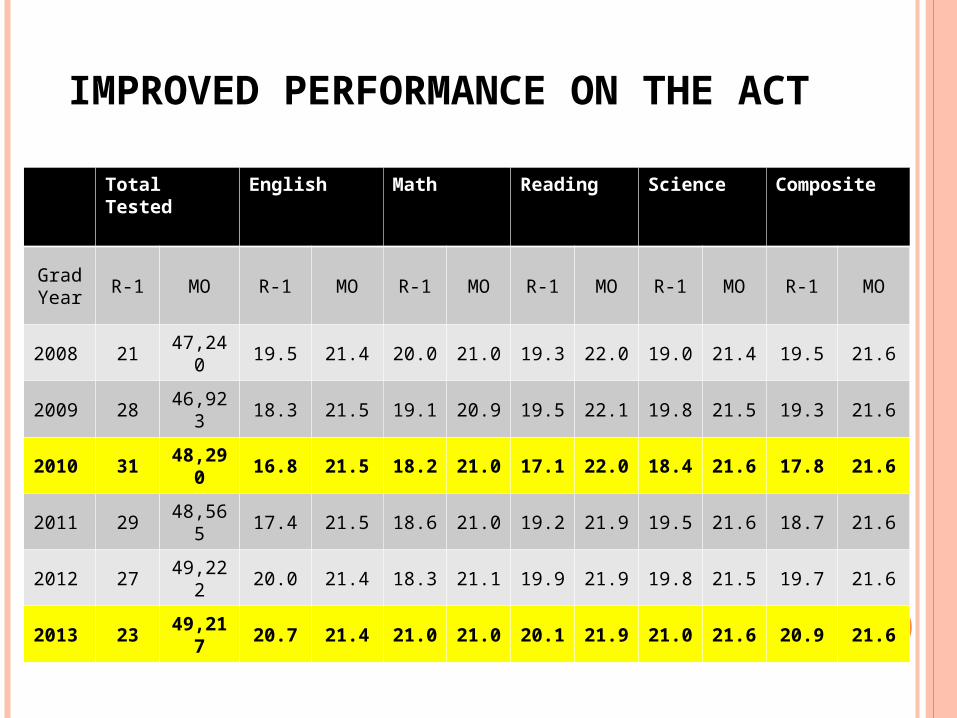
IMPROVED PERFORMANCE ON THE ACT
Total Tested
English Math Reading Science Composite
Grad Year
R-1 MO R-1 MO R-1 MO R-1 MO R-1 MO R-1 MO
2008 2147,24
019.5 21.4 20.0 21.0 19.3 22.0 19.0 21.4 19.5 21.6
2009 2846,92
318.3 21.5 19.1 20.9 19.5 22.1 19.8 21.5 19.3 21.6
2010 3148,29
016.8 21.5
18.2
21.0
17.1
22.0
18.4
21.6
17.8 21.6
2011 2948,56
517.4 21.5 18.6 21.0 19.2 21.9 19.5 21.6 18.7 21.6
2012 2749,22
220.0 21.4 18.3 21.1 19.9 21.9 19.8 21.5 19.7 21.6
2013 2349,21
720.7 21.4
21.0
21.0
20.1
21.9
21.0
21.6
20.9 21.6
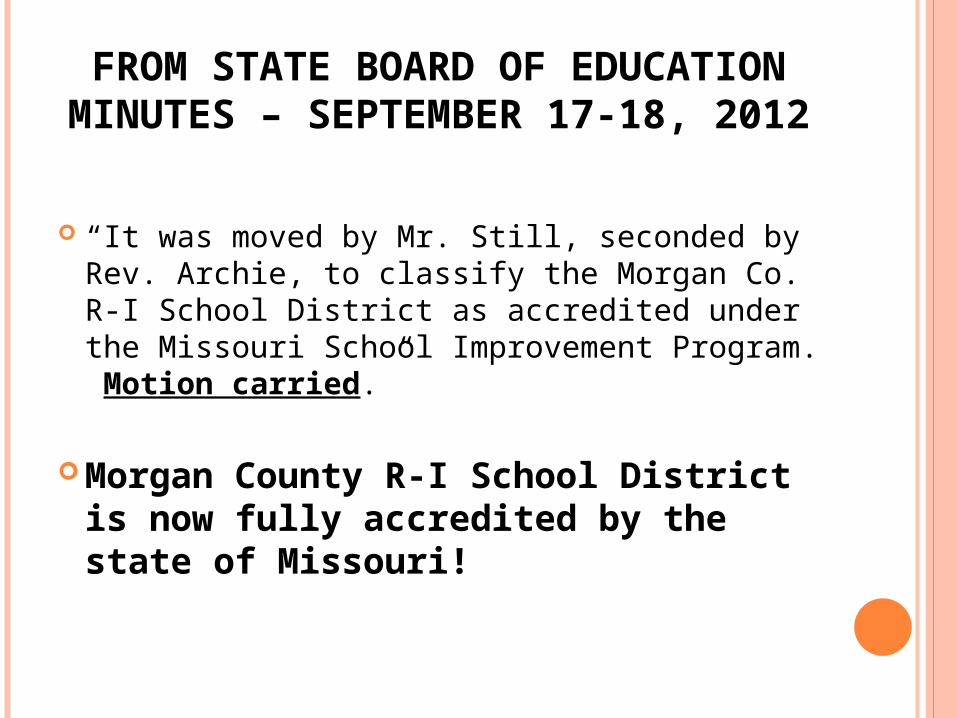
FROM STATE BOARD OF EDUCATION MINUTES –
SEPTEMBER 17-18, 2012
“It was moved by Mr. Still, seconded by Rev. Archie, to classify the Morgan Co. R-I School District as accredited under the Missouri School Improvement Program. Motion carried.”
Morgan County R-I School District is now fully accredited by the state of Missouri!
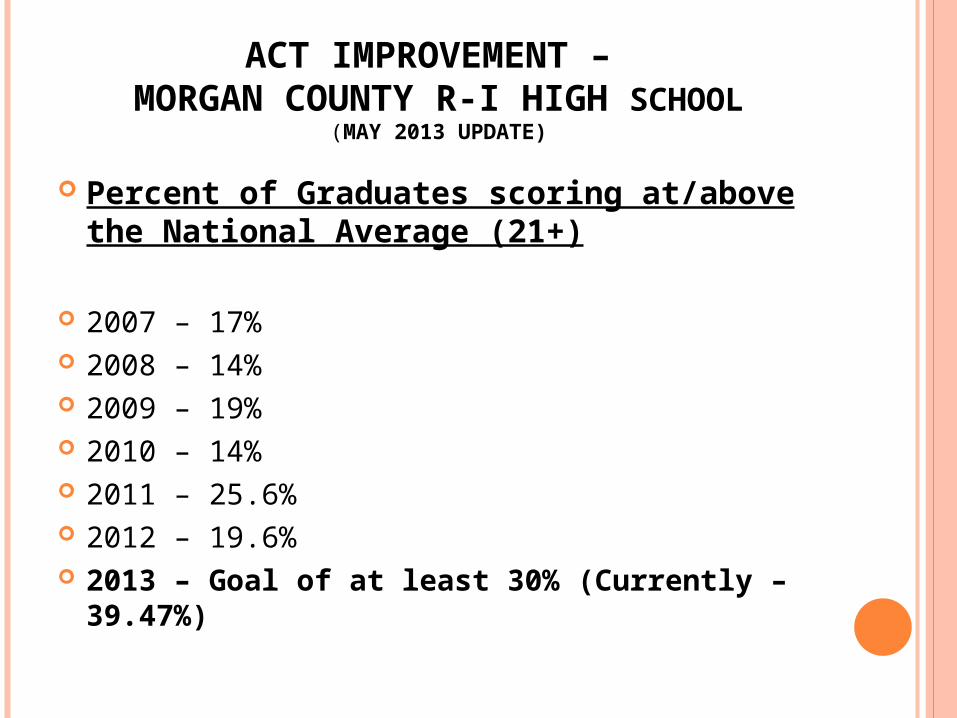
ACT IMPROVEMENT – MORGAN COUNTY R-I HIGH SCHOOL
(MAY 2013 UPDATE)
Percent of Graduates scoring at/above the National Average (21+)
2007 – 17% 2008 – 14% 2009 – 19% 2010 – 14% 2011 – 25.6% 2012 – 19.6% 2013 – Goal of at least 30% (Currently –
39.47%)
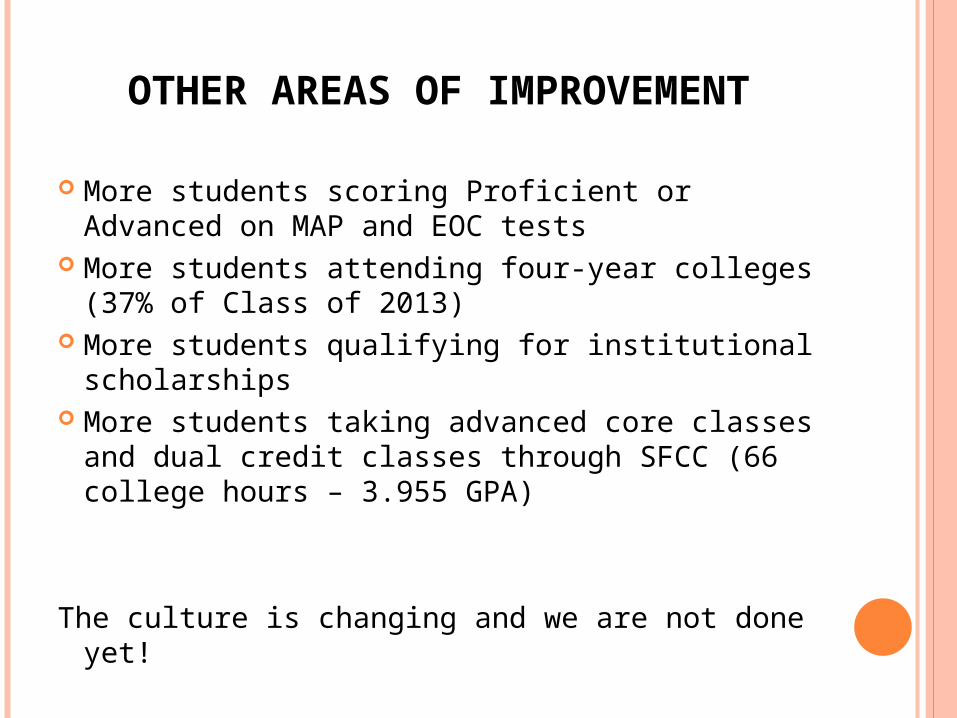
OTHER AREAS OF IMPROVEMENT
More students scoring Proficient or Advanced on MAP and EOC tests
More students attending four-year colleges (37% of Class of 2013)
More students qualifying for institutional scholarships
More students taking advanced core classes and dual credit classes through SFCC (66 college hours – 3.955 GPA)
The culture is changing and we are not done yet!
CONTACT INFORMATION