Embed Size (px)
Citation preview
C
Nb7JM
ABttgutOvfoeDtraS5fRi7c0wHept
JrDvSamC
BtE
A
©
RESEARCH
urrent Research
-Nitroso Compounds: Assessing Agreementetween Food Frequency Questionnaires and-Day Food Records
ANICE E. STUFF, PhD, RD; EUGENIA T. GOH, MS, RD; STEPHANIE L. BARRERA, MS, RD; MELISSA L. BONDY, PhD;
ICHELE R. FORMAN, PhDCugpaJ
TmbDrccf
wNecswcm
pswglHs
MSTdcpCISta
BSTRACTackground N-nitroso compounds are recognized as impor-ant dietary carcinogens. Accurate assessment of N-ni-roso intake is fundamental to advancing research re-arding its role with cancer. Previous studies have notsed a quantitative database to estimate the intake ofhese compounds in a US population.bjective To address this gap, a database of N-nitrosoalues was developed in conjunction with an existing foodrequency questionnaire (FFQ). In this article we reportn the relative validity of the FFQ instrument modified tostimate intake of N-nitroso compounds.esign Intake estimates of 23 N-nitroso compounds fromhe FFQ were compared with those from 7-day foodecords in a cross-sectional study conducted from Janu-ry 2005 through June 2006.ubjects A sample of 98 healthy adult subjects (aged0.42�12.84 years) completed an FFQ and then recordedoods and beverages consumed on 7-day food records.esults Crude and energy-adjusted N-nitroso compoundsntakes were significantly higher in the FFQ than the-day food records (P�0.001). Spearman correlations forrude and energy-adjusted N-nitroso intakes ranged from.004 to 0.48. By tertiles of N-nitiroso compounds, thereas moderate agreement (��0.30) for five compounds.igher estimates of N-nitroso compounds by FFQ was
xplained by a greater proportion of subjects who re-orted eating foods high in N-nitroso compounds on FFQhan reported on 7-day food records.
. E. Stuff is an assistant professor and E. T. Goh is aesearch coordinator, Baylor College of Medicine, USepartment of Agriculture/Agricultural Research Ser-ice Children’s Nutrition Research Center, Houston, TX.. L. Barrera is a research dietitian, and M. L. Bondynd M. R. Forman are professors, Department of Epide-iology, University of Texas M.D. Anderson Cancerenter, Houston.Address correspondence to: Janice E. Stuff, PhD, RD,aylor College of Medicine, USDA/ARS Children’s Nu-
rition Research Center, 1100 Bates, Houston, TX 77030.-mail: [email protected] accepted: December 30, 2008.Copyright © 2009 by the American Dietetic
ssociation.0002-8223/09/10907-0005$36.00/0
vdoi: 10.1016/j.jada.2009.04.006
2009 by the American Dietetic Association
onclusion The modified FFQ with N-nitroso values is aseful tool for assessing N-nitroso intakes relative to aroup, and captures all food items with N-nitroso com-ounds, including those foods with high concentrationsnd eaten sporadically.Am Diet Assoc. 2009;109:1179-1183.
he potential role of dietary intake of N-nitroso com-pounds and their precursors in the development ofcancer is of growing interest (1-3). The risk for hu-
an cancer posed by N-nitroso compounds is supportedy animal experiments (1,2), and mechanisms describingNA damage (4). Epidemiologic studies evaluating the
ole of N-nitroso compounds have shown a positive asso-iation with stomach and upper gastrointestinal tractancers (5-8) and brain cancer (3,9-13), whereas othersound no association (14-17).
The formation of these compounds in foods (3) occurshen oxides of nitrogen react with amino groups, yielding-nitrosamines or N-nitrosamides. Foods with the high-
st concentrations of N-nitroso compounds are thoseured with nitrate and/or nitrite (cured meat), pickled,tored under humid conditions, smoked in air saturatedith nitrogen, or dried at high temperatures (eg, protein-
ontaining foods such as beer ingredients, nonfat dryilk, cooked bacon, or dried meats) (18,19).Lack of compiled data on N-nitroso compounds in foods
revented past epidemiologic studies to accurately mea-ure intakes of N-nitroso compounds because exposureas surrogate or incomplete measures. To address thisap, a database of N-nitroso compounds was created andinked to an existing food frequency questionnaire (FFQ).ere, we report on the relative validity of the FFQ in-
trument modified to estimate N-nitroso compounds.
ETHODStudy Populationhe research was a cross-sectional study design, con-ucted January 2005 to June 2006. Subjects were re-ruited from a database of healthy controls who had com-leted data collection in studies at M.D. Anderson Cancerenter, Houston, TX, and from the community using
nstitutional Review Board-approved announcements.ubjects did not have a previous diagnosis of any cancerype and were frequently matched to the cancer cases forge (�5 years), sex, and ethnicity. Subjects were inter-
iewed in person and completed an FFQ, and then wereJournal of the AMERICAN DIETETIC ASSOCIATION 1179
i7ptPc
SSmaratcsC
fpwnemNs7
FFHcqaac(ClNvfua
fdiamfpss
DAdomt
tScidtWN7c7la7ficm
pcttNps�c
F
1
nvited to participate in our study requiring completion of-day food records. All subjects gave consent to partici-ate in the study, which was approved by the Institu-ional Review Board of the Human Subjects Protectionrogram at The University of Texas, M.D. Anderson Can-er Center, and Baylor College of Medicine.
even-Day Food Recordseven-day food records were chosen as the referenceethod. The study nutritionists gave subjects both verbal
nd written instructions for completing a 7-day foodecord, including detailed information on reporting themounts consumed and providing detailed food descrip-ions. Foods reported on the 7-day food records wereoded and analyzed using Nutrition Data System for Re-earch software (version 2005, Nutrition Coordinatingenter, University of Minnesota, Minneapolis).The assignment of values for N-nitroso compounds to
oods in the 7-day food records followed standards ofractice on food composition data sources (20-22)hereby research database foods (and corresponding N-itroso values of �g/100 g) are matched to line items ofach food listed in the food record. Concentration wasultiplied by grams of food consumed and yielded the-nitroso intake for each food, N-nitroso values were
ummed from all food sources per day, and a mean for thedays was computed for each subject.
FQFQs, a modified version of the National Cancer Institute’sealth Habits and History Questionnaire (23), were used to
ollect dietary data. The questionnaire includes a semi-uantitative food frequency list made up of food and bever-ge items, ethnic foods commonly consumed in the Houstonrea, and an open-ended section. Nutrient intake was cal-ulated using the DIETSYS�Plus dietary analysis programversion 5.9, 1999, Block Dietary Data Systems, Berkeley,A). The DIETSYS�Plus database was updated using re-
ease 16-1 of the US Department of Agriculture Nationalutrient Database for Standard Reference (24). Nutrientalues were estimated as needed from appropriate recipesound in the Continuing Survey of Food Intakes by Individ-als, 1994-1996, 1998 for multi-ingredient dishes not avail-ble in release 16-1 (25).The assignment of values for N-nitroso compounds to
oods in the FFQ was completed (20-22) whereby researchatabase foods are matched to line items of each food listedn the FFQ. The 205 food items in the modified FFQ weressigned N-nitroso values by matching foods using a directatch or imputation method (21). For both FFQ and 7-day
ood record, the output variables were 23 N-nitroso com-ounds, gram intake for selected food groups of N-nitrosoources, and macronutrients provided by nutrient analysisoftware.
ata and Statistical Proceduressample size of 100 allowed a power of 0.9 to detect
esirable differences between methods. This sample sizef 100 also conformed to the range (100 to 200) recom-ended by Willett and Lenhart (26) needed for a valida-
ion study for dietary questionnaires. t
180 July 2009 Volume 109 Number 7
Statistical analyses were conducted using SAS statis-ical software, (version 9.1, 2003, Statistical Analysisystems, Cary, NC). Means and standard deviations werealculated for demographic variables and macronutrientntakes. N-nitroso compound intakes are reported as me-ians (25th and 75th percentiles). Energy-adjusted in-akes were computed using the residual method (27). The
ilcoxon sign rank test was used to determine whether-nitroso intakes (crude or energy-adjusted) of FFQ and-day food record were significantly different. The jointlassification (%) of the participants in each tertile for-day food record vs FFQ for each compound was calcu-ated. Specifically, how many participants in the lowestnd highest tertiles of N-nitroso compound intake by-day food records (as the reference method) were classi-ed in the same tertiles by FFQ. A weighted � was cal-ulated which accounts for agreements and disagree-ents (28).Willett (27) argued that standard summary statistics
revent detection whether a dietary questionnaire dis-riminates among persons because of omissions or addi-ions of foods or differences in portion size. Accordingly,he proportion of subjects who reported eating the high-nitroso food source (yes/no) by each method was com-uted, and agreement of subjects reporting intake of foodources on both methods was tested using the McNemar2 test statistic for paired data. All statistically signifi-ant differences were based on a P�0.05. All tests were
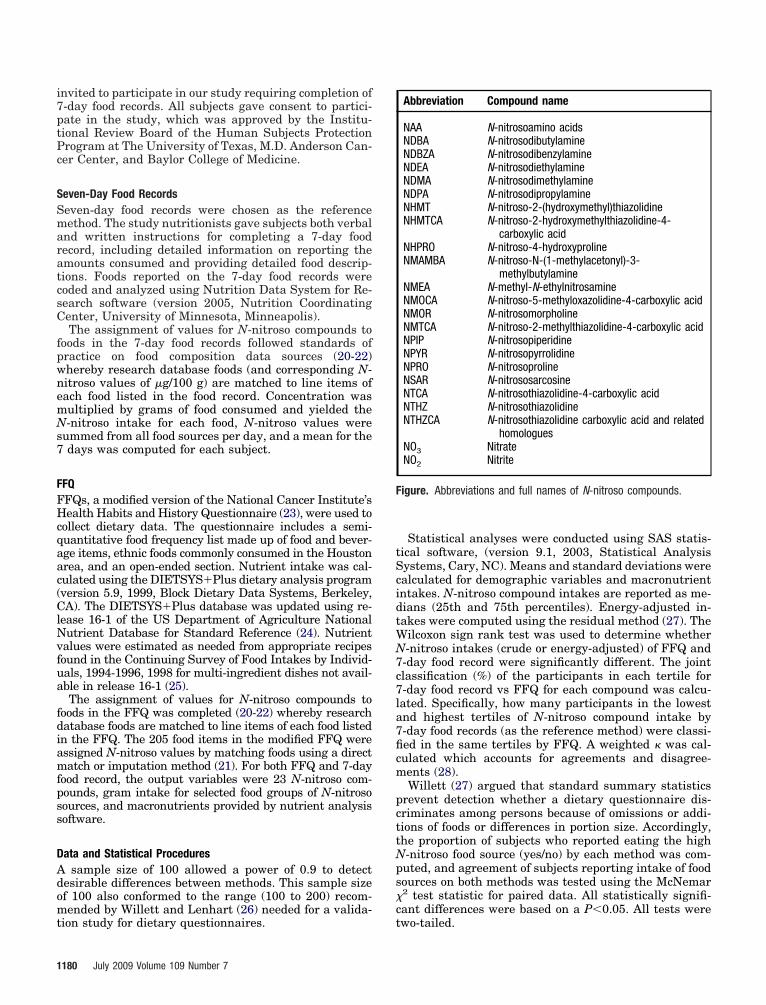
Abbreviation Compound name
NAA N-nitrosoamino acidsNDBA N-nitrosodibutylamineNDBZA N-nitrosodibenzylamineNDEA N-nitrosodiethylamineNDMA N-nitrosodimethylamineNDPA N-nitrosodipropylamineNHMT N-nitroso-2-(hydroxymethyl)thiazolidineNHMTCA N-nitroso-2-hydroxymethylthiazolidine-4-
carboxylic acidNHPRO N-nitroso-4-hydroxyprolineNMAMBA N-nitroso-N-(1-methylacetonyl)-3-
methylbutylamineNMEA N-methyl-N-ethylnitrosamineNMOCA N-nitroso-5-methyloxazolidine-4-carboxylic acidNMOR N-nitrosomorpholineNMTCA N-nitroso-2-methylthiazolidine-4-carboxylic acidNPIP N-nitrosopiperidineNPYR N-nitrosopyrrolidineNPRO N-nitrosoprolineNSAR N-nitrososarcosineNTCA N-nitrosothiazolidine-4-carboxylic acidNTHZ N-nitrosothiazolidineNTHZCA N-nitrosothiazolidine carboxylic acid and related
homologuesNO3 NitrateNO2 Nitrite
igure. Abbreviations and full names of N-nitroso compounds.
wo-tailed.
RSm2(mai9nt
i7NfcWctc
�m
aswdtbriNaalbgeab
d freq
ESULTS AND DISCUSSIONubjects (N�98) who participated in the study had aean age 50.42�12.84 years, mean body mass index
6.51�5.94, and a majority (73%) were white and women61%). Based on 7-day food records, subjects reportedean intakes of 1,727.25�512.97 kcal, 68.67�24.37 g fat,
nd 73.02�25.17 g protein, and based on FFQ meanntakes of 2,370.53�1,369.20 kcal, 91.96�54.93 g fat, and6.53�53.35 g protein. The Figure lists full chemicalames and corresponding abbreviations for each N-ni-roso compound.
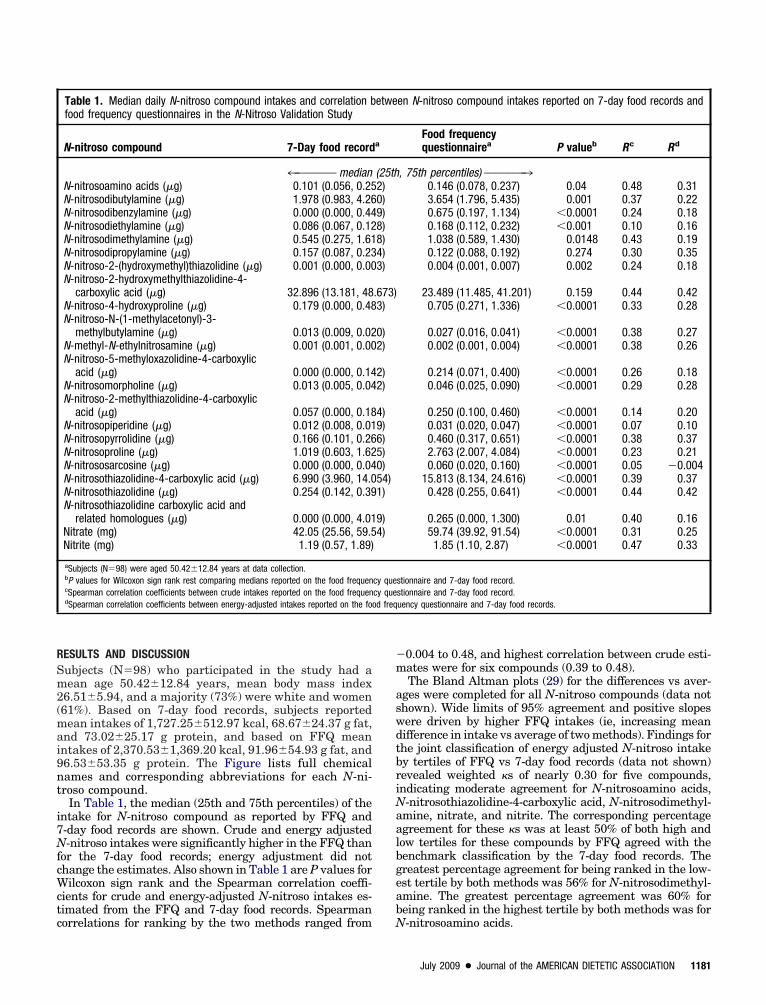
In Table 1, the median (25th and 75th percentiles) of thentake for N-nitroso compound as reported by FFQ and-day food records are shown. Crude and energy adjusted-nitroso intakes were significantly higher in the FFQ than
or the 7-day food records; energy adjustment did nothange the estimates. Also shown in Table 1 are P values forilcoxon sign rank and the Spearman correlation coeffi-
ients for crude and energy-adjusted N-nitroso intakes es-imated from the FFQ and 7-day food records. Spearman
Table 1. Median daily N-nitroso compound intakes and correlation bfood frequency questionnaires in the N-Nitroso Validation Study
N-nitroso compound 7-Day food record
4™™™™™™™ medianN-nitrosoamino acids (�g) 0.101 (0.056, 0.25N-nitrosodibutylamine (�g) 1.978 (0.983, 4.26N-nitrosodibenzylamine (�g) 0.000 (0.000, 0.44N-nitrosodiethylamine (�g) 0.086 (0.067, 0.12N-nitrosodimethylamine (�g) 0.545 (0.275, 1.61N-nitrosodipropylamine (�g) 0.157 (0.087, 0.23N-nitroso-2-(hydroxymethyl)thiazolidine (�g) 0.001 (0.000, 0.00N-nitroso-2-hydroxymethylthiazolidine-4-
carboxylic acid (�g) 32.896 (13.181, 48N-nitroso-4-hydroxyproline (�g) 0.179 (0.000, 0.48N-nitroso-N-(1-methylacetonyl)-3-
methylbutylamine (�g) 0.013 (0.009, 0.02N-methyl-N-ethylnitrosamine (�g) 0.001 (0.001, 0.00N-nitroso-5-methyloxazolidine-4-carboxylic
acid (�g) 0.000 (0.000, 0.14N-nitrosomorpholine (�g) 0.013 (0.005, 0.04N-nitroso-2-methylthiazolidine-4-carboxylic
acid (�g) 0.057 (0.000, 0.18N-nitrosopiperidine (�g) 0.012 (0.008, 0.01N-nitrosopyrrolidine (�g) 0.166 (0.101, 0.26N-nitrosoproline (�g) 1.019 (0.603, 1.62N-nitrososarcosine (�g) 0.000 (0.000, 0.04N-nitrosothiazolidine-4-carboxylic acid (�g) 6.990 (3.960, 14.0N-nitrosothiazolidine (�g) 0.254 (0.142, 0.39N-nitrosothiazolidine carboxylic acid and
related homologues (�g) 0.000 (0.000, 4.01Nitrate (mg) 42.05 (25.56, 59.5Nitrite (mg) 1.19 (0.57, 1.89)
aSubjects (N�98) were aged 50.42�12.84 years at data collection.bP values for Wilcoxon sign rank rest comparing medians reported on the food frequencSpearman correlation coefficients between crude intakes reported on the food frequendSpearman correlation coefficients between energy-adjusted intakes reported on the foo
orrelations for ranking by the two methods ranged from N
0.004 to 0.48, and highest correlation between crude esti-ates were for six compounds (0.39 to 0.48).The Bland Altman plots (29) for the differences vs aver-
ges were completed for all N-nitroso compounds (data nothown). Wide limits of 95% agreement and positive slopesere driven by higher FFQ intakes (ie, increasing meanifference in intake vs average of two methods). Findings forhe joint classification of energy adjusted N-nitroso intakey tertiles of FFQ vs 7-day food records (data not shown)evealed weighted �s of nearly 0.30 for five compounds,ndicating moderate agreement for N-nitrosoamino acids,-nitrosothiazolidine-4-carboxylic acid, N-nitrosodimethyl-mine, nitrate, and nitrite. The corresponding percentagegreement for these �s was at least 50% of both high andow tertiles for these compounds by FFQ agreed with theenchmark classification by the 7-day food records. Thereatest percentage agreement for being ranked in the low-st tertile by both methods was 56% for N-nitrosodimethyl-mine. The greatest percentage agreement was 60% foreing ranked in the highest tertile by both methods was for
en N-nitroso compound intakes reported on 7-day food records and
Food frequencyquestionnairea P valueb Rc Rd
, 75th percentiles) ™™™™™™™30.146 (0.078, 0.237) 0.04 0.48 0.313.654 (1.796, 5.435) 0.001 0.37 0.220.675 (0.197, 1.134) �0.0001 0.24 0.180.168 (0.112, 0.232) �0.001 0.10 0.161.038 (0.589, 1.430) 0.0148 0.43 0.190.122 (0.088, 0.192) 0.274 0.30 0.350.004 (0.001, 0.007) 0.002 0.24 0.18
23.489 (11.485, 41.201) 0.159 0.44 0.420.705 (0.271, 1.336) �0.0001 0.33 0.28
0.027 (0.016, 0.041) �0.0001 0.38 0.270.002 (0.001, 0.004) �0.0001 0.38 0.26
0.214 (0.071, 0.400) �0.0001 0.26 0.180.046 (0.025, 0.090) �0.0001 0.29 0.28
0.250 (0.100, 0.460) �0.0001 0.14 0.200.031 (0.020, 0.047) �0.0001 0.07 0.100.460 (0.317, 0.651) �0.0001 0.38 0.372.763 (2.007, 4.084) �0.0001 0.23 0.210.060 (0.020, 0.160) �0.0001 0.05 �0.004
15.813 (8.134, 24.616) �0.0001 0.39 0.370.428 (0.255, 0.641) �0.0001 0.44 0.42
0.265 (0.000, 1.300) 0.01 0.40 0.1659.74 (39.92, 91.54) �0.0001 0.31 0.251.85 (1.10, 2.87) �0.0001 0.47 0.33
stionnaire and 7-day food record.stionnaire and 7-day food record.uency questionnaire and 7-day food records.
etwe
a
(25th2)0)9)8)8)4)3)
.673)3)
0)2)
2)2)
4)9)6)5)0)54)1)
9)4)
cy quecy que
-nitrosoamino acids.
July 2009 ● Journal of the AMERICAN DIETETIC ASSOCIATION 1181
NbtwffNmc3mr
mhN7aFvwd
fawiwew0aaahb(vf0
td
uedcgfFmNctmhcpaqwutancr
nntape
CQrcptgchtnfcotedvd
SNt
gClNBt
1
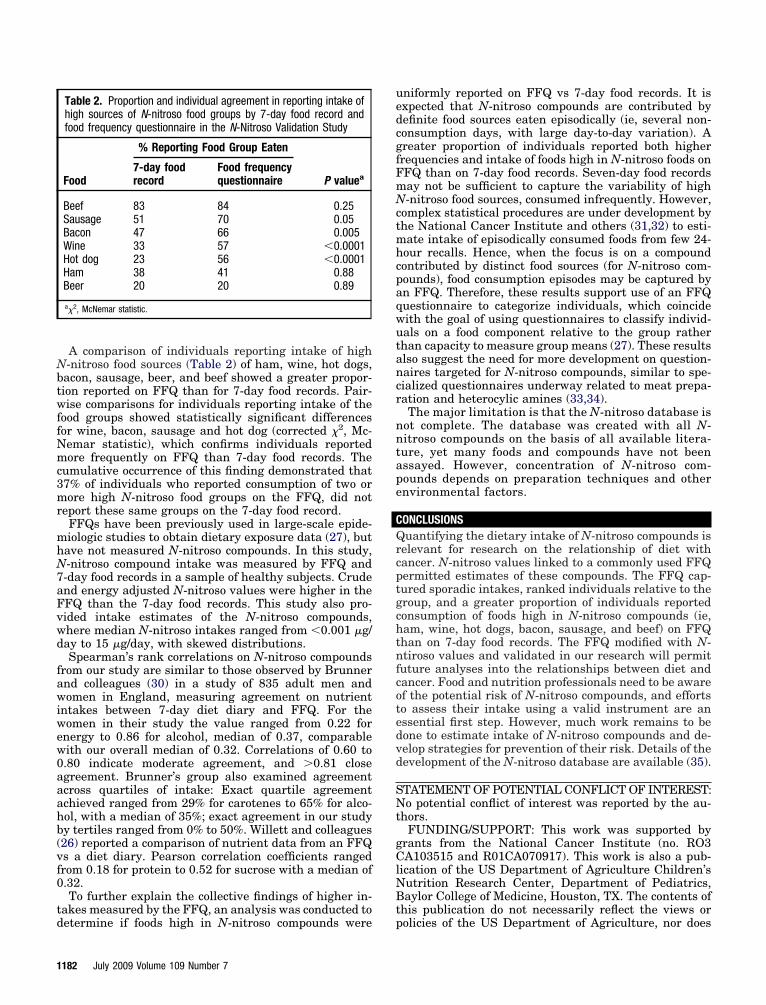
A comparison of individuals reporting intake of high-nitroso food sources (Table 2) of ham, wine, hot dogs,acon, sausage, beer, and beef showed a greater propor-ion reported on FFQ than for 7-day food records. Pair-ise comparisons for individuals reporting intake of the
ood groups showed statistically significant differencesor wine, bacon, sausage and hot dog (corrected �2, Mc-emar statistic), which confirms individuals reportedore frequently on FFQ than 7-day food records. The
umulative occurrence of this finding demonstrated that7% of individuals who reported consumption of two orore high N-nitroso food groups on the FFQ, did not
eport these same groups on the 7-day food record.FFQs have been previously used in large-scale epide-iologic studies to obtain dietary exposure data (27), but
ave not measured N-nitroso compounds. In this study,-nitroso compound intake was measured by FFQ and-day food records in a sample of healthy subjects. Crudend energy adjusted N-nitroso values were higher in theFQ than the 7-day food records. This study also pro-ided intake estimates of the N-nitroso compounds,here median N-nitroso intakes ranged from �0.001 �g/ay to 15 �g/day, with skewed distributions.Spearman’s rank correlations on N-nitroso compounds
rom our study are similar to those observed by Brunnernd colleagues (30) in a study of 835 adult men andomen in England, measuring agreement on nutrient
ntakes between 7-day diet diary and FFQ. For theomen in their study the value ranged from 0.22 fornergy to 0.86 for alcohol, median of 0.37, comparableith our overall median of 0.32. Correlations of 0.60 to.80 indicate moderate agreement, and �0.81 closegreement. Brunner’s group also examined agreementcross quartiles of intake: Exact quartile agreementchieved ranged from 29% for carotenes to 65% for alco-ol, with a median of 35%; exact agreement in our studyy tertiles ranged from 0% to 50%. Willett and colleagues26) reported a comparison of nutrient data from an FFQs a diet diary. Pearson correlation coefficients rangedrom 0.18 for protein to 0.52 for sucrose with a median of.32.To further explain the collective findings of higher in-
akes measured by the FFQ, an analysis was conducted to
Table 2. Proportion and individual agreement in reporting intake ofhigh sources of N-nitroso food groups by 7-day food record andfood frequency questionnaire in the N-Nitroso Validation Study
Food
% Reporting Food Group Eaten
P valuea7-day foodrecord
Food frequencyquestionnaire
Beef 83 84 0.25Sausage 51 70 0.05Bacon 47 66 0.005Wine 33 57 �0.0001Hot dog 23 56 �0.0001Ham 38 41 0.88Beer 20 20 0.89
a�2, McNemar statistic.
etermine if foods high in N-nitroso compounds were p
182 July 2009 Volume 109 Number 7
niformly reported on FFQ vs 7-day food records. It isxpected that N-nitroso compounds are contributed byefinite food sources eaten episodically (ie, several non-onsumption days, with large day-to-day variation). Areater proportion of individuals reported both higherrequencies and intake of foods high in N-nitroso foods onFQ than on 7-day food records. Seven-day food recordsay not be sufficient to capture the variability of high-nitroso food sources, consumed infrequently. However,
omplex statistical procedures are under development byhe National Cancer Institute and others (31,32) to esti-ate intake of episodically consumed foods from few 24-
our recalls. Hence, when the focus is on a compoundontributed by distinct food sources (for N-nitroso com-ounds), food consumption episodes may be captured byn FFQ. Therefore, these results support use of an FFQuestionnaire to categorize individuals, which coincideith the goal of using questionnaires to classify individ-als on a food component relative to the group ratherhan capacity to measure group means (27). These resultslso suggest the need for more development on question-aires targeted for N-nitroso compounds, similar to spe-ialized questionnaires underway related to meat prepa-ation and heterocylic amines (33,34).The major limitation is that the N-nitroso database is
ot complete. The database was created with all N-itroso compounds on the basis of all available litera-ure, yet many foods and compounds have not beenssayed. However, concentration of N-nitroso com-ounds depends on preparation techniques and othernvironmental factors.
ONCLUSIONSuantifying the dietary intake of N-nitroso compounds is
elevant for research on the relationship of diet withancer. N-nitroso values linked to a commonly used FFQermitted estimates of these compounds. The FFQ cap-ured sporadic intakes, ranked individuals relative to theroup, and a greater proportion of individuals reportedonsumption of foods high in N-nitroso compounds (ie,am, wine, hot dogs, bacon, sausage, and beef) on FFQhan on 7-day food records. The FFQ modified with N-tiroso values and validated in our research will permituture analyses into the relationships between diet andancer. Food and nutrition professionals need to be awaref the potential risk of N-nitroso compounds, and effortso assess their intake using a valid instrument are anssential first step. However, much work remains to beone to estimate intake of N-nitroso compounds and de-elop strategies for prevention of their risk. Details of theevelopment of the N-nitroso database are available (35).
TATEMENT OF POTENTIAL CONFLICT OF INTEREST:o potential conflict of interest was reported by the au-
hors.FUNDING/SUPPORT: This work was supported by
rants from the National Cancer Institute (no. RO3A103515 and R01CA070917). This work is also a pub-
ication of the US Department of Agriculture Children’sutrition Research Center, Department of Pediatrics,aylor College of Medicine, Houston, TX. The contents of
his publication do not necessarily reflect the views or
olicies of the US Department of Agriculture, nor does
mz
PSP
R
1
1
1
1
1
1
1
1
1
1
2
2
2
2
2
2
2
2
2
2
3
3
3
3
3
3
ention of trade names, commercial products, or organi-ations imply endorsement from the US government.ACKNOWLEDGEMENTS: The authors thank Patricia
illow for consultation and database development, Kallichentel and Ladia Hernandez for nutrition analysis, andhyllis Adatto and Karen Benedict for subject recruitment.
eferences1. Forman D. Dietary exposure to N-nitroso compounds and the risk of
human cancer. Cancer Surv. 1987;6:719-738.2. Lijinsky W. N-nitroso compounds in the diet. Mutat Res. 1999;443:
129-138.3. Dietrich M, Block G, Pogoda JM, Buffler P, Hecht S, Preston-Martin
S. A review: Dietary and endogenously formed N-nitroso compoundsand risk of childhood brain tumors. Cancer Causes Control. 2005;16:619-635.
4. Silber JR, Blank A, Bobola MS, Mueller BA, Kolstoe DD, OjemannGA, Berger MS. Lack of the DNA repair protein O6-methylguanine-DNA methyltransferase in histologically normal brain adjacent toprimary human brain tumors. Proc Natl Acad Sci U S A. 1996;93:6941-6946.
5. Pobel D, Riboli E, Cornee J, Hemon B, Guyader M. Nitrosamine,nitrate and nitrite in relation to gastric cancer: A case-control study inMarseille, France. Eur J Epidemiol. 1995;11:67-73.
6. Ning JP, Yu MC, Wang QS, Henderson BE. Consumption of saltedfish and other risk factors for nasopharyngeal carcinoma (NPC) inTianjin, a low-risk region for NPC in the People’s Republic of China.J Natl Cancer Inst. 1990;82:291-296.
7. La Vecchia C, D’Avanzo B, Airoldi L, Braga C, Decarli A. Nitrosamineintake and gastric cancer risk. Eur J Cancer Prev. 1995;4:469-474.
8. Gao YT, McLaughlin JK, Gridley G, Blot WJ, Ji BT, Dai Q, FraumeniJF Jr. Risk factors for esophageal cancer in Shanghai, China. II. Roleof diet and nutrients. Int J Cancer. 1994;58:197-202.
9. Hu J, La Vecchia C, Negri E, Chatenoud L, Bosetti C, Jia X, Liu R,Huang G, Bi D, Wang C. Diet and brain cancer in adults: A case-control study in northeast China. Int J Cancer. 1999;81:20-23.
0. Preston-Martin S, Paganini-Hill A, Henderson BE, Pike MC, Wood C.Case-control study of intracranial meningiomas in women in LosAngeles County, California. J Natl Cancer Inst. 1980;65:67-73.
1. Preston-Martin S, Yu MC, Benton B, Henderson BE. N-nitroso com-pounds and childhood brain tumors: A case-control study. Cancer Res.1982;42:5240-5245.
2. Preston-Martin S, Henderson BE. N-nitroso compounds and humanintracranial tumours. IARC Sci Publ. 1984;887-894.
3. Preston-Martin S, Pogoda JM, Mueller BA, Holly EA, Lijinsky W,Davis RL. Maternal consumption of cured meats and vitamins inrelation to pediatric brain tumors. Cancer Epidemiol BiomarkersPrev. 1996;5:599-605.
4. Bunin GR, Gallagher PR, Rorke-Adams LB, Robison LL, Cnaan A.Maternal supplement, micronutrient, and cured meat intake duringpregnancy and risk of medulloblastoma during childhood: A Chil-dren’s Oncology Group Study. Cancer Epidemiol Biomarkers Prev.2006;15:1660-1667.
5. Chen H, Ward MH, Tucker KL, Graubard BI, McComb RD, Potis-chman NA, Weisenburger DD, Heineman EF. Diet and risk of adultglioma in eastern Nebraska, United States. Cancer Causes Control.2002;13:647-655.
6. Hu J, Nyren O, Wolk A, Bergstrom R, Yuen J, Adami HO, Guo L, Li
H, Huang G, Xu X. Risk factors for oesophageal cancer in northeastChina. Int J Cancer. 1994;57:38-46.7. Li JY, Ershow AG, Chen ZJ, Wacholder S, Li GY, Guo W, Li B, BlotWJ. A case-control study of cancer of the esophagus and gastric cardiain Linxian. Int J Cancer. 1989;43:755-761.
8. Scanlan RA. Formation and occurrence of nitrosamines in food. Can-cer Res. 1983;43(suppl 5):2435s-2440s.
9. Tricker AR, Preussmann R. Carcinogenic N-nitrosamines in the diet:Occurrence, formation, mechanisms and carcinogenic potential. Mu-tat Res. 1991; 259:277-289.
0. Pennington JAT. Applications of food composition data: Data sourcesand considerations for use. J Food Comp Anal. 2008;21(suppl 1):S3-S12.
1. Blitz CL, Murphy SP, Au DL. Adding lignan values to a food compo-sition database. J Food Comp Anal. 2007;20:99-105.
2. Pillow PC, Duphorne CM, Chang S, Contois JH, Strom SS, Spitz MR,Hursting SD. Development of a database for assessing dietary phy-toestrogen intake. Nutr Cancer. 1999;33:3-19.
3. Risk Factor Monitoring and Methods Branch, Division of CancerControl and Prevention Sciences, and National Cancer Institute.Health Habits and History Questionnaire. National Cancer InstituteWeb site. http://appliedresearch.cancer.gov/DietSys/uguide.html. Ac-cessed September 2, 2008.
4. USDA National Nutrient Database for Standard Reference, Release16-1. US Department of Agriculture, Agricultural Research ServiceWeb site. http://www.nal.usda.gov/fnic/foodcomp/Data/SR16-1/sr16-1.html. Accessed September 3, 2008.
5. Continuing Survey of Food Intakes by Individuals 1994-1996, 1998[CD-ROM]. Washington, DC: US Department of Agriculture; Agricul-tural Research Service; 1998.
6. Willett W, Lenart E. Reproduciblity and validity of food-frequencyquestionnaires. In: Willet W, ed. Nutritional Epidemiology. NewYork, NY: Oxford University Press; 1998:101-147.
7. Willett W. Nutritional Epidemiology. Second ed. New York, NY: Ox-ford University Press, 1998.
8. Fleiss JL. Statistical Methods for Rates and Proportions. 2nd ed. NewYork, NY: Wiley; 1981.
9. Bland JM, Altman DG. Statistical methods for assessing agreementbetween two methods of clinical measurement. Lancet. 1986;1:307-310.
0. Brunner E, Stallone D, Juneja M, Bingham S, Marmot M. Dietaryassessment in Whitehall II: Comparison of 7 d diet diary and food-frequency questionnaire and validity against biomarkers. Br J Nutr.2001;86:405-414.
1. Dodd KW, Guenther PM, Freedman LS, Subar AF, Kipnis V,Midthune D, Tooze JA, Krebs-Smith SM. Statistical methods forestimating usual intake of nutrients and foods: A review of the theory.J Am Diet Assoc. 2006;106:1640-1650.
2. Tooze JA, Midthune D, Dodd KW, Freedman LS, Krebs-Smith SM,Subar AF, Guenther PM, Carroll RJ, Kipnis V. A new statisticalmethod for estimating the usual intake of episodically consumed foodswith application to their distribution. J Am Diet Assoc. 2006;106:1575-1587.
3. Sinha R, Cross A, Curtin J, Zimmerman T, McNutt S, Risch A, HoldenJ. Development of a food frequency questionnaire module and data-bases for compounds in cooked and processed meats. Mol Nutr FoodRes. 2005;49:648-655.
4. Sinha R, Peters U, Cross AJ, Kulldorff M, Weissfeld JL, Pinsky PF,Rothman N, Hayes RB. Meat, meat cooking methods and preserva-tion, and risk for colorectal adenoma. Cancer Res. 2005;65:8034-8041.
5. Stuff J, Goh ET, Barrera SL, Bondy ML, Forman MR. Construction of
an N-nitroso database for assessing dietary intake. J Food CompAnal. 2009 (in press).July 2009 ● Journal of the AMERICAN DIETETIC ASSOCIATION 1183


![N-Nitroso-bis(2-acetoxypropyl)amine as a Further Pancreatic … · [CANCERRESEARCH36, 2877-2884,August1976] SUMMARY N-Nitroso-bis(2-acetoxypropyl)amine , a possible f3 me tabolite](https://img.pdfslide.us/doc/110x75/60cc9fbec22aeb481e38fedc/n-nitroso-bis2-acetoxypropylamine-as-a-further-pancreatic-cancerresearch36-2877-2884august1976.jpg)