Embed Size (px)
Citation preview

n n n n Elevate your retirement.The Elevator Constructors Annuity and 401(k) Retirement Plan may be the best way to work toward your personal retirement goals. But saving for retirement can be both challenging and complicated, depending on your financial situation. This guide can help make complicated choices about retirement and saving for it, simple. Take control of your retirement now by turning your dreams into plans.

2
The Elevator Constructors Annuity and 401(k) Retirement Plan offers tax advantages, a variety of investment choices, and other features to make saving for retirement simple.
• The payroll deduction feature makes contributions easy and convenient.• Flexible investment choices allow you to choose how much to contribute and where to
invest your contributions.•Automatic rebalancing helps to keep your portfolio in line with your investment goals
through periodic rebalancing. Periodic rebalancing of your account helps ensure your investments stay aligned over time with the selected strategy you originally selected. For your convenience, you can initiate or discontinue this service at any time. Auto rebalancing is not recommended when using an asset allocation investment option.

3
Achieving a successful retirement.
The main goal of the plan is to help you build toward a comfortable income during retirement. This guide provides important information on how to use features of the plan and make them work best for you. Be sure to read it carefully, and feel free to contact us if you have any questions.
1 Online: www.massmutual.com/iuec
2 Phone:
1-800-743-5274 Dedicated customer service representatives available Monday - Friday, 8 a.m. to 8 p.m. ET or automated phone line 24/7.
3 Rollover Specialists:
1-888-526-6905 Get help rolling in accounts from a prior retirement account, Monday – Friday, 8 a.m. to 6 p.m. ET. You are encouraged to compare the benefits and features of the different plans before consolidating your accounts. Things to consider include each plan's available investment options, guarantees, fees and expenses.

4
Enrolling in the plan is easy.•Complete the 401(k) Contribution Enrollment, Investment Election and Beneficiary
Designation forms found in this book. Complete the information required; sign and date the form. Follow the return instructions on the bottom of the form.
•Once your enrollment form is processed through your employer, MassMutual will send you a confirmation report. You should keep this for your records.
•After you’ve received your confirmation, you can access your account and take advantage of all of our online tools at www.massmutual.com/iuec. Create your Username, Password and PIN. You will use the PIN on our voice response system.
Choosing investments that are right for you.Following the simple steps outlined in this guide may help you become more confident with your investment decisions.
If you don’t make a choice, your plan will invest your contributions in an asset allocation option on your behalf. This option is selected based on your date of birth and a projected retirement age of 65. (You may want to consider a different option if this is not your intended retirement age.) Offering professional management and monitoring as well as diversification all in one investment, it becomes more conservative as your retirement date approaches. You can change this option any time you wish.
Generally target retirement date (lifecycle) investment options are designed to be held beyond the presumed retirement date to offer a continuing investment option for the investor in retirement. The year in the investment option name refers to the approximate year an investor in the option would plan to retire and likely would stop making new contributions to the investment option. However, investors may choose a date other than their presumed retirement date to be more conservative or aggressive depending on their own risk tolerance.
Target retirement date (lifecycle) investment options are designed for participants who plan to withdraw the value of their accounts gradually after retirement. Each of these options follows its own asset allocation path (“glide path”) to progressively reduce its equity exposure and become more conservative over time. Options may not reach their most conservative allocation until after their target date. Others may reach their most conservative allocation in their target date year. Investors should consider their own personal risk tolerance, circumstances and financial situation. These options should not be selected solely on a single factor such as age or retirement date. Please consult the prospectus (if applicable) pertaining to the options to determine if their glide path is consistent with your long-term financial plan. Target retirement date investment options’ stated asset allocation may be subject to change.
Investments in these options are not guaranteed and you may experience losses, including losses near, at, or after the target date. Additionally, there is no guarantee that the options will provide adequate income at and through retirement.
5
Understanding asset allocation.
Determining your asset allocation is an important first step in choosing investment options in your workplace retirement plan. Asset allocation is how you divide your savings among different investment types such as stocks, bonds, and short-term investments. Here we highlight four basic steps in developing your asset allocation strategy.
Step 1 – Understand the asset classes. Consider that your choices generally focus on three things: stocks, bonds and short-term investments. These three types of investments are known as the basic “asset classes”:
• Stocks, also called equities, are shares of ownership in a company.
• Bonds, also called fixed income investments, are loans made to governments or corporations.
• Short-term investments, also known as cash equivalents, are designed to maintain their dollar value. Examples include money market funds, certificates of deposit and Treasury bills.
Although the investment menu in your workplace plan may have many options, most will fall into these basic groups, or a combination of them. Please note that asset allocation doesn’t ensure a profit or protect against loss in a declining market, but it may be a sound strategy.
Why it’s important.Each asset class has different characteristics you should be aware of. Historically speaking, stocks have posed greater investment risk than the other asset classes, but have offered the potential for the highest return. Short-term
investments have offered lower returns in exchange for low investment risk. Bonds have tended to fall somewhere in the middle.
Step 2 – Know your tolerance for risk. How much risk you are comfortable with is an important consideration in choosing your asset allocation strategy. How do you feel about investment risk – the chance that your investments could lose money? You also need to think about inflation risk – the risk that conservative investments such as short-term investments may not keep pace with inflation.
Investing in more than one asset class – or a blend of them – may help to balance your risk. Mixing the various investment types can provide a balance of growth with preservation, because the markets for each investment don’t always move in the same direction as each other.1
Step 3 – Establish your time horizon. Your tolerance for risk must be considered in the context of your time horizon. Do you have quite a bit of time until you retire or are you getting closer? In the short term, the most volatile investments, such as stocks, can rise and fall dramatically. Past performance is not indicative of future performance.
If you need your money within the next few years, you might want to avoid putting a large percentage into a single asset class that could dip in value in the short term. On the other hand, assuming you have six years or more before you will need your money, you may consider investing a percentage of your savings in investments that offer greater potential for return. That’s because you have

6
more time to potentially ride out short-term fluctuations in the value of your investments.
Step 4 – Determine your asset allocation strategy. The participant website offers tools and resources to help. To determine which strategy may be right for you, check out the Risk Quiz. Log into your account » My Account » Investment Selection » Risk Quiz.
Revisit your strategy once a year and after major life events to ensure it is still in line with your current needs and outlook. You may want to consider adjusting the proportions of stocks, bonds and short-term investments as you get closer to retirement. Remember, everyone’s situation will differ, and you should consult a financial advisor about your own particular situation.
Learn more.The right asset allocation strategy can help you maintain your confidence through market ups and downs. You can learn more about asset allocation at www.massmutual.com/iuec. If you have questions, call 1-800-743-5274.
1 http://www.sec.gov/investor/pubs/assetallocation.htmPast performance is no guarantee of future results. The information contained herein is not intended or written as specific legal or tax advice and may not be relied on for purposes of avoiding any federal tax penalties. Neither MassMutual nor any of its employees or representatives are authorized to give legal or tax advice. You must rely on the advice of your own independent tax counsel.

7
Your plan's investment options.
The portfolios below are built out of the investment options available in your plan*:
INVESTMENT PORTFOLIOS
ASSET CATEGORY INVESTMENT NAME Short Term Conservative Moderate Aggressive
Ultra Aggressive
Stable Value Fixed Income Fund 95% 21% 6% 2%Intermediate Term Bond Prm Cr Bnd Fd (Barings) 5% 49% 34% 14%Asset Allocation/Lifestyle
Oppenheimer Global Alloc Fund
Asset Allocation/Lifestyle
Vanguard Balanced Index Fund
Asset Allocation/Lifecycle
T. Rowe Price Retirmnt 2010 Fd
Asset Allocation/Lifecycle
T. Rowe Price Retirmnt 2020 Fd
Asset Allocation/Lifecycle
T. Rowe Price Retirmnt 2030 Fd
Asset Allocation/Lifecycle
T. Rowe Price Retirmnt 2040 Fd
Asset Allocation/Lifecycle
T. Rowe Price Retirmnt 2050 Fd
Large Cap ValueSel Dvrsfd Val Fd (Brdywn/TRP) 4% 7% 10% 12%
Large Cap Core Vanguard 500 Index Fund 10% 18% 26% 34%Large Cap Growth Sel Gr Opps Fd (Sands/JSP) 4% 8% 10% 12%
Mid Cap ValueSelect Am Cent Mid Cap Val Fd 1% 4% 5% 4%
Mid Cap GrowthSel Md Cp Gr Fd (TRP/Frontier) 1% 4% 5% 5%
Small Cap ValueSl SmCoVl Fd(Fed Cl/TRP/INVSC) 2% 4% 5% 6%
Small Cap GrowthJanus Henderson Venture Fd 3% 4% 6% 7%
Intl/Global Large Growth
AmerFunds EuroPacific Gr Fund 5% 11% 17% 20%
Intl/Global Small/Mid Cap
Oppenheimer Global Op-port Fund

8
*Investment allocation strategies are a convenient way of allocating your account among certain of the plan’s individual investment options. Any investment allocation strategies included in these materials are not intended to be investment advice or recommendations to you and may or may not be appropriate for your circumstances. In applying investment allocation strategies to your individual circumstances, you should consider your other assets, income and investments as well as your risk tolerance. If you direct your contributions or current account balance to an investment allocation strategy, your contributions or account balance will be invested in each of the individual investment alternatives in the percentages indicated for the strategy. The plan may offer other investment options not included in the strategies and the individual investment alternatives included in the strategies may also be available on a stand-alone basis. The CustomChoice Strategies chart lists asset classes, along with their weightings in the allocation strategy.
RISK DISCLOSURES FOR CERTAIN ASSET CATEGORIES – PLEASE NOTE THAT YOUR PLAN MAY NOT OFFER ALL OF THE INVESTMENT TYPES DISCUSSED BELOW.
Please consider an investment option’s objectives, risks, fees and expenses carefully before investing. This and other information about the investment option can be found in the applicable prospectuses or summary prospectuses, if any, or fact sheets for the investment options listed, which are available from your plan sponsor, the participant website at www.retiresmart.com or by contacting our Participant Information Center at 1-800-743-5274 between 8:00 a.m. and 8:00 p.m. ET, Monday through Friday. Please read them carefully before investing.
If a retirement plan fully or partially terminates its investment in the Guaranteed Interest Account (GIA), Super Flex (SF) Guaranteed, Fixed Interest Account or Separate Account Guaranteed Interest Contract (SAGIC) investment options, the plan receives the liquidation value of its investment, which may either be more or less than the book value of its investment. As a result of this adjustment, a participant’s account balance may be either increased or decreased if the plan fully or partially terminates the contract with MassMutual.
Government/Retail Money Market Funds:
You could lose money by investing in the fund. Although the fund seeks to preserve the value of your investment at $1.00 per share, it cannot guarantee it will do so. The fund may impose a fee upon the sale of your shares or may temporarily suspend your ability to sell shares if the fund's liquidity falls below required minimums because of market conditions or other factors. An investment in the fund is not insured or guaranteed by the Federal Deposit Insurance Corporation or any other government agency. The fund’s sponsor has no legal obligation to provide financial support to the fund, and you should not expect that the sponsor will provide financial support to the fund at any time.
Money Market Floating NAV:
You could lose money by investing in the fund. Because the share price of the fund will fluctuate, when you sell your shares they may be worth more or less than what you originally paid for them. The fund may impose a fee upon the sale of your shares or may temporarily suspend your ability to sell shares if the fund’s liquidity falls below required minimums because of market conditions

9
or other factors. An investment in the fund is not insured or guaranteed by the Federal Deposit Insurance Corporation or any other government agency. The fund’s sponsor has no legal obligation to provide financial support to the fund, and you should not expect that the sponsor will provide financial support to the fund at any time.
Risks of investing in bond and debt securities investments include the risk that a bond issuer will default by failing to repay principal and interest in a timely manner (credit risk) and/or the risk that the value of these securities will decline when interest rates increase (interest rate risk).
Risks of investing in inflation-protected bond investments include credit risk and interest rate risk. Neither the bond investment nor its yield is guaranteed by the U.S. Government.
High yield bond investments are generally subject to greater market fluctuations and risk of loss of income and principal than lower yielding debt securities investments.
Investments in value stocks may remain undervalued for extended periods of time, and the market may not recognize the intrinsic value of these securities.
Investments that track a benchmark index are professionally managed investments. However, the benchmark index itself is unmanaged and does not incur fees or expenses and cannot be purchased directly for investment.
Investments in growth stocks may experience price volatility due to their sensitivity to market fluctuations and dependence on future earnings expectations.
Investments in companies with small or mid market capitalization (“small caps” or “mid caps”) may be subject to special risks given their characteristic narrow markets, limited financial resources, and less liquid stocks, all of which may cause price volatility.
International/global investing can involve special risks, such as political changes and currency fluctuations. These risks are heightened in emerging markets. Other trading restrictions may apply. Please see the investment’s prospectus for more details.
A significant percentage of the underlying investments in aggressive asset allocation portfolio options have a higher than average risk exposure. Investors should consider their risk tolerance carefully before choosing such a strategy.
An investment with multiple underlying investments (which may include MassMutual RetireSmart and any other offered proprietary or non-proprietary asset-allocation, lifestyle, lifecycle or custom blended investments) may be subject to the expenses of those underlying investments in addition to those of the investment itself.
Investments may reside in the specialty category due to 1) allowable investment flexibility that precludes classification in standard asset categories and/or 2) investment concentration in a limited group of securities or industry sectors. Investments in this category may be more volatile than less-flexible and/or less-concentrated investments and may be appropriate as only a minor component in an investor's overall portfolio.

10
Participants with a large ownership interest in a company or employer stock investment may have the potential to manipulate the value of units of this investment option through their trading practices. As a result, special transfer restrictions may apply. This type of investment option presents a higher degree of risk than diversified investment options under the plan because it invests in the securities of a single company.
Investments that invest more of their assets in a single issuer or industry sector (such as company stock or sector investments) involve additional risks, including unit price fluctuations, because of the increased concentration of investments.
A participant will be prohibited from transferring into most mutual funds and similar investments if they have transferred into and out of the same investment within the previous 60 days. Certain stable value, guaranteed interest, fixed income and other investments are not subject to this rule. This rule does not prohibit participants from transferring out of any investment at any time.
Excessive Trading Policy: MassMutual strongly discourages plan participants from engaging in excessive trading. The MassMutual Excessive Trading Policy helps protect the interests of long-term investors like you. If you would like to view the MassMutual Excessive Trading Policy, please visit MassMutual’s participant website at www.retiresmart.com. In addition, you cannot transfer into any investment options if you have already made a purchase followed by a sale (redemption) involving the same investment within the last sixty days.
Apple® and the Apple logo® are registered trademarks of Apple Inc., registered in the U.S. and other countries. App Store is a registered trademark of Apple Inc.
Android, Google PlayTM and the Google Play logoTM are trademarks of Google Inc.
MassMutual RetireSmartSM is a registered service mark of MassMutual.
SOCIAL SECURITY NUMBER FIRST NAME LAST NAME MI
STREET ADDRESS E-MAIL ADDRESS
CITY STATE ZIP
BIRTH DATE MARITAL STATUS
MARRIED SINGLE OR LEGALLY SEPARATED
BENEFICIARY
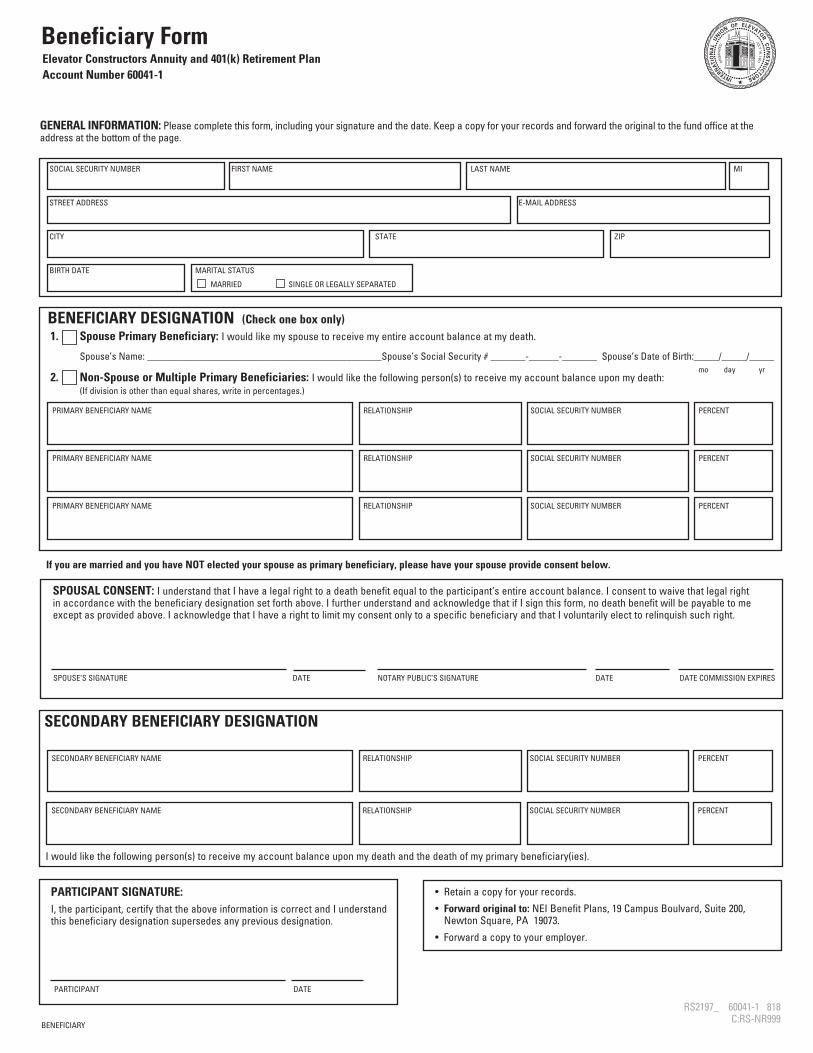
Beneficiary Form
BENEFICIARY DESIGNATION (Check one box only)
1. Spouse Primary Beneficiary: I would like my spouse to receive my entire account balance at my death.
Spouse’s Name: _______________________________________________Spouse’s Social Security # _______-______-_______ Spouse’s Date of Birth:_____/_____/_____
2. Non-Spouse or Multiple Primary Beneficiaries: I would like the following person(s) to receive my account balance upon my death:
(If division is other than equal shares, write in percentages.)
mo day yr
PRIMARY BENEFICIARY NAME RELATIONSHIP SOCIAL SECURITY NUMBER PERCENT
PRIMARY BENEFICIARY NAME RELATIONSHIP SOCIAL SECURITY NUMBER PERCENT
PRIMARY BENEFICIARY NAME RELATIONSHIP SOCIAL SECURITY NUMBER PERCENT
PARTICIPANT SIGNATURE:
I, the participant, certify that the above information is correct and I understand this beneficiary designation supersedes any previous designation.
PARTICIPANT DATE
GENERAL INFORMATION: Please complete this form, including your signature and the date. Keep a copy for your records and forward the original to the fund office at the address at the bottom of the page.
• Retain a copy for your records.
• Forward original to: NEI Benefit Plans, 19 Campus Boulvard, Suite 200, Newton Square, PA 19073.
• Forward a copy to your employer.
SPOUSE’S SIGNATURE DATE NOTARY PUBLIC’S SIGNATURE DATE DATE COMMISSION EXPIRES
If you are married and you have NOT elected your spouse as primary beneficiary, please have your spouse provide consent below.
SPOUSAL CONSENT: I understand that I have a legal right to a death benefit equal to the participant’s entire account balance. I consent to waive that legal right in accordance with the beneficiary designation set forth above. I further understand and acknowledge that if I sign this form, no death benefit will be payable to me except as provided above. I acknowledge that I have a right to limit my consent only to a specific beneficiary and that I voluntarily elect to relinquish such right.
Elevator Constructors Annuity and 401(k) Retirement Plan
Account Number 60041-1
RS2197_ 60041-1 818 C:RS-NR999
SECONDARY BENEFICIARY DESIGNATION
I would like the following person(s) to receive my account balance upon my death and the death of my primary beneficiary(ies).
SECONDARY BENEFICIARY NAME RELATIONSHIP SOCIAL SECURITY NUMBER PERCENT
SECONDARY BENEFICIARY NAME RELATIONSHIP SOCIAL SECURITY NUMBER PERCENT

12

INVEST_ELEC
PARTICIPANT INFORMATION
SOCIAL SECURITY NUMBER FIRST NAME LAST NAME MI
STREET ADDRESS E-MAIL ADDRESS
CITY STATE ZIP
BIRTH DATE PAYROLL FREQUENCY MARITAL STATUS GENDER (OPTIONAL)
MONTHLY (12/YR) SEMI-MONTHLY (24/YR) BI-WEEKLY (26/YR) WEEKLY (52/YR) MARRIED SINGLE OR LEGALLY SEPARATED MALE FEMALE
EMPLOYEE SURVIVING BENEFICIARY (ATTACH NOTICE OF DEATH FORM) ALTERNATE PAYEE (ATTACH QDRO FORM)
Investment Election Form (page 1 of 2)
The Elevator Constructors Annuity and 401(k) Retirement Plan
60041-1-1
PLAN ADMINISTRATOR USE ONLY HIRE DATE _____/_____/_____ PLAN ENTRY DATE _____/_____/_____ If Employer Vesting: Total Years of Service as of the end of the computation period: __________
INVESTMENT SELECTION 2 Easy Options to Invest Your Retirement Contribution
Option 1 Choose a Target Asset Allocation Investment Options
100% to Retirement 2010 (TRP)
100% to Retirement 2020 (TRP)
100% to Retirement 2030 (TRP)
Target Asset Allocation investment options are single solutions that offer professional management and monitoring as well as diversification – all in one investment.
Each investment option has an automatic process that invests more conservatively as retirement nears and the options are named to coincide with a particular
retirement date. Your plan is designed to invest your contributions into one of these options as the default investment based on your date of birth and a projected
retirement age of 65. You may always choose new investment options at any time.
Until you make your investment option selection, all of your contributions will be invested in the T. Rowe Price Target Asset Allocation Date Funds.
Option 2 Choose Your Own
Total contributions must add up to 100% 100%
Investment OptionsAll Contributions
(ENTER WHOLE PERCENTAGES; 1% MINIMUM IN INVESTMENTS SELECTED; MULTIPLES OF 1% THEREAFTER)
100% to Retirement 2040 (TRP)
100% to Retirement 2050 (TRP)
OR
Fixed Income Fund ______%
Prm Cr Bnd Fd (Barings) ______%
Oppenheimer Global Alloc Fund ______%
Vanguard Balanced Index Fund ______%
Sel Dvrsfd Val Fd (Loomis Sayles/Brandywine) ______%
Vanguard 500 Index Fund ______%
Sel Gr Oppts Fund (Sands/JSP) ______%
Sel Systmc/Am Century Mid Cap Value Fd ______%
Sel Md Cp Grwth Fd (TRP/Frontier) ______%
Sel Sm Co Val Fd (Fed Clov/TRP/INVSC) ______%
Janus Venture Fund ______%
AmerFunds EuroPacific Gr Fund ______%
Oppenheimer Global Opport Fund ______%
TRowe Price Retirement 2010 Fund ______%
TRowe Price Retirement 2020 Fund ______%
TRowe Price Retirement 2030 Fund ______%
TRowe Price Retirement 2040 Fund ______%
TRowe Price Retirement 2050 Fund ______%
INVESTMENT SELECTION

PARTICIPANT SIGNATURE:
I, the participant, certify that the above information is correct.
PARTICIPANT DATE
Investment Election Form (page 2 of 2)
MAIL TO: MassMutual Retirement Services, PO Box 219062, Kansas City, MO 64121-9062
OVERNIGHT MAIL TO: MassMutual Retirement Services, 430 W 7th Street, Kansas City, MO 64105
After receipt of this form, MassMutual will send you an Investment Selection Confirmation report. You should keep a copy of this form for your records.
To get the most out of your Plan . . . you may also roll over your eligible distributions from your prior employer’s qualified plan.
Investors should consider an investment’s objectives, risks, charges and expenses carefully before investing. For this and other information, see a fact sheet or the applicable prospectus available from your plan sponsor at www.massmutual.com/iuec or by contacting our Participant Information Center at 1-800-743-5274 between 8:00 a.m. and 8:00 p.m. ET, Monday through Friday. Read it carefully before investing.
I understand I may revoke this election at anytime or I may change this election as allowed by the Plan. I understand that the maximum annual limit on contributions is determined under the Plan document and the Internal Revenue Code. Any amounts contributed may be reduced or returned to me as required by these limitations.
RS2200 60041-1-1 1217 C:RS-43374-00
© 2017 Massachusetts Mutual Life Insurance Company, Springfield, MA 01111-0001. All rights reserved. www.massmutual.com. MassMutual Financial Group is a marketing name for Massachusetts Mutual Life Insurance Company (MassMutual) and its affiliated companies and sales representatives.


16

401(k) Contribution Enrollment/Deferral Change FormUnless your employer provides you with its own Enrollment/Deferral Change Form, use this form to notify your employer to start your 401(k) contributions, change your 401(k) contribution rate, suspend your 401(k) contributions or resume your 401(k) contributions. Your employer will use this form to update payroll. By electing to make contributions to the Plan, you are authorizing your employer to withhold those contributions from your pay.
General Information (Please print or type)
Employee’s Name:
Employer Name:
Local Number:
Employee SS#: ________/ _____/ _______ Employee’s Phone Number: (_____)
Employee’s Address:
Employee’s Birthdate: ______/ ______/ ______ Hire Date ______/ ______/ ______
Employee Enrollment or Deferral Change (Please check only one box and provide requested information where indicated)
START: I want to start my participation in the plan and my contribution rate will be _____% or $__________,per pay period. It will become effective coincident with the first payroll of the following month.
RESUME: I want to resume my participation in the plan and increase my contributions from zero to_____% or$__________, per pay period. Please execute this request as soon as administratively possible.
CHANGE: I want to change my rate of contributions to_____% or $__________, per pay period. Please executethis request as soon as administratively possible.
SUSPEND: I want to suspend my participation in the plan and reduce my contributions to zero. Please executethis request as soon as administratively possible.
(Note: Participants employed by Otis may only make a percentage election.)
Catch-Up Contributions. Generally, your elective deferrals may not exceed the “applicable dollar amount” as established by the IRS in a calendar year. If your elective deferrals reach the IRS’ applicable dollar limit during the calendar year, your employer will cease making elective deferrals to the plan for the remainder of the calendar year. However, if you attain age 50 or older by the end of the calendar year, you may make “Catch-Up Contributions” under the plan until you reach the IRS’ applicable dollar amount for Catch-Up Contributions. If you are age 50 or older by the end of the calendar year and wish to make Catch-Up Contributions to the plan if and when you reach the IRS’ applicable dollar limit for elective deferrals, please check the box below:
YES, I will be age 50 or older in the calendar year and I wish to make Catch-Up Contributions when and if myelective deferrals reach the IRS applicable dollar limit.
Employee Signature Date
RSU3227 117 RSU3227RSU3227
118C:RSNR999
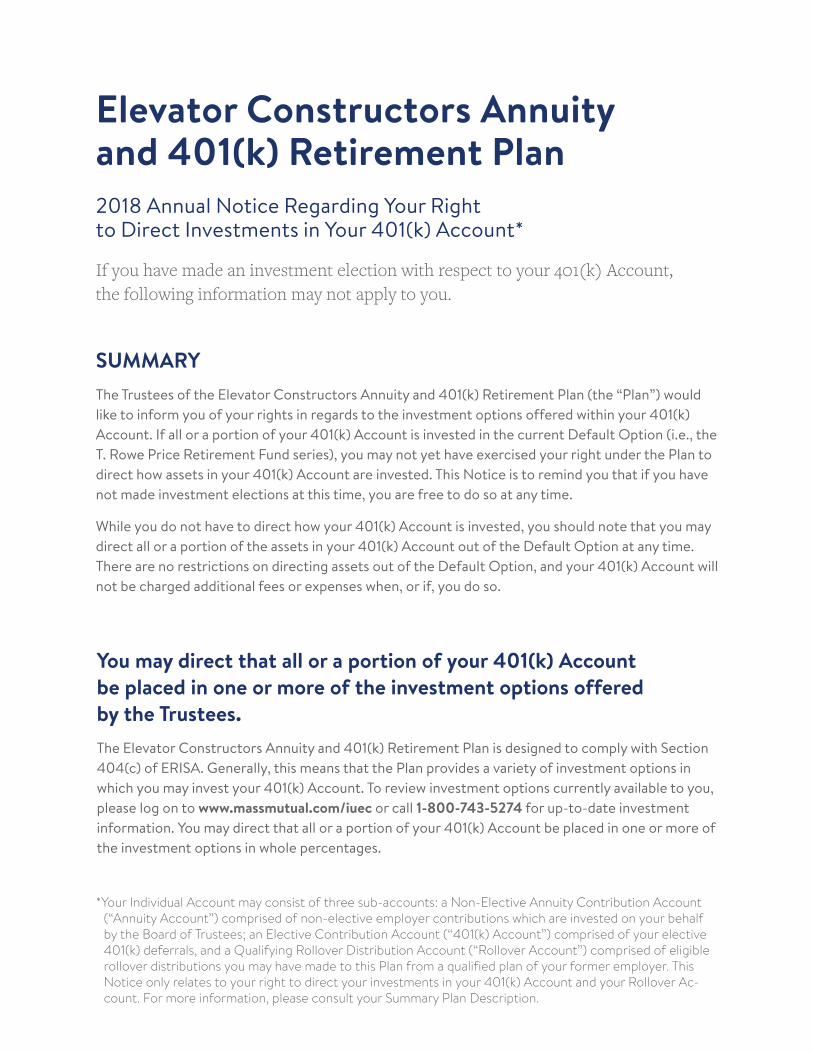
SUMMARY
The Trustees of the Elevator Constructors Annuity and 401(k) Retirement Plan (the “Plan”) would
like to inform you of your rights in regards to the investment options offered within your 401(k)
Account. If all or a portion of your 401(k) Account is invested in the current Default Option (i.e., the
T. Rowe Price Retirement Fund series), you may not yet have exercised your right under the Plan to
direct how assets in your 401(k) Account are invested. This Notice is to remind you that if you have
not made investment elections at this time, you are free to do so at any time.
While you do not have to direct how your 401(k) Account is invested, you should note that you may
direct all or a portion of the assets in your 401(k) Account out of the Default Option at any time.
There are no restrictions on directing assets out of the Default Option, and your 401(k) Account will
not be charged additional fees or expenses when, or if, you do so.
You may direct that all or a portion of your 401(k) Account
be placed in one or more of the investment options offered
by the Trustees.
The Elevator Constructors Annuity and 401(k) Retirement Plan is designed to comply with Section
404(c) of ERISA. Generally, this means that the Plan provides a variety of investment options in
which you may invest your 401(k) Account. To review investment options currently available to you,
please log on to www.massmutual.com/iuec or call 1-800-743-5274 for up-to-date investment
information. You may direct that all or a portion of your 401(k) Account be placed in one or more of
the investment options in whole percentages.
Elevator Constructors Annuity and 401(k) Retirement Plan
2018 Annual Notice Regarding Your Right to Direct Investments in Your 401(k) Account*
If you have made an investment election with respect to your 401(k) Account,
the following information may not apply to you.
*Your Individual Account may consist of three sub-accounts: a Non-Elective Annuity Contribution Account
(“Annuity Account”) comprised of non-elective employer contributions which are invested on your behalf
by the Board of Trustees; an Elective Contribution Account (“401(k) Account”) comprised of your elective
401(k) deferrals, and a Qualifying Rollover Distribution Account (“Rollover Account”) comprised of eligible
rollover distributions you may have made to this Plan from a qualified plan of your former employer. This
Notice only relates to your right to direct your investments in your 401(k) Account and your Rollover Ac-
count. For more information, please consult your Summary Plan Description.

If you do not direct how you want your 401(k) Account to be
invested, it will be invested in the age appropriate T. Rowe Price
Retirement Fund, the Plan’s Default Option, as described below:
If you choose not to direct the investment of all or any portion of your contributions to your
401(k) Account, the contributions will be invested in the Plan’s “Default Option,” the T. Rowe Price
Retirement Fund series.
Each T. Rowe Price Retirement Fund is a diversified mix of stocks, bonds, and cash that
automatically becomes more conservative over time. Experienced investment professionals
carefully select and manage the mix of investments to help investors best meet their changing
needs as they near retirement.
Generally target retirement date (lifecycle) investment options, like the T. Rowe Price Retirement
Fund series, are designed to be held beyond the presumed retirement date to offer a continuing
investment option for the investor in retirement. The year in the investment option name refers to
the approximate year an investor in the option would plan to retire and likely would stop making
new contributions to the Plan.
Target retirement date (lifecycle) investment options are designed for participants who plan to
withdraw the value of their accounts gradually after retirement. Each of these options follows its
own asset allocation path (“glide path”) to progressively reduce its equity exposure and become
more conservative over time. Options may not reach their most conservative allocation until
after their target date. Others may reach their most conservative allocation in their target date
year. Investors should consider their own personal risk tolerance, circumstances and financial
situation. These options should not be selected solely on a single factor such as age or retirement
date. Please consult the prospectus (if applicable) pertaining to the options to determine if their
glide path is consistent with your long-term financial plan. A target retirement date (lifecycle)
investment option may not achieve its objective and/or you could lose money on your investment
in the fund. You may experience losses near, at, or after the target date. There is no guarantee
of the fund’s principal value, including at the target date, or that the fund will provide adequate
income at and through your retirement.
D E F A U L T I N V E S T M E N T O P T I O N
T. Rowe Price Retirement 2010 Fund
T. Rowe Price Retirement 2020 Fund
T. Rowe Price Retirement 2030 Fund
T. Rowe Price Retirement 2040 Fund
T. Rowe Price Retirement 2050 Fund

T . R O W E P R I C E R E T I R E M E N T F U N D S E R I E S
Fund Description
T. Rowe Price Retirement 2010 Fund
The T. Rowe Price Retirement 2010 Fund is currently invested in a moderately conservative mix of individual stock, bond, and cash securities that seeks a more stable rate of growth than that of a broad investment in the stock market. The fund manager diversifies this fund primarily among stocks and intermediate to long-term fixed-income securities. Stocks will typically be a majority of the fund unless the fund manager sees the stock market as particularly unattractive. Each Retirement Target Fund becomes more conservative over time.
T. Rowe Price Retirement 2020 Fund
The T. Rowe Price Retirement 2020 Fund is currently invested in a growth-oriented mix of individual stock, bond, and cash securities that seeks to earn a good portion of the long-term growth of the stock market without full market risk. The fund manager diversifies this fund primarily among various stock investments as long as stock market valuations are favorable versus long-term bond yields. A small portion of the fund is also invested in long-term, fixed-income securities. Each Retirement Target Fund becomes more conservative over time.
T. Rowe Price Retirement 2030 Fund
The T. Rowe Price Retirement 2030 Fund is currently invested in an aggressive, growth-oriented mix of individual stock, bond, and cash securities that seeks to earn the high returns typically associated with the stock market over time. The fund manager diversifies this fund primarily among various stock investments in both domestic and foreign markets, typically investing only a minor portion of the fund in fixed-income securities. Each Retirement Target Fund becomes more conservative over time.
T. Rowe Price Retirement 2040 Fund
The T. Rowe Price Retirement 2040 Fund is currently invested in an aggressive, growth-oriented mix of individual stock, bond, and cash securities that seeks to earn the high returns typically associated with the stock market over time. The fund manager diversifies this fund almost entirely among various stock investments in both domestic and foreign markets, typically investing only a minor portion of the fund in fixed income securities. Each Retirement Target Fund becomes more conservative over time.
T. Rowe Price Retirement 2050 Fund
The T. Rowe Price Retirement 2050 Fund is currently invested in an aggressive, growth-oriented mix of individual stock, bond, and cash securities that seeks to earn the high returns typically associated with the stock market over time. The fund manager diversifies this fund almost entirely among various stock investments in both domestic and foreign markets, typically investing only a minor portion of the fund in fixed income securities. Each Retirement Target Fund becomes more conservative over time.

Elevator Constructors Annuity
and 401(k) Retirement Plan
Provisional Safe Harbor Notification
You are receiving this Notice because you are either participating in or are eligible to participate in
the Elevator Constructors Annuity and 401(k) Retirement Plan (i.e. “the Plan”). The Plan and the
collective bargaining agreement between your employer and the IUEC permits you and requires
your employer to make contributions to your account. The Internal Revenue Service requires 401(k)
plans that will or may use a “safe harbor” structure rather than perform nondiscrimination 401(k)
contribution testing, to inform employees who are eligible to make 401(k) contributions to the Plan
of their rights and obligations under the Plan.
For the 2018 Plan Year, the Board of Trustees may elect to consider the contributions employers
make to the Plan (non-elective employer contributions to Participants’ Annuity Accounts) as Safe
Harbor Non-Elective Contributions. This information is conditional at this point, and may not
come into effect until later on in the 2018 Plan Year, if at all, and is predicated based on the Board
of Trustees’ direction. If the Board of Trustees makes the election, the election would apply to all
employer Annuity contributions equaling 3% of compensation or greater, which are made to the
Plan by employers pursuant to the terms of their collective bargaining agreements with the IUEC
and can change from time to time.
If the Board of Trustees elect this “safe harbor,” it would mean that 401(k) deferred salary
contributions would not have to be tested for 2018, to determine whether the contributions
discriminate in favor of highly compensated employees.
Great news! Based on current results of the Plan’s annual non-discrimination testing, you will
be able to contribute up to the IRS plan maximum in 2018. This means that you
can contribute up to $18,500 in 2018 (or up to $24,500 if you will be age 50 or older
during 2018). To change your contribution amount, contact your current employer.
© 2018 Massachusetts Mutual Life Insurance Company (MassMutual), Springfield, MA 01111-0001. All rights reserved. www.massmutual.com.
RSU3476a 718 C:RS-43375-00
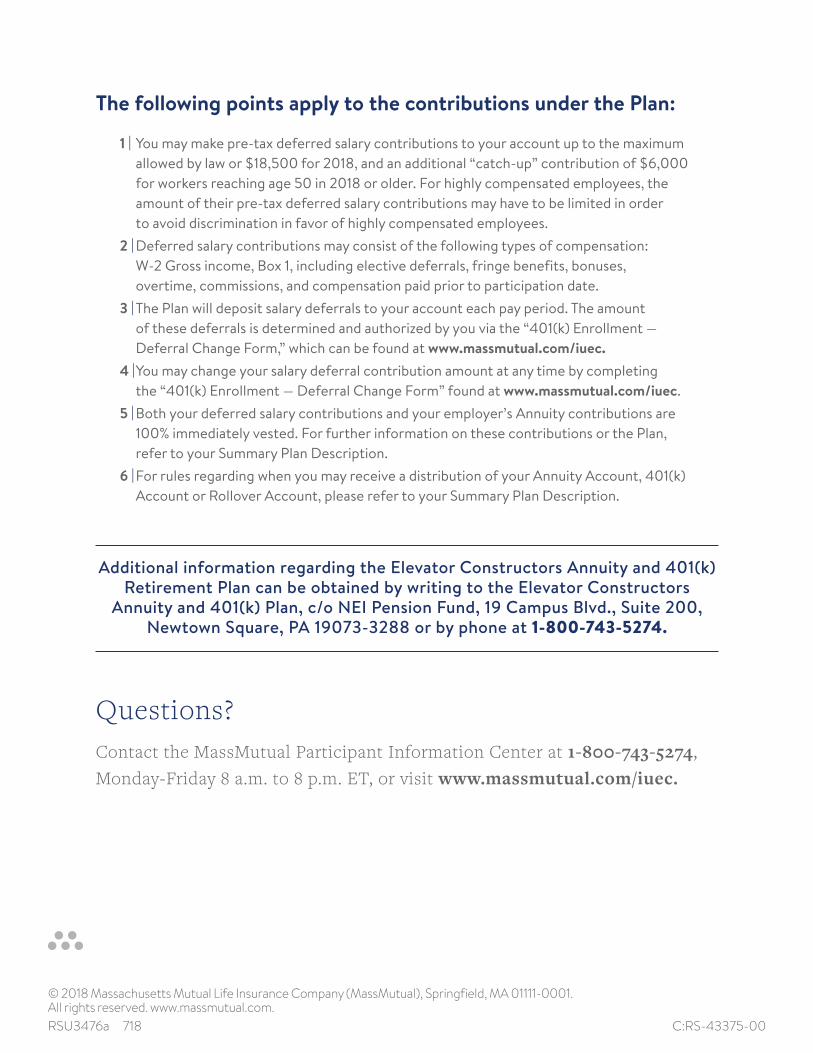
The following points apply to the contributions under the Plan:
1 | You may make pre-tax deferred salary contributions to your account up to the maximum
allowed by law or $18,500 for 2018, and an additional “catch-up” contribution of $6,000
for workers reaching age 50 in 2018 or older. For highly compensated employees, the
amount of their pre-tax deferred salary contributions may have to be limited in order
to avoid discrimination in favor of highly compensated employees.
2 | Deferred salary contributions may consist of the following types of compensation:
W-2 Gross income, Box 1, including elective deferrals, fringe benefits, bonuses,
overtime, commissions, and compensation paid prior to participation date.
3 | The Plan will deposit salary deferrals to your account each pay period. The amount
of these deferrals is determined and authorized by you via the “401(k) Enrollment —
Deferral Change Form,” which can be found at www.massmutual.com/iuec.
4 | You may change your salary deferral contribution amount at any time by completing
the “401(k) Enrollment — Deferral Change Form” found at www.massmutual.com/iuec.
5 | Both your deferred salary contributions and your employer’s Annuity contributions are
100% immediately vested. For further information on these contributions or the Plan,
refer to your Summary Plan Description.
6 | For rules regarding when you may receive a distribution of your Annuity Account, 401(k)
Account or Rollover Account, please refer to your Summary Plan Description.
Additional information regarding the Elevator Constructors Annuity and 401(k) Retirement Plan can be obtained by writing to the Elevator Constructors
Annuity and 401(k) Plan, c/o NEI Pension Fund, 19 Campus Blvd., Suite 200, Newtown Square, PA 19073-3288 or by phone at 1-800-743-5274.
Questions?
Contact the MassMutual Participant Information Center at 1-800-743-5274,
Monday-Friday 8 a.m. to 8 p.m. ET, or visit www.massmutual.com/iuec.

Plan
:Ele
vato
r Con
stru
ctor
s An
nuity
and
401
(k) R
etire
men
t Pla
n Ac
coun
t Num
ber:
6004
1-1-
1Su
bscr
iptio
n:Tr
uste
es, E
CA &
401
(k)
Crea
ted:
06/1
6/20
18
You
are
a pa
rtici
pant
or b
enef
icia
ry in
an
indi
vidu
al a
ccou
nt p
lan
that
allo
ws
you
to d
irect
the
inve
stm
ent o
f you
r acc
ount
bal
ance
. Thi
s di
sclo
sure
sta
tem
ent i
s de
sign
ed to
pro
vide
you
with
info
rmat
ion
that
will
allo
w y
ou to
mak
e in
form
ed d
ecis
ions
whe
n se
lect
ing
and
man
agin
g yo
ur in
vest
men
ts. T
his
disc
losu
re s
tate
men
t adv
ises
you
of i
nfor
mat
ion
rega
rdin
g fe
es a
nd e
xpen
ses
asso
ciat
ed w
ith y
our p
artic
ipat
ion
in th
e Pl
an. T
he G
ener
al P
lan
Info
rmat
ion
sect
ion
prov
ides
info
rmat
ion
rega
rdin
g th
e op
erat
ion
of th
e Pl
an. T
heCo
mpa
rativ
e Ch
art s
ectio
n pr
ovid
es in
form
atio
n ab
out t
he P
lan'
s de
sign
ated
inve
stm
ent a
ltern
ativ
es in
clud
ing
inve
stm
ent p
erfo
rman
ce, o
pera
ting
expe
nses
, fee
s, tr
ade
rest
rictio
ns, a
nd a
n in
dust
ry b
ench
mar
k re
lativ
e to
eac
h no
n-fix
ed in
tere
st in
vest
men
t to
help
you
mak
e in
vest
men
t dec
isio
ns. I
f the
Pla
n ha
s ta
rget
dat
e or
life
cyc
le in
vest
men
tal
loca
tion
alte
rnat
ives
, thi
s di
sclo
sure
sta
tem
ent w
ill in
clud
e a
Targ
et D
ate
Asse
t Allo
catio
n In
vest
men
t Alte
rnat
ives
sec
tion
prov
idin
g in
form
atio
n on
how
the
inve
stm
ent
allo
catio
n w
ill c
hang
e ov
er ti
me,
whe
n it
will
reac
h its
mos
t con
serv
ativ
e as
set a
lloca
tion,
the
rele
vanc
e of
any
dat
es u
sed
to d
escr
ibe
the
inve
stm
ent a
nd th
e pa
rtici
pant
age
grou
ps fo
r who
m th
e in
vest
men
t alte
rnat
ive
is d
esig
ned.
If y
our P
lan'
s ad
min
istra
tive
expe
nses
cou
ld b
e de
duct
ed fr
om y
our a
ccou
nt b
alan
ce, t
his
disc
losu
re s
tate
men
t will
incl
ude
an A
dmin
istra
tive
Expe
nses
sec
tion.
The
Adm
inis
trativ
e Ex
pens
es s
ectio
n pr
ovid
es in
form
atio
n re
gard
ing
char
ges
for a
dmin
istra
tive
expe
nses
incu
rred
on
a Pl
an-w
ide
basi
s th
at m
ay b
e de
duct
ed fr
om y
our a
ccou
nt. A
n In
divi
dual
Exp
ense
s se
ctio
n re
gard
ing
indi
vidu
al e
xpen
ses
that
may
be
dedu
cted
from
you
r acc
ount
, will
als
o be
incl
uded
in th
isdi
sclo
sure
sta
tem
ent i
f the
Pla
n ch
arge
s pa
rtici
pant
s an
d be
nefic
iarie
s fo
r the
exp
ense
s as
soci
ated
with
indi
vidu
al tr
ansa
ctio
ns.
Plea
se b
e m
indf
ul th
at:
·An
inve
stm
ent's
pas
t per
form
ance
is n
o gu
aran
tee
of fu
ture
resu
lts.
·To
hel
p ac
hiev
e lo
ng-te
rm re
tirem
ent s
ecur
ity, y
ou s
houl
d gi
ve c
aref
ul c
onsi
dera
tion
to th
e be
nefit
s of
a w
ell-b
alan
ced
and
dive
rsifi
ed in
vest
men
t por
tfolio
.·
Fees
are
onl
y on
e of
sev
eral
fact
ors
you
shou
ld c
onsi
der w
hen
mak
ing
inve
stm
ent d
ecis
ions
. For
mor
e in
form
atio
n an
d an
exa
mpl
e de
mon
stra
ting
the
long
-term
effe
ct o
f fee
san
d ex
pens
es, p
leas
e vi
sit:
http
s://w
ww
.dol
.gov
/site
s/de
faul
t/file
s/eb
sa/a
bout
-ebs
a/ou
r-ac
tiviti
es/re
sour
ce-c
ente
r/pub
licat
ions
/a-lo
ok-a
t-401
k-pl
an-fe
es.p
df a
ndht
tps:
//ww
w.d
ol.g
ov/a
genc
ies/
ebsa
/abo
ut-e
bsa/
our-
activ
ities
/reso
urce
-cen
ter/p
ublic
atio
ns/u
nder
stan
ding
-you
r-re
tirem
ent-p
lan-
fees
.
Inve
stm
ent I
nstru
ctio
ns: I
n or
der t
o di
rect
you
r Pla
n in
vest
men
ts, y
ou m
ust m
ake
your
ele
ctio
n at
ww
w.re
tires
mar
t.com
or c
onta
ct th
e M
assM
utua
l Par
ticip
ant I
nfor
mat
ion
Cent
erat
1-8
88-6
06-7
343.
If y
ou a
re c
urre
ntly
not
par
ticip
atin
g in
the
Plan
and
hav
e qu
estio
ns c
once
rnin
g pl
an p
rovi
sion
s, in
clud
ing
elig
ibili
ty re
quire
men
ts, c
onta
ct N
EI B
enef
it Pl
ans
at(6
10) 3
25-9
100
or N
EI B
enef
it Pl
ans
19 C
ampu
s Bl
vd. S
uite
200
, New
tow
n Sq
uare
PA
1907
3-32
88.
Lim
itatio
ns o
n In
stru
ctio
ns:
·Yo
u m
ay g
ive
inve
stm
ent i
nstru
ctio
ns o
n an
y da
y th
e N
ew Y
ork
Stoc
k Ex
chan
ge is
ope
n fo
r bus
ines
s.·
Any
trade
rest
rictio
ns s
peci
fic to
an
indi
vidu
al in
vest
men
t alte
rnat
ive
will
be
liste
d in
the
Com
para
tive
Char
t.
2
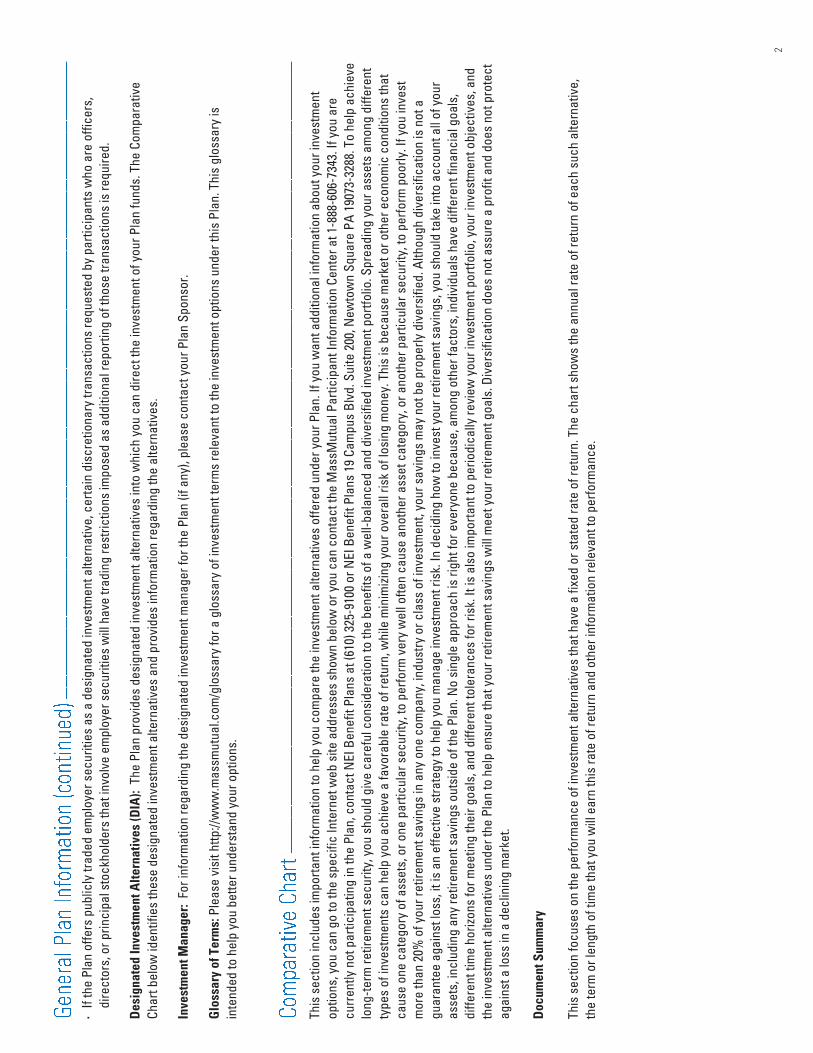
·If
the
Plan
offe
rs p
ublic
ly tr
aded
em
ploy
er s
ecur
ities
as
a de
sign
ated
inve
stm
ent a
ltern
ativ
e, c
erta
in d
iscr
etio
nary
tran
sact
ions
requ
este
d by
par
ticip
ants
who
are
offi
cers
,di
rect
ors,
or p
rinci
pal s
tock
hold
ers
that
invo
lve
empl
oyer
sec
uriti
es w
ill h
ave
tradi
ng re
stric
tions
impo
sed
as a
dditi
onal
repo
rting
of t
hose
tran
sact
ions
is re
quire
d.
Desi
gnat
ed In
vest
men
t Alte
rnat
ives
(DIA
): T
he P
lan
prov
ides
des
igna
ted
inve
stm
ent a
ltern
ativ
es in
to w
hich
you
can
dire
ct th
e in
vest
men
t of y
our P
lan
fund
s. T
he C
ompa
rativ
eCh
art b
elow
iden
tifie
s th
ese
desi
gnat
ed in
vest
men
t alte
rnat
ives
and
pro
vide
s in
form
atio
n re
gard
ing
the
alte
rnat
ives
.
Inve
stm
ent M
anag
er:
For i
nfor
mat
ion
rega
rdin
g th
e de
sign
ated
inve
stm
ent m
anag
er fo
r the
Pla
n (if
any
), pl
ease
con
tact
you
r Pla
n Sp
onso
r.
Glos
sary
of T
erm
s: P
leas
e vi
sit h
ttp://
ww
w.m
assm
utua
l.com
/glo
ssar
y fo
r a g
loss
ary
of in
vest
men
t ter
ms
rele
vant
to th
e in
vest
men
t opt
ions
und
er th
is P
lan.
Thi
s gl
ossa
ry is
inte
nded
to h
elp
you
bette
r und
erst
and
your
opt
ions
.
This
sec
tion
incl
udes
impo
rtant
info
rmat
ion
to h
elp
you
com
pare
the
inve
stm
ent a
ltern
ativ
es o
ffere
d un
der y
our P
lan.
If y
ou w
ant a
dditi
onal
info
rmat
ion
abou
t you
r inv
estm
ent
optio
ns, y
ou c
an g
o to
the
spec
ific
Inte
rnet
web
site
add
ress
es s
how
n be
low
or y
ou c
an c
onta
ct th
e M
assM
utua
l Par
ticip
ant I
nfor
mat
ion
Cent
er a
t 1-8
88-6
06-7
343.
If y
ou a
re
curr
ently
not
par
ticip
atin
g in
the
Plan
, con
tact
NEI
Ben
efit
Plan
s at
(610
) 325
-910
0 or
NEI
Ben
efit
Plan
s 19
Cam
pus
Blvd
. Sui
te 2
00, N
ewto
wn
Squa
re P
A 19
073-
3288
. To
help
ach
ieve
lo
ng-te
rm re
tirem
ent s
ecur
ity, y
ou s
houl
d gi
ve c
aref
ul c
onsi
dera
tion
to th
e be
nefit
s of
a w
ell-b
alan
ced
and
dive
rsifi
ed in
vest
men
t por
tfolio
. Spr
eadi
ng y
our a
sset
s am
ong
diffe
rent
ty
pes
of in
vest
men
ts c
an h
elp
you
achi
eve
a fa
vora
ble
rate
of r
etur
n, w
hile
min
imizi
ng y
our o
vera
ll ris
k of
losi
ng m
oney
. Thi
s is
bec
ause
mar
ket o
r oth
er e
cono
mic
con
ditio
ns th
at
caus
e on
e ca
tego
ry o
f ass
ets,
or o
ne p
artic
ular
sec
urity
, to
perfo
rm v
ery
wel
l ofte
n ca
use
anot
her a
sset
cat
egor
y, o
r ano
ther
par
ticul
ar s
ecur
ity, t
o pe
rform
poo
rly. I
f you
inve
st
mor
e th
an 2
0% o
f you
r ret
irem
ent s
avin
gs in
any
one
com
pany
, ind
ustry
or c
lass
of i
nves
tmen
t, yo
ur s
avin
gs m
ay n
ot b
e pr
oper
ly d
iver
sifie
d. A
lthou
gh d
iver
sific
atio
n is
not
a
guar
ante
e ag
ains
t los
s, it
is a
n ef
fect
ive
stra
tegy
to h
elp
you
man
age
inve
stm
ent r
isk.
In d
ecid
ing
how
to in
vest
you
r ret
irem
ent s
avin
gs, y
ou s
houl
d ta
ke in
to a
ccou
nt a
ll of
you
r as
sets
, inc
ludi
ng a
ny re
tirem
ent s
avin
gs o
utsi
de o
f the
Pla
n. N
o si
ngle
app
roac
h is
righ
t for
eve
ryon
e be
caus
e, a
mon
g ot
her f
acto
rs, i
ndiv
idua
ls h
ave
diffe
rent
fina
ncia
l goa
ls,
diffe
rent
tim
e ho
rizon
s fo
r mee
ting
thei
r goa
ls, a
nd d
iffer
ent t
oler
ance
s fo
r ris
k. It
is a
lso
impo
rtant
to p
erio
dica
lly re
view
you
r inv
estm
ent p
ortfo
lio, y
our i
nves
tmen
t obj
ectiv
es, a
nd
the
inve
stm
ent a
ltern
ativ
es u
nder
the
Plan
to h
elp
ensu
re th
at y
our r
etire
men
t sav
ings
will
mee
t you
r ret
irem
ent g
oals
. Div
ersi
ficat
ion
does
not
ass
ure
a pr
ofit
and
does
not
pro
tect
ag
ains
t a lo
ss in
a d
eclin
ing
mar
ket.
Docu
men
t Sum
mar
y
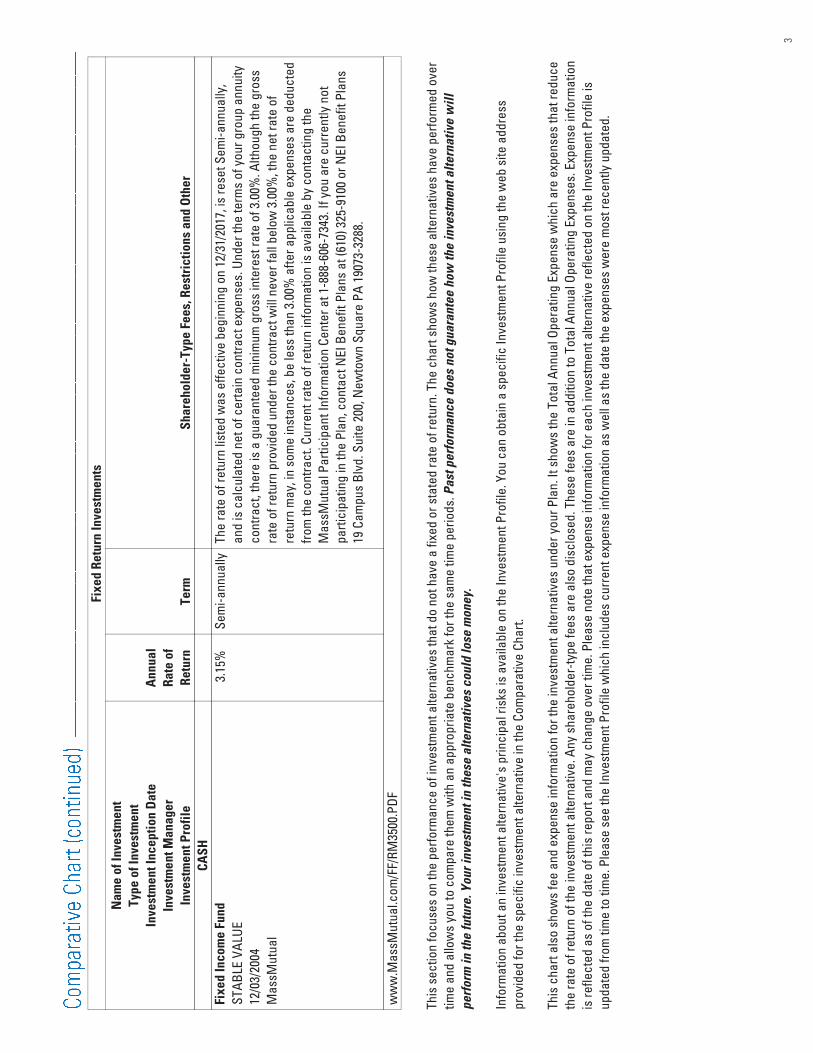
This
sec
tion
focu
ses
on th
e pe
rform
ance
of i
nves
tmen
t alte
rnat
ives
that
hav
e a
fixed
or s
tate
d ra
te o
f ret
urn.
The
cha
rt sh
ows
the
annu
al ra
te o
f ret
urn
of e
ach
such
alte
rnat
ive,
the
term
or l
engt
h of
tim
e th
at y
ou w
ill e
arn
this
rate
of r
etur
n an
d ot
her i
nfor
mat
ion
rele
vant
to p
erfo
rman
ce.
3
Fixe
d Re
turn
Inve
stm
ents
Nam
e of
Inve
stm
ent
Type
of I
nves
tmen
tIn
vest
men
t Inc
eptio
n Da
teIn
vest
men
t Man
ager
Inve
stm
ent P
rofil
e
Annu
alRa
te o
fRe
turn
Term
Shar
ehol
der-
Type
Fee
s, R
estri
ctio
ns a
nd O
ther
CASH
Fixe
d In
com
e Fu
ndST
ABLE
VAL
UE12
/03/
2004
Mas
sMut
ual
3.15
%Se
mi-a
nnua
llyTh
e ra
te o
f ret
urn
liste
d w
as e
ffect
ive
begi
nnin
g on
12/
31/2
017,
is re
set S
emi-a
nnua
lly,
and
is c
alcu
late
d ne
t of c
erta
in c
ontra
ct e
xpen
ses.
Und
er th
e te
rms
of y
our g
roup
ann
uity
cont
ract
, the
re is
a g
uara
ntee
d m
inim
um g
ross
inte
rest
rate
of 3
.00%
. Alth
ough
the
gros
sra
te o
f ret
urn
prov
ided
und
er th
e co
ntra
ct w
ill n
ever
fall
belo
w 3
.00%
, the
net
rate
of
retu
rn m
ay, i
n so
me
inst
ance
s, b
e le
ss th
an 3
.00%
afte
r app
licab
le e
xpen
ses
are
dedu
cted
from
the
cont
ract
. Cur
rent
rate
of r
etur
n in
form
atio
n is
ava
ilabl
e by
con
tact
ing
the
Mas
sMut
ual P
artic
ipan
t Inf
orm
atio
n Ce
nter
at 1
-888
-606
-734
3. If
you
are
cur
rent
ly n
otpa
rtici
patin
g in
the
Plan
, con
tact
NEI
Ben
efit
Plan
s at
(610
) 325
-910
0 or
NEI
Ben
efit
Plan
s19
Cam
pus
Blvd
. Sui
te 2
00, N
ewto
wn
Squa
re P
A 19
073-
3288
.
ww
w.M
assM
utua
l.com
/FF/
RM35
00.P
DF
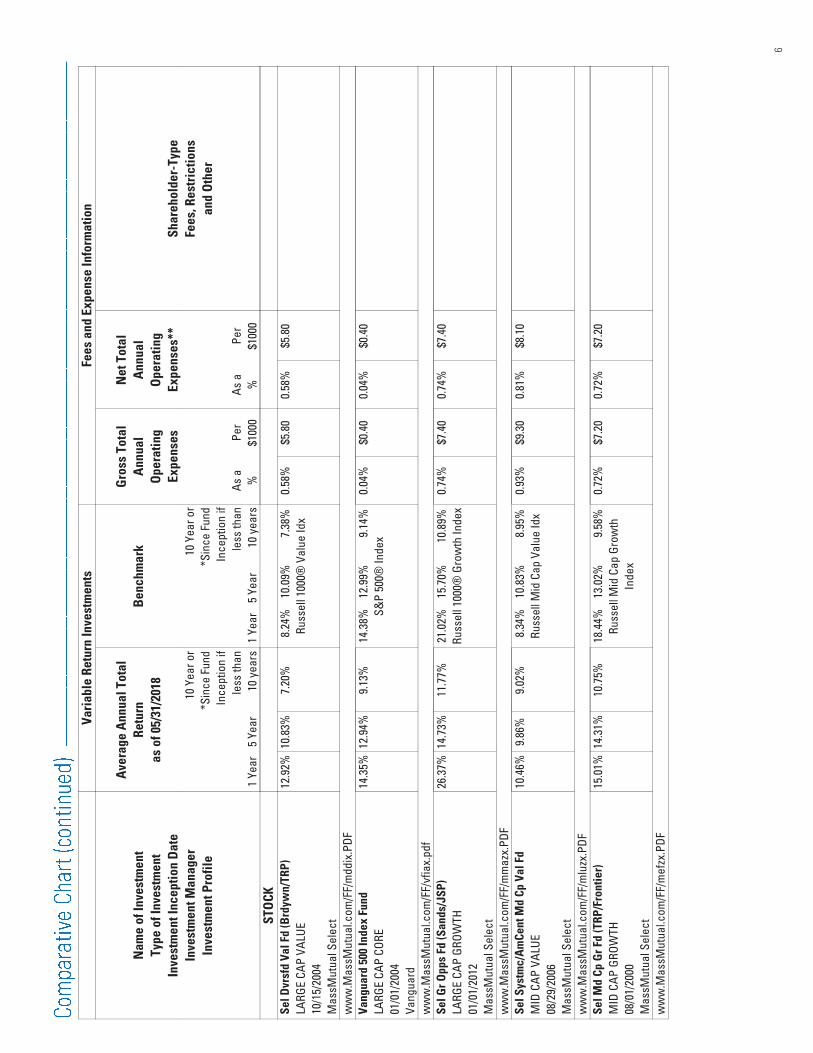
This
sec
tion
focu
ses
on th
e pe
rform
ance
of i
nves
tmen
t alte
rnat
ives
that
do
not h
ave
a fix
ed o
r sta
ted
rate
of r
etur
n. T
he c
hart
show
s ho
w th
ese
alte
rnat
ives
hav
e pe
rform
ed o
ver
time
and
allo
ws
you
to c
ompa
re th
em w
ith a
n ap
prop
riate
ben
chm
ark
for t
he s
ame
time
perio
ds. P
ast p
erfo
rman
ce d
oes
not g
uara
ntee
how
the
inve
stm
ent a
ltern
ativ
e w
illpe
rform
in th
e fu
ture
. You
r inv
estm
ent i
n th
ese
alte
rnat
ives
cou
ld lo
se m
oney
.
Info
rmat
ion
abou
t an
inve
stm
ent a
ltern
ativ
e's
prin
cipa
l ris
ks is
ava
ilabl
e on
the
Inve
stm
ent P
rofil
e. Y
ou c
an o
btai
n a
spec
ific
Inve
stm
ent P
rofil
e us
ing
the
web
site
add
ress
prov
ided
for t
he s
peci
fic in
vest
men
t alte
rnat
ive
in th
e Co
mpa
rativ
e Ch
art.
This
cha
rt al
so s
how
s fe
e an
d ex
pens
e in
form
atio
n fo
r the
inve
stm
ent a
ltern
ativ
es u
nder
you
r Pla
n. It
sho
ws
the
Tota
l Ann
ual O
pera
ting
Expe
nse
whi
ch a
re e
xpen
ses
that
redu
ceth
e ra
te o
f ret
urn
of th
e in
vest
men
t alte
rnat
ive.
Any
sha
reho
lder
-type
fees
are
als
o di
sclo
sed.
The
se fe
es a
re in
add
ition
to T
otal
Ann
ual O
pera
ting
Expe
nses
. Exp
ense
info
rmat
ion
is re
flect
ed a
s of
the
date
of t
his
repo
rt an
d m
ay c
hang
e ov
er ti
me.
Ple
ase
note
that
exp
ense
info
rmat
ion
for e
ach
inve
stm
ent a
ltern
ativ
e re
flect
ed o
n th
e In
vest
men
t Pro
file
isup
date
d fro
m ti
me
to ti
me.
Ple
ase
see
the
Inve
stm
ent P
rofil
e w
hich
incl
udes
cur
rent
exp
ense
info
rmat
ion
as w
ell a
s th
e da
te th
e ex
pens
es w
ere
mos
t rec
ently
upd
ated
.

4
Varia
ble
Retu
rn In
vest
men
tsFe
es a
nd E
xpen
se In
form
atio
n
Nam
e of
Inve
stm
ent
Type
of I
nves
tmen
tIn
vest
men
t Inc
eptio
n Da
te
Aver
age
Annu
al T
otal
Retu
rnas
of 0
5/31
/201
8Be
nchm
ark
Gros
s To
tal
Annu
alOp
erat
ing
Expe
nses
Net
Tot
alAn
nual
Oper
atin
gEx
pens
es**
Shar
ehol
der-
Type
Inve
stm
ent M
anag
erIn
vest
men
t Pro
file
1 Ye
ar5
Year
10 Y
ear o
r*S
ince
Fun
dIn
cept
ion
ifle
ss th
an10
yea
rs1
Year
5 Ye
ar
10 Y
ear o
r*S
ince
Fun
dIn
cept
ion
ifle
ss th
an10
yea
rsAs
a %Pe
r$1
000
As a %
Per
$100
0
Fees
, Res
trict
ions
and
Othe
r
BON
DPr
m C
r Bnd
Fd
(Bar
ings
)IN
TERM
EDIA
TE T
ERM
BON
D02
/01/
2001
Mas
sMut
ual P
rem
ier
0.44
%2.
18%
4.28
%-0
.38%
1.99
%3.
73%
BBgB
arc
US A
gg B
ond
0.42
%$4
.20
0.42
%$4
.20
ww
w.M
assM
utua
l.com
/FF/
mcz
zx.P
DFAS
SET
ALLO
CATI
ONOp
penh
eim
er G
loba
l Allo
c Fu
ndAS
SET
ALLO
CATI
ON/L
IFES
TYLE
01/0
1/20
07Op
penh
eim
er
4.64
%6.
01%
4.86
%11
.81%
8.88
%4.
95%
MSC
I ACW
I0.
92%
$9.2
00.
86%
$8.6
0
ww
w.M
assM
utua
l.com
/FF/
qgrix
Vang
uard
Bal
ance
d In
dex
Fund
ASSE
T AL
LOCA
TION
/LIF
ESTY
LE12
/02/
2005
Vang
uard
8.75
%8.
46%
7.39
%8.
34%
8.59
%7.
34%
60%
SP
500/
40%
BC
Agg
BdId
x
0.06
%$0
.60
0.06
%$0
.60
ww
w.M
assM
utua
l.com
/FF/
vbai
x.PD
FT.
Row
e Pr
ice
Retir
mnt
201
0 Fd
ASSE
T AL
LOCA
TION
/LIF
ECYC
LE10
/01/
2015
T. R
owe
Pric
e
5.29
%N
/A7.
79%
5.03
%5.
04%
6.48
%S&
P Ta
rget
Dat
e 20
10 T
R0.
55%
$5.5
00.
42%
$4.2
0
ww
w.M
assM
utua
l.com
/FF/
trpax

5
Varia
ble
Retu
rn In
vest
men
tsFe
es a
nd E
xpen
se In
form
atio
n
Nam
e of
Inve
stm
ent
Type
of I
nves
tmen
tIn
vest
men
t Inc
eptio
n Da
te
Aver
age
Annu
al T
otal
Retu
rnas
of 0
5/31
/201
8Be
nchm
ark
Gros
s To
tal
Annu
alOp
erat
ing
Expe
nses
Net
Tot
alAn
nual
Oper
atin
gEx
pens
es**
Shar
ehol
der-
Type
Inve
stm
ent M
anag
erIn
vest
men
t Pro
file
1 Ye
ar5
Year
10 Y
ear o
r*S
ince
Fun
dIn
cept
ion
ifle
ss th
an10
yea
rs1
Year
5 Ye
ar
10 Y
ear o
r*S
ince
Fun
dIn
cept
ion
ifle
ss th
an10
yea
rsAs
a %Pe
r$1
000
As a %
Per
$100
0
Fees
, Res
trict
ions
and
Othe
r
T. R
owe
Pric
e Re
tirm
nt 2
020
FdAS
SET
ALLO
CATI
ON/L
IFEC
YCLE
10/0
1/20
15T.
Row
e Pr
ice
7.64
%N
/A10
.10%
6.68
%6.
55%
8.51
%S&
P Ta
rget
Dat
e 20
20 T
R0.
52%
$5.2
00.
49%
$4.9
0
ww
w.M
assM
utua
l.com
/FF/
trbrx
T. R
owe
Pric
e Re
tirm
nt 2
030
FdAS
SET
ALLO
CATI
ON/L
IFEC
YCLE
10/0
1/20
15T.
Row
e Pr
ice
9.68
%N
/A12
.07%
9.20
%7.
90%
10.6
1%S&
P Ta
rget
Dat
e 20
30 T
R0.
58%
$5.8
00.
55%
$5.5
0
ww
w.M
assM
utua
l.com
/FF/
trpcx
T. R
owe
Pric
e Re
tirm
nt 2
040
FdAS
SET
ALLO
CATI
ON/L
IFEC
YCLE
10/0
1/20
15T.
Row
e Pr
ice
11.2
6%N
/A13
.42%
11.1
7%8.
95%
12.2
6%S&
P Ta
rget
Dat
e 20
40 T
R0.
62%
$6.2
00.
59%
$5.9
0
ww
w.M
assM
utua
l.com
/FF/
trpdx
T. R
owe
Pric
e Re
tirm
nt 2
050
FdAS
SET
ALLO
CATI
ON/L
IFEC
YCLE
10/0
1/20
15T.
Row
e Pr
ice
11.5
7%N
/A13
.61%
11.9
2%9.
54%
13.1
4%S&
P Ta
rget
Dat
e 20
50 T
R0.
66%
$6.6
00.
60%
$6.0
0
ww
w.M
assM
utua
l.com
/FF/
trpm
x.PD
F
6
Varia
ble
Retu
rn In
vest
men
tsFe
es a
nd E
xpen
se In
form
atio
n
Nam
e of
Inve
stm
ent
Type
of I
nves
tmen
tIn
vest
men
t Inc
eptio
n Da
te
Aver
age
Annu
al T
otal
Retu
rnas
of 0
5/31
/201
8Be
nchm
ark
Gros
s To
tal
Annu
alOp
erat
ing
Expe
nses
Net
Tot
alAn
nual
Oper
atin
gEx
pens
es**
Shar
ehol
der-
Type
Inve
stm
ent M
anag
erIn
vest
men
t Pro
file
1 Ye
ar5
Year
10 Y
ear o
r*S
ince
Fun
dIn
cept
ion
ifle
ss th
an10
yea
rs1
Year
5 Ye
ar
10 Y
ear o
r*S
ince
Fun
dIn
cept
ion
ifle
ss th
an10
yea
rsAs
a %Pe
r$1
000
As a %
Per
$100
0
Fees
, Res
trict
ions
and
Othe
r
STOC
KSe
l Dvr
sfd
Val F
d (B
rdyw
n/TR
P)LA
RGE
CAP
VALU
E10
/15/
2004
Mas
sMut
ual S
elec
t
12.9
2%10
.83%
7.20
%8.
24%
10.0
9%7.
38%
Russ
ell 1
000®
Val
ue Id
x0.
58%
$5.8
00.
58%
$5.8
0
ww
w.M
assM
utua
l.com
/FF/
mdd
ix.P
DFVa
ngua
rd 5
00 In
dex
Fund
LARG
E CA
P CO
RE01
/01/
2004
Vang
uard
14.3
5%12
.94%
9.13
%14
.38%
12.9
9%9.
14%
S&P
500®
Inde
x0.
04%
$0.4
00.
04%
$0.4
0
ww
w.M
assM
utua
l.com
/FF/
vfia
x.pd
fSe
l Gr O
pps
Fd (S
ands
/JSP
)LA
RGE
CAP
GROW
TH01
/01/
2012
Mas
sMut
ual S
elec
t
26.3
7%14
.73%
11.7
7%21
.02%
15.7
0%10
.89%
Russ
ell 1
000®
Gro
wth
Inde
x0.
74%
$7.4
00.
74%
$7.4
0
ww
w.M
assM
utua
l.com
/FF/
mm
azx.
Sel S
ystm
c/Am
Cent
Md
Cp V
al F
dM
ID C
AP V
ALUE
08/2
9/20
06M
assM
utua
l Sel
ect
10.4
6%9.
86%
9.02
%8.
34%
10.8
3%8.
95%
Russ
ell M
id C
ap V
alue
Idx
0.93
%$9
.30
0.81
%$8
.10
ww
w.M
assM
utua
l.com
/FF/
mlu
zx.P
DFSe
l Md
Cp G
r Fd
(TRP
/Fro
ntie
r)M
ID C
AP G
ROW
TH08
/01/
2000
Mas
sMut
ual S
elec
t
15.0
1%14
.31%
10.7
5%18
.44%
13.0
2%9.
58%
Russ
ell M
id C
ap G
row
thIn
dex
0.72
%$7
.20
0.72
%$7
.20
ww
w.M
assM
utua
l.com
/FF/
mef
zx.P
DF

7
Varia
ble
Retu
rn In
vest
men
tsFe
es a
nd E
xpen
se In
form
atio
n
Nam
e of
Inve
stm
ent
Type
of I
nves
tmen
tIn
vest
men
t Inc
eptio
n Da
te
Aver
age
Annu
al T
otal
Retu
rnas
of 0
5/31
/201
8Be
nchm
ark
Gros
s To
tal
Annu
alOp
erat
ing
Expe
nses
Net
Tot
alAn
nual
Oper
atin
gEx
pens
es**
Shar
ehol
der-
Type
Inve
stm
ent M
anag
erIn
vest
men
t Pro
file
1 Ye
ar5
Year
10 Y
ear o
r*S
ince
Fun
dIn
cept
ion
ifle
ss th
an10
yea
rs1
Year
5 Ye
ar
10 Y
ear o
r*S
ince
Fun
dIn
cept
ion
ifle
ss th
an10
yea
rsAs
a %Pe
r$1
000
As a %
Per
$100
0
Fees
, Res
trict
ions
and
Othe
r
Sl S
mCo
Vl F
d(Fe
d Cl
/TRP
/INVS
C)SM
ALL
CAP
VALU
E02
/01/
2002
Mas
sMut
ual S
elec
t
14.1
2%9.
84%
8.23
%16
.35%
10.9
5%8.
71%
Russ
ell 2
000®
Val
ue Id
x0.
95%
$9.5
00.
95%
$9.5
0
ww
w.M
assM
utua
l.com
/FF/
msv
zx.P
DFJa
nus
Hend
erso
n Ve
ntur
e Fd
SMAL
L CA
P GR
OWTH
06/0
1/20
12Ja
nus
Hend
erso
n
24.4
4%14
.46%
16.3
8%25
.09%
13.3
3%16
.08%
Russ
ell 2
000®
Gro
wth
Inde
x0.
67%
$6.7
00.
67%
$6.7
0
ww
w.M
assM
utua
l.com
/FF/
jvtn
x.PD
FAm
erFu
nds
Euro
Paci
fic G
r Fun
dIN
TL/G
LOBA
L LA
RGE
GROW
TH05
/02/
2009
Amer
ican
Fun
ds
13.0
5%8.
18%
10.2
4%9.
68%
5.45
%8.
68%
MSC
I AC
Wor
ld e
x-US
A0.
50%
$5.0
00.
50%
$5.0
0
ww
w.M
assM
utua
l.com
/FF/
rerg
x.pd
fOp
penh
eim
er G
loba
l Opp
ort F
und
INTL
/GLO
BAL
SMAL
L/M
ID C
AP10
/23/
1990
Oppe
nhei
mer
30.5
1%20
.49%
13.2
4%11
.81%
8.88
%4.
95%
MSC
I ACW
I0.
73%
$7.3
00.
73%
$7.3
0
ww
w.M
assM
utua
l.com
/FF/
ogiix
*The
ben
chm
ark
sinc
e in
cept
ion
retu
rn is
cal
cula
ted
from
the
mon
th-e
nd o
f the
inve
stm
ent's
ince
ptio
n.

8
**Th
e N
et T
otal
Ann
ual O
pera
ting
Expe
nses
incl
ude
any
inve
stm
ent e
xpen
se w
aive
r/rei
mbu
rsem
ent a
rran
gem
ents
doc
umen
ted
in th
e in
vest
men
t's p
rosp
ectu
s an
d m
ay b
e lo
wer
than
the
Gros
s To
tal A
nnua
l Ope
ratin
g Ex
pens
es d
ue to
the
indi
cate
d ex
pens
e w
aive
rs o
r rei
mbu
rsem
ents
, whi
ch m
ay b
e su
bjec
t to
expi
ratio
n. A
dditi
onal
info
rmat
ion
rega
rdin
gin
vest
men
t exp
ense
wai
vers
spe
cific
to e
ach
inve
stm
ent i
s in
clud
ed in
this
doc
umen
t, if
avai
labl
e, in
clud
ing
whe
ther
the
wai
ver i
s co
ntra
ctua
l or v
olun
tary
and
its
date
of
expi
ratio
n. A
ll av
aila
ble
info
rmat
ion
abou
t inv
estm
ent e
xpen
se w
aive
rs is
cur
rent
and
com
plet
e as
of t
he d
ate
of th
is re
port.
If in
form
atio
n re
gard
ing
the
wai
vers
is in
com
plet
e, it
isbe
caus
e ou
r thi
rd-p
arty
dat
a pr
ovid
er w
as u
nabl
e to
mak
e th
e in
form
atio
n av
aila
ble.
For
som
e in
vest
men
ts, t
he N
et T
otal
Ann
ual O
pera
ting
Expe
nse
ratio
figu
re re
flect
s th
esu
btra
ctio
n of
inte
rest
exp
ense
, whi
ch re
sults
from
an
inve
stm
ent's
use
of c
erta
in o
ther
inve
stm
ents
. Thi
s ex
pens
e is
requ
ired
to b
e tre
ated
as
an in
vest
men
t exp
ense
for
acco
untin
g pu
rpos
es, b
ut is
not
pay
able
to th
e in
vest
men
t adv
iser
or s
ubad
vise
r (if
appl
icab
le).
For m
ore
info
rmat
ion,
ple
ase
see
the
inve
stm
ent p
rofil
e or
the
pros
pect
us th
atco
rres
pond
s to
the
inve
stm
ent,
whi
ch a
re b
oth
avai
labl
e fro
m M
assM
utua
l. Co
ntac
t the
Mas
sMut
ual P
artic
ipan
t Inf
orm
atio
n Ce
nter
at 1
-888
-606
-734
3. If
you
are
cur
rent
ly n
otpa
rtici
patin
g in
the
Plan
, con
tact
NEI
Ben
efit
Plan
s at
(610
) 325
-910
0 or
NEI
Ben
efit
Plan
s 19
Cam
pus
Blvd
. Sui
te 2
00, N
ewto
wn
Squa
re P
A 19
073-
3288
.
Othe
r sha
re c
lass
es o
f an
inve
stm
ent o
r its
und
erly
ing
inve
stm
ent (
depe
ndin
g up
on th
e in
vest
men
t) m
ay h
ave
exis
ted
long
er, w
hich
may
acc
ount
for a
ny p
re-in
cept
ion
perfo
rman
ce s
how
n. If
pre
-ince
ptio
n pe
rform
ance
is s
how
n, it
is g
ener
ally
the
perfo
rman
ce o
f an
olde
r sha
re c
lass
of t
he in
vest
men
t its
elf o
r its
und
erly
ing
inve
stm
ent (
depe
ndin
gup
on th
e in
vest
men
t) ad
just
ed fo
r fee
s an
d ex
pens
es o
f the
new
er s
hare
cla
ss. H
owev
er, i
f usi
ng th
e ex
pens
es o
f the
new
er s
hare
cla
ss ra
ther
than
the
expe
nses
of t
he o
lder
shar
e cl
ass
(due
to lo
wer
exp
ense
s of
the
new
er s
hare
cla
ss) w
ould
resu
lt in
bet
ter p
erfo
rman
ce, t
hen
pre-
ince
ptio
n pe
rform
ance
repr
esen
ts th
at o
f the
old
er s
hare
cla
ss w
ithou
tan
y ex
pens
e ad
just
men
t.
The
cum
ulat
ive
effe
ct o
f fee
s an
d ex
pens
es c
an s
ubst
antia
lly re
duce
the
grow
th o
f you
r ret
irem
ent s
avin
gs. V
isit
the
U.S.
Dep
artm
ent o
f Lab
or's
Web
site
for a
n ex
ampl
e sh
owin
gth
e lo
ng-te
rm e
ffect
of f
ees
and
expe
nses
at h
ttps:
//ww
w.d
ol.g
ov/s
ites/
defa
ult/f
iles/
ebsa
/abo
ut-e
bsa/
our-
activ
ities
/reso
urce
-cen
ter/p
ublic
atio
ns/a
-look
-at-4
01k-
plan
-fees
.Fe
es a
nd e
xpen
ses
are
only
one
of m
any
fact
ors
to c
onsi
der w
hen
you
deci
de to
inve
st in
an
alte
rnat
ive.
You
may
als
o w
ant t
o th
ink
abou
t whe
ther
an
inve
stm
ent i
n a
parti
cula
rop
tion,
alo
ng w
ith y
our o
ther
inve
stm
ents
, will
hel
p yo
u ac
hiev
e yo
ur fi
nanc
ial g
oals
.
To o
btai
n ad
ditio
nal i
nfor
mat
ion
abou
t the
Pla
n's
desi
gnat
ed in
vest
men
t alte
rnat
ives
, ple
ase
obta
in th
e In
vest
men
t Pro
files
for t
he s
peci
fic in
vest
men
t alte
rnat
ives
you
are
inte
rest
ed in
usi
ng th
e w
eb s
ite a
ddre
sses
pro
vide
d in
the
Com
para
tive
Char
t or g
o to
ww
w.re
tires
mar
t.com
.
You
have
the
right
to re
ques
t the
follo
win
g in
form
atio
n re
latin
g to
the
Plan
's in
vest
men
t alte
rnat
ives
: cop
ies
of p
rosp
ectu
ses
or a
ny s
hort-
form
or s
umm
ary
pros
pect
us o
r sim
ilar
docu
men
ts, f
inan
cial
sta
tem
ents
or r
epor
ts, a
sta
tem
ent o
f the
val
ue o
f eac
h in
vest
men
t ava
ilabl
e un
der t
he P
lan
as w
ell a
s th
e va
luat
ion
date
, and
a li
st o
f the
ass
ets
that
mak
e up
the
portf
olio
of e
ach
inve
stm
ent u
nder
the
Plan
that
con
stitu
te "p
lan
asse
ts" w
ithin
the
mea
ning
of U
.S. D
epar
tmen
t of L
abor
regu
latio
ns a
nd th
e va
lue
of e
ach
of th
ese
asse
ts. I
nad
ditio
n, y
ou m
ay re
ques
t a fr
ee p
aper
cop
y of
the
info
rmat
ion
avai
labl
e on
the
web
site
(s) l
iste
d on
the
Com
para
tive
Char
ts a
bove
and
the
Glos
sary
of I
nves
tmen
t Ter
ms.
Thi
sin
form
atio
n ca
n be
obt
aine
d by
con
tact
ing
NEI
Ben
efit
Plan
s at
(610
) 325
-910
0 or
NEI
Ben
efit
Plan
s 19
Cam
pus
Blvd
. Sui
te 2
00, N
ewto
wn
Squa
re P
A 19
073-
3288
or M
assM
utua
lPa
rtici
pant
Info
rmat
ion
Cent
er, P
.O. B
ox 2
1906
2, K
ansa
s Ci
ty,
MO
6412
1-90
62, 1
-888
-606
-734
3.

9
If fe
es/e
xpen
ses
are
incu
rred
for p
lan
adm
inis
tratio
n, s
uch
fees
/exp
ense
s m
ay b
e ch
arge
d to
the
Plan
. As
an in
divi
dual
acc
ount
Pla
n, th
ese
Adm
inis
trativ
e Fe
es m
ay b
e ch
arge
d ag
ains
t you
r acc
ount
bal
ance
to th
e ex
tent
they
are
not
cha
rged
aga
inst
forfe
iture
s or
pai
d by
the
Plan
Spo
nsor
. As
a re
sult,
you
r acc
ount
bal
ance
may
be
redu
ced
for y
our s
hare
of
any
Pla
n Ad
min
istra
tive
fees
cha
rged
aga
inst
you
r acc
ount
. The
se fe
es m
ay b
e ch
arge
d on
a p
ro ra
ta b
asis
(i.e
., ba
sed
on th
e re
lativ
e si
ze o
f eac
h pa
rtici
pant
and
ben
efic
iary
's
acco
unt)
and/
or a
per
cap
ita b
asis
(i.e
., ea
ch p
artic
ipan
t and
ben
efic
iary
is c
harg
ed th
e sa
me
fee)
. If P
lan
Adm
inis
trativ
e fe
es a
re c
harg
ed to
you
r acc
ount
bal
ance
, the
act
ual
dolla
r am
ount
will
be
repo
rted
to y
ou in
the
cale
ndar
qua
rter f
ollo
win
g th
e qu
arte
r in
whi
ch th
e ch
arge
occ
urs.
Ple
ase
refe
r to
your
qua
rterly
acc
ount
sta
tem
ent f
or in
form
atio
n on
an
y fe
es a
ctua
lly c
harg
ed to
you
r acc
ount
.
Plea
se n
ote
that
the
Plan
Adm
inis
trativ
e fe
es w
hich
app
ear b
elow
are
not
refle
cted
in th
e to
tal a
nnua
l ope
ratin
g ex
pens
es o
f any
of t
he P
lan'
s in
vest
men
t opt
ions
. How
ever
, in
addi
tion
to th
e Pl
an A
dmin
istra
tive
fee
amou
nts
liste
d in
this
sec
tion,
som
e of
the
Plan
's A
dmin
istra
tive
fees
may
hav
e be
en p
aid
thro
ugh
reve
nue
shar
ing
arra
ngem
ents
m
aint
aine
d w
ith o
ne o
r mor
e of
the
Plan
's in
vest
men
t opt
ions
in w
hich
you
may
be
inve
sted
.
Pro
Rata
Fee
sPl
an a
dmin
istra
tion
fees
/exp
ense
s th
at m
ay b
e ch
arge
d pr
o ra
ta in
clud
e, b
ut a
re n
ot li
mite
d to
, fee
s/ex
pens
es fo
r leg
al, a
ccou
ntin
g, a
udit,
com
plia
nce,
inte
rmed
iary
/adv
isor
, in
vest
men
t, re
cord
keep
ing,
and
trus
tee
serv
ices
(col
lect
ivel
y "P
lan
Adm
inis
tratio
n Fe
es").
Per C
apita
Fee
sPl
an a
dmin
istra
tion
fees
/exp
ense
s th
at m
ay b
e ch
arge
d on
a p
er c
apita
bas
is a
re fe
es/e
xpen
ses
for r
ecor
dkee
ping
ser
vice
s.
If th
e Pl
an's
Spo
nsor
nor
mal
ly p
ays
the
fees
for a
dmin
istra
tive
serv
ices
per
form
ed b
y M
assM
utua
l, an
d th
e pa
ymen
t is
over
due
in a
ccor
danc
e w
ith th
e Pl
an S
pons
or's
Ad
min
istra
tive
Serv
ices
Agr
eem
ent w
ith M
assM
utua
l, th
e Pl
an S
pons
or is
aut
horiz
ing
that
the
outs
tand
ing
expe
nses
will
be
dedu
cted
from
par
ticip
ants
' acc
ount
bal
ance
s on
a p
ro
rata
bas
is to
the
exte
nt a
llow
ed b
y th
e Pl
an's
Adm
inis
trativ
e Se
rvic
es A
gree
men
t. Yo
ur s
hare
of t
he o
verd
ue e
xpen
se w
ill b
e de
term
ined
by
mul
tiply
ing
the
fee
by a
ratio
that
is
equa
l to
the
valu
e of
you
r acc
ount
bal
ance
div
ided
by
the
valu
e of
all
acco
unt b
alan
ces
unde
r the
pla
n.
In a
dditi
on, t
here
may
be
othe
r adm
inis
trativ
e se
rvic
es p
erfo
rmed
by
serv
ice
prov
ider
s ou
tsid
e of
Mas
sMut
ual d
urin
g th
e ne
xt 1
2 m
onth
s. H
owev
er, i
t is
unkn
own
at th
is ti
me
if an
y se
rvic
es b
y ot
her s
ervi
ce p
rovi
ders
will
be
requ
ired,
wha
t fee
s m
ay b
e ch
arge
d an
d w
heth
er th
ose
fees
will
be
paid
from
pla
n as
sets
. Exa
mpl
es o
f oth
er a
dmin
istra
tive
serv
ices
th
at m
ay o
ccur
out
side
of M
assM
utua
l and
that
may
be
paid
by
plan
ass
ets
if no
t pai
d by
the
Plan
Spo
nsor
incl
ude
but a
re n
ot li
mite
d to
: leg
al s
ervi
ces;
third
par
ty a
dmin
istra
tor
serv
ices
; acc
ount
ing
serv
ices
; pla
n au
dits
; and
inte
rmed
iary
/adv
isor
ser
vice
s. If
any
fees
for s
ervi
ces
perfo
rmed
out
side
of M
assM
utua
l are
to b
e de
duct
ed fr
om p
artic
ipan
t ac
coun
ts, t
hey
may
be
dedu
cted
on
a pr
o ra
ta o
r a p
er c
apita
bas
is. T
he P
lan
Spon
sor w
ill d
irect
whi
ch a
lloca
tion
met
hod
will
be
used
whe
n th
e fe
e fo
r the
ser
vice
is s
ubm
itted
for
paym
ent t
o th
e se
rvic
e pr
ovid
er o
r rei
mbu
rsem
ent t
o th
e Pl
an S
pons
or.

10
© 2
018
Mas
sach
uset
ts M
utua
l Life
Insu
ranc
e Co
mpa
ny, S
prin
gfie
ld, M
A. A
ll rig
hts
rese
rved
. ww
w.m
assm
utua
l.com
.
RS48
94 8
11C:
2171
5-06
The
Plan
may
impo
se c
erta
in c
harg
es a
gain
st in
divi
dual
par
ticip
ants
' acc
ount
s ra
ther
than
cha
rge
them
aga
inst
the
Plan
as
a w
hole
. The
se c
harg
es m
ay a
rise
base
d on
you
r use
of a
feat
ure
avai
labl
e un
der t
he P
lan
(e.g
., pa
rtici
pant
loan
s), o
r bas
ed o
n th
e ap
plic
atio
n of
app
licab
le la
w (e
.g.,
proc
essi
ng a
qua
lifie
d do
mes
tic re
latio
ns o
rder
in c
ase
of a
divo
rce)
. Any
fee
or e
xpen
se c
harg
ed a
gain
st y
our a
ccou
nt w
ill b
e re
porte
d to
you
in y
our q
uarte
rly a
ccou
nt s
tate
men
t in
the
cale
ndar
qua
rter f
ollo
win
g th
e qu
arte
r in
whi
ch th
ech
arge
occ
urs
(and
/or,
as a
pplic
able
, in
any
trans
actio
n st
atem
ent).
Activ
ity T
ype
Curr
ent F
ees
Repr
oces
sing
(adj
ustm
ent)
$75
Spec
ial M
ailin
g$2
0
Effe
ctiv
e 9/
1/20
18, t
he S
peci
al M
ailin
g fe
e w
ill b
e $4
0.

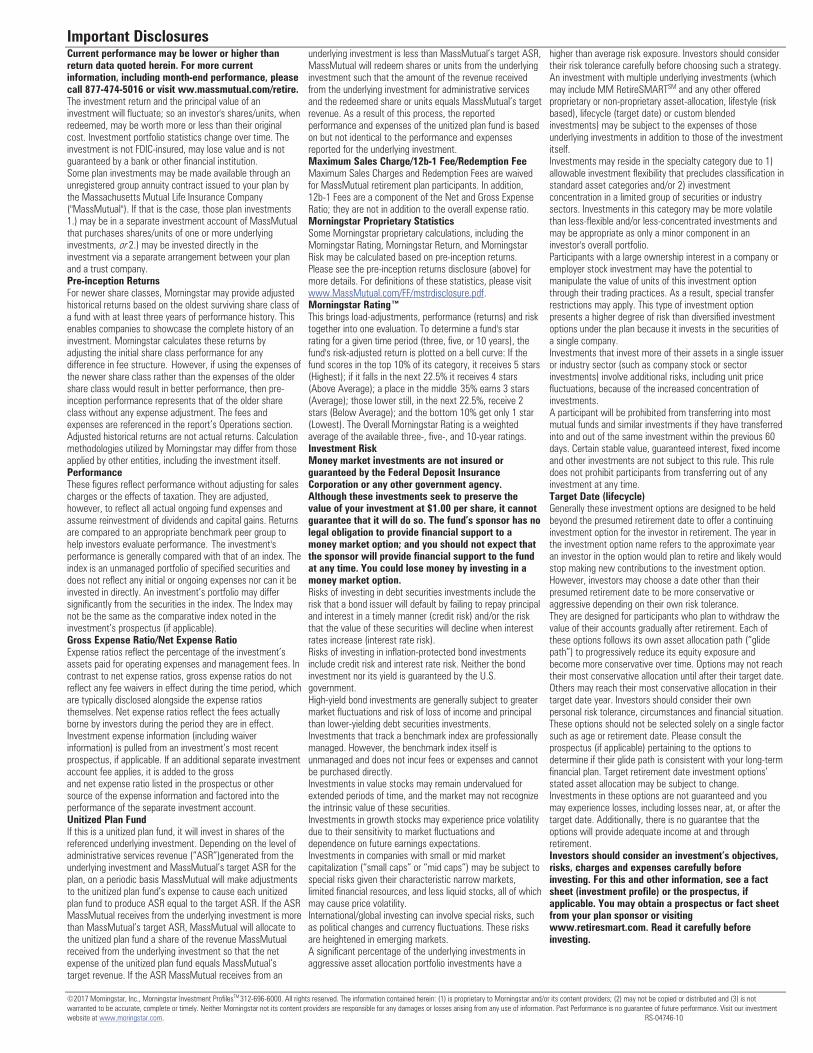
Important Disclosures
©2017 Morningstar, Inc., Morningstar Investment ProfilesTM 312-696-6000. All rights reserved. The information contained herein: (1) is proprietary to Morningstar and/or its content providers; (2) may not be copied or distributed and (3) is not warranted to be accurate, complete or timely. Neither Morningstar not its content providers are responsible for any damages or losses arising from any use of information. Past Performance is no guarantee of future performance. Visit our investment website at www.moringstar.com. RS-04746-10
Current performance may be lower or higher than return data quoted herein. For more current information, including month-end performance, please call 877-474-5016 or visit ww.massmutual.com/retire. The investment return and the principal value of an investment will fluctuate; so an investor's shares/units, when redeemed, may be worth more or less than their original cost. Investment portfolio statistics change over time. The investment is not FDIC-insured, may lose value and is not guaranteed by a bank or other financial institution. Some plan investments may be made available through an unregistered group annuity contract issued to your plan by the Massachusetts Mutual Life Insurance Company ("MassMutual"). If that is the case, those plan investments 1.) may be in a separate investment account of MassMutual that purchases shares/units of one or more underlying investments, or 2.) may be invested directly in the investment via a separate arrangement between your plan and a trust company. Pre-inception Returns For newer share classes, Morningstar may provide adjusted historical returns based on the oldest surviving share class of a fund with at least three years of performance history. This enables companies to showcase the complete history of an investment. Morningstar calculates these returns by adjusting the initial share class performance for any difference in fee structure. However, if using the expenses of the newer share class rather than the expenses of the older share class would result in better performance, then pre-inception performance represents that of the older share class without any expense adjustment. The fees and expenses are referenced in the report’s Operations section. Adjusted historical returns are not actual returns. Calculation methodologies utilized by Morningstar may differ from those applied by other entities, including the investment itself. Performance These figures reflect performance without adjusting for sales charges or the effects of taxation. They are adjusted, however, to reflect all actual ongoing fund expenses and assume reinvestment of dividends and capital gains. Returns are compared to an appropriate benchmark peer group to help investors evaluate performance. The investment's performance is generally compared with that of an index. The index is an unmanaged portfolio of specified securities and does not reflect any initial or ongoing expenses nor can it be invested in directly. An investment’s portfolio may differ significantly from the securities in the index. The Index may not be the same as the comparative index noted in the investment’s prospectus (if applicable). Gross Expense Ratio/Net Expense Ratio Expense ratios reflect the percentage of the investment’s assets paid for operating expenses and management fees. In contrast to net expense ratios, gross expense ratios do not reflect any fee waivers in effect during the time period, which are typically disclosed alongside the expense ratios themselves. Net expense ratios reflect the fees actually borne by investors during the period they are in effect. Investment expense information (including waiver information) is pulled from an investment’s most recent prospectus, if applicable. If an additional separate investment account fee applies, it is added to the gross and net expense ratio listed in the prospectus or other source of the expense information and factored into the performance of the separate investment account. Unitized Plan Fund If this is a unitized plan fund, it will invest in shares of the referenced underlying investment. Depending on the level of administrative services revenue (“ASR”)generated from the underlying investment and MassMutual’s target ASR for the plan, on a periodic basis MassMutual will make adjustments to the unitized plan fund’s expense to cause each unitized plan fund to produce ASR equal to the target ASR. If the ASR MassMutual receives from the underlying investment is more than MassMutual’s target ASR, MassMutual will allocate to the unitized plan fund a share of the revenue MassMutual received from the underlying investment so that the net expense of the unitized plan fund equals MassMutual’s target revenue. If the ASR MassMutual receives from an
underlying investment is less than MassMutual’s target ASR, MassMutual will redeem shares or units from the underlying investment such that the amount of the revenue received from the underlying investment for administrative services and the redeemed share or units equals MassMutual’s target revenue. As a result of this process, the reported performance and expenses of the unitized plan fund is based on but not identical to the performance and expenses reported for the underlying investment. Maximum Sales Charge/12b-1 Fee/Redemption Fee Maximum Sales Charges and Redemption Fees are waived for MassMutual retirement plan participants. In addition, 12b-1 Fees are a component of the Net and Gross Expense Ratio; they are not in addition to the overall expense ratio. Morningstar Proprietary Statistics Some Morningstar proprietary calculations, including the Morningstar Rating, Morningstar Return, and Morningstar Risk may be calculated based on pre-inception returns. Please see the pre-inception returns disclosure (above) for more details. For definitions of these statistics, please visit www.MassMutual.com/FF/mstrdisclosure.pdf. Morningstar Rating™ This brings load-adjustments, performance (returns) and risk together into one evaluation. To determine a fund's star rating for a given time period (three, five, or 10 years), the fund's risk-adjusted return is plotted on a bell curve: If the fund scores in the top 10% of its category, it receives 5 stars (Highest); if it falls in the next 22.5% it receives 4 stars (Above Average); a place in the middle 35% earns 3 stars (Average); those lower still, in the next 22.5%, receive 2 stars (Below Average); and the bottom 10% get only 1 star (Lowest). The Overall Morningstar Rating is a weighted average of the available three-, five-, and 10-year ratings. Investment Risk Money market investments are not insured or guaranteed by the Federal Deposit Insurance Corporation or any other government agency. Although these investments seek to preserve the value of your investment at $1.00 per share, it cannot guarantee that it will do so. The fund’s sponsor has no legal obligation to provide financial support to a money market option; and you should not expect that the sponsor will provide financial support to the fund at any time. You could lose money by investing in a money market option. Risks of investing in debt securities investments include the risk that a bond issuer will default by failing to repay principal and interest in a timely manner (credit risk) and/or the risk that the value of these securities will decline when interest rates increase (interest rate risk). Risks of investing in inflation-protected bond investments include credit risk and interest rate risk. Neither the bond investment nor its yield is guaranteed by the U.S. government. High-yield bond investments are generally subject to greater market fluctuations and risk of loss of income and principal than lower-yielding debt securities investments. Investments that track a benchmark index are professionally managed. However, the benchmark index itself is unmanaged and does not incur fees or expenses and cannot be purchased directly. Investments in value stocks may remain undervalued for extended periods of time, and the market may not recognize the intrinsic value of these securities. Investments in growth stocks may experience price volatility due to their sensitivity to market fluctuations and dependence on future earnings expectations. Investments in companies with small or mid market capitalization (“small caps” or “mid caps”) may be subject to special risks given their characteristic narrow markets, limited financial resources, and less liquid stocks, all of which may cause price volatility. International/global investing can involve special risks, such as political changes and currency fluctuations. These risks are heightened in emerging markets. A significant percentage of the underlying investments in aggressive asset allocation portfolio investments have a
higher than average risk exposure. Investors should consider their risk tolerance carefully before choosing such a strategy. An investment with multiple underlying investments (which may include MM RetireSMARTSM and any other offered proprietary or non-proprietary asset-allocation, lifestyle (risk based), lifecycle (target date) or custom blended investments) may be subject to the expenses of those underlying investments in addition to those of the investment itself. Investments may reside in the specialty category due to 1) allowable investment flexibility that precludes classification in standard asset categories and/or 2) investment concentration in a limited group of securities or industry sectors. Investments in this category may be more volatile than less-flexible and/or less-concentrated investments and may be appropriate as only a minor component in an investor's overall portfolio. Participants with a large ownership interest in a company or employer stock investment may have the potential to manipulate the value of units of this investment option through their trading practices. As a result, special transfer restrictions may apply. This type of investment option presents a higher degree of risk than diversified investment options under the plan because it invests in the securities of a single company. Investments that invest more of their assets in a single issuer or industry sector (such as company stock or sector investments) involve additional risks, including unit price fluctuations, because of the increased concentration of investments. A participant will be prohibited from transferring into most mutual funds and similar investments if they have transferred into and out of the same investment within the previous 60 days. Certain stable value, guaranteed interest, fixed income and other investments are not subject to this rule. This rule does not prohibit participants from transferring out of any investment at any time. Target Date (lifecycle) Generally these investment options are designed to be held beyond the presumed retirement date to offer a continuing investment option for the investor in retirement. The year in the investment option name refers to the approximate year an investor in the option would plan to retire and likely would stop making new contributions to the investment option. However, investors may choose a date other than their presumed retirement date to be more conservative or aggressive depending on their own risk tolerance. They are designed for participants who plan to withdraw the value of their accounts gradually after retirement. Each of these options follows its own asset allocation path (“glide path”) to progressively reduce its equity exposure and become more conservative over time. Options may not reach their most conservative allocation until after their target date. Others may reach their most conservative allocation in their target date year. Investors should consider their own personal risk tolerance, circumstances and financial situation. These options should not be selected solely on a single factor such as age or retirement date. Please consult the prospectus (if applicable) pertaining to the options to determine if their glide path is consistent with your long-term financial plan. Target retirement date investment options’ stated asset allocation may be subject to change. Investments in these options are not guaranteed and you may experience losses, including losses near, at, or after the target date. Additionally, there is no guarantee that the options will provide adequate income at and through retirement. Investors should consider an investment’s objectives, risks, charges and expenses carefully before investing. For this and other information, see a fact sheet (investment profile) or the prospectus, if applicable. You may obtain a prospectus or fact sheet from your plan sponsor or visiting www.retiresmart.com. Read it carefully before investing.
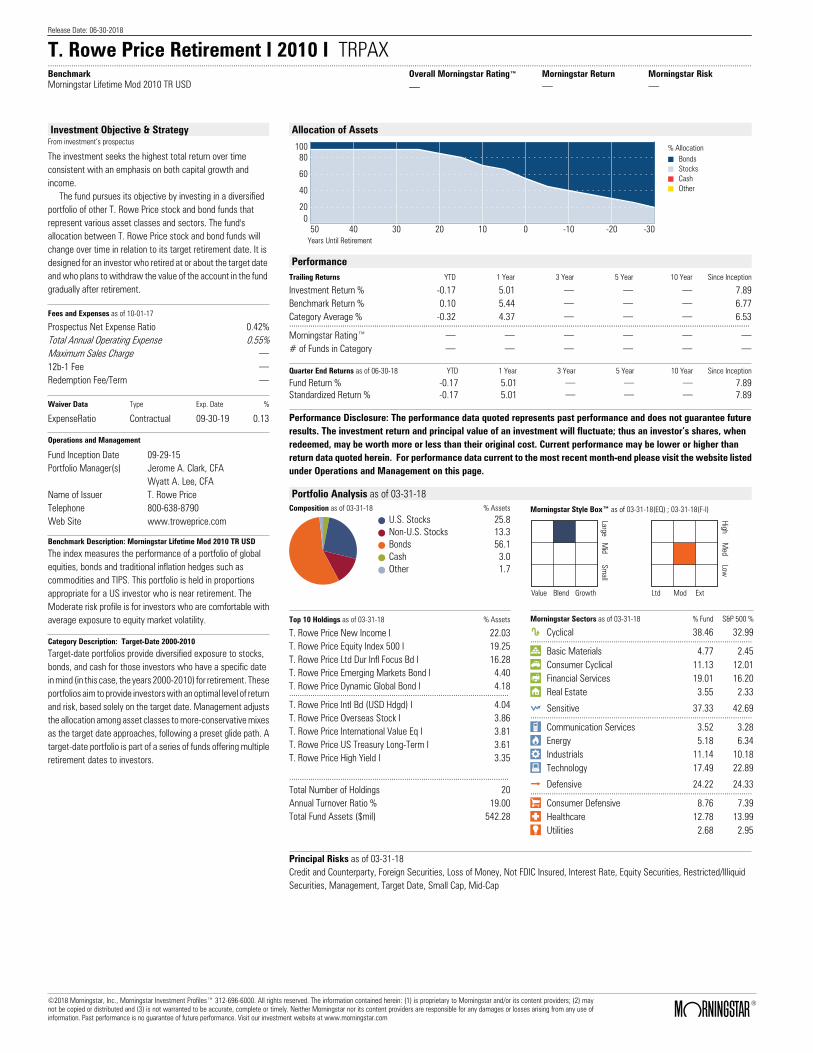
Release Date: 06-30-2018
T. Rowe Price Retirement I 2010 I TRPAX ..........................................................................................................................................................................................................................................................................................................................................BenchmarkMorningstar Lifetime Mod 2010 TR USD
Overall Morningstar Rating™ Morningstar Return Morningstar Risk. . .
Investment Objective & StrategyFrom investment’s prospectus
The investment seeks the highest total return over time consistent with an emphasis on both capital growth and income. The fund pursues its objective by investing in a diversified portfolio of other T. Rowe Price stock and bond funds that represent various asset classes and sectors. The fund's allocation between T. Rowe Price stock and bond funds will change over time in relation to its target retirement date. It is designed for an investor who retired at or about the target date and who plans to withdraw the value of the account in the fund gradually after retirement.
Fees and Expenses as of 10-01-17
Prospectus Net Expense Ratio 0.42%Total Annual Operating Expense 0.55%Maximum Sales Charge .12b-1 Fee .Redemption Fee/Term .
Waiver Data Type Exp. Date %
ExpenseRatio Contractual 09-30-19 0.13
Operations and Management
Fund Inception Date 09-29-15Portfolio Manager(s) Jerome A. Clark, CFA
Wyatt A. Lee, CFAName of Issuer T. Rowe PriceTelephone 800-638-8790Web Site www.troweprice.com
Benchmark Description: Morningstar Lifetime Mod 2010 TR USD
The index measures the performance of a portfolio of globalequities, bonds and traditional inflation hedges such ascommodities and TIPS. This portfolio is held in proportionsappropriate for a US investor who is near retirement. TheModerate risk profile is for investors who are comfortable withaverage exposure to equity market volatility.
Category Description: Target-Date 2000-2010
Target-date portfolios provide diversified exposure to stocks,bonds, and cash for those investors who have a specific datein mind (in this case, the years 2000-2010) for retirement. Theseportfolios aim to provide investors with an optimal level of returnand risk, based solely on the target date. Management adjuststhe allocation among asset classes to more-conservative mixesas the target date approaches, following a preset glide path. Atarget-date portfolio is part of a series of funds offering multipleretirement dates to investors.
Allocation of Assets
050 40 30 20 10 -10 -20 -30
10080
60
40
200
Years Until Retirement
% AllocationBondsStocksCashOther
PerformanceTrailing Returns YTD 1 Year 3 Year 5 Year 10 Year Since Inception
Investment Return % -0.17 5.01 . . . 7.89Benchmark Return % 0.10 5.44 . . . 6.77Category Average % -0.32 4.37 . . . 6.53........................................................................................................................................................................................................................Morningstar Rating™ . . . . . .# of Funds in Category . . . . . .
Quarter End Returns as of 06-30-18 YTD 1 Year 3 Year 5 Year 10 Year Since Inception
Fund Return % -0.17 5.01 . . . 7.89Standardized Return % -0.17 5.01 . . . 7.89
Performance Disclosure: The performance data quoted represents past performance and does not guarantee futureresults. The investment return and principal value of an investment will fluctuate; thus an investor’s shares, whenredeemed, may be worth more or less than their original cost. Current performance may be lower or higher thanreturn data quoted herein. For performance data current to the most recent month-end please visit the website listedunder Operations and Management on this page.
Portfolio Analysis as of 03-31-18Composition as of 03-31-18 % Assets
U.S. Stocks 25.8Non-U.S. Stocks 13.3Bonds 56.1Cash 3.0Other 1.7
Morningstar Style Box™ as of 03-31-18(EQ) ; 03-31-18(F-I)
LargeM
idSm
all
Value Blend Growth
HighM
edLow
Ltd Mod Ext
Top 10 Holdings as of 03-31-18 % Assets
T. Rowe Price New Income I 22.03T. Rowe Price Equity Index 500 I 19.25T. Rowe Price Ltd Dur Infl Focus Bd I 16.28T. Rowe Price Emerging Markets Bond I 4.40T. Rowe Price Dynamic Global Bond I 4.18.......................................................................................................T. Rowe Price Intl Bd (USD Hdgd) I 4.04T. Rowe Price Overseas Stock I 3.86T. Rowe Price International Value Eq I 3.81T. Rowe Price US Treasury Long-Term I 3.61T. Rowe Price High Yield I 3.35
.......................................................................................................Total Number of Holdings 20Annual Turnover Ratio % 19.00Total Fund Assets ($mil) 542.28
Morningstar Sectors as of 03-31-18 % Fund S&P 500 %
h Cyclical 38.46 32.99........................................................................................................r Basic Materials 4.77 2.45t Consumer Cyclical 11.13 12.01y Financial Services 19.01 16.20u Real Estate 3.55 2.33
j Sensitive 37.33 42.69........................................................................................................i Communication Services 3.52 3.28o Energy 5.18 6.34p Industrials 11.14 10.18a Technology 17.49 22.89
k Defensive 24.22 24.33........................................................................................................s Consumer Defensive 8.76 7.39d Healthcare 12.78 13.99f Utilities 2.68 2.95
Principal Risks as of 03-31-18Credit and Counterparty, Foreign Securities, Loss of Money, Not FDIC Insured, Interest Rate, Equity Securities, Restricted/IlliquidSecurities, Management, Target Date, Small Cap, Mid-Cap
©2018 Morningstar, Inc., Morningstar Investment Profiles™ 312-696-6000. All rights reserved. The information contained herein: (1) is proprietary to Morningstar and/or its content providers; (2) maynot be copied or distributed and (3) is not warranted to be accurate, complete or timely. Neither Morningstar nor its content providers are responsible for any damages or losses arising from any use ofinformation. Past performance is no guarantee of future performance. Visit our investment website at www.morningstar.com ß
®

Release Date: 06-30-2018
T. Rowe Price Retirement I 2020 I TRBRX ..........................................................................................................................................................................................................................................................................................................................................BenchmarkMorningstar Lifetime Mod 2020 TR USD
Overall Morningstar Rating™ Morningstar Return Morningstar Risk. . .
Investment Objective & StrategyFrom investment’s prospectus
The investment seeks the highest total return over time consistent with an emphasis on both capital growth and income. The fund pursues its objective by investing in a diversified portfolio of other T. Rowe Price stock and bond funds that represent various asset classes and sectors. The fund's allocation between T. Rowe Price stock and bond funds will change over time in relation to its target retirement date. It is primarily designed for an investor who anticipates retiring at or about the target date and who plans to withdraw the value of the account in the fund gradually after retirement.
Fees and Expenses as of 10-01-17
Prospectus Net Expense Ratio 0.49%Total Annual Operating Expense 0.52%Maximum Sales Charge .12b-1 Fee .Redemption Fee/Term .
Waiver Data Type Exp. Date %
ExpenseRatio Contractual 09-30-19 0.03
Operations and Management
Fund Inception Date 09-29-15Portfolio Manager(s) Jerome A. Clark, CFA
Wyatt A. Lee, CFAName of Issuer T. Rowe PriceTelephone 800-638-8790Web Site www.troweprice.com
Benchmark Description: Morningstar Lifetime Mod 2020 TR USD
The index measures the performance of a portfolio of globalequities, bonds and traditional inflation hedges such ascommodities and TIPS. This portfolio is held in proportionsappropriate for a US investor who is about ten years away fromretirement. The Moderate risk profile is for investors who arecomfortable with average exposure to equity market volatility.
Category Description: Target-Date 2020
Target-date portfolios provide diversified exposure to stocks,bonds, and cash for those investors who have a specific datein mind (in this case, the years 2016-2020) for retirement. Theseportfolios aim to provide investors with an optimal level of returnand risk, based solely on the target date. Management adjuststhe allocation among asset classes to more-conservative mixesas the target date approaches, following a preset glide path. Atarget-date portfolio is part of a series of funds offering multipleretirement dates to investors.
Allocation of Assets
050 40 30 20 10 -10 -20 -30
10080
60
40
200
Years Until Retirement
% AllocationBondsStocksCashOther
PerformanceTrailing Returns YTD 1 Year 3 Year 5 Year 10 Year Since Inception
Investment Return % 0.40 7.19 . . . 10.29Benchmark Return % -0.07 6.54 . . . 8.30Category Average % -0.25 5.65 . . . 7.64........................................................................................................................................................................................................................Morningstar Rating™ . . . . . .# of Funds in Category . . . . . .
Quarter End Returns as of 06-30-18 YTD 1 Year 3 Year 5 Year 10 Year Since Inception
Fund Return % 0.40 7.19 . . . 10.29Standardized Return % 0.40 7.19 . . . 10.29
Performance Disclosure: The performance data quoted represents past performance and does not guarantee futureresults. The investment return and principal value of an investment will fluctuate; thus an investor’s shares, whenredeemed, may be worth more or less than their original cost. Current performance may be lower or higher thanreturn data quoted herein. For performance data current to the most recent month-end please visit the website listedunder Operations and Management on this page.
Portfolio Analysis as of 03-31-18Composition as of 03-31-18 % Assets
U.S. Stocks 36.4Non-U.S. Stocks 19.6Bonds 39.7Cash 2.9Other 1.5
Morningstar Style Box™ as of 03-31-18(EQ) ; 03-31-18(F-I)
LargeM
idSm
all
Value Blend Growth
HighM
edLow
Ltd Mod Ext
Top 10 Holdings as of 03-31-18 % Assets
T. Rowe Price New Income I 17.77T. Rowe Price Equity Index 500 I 16.17T. Rowe Price Ltd Dur Infl Focus Bd I 7.61T. Rowe Price Growth Stock I 5.81T. Rowe Price Value I 5.79.......................................................................................................T. Rowe Price Overseas Stock I 5.45T. Rowe Price International Value Eq I 5.41T. Rowe Price International Stock I 4.81T. Rowe Price US Treasury Long-Term I 3.52T. Rowe Price Dynamic Global Bond I 3.33
.......................................................................................................Total Number of Holdings 22Annual Turnover Ratio % 11.60Total Fund Assets ($mil) 3,805.03
Morningstar Sectors as of 03-31-18 % Fund S&P 500 %
h Cyclical 38.40 32.99........................................................................................................r Basic Materials 4.44 2.45t Consumer Cyclical 11.09 12.01y Financial Services 19.47 16.20u Real Estate 3.40 2.33
j Sensitive 36.91 42.69........................................................................................................i Communication Services 3.18 3.28o Energy 4.78 6.34p Industrials 11.05 10.18a Technology 17.90 22.89
k Defensive 24.70 24.33........................................................................................................s Consumer Defensive 8.32 7.39d Healthcare 13.40 13.99f Utilities 2.98 2.95
Principal Risks as of 03-31-18Credit and Counterparty, Foreign Securities, Loss of Money, Not FDIC Insured, Interest Rate, Equity Securities, Restricted/IlliquidSecurities, Management, Target Date, Small Cap, Mid-Cap
©2018 Morningstar, Inc., Morningstar Investment Profiles™ 312-696-6000. All rights reserved. The information contained herein: (1) is proprietary to Morningstar and/or its content providers; (2) maynot be copied or distributed and (3) is not warranted to be accurate, complete or timely. Neither Morningstar nor its content providers are responsible for any damages or losses arising from any use ofinformation. Past performance is no guarantee of future performance. Visit our investment website at www.morningstar.com ß
®
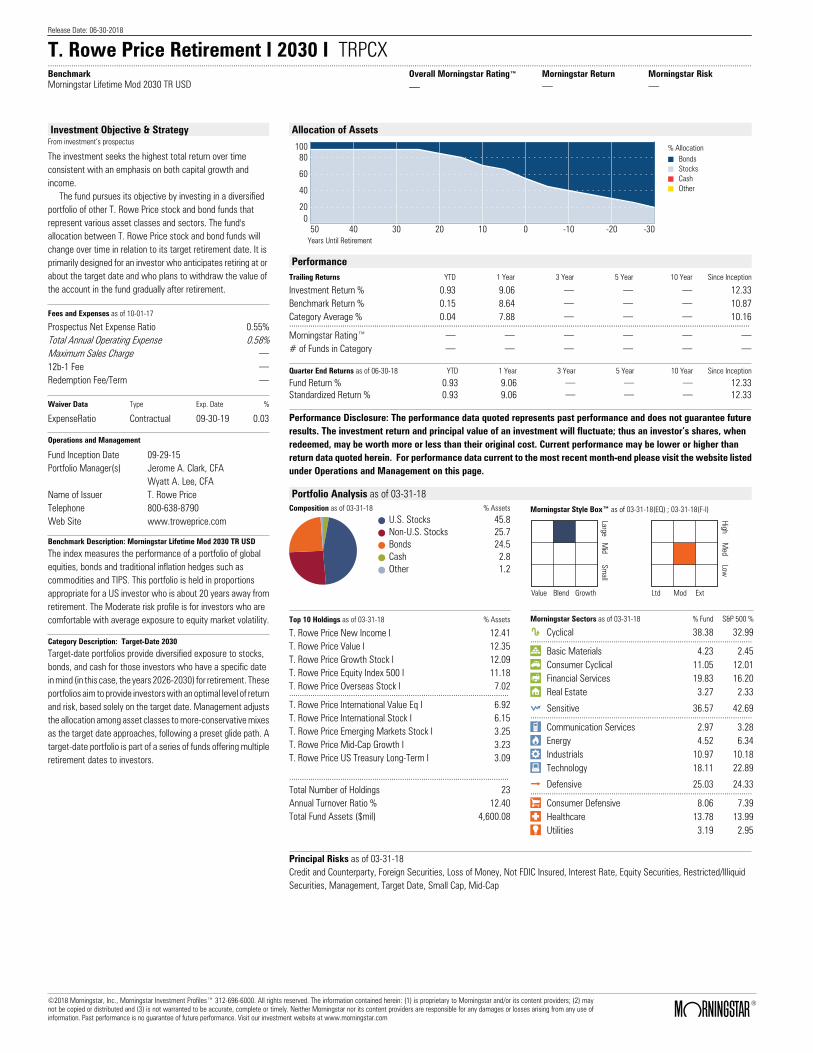
Release Date: 06-30-2018
T. Rowe Price Retirement I 2030 I TRPCX ..........................................................................................................................................................................................................................................................................................................................................BenchmarkMorningstar Lifetime Mod 2030 TR USD
Overall Morningstar Rating™ Morningstar Return Morningstar Risk. . .
Investment Objective & StrategyFrom investment’s prospectus
The investment seeks the highest total return over time consistent with an emphasis on both capital growth and income. The fund pursues its objective by investing in a diversified portfolio of other T. Rowe Price stock and bond funds that represent various asset classes and sectors. The fund's allocation between T. Rowe Price stock and bond funds will change over time in relation to its target retirement date. It is primarily designed for an investor who anticipates retiring at or about the target date and who plans to withdraw the value of the account in the fund gradually after retirement.
Fees and Expenses as of 10-01-17
Prospectus Net Expense Ratio 0.55%Total Annual Operating Expense 0.58%Maximum Sales Charge .12b-1 Fee .Redemption Fee/Term .
Waiver Data Type Exp. Date %
ExpenseRatio Contractual 09-30-19 0.03
Operations and Management
Fund Inception Date 09-29-15Portfolio Manager(s) Jerome A. Clark, CFA
Wyatt A. Lee, CFAName of Issuer T. Rowe PriceTelephone 800-638-8790Web Site www.troweprice.com
Benchmark Description: Morningstar Lifetime Mod 2030 TR USD
The index measures the performance of a portfolio of globalequities, bonds and traditional inflation hedges such ascommodities and TIPS. This portfolio is held in proportionsappropriate for a US investor who is about 20 years away fromretirement. The Moderate risk profile is for investors who arecomfortable with average exposure to equity market volatility.
Category Description: Target-Date 2030
Target-date portfolios provide diversified exposure to stocks,bonds, and cash for those investors who have a specific datein mind (in this case, the years 2026-2030) for retirement. Theseportfolios aim to provide investors with an optimal level of returnand risk, based solely on the target date. Management adjuststhe allocation among asset classes to more-conservative mixesas the target date approaches, following a preset glide path. Atarget-date portfolio is part of a series of funds offering multipleretirement dates to investors.
Allocation of Assets
050 40 30 20 10 -10 -20 -30
10080
60
40
200
Years Until Retirement
% AllocationBondsStocksCashOther
PerformanceTrailing Returns YTD 1 Year 3 Year 5 Year 10 Year Since Inception
Investment Return % 0.93 9.06 . . . 12.33Benchmark Return % 0.15 8.64 . . . 10.87Category Average % 0.04 7.88 . . . 10.16........................................................................................................................................................................................................................Morningstar Rating™ . . . . . .# of Funds in Category . . . . . .
Quarter End Returns as of 06-30-18 YTD 1 Year 3 Year 5 Year 10 Year Since Inception
Fund Return % 0.93 9.06 . . . 12.33Standardized Return % 0.93 9.06 . . . 12.33
Performance Disclosure: The performance data quoted represents past performance and does not guarantee futureresults. The investment return and principal value of an investment will fluctuate; thus an investor’s shares, whenredeemed, may be worth more or less than their original cost. Current performance may be lower or higher thanreturn data quoted herein. For performance data current to the most recent month-end please visit the website listedunder Operations and Management on this page.
Portfolio Analysis as of 03-31-18Composition as of 03-31-18 % Assets
U.S. Stocks 45.8Non-U.S. Stocks 25.7Bonds 24.5Cash 2.8Other 1.2
Morningstar Style Box™ as of 03-31-18(EQ) ; 03-31-18(F-I)
LargeM
idSm
all
Value Blend Growth
HighM
edLow
Ltd Mod Ext
Top 10 Holdings as of 03-31-18 % Assets
T. Rowe Price New Income I 12.41T. Rowe Price Value I 12.35T. Rowe Price Growth Stock I 12.09T. Rowe Price Equity Index 500 I 11.18T. Rowe Price Overseas Stock I 7.02.......................................................................................................T. Rowe Price International Value Eq I 6.92T. Rowe Price International Stock I 6.15T. Rowe Price Emerging Markets Stock I 3.25T. Rowe Price Mid-Cap Growth I 3.23T. Rowe Price US Treasury Long-Term I 3.09
.......................................................................................................Total Number of Holdings 23Annual Turnover Ratio % 12.40Total Fund Assets ($mil) 4,600.08
Morningstar Sectors as of 03-31-18 % Fund S&P 500 %
h Cyclical 38.38 32.99........................................................................................................r Basic Materials 4.23 2.45t Consumer Cyclical 11.05 12.01y Financial Services 19.83 16.20u Real Estate 3.27 2.33
j Sensitive 36.57 42.69........................................................................................................i Communication Services 2.97 3.28o Energy 4.52 6.34p Industrials 10.97 10.18a Technology 18.11 22.89
k Defensive 25.03 24.33........................................................................................................s Consumer Defensive 8.06 7.39d Healthcare 13.78 13.99f Utilities 3.19 2.95
Principal Risks as of 03-31-18Credit and Counterparty, Foreign Securities, Loss of Money, Not FDIC Insured, Interest Rate, Equity Securities, Restricted/IlliquidSecurities, Management, Target Date, Small Cap, Mid-Cap
©2018 Morningstar, Inc., Morningstar Investment Profiles™ 312-696-6000. All rights reserved. The information contained herein: (1) is proprietary to Morningstar and/or its content providers; (2) maynot be copied or distributed and (3) is not warranted to be accurate, complete or timely. Neither Morningstar nor its content providers are responsible for any damages or losses arising from any use ofinformation. Past performance is no guarantee of future performance. Visit our investment website at www.morningstar.com ß
®

Release Date: 06-30-2018
T. Rowe Price Retirement I 2040 I TRPDX ..........................................................................................................................................................................................................................................................................................................................................BenchmarkMorningstar Lifetime Mod 2040 TR USD
Overall Morningstar Rating™ Morningstar Return Morningstar Risk. . .
Investment Objective & StrategyFrom investment’s prospectus
The investment seeks the highest total return over time consistent with an emphasis on both capital growth and income. The fund pursues its objective by investing in a diversified portfolio of other T. Rowe Price stock and bond funds that represent various asset classes and sectors. The fund's allocation between T. Rowe Price stock and bond funds will change over time in relation to its target retirement date. It is primarily designed for an investor who anticipates retiring at or about the target date and who plans to withdraw the value of the account in the fund gradually after retirement.
Fees and Expenses as of 10-01-17
Prospectus Net Expense Ratio 0.59%Total Annual Operating Expense 0.62%Maximum Sales Charge .12b-1 Fee .Redemption Fee/Term .
Waiver Data Type Exp. Date %
ExpenseRatio Contractual 09-30-19 0.03
Operations and Management
Fund Inception Date 09-29-15Portfolio Manager(s) Jerome A. Clark, CFA
Wyatt A. Lee, CFAName of Issuer T. Rowe PriceTelephone 800-638-8790Web Site www.troweprice.com
Benchmark Description: Morningstar Lifetime Mod 2040 TR USD
The index measures the performance of a portfolio of globalequities, bonds and traditional inflation hedges such ascommodities and TIPS. This portfolio is held in proportionsappropriate for a US investor who is about 30 years away fromretirement. The Moderate risk profile is for investors who arecomfortable with average exposure to equity market volatility.
Category Description: Target-Date 2040
Target-date portfolios provide diversified exposure to stocks,bonds, and cash for those investors who have a specific datein mind (in this case, the years 2036-2040) for retirement. Theseportfolios aim to provide investors with an optimal level of returnand risk, based solely on the target date. Management adjuststhe allocation among asset classes to more-conservative mixesas the target date approaches, following a preset glide path. Atarget-date portfolio is part of a series of funds offering multipleretirement dates to investors.
Allocation of Assets
050 40 30 20 10 -10 -20 -30
10080
60
40
200
Years Until Retirement
% AllocationBondsStocksCashOther
PerformanceTrailing Returns YTD 1 Year 3 Year 5 Year 10 Year Since Inception
Investment Return % 1.35 10.56 . . . 13.76Benchmark Return % 0.43 10.62 . . . 13.04Category Average % 0.30 9.56 . . . 11.89........................................................................................................................................................................................................................Morningstar Rating™ . . . . . .# of Funds in Category . . . . . .
Quarter End Returns as of 06-30-18 YTD 1 Year 3 Year 5 Year 10 Year Since Inception
Fund Return % 1.35 10.56 . . . 13.76Standardized Return % 1.35 10.56 . . . 13.76
Performance Disclosure: The performance data quoted represents past performance and does not guarantee futureresults. The investment return and principal value of an investment will fluctuate; thus an investor’s shares, whenredeemed, may be worth more or less than their original cost. Current performance may be lower or higher thanreturn data quoted herein. For performance data current to the most recent month-end please visit the website listedunder Operations and Management on this page.
Portfolio Analysis as of 03-31-18Composition as of 03-31-18 % Assets
U.S. Stocks 52.6Non-U.S. Stocks 30.2Bonds 13.6Cash 2.7Other 0.9
Morningstar Style Box™ as of 03-31-18(EQ) ; 03-31-18(F-I)
LargeM
idSm
all
Value Blend Growth
HighM
edLow
Ltd Mod Ext
Top 10 Holdings as of 03-31-18 % Assets
T. Rowe Price Value I 17.26T. Rowe Price Growth Stock I 16.77T. Rowe Price Overseas Stock I 8.20T. Rowe Price International Value Eq I 8.02T. Rowe Price New Income I 7.44.......................................................................................................T. Rowe Price Equity Index 500 I 7.25T. Rowe Price International Stock I 7.14T. Rowe Price Emerging Markets Stock I 3.77T. Rowe Price Mid-Cap Growth I 3.72T. Rowe Price Mid-Cap Value I 3.48
.......................................................................................................Total Number of Holdings 22Annual Turnover Ratio % 11.00Total Fund Assets ($mil) 3,535.01
Morningstar Sectors as of 03-31-18 % Fund S&P 500 %
h Cyclical 38.40 32.99........................................................................................................r Basic Materials 4.12 2.45t Consumer Cyclical 11.03 12.01y Financial Services 20.03 16.20u Real Estate 3.22 2.33
j Sensitive 36.39 42.69........................................................................................................i Communication Services 2.86 3.28o Energy 4.39 6.34p Industrials 10.92 10.18a Technology 18.22 22.89
k Defensive 25.21 24.33........................................................................................................s Consumer Defensive 7.93 7.39d Healthcare 13.97 13.99f Utilities 3.31 2.95
Principal Risks as of 03-31-18Credit and Counterparty, Foreign Securities, Loss of Money, Not FDIC Insured, Interest Rate, Equity Securities, Restricted/IlliquidSecurities, Management, Target Date, Small Cap, Mid-Cap
©2018 Morningstar, Inc., Morningstar Investment Profiles™ 312-696-6000. All rights reserved. The information contained herein: (1) is proprietary to Morningstar and/or its content providers; (2) maynot be copied or distributed and (3) is not warranted to be accurate, complete or timely. Neither Morningstar nor its content providers are responsible for any damages or losses arising from any use ofinformation. Past performance is no guarantee of future performance. Visit our investment website at www.morningstar.com ß
®

Release Date: 06-30-2018
T. Rowe Price Retirement I 2050 I TRPMX ..........................................................................................................................................................................................................................................................................................................................................BenchmarkMorningstar Lifetime Mod 2050 TR USD
Overall Morningstar Rating™ Morningstar Return Morningstar Risk. . .
Investment Objective & StrategyFrom investment’s prospectus
The investment seeks the highest total return over time consistent with an emphasis on both capital growth and income. The fund pursues its objective by investing in a diversified portfolio of other T. Rowe Price stock and bond funds that represent various asset classes and sectors. The fund's allocation between T. Rowe Price stock and bond funds will change over time in relation to its target retirement date. It is primarily designed for an investor who anticipates retiring at or about the target date and who plans to withdraw the value of the account in the fund gradually after retirement.
Fees and Expenses as of 10-01-17
Prospectus Net Expense Ratio 0.60%Total Annual Operating Expense 0.66%Maximum Sales Charge .12b-1 Fee .Redemption Fee/Term .
Waiver Data Type Exp. Date %
ExpenseRatio Contractual 09-30-19 0.06
Operations and Management
Fund Inception Date 09-29-15Portfolio Manager(s) Jerome A. Clark, CFA
Wyatt A. Lee, CFAName of Issuer T. Rowe PriceTelephone 800-638-8790Web Site www.troweprice.com
Benchmark Description: Morningstar Lifetime Mod 2050 TR USD
The index measures the performance of a portfolio of globalequities, bonds and traditional inflation hedges such ascommodities and TIPS. This portfolio is held in proportionsappropriate for a US investor who is about 40 years away fromretirement. The Moderate risk profile is for investors who arecomfortable with average exposure to equity market volatility.
Category Description: Target-Date 2050
Target-date portfolios provide diversified exposure to stocks,bonds, and cash for those investors who have a specific datein mind (in this case, the years 2046-2050) for retirement. Theseportfolios aim to provide investors with an optimal level of returnand risk, based solely on the target date. Management adjuststhe allocation among asset classes to more-conservative mixesas the target date approaches, following a preset glide path. Atarget-date portfolio is part of a series of funds offering multipleretirement dates to investors.
Allocation of Assets
050 40 30 20 10 -10 -20 -30
10080
60
40
200
Years Until Retirement
% AllocationBondsStocksCashOther
PerformanceTrailing Returns YTD 1 Year 3 Year 5 Year 10 Year Since Inception
Investment Return % 1.42 10.77 . . . 13.94Benchmark Return % 0.36 11.00 . . . 13.47Category Average % 0.38 10.22 . . . 12.51........................................................................................................................................................................................................................Morningstar Rating™ . . . . . .# of Funds in Category . . . . . .
Quarter End Returns as of 06-30-18 YTD 1 Year 3 Year 5 Year 10 Year Since Inception
Fund Return % 1.42 10.77 . . . 13.94Standardized Return % 1.42 10.77 . . . 13.94
Performance Disclosure: The performance data quoted represents past performance and does not guarantee futureresults. The investment return and principal value of an investment will fluctuate; thus an investor’s shares, whenredeemed, may be worth more or less than their original cost. Current performance may be lower or higher thanreturn data quoted herein. For performance data current to the most recent month-end please visit the website listedunder Operations and Management on this page.
Portfolio Analysis as of 03-31-18Composition as of 03-31-18 % Assets
U.S. Stocks 54.2Non-U.S. Stocks 31.3Bonds 11.1Cash 2.6Other 0.9
Morningstar Style Box™ as of 03-31-18(EQ) ; 03-31-18(F-I)
LargeM
idSm
all
Value Blend Growth
HighM
edLow
Ltd Mod Ext
Top 10 Holdings as of 03-31-18 % Assets
T. Rowe Price Value I 18.29T. Rowe Price Growth Stock I 17.86T. Rowe Price Overseas Stock I 8.50T. Rowe Price International Value Eq I 8.26T. Rowe Price International Stock I 7.37.......................................................................................................T. Rowe Price Equity Index 500 I 6.43T. Rowe Price New Income I 5.99T. Rowe Price Emerging Markets Stock I 3.99T. Rowe Price Mid-Cap Growth I 3.84T. Rowe Price Mid-Cap Value I 3.61
.......................................................................................................Total Number of Holdings 21Annual Turnover Ratio % 9.00Total Fund Assets ($mil) 1,967.91
Morningstar Sectors as of 03-31-18 % Fund S&P 500 %
h Cyclical 38.38 32.99........................................................................................................r Basic Materials 4.08 2.45t Consumer Cyclical 11.04 12.01y Financial Services 20.08 16.20u Real Estate 3.18 2.33
j Sensitive 36.37 42.69........................................................................................................i Communication Services 2.84 3.28o Energy 4.35 6.34p Industrials 10.91 10.18a Technology 18.27 22.89
k Defensive 25.24 24.33........................................................................................................s Consumer Defensive 7.92 7.39d Healthcare 14.00 13.99f Utilities 3.32 2.95
Principal Risks as of 03-31-18Credit and Counterparty, Foreign Securities, Loss of Money, Not FDIC Insured, Interest Rate, Equity Securities, Restricted/IlliquidSecurities, Management, Target Date, Small Cap, Mid-Cap
©2018 Morningstar, Inc., Morningstar Investment Profiles™ 312-696-6000. All rights reserved. The information contained herein: (1) is proprietary to Morningstar and/or its content providers; (2) maynot be copied or distributed and (3) is not warranted to be accurate, complete or timely. Neither Morningstar nor its content providers are responsible for any damages or losses arising from any use ofinformation. Past performance is no guarantee of future performance. Visit our investment website at www.morningstar.com ß
®

40

41

42

43

©2018 Massachusetts Mutual Life Insurance Company (MassMutual), Springfield, MA 01111-0001. All rights reserved. www.massmutual.com. RSD4004 C:RS-41859-00
MassMutual
PO Box 219062Kansas City, MO 64121-9062