Embed Size (px)
Citation preview
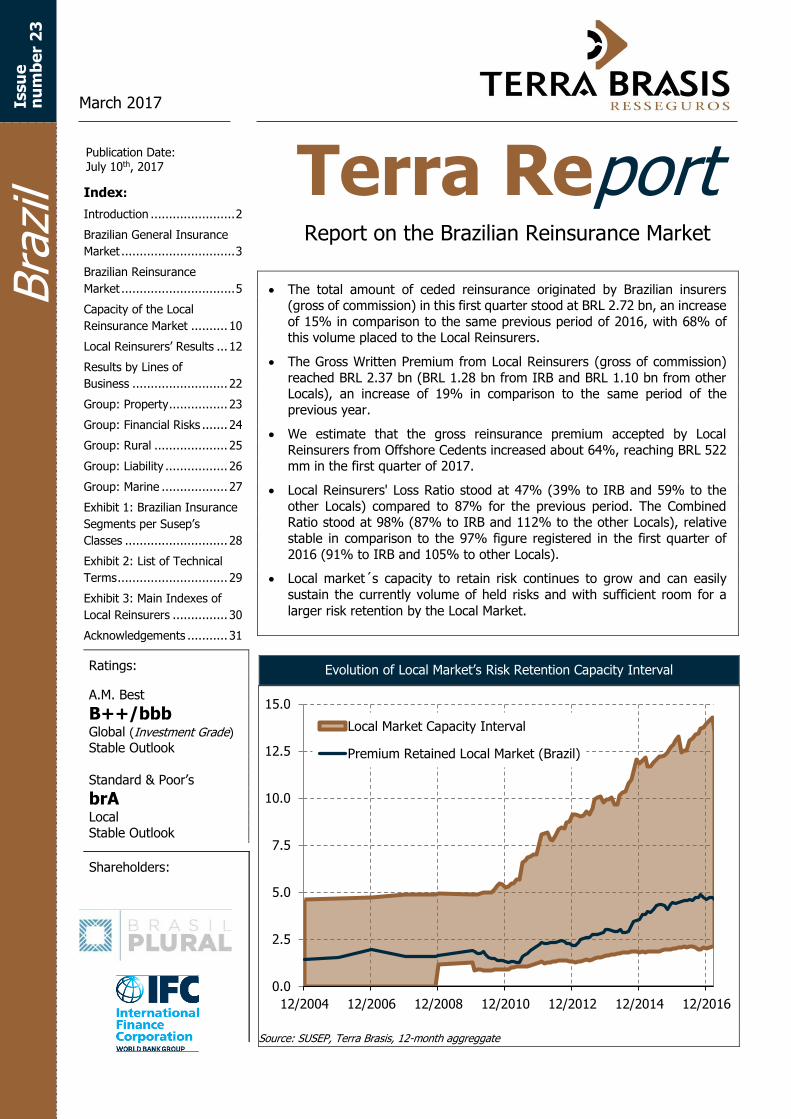
Evolution of Local Market’s Risk Retention Capacity Interval
Source: SUSEP, Terra Brasis, 12-month aggreggate
0.0
2.5
5.0
7.5
10.0
12.5
15.0
12/2004 12/2006 12/2008 12/2010 12/2012 12/2014 12/2016
Local Market Capacity Interval
Premium Retained Local Market (Brazil)
March 2017
Index:Terra Report........... 1
Introduction ....................... 2
Brazilian General Insurance
Market ............................... 3
Brazilian Reinsurance
Market ............................... 5
Capacity of the Local
Reinsurance Market .......... 10
Local Reinsurers’ Results ... 12
Results by Lines of
Business .......................... 22
Group: Property ................ 23
Group: Financial Risks ....... 24
Group: Rural .................... 25
Group: Liability ................. 26
Group: Marine .................. 27
Exhibit 1: Brazilian Insurance
Segments per Susep’s
Classes ............................ 28
Exhibit 2: List of Technical
Terms .............................. 29
Exhibit 3: Main Indexes of
Local Reinsurers ............... 30
Acknowledgements ........... 31
The total amount of ceded reinsurance originated by Brazilian insurers (gross of commission) in this first quarter stood at BRL 2.72 bn, an increase
of 15% in comparison to the same previous period of 2016, with 68% of this volume placed to the Local Reinsurers.
The Gross Written Premium from Local Reinsurers (gross of commission)
reached BRL 2.37 bn (BRL 1.28 bn from IRB and BRL 1.10 bn from other Locals), an increase of 19% in comparison to the same period of the
previous year.
We estimate that the gross reinsurance premium accepted by Local
Reinsurers from Offshore Cedents increased about 64%, reaching BRL 522 mm in the first quarter of 2017.
Local Reinsurers' Loss Ratio stood at 47% (39% to IRB and 59% to the
other Locals) compared to 87% for the previous period. The Combined Ratio stood at 98% (87% to IRB and 112% to the other Locals), relative
stable in comparison to the 97% figure registered in the first quarter of
2016 (91% to IRB and 105% to other Locals).
Local market´s capacity to retain risk continues to grow and can easily
sustain the currently volume of held risks and with sufficient room for a
larger risk retention by the Local Market.
Ratings: A.M. Best
B++/bbb Global (Investment Grade)
Stable Outlook
Standard & Poor’s
brA Local Stable Outlook Shareholders: : Shareholders:
Terra Report Report on the Brazilian Reinsurance Market
Issu
e
nu
mb
er
23
Publication Date: July 10th, 2017
Bra
zil
March 2017 Terra Report: Brazil Terra Brasis Resseguros
2
Introduction
Dear Reader,
This edition of Terra Report analyses the Brazilian reinsurance market at 2017 first quarter.
We also updated our study about the local market’s risk retention capacity interval, published the first time at Terra Report’s fourth edition, from December 2011. The study uses Brazilian regulation to estimate a floor to the local market’s risk retention capacity and the relation between shareholder’s equity and risk to estimate a ceiling.
The result is interesting in a number of aspects. Local Market’s risk retention capacity has continued to grow over the years, with the arrival of new companies and by the increase in capital of established reinsurers. As we reach the tenth anniversary of the opening of the market to private sector companies, the shareholder’s equity of the new reinsurers, in aggregate, is currently close to that of the IRB. Such achievement should not be undervalued.
We estimate the local market’s risk retention capacity laying in about BRL 13.5 bn while the current retention is BRL 5.5 bn, from which BRL 4.6 bn comes from Brazil-based insurers and BRL 0.9 bn comes from offshore insurers. Therefore, there is significant space for a larger retention by the Local Market. In addition, as previously mentioned, the Brazilian Local Market is in excellent position to increase its participation in risks originated from abroad, therefore exporting reinsurance.
The study also shows that the Local Market’s retention level has increased. Between 2011 and 2014 the market retained between 30% and 40% of the ceded premium from insurers based in Brazil. In the last two years, the retention level increased to between 40% and 50%. This, in our understanding, is another signal that the Brazilian Market is maturing, as the reinsurers are more comfortable in increasing their risk retention.
In our usual market analysis, we note that the premium from offshore cedents continues to grow by an accelerated pace. The reinsurance premium (gross of commission) originated from offshore cedents reached BRL 1.6 bn for the 12 months period ending in March of 2017, a volume 25% greater than that of the previous 12 month.
Moreover, Local Reinsurer’s loss ratio continued to decrease. For the 12 month period ending in March 2017 it stood at 56%, in comparison to 66% of December and 101% of March 2016. This decrease in the loss ratio is partially offset by an increase in retrocession costs. Nevertheless, the Combined Ratio shows improvement, reaching 94% for the 12 month period ending in March 2017. This is the best mark since mid-2011. Considering that the economic and political short-term conditions in Brazil continues to be challenging, these results are quite positive.
Enjoy your reading, Rodrigo Botti, ARe General Director Terra Brasis Resseguros
March 2017 Terra Report: Brazil Terra Brasis Resseguros
3
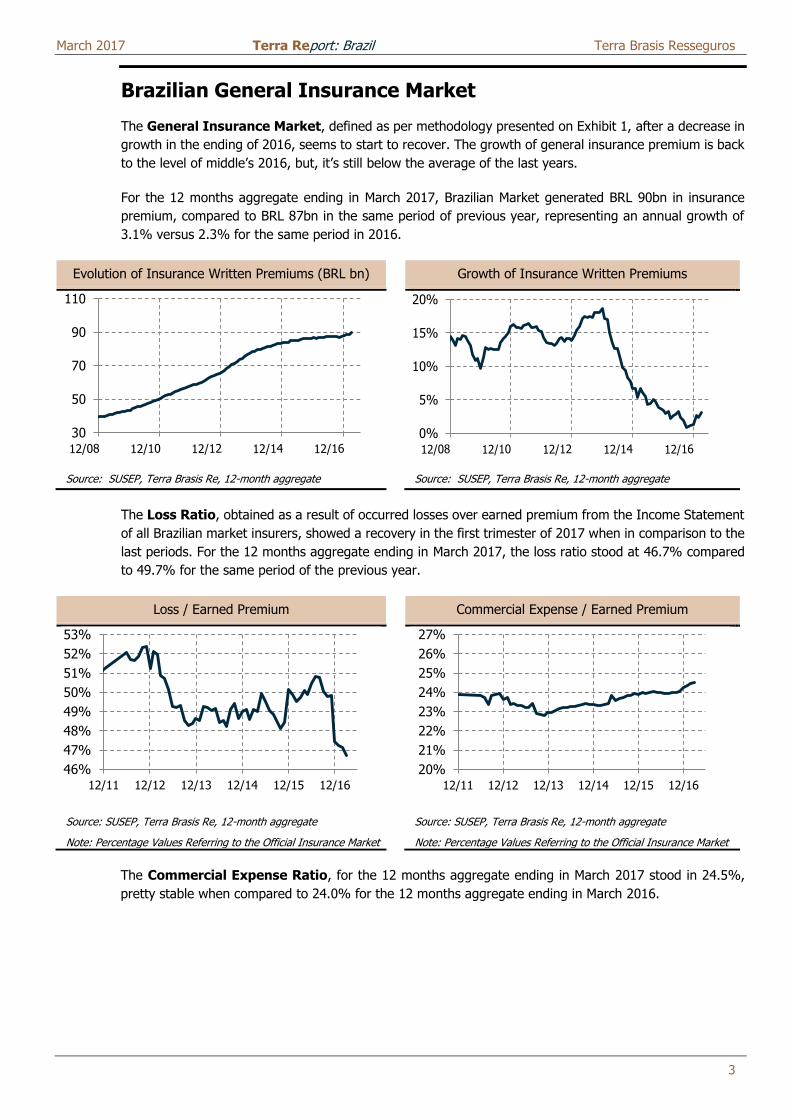
Brazilian General Insurance Market
The General Insurance Market, defined as per methodology presented on Exhibit 1, after a decrease in
growth in the ending of 2016, seems to start to recover. The growth of general insurance premium is back
to the level of middle’s 2016, but, it’s still below the average of the last years.
For the 12 months aggregate ending in March 2017, Brazilian Market generated BRL 90bn in insurance
premium, compared to BRL 87bn in the same period of previous year, representing an annual growth of
3.1% versus 2.3% for the same period in 2016.
Evolution of Insurance Written Premiums (BRL bn) Growth of Insurance Written Premiums
Source: SUSEP, Terra Brasis Re, 12-month aggregate Source: SUSEP, Terra Brasis Re, 12-month aggregate
The Loss Ratio, obtained as a result of occurred losses over earned premium from the Income Statement
of all Brazilian market insurers, showed a recovery in the first trimester of 2017 when in comparison to the
last periods. For the 12 months aggregate ending in March 2017, the loss ratio stood at 46.7% compared
to 49.7% for the same period of the previous year.
Loss / Earned Premium Commercial Expense / Earned Premium
Source: SUSEP, Terra Brasis Re, 12-month aggregate
Note: Percentage Values Referring to the Official Insurance Market
Source: SUSEP, Terra Brasis Re, 12-month aggregate
Note: Percentage Values Referring to the Official Insurance Market
The Commercial Expense Ratio, for the 12 months aggregate ending in March 2017 stood in 24.5%,
pretty stable when compared to 24.0% for the 12 months aggregate ending in March 2016.
30
50
70
90
110
0%
5%
10%
15%
20%
46%
47%
48%
49%
50%
51%
52%
53%
12/11 12/12 12/13 12/14 12/15 12/16
20%
21%
22%
23%
24%
25%
26%
27%
12/11 12/12 12/13 12/14 12/15 12/16
March 2017 Terra Report: Brazil Terra Brasis Resseguros
4
(Administrative, Tax and Other Expenses)
/Earned Premium
Reinsurance Result / Earned Premium
Source: SUSEP, Terra Brasis Re, 12-month aggregate Note: Percentage Values Referring to the Official Insurance Market
Source: SUSEP, Terra Brasis Re, 12-month aggregate Note: Percentage Values Referring to the Official Insurance Market
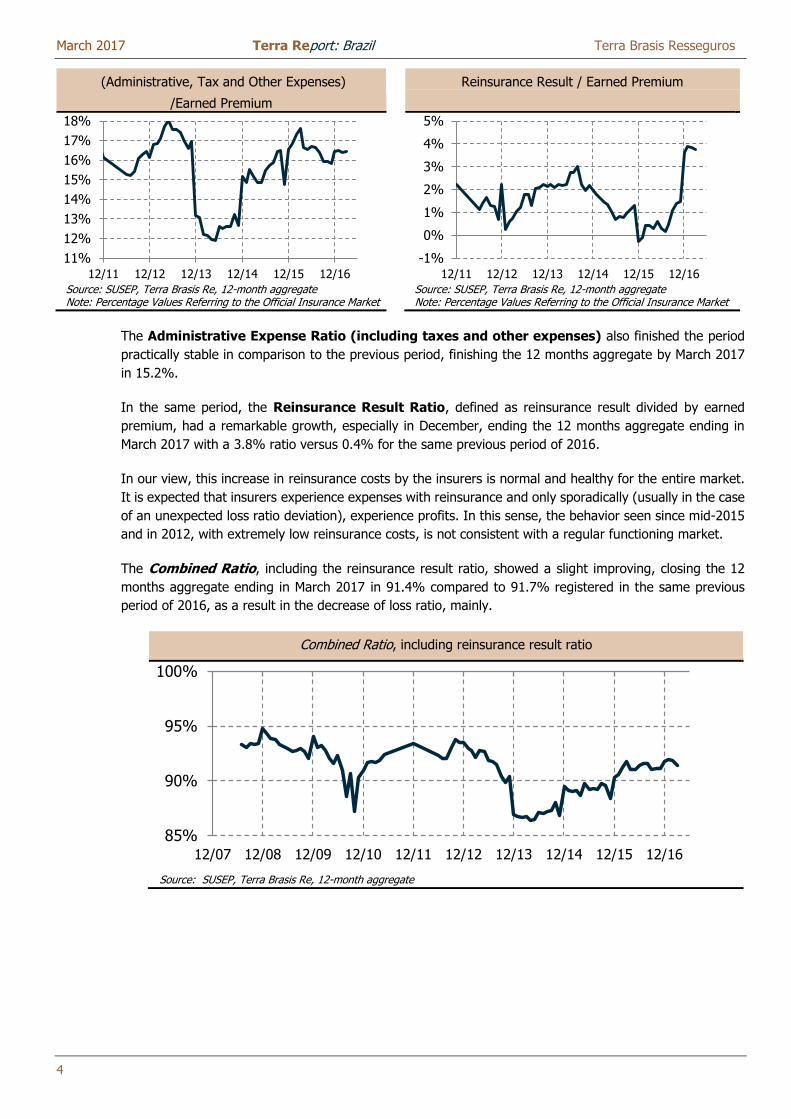
The Administrative Expense Ratio (including taxes and other expenses) also finished the period
practically stable in comparison to the previous period, finishing the 12 months aggregate by March 2017
in 15.2%.
In the same period, the Reinsurance Result Ratio, defined as reinsurance result divided by earned
premium, had a remarkable growth, especially in December, ending the 12 months aggregate ending in
March 2017 with a 3.8% ratio versus 0.4% for the same previous period of 2016.
In our view, this increase in reinsurance costs by the insurers is normal and healthy for the entire market.
It is expected that insurers experience expenses with reinsurance and only sporadically (usually in the case
of an unexpected loss ratio deviation), experience profits. In this sense, the behavior seen since mid-2015
and in 2012, with extremely low reinsurance costs, is not consistent with a regular functioning market.
The Combined Ratio, including the reinsurance result ratio, showed a slight improving, closing the 12
months aggregate ending in March 2017 in 91.4% compared to 91.7% registered in the same previous
period of 2016, as a result in the decrease of loss ratio, mainly.
Combined Ratio, including reinsurance result ratio
Source: SUSEP, Terra Brasis Re, 12-month aggregate
11%
12%
13%
14%
15%
16%
17%
18%
12/11 12/12 12/13 12/14 12/15 12/16
-1%
0%
1%
2%
3%
4%
5%
12/11 12/12 12/13 12/14 12/15 12/16
85%
90%
95%
100%
12/07 12/08 12/09 12/10 12/11 12/12 12/13 12/14 12/15 12/16
March 2017 Terra Report: Brazil Terra Brasis Resseguros
5
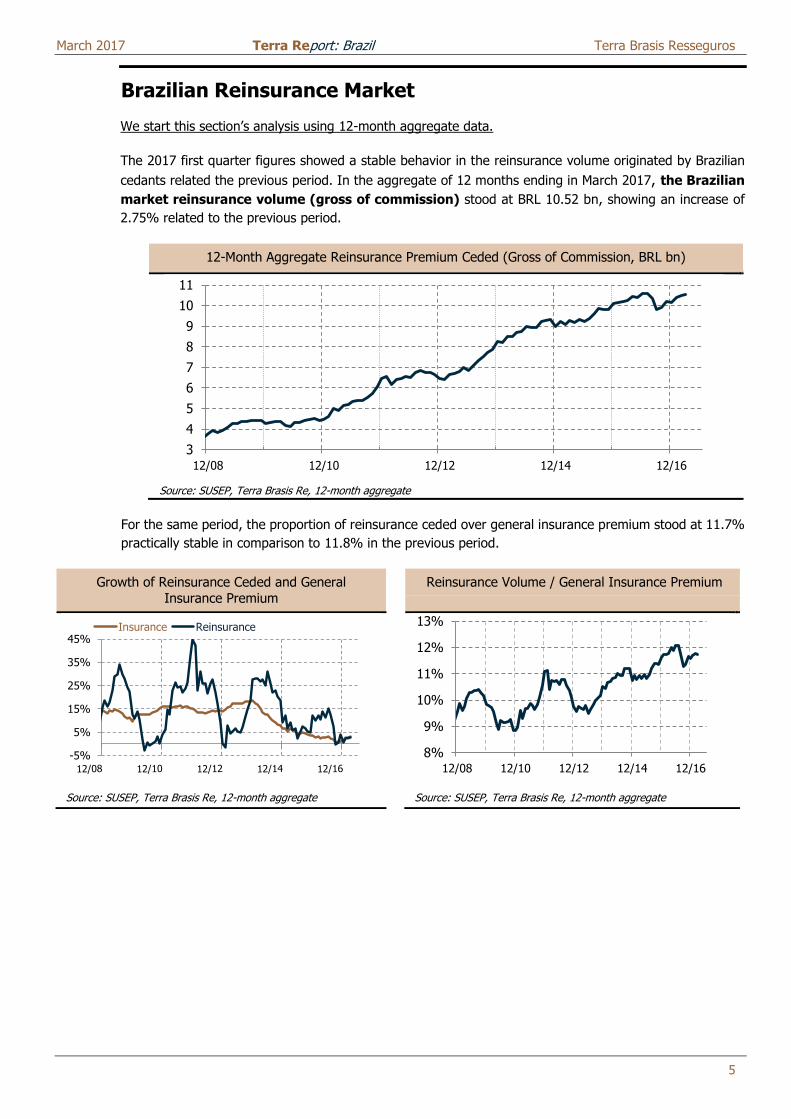
Brazilian Reinsurance Market
We start this section’s analysis using 12-month aggregate data.
The 2017 first quarter figures showed a stable behavior in the reinsurance volume originated by Brazilian
cedants related the previous period. In the aggregate of 12 months ending in March 2017, the Brazilian
market reinsurance volume (gross of commission) stood at BRL 10.52 bn, showing an increase of
2.75% related to the previous period.
12-Month Aggregate Reinsurance Premium Ceded (Gross of Commission, BRL bn)
Source: SUSEP, Terra Brasis Re, 12-month aggregate
For the same period, the proportion of reinsurance ceded over general insurance premium stood at 11.7%
practically stable in comparison to 11.8% in the previous period.
Growth of Reinsurance Ceded and General
Insurance Premium
Reinsurance Volume / General Insurance Premium
Source: SUSEP, Terra Brasis Re, 12-month aggregate Source: SUSEP, Terra Brasis Re, 12-month aggregate
3
4
5
6
7
8
9
10
11
12/08 12/10 12/12 12/14 12/16
-5%
5%
15%
25%
35%
45%Insurance Reinsurance
8%
9%
10%
11%
12%
13%
12/08 12/10 12/12 12/14 12/16
March 2017 Terra Report: Brazil Terra Brasis Resseguros
6
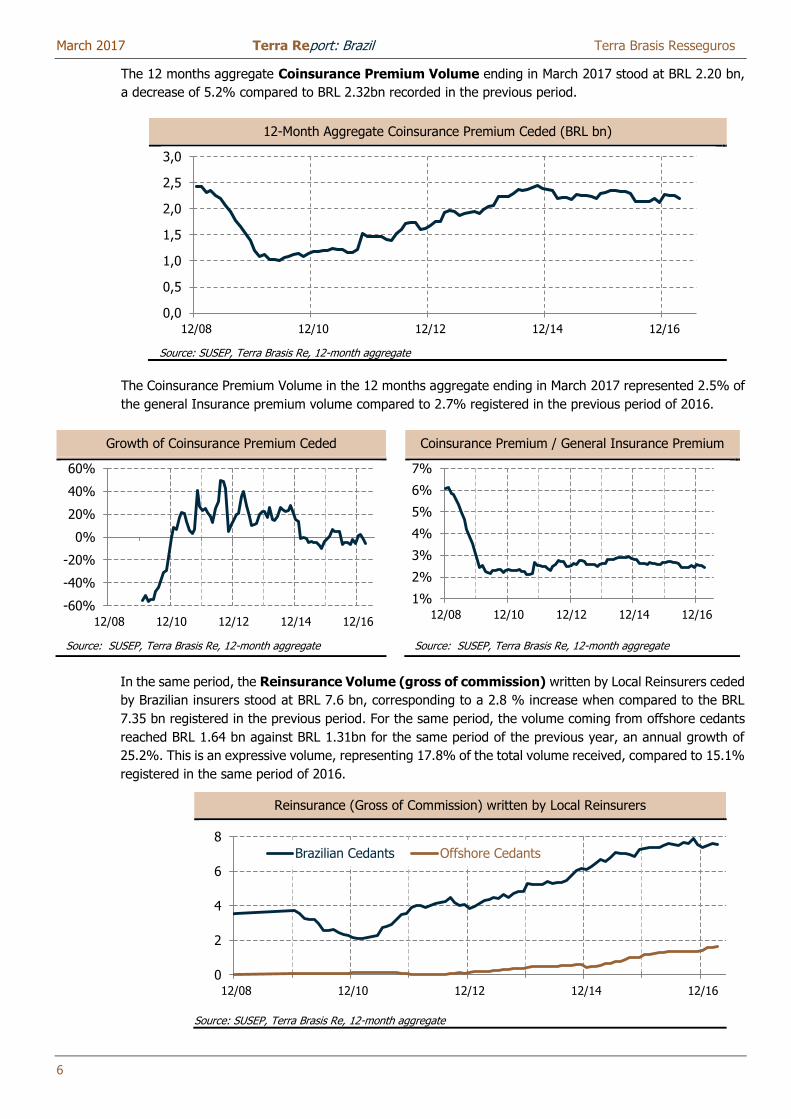
The 12 months aggregate Coinsurance Premium Volume ending in March 2017 stood at BRL 2.20 bn,
a decrease of 5.2% compared to BRL 2.32bn recorded in the previous period.
12-Month Aggregate Coinsurance Premium Ceded (BRL bn)
Source: SUSEP, Terra Brasis Re, 12-month aggregate
The Coinsurance Premium Volume in the 12 months aggregate ending in March 2017 represented 2.5% of
the general Insurance premium volume compared to 2.7% registered in the previous period of 2016.
Growth of Coinsurance Premium Ceded Coinsurance Premium / General Insurance Premium
Source: SUSEP, Terra Brasis Re, 12-month aggregate Source: SUSEP, Terra Brasis Re, 12-month aggregate
In the same period, the Reinsurance Volume (gross of commission) written by Local Reinsurers ceded
by Brazilian insurers stood at BRL 7.6 bn, corresponding to a 2.8 % increase when compared to the BRL
7.35 bn registered in the previous period. For the same period, the volume coming from offshore cedants
reached BRL 1.64 bn against BRL 1.31bn for the same period of the previous year, an annual growth of
25.2%. This is an expressive volume, representing 17.8% of the total volume received, compared to 15.1%
registered in the same period of 2016.
Reinsurance (Gross of Commission) written by Local Reinsurers
Source: SUSEP, Terra Brasis Re, 12-month aggregate
0,0
0,5
1,0
1,5
2,0
2,5
3,0
12/08 12/10 12/12 12/14 12/16
-60%
-40%
-20%
0%
20%
40%
60%
12/08 12/10 12/12 12/14 12/16
1%
2%
3%
4%
5%
6%
7%
12/08 12/10 12/12 12/14 12/16
0
2
4
6
8
12/08 12/10 12/12 12/14 12/16
Brazilian Cedants Offshore Cedants
March 2017 Terra Report: Brazil Terra Brasis Resseguros
7
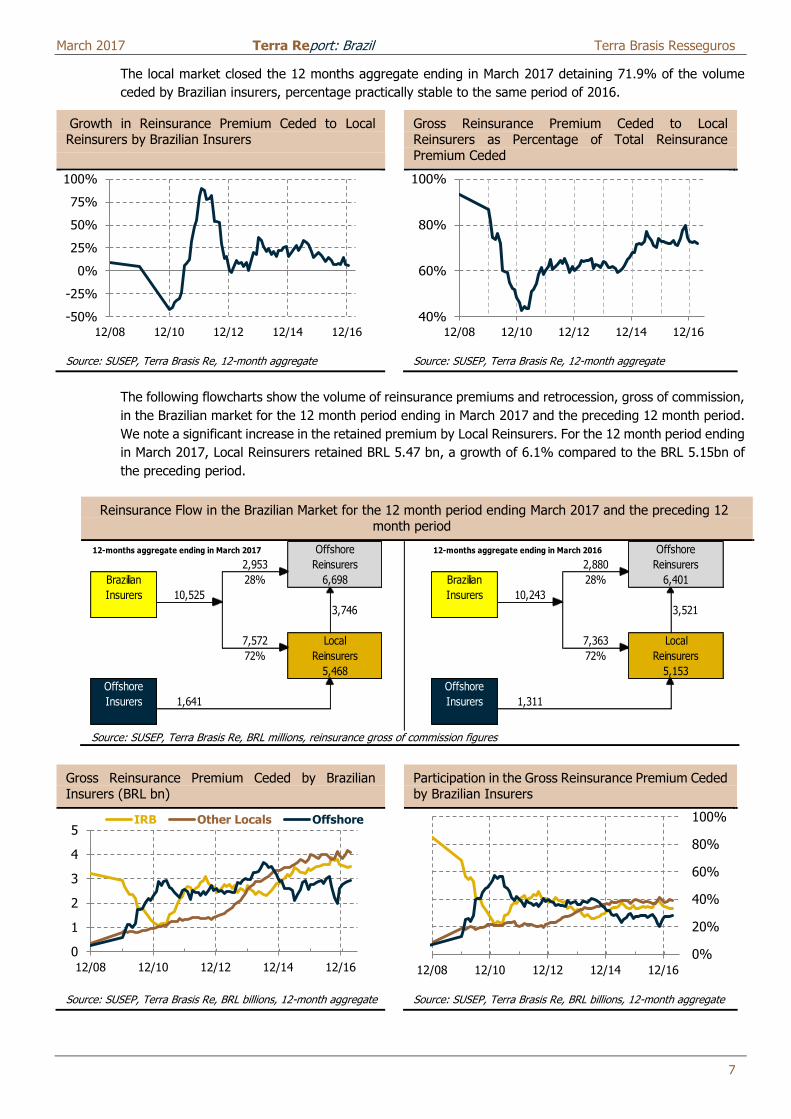
The local market closed the 12 months aggregate ending in March 2017 detaining 71.9% of the volume
ceded by Brazilian insurers, percentage practically stable to the same period of 2016.
Growth in Reinsurance Premium Ceded to Local Reinsurers by Brazilian Insurers
Gross Reinsurance Premium Ceded to Local Reinsurers as Percentage of Total Reinsurance Premium Ceded
Source: SUSEP, Terra Brasis Re, 12-month aggregate Source: SUSEP, Terra Brasis Re, 12-month aggregate
The following flowcharts show the volume of reinsurance premiums and retrocession, gross of commission,
in the Brazilian market for the 12 month period ending in March 2017 and the preceding 12 month period.
We note a significant increase in the retained premium by Local Reinsurers. For the 12 month period ending
in March 2017, Local Reinsurers retained BRL 5.47 bn, a growth of 6.1% compared to the BRL 5.15bn of
the preceding period.
Reinsurance Flow in the Brazilian Market for the 12 month period ending March 2017 and the preceding 12 month period
Source: SUSEP, Terra Brasis Re, BRL millions, reinsurance gross of commission figures
Gross Reinsurance Premium Ceded by Brazilian Insurers (BRL bn)
Participation in the Gross Reinsurance Premium Ceded by Brazilian Insurers
Source: SUSEP, Terra Brasis Re, BRL billions, 12-month aggregate Source: SUSEP, Terra Brasis Re, BRL billions, 12-month aggregate
-50%
-25%
0%
25%
50%
75%
100%
12/08 12/10 12/12 12/14 12/16
40%
60%
80%
100%
12/08 12/10 12/12 12/14 12/16
12-months aggregate ending in March 2017 12-months aggregate ending in March 2016
2,953 2,880
Brazilian 28% Brazilian 28%
Insurers 10,525 Insurers 10,243
3,746 3,521
7,572 7,363
72% 72%
Offshore Offshore
Insurers 1,641 Insurers 1,311
Offshore
Reinsurers
6,401
Local
Reinsurers
5,153
Offshore
Reinsurers
6,698
Local
Reinsurers
5,468
0
1
2
3
4
5
12/08 12/10 12/12 12/14 12/16
IRB Other Locals Offshore
0%
20%
40%
60%
80%
100%
12/08 12/10 12/12 12/14 12/16
March 2017 Terra Report: Brazil Terra Brasis Resseguros
8
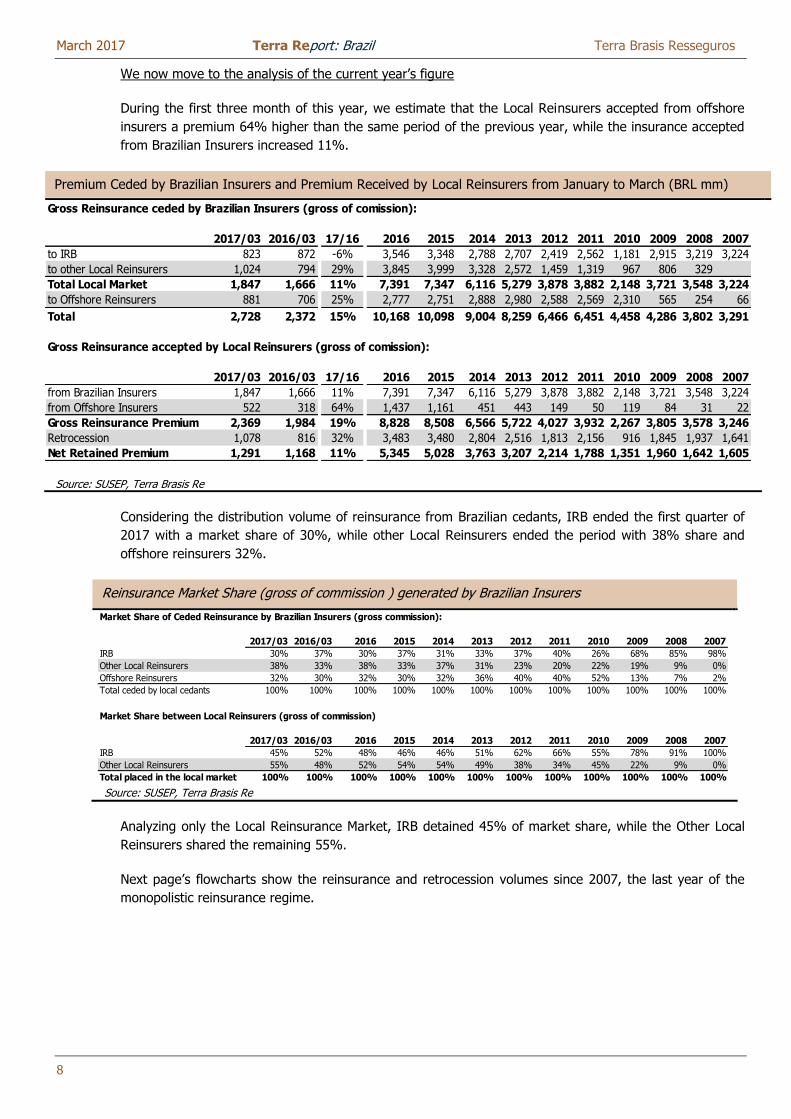
We now move to the analysis of the current year’s figure
During the first three month of this year, we estimate that the Local Reinsurers accepted from offshore
insurers a premium 64% higher than the same period of the previous year, while the insurance accepted
from Brazilian Insurers increased 11%.
Premium Ceded by Brazilian Insurers and Premium Received by Local Reinsurers from January to March (BRL mm)
Source: SUSEP, Terra Brasis Re
Considering the distribution volume of reinsurance from Brazilian cedants, IRB ended the first quarter of
2017 with a market share of 30%, while other Local Reinsurers ended the period with 38% share and
offshore reinsurers 32%.
Reinsurance Market Share (gross of commission ) generated by Brazilian Insurers
Source: SUSEP, Terra Brasis Re
Analyzing only the Local Reinsurance Market, IRB detained 45% of market share, while the Other Local
Reinsurers shared the remaining 55%.
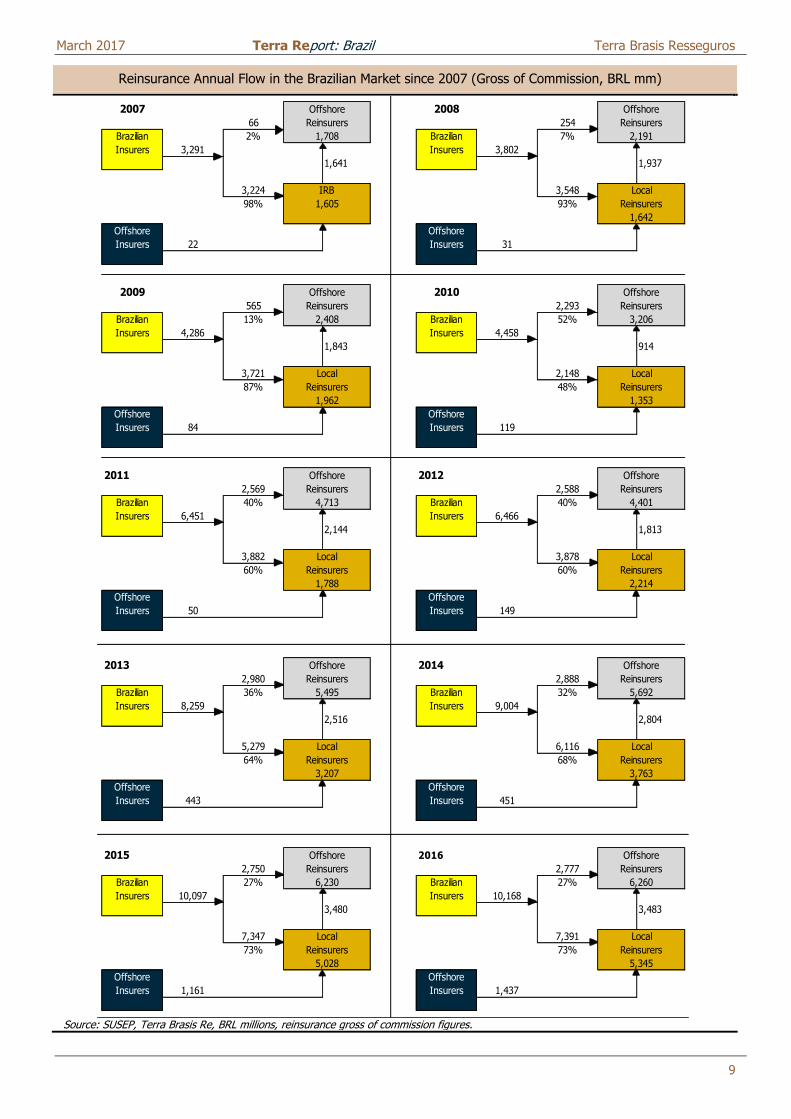
Next page’s flowcharts show the reinsurance and retrocession volumes since 2007, the last year of the
monopolistic reinsurance regime.
Gross Reinsurance ceded by Brazilian Insurers (gross of comission):
2017/03 2016/03 17/16 2016 2015 2014 2013 2012 2011 2010 2009 2008 2007
to IRB 823 872 -6% 3,546 3,348 2,788 2,707 2,419 2,562 1,181 2,915 3,219 3,224
to other Local Reinsurers 1,024 794 29% 3,845 3,999 3,328 2,572 1,459 1,319 967 806 329
Total Local Market 1,847 1,666 11% 7,391 7,347 6,116 5,279 3,878 3,882 2,148 3,721 3,548 3,224
to Offshore Reinsurers 881 706 25% 2,777 2,751 2,888 2,980 2,588 2,569 2,310 565 254 66
Total 2,728 2,372 15% 10,168 10,098 9,004 8,259 6,466 6,451 4,458 4,286 3,802 3,291
Gross Reinsurance accepted by Local Reinsurers (gross of comission):
2017/03 2016/03 17/16 2016 2015 2014 2013 2012 2011 2010 2009 2008 2007
from Brazilian Insurers 1,847 1,666 11% 7,391 7,347 6,116 5,279 3,878 3,882 2,148 3,721 3,548 3,224
from Offshore Insurers 522 318 64% 1,437 1,161 451 443 149 50 119 84 31 22
Gross Reinsurance Premium 2,369 1,984 19% 8,828 8,508 6,566 5,722 4,027 3,932 2,267 3,805 3,578 3,246
Retrocession 1,078 816 32% 3,483 3,480 2,804 2,516 1,813 2,156 916 1,845 1,937 1,641
Net Retained Premium 1,291 1,168 11% 5,345 5,028 3,763 3,207 2,214 1,788 1,351 1,960 1,642 1,605
Market Share of Ceded Reinsurance by Brazilian Insurers (gross commission):
2017/03 2016/03 2016 2015 2014 2013 2012 2011 2010 2009 2008 2007
IRB 30% 37% 30% 37% 31% 33% 37% 40% 26% 68% 85% 98%
Other Local Reinsurers 38% 33% 38% 33% 37% 31% 23% 20% 22% 19% 9% 0%
Offshore Reinsurers 32% 30% 32% 30% 32% 36% 40% 40% 52% 13% 7% 2%
Total ceded by local cedants 100% 100% 100% 100% 100% 100% 100% 100% 100% 100% 100% 100%
Market Share between Local Reinsurers (gross of commission)
2017/03 2016/03 2016 2015 2014 2013 2012 2011 2010 2009 2008 2007
IRB 45% 52% 48% 46% 46% 51% 62% 66% 55% 78% 91% 100%
Other Local Reinsurers 55% 48% 52% 54% 54% 49% 38% 34% 45% 22% 9% 0%
Total placed in the local market 100% 100% 100% 100% 100% 100% 100% 100% 100% 100% 100% 100%
March 2017 Terra Report: Brazil Terra Brasis Resseguros
9
Reinsurance Annual Flow in the Brazilian Market since 2007 (Gross of Commission, BRL mm)
Source: SUSEP, Terra Brasis Re, BRL millions, reinsurance gross of commission figures.
2007 2008
66 254
Brazilian 2% Brazilian 7%
Insurers 3,291 Insurers 3,802
1,641 1,937
3,224 3,548
98% 93%
Offshore Offshore
Insurers 22 Insurers 31
2009 2010
565 2,293
Brazilian 13% Brazilian 52%
Insurers 4,286 Insurers 4,458
1,843 914
3,721 2,148
87% 48%
Offshore Offshore
Insurers 84 Insurers 119
2011 2012
2,569 2,588
Brazilian 40% Brazilian 40%
Insurers 6,451 Insurers 6,466
2,144 1,813
3,882 3,878
60% 60%
Offshore Offshore
Insurers 50 Insurers 149
2013 2014
2,980 2,888
Brazilian 36% Brazilian 32%
Insurers 8,259 Insurers 9,004
2,516 2,804
5,279 6,116
64% 68%
Offshore Offshore
Insurers 443 Insurers 451
2015 2016
2,750 2,777
Brazilian 27% Brazilian 27%
Insurers 10,097 Insurers 10,168
3,480 3,483
7,347 7,391
73% 73%
Offshore Offshore
Insurers 1,161 Insurers 1,437
Local Local
Reinsurers Reinsurers
5,028 5,345
Offshore
Reinsurers Reinsurers
6,230 6,260
Offshore
Reinsurers
5,692
Local
Reinsurers
3,763
Offshore
Reinsurers
Local
Reinsurers
3,207
5,495
Offshore
Offshore
1,642
Offshore Offshore
Reinsurers Reinsurers
2,408 3,206
Local
Reinsurers
1,962 1,353
Local
Reinsurers
Offshore
Reinsurers Reinsurers
1,708 2,191
IRB Local
1,605 Reinsurers
2,214
Offshore
ReinsurersReinsurers
Offshore
Local
1,788
Reinsurers
4,713 4,401
Local
Reinsurers
March 2017 Terra Report: Brazil Terra Brasis Resseguros
10
Capacity of the Local Reinsurance Market
In this section we updated a study initially published in our Edition number 4 of Terra Report from December
2011, at which we estimated the capacity of retention by the Local Reinsurance Market. In this study we
estimated a maximum limit and a minimum theoretical limit for the local market withholding capacity.
Firstly, we studied a minimum theoretical limit for the local market, resulting from the legislation that has
been introduced in 2007, with the opening of the reinsurance market for private companies.
In a short and simplified manner, the legislation made current in 2007 stipulated that, during 2008, 60% of
the reinsurance premium generated by Brazilian insurers should be offered to the local market, with this limit
being reduced to 40% by 2009.
At the end of 2010 and beginning of 2011, due to misbehavior of some players that were no compatible to
the regulatory principles, there was a change in the legislation. The mechanism of the offer demanding
changed to a mandatory placement of 40%, limiting the intra group operations (operations between the
subsidiaries companies in Brazil and their headquarters abroad) to a 20% of each cession.
In 2015, a new regulatory adjustment has been made, establishing that by the beginning of 2017 the market
should return to the framework of 40%’s preferential offer and, until 2020, the restrictions made in 2010/2011
would be gradually reduced.
At the same time, the legislation keeps demanding that the Local Reinsurers must retain at least 50% of the
current year written volume. This demand is necessary in order to prevent the local market to become just
an intermediary, a “fronting company” in a technical way, which in this case would go against the basic
principles that guides the foster of a local insurance and reinsurance market.
In the update of this study was necessary one more assumption. Using the available data in SES/SUSEP
system, we know the reinsurance premium division of the Local Reinsurers between Brazilian insurers and
Offshore insurers (currently about 15% of the premium that the Local Reinsurers accept are from abroad
companies). However, we don’t have the retrocession divided by these two groups. We assume that the
Local Reinsurers use the same politic for retrocession and retention for premium accepted by Brazilian
Insurers and Offshore Insurers.
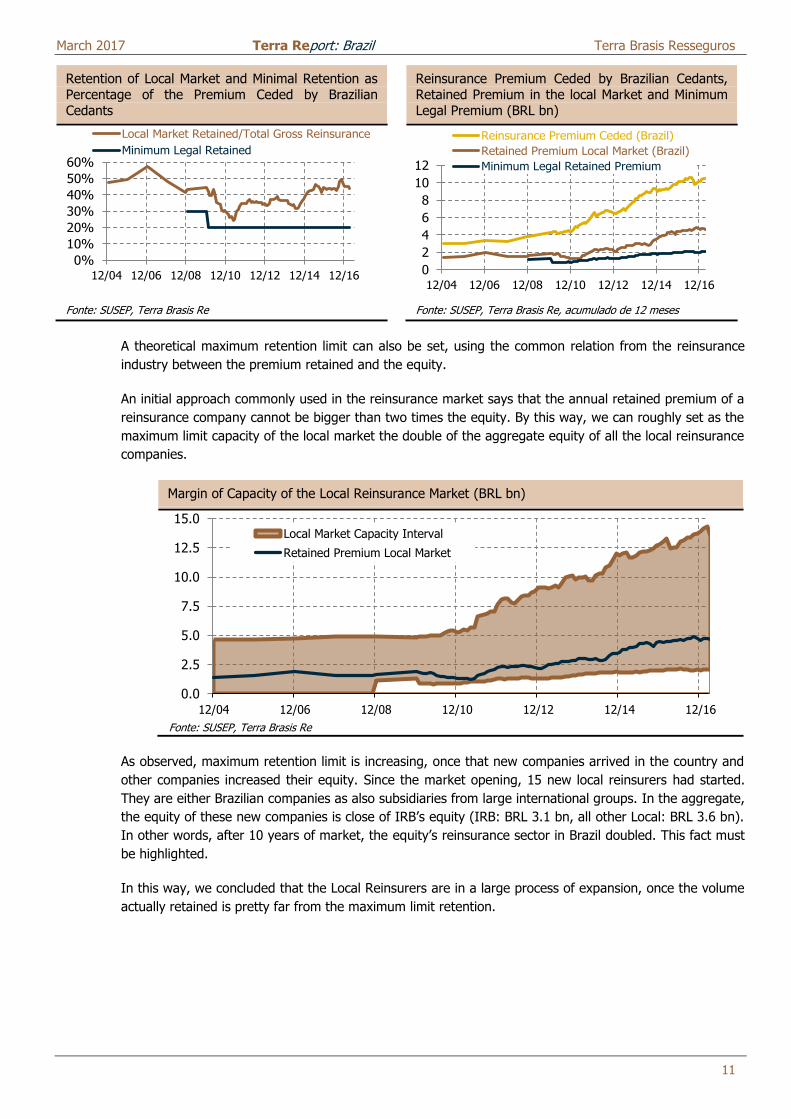
By this way, we show by the blue line of the left chart below an estimative of minimum retention of the local
market demanded by the Legislation of 30% (60% preferential offer multiplied by 50% of minimum retention)
in 2008 and of 20% (40% of preferential offer multiplied by 50% of minimum retention) since then. This
limit is slightly lower, once that we are ignoring in the graphic the fact that this maximum retrocession
restriction of 50% doesn’t apply to some Lines of Business, such as Financial Risks and Rural.
As shown in the charts below, for the 12 month aggregate ending in March of 2017, we estimate that the
local market retained, after retrocession, BRL 4.6 bn – close to 44% of the ceded premium from the Brazilian
insurers. This percentage of retention has been increased over the last years, and now is getting closer the
level that the market used to work in the period of IRB’s monopoly and also, in a general way, the global
market level. In general terms, reinsurance companies retain around 50% to 60% of the written premium.
The fact that the Local Reinsurers increased their retention is a positive signal of the development of the
market.
March 2017 Terra Report: Brazil Terra Brasis Resseguros
11
Retention of Local Market and Minimal Retention as Percentage of the Premium Ceded by Brazilian Cedants
Reinsurance Premium Ceded by Brazilian Cedants, Retained Premium in the local Market and Minimum Legal Premium (BRL bn)
Fonte: SUSEP, Terra Brasis Re Fonte: SUSEP, Terra Brasis Re, acumulado de 12 meses
A theoretical maximum retention limit can also be set, using the common relation from the reinsurance
industry between the premium retained and the equity.
An initial approach commonly used in the reinsurance market says that the annual retained premium of a
reinsurance company cannot be bigger than two times the equity. By this way, we can roughly set as the
maximum limit capacity of the local market the double of the aggregate equity of all the local reinsurance
companies.
Margin of Capacity of the Local Reinsurance Market (BRL bn)
Fonte: SUSEP, Terra Brasis Re
As observed, maximum retention limit is increasing, once that new companies arrived in the country and
other companies increased their equity. Since the market opening, 15 new local reinsurers had started.
They are either Brazilian companies as also subsidiaries from large international groups. In the aggregate,
the equity of these new companies is close of IRB’s equity (IRB: BRL 3.1 bn, all other Local: BRL 3.6 bn).
In other words, after 10 years of market, the equity’s reinsurance sector in Brazil doubled. This fact must
be highlighted.
In this way, we concluded that the Local Reinsurers are in a large process of expansion, once the volume
actually retained is pretty far from the maximum limit retention.
0%
10%
20%
30%
40%
50%
60%
12/04 12/06 12/08 12/10 12/12 12/14 12/16
Local Market Retained/Total Gross Reinsurance
Minimum Legal Retained
0
2
4
6
8
10
12
12/04 12/06 12/08 12/10 12/12 12/14 12/16
Reinsurance Premium Ceded (Brazil)
Retained Premium Local Market (Brazil)
Minimum Legal Retained Premium
0.0
2.5
5.0
7.5
10.0
12.5
15.0
12/04 12/06 12/08 12/10 12/12 12/14 12/16
Local Market Capacity Interval
Retained Premium Local Market
March 2017 Terra Report: Brazil Terra Brasis Resseguros
12
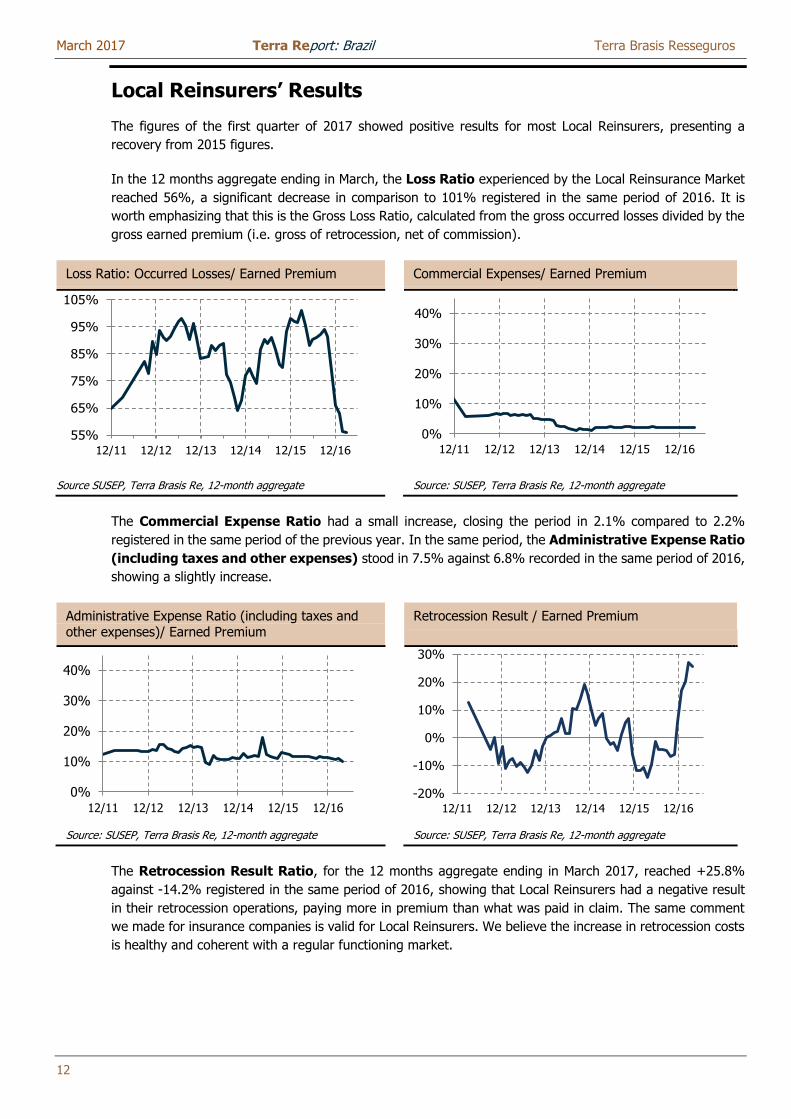
Local Reinsurers’ Results
The figures of the first quarter of 2017 showed positive results for most Local Reinsurers, presenting a
recovery from 2015 figures.
In the 12 months aggregate ending in March, the Loss Ratio experienced by the Local Reinsurance Market
reached 56%, a significant decrease in comparison to 101% registered in the same period of 2016. It is
worth emphasizing that this is the Gross Loss Ratio, calculated from the gross occurred losses divided by the
gross earned premium (i.e. gross of retrocession, net of commission).
Loss Ratio: Occurred Losses/ Earned Premium Commercial Expenses/ Earned Premium
Source SUSEP, Terra Brasis Re, 12-month aggregate Source: SUSEP, Terra Brasis Re, 12-month aggregate
The Commercial Expense Ratio had a small increase, closing the period in 2.1% compared to 2.2%
registered in the same period of the previous year. In the same period, the Administrative Expense Ratio
(including taxes and other expenses) stood in 7.5% against 6.8% recorded in the same period of 2016,
showing a slightly increase.
Administrative Expense Ratio (including taxes and other expenses)/ Earned Premium
Retrocession Result / Earned Premium
Source: SUSEP, Terra Brasis Re, 12-month aggregate Source: SUSEP, Terra Brasis Re, 12-month aggregate
The Retrocession Result Ratio, for the 12 months aggregate ending in March 2017, reached +25.8%
against -14.2% registered in the same period of 2016, showing that Local Reinsurers had a negative result
in their retrocession operations, paying more in premium than what was paid in claim. The same comment
we made for insurance companies is valid for Local Reinsurers. We believe the increase in retrocession costs
is healthy and coherent with a regular functioning market.
55%
65%
75%
85%
95%
105%
12/11 12/12 12/13 12/14 12/15 12/16
0%
10%
20%
30%
40%
12/11 12/12 12/13 12/14 12/15 12/16
0%
10%
20%
30%
40%
12/11 12/12 12/13 12/14 12/15 12/16-20%
-10%
0%
10%
20%
30%
12/11 12/12 12/13 12/14 12/15 12/16
March 2017 Terra Report: Brazil Terra Brasis Resseguros
13
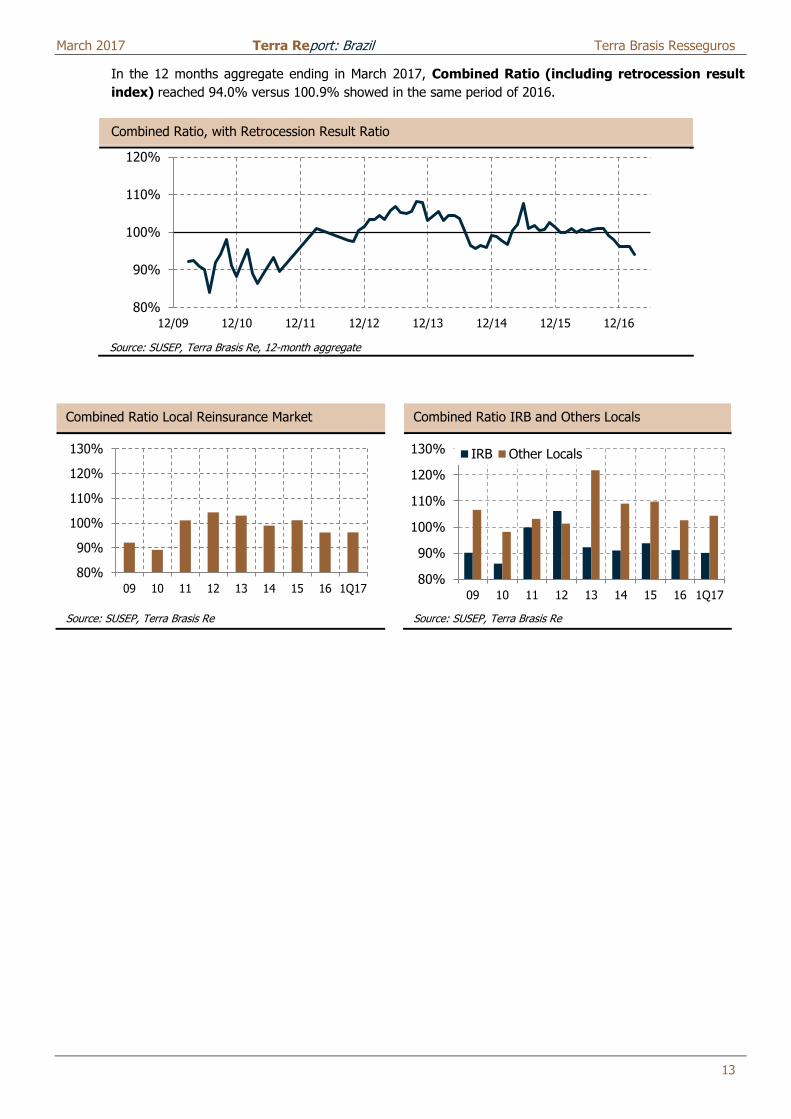
In the 12 months aggregate ending in March 2017, Combined Ratio (including retrocession result
index) reached 94.0% versus 100.9% showed in the same period of 2016.
Combined Ratio, with Retrocession Result Ratio
Source: SUSEP, Terra Brasis Re, 12-month aggregate
Combined Ratio Local Reinsurance Market Combined Ratio IRB and Others Locals
Source: SUSEP, Terra Brasis Re Source: SUSEP, Terra Brasis Re
80%
90%
100%
110%
120%
12/09 12/10 12/11 12/12 12/13 12/14 12/15 12/16
80%
90%
100%
110%
120%
130%
09 10 11 12 13 14 15 16 1Q1780%
90%
100%
110%
120%
130%
09 10 11 12 13 14 15 16 1Q17
IRB Other Locals
March 2017 Terra Report: Brazil Terra Brasis Resseguros
14
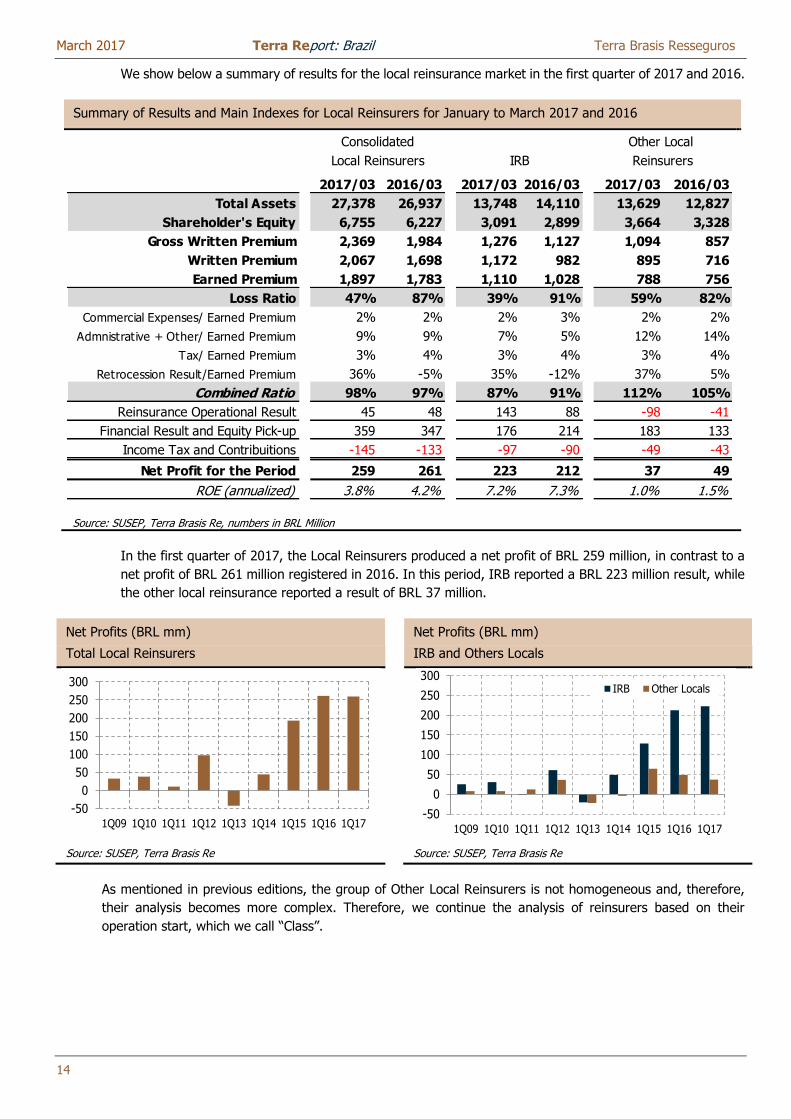
We show below a summary of results for the local reinsurance market in the first quarter of 2017 and 2016.
Summary of Results and Main Indexes for Local Reinsurers for January to March 2017 and 2016
Source: SUSEP, Terra Brasis Re, numbers in BRL Million
In the first quarter of 2017, the Local Reinsurers produced a net profit of BRL 259 million, in contrast to a
net profit of BRL 261 million registered in 2016. In this period, IRB reported a BRL 223 million result, while
the other local reinsurance reported a result of BRL 37 million.
Net Profits (BRL mm)
Total Local Reinsurers
Net Profits (BRL mm)
IRB and Others Locals
Source: SUSEP, Terra Brasis Re Source: SUSEP, Terra Brasis Re
As mentioned in previous editions, the group of Other Local Reinsurers is not homogeneous and, therefore,
their analysis becomes more complex. Therefore, we continue the analysis of reinsurers based on their
operation start, which we call “Class”.
2017/03 2016/03 2017/03 2016/03 2017/03 2016/03
Total Assets 27,378 26,937 13,748 14,110 13,629 12,827
Shareholder's Equity 6,755 6,227 3,091 2,899 3,664 3,328
Gross Written Premium 2,369 1,984 1,276 1,127 1,094 857
Written Premium 2,067 1,698 1,172 982 895 716
Earned Premium 1,897 1,783 1,110 1,028 788 756
Loss Ratio 47% 87% 39% 91% 59% 82%
Commercial Expenses/ Earned Premium 2% 2% 2% 3% 2% 2%
Admnistrative + Other/ Earned Premium 9% 9% 7% 5% 12% 14%
Tax/ Earned Premium 3% 4% 3% 4% 3% 4%
Retrocession Result/Earned Premium 36% -5% 35% -12% 37% 5%
Combined Ratio 98% 97% 87% 91% 112% 105%
Reinsurance Operational Result 45 48 143 88 -98 -41
Financial Result and Equity Pick-up 359 347 176 214 183 133
Income Tax and Contribuitions -145 -133 -97 -90 -49 -43
Net Profit for the Period 259 261 223 212 37 49
ROE (annualized) 3.8% 4.2% 7.2% 7.3% 1.0% 1.5%
Consolidated Other Local
Local Reinsurers IRB Reinsurers
-50
0
50
100
150
200
250
300
1Q09 1Q10 1Q11 1Q12 1Q13 1Q14 1Q15 1Q16 1Q17-50
0
50
100
150
200
250
300
1Q09 1Q10 1Q11 1Q12 1Q13 1Q14 1Q15 1Q16 1Q17
IRB Other Locals
March 2017 Terra Report: Brazil Terra Brasis Resseguros
15
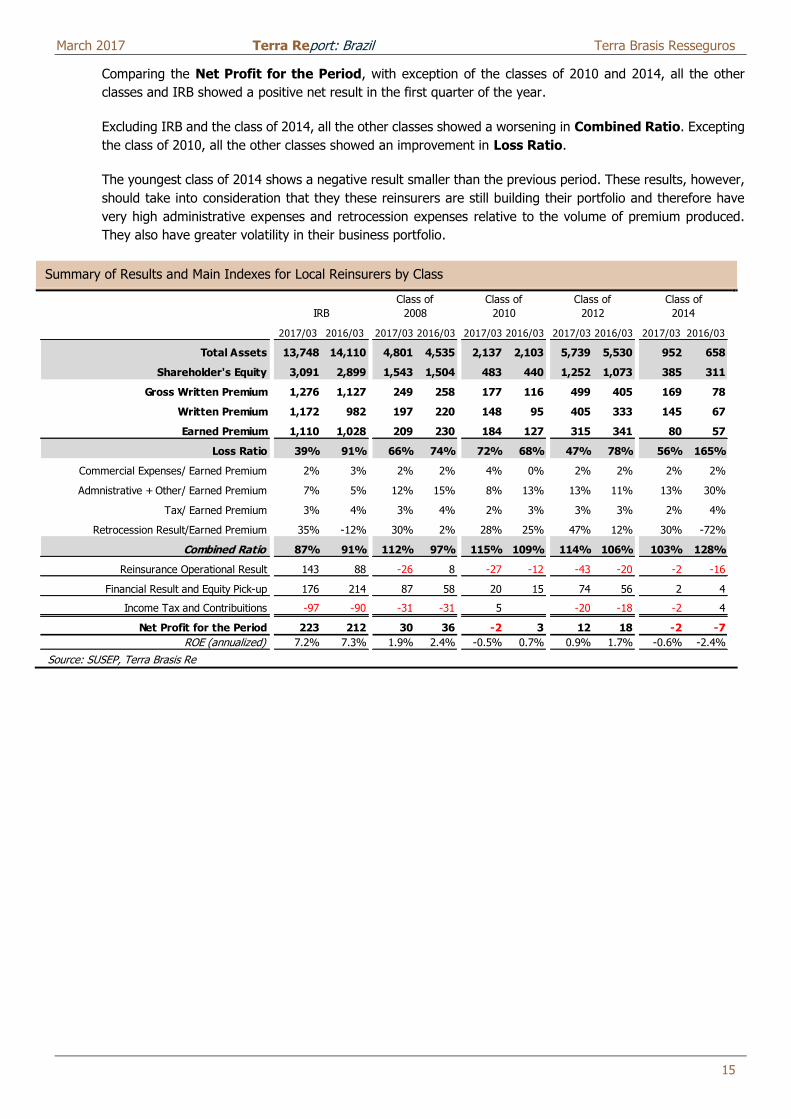
Comparing the Net Profit for the Period, with exception of the classes of 2010 and 2014, all the other
classes and IRB showed a positive net result in the first quarter of the year.
Excluding IRB and the class of 2014, all the other classes showed a worsening in Combined Ratio. Excepting
the class of 2010, all the other classes showed an improvement in Loss Ratio.
The youngest class of 2014 shows a negative result smaller than the previous period. These results, however,
should take into consideration that they these reinsurers are still building their portfolio and therefore have
very high administrative expenses and retrocession expenses relative to the volume of premium produced.
They also have greater volatility in their business portfolio.
Summary of Results and Main Indexes for Local Reinsurers by Class
Source: SUSEP, Terra Brasis Re
2017/03 2016/03 2017/03 2016/03 2017/03 2016/03 2017/03 2016/03 2017/03 2016/03
Total Assets 13,748 14,110 4,801 4,535 2,137 2,103 5,739 5,530 952 658
Shareholder's Equity 3,091 2,899 1,543 1,504 483 440 1,252 1,073 385 311
Gross Written Premium 1,276 1,127 249 258 177 116 499 405 169 78
Written Premium 1,172 982 197 220 148 95 405 333 145 67
Earned Premium 1,110 1,028 209 230 184 127 315 341 80 57
Loss Ratio 39% 91% 66% 74% 72% 68% 47% 78% 56% 165%
Commercial Expenses/ Earned Premium 2% 3% 2% 2% 4% 0% 2% 2% 2% 2%
Admnistrative + Other/ Earned Premium 7% 5% 12% 15% 8% 13% 13% 11% 13% 30%
Tax/ Earned Premium 3% 4% 3% 4% 2% 3% 3% 3% 2% 4%
Retrocession Result/Earned Premium 35% -12% 30% 2% 28% 25% 47% 12% 30% -72%
Combined Ratio 87% 91% 112% 97% 115% 109% 114% 106% 103% 128%
Reinsurance Operational Result 143 88 -26 8 -27 -12 -43 -20 -2 -16
Financial Result and Equity Pick-up 176 214 87 58 20 15 74 56 2 4
Income Tax and Contribuitions -97 -90 -31 -31 5 -20 -18 -2 4
Net Profit for the Period 223 212 30 36 -2 3 12 18 -2 -7
ROE (annualized) 7.2% 7.3% 1.9% 2.4% -0.5% 0.7% 0.9% 1.7% -0.6% -2.4%
Class of
2014IRB 2008 2010 2012
Class of Class of Class of
March 2017 Terra Report: Brazil Terra Brasis Resseguros
16
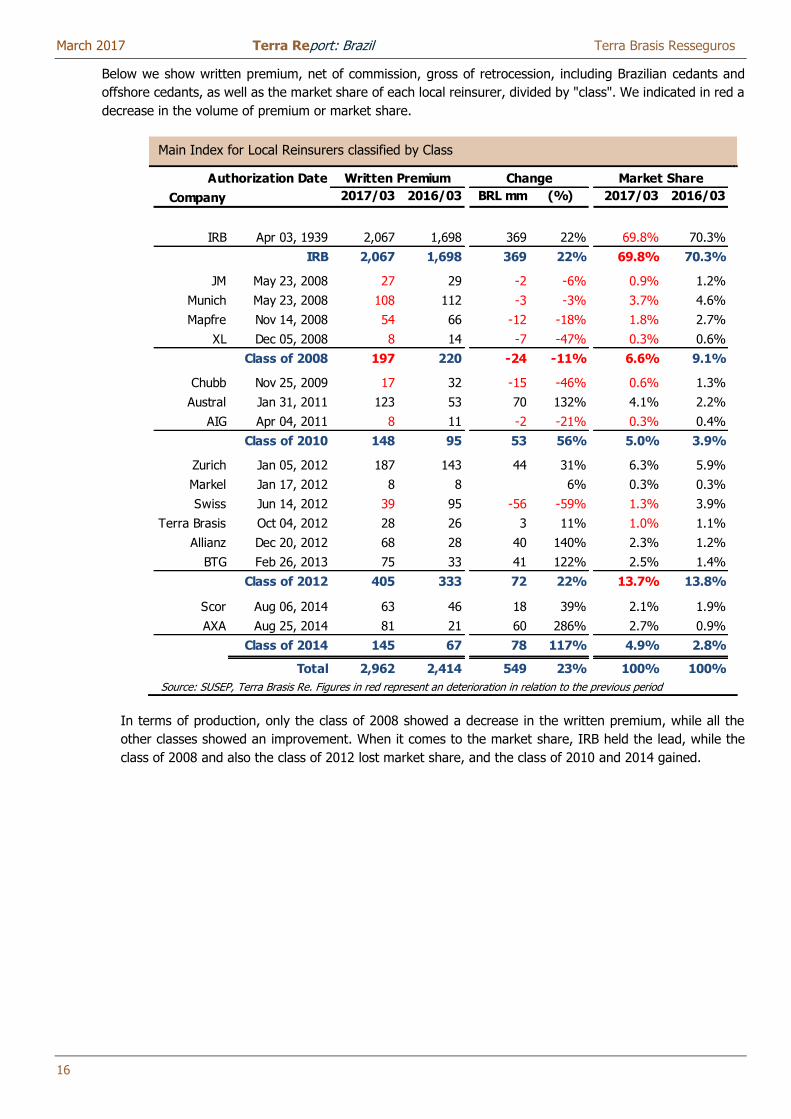
Below we show written premium, net of commission, gross of retrocession, including Brazilian cedants and
offshore cedants, as well as the market share of each local reinsurer, divided by "class". We indicated in red a
decrease in the volume of premium or market share.
Main Index for Local Reinsurers classified by Class
Source: SUSEP, Terra Brasis Re. Figures in red represent an deterioration in relation to the previous period
In terms of production, only the class of 2008 showed a decrease in the written premium, while all the
other classes showed an improvement. When it comes to the market share, IRB held the lead, while the
class of 2008 and also the class of 2012 lost market share, and the class of 2010 and 2014 gained.
Authorization Date
Company 2017/03 2016/03 BRL mm (%) 2017/03 2016/03
IRB Apr 03, 1939 2,067 1,698 369 22% 69.8% 70.3%
IRB 2,067 1,698 369 22% 69.8% 70.3%
JM May 23, 2008 27 29 -2 -6% 0.9% 1.2%
Munich May 23, 2008 108 112 -3 -3% 3.7% 4.6%
Mapfre Nov 14, 2008 54 66 -12 -18% 1.8% 2.7%
XL Dec 05, 2008 8 14 -7 -47% 0.3% 0.6%
Class of 2008 197 220 -24 -11% 6.6% 9.1%
Chubb Nov 25, 2009 17 32 -15 -46% 0.6% 1.3%
Austral Jan 31, 2011 123 53 70 132% 4.1% 2.2%
AIG Apr 04, 2011 8 11 -2 -21% 0.3% 0.4%
Class of 2010 148 95 53 56% 5.0% 3.9%
Zurich Jan 05, 2012 187 143 44 31% 6.3% 5.9%
Markel Jan 17, 2012 8 8 6% 0.3% 0.3%
Swiss Jun 14, 2012 39 95 -56 -59% 1.3% 3.9%
Terra Brasis Oct 04, 2012 28 26 3 11% 1.0% 1.1%
Allianz Dec 20, 2012 68 28 40 140% 2.3% 1.2%
BTG Feb 26, 2013 75 33 41 122% 2.5% 1.4%
Class of 2012 405 333 72 22% 13.7% 13.8%
Scor Aug 06, 2014 63 46 18 39% 2.1% 1.9%
AXA Aug 25, 2014 81 21 60 286% 2.7% 0.9%
Class of 2014 145 67 78 117% 4.9% 2.8%
Total 2,962 2,414 549 23% 100% 100%
Written Premium Change Market Share
March 2017 Terra Report: Brazil Terra Brasis Resseguros
17
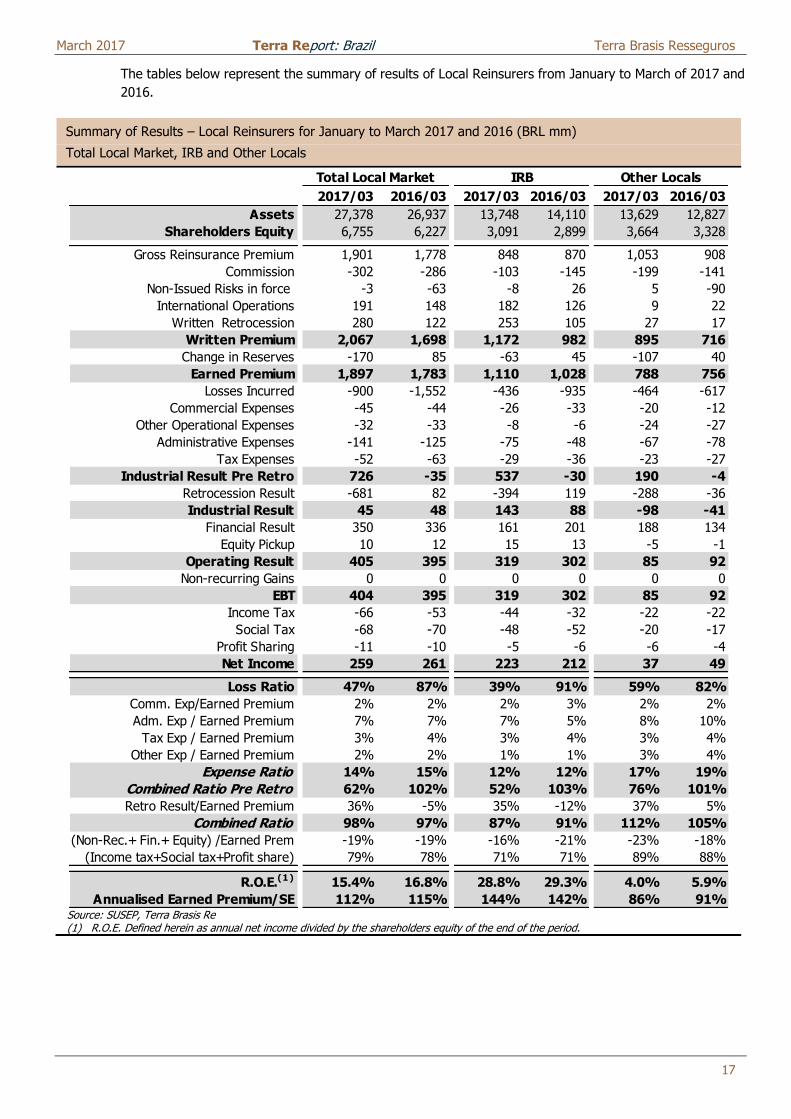
The tables below represent the summary of results of Local Reinsurers from January to March of 2017 and
2016.
Summary of Results – Local Reinsurers for January to March 2017 and 2016 (BRL mm)
Total Local Market, IRB and Other Locals
Source: SUSEP, Terra Brasis Re (1) R.O.E. Defined herein as annual net income divided by the shareholders equity of the end of the period.
2017/03 2016/03 2017/03 2016/03 2017/03 2016/03
Assets 27,378 26,937 13,748 14,110 13,629 12,827
Shareholders Equity 6,755 6,227 3,091 2,899 3,664 3,328
Gross Reinsurance Premium 1,901 1,778 848 870 1,053 908
Commission -302 -286 -103 -145 -199 -141
Non-Issued Risks in force -3 -63 -8 26 5 -90
International Operations 191 148 182 126 9 22
Written Retrocession 280 122 253 105 27 17
Written Premium 2,067 1,698 1,172 982 895 716
Change in Reserves -170 85 -63 45 -107 40
Earned Premium 1,897 1,783 1,110 1,028 788 756
Losses Incurred -900 -1,552 -436 -935 -464 -617
Commercial Expenses -45 -44 -26 -33 -20 -12
Other Operational Expenses -32 -33 -8 -6 -24 -27
Administrative Expenses -141 -125 -75 -48 -67 -78
Tax Expenses -52 -63 -29 -36 -23 -27
Industrial Result Pre Retro 726 -35 537 -30 190 -4
Retrocession Result -681 82 -394 119 -288 -36
Industrial Result 45 48 143 88 -98 -41
Financial Result 350 336 161 201 188 134
Equity Pickup 10 12 15 13 -5 -1
Operating Result 405 395 319 302 85 92
Non-recurring Gains 0 0 0 0 0 0
EBT 404 395 319 302 85 92
Income Tax -66 -53 -44 -32 -22 -22
Social Tax -68 -70 -48 -52 -20 -17
Profit Sharing -11 -10 -5 -6 -6 -4
Net Income 259 261 223 212 37 49
Loss Ratio 47% 87% 39% 91% 59% 82%
Comm. Exp/Earned Premium 2% 2% 2% 3% 2% 2%
Adm. Exp / Earned Premium 7% 7% 7% 5% 8% 10%
Tax Exp / Earned Premium 3% 4% 3% 4% 3% 4%
Other Exp / Earned Premium 2% 2% 1% 1% 3% 4%
Expense Ratio 14% 15% 12% 12% 17% 19%
Combined Ratio Pre Retro 62% 102% 52% 103% 76% 101%
Retro Result/Earned Premium 36% -5% 35% -12% 37% 5%
Combined Ratio 98% 97% 87% 91% 112% 105%
(Non-Rec.+ Fin.+ Equity) /Earned Prem -19% -19% -16% -21% -23% -18%
(Income tax+Social tax+Profit share) 79% 78% 71% 71% 89% 88%
R.O.E.(1) 15.4% 16.8% 28.8% 29.3% 4.0% 5.9%
Annualised Earned Premium/SE 112% 115% 144% 142% 86% 91%
Total Local Market IRB Other Locals
March 2017 Terra Report: Brazil Terra Brasis Resseguros
18
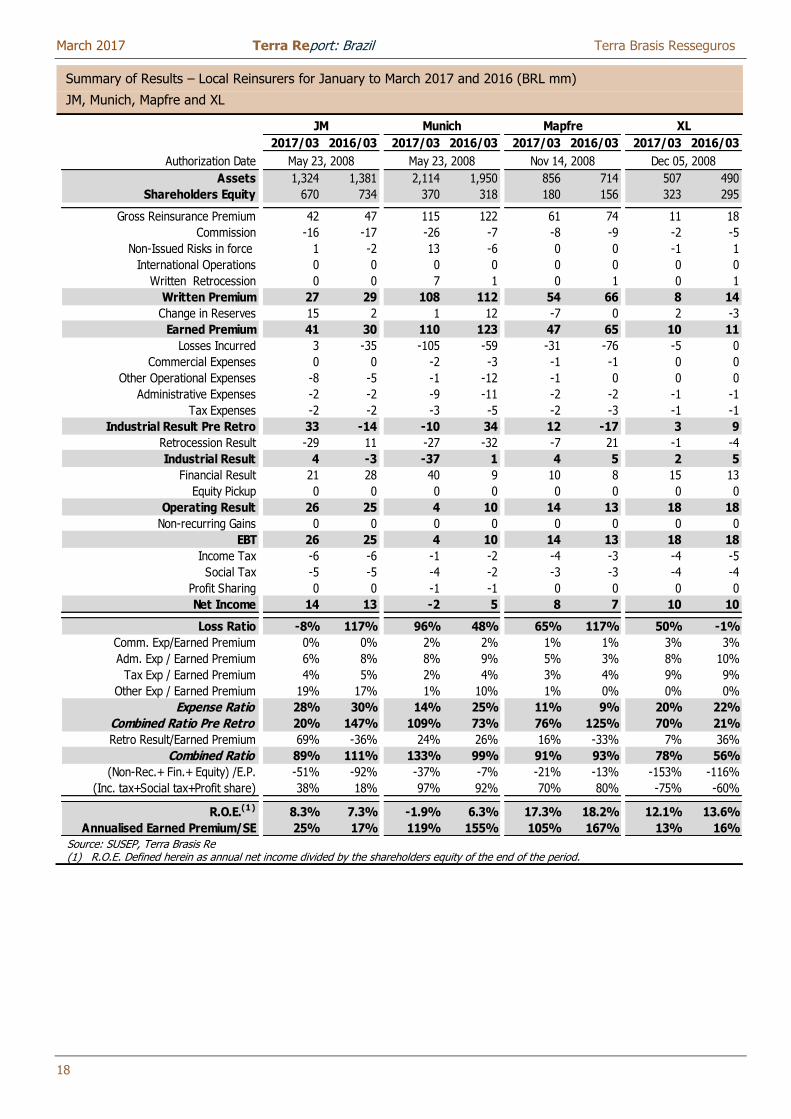
Summary of Results – Local Reinsurers for January to March 2017 and 2016 (BRL mm)
JM, Munich, Mapfre and XL
Source: SUSEP, Terra Brasis Re (1) R.O.E. Defined herein as annual net income divided by the shareholders equity of the end of the period.
2017/03 2016/03 2017/03 2016/03 2017/03 2016/03 2017/03 2016/03
Authorization Date
Assets 1,324 1,381 2,114 1,950 856 714 507 490
Shareholders Equity 670 734 370 318 180 156 323 295
Gross Reinsurance Premium 42 47 115 122 61 74 11 18
Commission -16 -17 -26 -7 -8 -9 -2 -5
Non-Issued Risks in force 1 -2 13 -6 0 0 -1 1
International Operations 0 0 0 0 0 0 0 0
Written Retrocession 0 0 7 1 0 1 0 1
Written Premium 27 29 108 112 54 66 8 14
Change in Reserves 15 2 1 12 -7 0 2 -3
Earned Premium 41 30 110 123 47 65 10 11
Losses Incurred 3 -35 -105 -59 -31 -76 -5 0
Commercial Expenses 0 0 -2 -3 -1 -1 0 0
Other Operational Expenses -8 -5 -1 -12 -1 0 0 0
Administrative Expenses -2 -2 -9 -11 -2 -2 -1 -1
Tax Expenses -2 -2 -3 -5 -2 -3 -1 -1
Industrial Result Pre Retro 33 -14 -10 34 12 -17 3 9
Retrocession Result -29 11 -27 -32 -7 21 -1 -4
Industrial Result 4 -3 -37 1 4 5 2 5
Financial Result 21 28 40 9 10 8 15 13
Equity Pickup 0 0 0 0 0 0 0 0
Operating Result 26 25 4 10 14 13 18 18
Non-recurring Gains 0 0 0 0 0 0 0 0
EBT 26 25 4 10 14 13 18 18
Income Tax -6 -6 -1 -2 -4 -3 -4 -5
Social Tax -5 -5 -4 -2 -3 -3 -4 -4
Profit Sharing 0 0 -1 -1 0 0 0 0
Net Income 14 13 -2 5 8 7 10 10
Loss Ratio -8% 117% 96% 48% 65% 117% 50% -1%
Comm. Exp/Earned Premium 0% 0% 2% 2% 1% 1% 3% 3%
Adm. Exp / Earned Premium 6% 8% 8% 9% 5% 3% 8% 10%
Tax Exp / Earned Premium 4% 5% 2% 4% 3% 4% 9% 9%
Other Exp / Earned Premium 19% 17% 1% 10% 1% 0% 0% 0%
Expense Ratio 28% 30% 14% 25% 11% 9% 20% 22%
Combined Ratio Pre Retro 20% 147% 109% 73% 76% 125% 70% 21%
Retro Result/Earned Premium 69% -36% 24% 26% 16% -33% 7% 36%
Combined Ratio 89% 111% 133% 99% 91% 93% 78% 56%
(Non-Rec.+ Fin.+ Equity) /E.P. -51% -92% -37% -7% -21% -13% -153% -116%
(Inc. tax+Social tax+Profit share) 38% 18% 97% 92% 70% 80% -75% -60%
R.O.E.(1) 8.3% 7.3% -1.9% 6.3% 17.3% 18.2% 12.1% 13.6%
Annualised Earned Premium/SE 25% 17% 119% 155% 105% 167% 13% 16%
May 23, 2008 May 23, 2008 Nov 14, 2008
XLJM Munich Mapfre
Dec 05, 2008
March 2017 Terra Report: Brazil Terra Brasis Resseguros
19
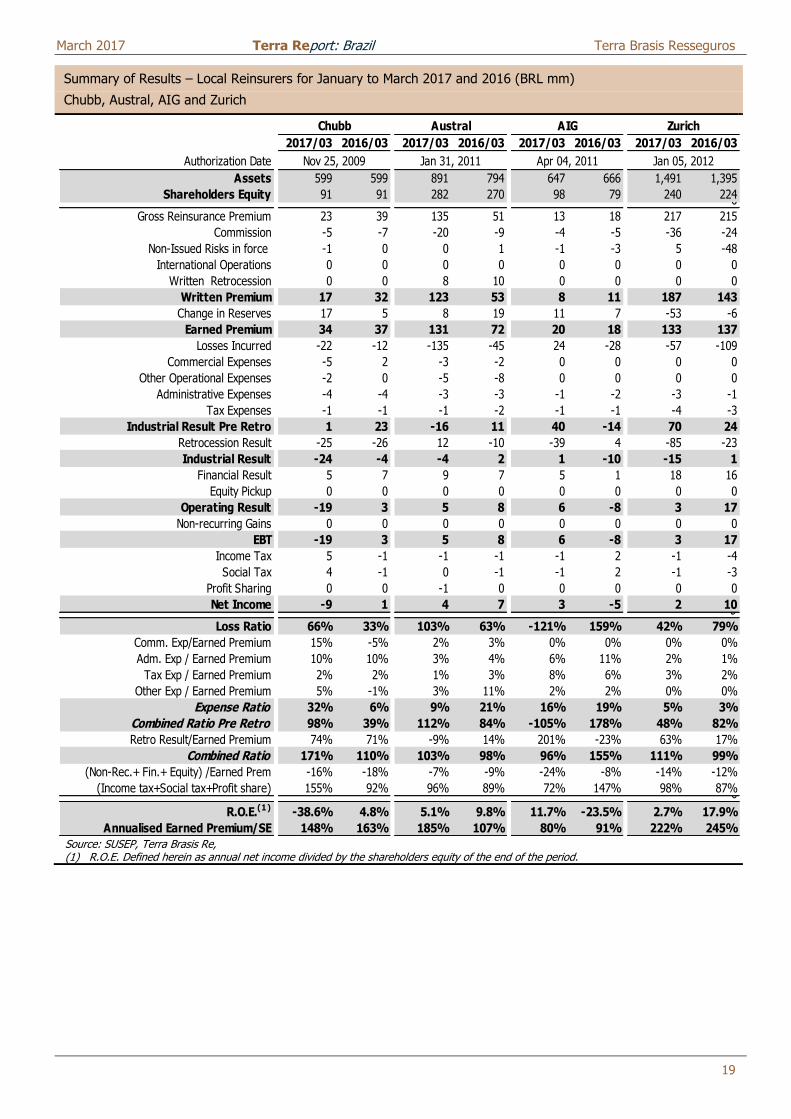
Summary of Results – Local Reinsurers for January to March 2017 and 2016 (BRL mm)
Chubb, Austral, AIG and Zurich
Source: SUSEP, Terra Brasis Re, (1) R.O.E. Defined herein as annual net income divided by the shareholders equity of the end of the period.
2017/03 2016/03 2017/03 2016/03 2017/03 2016/03 2017/03 2016/03
Authorization Date
Assets 599 599 891 794 647 666 1,491 1,395
Shareholders Equity 91 91 282 270 98 79 240 2240
Gross Reinsurance Premium 23 39 135 51 13 18 217 215
Commission -5 -7 -20 -9 -4 -5 -36 -24
Non-Issued Risks in force -1 0 0 1 -1 -3 5 -48
International Operations 0 0 0 0 0 0 0 0
Written Retrocession 0 0 8 10 0 0 0 0
Written Premium 17 32 123 53 8 11 187 143
Change in Reserves 17 5 8 19 11 7 -53 -6
Earned Premium 34 37 131 72 20 18 133 137
Losses Incurred -22 -12 -135 -45 24 -28 -57 -109
Commercial Expenses -5 2 -3 -2 0 0 0 0
Other Operational Expenses -2 0 -5 -8 0 0 0 0
Administrative Expenses -4 -4 -3 -3 -1 -2 -3 -1
Tax Expenses -1 -1 -1 -2 -1 -1 -4 -3
Industrial Result Pre Retro 1 23 -16 11 40 -14 70 24
Retrocession Result -25 -26 12 -10 -39 4 -85 -23
Industrial Result -24 -4 -4 2 1 -10 -15 1
Financial Result 5 7 9 7 5 1 18 16
Equity Pickup 0 0 0 0 0 0 0 0
Operating Result -19 3 5 8 6 -8 3 17
Non-recurring Gains 0 0 0 0 0 0 0 0
EBT -19 3 5 8 6 -8 3 17
Income Tax 5 -1 -1 -1 -1 2 -1 -4
Social Tax 4 -1 0 -1 -1 2 -1 -3
Profit Sharing 0 0 -1 0 0 0 0 0
Net Income -9 1 4 7 3 -5 2 100
Loss Ratio 66% 33% 103% 63% -121% 159% 42% 79%
Comm. Exp/Earned Premium 15% -5% 2% 3% 0% 0% 0% 0%
Adm. Exp / Earned Premium 10% 10% 3% 4% 6% 11% 2% 1%
Tax Exp / Earned Premium 2% 2% 1% 3% 8% 6% 3% 2%
Other Exp / Earned Premium 5% -1% 3% 11% 2% 2% 0% 0%
Expense Ratio 32% 6% 9% 21% 16% 19% 5% 3%
Combined Ratio Pre Retro 98% 39% 112% 84% -105% 178% 48% 82%
Retro Result/Earned Premium 74% 71% -9% 14% 201% -23% 63% 17%
Combined Ratio 171% 110% 103% 98% 96% 155% 111% 99%
(Non-Rec.+ Fin.+ Equity) /Earned Prem -16% -18% -7% -9% -24% -8% -14% -12%
(Income tax+Social tax+Profit share) 155% 92% 96% 89% 72% 147% 98% 87%0
R.O.E.(1) -38.6% 4.8% 5.1% 9.8% 11.7% -23.5% 2.7% 17.9%
Annualised Earned Premium/SE 148% 163% 185% 107% 80% 91% 222% 245%
Zurich
Jan 31, 2011 Apr 04, 2011
Austral AIGChubb
Nov 25, 2009 Jan 05, 2012
March 2017 Terra Report: Brazil Terra Brasis Resseguros
20
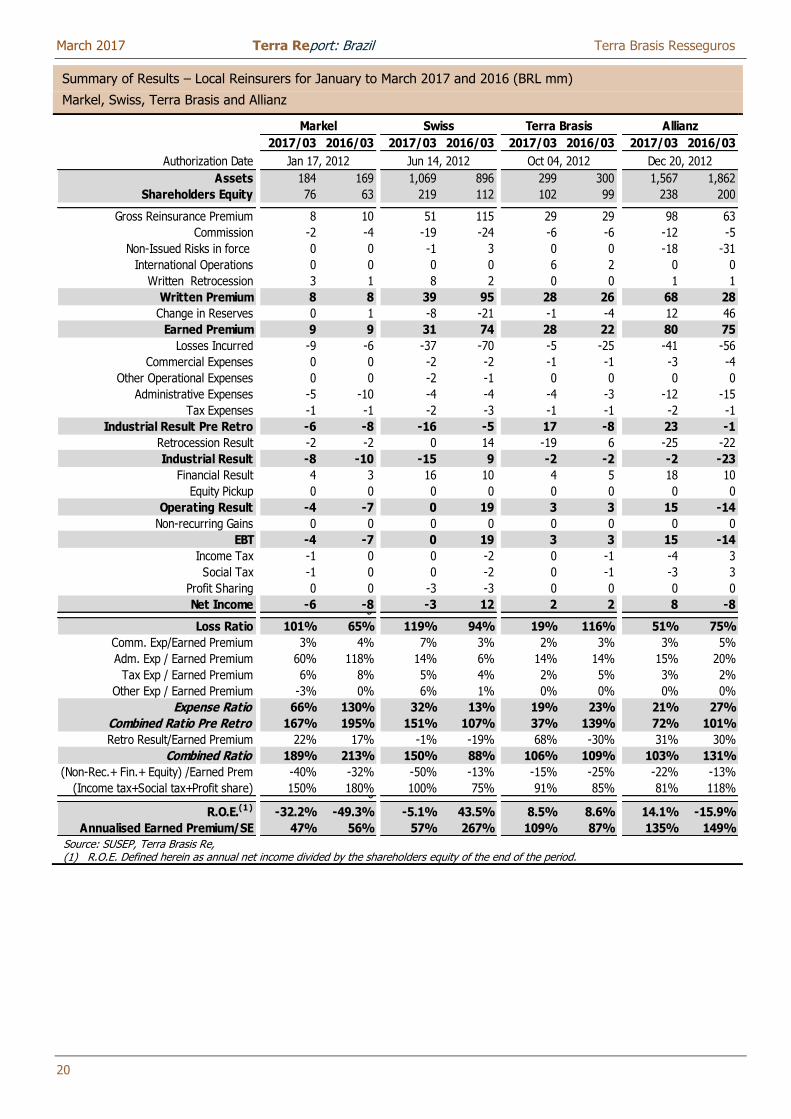
Summary of Results – Local Reinsurers for January to March 2017 and 2016 (BRL mm)
Markel, Swiss, Terra Brasis and Allianz
Source: SUSEP, Terra Brasis Re, (1) R.O.E. Defined herein as annual net income divided by the shareholders equity of the end of the period.
2017/03 2016/03 2017/03 2016/03 2017/03 2016/03 2017/03 2016/03
Authorization Date
Assets 184 169 1,069 896 299 300 1,567 1,862
Shareholders Equity 76 63 219 112 102 99 238 200
Gross Reinsurance Premium 8 10 51 115 29 29 98 63
Commission -2 -4 -19 -24 -6 -6 -12 -5
Non-Issued Risks in force 0 0 -1 3 0 0 -18 -31
International Operations 0 0 0 0 6 2 0 0
Written Retrocession 3 1 8 2 0 0 1 1
Written Premium 8 8 39 95 28 26 68 28
Change in Reserves 0 1 -8 -21 -1 -4 12 46
Earned Premium 9 9 31 74 28 22 80 75
Losses Incurred -9 -6 -37 -70 -5 -25 -41 -56
Commercial Expenses 0 0 -2 -2 -1 -1 -3 -4
Other Operational Expenses 0 0 -2 -1 0 0 0 0
Administrative Expenses -5 -10 -4 -4 -4 -3 -12 -15
Tax Expenses -1 -1 -2 -3 -1 -1 -2 -1
Industrial Result Pre Retro -6 -8 -16 -5 17 -8 23 -1
Retrocession Result -2 -2 0 14 -19 6 -25 -22
Industrial Result -8 -10 -15 9 -2 -2 -2 -23
Financial Result 4 3 16 10 4 5 18 10
Equity Pickup 0 0 0 0 0 0 0 0
Operating Result -4 -7 0 19 3 3 15 -14
Non-recurring Gains 0 0 0 0 0 0 0 0
EBT -4 -7 0 19 3 3 15 -14
Income Tax -1 0 0 -2 0 -1 -4 3
Social Tax -1 0 0 -2 0 -1 -3 3
Profit Sharing 0 0 -3 -3 0 0 0 0
Net Income -6 -8 -3 12 2 2 8 -80
Loss Ratio 101% 65% 119% 94% 19% 116% 51% 75%
Comm. Exp/Earned Premium 3% 4% 7% 3% 2% 3% 3% 5%
Adm. Exp / Earned Premium 60% 118% 14% 6% 14% 14% 15% 20%
Tax Exp / Earned Premium 6% 8% 5% 4% 2% 5% 3% 2%
Other Exp / Earned Premium -3% 0% 6% 1% 0% 0% 0% 0%
Expense Ratio 66% 130% 32% 13% 19% 23% 21% 27%
Combined Ratio Pre Retro 167% 195% 151% 107% 37% 139% 72% 101%
Retro Result/Earned Premium 22% 17% -1% -19% 68% -30% 31% 30%
Combined Ratio 189% 213% 150% 88% 106% 109% 103% 131%
(Non-Rec.+ Fin.+ Equity) /Earned Prem -40% -32% -50% -13% -15% -25% -22% -13%
(Income tax+Social tax+Profit share) 150% 180% 100% 75% 91% 85% 81% 118%0
R.O.E.(1) -32.2% -49.3% -5.1% 43.5% 8.5% 8.6% 14.1% -15.9%
Annualised Earned Premium/SE 47% 56% 57% 267% 109% 87% 135% 149%
SwissMarkel
Jan 17, 2012
Terra Brasis Allianz
Oct 04, 2012 Dec 20, 2012Jun 14, 2012
March 2017 Terra Report: Brazil Terra Brasis Resseguros
21
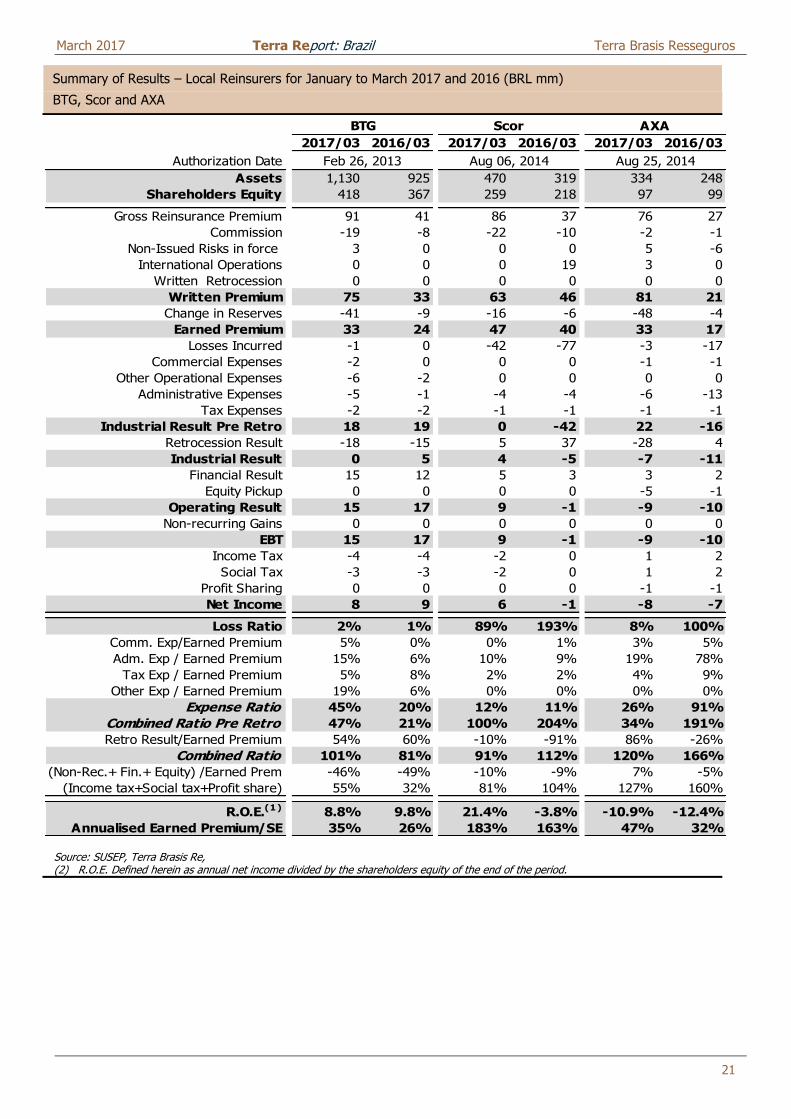
Summary of Results – Local Reinsurers for January to March 2017 and 2016 (BRL mm)
BTG, Scor and AXA
Source: SUSEP, Terra Brasis Re, (2) R.O.E. Defined herein as annual net income divided by the shareholders equity of the end of the period.
2017/03 2016/03 2017/03 2016/03 2017/03 2016/03
Authorization Date
Assets 1,130 925 470 319 334 248
Shareholders Equity 418 367 259 218 97 99
Gross Reinsurance Premium 91 41 86 37 76 27
Commission -19 -8 -22 -10 -2 -1
Non-Issued Risks in force 3 0 0 0 5 -6
International Operations 0 0 0 19 3 0
Written Retrocession 0 0 0 0 0 0
Written Premium 75 33 63 46 81 21
Change in Reserves -41 -9 -16 -6 -48 -4
Earned Premium 33 24 47 40 33 17
Losses Incurred -1 0 -42 -77 -3 -17
Commercial Expenses -2 0 0 0 -1 -1
Other Operational Expenses -6 -2 0 0 0 0
Administrative Expenses -5 -1 -4 -4 -6 -13
Tax Expenses -2 -2 -1 -1 -1 -1
Industrial Result Pre Retro 18 19 0 -42 22 -16
Retrocession Result -18 -15 5 37 -28 4
Industrial Result 0 5 4 -5 -7 -11
Financial Result 15 12 5 3 3 2
Equity Pickup 0 0 0 0 -5 -1
Operating Result 15 17 9 -1 -9 -10
Non-recurring Gains 0 0 0 0 0 0
EBT 15 17 9 -1 -9 -10
Income Tax -4 -4 -2 0 1 2
Social Tax -3 -3 -2 0 1 2
Profit Sharing 0 0 0 0 -1 -1
Net Income 8 9 6 -1 -8 -7
Loss Ratio 2% 1% 89% 193% 8% 100%
Comm. Exp/Earned Premium 5% 0% 0% 1% 3% 5%
Adm. Exp / Earned Premium 15% 6% 10% 9% 19% 78%
Tax Exp / Earned Premium 5% 8% 2% 2% 4% 9%
Other Exp / Earned Premium 19% 6% 0% 0% 0% 0%
Expense Ratio 45% 20% 12% 11% 26% 91%
Combined Ratio Pre Retro 47% 21% 100% 204% 34% 191%
Retro Result/Earned Premium 54% 60% -10% -91% 86% -26%
Combined Ratio 101% 81% 91% 112% 120% 166%
(Non-Rec.+ Fin.+ Equity) /Earned Prem -46% -49% -10% -9% 7% -5%
(Income tax+Social tax+Profit share) 55% 32% 81% 104% 127% 160%
R.O.E.(1) 8.8% 9.8% 21.4% -3.8% -10.9% -12.4%
Annualised Earned Premium/SE 35% 26% 183% 163% 47% 32%
AXA
Feb 26, 2013 Aug 25, 2014
Scor
Aug 06, 2014
BTG
March 2017 Terra Report: Brazil Terra Brasis Resseguros
22
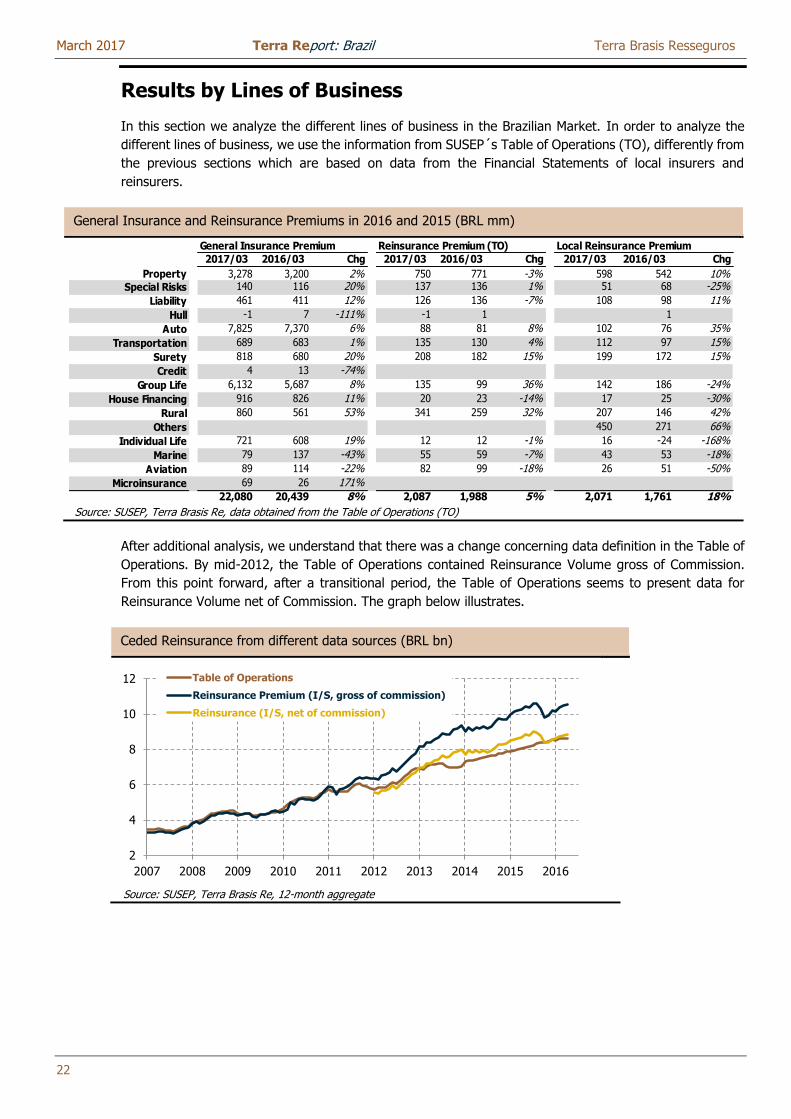
Results by Lines of Business
In this section we analyze the different lines of business in the Brazilian Market. In order to analyze the
different lines of business, we use the information from SUSEP´s Table of Operations (TO), differently from
the previous sections which are based on data from the Financial Statements of local insurers and
reinsurers.
General Insurance and Reinsurance Premiums in 2016 and 2015 (BRL mm)
Source: SUSEP, Terra Brasis Re, data obtained from the Table of Operations (TO)
After additional analysis, we understand that there was a change concerning data definition in the Table of
Operations. By mid-2012, the Table of Operations contained Reinsurance Volume gross of Commission.
From this point forward, after a transitional period, the Table of Operations seems to present data for
Reinsurance Volume net of Commission. The graph below illustrates.
Ceded Reinsurance from different data sources (BRL bn)
Source: SUSEP, Terra Brasis Re, 12-month aggregate
General Insurance Premium Reinsurance Premium (TO) Local Reinsurance Premium
2017/03 2016/03 Chg 2017/03 2016/03 Chg 2017/03 2016/03 Chg
Property 3,278 3,200 2% 750 771 -3% 598 542 10%Special Risks 140 116 20% 137 136 1% 51 68 -25%
Liability 461 411 12% 126 136 -7% 108 98 11%
Hull -1 7 -111% -1 1 1
Auto 7,825 7,370 6% 88 81 8% 102 76 35%
Transportation 689 683 1% 135 130 4% 112 97 15%
Surety 818 680 20% 208 182 15% 199 172 15%
Credit 4 13 -74%
Group Life 6,132 5,687 8% 135 99 36% 142 186 -24%
House Financing 916 826 11% 20 23 -14% 17 25 -30%
Rural 860 561 53% 341 259 32% 207 146 42%
Others 450 271 66%
Individual Life 721 608 19% 12 12 -1% 16 -24 -168%
Marine 79 137 -43% 55 59 -7% 43 53 -18%
Aviation 89 114 -22% 82 99 -18% 26 51 -50%
Microinsurance 69 26 171%
22,080 20,439 8% 2,087 1,988 5% 2,071 1,761 18%
2
4
6
8
10
12
2007 2008 2009 2010 2011 2012 2013 2014 2015 2016
Table of Operations
Reinsurance Premium (I/S, gross of commission)
Reinsurance (I/S, net of commission)
March 2017 Terra Report: Brazil Terra Brasis Resseguros
23
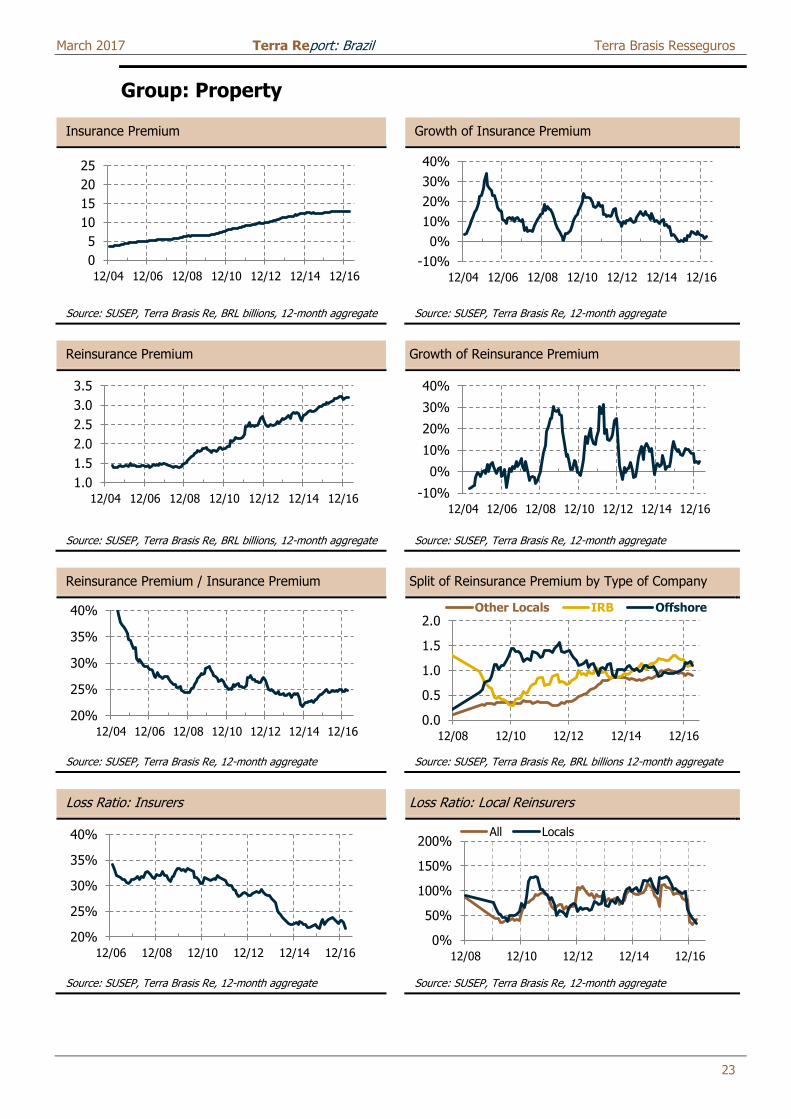
Group: Property
Insurance Premium Growth of Insurance Premium
Source: SUSEP, Terra Brasis Re, BRL billions, 12-month aggregate Source: SUSEP, Terra Brasis Re, 12-month aggregate
Reinsurance Premium Growth of Reinsurance Premium
Source: SUSEP, Terra Brasis Re, BRL billions, 12-month aggregate Source: SUSEP, Terra Brasis Re, 12-month aggregate
Reinsurance Premium / Insurance Premium Split of Reinsurance Premium by Type of Company
Source: SUSEP, Terra Brasis Re, 12-month aggregate Source: SUSEP, Terra Brasis Re, BRL billions 12-month aggregate
Loss Ratio: Insurers Loss Ratio: Local Reinsurers
Source: SUSEP, Terra Brasis Re, 12-month aggregate Source: SUSEP, Terra Brasis Re, 12-month aggregate
0
5
10
15
20
25
12/04 12/06 12/08 12/10 12/12 12/14 12/16-10%
0%
10%
20%
30%
40%
12/04 12/06 12/08 12/10 12/12 12/14 12/16
1.0
1.5
2.0
2.5
3.0
3.5
12/04 12/06 12/08 12/10 12/12 12/14 12/16 -10%
0%
10%
20%
30%
40%
12/04 12/06 12/08 12/10 12/12 12/14 12/16
20%
25%
30%
35%
40%
12/04 12/06 12/08 12/10 12/12 12/14 12/160.0
0.5
1.0
1.5
2.0
12/08 12/10 12/12 12/14 12/16
Other Locals IRB Offshore
20%
25%
30%
35%
40%
12/06 12/08 12/10 12/12 12/14 12/160%
50%
100%
150%
200%
12/08 12/10 12/12 12/14 12/16
All Locals
March 2017 Terra Report: Brazil Terra Brasis Resseguros
24
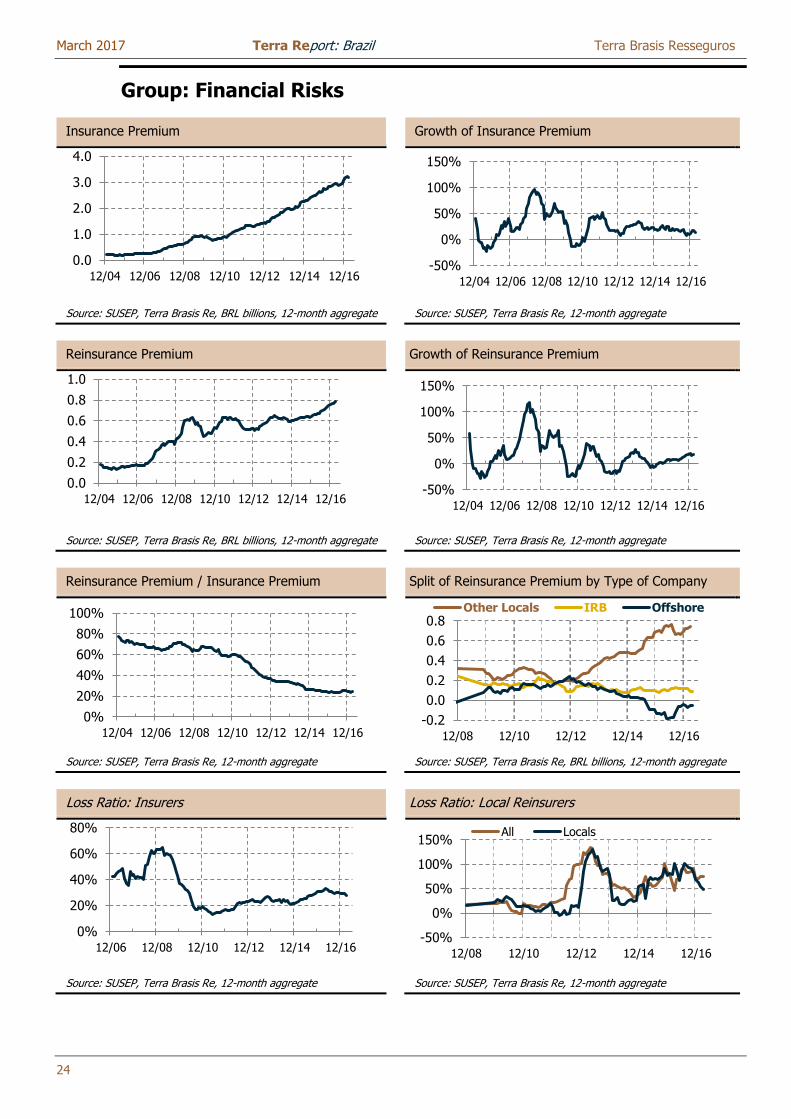
Group: Financial Risks
Insurance Premium Growth of Insurance Premium
Source: SUSEP, Terra Brasis Re, BRL billions, 12-month aggregate Source: SUSEP, Terra Brasis Re, 12-month aggregate
Reinsurance Premium Growth of Reinsurance Premium
Source: SUSEP, Terra Brasis Re, BRL billions, 12-month aggregate Source: SUSEP, Terra Brasis Re, 12-month aggregate
Reinsurance Premium / Insurance Premium Split of Reinsurance Premium by Type of Company
Source: SUSEP, Terra Brasis Re, 12-month aggregate Source: SUSEP, Terra Brasis Re, BRL billions, 12-month aggregate
Loss Ratio: Insurers Loss Ratio: Local Reinsurers
Source: SUSEP, Terra Brasis Re, 12-month aggregate Source: SUSEP, Terra Brasis Re, 12-month aggregate
0.0
1.0
2.0
3.0
4.0
12/04 12/06 12/08 12/10 12/12 12/14 12/16-50%
0%
50%
100%
150%
12/04 12/06 12/08 12/10 12/12 12/14 12/16
0.0
0.2
0.4
0.6
0.8
1.0
12/04 12/06 12/08 12/10 12/12 12/14 12/16-50%
0%
50%
100%
150%
12/04 12/06 12/08 12/10 12/12 12/14 12/16
0%
20%
40%
60%
80%
100%
12/04 12/06 12/08 12/10 12/12 12/14 12/16-0.2
0.0
0.2
0.4
0.6
0.8
12/08 12/10 12/12 12/14 12/16
Other Locals IRB Offshore
0%
20%
40%
60%
80%
12/06 12/08 12/10 12/12 12/14 12/16-50%
0%
50%
100%
150%
12/08 12/10 12/12 12/14 12/16
All Locals
March 2017 Terra Report: Brazil Terra Brasis Resseguros
25
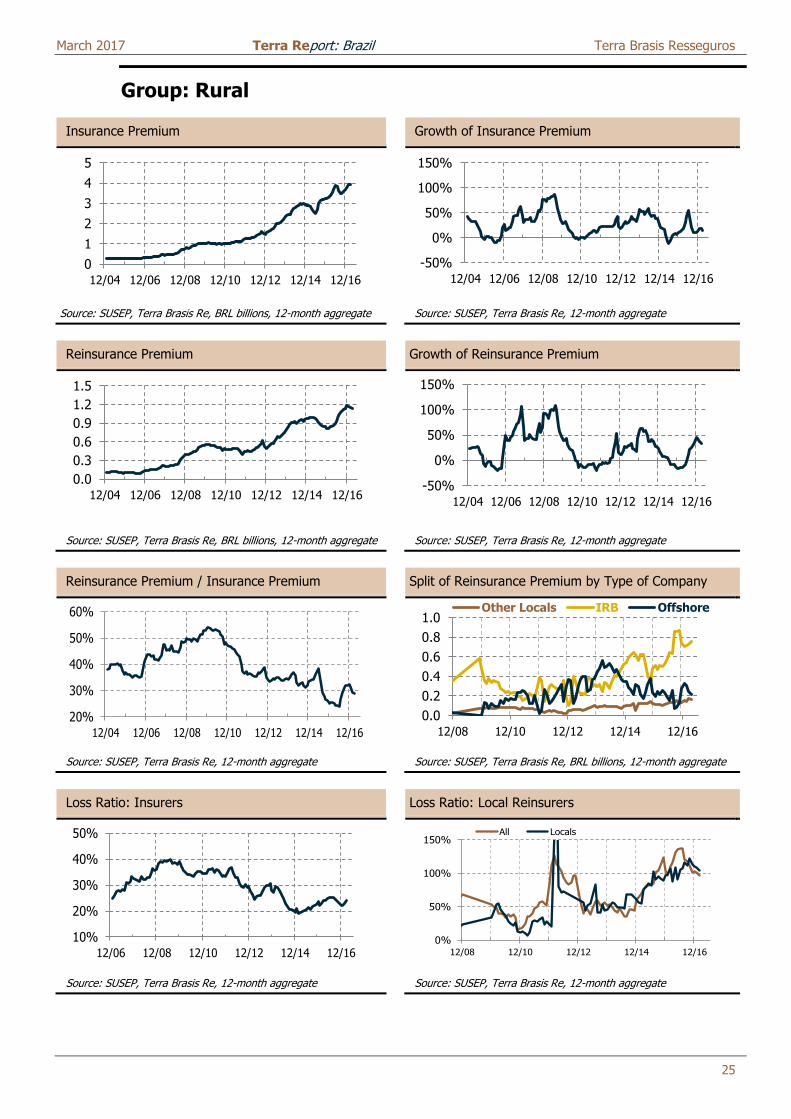
Group: Rural
Insurance Premium Growth of Insurance Premium
Source: SUSEP, Terra Brasis Re, BRL billions, 12-month aggregate Source: SUSEP, Terra Brasis Re, 12-month aggregate
Reinsurance Premium Growth of Reinsurance Premium
Source: SUSEP, Terra Brasis Re, BRL billions, 12-month aggregate Source: SUSEP, Terra Brasis Re, 12-month aggregate
Reinsurance Premium / Insurance Premium Split of Reinsurance Premium by Type of Company
Source: SUSEP, Terra Brasis Re, 12-month aggregate Source: SUSEP, Terra Brasis Re, BRL billions, 12-month aggregate
Loss Ratio: Insurers Loss Ratio: Local Reinsurers
Source: SUSEP, Terra Brasis Re, 12-month aggregate Source: SUSEP, Terra Brasis Re, 12-month aggregate
0
1
2
3
4
5
12/04 12/06 12/08 12/10 12/12 12/14 12/16
-50%
0%
50%
100%
150%
12/04 12/06 12/08 12/10 12/12 12/14 12/16
0.0
0.3
0.6
0.9
1.2
1.5
12/04 12/06 12/08 12/10 12/12 12/14 12/16-50%
0%
50%
100%
150%
12/04 12/06 12/08 12/10 12/12 12/14 12/16
20%
30%
40%
50%
60%
12/04 12/06 12/08 12/10 12/12 12/14 12/16
0.0
0.2
0.4
0.6
0.8
1.0
12/08 12/10 12/12 12/14 12/16
Other Locals IRB Offshore
10%
20%
30%
40%
50%
12/06 12/08 12/10 12/12 12/14 12/160%
50%
100%
150%
12/08 12/10 12/12 12/14 12/16
All Locals
March 2017 Terra Report: Brazil Terra Brasis Resseguros
26
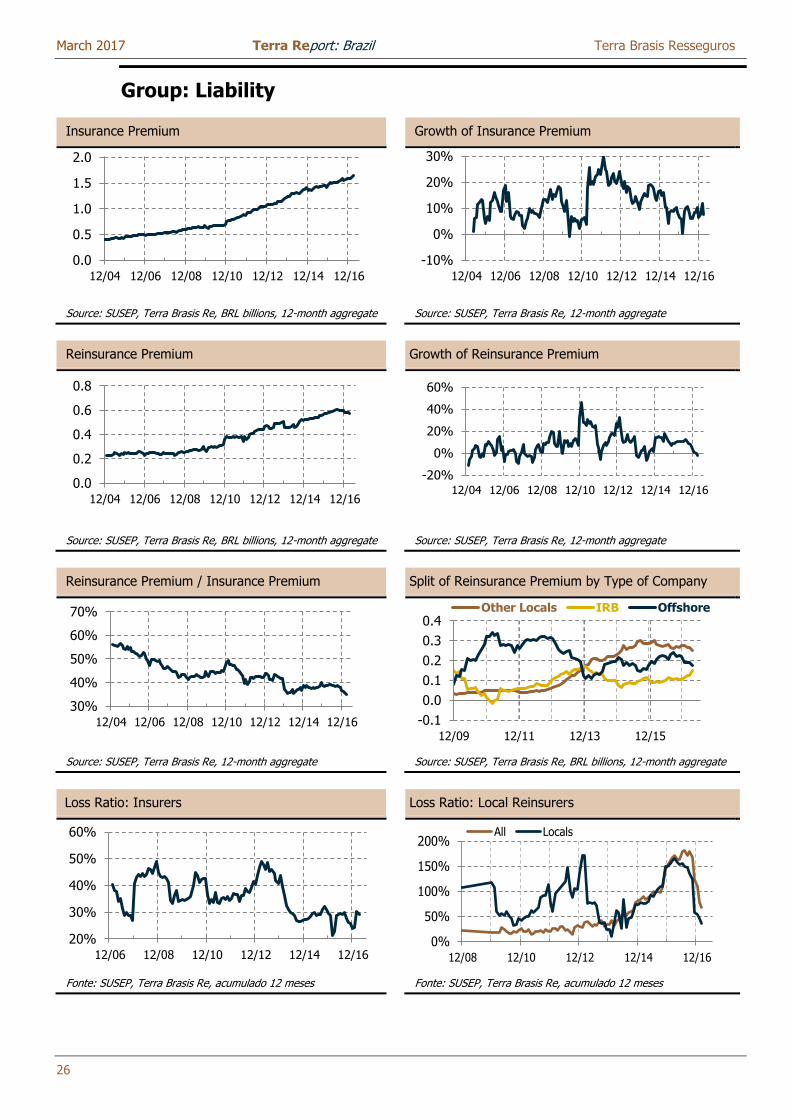
Group: Liability
Insurance Premium Growth of Insurance Premium
Source: SUSEP, Terra Brasis Re, BRL billions, 12-month aggregate Source: SUSEP, Terra Brasis Re, 12-month aggregate
Reinsurance Premium Growth of Reinsurance Premium
Source: SUSEP, Terra Brasis Re, BRL billions, 12-month aggregate Source: SUSEP, Terra Brasis Re, 12-month aggregate
Reinsurance Premium / Insurance Premium Split of Reinsurance Premium by Type of Company
Source: SUSEP, Terra Brasis Re, 12-month aggregate Source: SUSEP, Terra Brasis Re, BRL billions, 12-month aggregate
Loss Ratio: Insurers Loss Ratio: Local Reinsurers
Fonte: SUSEP, Terra Brasis Re, acumulado 12 meses Fonte: SUSEP, Terra Brasis Re, acumulado 12 meses
0.0
0.5
1.0
1.5
2.0
12/04 12/06 12/08 12/10 12/12 12/14 12/16
-10%
0%
10%
20%
30%
12/04 12/06 12/08 12/10 12/12 12/14 12/16
0.0
0.2
0.4
0.6
0.8
12/04 12/06 12/08 12/10 12/12 12/14 12/16
-20%
0%
20%
40%
60%
12/04 12/06 12/08 12/10 12/12 12/14 12/16
30%
40%
50%
60%
70%
12/04 12/06 12/08 12/10 12/12 12/14 12/16 -0.1
0.0
0.1
0.2
0.3
0.4
12/09 12/11 12/13 12/15
Other Locals IRB Offshore
20%
30%
40%
50%
60%
12/06 12/08 12/10 12/12 12/14 12/160%
50%
100%
150%
200%
12/08 12/10 12/12 12/14 12/16
All Locals
March 2017 Terra Report: Brazil Terra Brasis Resseguros
27
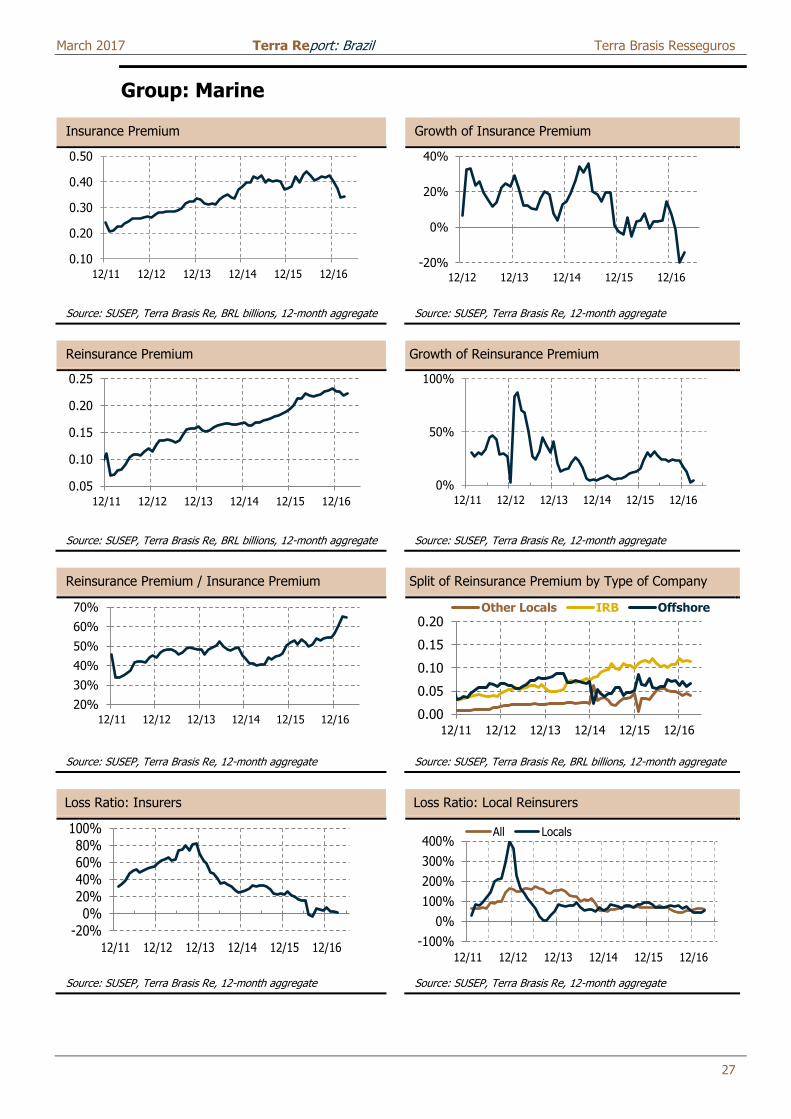
Group: Marine
Insurance Premium Growth of Insurance Premium
Source: SUSEP, Terra Brasis Re, BRL billions, 12-month aggregate Source: SUSEP, Terra Brasis Re, 12-month aggregate
Reinsurance Premium Growth of Reinsurance Premium
Source: SUSEP, Terra Brasis Re, BRL billions, 12-month aggregate Source: SUSEP, Terra Brasis Re, 12-month aggregate
Reinsurance Premium / Insurance Premium Split of Reinsurance Premium by Type of Company
Source: SUSEP, Terra Brasis Re, 12-month aggregate Source: SUSEP, Terra Brasis Re, BRL billions, 12-month aggregate
Loss Ratio: Insurers Loss Ratio: Local Reinsurers
Source: SUSEP, Terra Brasis Re, 12-month aggregate Source: SUSEP, Terra Brasis Re, 12-month aggregate
0.10
0.20
0.30
0.40
0.50
12/11 12/12 12/13 12/14 12/15 12/16-20%
0%
20%
40%
12/12 12/13 12/14 12/15 12/16
0.05
0.10
0.15
0.20
0.25
12/11 12/12 12/13 12/14 12/15 12/16
0%
50%
100%
12/11 12/12 12/13 12/14 12/15 12/16
20%
30%
40%
50%
60%
70%
12/11 12/12 12/13 12/14 12/15 12/16 0.00
0.05
0.10
0.15
0.20
12/11 12/12 12/13 12/14 12/15 12/16
Other Locals IRB Offshore
-20%
0%20%40%60%
80%
100%
12/11 12/12 12/13 12/14 12/15 12/16 -100%
0%
100%
200%
300%
400%
12/11 12/12 12/13 12/14 12/15 12/16
All Locals
March 2017 Terra Report: Brazil Terra Brasis Resseguros
28
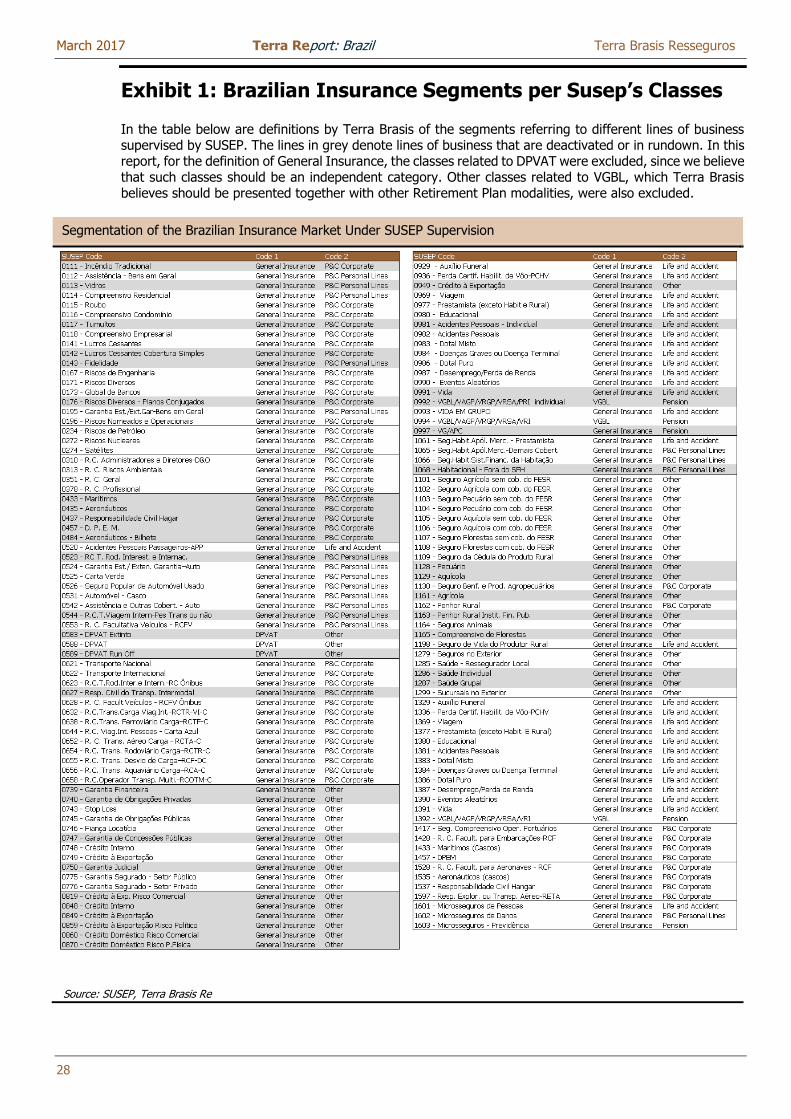
Exhibit 1: Brazilian Insurance Segments per Susep’s Classes
In the table below are definitions by Terra Brasis of the segments referring to different lines of business supervised by SUSEP. The lines in grey denote lines of business that are deactivated or in rundown. In this report, for the definition of General Insurance, the classes related to DPVAT were excluded, since we believe that such classes should be an independent category. Other classes related to VGBL, which Terra Brasis believes should be presented together with other Retirement Plan modalities, were also excluded.
Segmentation of the Brazilian Insurance Market Under SUSEP Supervision
Source: SUSEP, Terra Brasis Re
March 2017 Terra Report: Brazil Terra Brasis Resseguros
29
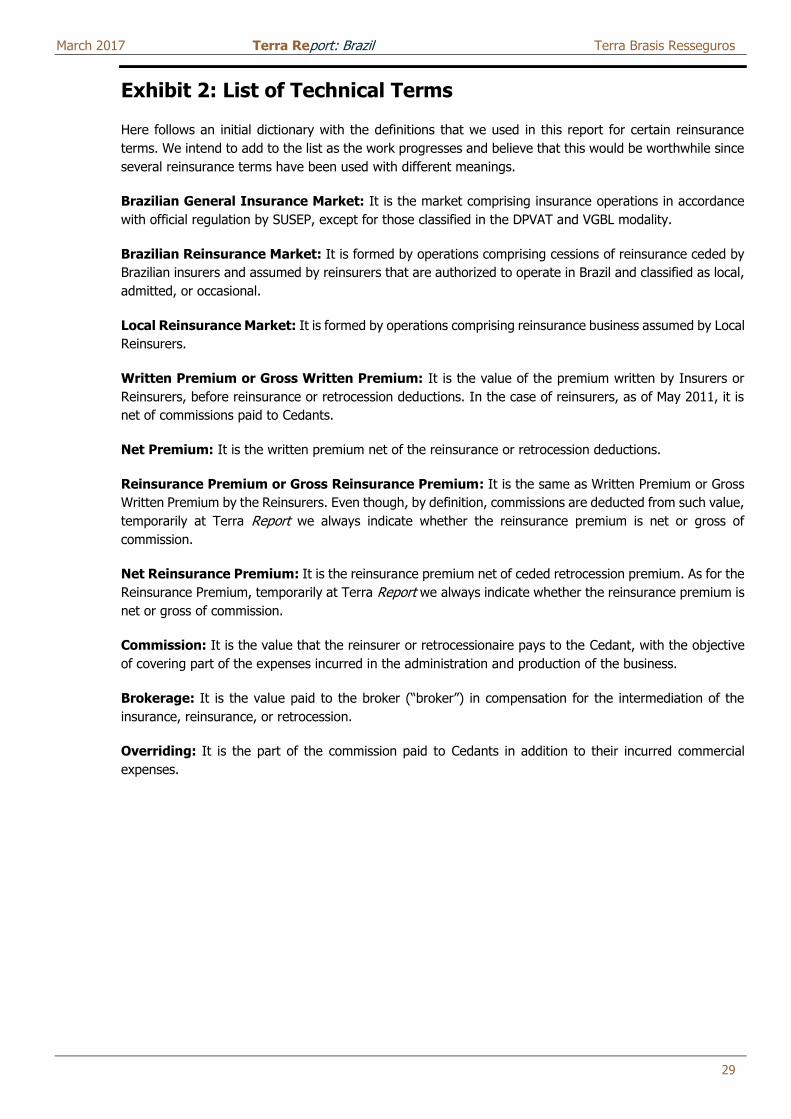
Exhibit 2: List of Technical Terms
Here follows an initial dictionary with the definitions that we used in this report for certain reinsurance
terms. We intend to add to the list as the work progresses and believe that this would be worthwhile since
several reinsurance terms have been used with different meanings.
Brazilian General Insurance Market: It is the market comprising insurance operations in accordance
with official regulation by SUSEP, except for those classified in the DPVAT and VGBL modality.
Brazilian Reinsurance Market: It is formed by operations comprising cessions of reinsurance ceded by
Brazilian insurers and assumed by reinsurers that are authorized to operate in Brazil and classified as local,
admitted, or occasional.
Local Reinsurance Market: It is formed by operations comprising reinsurance business assumed by Local
Reinsurers.
Written Premium or Gross Written Premium: It is the value of the premium written by Insurers or
Reinsurers, before reinsurance or retrocession deductions. In the case of reinsurers, as of May 2011, it is
net of commissions paid to Cedants.
Net Premium: It is the written premium net of the reinsurance or retrocession deductions.
Reinsurance Premium or Gross Reinsurance Premium: It is the same as Written Premium or Gross
Written Premium by the Reinsurers. Even though, by definition, commissions are deducted from such value,
temporarily at Terra Report we always indicate whether the reinsurance premium is net or gross of
commission.
Net Reinsurance Premium: It is the reinsurance premium net of ceded retrocession premium. As for the
Reinsurance Premium, temporarily at Terra Report we always indicate whether the reinsurance premium is
net or gross of commission.
Commission: It is the value that the reinsurer or retrocessionaire pays to the Cedant, with the objective
of covering part of the expenses incurred in the administration and production of the business.
Brokerage: It is the value paid to the broker (“broker”) in compensation for the intermediation of the
insurance, reinsurance, or retrocession.
Overriding: It is the part of the commission paid to Cedants in addition to their incurred commercial
expenses.
March 2017 Terra Report: Brazil Terra Brasis Resseguros
30
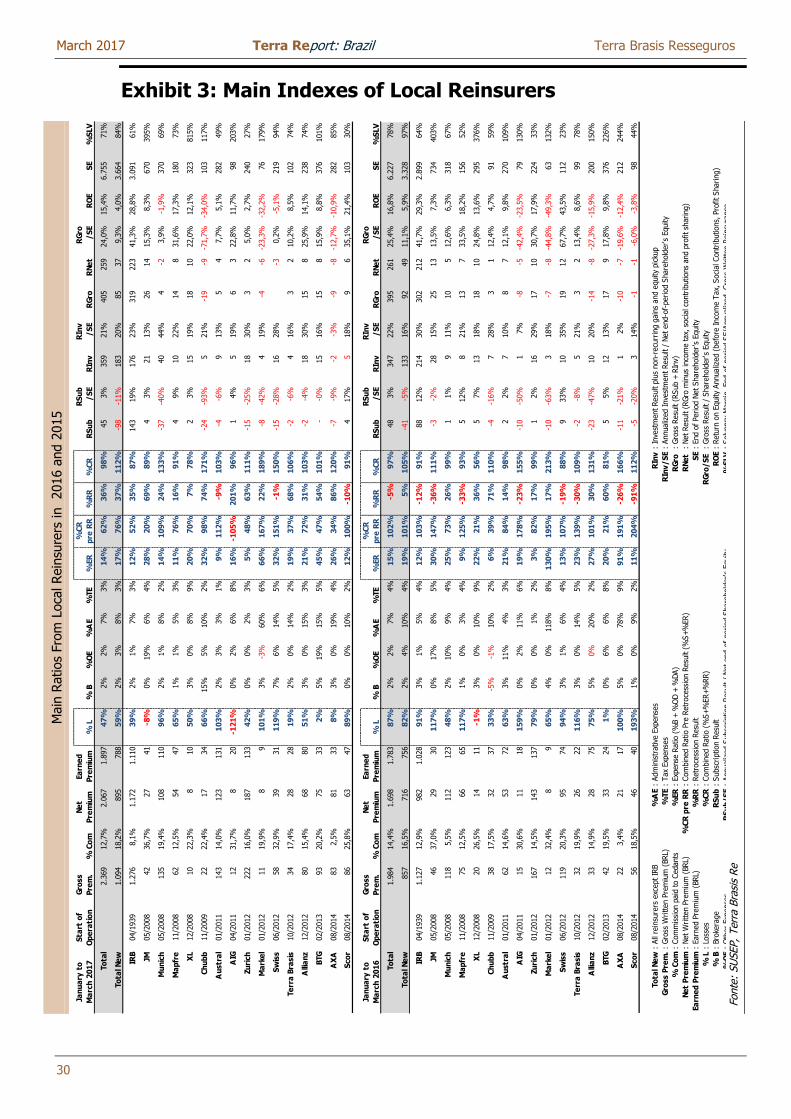
Exhibit 3: Main Indexes of Local Reinsurers
Main
Ratios
Fro
m L
oca
l Rein
sure
rs in
2016 a
nd 2
015
Fonte
: SU
SEP, Terr
a B
rasi
s R
e
Jan
ua
ry t
o
Ma
rch
20
17
Sta
rt o
f
Op
era
tio
n
Gro
ss
Pre
m.
% C
om
Ne
t
Pre
miu
m
Ea
rne
d
Pre
miu
m%
L%
B%
OE
%A
E%
TE
%ER
%C
R
pre
RR
%R
R%
CR
RS
ub
RS
ub
/S
ER
Inv
RIn
v
/S
ER
Gro
R
Ne
t
RG
ro
/S
ER
OE
SE
%S
LV
To
tal
2.3
69
12,7
%2.0
67
1.8
97
47
%2%
2%
7%
3%
14
%6
2%
36
%9
8%
45
3%
359
21%
405
259
24,0
%15,4
%6.7
55
71%
To
tal N
ew
1.0
94
18,2
%895
788
59
%2%
3%
8%
3%
17
%7
6%
37
%1
12
%-9
8-1
1%
183
20%
85
37
9,3
%4,0
%3.6
64
84%
IRB
04/1
939
1.2
76
8,1
%1.1
72
1.1
10
39
%2%
1%
7%
3%
12
%5
2%
35
%8
7%
143
19%
176
23%
319
223
41,3
%28,8
%3.0
91
61%
JM05/2
008
42
36,7
%27
41
-8%
0%
19%
6%
4%
28
%2
0%
69
%8
9%
43%
21
13%
26
14
15,3
%8,3
%670
395%
Mu
nic
h05/2
008
135
19,4
%108
110
96
%2%
1%
8%
2%
14
%1
09
%2
4%
13
3%
-37
-40%
40
44%
4-2
3,9
%-1
,9%
370
69%
Ma
pfr
e11/2
008
62
12,5
%54
47
65
%1%
1%
5%
3%
11
%7
6%
16
%9
1%
49%
10
22%
14
831,6
%17,3
%180
73%
XL
12/2
008
10
22,3
%8
10
50
%3%
0%
8%
9%
20
%7
0%
7%
78
%2
3%
15
19%
18
10
22,0
%12,1
%323
815%
Ch
ub
b11/2
009
22
22,4
%17
34
66
%15%
5%
10%
2%
32
%9
8%
74
%1
71
%-2
4-9
3%
521%
-19
-9-7
1,7
%-3
4,0
%103
117%
Au
str
al
01/2
011
143
14,0
%123
131
10
3%
2%
3%
3%
1%
9%
11
2%
-9%
10
3%
-4-6
%9
13%
54
7,7
%5,1
%282
49%
AIG
04/2
011
12
31,7
%8
20
-12
1%
0%
2%
6%
8%
16
%-1
05
%2
01
%9
6%
14%
519%
63
22,8
%11,7
%98
203%
Zu
rich
01/2
012
222
16,0
%187
133
42
%0%
0%
2%
3%
5%
48
%6
3%
11
1%
-15
-25%
18
30%
32
5,0
%2,7
%240
27%
Ma
rke
l01/2
012
11
19,9
%8
91
01
%3%
-3%
60%
6%
66
%1
67
%2
2%
18
9%
-8-4
2%
419%
-4-6
-23,3
%-3
2,2
%76
179%
Sw
iss
06/2
012
58
32,9
%39
31
11
9%
7%
6%
14%
5%
32
%1
51
%-1
%1
50
%-1
5-2
8%
16
28%
-30,2
%-5
,1%
219
94%
Te
rra
Bra
sis
10/2
012
34
17,4
%28
28
19
%2%
0%
14%
2%
19
%3
7%
68
%1
06
%-2
-6%
416%
32
10,2
%8,5
%102
74%
Alli
an
z12/2
012
80
15,4
%68
80
51
%3%
0%
15%
3%
21
%7
2%
31
%1
03
%-2
-4%
18
30%
15
825,9
%14,1
%238
74%
BTG
02/2
013
93
20,2
%75
33
2%
5%
19%
15%
5%
45
%4
7%
54
%1
01
%-
-0%
15
16%
15
815,9
%8,8
%376
101%
AX
A08/2
014
83
2,5
%81
33
8%
3%
0%
19%
4%
26
%3
4%
86
%1
20
%-7
-9%
-2-3
%-9
-8-1
2,7
%-1
0,9
%282
85%
Sco
r08/2
014
86
25,8
%63
47
89
%0%
0%
10%
2%
12
%1
00
%-1
0%
91
%4
17%
518%
96
35,1
%21,4
%103
30%
Jan
ua
ry t
o
Ma
rch
20
16
Sta
rt o
f
Op
era
tio
n
Gro
ss
Pre
m.
% C
om
Ne
t
Pre
miu
m
Ea
rne
d
Pre
miu
m%
L%
B%
OE
%A
E%
TE
%ER
%C
R
pre
RR
%R
R%
CR
RS
ub
RS
ub
/S
ER
Inv
RIn
v
/S
ER
Gro
R
Ne
t
RG
ro
/S
ER
OE
SE
%S
LV
To
tal
1.9
84
14,4
%1.6
98
1.7
83
87
%2%
2%
7%
4%
15
%1
02
%-5
%9
7%
48
3%
347
22%
395
261
25,4
%16,8
%6.2
27
78%
To
tal N
ew
857
16,5
%716
756
82
%2%
4%
10%
4%
19
%1
01
%5
%1
05
%-4
1-5
%133
16%
92
49
11,1
%5,9
%3.3
28
97%
IRB
04/1
939
1.1
27
12,9
%982
1.0
28
91
%3%
1%
5%
4%
12
%1
03
%-1
2%
91
%88
12%
214
30%
302
212
41,7
%29,3
%2.8
99
64%
JM05/2
008
46
37,0
%29
30
11
7%
0%
17%
8%
5%
30
%1
47
%-3
6%
11
1%
-3-2
%28
15%
25
13
13,5
%7,3
%734
403%
Mu
nic
h05/2
008
118
5,5
%112
123
48
%2%
10%
9%
4%
25
%7
3%
26
%9
9%
11%
911%
10
512,6
%6,3
%318
67%
Ma
pfr
e11/2
008
75
12,5
%66
65
11
7%
1%
0%
3%
4%
9%
12
5%
-33
%9
3%
512%
821%
13
733,5
%18,2
%156
52%
XL
12/2
008
20
26,5
%14
11
-1%
3%
0%
10%
9%
22
%2
1%
36
%5
6%
57%
13
18%
18
10
24,8
%13,6
%295
376%
Ch
ub
b11/2
009
38
17,5
%32
37
33
%-5
%-1
%10%
2%
6%
39
%7
1%
11
0%
-4-1
6%
728%
31
12,4
%4,7
%91
59%
Au
str
al
01/2
011
62
14,6
%53
72
63
%3%
11%
4%
3%
21
%8
4%
14
%9
8%
22%
710%
87
12,1
%9,8
%270
109%
AIG
04/2
011
15
30,6
%11
18
15
9%
0%
2%
11%
6%
19
%1
78
%-2
3%
15
5%
-10
-50%
17%
-8-5
-42,4
%-2
3,5
%79
130%
Zu
rich
01/2
012
167
14,5
%143
137
79
%0%
0%
1%
2%
3%
82
%1
7%
99
%1
2%
16
29%
17
10
30,7
%17,9
%224
33%
Ma
rke
l01/2
012
12
32,4
%8
96
5%
4%
0%
118%
8%
13
0%
19
5%
17
%2
13
%-1
0-6
3%
318%
-7-8
-44,8
%-4
9,3
%63
132%
Sw
iss
06/2
012
119
20,3
%95
74
94
%3%
1%
6%
4%
13
%1
07
%-1
9%
88
%9
33%
10
35%
19
12
67,7
%43,5
%112
23%
Te
rra
Bra
sis
10/2
012
32
19,9
%26
22
11
6%
3%
0%
14%
5%
23
%1
39
%-3
0%
10
9%
-2-8
%5
21%
32
13,4
%8,6
%99
78%
Alli
an
z12/2
012
33
14,9
%28
75
75
%5%
0%
20%
2%
27
%1
01
%3
0%
13
1%
-23
-47%
10
20%
-14
-8-2
7,3
%-1
5,9
%200
150%
BTG
02/2
013
42
19,5
%33
24
1%
0%
6%
6%
8%
20
%2
1%
60
%8
1%
55%
12
13%
17
917,8
%9,8
%376
226%
AX
A08/2
014
22
3,4
%21
17
10
0%
5%
0%
78%
9%
91
%1
91
%-2
6%
16
6%
-11
-21%
12%
-10
-7-1
9,6
%-1
2,4
%212
244%
Sco
r08/2
014
56
18,5
%46
40
19
3%
1%
0%
9%
2%
11
%2
04
%-9
1%
11
2%
-5-2
0%
314%
-1-1
-6,0
%-3
,8%
98
44%
To
tal N
ew
: All
rein
sure
rs e
xcept IR
B%
AE
RIn
v:
Inve
stm
ent Resu
lt p
lus
non-r
ecu
rrin
g g
ain
s and e
quity
pic
kup
Gro
ss P
rem
.:
Gro
ss W
ritten P
rem
ium
(BRL)
%TE
RIn
v/
SE
: Annualiz
ed Inve
stm
ent Resu
lt /
Net end-o
f-period S
hare
hold
er's
Equity
% C
om
: Com
mis
sion p
aid
to C
edants
%ER
: Exp
ense
Ratio (
%B +
%O
D +
%DA)
RG
ro
: Gro
ss R
esu
lt (
RSub +
RIn
v)
Ne
t P
rem
ium
: Net W
ritten P
rem
ium
(BRL)
%C
R p
re R
R:
Com
bin
ed R
atio P
re R
etr
oce
ssio
n R
esu
lt (
%S+%
ER)
RN
et
: Net Resu
lt (
RGro
min
us
inco
me tax,
soci
al co
ntr
ibutions
and p
rofit sh
aring)
Ea
rne
d P
rem
ium
: Earn
ed P
rem
ium
(BRL)
%R
R:
Retr
oce
ssio
n R
esu
ltS
E:
End o
f Period N
et Share
hold
er's
Equity
% L
: Lo
sses
%C
R:
Com
bin
ed R
atio (
%S+%
ER+%
RR)
RG
ro/
SE
: Gro
ss R
esu
lt /
Share
hold
er's
Equity
% B
: Bro
kera
ge
RS
ub
: Subsc
ription R
esu
ltR
OE
: Retu
rn o
n E
quity
Annualiz
ed (
befo
re Inco
me T
ax,
Soci
al Contr
ibutions,
Pro
fit Sharing)
%O
E:
Oth
er
Exp
ense
sR
Su
b/
SE
: Annualiz
ed S
ubsc
ription R
esu
lt /
Net end-o
f-period S
hare
hold
er's
Equity
%S
LV
: Solv
ency
Marg
in, End-o
f-period S
E/A
nnualiz
ed Gro
ss W
ritten R
ein
sura
nce
: Adm
inis
trative
Exp
ense
s
: Tax
Exp
ense
s
March 2017 Terra Report: Brazil Terra Brasis Resseguros
31
Acknowledgements
It is with enthusiasm that we continue to publish our market report, Terra Report, a research piece covering the Brazilian Reinsurance Market, which we share with our clients, partners, and colleagues.
We are immensely grateful to SUSEP for making its databank available to the public. We also thank ANS and CNSeg for information used herein. The report also contains analyses and adjustments made internally by Terra Brasis and, in this way, we apologize in advance for possible inaccuracies contained in this publication.
We hope our readers appreciate this work as much as we appreciate developing it. Without a doubt, it is extremely gratifying to be involved in the Brazilian reinsurance market at such an important moment of its development. Any criticism, comment, or suggestion for this work is very welcome.
March 2017 Terra Report: Brazil Terra Brasis Resseguros
32
Contacts
Name Title Telephone Email
Paulo Eduardo de Freitas Botti Chief Executive Officer +55 11 3320 5056 [email protected]
Carlos Roberto De Zoppa Technical Executive Vice President +55 11 3320 5058 [email protected]
Bernardo Nolasco Chief Investment Officer +55 11 3320 5165 [email protected]
Rodrigo Botti, ARe General Manager, CFO & COO +55 11 3320 5050 [email protected]
Paulo Hayakawa Chief Underwriting Officer +55 11 3320 5053 [email protected]
Beatriz Americano Chief Administrative Officer +55 11 3320 5051 [email protected]
Rafael Gersely Risk Coordinator +55 11 3320 5066 [email protected]
Dioniso Araujo Risk Analyst +55 11 3320 5052 [email protected]
Camila Palmeira Risk Intern +55 11 3320 5052 [email protected]

This document was prepared by Terra Brasis Re S.A. ("Terra Brasis Re") for informational purposes only.
Terra Brasis Re, its partners, companies under common control, its directors, employees and agents do not express any opinion, do not guarantee, nor assume any responsibility for the adequacy, consistency, or completeness of any information contained herein or any omission regarding this report. This publication is also not designed to be a complete statement or summary of markets or strategies discussed in this document. None of the people mentioned in this paragraph shall be liable for any loss or damage of any kind arising from the use of the information contained herein, or which may be obtained by third parties by any other means. Terra Brasis Re should not be construed as providing financial, tax, or legal advice.
The information contained herein was obtained from public sources, and Terra Brasis Re has not conducted an independent verification of this information. Any projections or forecasts contained in this report are based on subjective estimates and assumptions about events and circumstances that have not yet occurred and are subject to significant variations. Thus, it is not possible to ensure that results from any projections or forecasts
contained in this document will be effectively verified.
This publication is only valid on the date hereof, and future events could undermine its conclusions. Terra Brasis Re assumes no responsibility to update, revise, amend or cancel this publication due to any future event, unless previously requested.
It is not the obligation of Terra Brasis Re to implement the procedures in this document, nor is Terra Brasis Re responsible for any inaccuracies in any negotiations or transactions relating to this report. No investment or financial decision should be based solely on the information presented here.
All information contained in this report should be kept strictly confidential and can only be released, quoted, or reproduced in whole or in part, with the prior written consent of Terra Brasis Re for people who have agreed to treat such information as confidential
Head Office Av. Presidente Juscelino Kubitschek, 1700, 12º Andar Itaim Bibi, São Paulo, SP 04543-000 Colombia Office Carrera 9 Nº 113 -52 Oficina 1207, Edifício Torres Unidas 2 P.H. Bogotá, Colômbia