Embed Size (px)
Citation preview
NEW MEXICO DEPARTMENT OF TRANSPORTATION
RREESSEEAARRCCHH BBUURREEAAUU
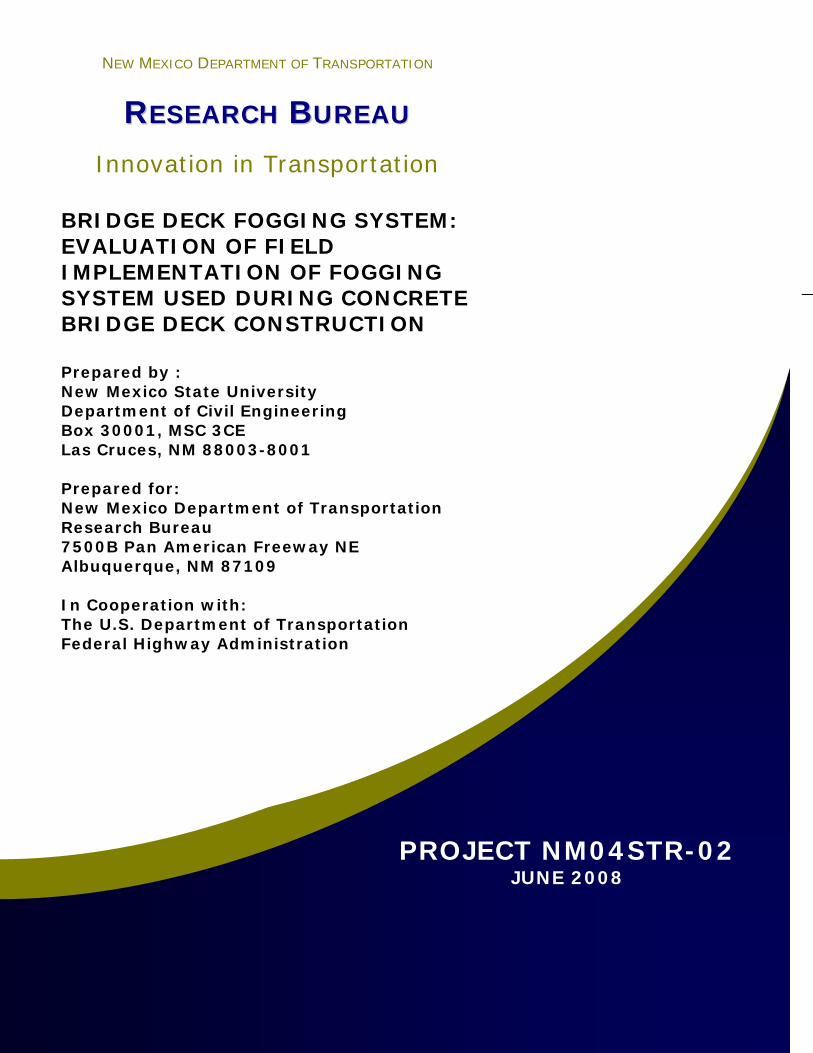
Innovation in Transportation BRIDGE DECK FOGGING SYSTEM: EVALUATION OF FIELD IMPLEMENTATION OF FOGGING SYSTEM USED DURING CONCRETE BRIDGE DECK CONSTRUCTION Prepared by : New Mexico State University Department of Civil Engineering Box 30001, MSC 3CE Las Cruces, NM 88003-8001 Prepared for: New Mexico Department of Transportation Research Bureau 7500B Pan American Freeway NE Albuquerque, NM 87109 In Cooperation with: The U.S. Department of Transportation Federal Highway Administration
PROJECT NM04STR-02 JUNE 2008
1. NMDOT Report No. NM04STR-02
2. Govt. Accession No. 3. Recipient Catalog No.:
5. Report Date June 2008
4. Title and Subtitle Bridge Deck Fogging System: Evaluation of Field Implementation of A Fogging System Used During Bridge Deck Construction 6. Performing Organization Code
7. Author(s) Ahilan Selladurai, Craig Newtson
8. Performing Organization Report No. NM04STR-02
10. Work Unit No. (TRAIS)
9. Performing Organization Name and Address New Mexico State University Department of Civil Engineering Box 3001, MSC 3CE Las Cruces, NM 88003-800
11. Contract or Grant No. C04759
13. Type of Report and Period Covered 12. Sponsoring Agency Name and Address NMDOT Research Bureau 7500B Pan American Freeway NE PO Box 94690
Albuquerque, NM 87199-4690
14. Sponsoring Agency Code
15. Supplementary Notes Will Dooley, USDOT FHWA, New Mexico Division; Jimmy Camp, Bridge Engineer, NMDOT; Rais Rizvi, Research Engineer, NMDOT; Virgil Valdez, Research Analyst, NMDOT. 16. Abstract The objective of this research was to implement and evaluate a fogging system used to provide initial cure for a concrete bridge deck construction project. To accomplish this, Bridges 5500 and 5701 along NM26 were selected. Bridge 5500 was placed using the fogging system and Bridge 5701 was placed using conventional curing methods. Since weather conditions influence evaporation rate, weather conditions were monitored throughout the construction processes. A windbreak was erected to reduce the wind speed during the placement and fogging of Bridge 5500. Visual inspections of cracks were conducted 7, 14, 21, 28 and 56 days after the construction of each bridge. Bridge 5500 exhibited substantially more cracks than Bridge 5701. The additional cracking in Bridge 5500 is attributed to more severe evaporation conditions during placement and inefficiencies associated with the fogging system. Cracking occurred in both bridges to concrete that was exposed to evaporation rates that exceeded 0.1 lb/ft2/hr. 17. Key Words Bridge deck, concrete, fogging, misting, curing
18. Distribution Statement Available from NMDOT Research Bureau
19. Security Classification (of this report) Unclassified
20. Security Class. (of this page) Unclassified
21. No. of Pages
52
22. Price
Form DOT F 1700.7(8-72)
BRIDGE DECK FOGGING SYSTEM:
EVALUATION OF FIELD IMPLEMENTATION OF A FOGGING SYSTEM USED DURING
CONCRETE BRIDGE DECK CONSTRUCTION
by
Ahilan Selladurai Graduate Research Assistant New Mexico State University
Craig M. Newtson Associate Professor
New Mexico State University
Report NM04STR-02
A report on research sponsored by
New Mexico Department of Transportation Research Bureau
in cooperation with
The U.S. Department of Transportation, Federal Highway Administration
June 2008
NMDOT Research Bureau 7500B Pan American Freeway
PO Box 94690 Albuquerque, NM 87199-4690
© 2008 New Mexico Department of Transportation
PREFACE
The research reported herein evaluates the field implementation of a fogging system used during concrete bridge deck construction. The purpose of this work was to investigate the effectiveness of fogging during construction as a method for mitigating shrinkage cracking. To accomplish this objective, Bridge decks 5500 and 5701 were selected along NM26. Bridge deck 5500 was placed using the fogging system and Bridge deck 5701 was placed using conventional curing methods. The bridges were compared based on the weather conditions during placement and visual inspection of cracks in the weeks following the construction of the bridges.
NOTICE
The United State Government and the State of New Mexico do not endorse products or manufacturers. Trade or manufacturers’ names appear herein solely because they are considered essential to the object of this report. This information is available in alternative accessible formats. To obtain an alternative format, contact the NMDOT Research Bureau, 7500B Pan American Freeway, Albuquerque, NM 87109 (P.O. Box 94690, Albuquerque, NM 87199-4690) or by telephone (505) 841-9145.
DISCLAIMER
This report presents the results of research conducted by the author(s) and does not necessarily reflect the views of the New Mexico Department of Transportation or the Department of Transportation Federal Highway Administration. This report does not constitute a standard or specification.
i
ABSTRACT The objective of this research was to implement and evaluate a fogging system used to provide
initial cure for a concrete bridge deck construction project. To accomplish this, Bridges 5500
and 5701 along NM26 were selected. Bridge deck 5500 was placed using the fogging system
and Bridge deck 5701 was placed using conventional curing methods. Since weather conditions
influence evaporation rate, weather conditions were monitored throughout the construction
processes. A windbreak was erected to reduce the wind speed during the placement and fogging
of Bridge 5500. Visual inspections of cracks were conducted 7, 14, 21, 28 and 56 days after the
construction of each bridge. Bridge deck 5500 exhibited substantially more cracks than Bridge
5701. The additional cracking in Bridge 5500 is attributed to more severe evaporation
conditions during placement and inefficiencies associated with the fogging system. Cracking
occurred in both bridges to concrete that was exposed to evaporation rates that exceeded 0.1
lb/ft2/hr.
ii
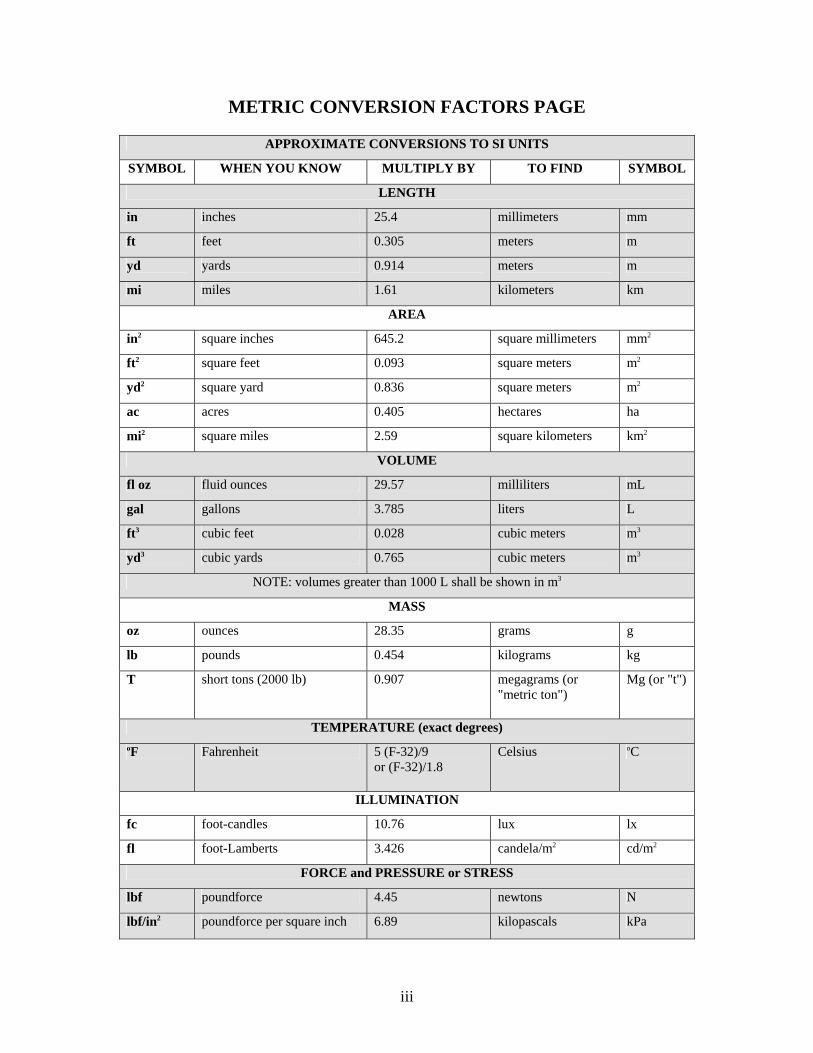
METRIC CONVERSION FACTORS PAGE
APPROXIMATE CONVERSIONS TO SI UNITS
SYMBOL WHEN YOU KNOW MULTIPLY BY TO FIND SYMBOL
LENGTH
in inches 25.4 millimeters mm
ft feet 0.305 meters m
yd yards 0.914 meters m
mi miles 1.61 kilometers km
AREA
in2 square inches 645.2 square millimeters mm2
ft2 square feet 0.093 square meters m2
yd2 square yard 0.836 square meters m2
ac acres 0.405 hectares ha
mi2 square miles 2.59 square kilometers km2
VOLUME
fl oz fluid ounces 29.57 milliliters mL
gal gallons 3.785 liters L
ft3 cubic feet 0.028 cubic meters m3
yd3 cubic yards 0.765 cubic meters m3
NOTE: volumes greater than 1000 L shall be shown in m3
MASS
oz ounces 28.35 grams g
lb pounds 0.454 kilograms kg
T short tons (2000 lb) 0.907 megagrams (or "metric ton")
Mg (or "t")
TEMPERATURE (exact degrees) oF Fahrenheit 5 (F-32)/9
or (F-32)/1.8 Celsius oC
ILLUMINATION
fc foot-candles 10.76 lux lx
fl foot-Lamberts 3.426 candela/m2 cd/m2
FORCE and PRESSURE or STRESS
lbf poundforce 4.45 newtons N
lbf/in2 poundforce per square inch 6.89 kilopascals kPa
iii
TABLE OF CONTENTS
Page INTRODUCTION ..................................................................................................... 1 BACKGROUND AND LITERATURE REVIEW ................................................... 3 Cracks in concrete................................................................................................ 3 Design based parameters.................................................................................. 4 Material based parameters ............................................................................... 4 Construction related parameters ...................................................................... 4 Shrinkage. ............................................................................................................ 4 Type of Shrinkage............................................................................................ 5 Autogenous shrinkage.................................................................................. 5 Drying shrinkage.......................................................................................... 6 Thermal shrinkage ....................................................................................... 6 Carbonation.................................................................................................. 6 Factors influencing shrinkage.......................................................................... 6 Hydration ..................................................................................................... 6 Weather conditions ...................................................................................... 7 Water-cement ratio....................................................................................... 7 Admixtures................................................................................................... 9 Curing .......................................................................................................... 7 Cement type ................................................................................................. 9 Aggregate properties.................................................................................... 9 Curing of concrete................................................................................................ 9 Curing methods and materials ......................................................................... 9 Ponding and immersion ............................................................................... 10 Fogging and sprinkling ................................................................................ 10 Wet coverings .............................................................................................. 10 Methods based on moisture retention .......................................................... 11 Curing period and temperature. ....................................................................... 11 EXPERIMENTAL METHODS................................................................................. 13 Site location and description................................................................................ 13 Fogging system .................................................................................................... 13 Water pumps/Water tanks/Pressure gauges ........................................................ 15 Windbreak ........................................................................................................... 18 Weather monitoring instrumentation .................................................................. 19 Curing compound................................................................................................. 21 Construction observations ................................................................................... 21 Crack observations .............................................................................................. 22 BRIDGE DECK CONSTRUCTION......................................................................... 23 Construction sequence monitoring ...................................................................... 23 Windbreak............................................................................................................ 27 Weather monitoring ............................................................................................. 27 Evaporation rate ................................................................................................... 31 Fogging system operation observations............................................................... 32
iv
CRACK OBSERVATIONS ...................................................................................... 34 Observations and analysis.................................................................................... 34 Crack observations........................................................................................... 34 Observations of cracks at 7 days.................................................................. 34 Observations of cracks at 14 days................................................................ 44 Observations of cracks at 21 days................................................................ 44 Observations of cracks at 28 days................................................................ 45 Observations of cracks at 56 days................................................................ 45 Possible reasons for cracks .............................................................................. 45 Placement duration....................................................................................... 45 Weather conditions ...................................................................................... 46 Evaporation rate ........................................................................................... 46 Windbreak.................................................................................................... 47 Other reasons ............................................................................................... 47 CONCLUSIONS AND RECOMMENDATIONS .................................................... 49 Conclusions.......................................................................................................... 49 Recommendations................................................................................................ 50 REFERENCES .......................................................................................................... 51
v
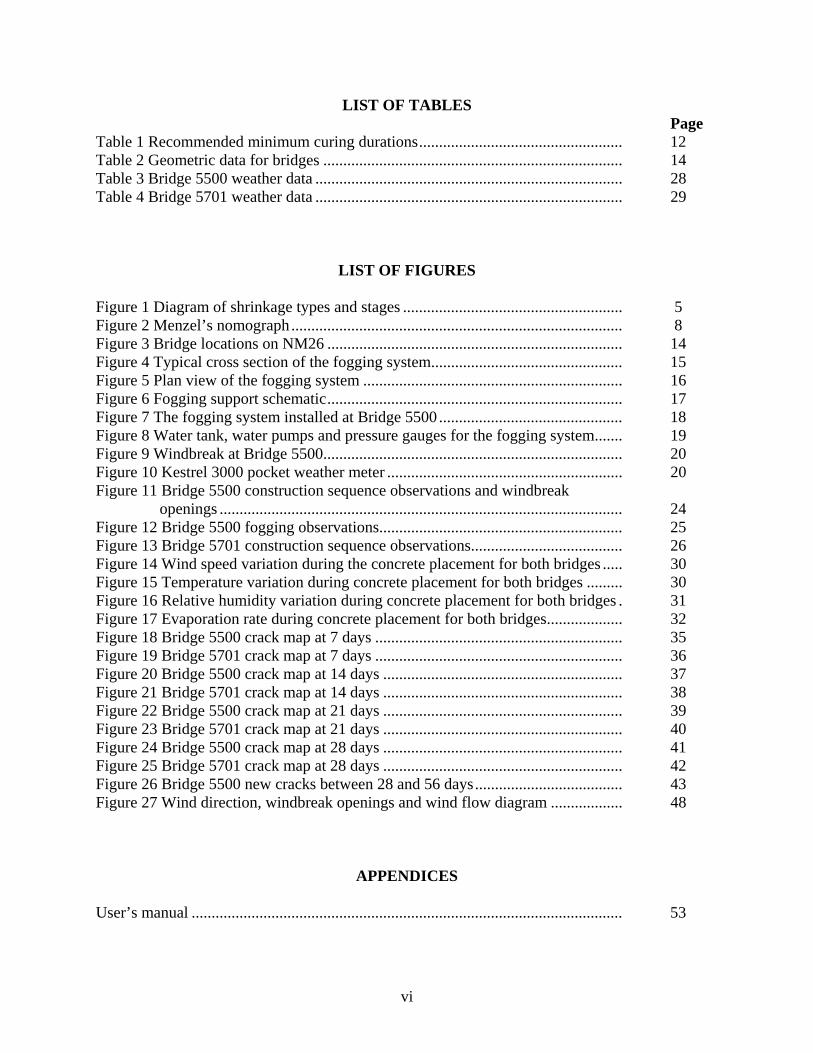
LIST OF TABLES Page
Table 1 Recommended minimum curing durations................................................... 12 Table 2 Geometric data for bridges ........................................................................... 14 Table 3 Bridge 5500 weather data ............................................................................. 28 Table 4 Bridge 5701 weather data ............................................................................. 29
LIST OF FIGURES
Figure 1 Diagram of shrinkage types and stages ....................................................... 5 Figure 2 Menzel’s nomograph................................................................................... 8 Figure 3 Bridge locations on NM26 .......................................................................... 14 Figure 4 Typical cross section of the fogging system................................................ 15 Figure 5 Plan view of the fogging system ................................................................. 16 Figure 6 Fogging support schematic.......................................................................... 17 Figure 7 The fogging system installed at Bridge 5500 .............................................. 18 Figure 8 Water tank, water pumps and pressure gauges for the fogging system....... 19 Figure 9 Windbreak at Bridge 5500........................................................................... 20 Figure 10 Kestrel 3000 pocket weather meter ........................................................... 20 Figure 11 Bridge 5500 construction sequence observations and windbreak openings ..................................................................................................... 24 Figure 12 Bridge 5500 fogging observations............................................................. 25 Figure 13 Bridge 5701 construction sequence observations...................................... 26 Figure 14 Wind speed variation during the concrete placement for both bridges ..... 30 Figure 15 Temperature variation during concrete placement for both bridges ......... 30 Figure 16 Relative humidity variation during concrete placement for both bridges . 31 Figure 17 Evaporation rate during concrete placement for both bridges................... 32 Figure 18 Bridge 5500 crack map at 7 days .............................................................. 35 Figure 19 Bridge 5701 crack map at 7 days .............................................................. 36 Figure 20 Bridge 5500 crack map at 14 days ............................................................ 37 Figure 21 Bridge 5701 crack map at 14 days ............................................................ 38 Figure 22 Bridge 5500 crack map at 21 days ............................................................ 39 Figure 23 Bridge 5701 crack map at 21 days ............................................................ 40 Figure 24 Bridge 5500 crack map at 28 days ............................................................ 41 Figure 25 Bridge 5701 crack map at 28 days ............................................................ 42 Figure 26 Bridge 5500 new cracks between 28 and 56 days..................................... 43 Figure 27 Wind direction, windbreak openings and wind flow diagram .................. 48
APPENDICES
User’s manual ............................................................................................................ 53
vi
INTRODUCTION
Concrete is one of the major construction materials in the civil engineering industry. Even
though concrete is widely used to construct bridges in North America, shrinkage cracks are a
common problem for concrete bridge decks. In 2001, after construction of the Big-I (intersection
of I-25 and I-40) in Albuquerque, shrinkage cracks were observed in 18 out of 56 newly
constructed bridge decks. Such cracking is common in North America and can result in
accelerated deterioration of a bridge and potential structural problems at later ages1. After the
Big-I project, NMDOT began funding research to find effective methods for reducing cracking
in bridge deck construction.
Shrinkage in concrete is the result of complex volume changes such as chemical shrinkage,
drying shrinkage and thermal shrinkage. Tensile stresses are developed due to these volumetric
changes at an age when the concrete has low strength. Development of shrinkage cracks begins
just after concrete placing and it may continue through the life of the concrete.
Curing is the most important parameter directly related to shrinkage and thermal cracking of
concrete. Fogging and sprinkling water are excellent curing methods when temperatures are
above freezing and there is low humidity2. The current project is the result of two phases
investigating the effectiveness of fogging to reduce shrinkage. The first phase focused on
laboratory testing using different curing methods. That work indicated that misting can reduce
early-age shrinkage in concrete by as much as 85%3. The second phase focused on design issues
related to fogging under field conditions.
The objective of this research was the evaluation of a misting system intended to reduce early
age shrinkage in bridge deck construction. This evaluation consisted of implementing the
1

fogging system on a bridge deck construction project and comparing the project with the
construction of another bridge constructed using conventional curing methods.
2
BACKGROUND AND LITERATURE REVIEW
Concrete is a durable and effective construction material that is widely used all over the world.
The durability of concrete is defined as “the ability of the material to remain serviceable”4.
However, cracks often develop in concrete that cause reduced service life. A shrinkage crack
that occurs due to moisture loss is one common type of crack. Consequently, shrinkage is a
major issue in producing a durable structure. If early-age cracking of concrete could be
eliminated, concrete bridge deck life would be extended and the cost of repairs would be
reduced.
Durability and other concrete properties are significantly influenced by curing since it is largely
responsible for hydration of cement5. Fogging is one of the most effective ways to reduce drying
shrinkage at early ages, because it reduces the evaporation of water from concrete substantially.
CRACKS IN CONCRETE
Many concrete bridge decks in America have cracked after construction, and a 1995 survey of all
50 states indicated that more than 100,000 bridges had developed early-age cracking 6. The
early-age cracks may not be considered critical in the beginning, but they can cause serious
problems as time passes7. These cracks allow moisture and other chemicals to penetrate into the
concrete. Which may cause corrosion of reinforcing steel in concrete, spalling of the concrete
deck, and deterioration of the bridge super structure8? Many researchers have investigated early-
age concrete cracking and have identified numerous factors that influence cracking. Basically
these factors can be classified into three major categories; design based parameters, material
based parameters and construction related parameters.
3
Design based parameters
A number of design concepts influence cracking of concrete structures. End restraints and
support have substantial influence on cracks in bridge decks. For example, simply supported
elements show less cracking compared to continuous members9. Also, roller supports prevent
thermal cracks in bridge elements such as beams, slabs and pre-cast elements. Another design
provision that influences cracks is providing transverse, temperature and shrinkage steel in
concrete structures. Practically, this provision has little influence on cracking because most
designs already provide temperature and shrinkage steel.
Material based parameters
Many studies have found that material based parameters have substantial influence on cracking9.
Examples of material related parameters are cement type, admixtures, water-cement ratio and
aggregate properties. Some of these material based parameters affect material properties such as
creep and shrinkage. These properties are also affected by construction related parameters. For
example, shrinkage and creep are affected by curing methods and other environmental factors.
Construction related parameters
Construction related parameters also have considerable effects on the formation of cracks in
concrete. Examples of construction related parameters are air temperature, weather conditions,
curing methods, curing period, vibration methods and finishing procedures. Weather conditions
include wind speed and relative humidity9.
SHRINKAGE
The general definition of shrinkage is “reduced in amount or value”. Shrinkage in concrete is
defined as a decrease in either length or volume of the material resulting from temperature
4
changes, loss of water or chemical changes2. Shrinkage plays a major role in early-age cracking
in concrete.
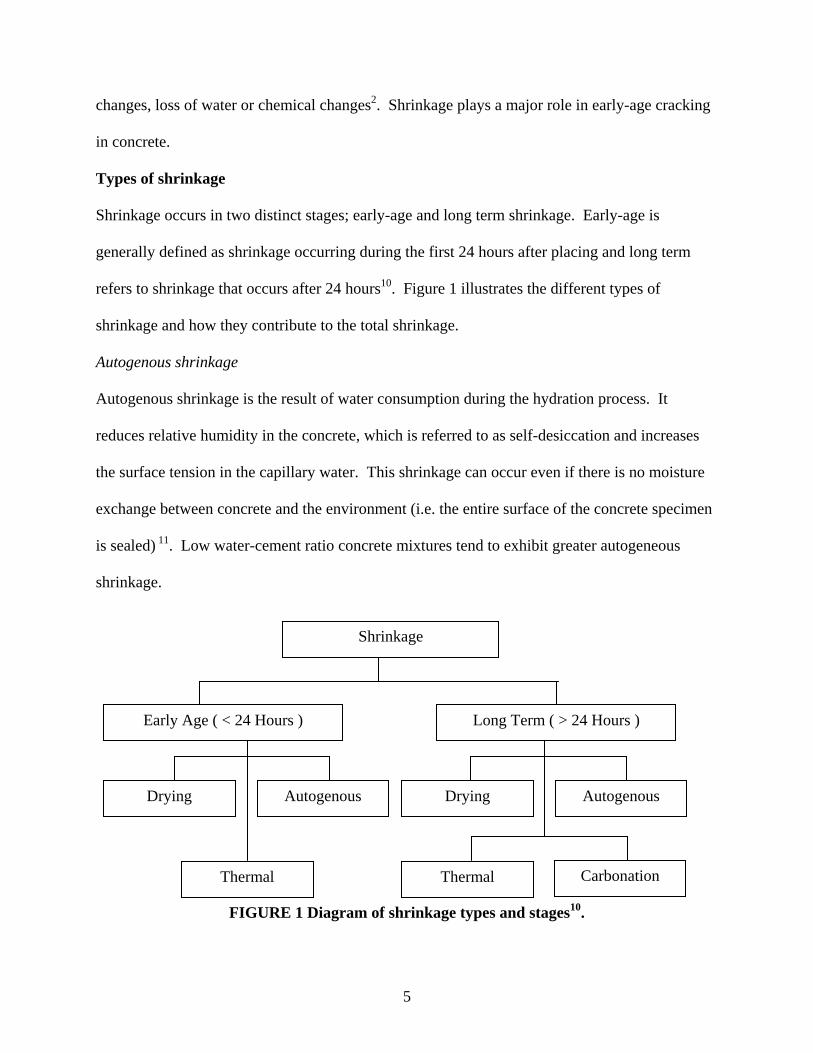
Types of shrinkage
Shrinkage occurs in two distinct stages; early-age and long term shrinkage. Early-age is
generally defined as shrinkage occurring during the first 24 hours after placing and long term
refers to shrinkage that occurs after 24 hours10. Figure 1 illustrates the different types of
shrinkage and how they contribute to the total shrinkage.
Autogenous shrinkage
Autogenous shrinkage is the result of water consumption during the hydration process. It
reduces relative humidity in the concrete, which is referred to as self-desiccation and increases
the surface tension in the capillary water. This shrinkage can occur even if there is no moisture
exchange between concrete and the environment (i.e. the entire surface of the concrete specimen
is sealed) 11. Low water-cement ratio concrete mixtures tend to exhibit greater autogeneous
shrinkage.
FIGURE 1 Diagram of shrinkage types and stages10.
Early Age ( < 24 Hours )
Drying Autogenous
Thermal
Drying
Thermal Carbonation
Autogenous
Long Term ( > 24 Hours )
Shrinkage
5
Drying shrinkage
Drying shrinkage is a reduction in the volume of concrete due to loss of water from concrete to
the environment11. Drying shrinkage can occur at early ages and long term. Some researchers
have referred to early-age drying shrinkage as “plastic shrinkage”. The use of fogging or misting
during curing is an efficient way to reduce early-age drying shrinkage2.
Thermal shrinkage
Thermal shrinkage is a result of temperature changes in the concrete. Cooling after the peak
temperature during the hydration process contributes to thermal shrinkage10. Generally, rapid
temperature changes are the primary cause of thermal cracks.
Carbonation
Carbonation occurs in hardened concrete due to a chemical reaction between cement hydration
products and carbon dioxide. This type of shrinkage occurs in the paste near the surface2. This
type of shrinkage occurs over several years and falls in the long term shrinkage category.
Factors influencing shrinkage
Concrete shrinkage is influenced by many internal and external factors such as weather, choice
of concrete materials, admixtures and type of curing. The following sub-sections provide brief
descriptions of these factors.
Hydration
The chemical reaction between water and the chemical compounds in cement is called
hydration2. Since the products of this reaction occupy less space than the reactants, this reaction
causes chemical shrinkage in concrete. Additionally, this reaction generates heat that causes
thermal expansion. Cooling from the peak temperature during the hydration process causes
thermal shrinkage.
6
Weather conditions
Weather is also an important factor when considering concrete shrinkage. Weather conditions
include wind speed, air temperature, and relative humidity. Weather conditions significantly
affect the evaporation rate of water from concrete. Shrinkage cracks often occur when the
evaporation rate exceeds the concrete bleeding rate. In normal practice, concrete placing is
avoided during windy conditions to reduce the cracking of concrete because wind increases the
evaporation rate of water. The evaporation rate can be calculated using Menzel’s12 nomograph
presented in Figure 2. The variables used in the nomograph are relative humidity, temperature,
air temperature and wind velocity. Evaporation rate is determined in lb/ft2/hr.
Water-cement ratio
Water-cement ratio is the most important factor when considering the quality of concrete. An
excessively high or low water-cement ratio can cause autogenous shrinkage, about 80 percent of
which occurs at early ages according to many studies. High-performance concretes with low
water-cement ratios increase the possibility of excessive autogenous shrinkage13.
Admixtures
Admixtures can have substantial influence on concrete shrinkage. Shrinkage reducing
admixtures have been shown by numerous investigators to reduce drying shrinkage.
Accelerators that increase the heat of hydration to accelerate the setting time of concrete can also
increase shrinkage in concrete14.
Curing
Curing is another important factor influencing concrete shrinkage. Different methods of curing
are applied to concrete depending on the purpose and location of the construction. This topic is
discussed in the next section in greater detail.
7
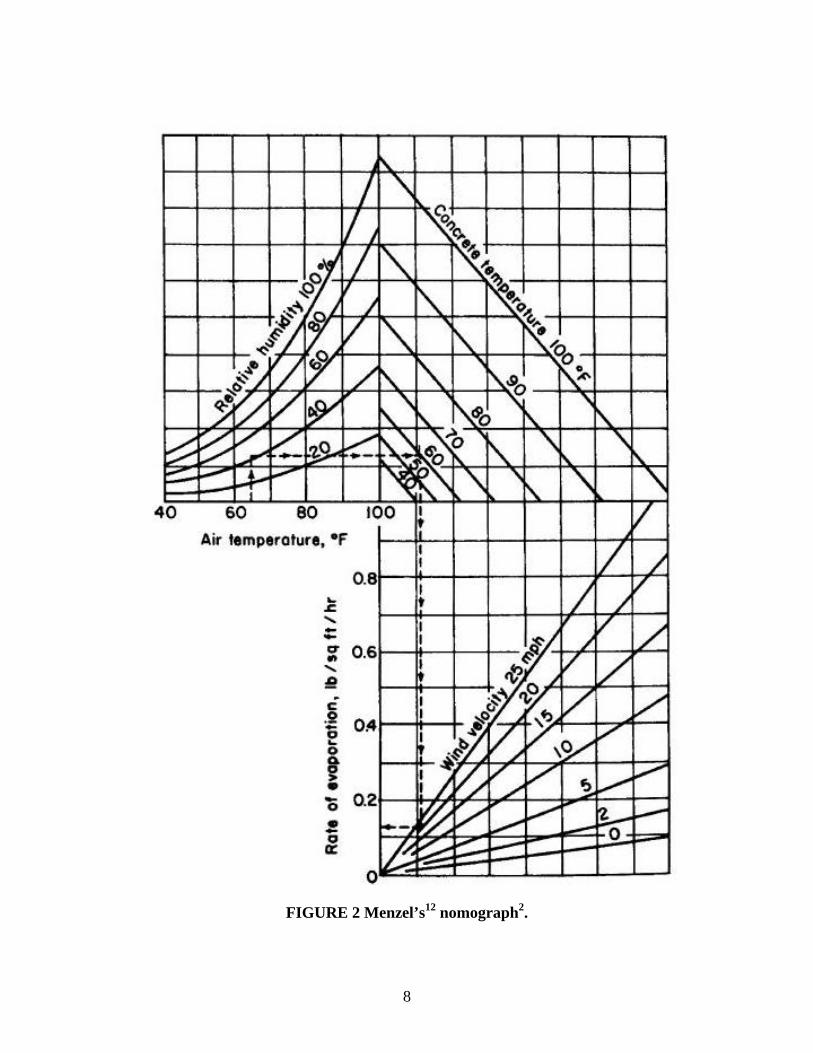
FIGURE 2 Menzel’s12 nomograph2.
8
Cement type
The chemical compositions of various types of portland cement produce different peak
temperatures during hydration and have different chemical shrinkage characteristics.
Consequently, the choice of cement type will influence the overall shrinkage of the concrete.
Supplementary materials also influence shrinkage of concrete. Pozzolanic materials generally
reduce concrete shrinkage. However, this effect is small compared to the effects of other
parameters15.
Aggregate properties
Aggregate properties also influence shrinkage since concrete is a composite material composed
of cement, fine aggregate and coarse aggregate. Larger coarse aggregate top size and higher
aggregate contents reduce shrinkage because aggregates are the material that shrinks the least in
concrete11.
CURING OF CONCRETE
Curing is defined as the maintenance of sufficient moisture in the concrete for the first several
days after placement2. Curing prevents moisture loss from the concrete. Complete hydration
occurs when proper curing is provided to concrete16. The extent of hydration has a major
influence on hardened concrete properties such as strength, permeability, abrasion resistance,
volume stability, and resistance to freezing and thawing16.
Curing methods and materials
Concrete should be kept moist at a favorable temperature using the following recommendations2:
a. Maintain the presence of the mixing water in the concrete. This is generally accomplished
by ponding or immersion, spraying or fogging, and saturated coverings.
9
b. Reduce the loss of mixing water from the concrete. This can be accomplished by
covering the concrete with a plastic sheet, other impervious paper, or a membrane-
forming curing compound.
c. Accelerate strength gain by supplying additional water or heat to the concrete. This is
usually accomplished by using steam curing, heating coils or electrically heated forms or
pads.
Ponding and immersion
Ponding is a common practice and an easy way to cure flatwork. Ponding is an ideal method for
preventing moisture losses from concrete and it also effectively maintains a uniform temperature
along the concrete surface2. Ponding does require more labor and supervision, so it is not
frequently used on large scale projects2. Immersion is not a common method of curing in
industry because of practical issues, but it is commonly used in laboratories.
Fogging and sprinkling
Fogging or sprinkling is an effective method of curing when ambient temperatures are above
freezing16. Fogging increases the relative humidity of the air over the concrete, which
significantly reduces evaporation of water from the concrete2. Fogging is a good way to reduce
plastic shrinkage cracking. The cost of a fogging system can be the main disadvantage. The
system requires an ample supply of water and good supervision2. If the sprinkling is applied in
intervals, concrete must be kept moist and prevented from drying between two applications using
wet burlap or similar materials16.
Wet coverings
Moisture can be held by burlap, cotton mats or other coverings of absorbent materials on
horizontal and vertical surfaces. These materials must not contain harmful substances, such as
10
sugar, fertilizer or any other materials that can react with concrete or concrete constituents16.
There should be considerable care taken in applying these coverings since dry burlap can wick
water from the concrete.
Methods based on moisture retention
Sheets or liquid membrane-forming compounds that can reduce or minimize evaporation losses
of water from concrete are also a common curing method16. These methods have the following
advantages:
a. They do not need a water source, but it is necessary to ensure that they do not absorb
water from the concrete.
b. They require less labor than burlap.
c. They can be applied earlier than other methods.
Numerous products are available in practice such as plastic film, reinforced paper, and liquid
membrane-forming compounds16.
Curing period and temperature
Curing should be continued until the concrete achieves 70% of the specified 28 day strength16.
Table 1 provides minimum recommended curing periods for different types of concrete mixtures.
11
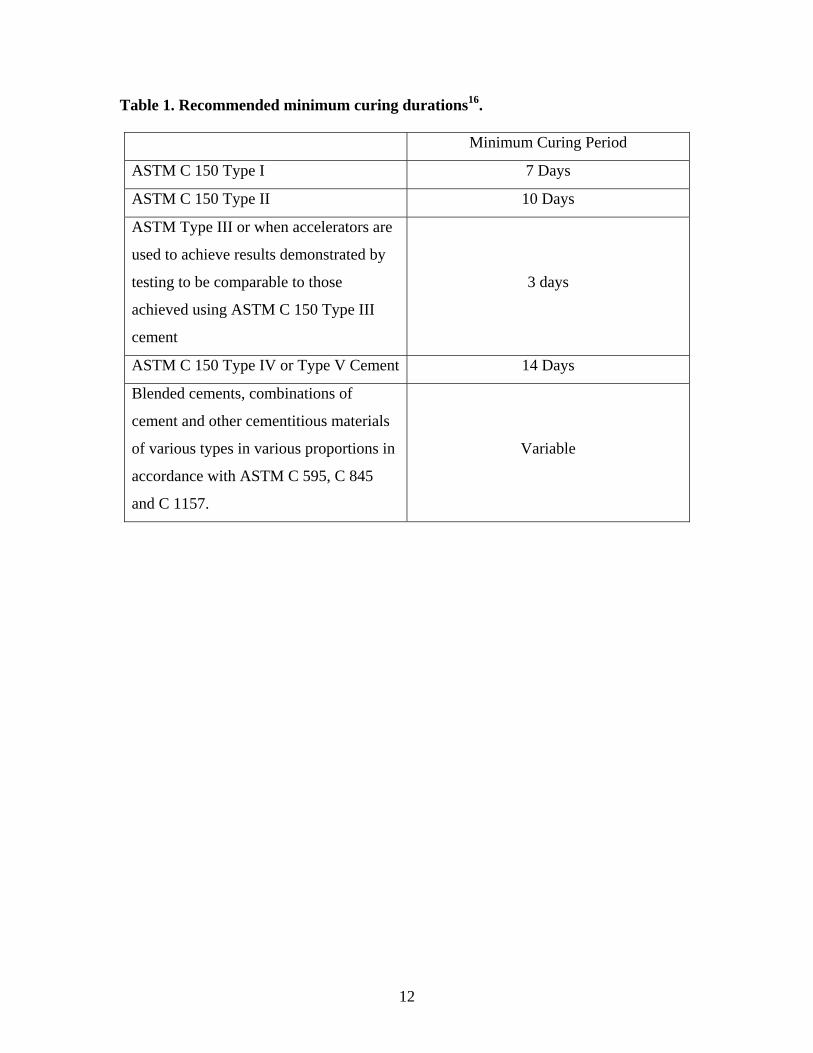
Table 1. Recommended minimum curing durations16.
Minimum Curing Period
ASTM C 150 Type I 7 Days
ASTM C 150 Type II 10 Days
ASTM Type III or when accelerators are
used to achieve results demonstrated by
testing to be comparable to those
achieved using ASTM C 150 Type III
cement
3 days
ASTM C 150 Type IV or Type V Cement 14 Days
Blended cements, combinations of
cement and other cementitious materials
of various types in various proportions in
accordance with ASTM C 595, C 845
and C 1157.
Variable
12
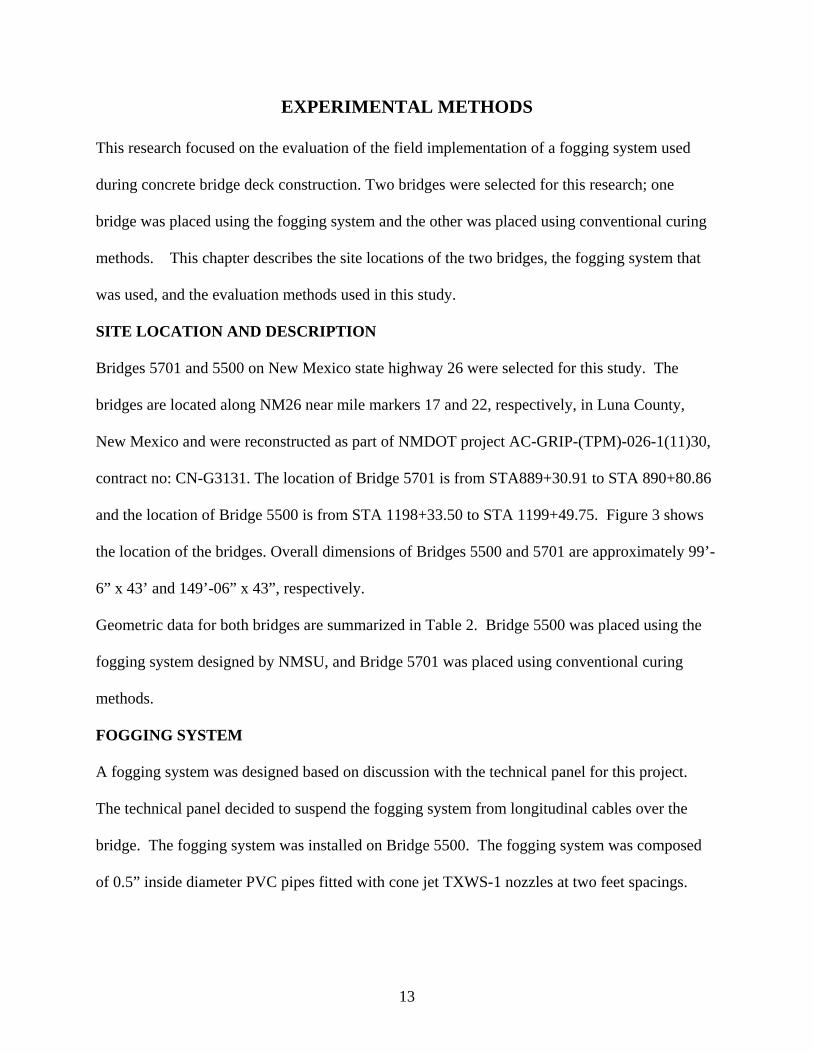
EXPERIMENTAL METHODS
This research focused on the evaluation of the field implementation of a fogging system used
during concrete bridge deck construction. Two bridges were selected for this research; one
bridge was placed using the fogging system and the other was placed using conventional curing
methods. This chapter describes the site locations of the two bridges, the fogging system that
was used, and the evaluation methods used in this study.
SITE LOCATION AND DESCRIPTION
Bridges 5701 and 5500 on New Mexico state highway 26 were selected for this study. The
bridges are located along NM26 near mile markers 17 and 22, respectively, in Luna County,
New Mexico and were reconstructed as part of NMDOT project AC-GRIP-(TPM)-026-1(11)30,
contract no: CN-G3131. The location of Bridge 5701 is from STA889+30.91 to STA 890+80.86
and the location of Bridge 5500 is from STA 1198+33.50 to STA 1199+49.75. Figure 3 shows
the location of the bridges. Overall dimensions of Bridges 5500 and 5701 are approximately 99’-
6” x 43’ and 149’-06” x 43”, respectively.
Geometric data for both bridges are summarized in Table 2. Bridge 5500 was placed using the
fogging system designed by NMSU, and Bridge 5701 was placed using conventional curing
methods.
FOGGING SYSTEM
A fogging system was designed based on discussion with the technical panel for this project.
The technical panel decided to suspend the fogging system from longitudinal cables over the
bridge. The fogging system was installed on Bridge 5500. The fogging system was composed
of 0.5” inside diameter PVC pipes fitted with cone jet TXWS-1 nozzles at two feet spacings.
13
Bridge 5500 (near mile mark 22)
Bridge 5701 (near mile mark 17)
FIGURE 3 Bridge locations on NM26 (Google Map 2008).
The nozzles were arranged such that adjacent nozzles sprayed water in opposite directions. The
fogging system was fixed 10’-6” above the top of the bridge deck to provide enough head room
for workers and still provide appropriate mist distribution. All of the pipes were tied to cables
using steel wires. Clamps were used to connect the wires to the cables and to prevent slipping of
Table 2. Geometric data for the bridges.
Bridge 5500 Bridge 5701
Length 99’ - 06” 149’- 00”
Width 43’ -00” 43’ - 00”
Number of spans 4 6
Interior span length 25’ - 00” 25” - 00”
End span length 24’ - 09” 24’ - 09”
14
the pipes along the cables. The three segments of the fogging system are illustrated in Figure 4.
Each segment was approximately 33 feet long and had four rows of misting nozzles, each of
which was controlled individually. All of the pipes were connected to pumps using hoses.
Pressure gauges were attached to the pumps to measure and control system pressure. Figure 5
shows a plan view of the fogging system and nozzle layout and Figure 6 presents a schematic
arrangement of the cable system used to support the fogging system. Figure 7 shows a
photograph of the system installed at Bridge 5500. As soon as concrete finishing passed each
segment, fogging was initiated; fogging continued until the concrete was covered with burlap.
WATER PUMPS/ WATER TANKS / PRESSURE GAGES
Simer MOD.2825ss model water pumps were used to pump water with adequate pressure
through the pipes. One pump was used for each 33 ft segment of the fogging system. The
pumps and water tanks are shown in Figure 8. The maximum possible pressure supplied by the
pump was 80 psi. The fogging rate was selected based on the expected evaporation rate of water
from concrete determined using Menzel’s12 nomograph. The fogging rate used in this study was
0.40 lb/ft2/hr. This fogging rate is substantially greater than the maximum expected
Bridge deck
33' Fogging Segments
Steel Post Steel Post
Steel cable
FIGURE 4 Typical cross section of the fogging system.
15
Fogging systemsegment - 1(Nozzles @ 2 feetspacings)
Bridge 5500 outline
Fogging systemsegment - 2(Nozzles @ 2 feetspacings)
Fogging systemsegment - 3(Nozzles @ 2 feetspacings)
Nozzle
FIGURE 5 Plan view of fogging system.
16
Dec
k
1" S
teel
Cab
le
Typi
cal,
2' -
0" S
ag
HSS
16"
x 1
6" x
1/2
" En
d Po
st (T
yp)
App
roac
h sl
abA
ppro
ach
slab
Dea
dman
anc
hor
HSS
6"
x 6"
x 1
/2"
Inte
rior P
ost (
Typ)
5 @ 11' -
0" ( =
55'-0" )
FIG
UR
E 6
Fog
ging
supp
ort s
chem
atic
.
17
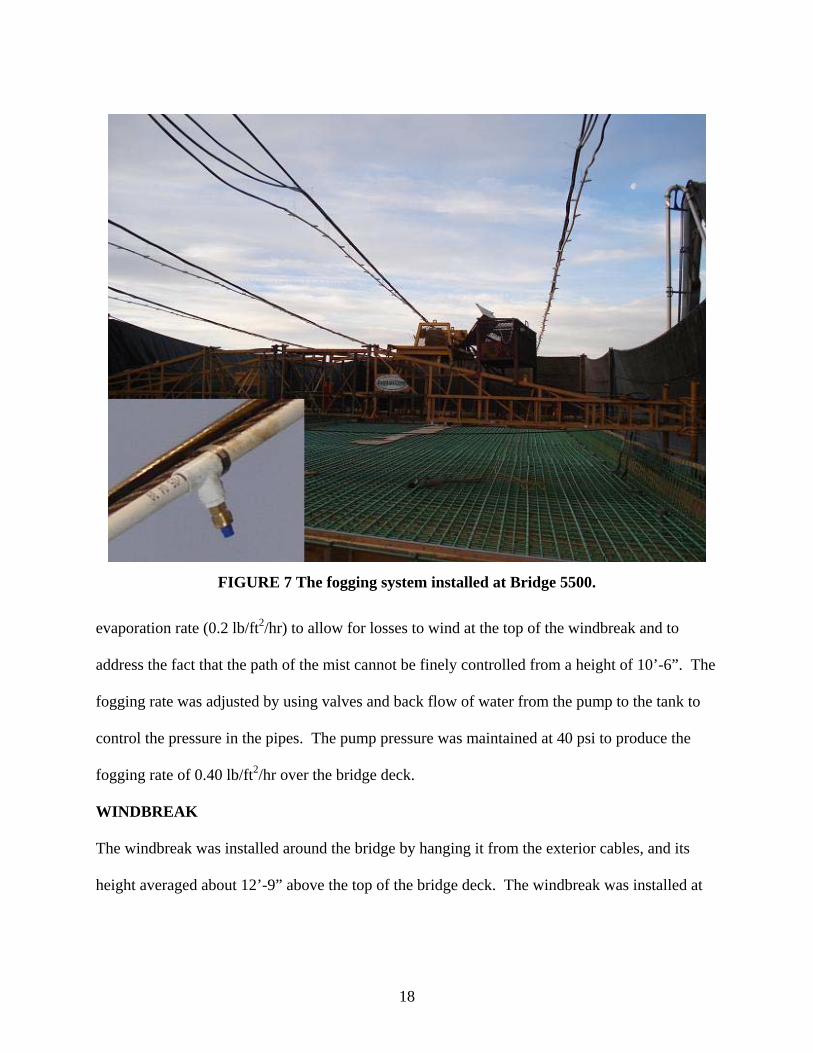
FIGURE 7 The fogging system installed at Bridge 5500.
evaporation rate (0.2 lb/ft2/hr) to allow for losses to wind at the top of the windbreak and to
address the fact that the path of the mist cannot be finely controlled from a height of 10’-6”. The
fogging rate was adjusted by using valves and back flow of water from the pump to the tank to
control the pressure in the pipes. The pump pressure was maintained at 40 psi to produce the
fogging rate of 0.40 lb/ft2/hr over the bridge deck.
WINDBREAK
The windbreak was installed around the bridge by hanging it from the exterior cables, and its
height averaged about 12’-9” above the top of the bridge deck. The windbreak was installed at
18
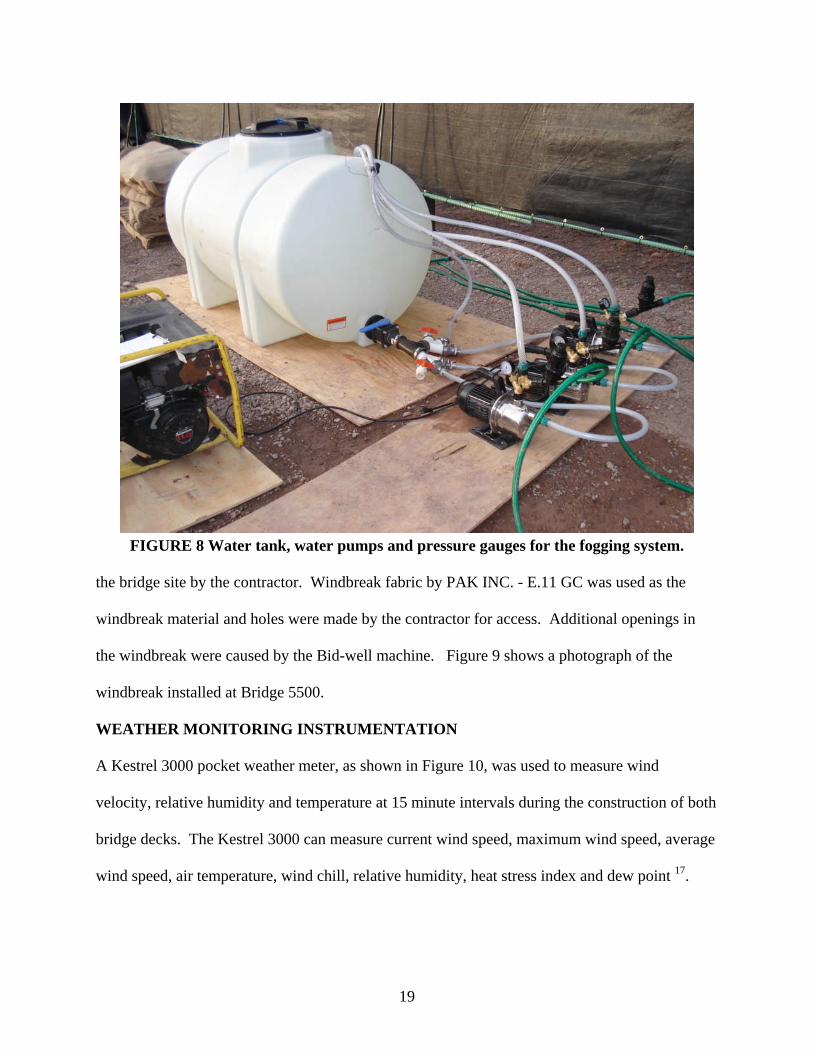
FIGURE 8 Water tank, water pumps and pressure gauges for the fogging system.
the bridge site by the contractor. Windbreak fabric by PAK INC. - E.11 GC was used as the
windbreak material and holes were made by the contractor for access. Additional openings in
the windbreak were caused by the Bid-well machine. Figure 9 shows a photograph of the
windbreak installed at Bridge 5500.
WEATHER MONITORING INSTRUMENTATION
A Kestrel 3000 pocket weather meter, as shown in Figure 10, was used to measure wind
velocity, relative humidity and temperature at 15 minute intervals during the construction of both
bridge decks. The Kestrel 3000 can measure current wind speed, maximum wind speed, average
wind speed, air temperature, wind chill, relative humidity, heat stress index and dew point 17.
19
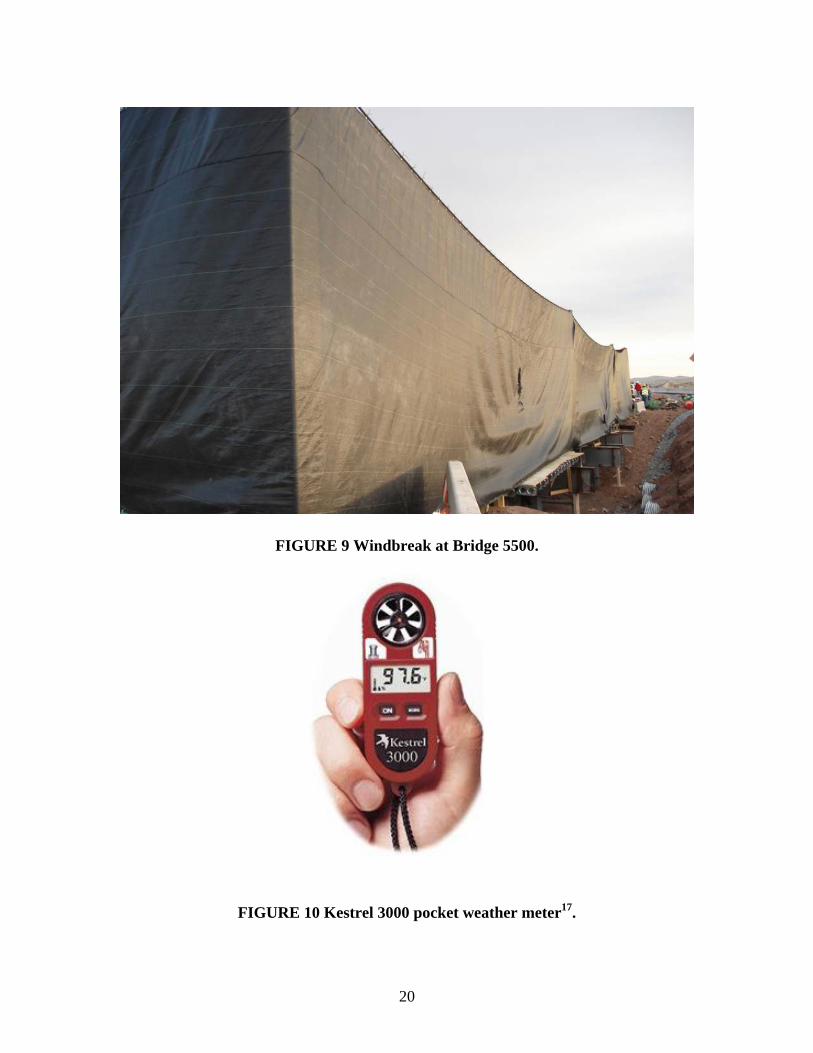
FIGURE 9 Windbreak at Bridge 5500.
FIGURE 10 Kestrel 3000 pocket weather meter17.
20
In this work, wind velocities were measured as the average wind speed during a three second
period. Relative humidity and air temperature were also monitored.
CURING COMPOUND
Kurez vox white pigmented curing compound was used on Bridge 5701. It is a water based and
membrane forming curing compound. The membrane helps concrete to retain sufficient water to
gain the design strength while providing reflectivity to reduce the heat produced by direct sun
light. This curing compound was only applied to Bridge 5701. Specifications for Kurez vox
White Pigmented curing compound include18:
a. Drying time – 1 hour @ 73oF and 50% RH.
b. Solid content - 25%.
c. Moisture loss - < 0.1127 lb/ft2 (0.55 kg/m2).
d. Foot traffic – 2 to 4 hours.
e. Wheel traffic – 6 to 10 hours.
The manufacturer also states that this compound covers about 300 ft2/gal for smooth concrete
and 200 ft2/gal for textured concrete.
CONSTRUCTION OBSERVATIONS
Even though early-age cracking can be reduced by fogging and weather conditions, other
environmental factors also have significant influence on cracking. Therefore, weather conditions
and construction progress were monitored for both bridges. The following measurements were
recorded on the day of placing deck on Bridge 5500 using the Kestrel 3000 pocket weather
meter:
a. Wind speed inside the windbreak and outside the windbreak.
b. Relative humidity inside the windbreak and outside the windbreak.
21
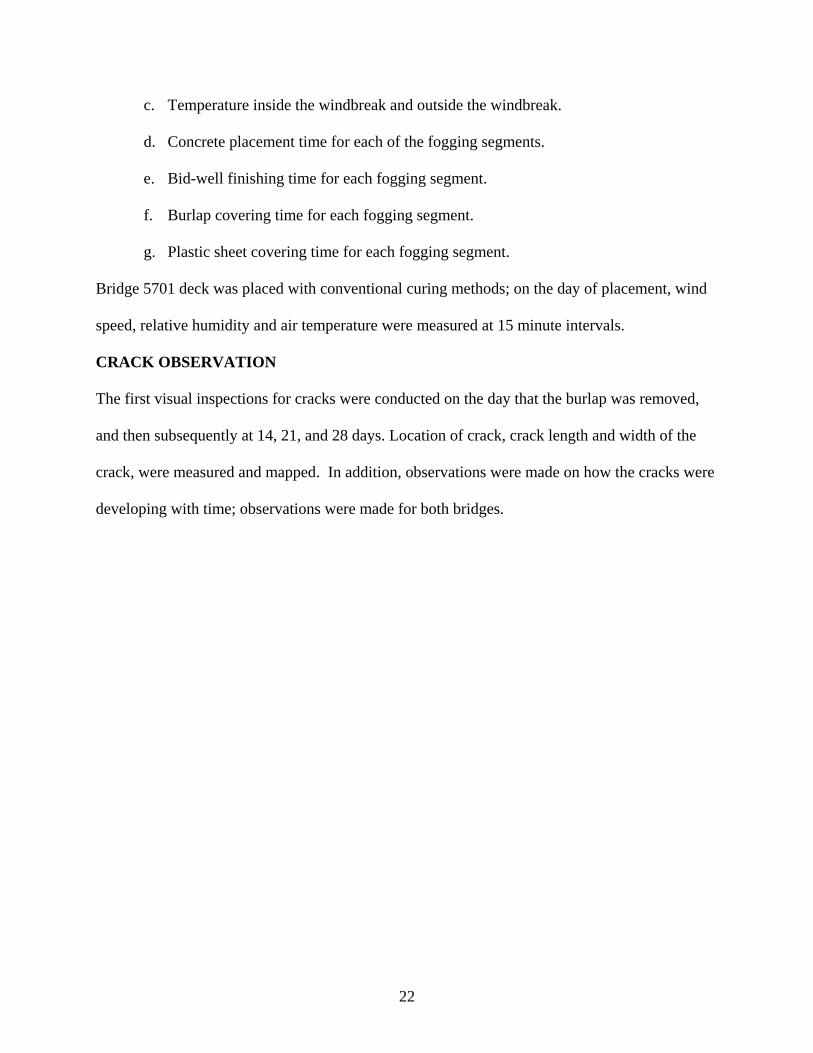
c. Temperature inside the windbreak and outside the windbreak.
d. Concrete placement time for each of the fogging segments.
e. Bid-well finishing time for each fogging segment.
f. Burlap covering time for each fogging segment.
g. Plastic sheet covering time for each fogging segment.
Bridge 5701 deck was placed with conventional curing methods; on the day of placement, wind
speed, relative humidity and air temperature were measured at 15 minute intervals.
CRACK OBSERVATION
The first visual inspections for cracks were conducted on the day that the burlap was removed,
and then subsequently at 14, 21, and 28 days. Location of crack, crack length and width of the
crack, were measured and mapped. In addition, observations were made on how the cracks were
developing with time; observations were made for both bridges.
22
BRIDGE DECK CONSTRUCTION
This chapter presents the observations made for the days of deck placement on the two bridges
along NM26. Weather conditions including temperature, relative humidity and wind speed were
monitored throughout the placement of concrete for both bridges since weather conditions have a
major influence on cracking. In addition, fogging starting and ending times, Bid-well finishing
times, and burlap and plastic sheet covering times were recorded for both bridges.
CONSTRUCTION SEQUENCE MONITORING
The construction sequence was monitored throughout the construction of both bridges. The
following activities were monitored and recorded:
a. Placement time of each segment.
b. Bid-well finishing time for each segment.
c. Burlap coving time.
d. Plastic sheet covering time.
e. Curing compound application time.
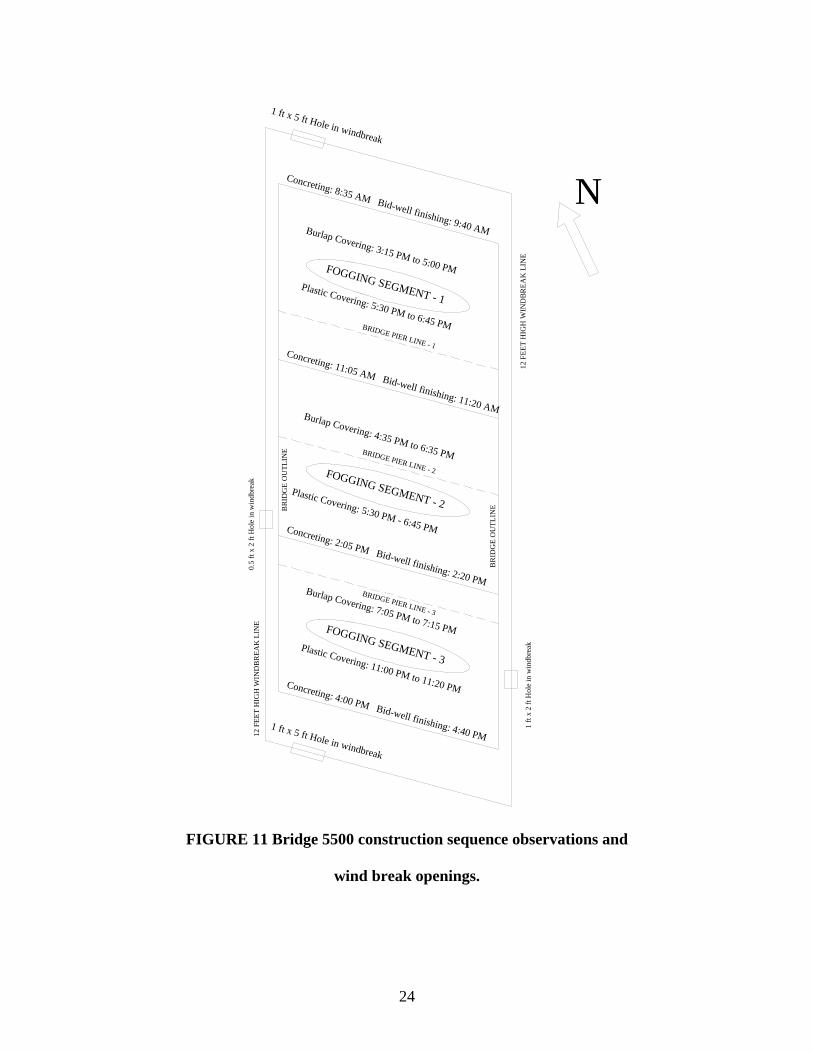
The observations for the construction and fogging sequences for Bridge 5500 are summarized in
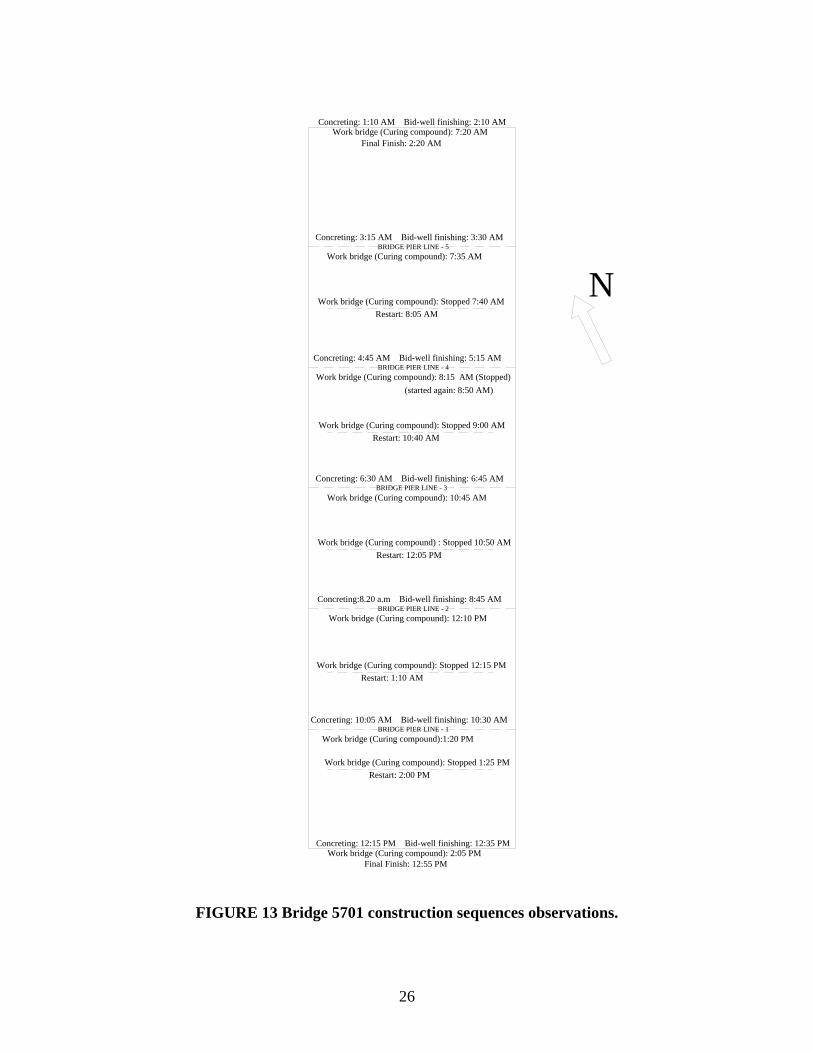
Figures 11 and 12. Similar observations for Bridge 5701 are presented in Figure 13. In Figure
12, two stoppages are listed for the fogging system. These stoppages were to allow the
contractor to repair footprints left during burlap coverage. NMDOT specifications state that the
rate of forward progress of the finishing machine shall be 20ft/hr over the entire width of the slab
bridge being placed. Finishing durations for Bridges 5500 and 5701 were 7 hours and 10.5
hours, respectively. The rate of forward progress for Bridges 5500 and 5701 was about 14 ft/hr.
The forward progress rate was slower than the rate specified by NMDOT. Other authors have
23
Concreting: 8:35 AM Bid-well finishing: 9:40 AM Burlap Covering: 3:15 PM to 5:00 PM
Concreting: 11:05 AM Bid-well finishing: 11:20 AM
Concreting: 2:05 PM Bid-well finishing: 2:20 PM
Concreting: 4:00 PM Bid-well finishing: 4:40 PM
Plastic Covering: 5:30 PM to 6:45 PM
FOGGING SEGMENT - 1
FOGGING SEGMENT - 2
FOGGING SEGMENT - 3
BRIDGE PIER LINE - 1
BRIDGE PIER LINE - 2
BRIDGE PIER LINE - 3
BR
IDG
E O
UTL
INE
BR
IDG
E O
UTL
INE
Burlap Covering: 4:35 PM to 6:35 PM
Plastic Covering: 5:30 PM - 6:45 PM
Burlap Covering: 7:05 PM to 7:15 PM Plastic Covering: 11:00 PM to 11:20 PM
12 F
EET
HIG
H W
IND
BR
EAK
LIN
E
12 F
EET
HIG
H W
IND
BREA
K L
INE
1 ft x 5 ft Hole in windbreak
1 ft x 5 ft Hole in windbreak
1 ft
x 2
ft H
ole
in w
indb
reak
0.5
ft x
2 ft
Hol
e in
win
dbre
ak
N
FIGURE 11 Bridge 5500 construction sequence observations and
wind break openings.
24
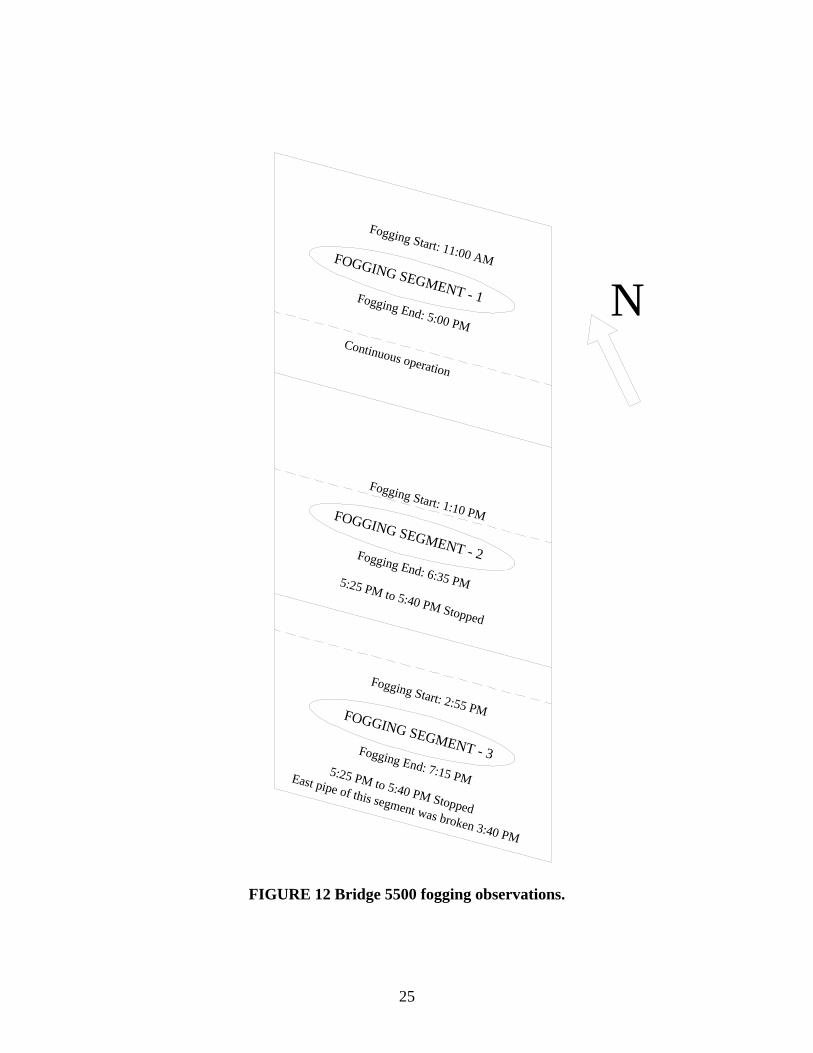
Fogging Start: 11:00 AM
Fogging End: 5:00 PM
FOGGING SEGMENT - 1
FOGGING SEGMENT - 2
Fogging Start: 1:10 PM
Fogging End: 6:35 PM
Fogging Start: 2:55 PM
Fogging End: 7:15 PM
FOGGING SEGMENT - 3
Continuous operation
5:25 PM to 5:40 PM Stopped
5:25 PM to 5:40 PM Stopped
East pipe of this segment was broken 3:40 PM
N
FIGURE 12 Bridge 5500 fogging observations.
25
BRIDGE PIER LINE - 5
BRIDGE PIER LINE - 4
BRIDGE PIER LINE - 3
BRIDGE PIER LINE - 2
BRIDGE PIER LINE - 1
Concreting: 1:10 AM Bid-well finishing: 2:10 AMWork bridge (Curing compound): 7:20 AM
Concreting: 3:15 AM Bid-well finishing: 3:30 AM
Work bridge (Curing compound): 7:35 AM
Concreting: 4:45 AM Bid-well finishing: 5:15 AM
Work bridge (Curing compound): 8:15 AM (Stopped)
Concreting: 6:30 AM Bid-well finishing: 6:45 AM
Work bridge (Curing compound): 10:45 AM
Concreting:8.20 a.m Bid-well finishing: 8:45 AM
Work bridge (Curing compound): 12:10 PM
Concreting: 10:05 AM Bid-well finishing: 10:30 AM
Work bridge (Curing compound):1:20 PM
Concreting: 12:15 PM Bid-well finishing: 12:35 PMWork bridge (Curing compound): 2:05 PM
(started again: 8:50 AM)
Work bridge (Curing compound): Stopped 7:40 AMRestart: 8:05 AM
Work bridge (Curing compound): Stopped 9:00 AMRestart: 10:40 AM
Work bridge (Curing compound) : Stopped 10:50 AMRestart: 12:05 PM
Work bridge (Curing compound): Stopped 12:15 PMRestart: 1:10 AM
Work bridge (Curing compound): Stopped 1:25 PMRestart: 2:00 PM
Final Finish: 12:55 PM
Final Finish: 2:20 AM
N
FIGURE 13 Bridge 5701 construction sequences observations.
26
recommended that placement speed not be less than 0.6 span/hr (about 15 ft/hr) 19. A slow
placement speed lead to more evaporation occurring before fogging is initiated.
WINDBREAK
A windbreak was erected for the Bridge 5500 site to reduce the wind speed at the concrete
surface, which reduces the evaporation rate and allows proper fogging operation. There were
two openings in the windbreak that were made by the contractor for access to the inside of
windbreak, and the Bid-well machine damaged the windbreak in two places. All of those holes
in the windbreak are documented in Figure 11.
WEATHER MONITORING
Weather conditions including temperature, wind speed and relative humidity were monitored
throughout placement of concrete at fifteen minute intervals using a Kestrel-3000 pocket weather
meter. For Bridge 5500, measurements were taken inside and outside the windbreak. All of the
weather data for Bridges 5500 and 5701 are presented in Tables 3 and 4, respectively.
Wind speed is the most important factor for evaporation rate which strongly influences early-age
cracking. The windbreak for Bridge 5500 reduced the wind speed by 60-65% inside the
windbreak compared to the outside wind speed. Even though a windbreak was not erected at
Bridge 5701, wind velocity was low on the night and morning of deck placement on Bridge
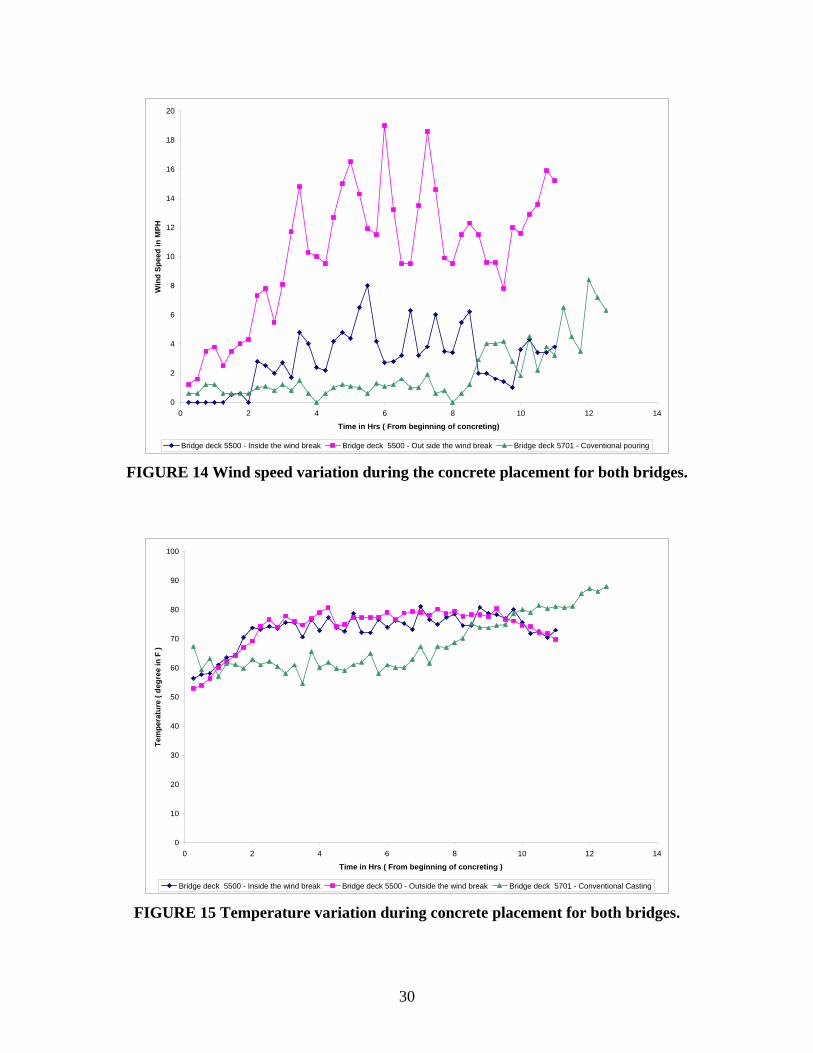
5701. Wind speeds present during the construction of both bridge decks are plotted in Figure 14.
Even though the windbreak was erected for Bridge 5500, Bridge 5701 experienced lower wind
speeds than Bridge 5500.
Air temperature is another important factor for evaporation. The windbreak and fogging did not
influence the air temperature at the concrete surface for Bridge 5500. This is apparent from the
similarity of the temperatures inside and outside the windbreak presented in Figure 15.
27
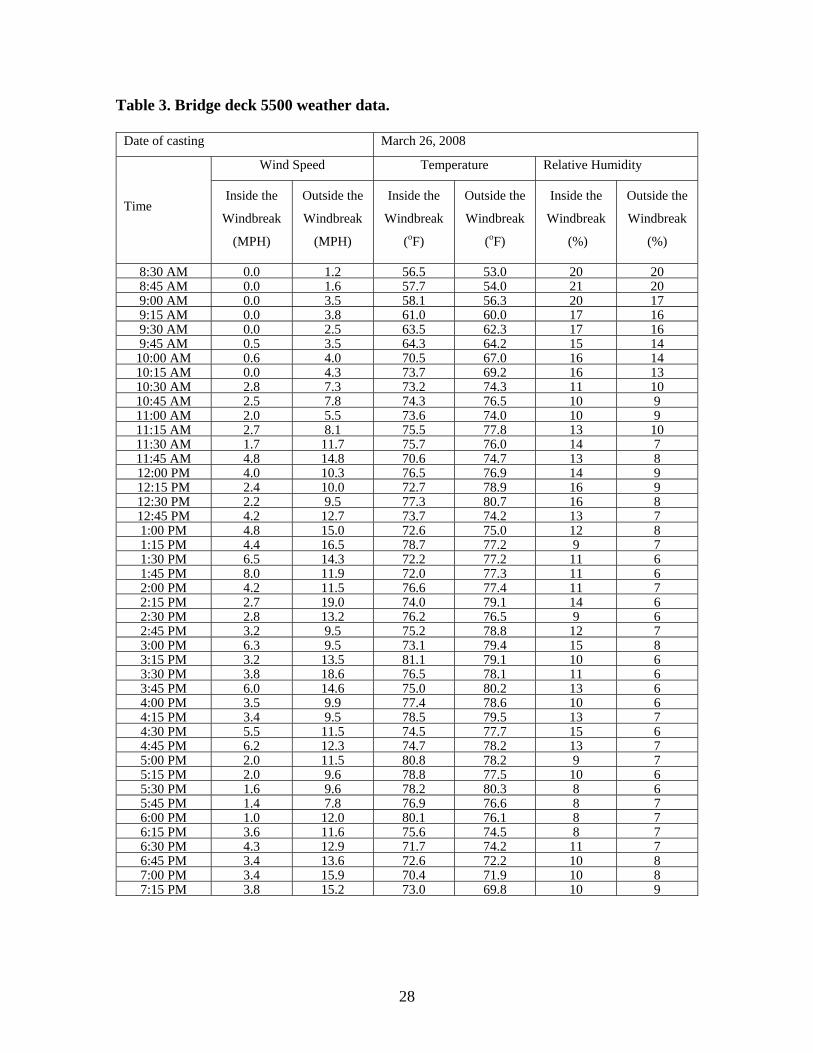
Table 3. Bridge deck 5500 weather data.
Date of casting March 26, 2008
Wind Speed Temperature Relative Humidity
Time Inside the
Windbreak
(MPH)
Outside the
Windbreak
(MPH)
Inside the
Windbreak
(oF)
Outside the
Windbreak
(oF)
Inside the
Windbreak
(%)
Outside the
Windbreak
(%)
8:30 AM 0.0 1.2 56.5 53.0 20 208:45 AM 0.0 1.6 57.7 54.0 21 209:00 AM 0.0 3.5 58.1 56.3 20 179:15 AM 0.0 3.8 61.0 60.0 17 169:30 AM 0.0 2.5 63.5 62.3 17 169:45 AM 0.5 3.5 64.3 64.2 15 14
10:00 AM 0.6 4.0 70.5 67.0 16 1410:15 AM 0.0 4.3 73.7 69.2 16 1310:30 AM 2.8 7.3 73.2 74.3 11 1010:45 AM 2.5 7.8 74.3 76.5 10 911:00 AM 2.0 5.5 73.6 74.0 10 911:15 AM 2.7 8.1 75.5 77.8 13 1011:30 AM 1.7 11.7 75.7 76.0 14 711:45 AM 4.8 14.8 70.6 74.7 13 812:00 PM 4.0 10.3 76.5 76.9 14 912:15 PM 2.4 10.0 72.7 78.9 16 912:30 PM 2.2 9.5 77.3 80.7 16 812:45 PM 4.2 12.7 73.7 74.2 13 71:00 PM 4.8 15.0 72.6 75.0 12 81:15 PM 4.4 16.5 78.7 77.2 9 71:30 PM 6.5 14.3 72.2 77.2 11 61:45 PM 8.0 11.9 72.0 77.3 11 62:00 PM 4.2 11.5 76.6 77.4 11 72:15 PM 2.7 19.0 74.0 79.1 14 62:30 PM 2.8 13.2 76.2 76.5 9 62:45 PM 3.2 9.5 75.2 78.8 12 73:00 PM 6.3 9.5 73.1 79.4 15 83:15 PM 3.2 13.5 81.1 79.1 10 63:30 PM 3.8 18.6 76.5 78.1 11 63:45 PM 6.0 14.6 75.0 80.2 13 64:00 PM 3.5 9.9 77.4 78.6 10 64:15 PM 3.4 9.5 78.5 79.5 13 74:30 PM 5.5 11.5 74.5 77.7 15 64:45 PM 6.2 12.3 74.7 78.2 13 75:00 PM 2.0 11.5 80.8 78.2 9 75:15 PM 2.0 9.6 78.8 77.5 10 65:30 PM 1.6 9.6 78.2 80.3 8 65:45 PM 1.4 7.8 76.9 76.6 8 76:00 PM 1.0 12.0 80.1 76.1 8 76:15 PM 3.6 11.6 75.6 74.5 8 76:30 PM 4.3 12.9 71.7 74.2 11 76:45 PM 3.4 13.6 72.6 72.2 10 87:00 PM 3.4 15.9 70.4 71.9 10 87:15 PM 3.8 15.2 73.0 69.8 10 9
28
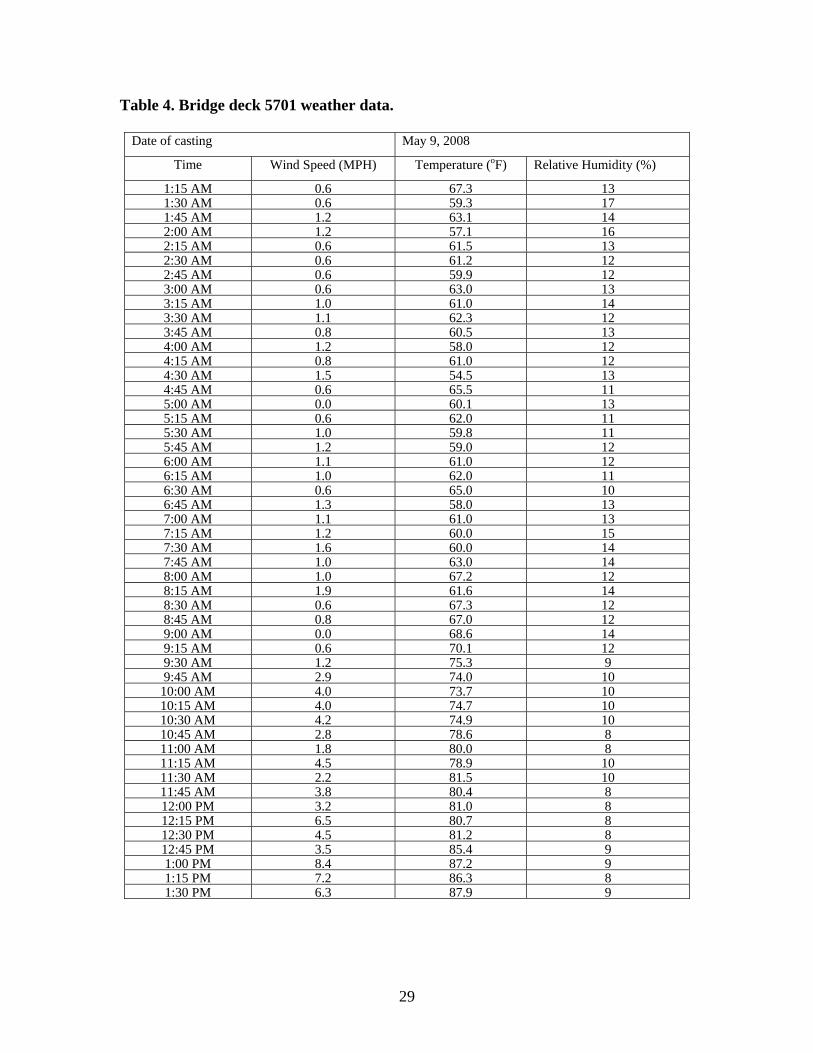
Table 4. Bridge deck 5701 weather data.
Date of casting May 9, 2008
Time Wind Speed (MPH) Temperature (oF) Relative Humidity (%)
1:15 AM 0.6 67.3 13 1:30 AM 0.6 59.3 17 1:45 AM 1.2 63.1 14 2:00 AM 1.2 57.1 16 2:15 AM 0.6 61.5 13 2:30 AM 0.6 61.2 12 2:45 AM 0.6 59.9 12 3:00 AM 0.6 63.0 13 3:15 AM 1.0 61.0 14 3:30 AM 1.1 62.3 12 3:45 AM 0.8 60.5 13 4:00 AM 1.2 58.0 12 4:15 AM 0.8 61.0 12 4:30 AM 1.5 54.5 13 4:45 AM 0.6 65.5 11 5:00 AM 0.0 60.1 13 5:15 AM 0.6 62.0 11 5:30 AM 1.0 59.8 11 5:45 AM 1.2 59.0 12 6:00 AM 1.1 61.0 12 6:15 AM 1.0 62.0 11 6:30 AM 0.6 65.0 10 6:45 AM 1.3 58.0 13 7:00 AM 1.1 61.0 13 7:15 AM 1.2 60.0 15 7:30 AM 1.6 60.0 14 7:45 AM 1.0 63.0 14 8:00 AM 1.0 67.2 12 8:15 AM 1.9 61.6 14 8:30 AM 0.6 67.3 12 8:45 AM 0.8 67.0 12 9:00 AM 0.0 68.6 14 9:15 AM 0.6 70.1 12 9:30 AM 1.2 75.3 9 9:45 AM 2.9 74.0 10
10:00 AM 4.0 73.7 10 10:15 AM 4.0 74.7 10 10:30 AM 4.2 74.9 10 10:45 AM 2.8 78.6 8 11:00 AM 1.8 80.0 8 11:15 AM 4.5 78.9 10 11:30 AM 2.2 81.5 10 11:45 AM 3.8 80.4 8 12:00 PM 3.2 81.0 8 12:15 PM 6.5 80.7 8 12:30 PM 4.5 81.2 8 12:45 PM 3.5 85.4 9 1:00 PM 8.4 87.2 9 1:15 PM 7.2 86.3 8 1:30 PM 6.3 87.9 9
29
0
2
4
6
8
10
12
14
16
18
20
0 2 4 6 8 10 12 14
Time in Hrs ( From beginning of concreting)
Win
d Sp
eed
in M
PH
Bridge deck 5500 - Inside the wind break Bridge deck 5500 - Out side the wind break Bridge deck 5701 - Coventional pouring
FIGURE 14 Wind speed variation during the concrete placement for both bridges.
0
10
20
30
40
50
60
70
80
90
100
0 2 4 6 8 10 12 14
Time in Hrs ( From beginning of concreting )
Tem
pera
ture
( de
gree
in F
)
Bridge deck 5500 - Inside the wind break Bridge deck 5500 - Outside the wind break Bridge deck 5701 - Conventional Casting
FIGURE 15 Temperature variation during concrete placement for both bridges.
30
Air temperature during the placement of Bridge deck 5701 was good for the first eight hours.
Maximum and minimum recommended temperatures for placing concrete are 80oF and 45oF 20.
The air temperature was near the upper end of this recommended range during the Bridge 5500
placement, but near the middle of the range for most of the Bridge 5701 deck placement.
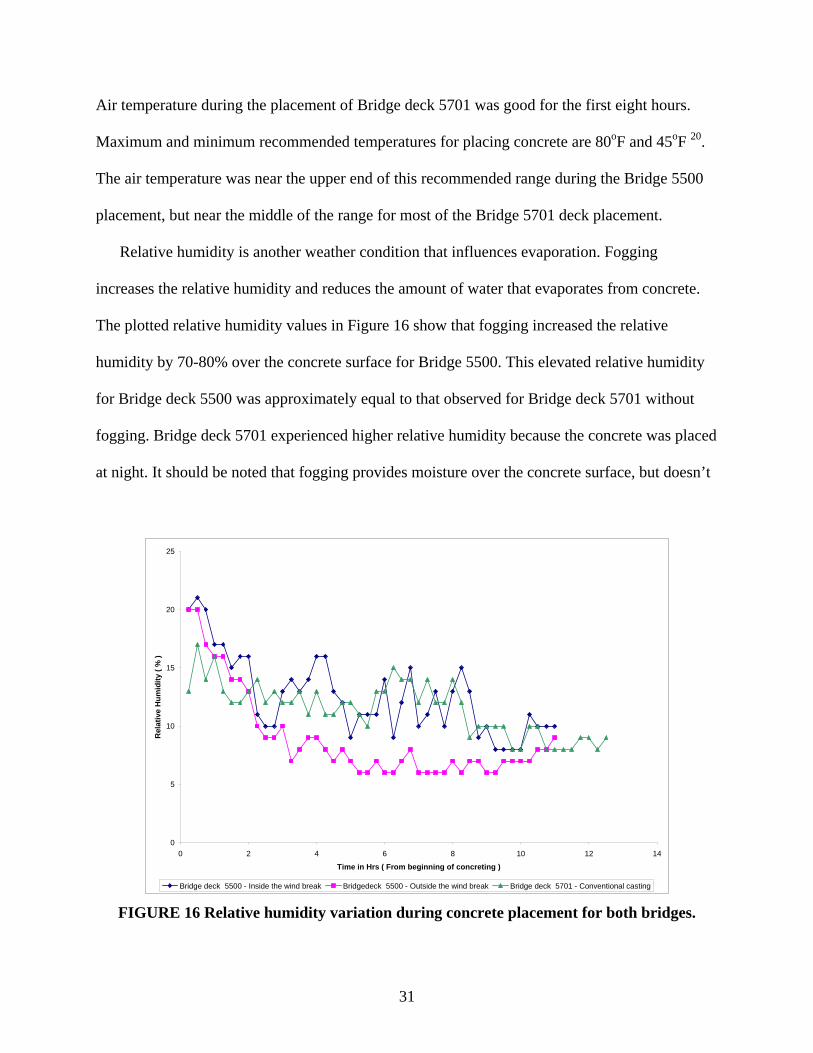
Relative humidity is another weather condition that influences evaporation. Fogging
increases the relative humidity and reduces the amount of water that evaporates from concrete.
The plotted relative humidity values in Figure 16 show that fogging increased the relative
humidity by 70-80% over the concrete surface for Bridge 5500. This elevated relative humidity
for Bridge deck 5500 was approximately equal to that observed for Bridge deck 5701 without
fogging. Bridge deck 5701 experienced higher relative humidity because the concrete was placed
at night. It should be noted that fogging provides moisture over the concrete surface, but doesn’t
0
5
10
15
20
25
0 2 4 6 8 10 12 14
Time in Hrs ( From beginning of concreting )
Rel
ativ
e H
umid
ity (
% )
Bridge deck 5500 - Inside the wind break Bridgedeck 5500 - Outside the wind break Bridge deck 5701 - Conventional casting
FIGURE 16 Relative humidity variation during concrete placement for both bridges.
31
necessarily raise the relative humidity measurement to 100%. Fogging produces water particles
in the air, but the relative humidity measurement doesn’t capture individual water droplets;
however, the droplets provided by fogging provide a source of water that will evaporate before
water evaporates from the concrete.
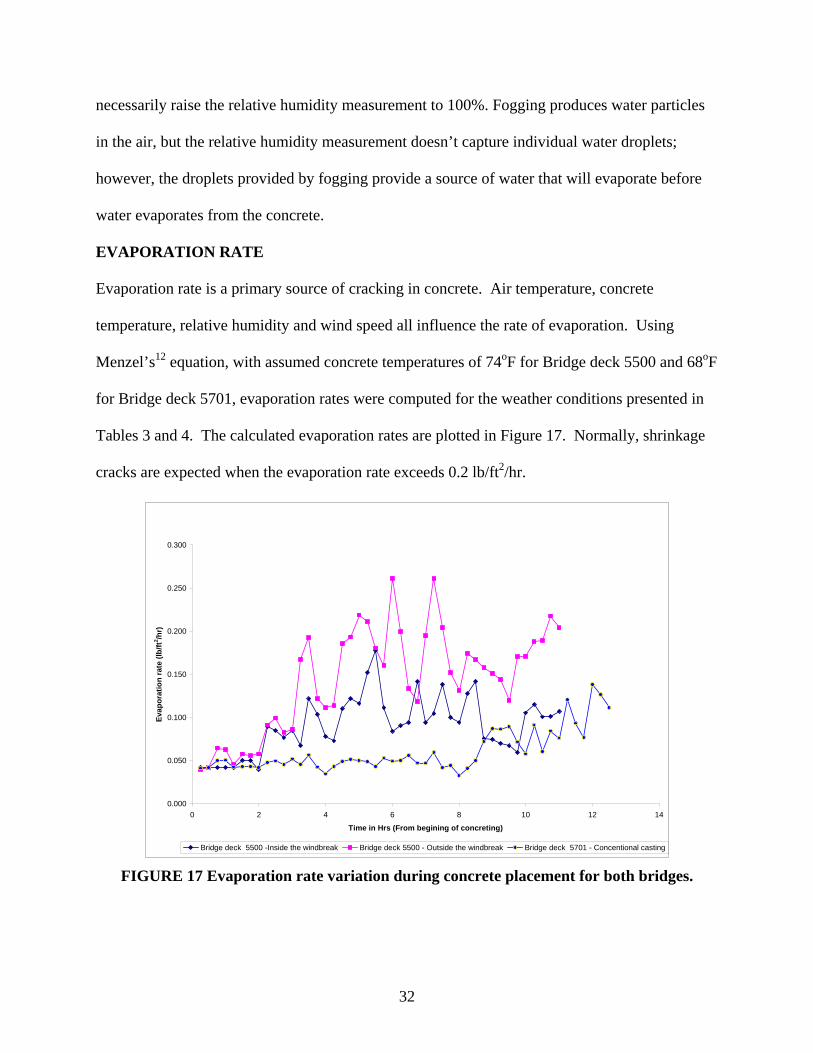
EVAPORATION RATE
Evaporation rate is a primary source of cracking in concrete. Air temperature, concrete
temperature, relative humidity and wind speed all influence the rate of evaporation. Using
Menzel’s12 equation, with assumed concrete temperatures of 74oF for Bridge deck 5500 and 68oF
for Bridge deck 5701, evaporation rates were computed for the weather conditions presented in
Tables 3 and 4. The calculated evaporation rates are plotted in Figure 17. Normally, shrinkage
cracks are expected when the evaporation rate exceeds 0.2 lb/ft2/hr.
0.000
0.050
0.100
0.150
0.200
0.250
0.300
0 2 4 6 8 10 12 14
Time in Hrs (From begining of concreting)
Evap
orat
ion
rate
(lb/
ft2 /hr)
Bridge deck 5500 -Inside the windbreak Bridge deck 5500 - Outside the windbreak Bridge deck 5701 - Concentional casting
FIGURE 17 Evaporation rate variation during concrete placement for both bridges.
32
When the evaporation rate is between 0.2 lb/ft2/hr and 0.1 lb/ft2/hr, plastic shrinkage cracks may
still occur21. However, if the evaporation rate is less than 0.1 lb/ft2/hr, plastic shrinkage cracks
are not expected.
FOGGING SYSTEM OPERATION OBSERVATION
The fogging system was operated on the Bridge 5500 site until the deck was covered with
burlap. The fogging system was arranged as three segments with each segment approximately 33
foot long. Fogging was started once final finishing passed the end of each of the segments. All
three segments of the fogging systems were individually controlled and each segment’s operation
was monitored separately. Operation times for each segment of the fogging system are provided
in Figure 12.
33
CRACK OBSERVATIONS
This chapter presents the observations made for Bridge decks 5500 and 5701 after construction.
These observations are used to evaluate the field implementation of the fogging system on
Bridge deck 5500.
OBSERVATIONS AND ANALYSIS
Observations of the two bridge decks were made after construction at age 7, 14, 21, 28 and 56
days. Comparisons of the observations of the bridges are not ideal since the bridge decks were
placed on different days with different weather and environmental conditions. However, there
are some comparisons that can be made from the observations.
Crack observations
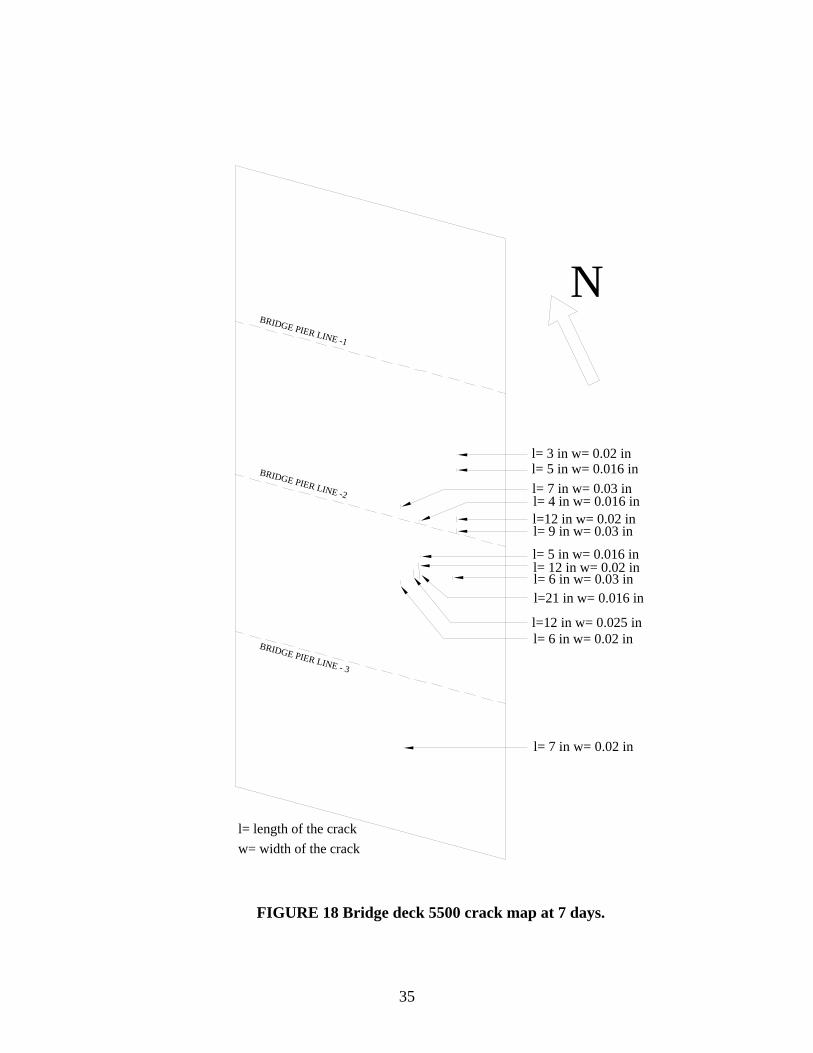
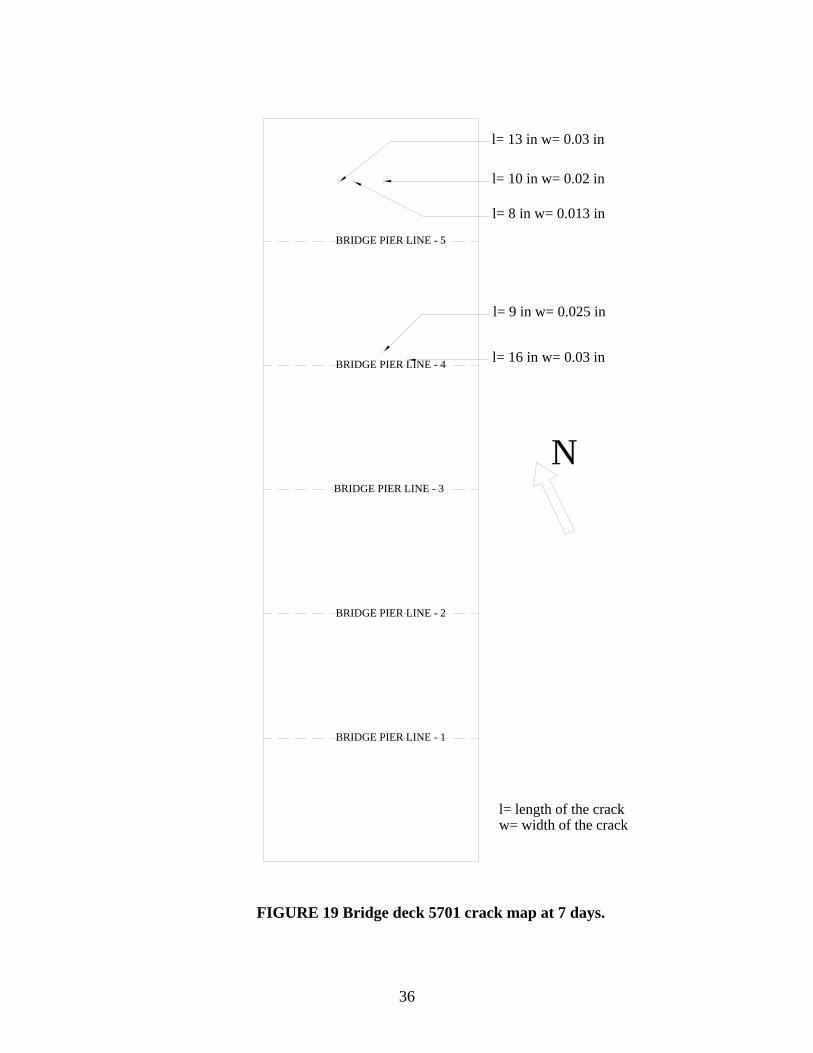
Cracks were observed and mapped for both bridges at age 7, 14, 21, 28 and 56 days. All visible
cracks were identified by location, length and crack width. Crack maps for both bridges are
presented in Figures 18-26.
Observation of cracks at 7 days
Both bridges were covered by burlap and plastic sheets for 7 days. The first visual inspection
was made on the seventh day. For Bridge deck 5500, thirteen small cracks were observed on the
seventh day (Figure 18). Most of the cracks are located near pier line 2 on the east side of the
bridge. The first span and last span were observed to be in good condition. For Bridge deck
5701, five small cracks were observed at 7 days (Figure 19). Three cracks were located in the
span between the abutment and pier line 5 and the other two cracks were near pier line 5. Spans
1 through 4 were in good condition.
34
l= 3 in w= 0.02 inl= 5 in w= 0.016 in
l=12 in w= 0.02 inl= 9 in w= 0.03 in
l= 6 in w= 0.03 in
l= 7 in w= 0.03 inl= 4 in w= 0.016 in
l= 5 in w= 0.016 inl= 12 in w= 0.02 in
l=12 in w= 0.025 inl= 6 in w= 0.02 in
l=21 in w= 0.016 in
l= 7 in w= 0.02 in
BRIDGE PIER LINE -1
BRIDGE PIER LINE -2
BRIDGE PIER LINE - 3
l= length of the crackw= width of the crack
N
FIGURE 18 Bridge deck 5500 crack map at 7 days.
35
l= 13 in w= 0.03 in
l= 8 in w= 0.013 in
l= 10 in w= 0.02 in
l= 9 in w= 0.025 in
l= 16 in w= 0.03 in
BRIDGE PIER LINE - 5
BRIDGE PIER LINE - 4
BRIDGE PIER LINE - 3
BRIDGE PIER LINE - 2
BRIDGE PIER LINE - 1
l= length of the crackw= width of the crack
N
FIGURE 19 Bridge deck 5701 crack map at 7 days.
36
l= 5 in w= 0.02 in ( 7C )l= 5 in w= 0.016 in ( 7O )
l=12 in w= 0.02 in ( 7O )l= 9 in w= 0.03 in ( 7O )
l= 6 in w= 0.03 in ( 7O )
l= 7 in w= 0.03 in ( 7O)l= 9 in w= 0.016 in ( 7C )
l= 5 in w= 0.016 in ( 7O )l= 12 in w= 0.02 in ( 7O )
l=14 in w= 0.025 in ( 7C )l= 12 in w= 0.02 in ( 7C )
l=21 in w= 0.02 in ( 7C )
l=7 in w= 0.02 in ( 7O )
BRIDGE PIER LINE - 1
BRIDGE PIER LINE - 2
BRIDGE PIER LINE - 3
l=84 in w= 0.01 in ( 14 N )
l=59 in w= 0.013 in ( 14 N )
l=108 in w= 0.025 in (14 N )
=46 in w= 0.02 in ( 14 N )
l=12 in w= 0.02 in ( 14 N )0 in w= 0.02 in ( 14 N )
l=12 in w= 0.025 in ( 14 N )l=17 in w= 0.025 in ( 14 N )
l
l=1
( 7C ) Indicates changed cracks from 7 days( 7O ) Indicates unchanged cracks from 7 days( 14N ) Indicates new cracks at 14 days
l= length of the crackw= width of the crack
N
FIGURE 20 Bridge deck 5500 crack map at 14 days.
37
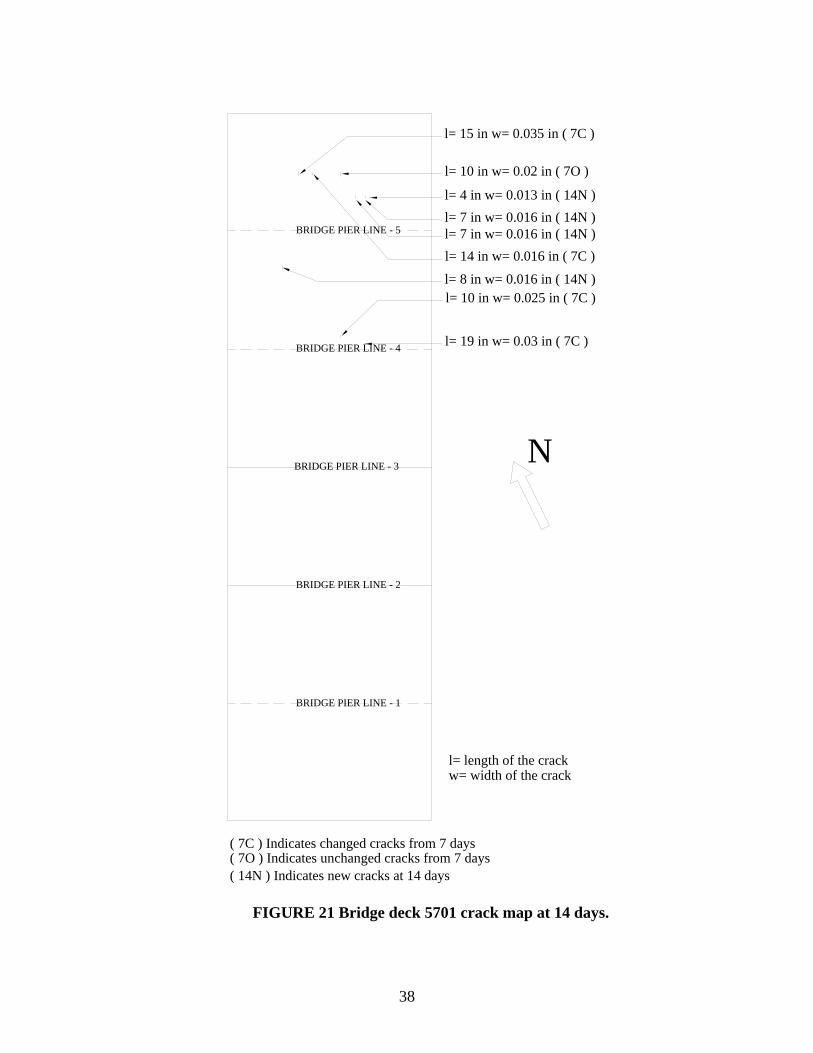
l= 15 in w= 0.035 in ( 7C )
l= 14 in w= 0.016 in ( 7C )
l= 10 in w= 0.02 in ( 7O )
l= 10 in w= 0.025 in ( 7C )
l= 19 in w= 0.03 in ( 7C )
( 7C ) Indicates changed cracks from 7 days( 7O ) Indicates unchanged cracks from 7 days( 14N ) Indicates new cracks at 14 days
l= 4 in w= 0.013 in ( 14N )l= 7 in w= 0.016 in ( 14N )l= 7 in w= 0.016 in ( 14N )
l= 8 in w= 0.016 in ( 14N )
BRIDGE PIER LINE - 5
BRIDGE PIER LINE - 4
BRIDGE PIER LINE - 3
BRIDGE PIER LINE - 2
BRIDGE PIER LINE - 1
l= length of the crackw= width of the crack
N
FIGURE 21 Bridge deck 5701 crack map at 14 days.
38
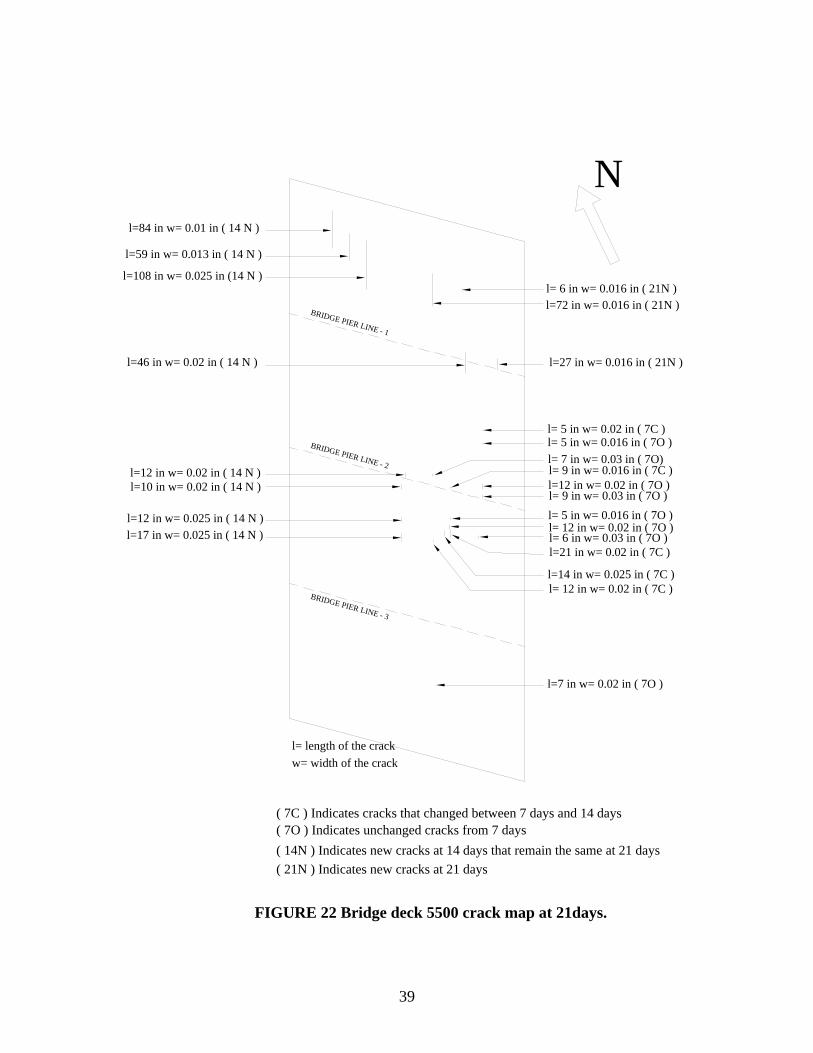
l= 5 in w= 0.02 in ( 7C )l= 5 in w= 0.016 in ( 7O )
l=12 in w= 0.02 in ( 7O )l= 9 in w= 0.03 in ( 7O )
l= 6 in w= 0.03 in ( 7O )
l= 7 in w= 0.03 in ( 7O)l= 9 in w= 0.016 in ( 7C )
l= 5 in w= 0.016 in ( 7O )l= 12 in w= 0.02 in ( 7O )
l=14 in w= 0.025 in ( 7C )l= 12 in w= 0.02 in ( 7C )
l=21 in w= 0.02 in ( 7C )
l=7 in w= 0.02 in ( 7O )
BRIDGE PIER LINE - 1
BRIDGE PIER LINE - 2
BRIDGE PIER LINE - 3
l=84 in w= 0.01 in ( 14 N )
l=59 in w= 0.013 in ( 14 N )
l=108 in w= 0.025 in (14 N )
l=46 in w= 0.02 in ( 14 N )
l=12 in w= 0.02 in ( 14 N )l=10 in w= 0.02 in ( 14 N )
l=12 in w= 0.025 in ( 14 N )l=17 in w= 0.025 in ( 14 N )
( 7C ) Indicates cracks that changed between 7 days and 14 days ( 7O ) Indicates unchanged cracks from 7 days( 14N ) Indicates new cracks at 14 days that remain the same at 21 days
l= 6 in w= 0.016 in ( 21N )l=72 in w= 0.016 in ( 21N )
l=27 in w= 0.016 in ( 21N )
( 21N ) Indicates new cracks at 21 days
l= length of the crackw= width of the crack
N
FIGURE 22 Bridge deck 5500 crack map at 21days.
39
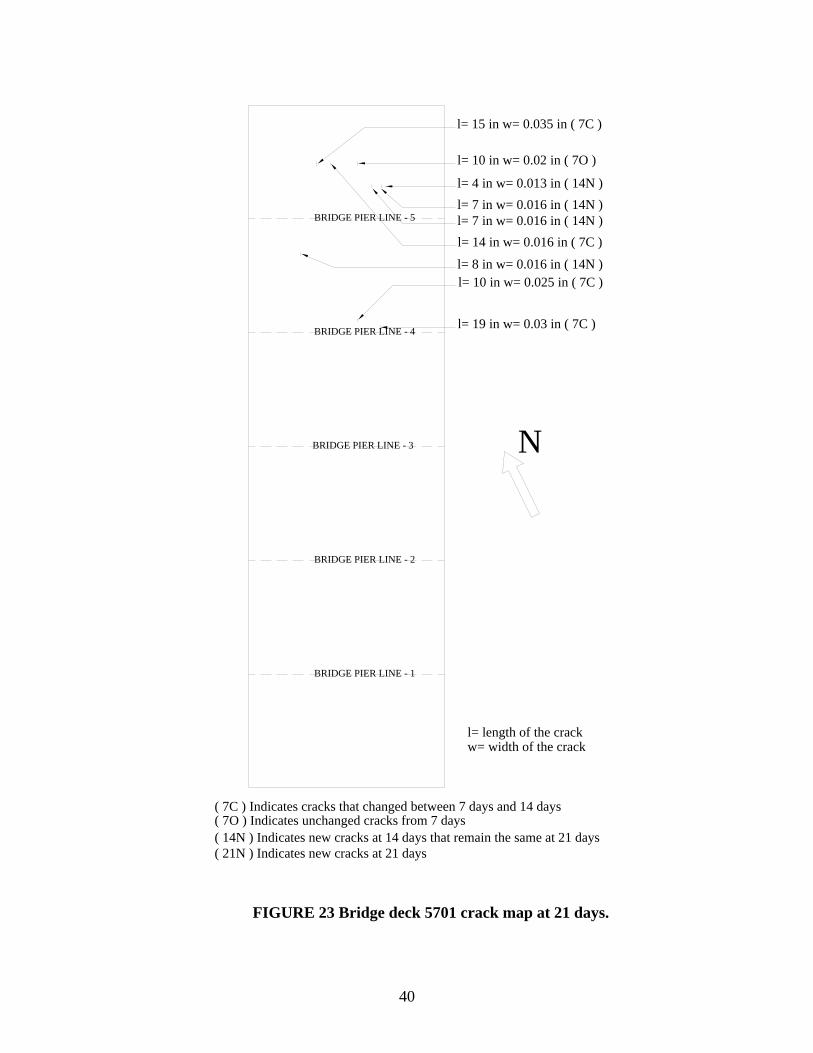
l= 15 in w= 0.035 in ( 7C )
l= 14 in w= 0.016 in ( 7C )
l= 10 in w= 0.02 in ( 7O )
l= 10 in w= 0.025 in ( 7C )
l= 19 in w= 0.03 in ( 7C )
l= 4 in w= 0.013 in ( 14N )l= 7 in w= 0.016 in ( 14N )l= 7 in w= 0.016 in ( 14N )
l= 8 in w= 0.016 in ( 14N )
l= length of the crackw= width of the crack
( 7C ) Indicates cracks that changed between 7 days and 14 days ( 7O ) Indicates unchanged cracks from 7 days( 14N ) Indicates new cracks at 14 days that remain the same at 21 days( 21N ) Indicates new cracks at 21 days
N
BRIDGE PIER LINE - 5
BRIDGE PIER LINE - 4
BRIDGE PIER LINE - 3
BRIDGE PIER LINE - 2
BRIDGE PIER LINE - 1
FIGURE 23 Bridge deck 5701 crack map at 21 days.
40
l= 5 in w= 0.02 in ( 7C )l= 5 in w= 0.016 in ( 7O )
l=12 in w= 0.02 in ( 7O )l= 9 in w= 0.03 in ( 7O )
l= 6 in w= 0.03 in ( 7O )
l= 7 in w= 0.03 in ( 7O)l= 9 in w= 0.016 in ( 7C )
l= 5 in w= 0.016 in ( 7O )l= 12 in w= 0.02 in ( 7O )
l=14 in w= 0.025 in ( 7C )l= 12 in w= 0.02 in ( 7C )
l=21 in w= 0.02 in ( 7C )
l=7 in w= 0.02 in ( 7O )
BRIDGE PIER LINE
BRIDGE PIER LINE
BRIDGE PIER LINE
l=84 in w= 0.01 in ( 14 N )
l=59 in w= 0.013 in ( 14 N )
l=108 in w= 0.025 in (14 N )
l=46 in w= 0.02 in ( 14 N )
l=12 in w= 0.02 in ( 14 N )
l=10 in w= 0.02 in ( 14 N )
l=12 in w= 0.025 in ( 14 N )
l=17 in w= 0.025 in ( 14 N )
( 7C ) Indicates cracks that changed between 7 days and 14 days ( 7O ) Indicates unchanged cracks from 7 days that remain at 28 days( 14N ) Indicates new cracks at 14 days that remain the same at 28 days
l= 6 in w= 0.016 in ( 21N )l=72 in w= 0.016 in ( 21N )
l=27 in w= 0.016 in ( 21N )
( 21N ) Indicates new cracks at 21 days that remain the same at 28 days
l= 78 in w= 0.02 in ( 28N )
l= 19 in w= 0.025 in ( 28N )
l= 36 in w= 0.016 in ( 28 N )
l= 15 in w= 0.013 in ( 28 N )
l= 18 in w= 0.016 in ( 28N )l= 13 in w= 0.016 in ( 28N )
l= 26 in w= 0.020 in ( 28N )
( 28N ) Indicates new cracks at 28 days
BRIDGE PIER LINE
l= length of the crackw= width of the crack
N
FIGURE 24 Bridge deck 5500 crack map at 28 days.
41
l= 15 in w= 0.035 in ( 7C )
l= 14 in w= 0.016 in ( 7C )
l= 10 in w= 0.02 in ( 7O )
l= 10 in w= 0.025 in ( 7C )
l= 19 in w= 0.03 in ( 7C )
l= 4 in w= 0.013 in ( 14N )l= 7 in w= 0.016 in ( 14N )l= 7 in w= 0.016 in ( 14N )
l= 8 in w= 0.016 in ( 14N )
BRIDGE PIER LINE - 5
BRIDGE PIER LINE - 4
BRIDGE PIER LINE - 3
BRIDGE PIER LINE - 2
BRIDGE PIER LINE - 1
l= length of the crackw= width of the crack
( 7C ) Indicates cracks that changed between 7 days and 14 days ( 7O ) Indicates unchanged cracks from 7 days that remain at 28 days( 14N ) Indicates new cracks at 14 days that remain the same at 28 days( 21N ) Indicates new cracks at 21 days that remain the same at 28 days( 28N ) Indicates new cracks at 28 days
N
FIGURE 25 Bridge deck 5701 crack map at 28 days.
42
BRIDGE PIER LINE -1
BRIDGE PIER LINE -2
BRIDGE PIER LINE - 3
l=26 in w= 0.013 in
l=77 in w= 0.02 in
l=36 in w= 0.016 inl=36 in w= 0.02 inl=36 in w= 0.016 inl=95 in w= 0.02 inl=58 in w= 0.02 inl=51 in w= 0.02 inl=60 in w= 0.02 in
l=76 in w= 0.02 inl=54 in w= 0.02 in
l=52 in w= 0.016 in
l=29 in w= 0.013 in
l=9 in w= 0.013 inl=50 in w= 0.016 in
l=36 in w= 0.02 in
l=25 in w= 0.016 inl=12 in w= 0.013 in
l=24 in w= 0.016 in
l=22 in w= 0.013 in
l=20 in w= 0.013in
l= length of the crackw= width of the crack
N
FIGURE 26 Bridge deck 5500 new cracks between 28 and 56 days.
43
The more extensive cracking on Bridge 5500 appears to be largely due to the greater evaporation
rate experienced during placement. It should also be noted that the cracks in Bridge 5500 were
in the location of a stoppage in placement. The cracks in Bridge 5701 occurred in concrete that
was placed with an elevated evaporation rate.
All of the observed cracks in both bridges were oriented in the longitudinal direction. This could
indicate that restraint in the transverse direction contributed to the cracking.
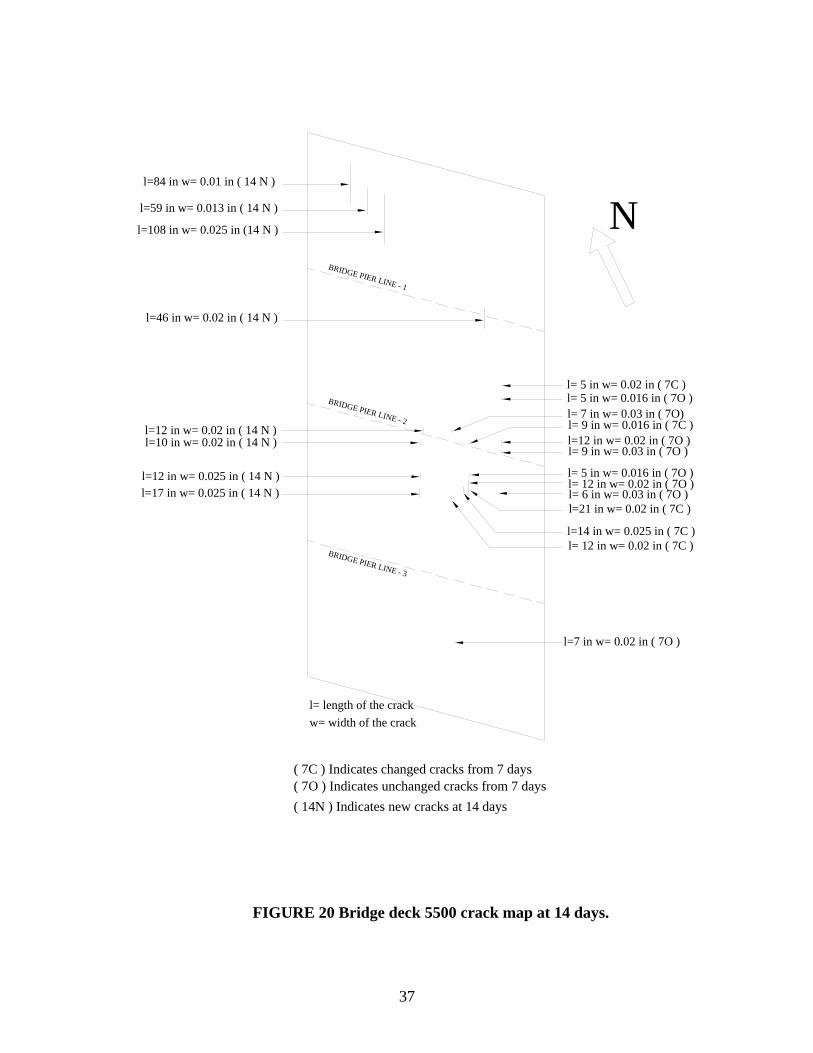
Observation of cracks at 14 days
For Bridge deck 5500, eight new cracks were observed at 14 days (Figure 20). Four cracks were
located in first span between the abutment and pier line 1, one was located on pier line one, and
the others were located near pier line 2. The span between pier line 3 and the abutment looked
very good at 14 days. For Bridge deck 5701, four new cracks were observed at 14 days (Figure
21); three were located in the last span between pier line 5 and the abutment and the other was
located on the fifth span between pier lines 4 and 5. The first four spans were observed to be in
good condition.
Again, all of the cracks were oriented in the longitudinal direction indicating that transverse
restraint may be playing a role in cracking, and all of the cracks occurred in concrete that had
been exposed to an evaporation rate near or exceeding 0.1 lb/ft2/hr.
Observation of cracks at 21 days
For Bridge deck 5500, three new cracks were observed in the first span between pier line one and
the abutment at 21 days (Figure 22). Two were located in the middle of the first span and the
other was located over the first pier line. For Bridge deck 5701, there were no new cracks
observed at 21 days (Figure 23).
44
Observation of cracks at 28 days
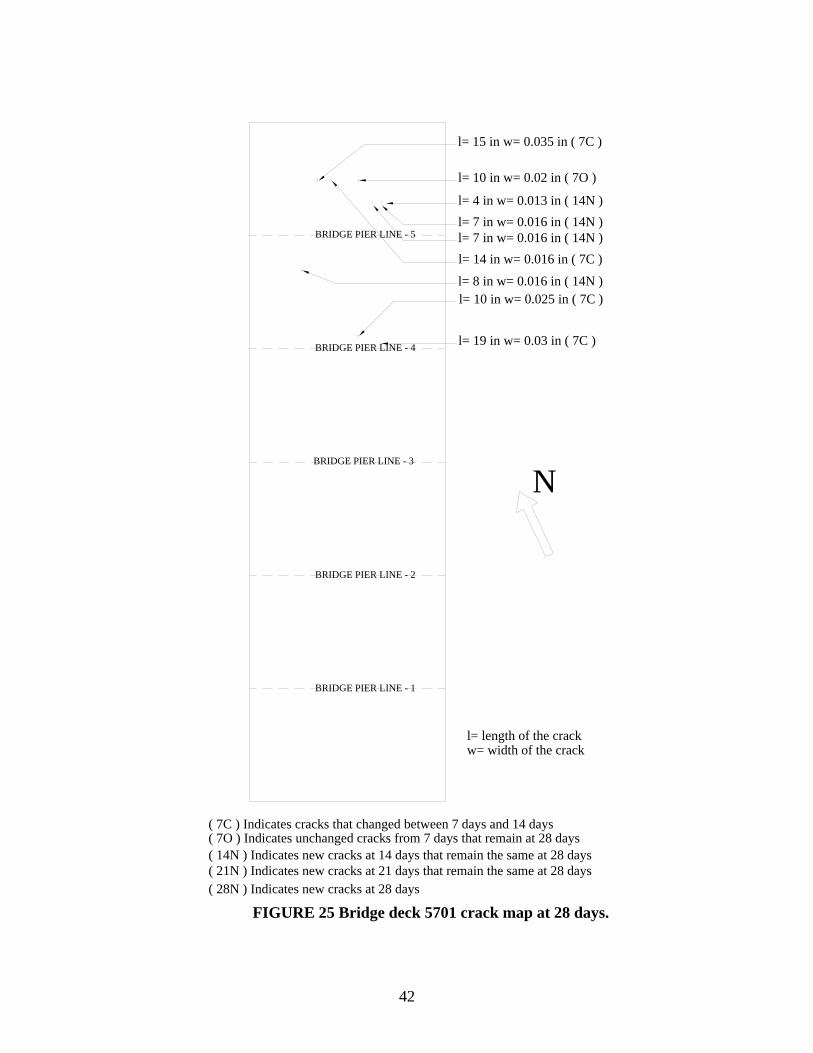
For Bridge deck 5500, seven new cracks were observed at 28 days (Figure 24). All of these
cracks were located near pier line 2. For Bridge deck 5701, there were no new cracks observed
at 28 days (Figure 25).
Again, the new cracks appeared in concrete that was exposed to an evaporation rate exceeding
0.1 lb/ft2/hr and were oriented longitudinally.
Observation of cracks at 56 days
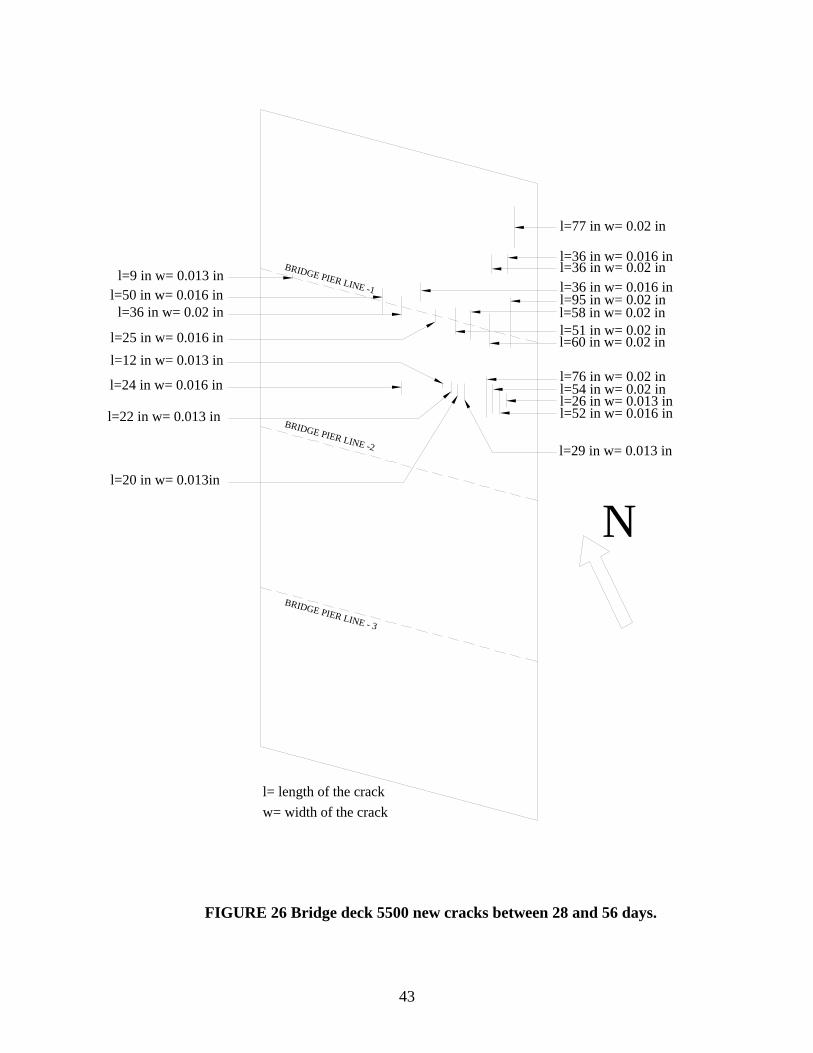
For Bridge deck 5500, several new cracks were observed in spans one and two at 56 days (Figure
26). Most of the cracks were observed along pier line one and at midspan between pier lines 1
and 2. However, there were several minor cracks located in the second span.
At the time that this report was prepared, Bridge deck 5701 had not reached an age of 56 days.
Consequently, no 56 day observations are presented here.
Possible reasons for cracks
This section presents a discussion of the observed cracks and possible causes for the cracks.
Placement duration
The rate of progress of concrete placement has a significant impact on deck cracking. As
discussed in the Bridge Deck Construction section, both forward progress rates were slower than
NMDOT specifications allow. Slow placement allows to more evaporation to occur before
fogging is initiated. The portion of Bridge deck 5500 under fogging segment 2 was observed to
have the majority of the cracking at 7 days. This portion of the deck required more than three
hours of forward progress and other two segments required approximately two hours.
45
Weather conditions
Weather conditions are a major factor influencing bridge deck cracking. Bridge deck 5500 was
placed during the daytime and Bridge deck 5701 was placed at night and early morning. The
night time weather conditions during the Bridge deck 5701 placement were favorable for
concrete placing.
Wind conditions were very good for Bridge deck 5701 since there was little wind until the last
two hours of concrete deck placement. Even though the windbreak was erected for Bridge deck
5500, Bridge deck 5701 experienced slower wind speed than Bridge 5500 (Figure 14).
Relative humidity is another weather condition that influences evaporation. Fogging increases
the relative humidity and reduces the evaporation of water from the concrete. As discussed in
the Bridge Deck Construction section, relative humidity was approximately the same for both
bridges, even though fogging increased relative humidity by 70-80% at Bridge deck 5500.
Air temperature is another important parameter for evaporation. The windbreak and fogging did
not influence the air temperature above the concrete surface for Bridge deck 5500. Bridge deck
5701 experienced milder air temperatures for most of the placement. Most of the cracks observed
on Bridge deck 5701 were in the last span which was placed when the air temperature was
approximately 80oF and the relative humidity was 8-9%.
Evaporation rate
NMDOT specifications state that concrete shall not be placed unless the combinations of weather
and environmental conditions produce an evaporation rate less than 0.2 lb/ft2/hr. Neither bridge
experienced an evaporation rate greater than 0.2 lb/ft2/hr. However, both bridges experienced
cracking in concrete that was exposed to an evaporation rate of 0.1 lb/ft2/hr. For Bridge 5500, the
evaporation rate approached 0.2 lb/ft2/hr five to six hours into the placement (Figure 17).
46
Windbreak
As discussed in Bridge Deck Construction section, the windbreak reduced the wind speed 60-
65% inside the windbreak compared to the outside wind speed. As shown in Figure 27, four
openings were present in the windbreak on the day of placement. Openings 1 and 2 were made
for access to the bridge site and openings 3 and 4 were made by the Bid-well machine. Idealized
wind flow over the windbreak is illustrated in Figure 27(b). Since the fogging system and
windbreak were nearly the same height, about 10.5 to 12.75 ft, some of the misting water was
carried outside the windbreak by the wind.
If the windbreak was 3-4 ft higher than the fogging system, that would improve the efficiency of
the windbreak. Also, if the access openings were located on the leeward side of the windbreak,
the windbreak efficiency would increase.
Other reasons
Other than the reasons listed above, there are other possible causes for the observed cracks. For
Bridge deck 5500, formwork for span 1 was removed during the 7-14 day period. The removal
of formwork may have caused some tensile stresses or movement in the first span of Bridge deck
5500. Three long cracks were observed in the first span of Bridge deck 5500 on the 14th day. In
the week following the placement of Bridge deck 5701, weather conditions were overcast in
southern New Mexico. This also provided a favorable environment for Bridge deck 5701
placement.
47
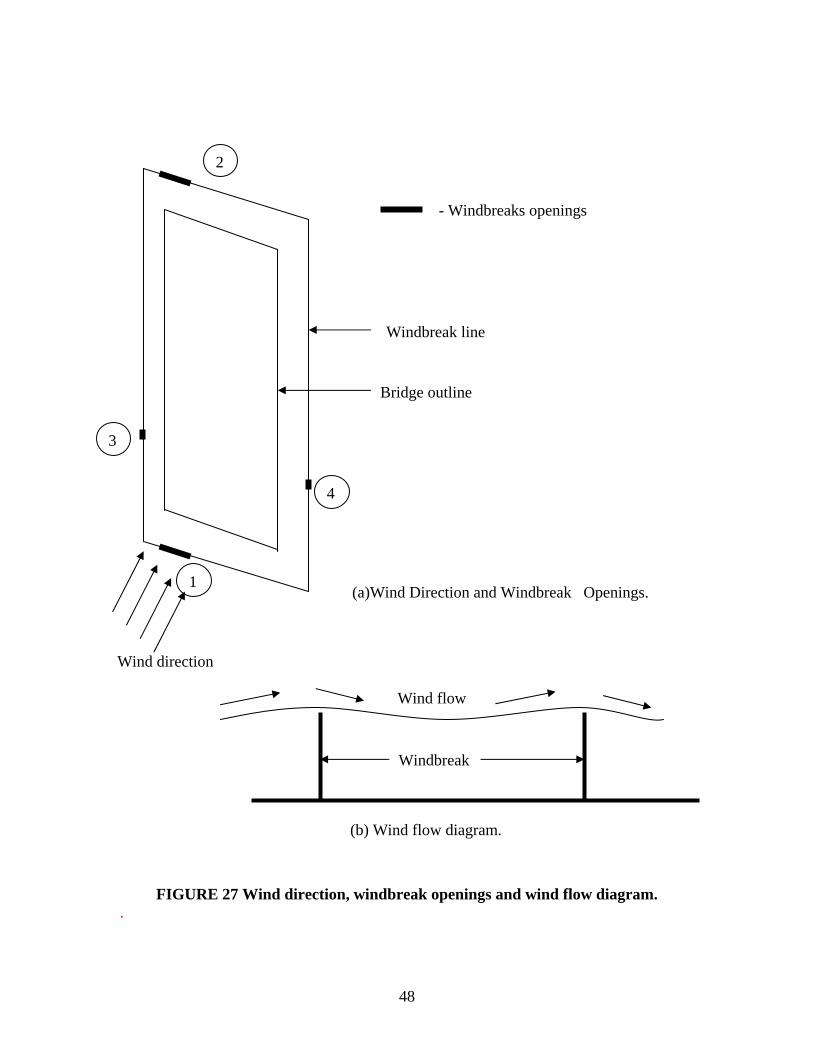
Wind direction
1
3
4
2
(a)Wind Direction and Windbreak Openings.
- Windbreaks openings
Windbreak line
Bridge outline
Windbreak
Wind flow (b) Wind flow diagram.
FIGURE 27 Wind direction, windbreak openings and wind flow diagram.
.
48
CONCLUSIONS AND RECOMMENDATIONS
CONCLUSIONS
Based on the observations made during this work, the following conclusions are drawn:
1. Using a fogging system that was suspended from longitudinal cables was not an
efficient system. There were a number of drawbacks that included:
a. The support system consisting of cables, steel posts, deadman anchors, and
windbreak fabric was expensive to install. The contractor’s bid for the
installation of this hardware on the Bridge 5500 site was approximately $75,000.
b. It was extremely difficult to ensure that a uniform mist of known quantity was
delivered to the concrete because it was being delivered from more than 10 feet
above the surface of the concrete.
c. Even crude control of the fogging system required a large windbreak.
2. Fogging at a rate that was double the evaporation rate did not alleviate all of the
cracking in Bridge deck 5500. Using curing compound in combination with the
fogging would probably have helped. However, the mist still needs to be delivered
with more control than was provided by the suspended system.
3. Concrete in both bridge decks that was exposed to an evaporation rate greater than 0.1
lb/ft2/hr was susceptible to cracking. The location on Bridge deck 5500 where the
placement and finishing operations were particularly slow was more prone to
cracking.
4. All of the cracks observed in the two bridge decks were oriented in the longitudinal
direction. This seems to indicate that transverse restraint contributed to the cracking.
49
RECOMMENDATIONS
For implementing fogging systems on future projects, the following recommendations are
provided:
1. The fogging system should be installed on a work bridge that follows the Bid-well. This
will allow the mist to be applied close to the concrete with much better control.
2. Curing compound should be used in combination with fogging.
3. Fogging should be initiated as soon as possible after placement.
4. Concrete should be placed while the evaporation rate is less than 0.1 lb/ft2/hr.
Practically, this requires placing concrete at night for most projects in New Mexico.
50
REFERENCES 1. Healy, R. J. and Lawrie, R. A. (1998). “Bridge cracking: A DOT experience and perspective,” Concrete International, 20(9), 37. 2. Kosmatka, S. H., Kerkhoff, B., and Panarese, W. C. (2002). Design and Control of Concrete Mixtures (14th ed.). Portland Cement Association, Skokie. 3. Lozoya, J., and Newtson, C. M. (2004). “Effects of early misting on concrete shrinkage,” Proceedings: Advancing Concrete Through Science and Engineering, RILEM, March 2004, Evanston. 4. Nawa,T., and Horita, T. (2004). “Autogenous shrinkage of high performance concrete,” Proceeding of the International Workshop on Microstructure and Durability to Predict Service Life of Concrete Structures, Sapporo, Japan, Feb 2004.
5. Safiuddin, M. D., Ramanan, S. N., and Zain, M.F.N. (2007). “Effect of different curing methods on the properties of microsillica concrete,” Australian Journal of Basic and Applied Sciences, 1(2) 87-95.
6. McDonald, D. B., Krauss, P. D., and Rogalla, E. A. (1995). “Early- age transverse deck cracking,” Concrete International, V. 17(n5), pp. 49-51. 7. William,G.W., Shoukry, S.N., and Raid,M.Y. (2005), “Early age cracking of reinforced concrete bridge decks,” Bridge Structures,V1(4),p379-396. 8. Cusson, D. and Repette, W. L. (2000). “Early age cracking in reinforced concrete bridge barrier walls,” ACI Materials Journal, 97(4), 438-446.
9. French, C. E., Eppers, L. J., Le, Q. T. C., and Hajjar, J. F. ( 1999). “Transverse cracking in bridge decks,” Minnesota Department of Transportation. Report No. MN/RC-1999-05. 10. Holt, E. (2001). “Early-age autogenous shrinkage measurement,” Technical Research Centre of FinLand, VTT Publication 466.
11. Xi,Y., Shing, B., Hejleh, A. H., Asiz, A., Suwito, A., Xie, Z., and Ababneh, A. (2003). “Assesment of cracking problems in newly constructed bridge decks in Colorado,” Colorado Department of Transportation Research Report CDOT-DTD-R-2003-3. 12. Menzel, C. A., (1954) “Causes and Prevention of Crack Development in Plastic Concrete,” Proceedings of the Portland Cement Association, pp. 130-136.
13. Aitcin, Pierre-Claude, (1999). “Autogenous shrinkage measurement,” Autogenous shrinkage of concrete, edited by Ei-ichi, Tazawa, E& FN Spon, London, p. 17. 14. Silliman, K. (2005). “Effect of misting rate on concrete shrinkage,” M.S. Thesis, New Mexico State University, Las Cruces, New Mexico.
51
15. Rogalla, E. A., Krauss, P. D., and Mc Donald, D. B. (1995). “Reducing trasverse cracking in new concrete bridge decks,” Concrete Construction, Sept 1995. 735-737. 16. ACI-308R-01. (2001). “Guide to Curing Concrete,” American Concrete Institute Committee, 308. 17. http://www.nkhome.com/ Retrieved May 15, 2008. 18.http://www.euclidchemical.com/fileshare/ProductFiles/techdata/kurez_vox_white_pigmented. pdf , Retrieved May 15, 2008. 19. Kochanski, T., Parry, J., Pruess, D., Schuchardt,L., and Ziehr, J. (1990). “Premature cracking of concrete bridge decks study,” Final Rep., Wisconsin Department of Transportation, Madison.
20. Krauss, P. D. and Rogalla. (1996). National Cooperative Highway Research Programme Report 380: Transverse cracking in newly constructed bridge decks. Transportation Research Board, National Research Council. 21. Uno, P.J. (1998). “Plastic shrinkage cracking and evaporation formulas,” ACI Materials Journal, 95(4), 365-375.
52
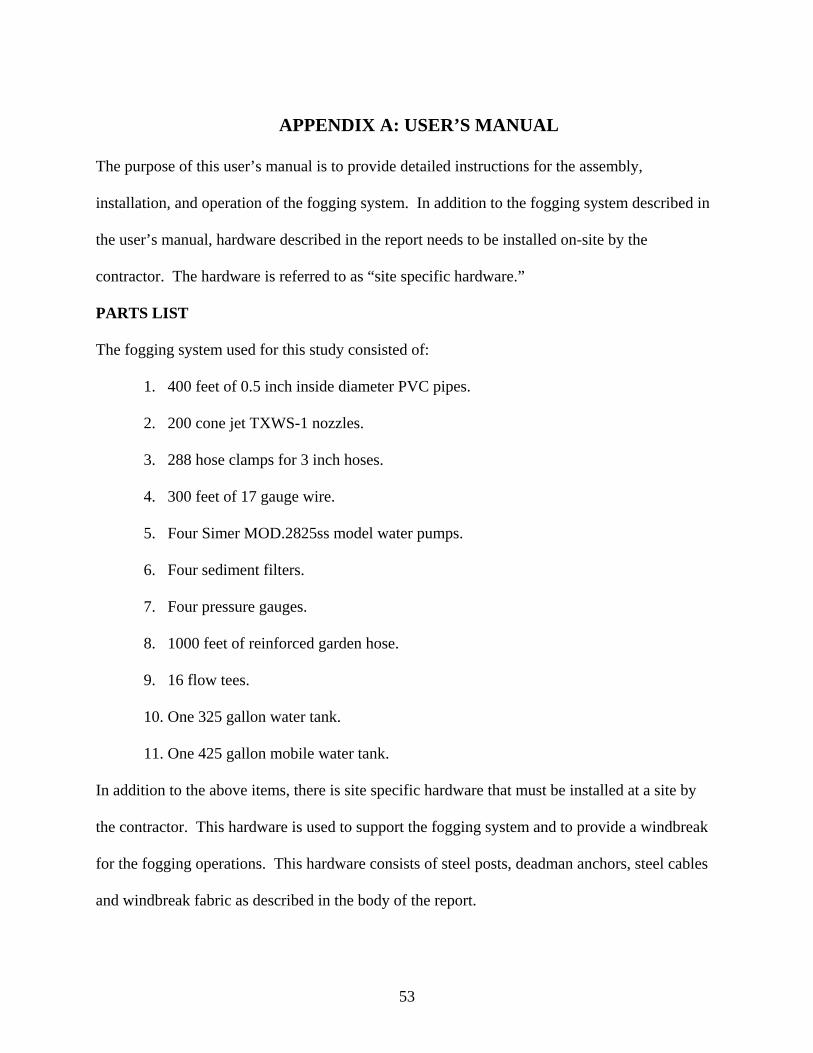
APPENDIX A: USER’S MANUAL
The purpose of this user’s manual is to provide detailed instructions for the assembly,
installation, and operation of the fogging system. In addition to the fogging system described in
the user’s manual, hardware described in the report needs to be installed on-site by the
contractor. The hardware is referred to as “site specific hardware.”
PARTS LIST
The fogging system used for this study consisted of:
1. 400 feet of 0.5 inch inside diameter PVC pipes.
2. 200 cone jet TXWS-1 nozzles.
3. 288 hose clamps for 3 inch hoses.
4. 300 feet of 17 gauge wire.
5. Four Simer MOD.2825ss model water pumps.
6. Four sediment filters.
7. Four pressure gauges.
8. 1000 feet of reinforced garden hose.
9. 16 flow tees.
10. One 325 gallon water tank.
11. One 425 gallon mobile water tank.
In addition to the above items, there is site specific hardware that must be installed at a site by
the contractor. This hardware is used to support the fogging system and to provide a windbreak
for the fogging operations. This hardware consists of steel posts, deadman anchors, steel cables
and windbreak fabric as described in the body of the report.
53
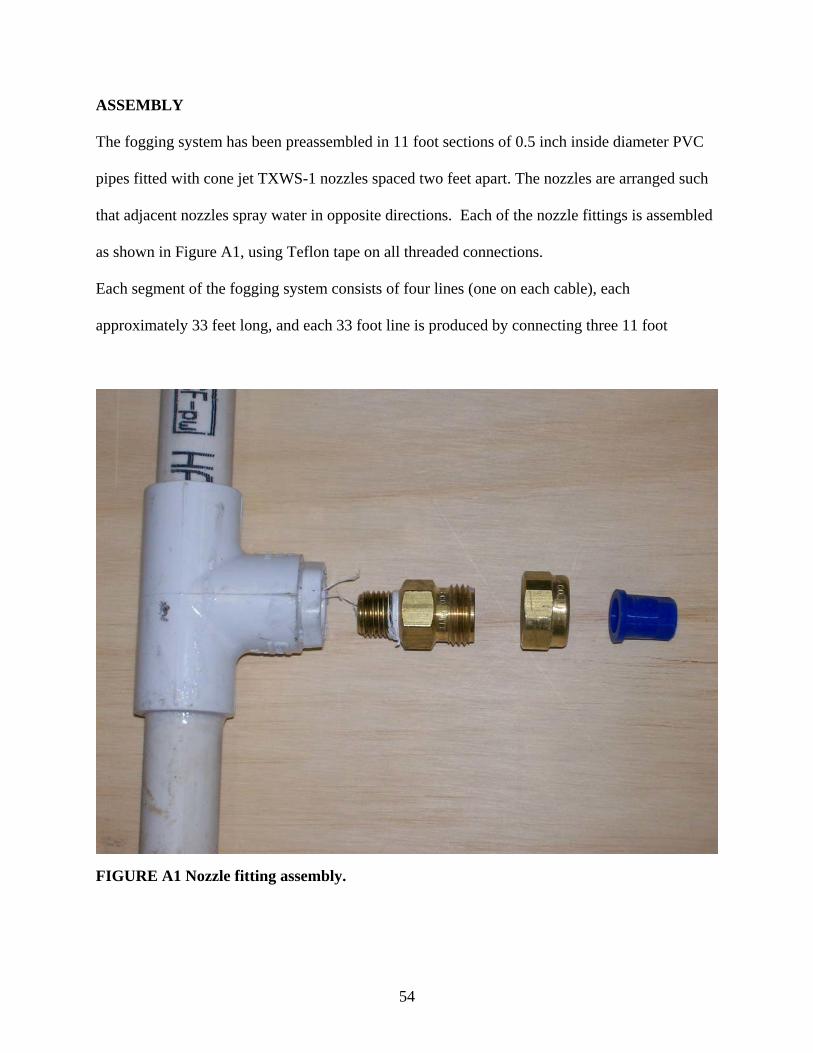
ASSEMBLY
The fogging system has been preassembled in 11 foot sections of 0.5 inch inside diameter PVC
pipes fitted with cone jet TXWS-1 nozzles spaced two feet apart. The nozzles are arranged such
that adjacent nozzles spray water in opposite directions. Each of the nozzle fittings is assembled
as shown in Figure A1, using Teflon tape on all threaded connections.
Each segment of the fogging system consists of four lines (one on each cable), each
approximately 33 feet long, and each 33 foot line is produced by connecting three 11 foot
FIGURE A1 Nozzle fitting assembly.
54
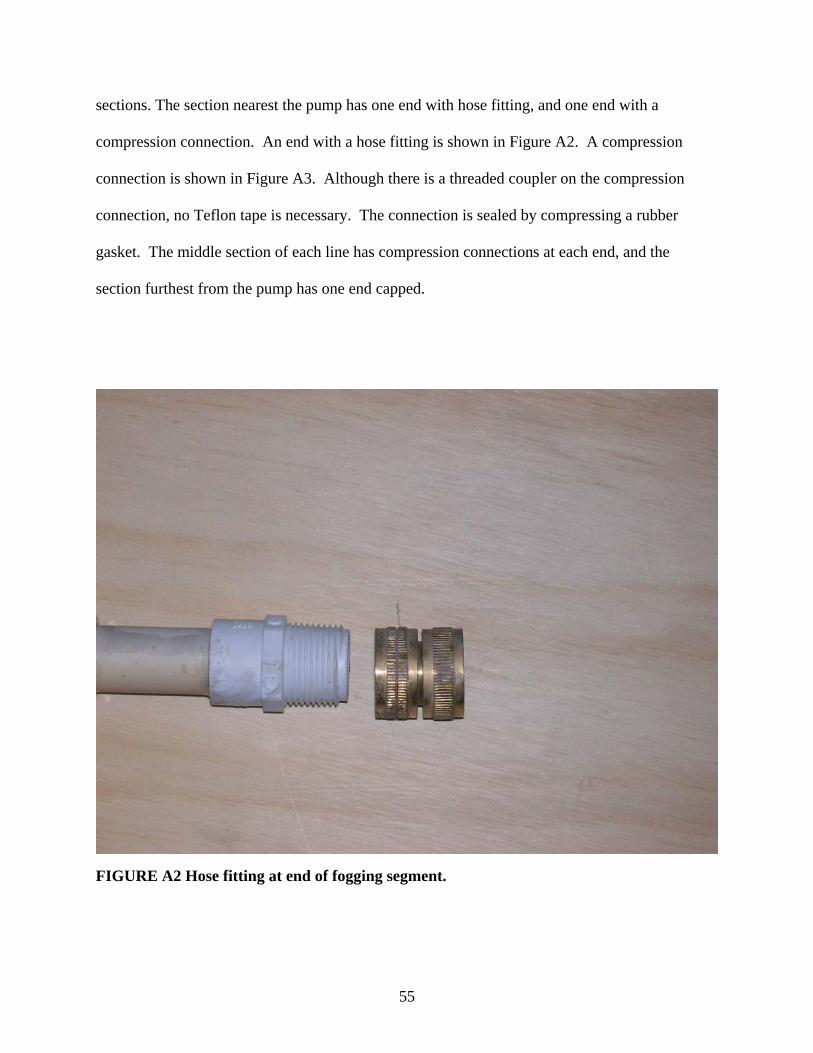
sections. The section nearest the pump has one end with hose fitting, and one end with a
compression connection. An end with a hose fitting is shown in Figure A2. A compression
connection is shown in Figure A3. Although there is a threaded coupler on the compression
connection, no Teflon tape is necessary. The connection is sealed by compressing a rubber
gasket. The middle section of each line has compression connections at each end, and the
section furthest from the pump has one end capped.
FIGURE A2 Hose fitting at end of fogging segment.
55
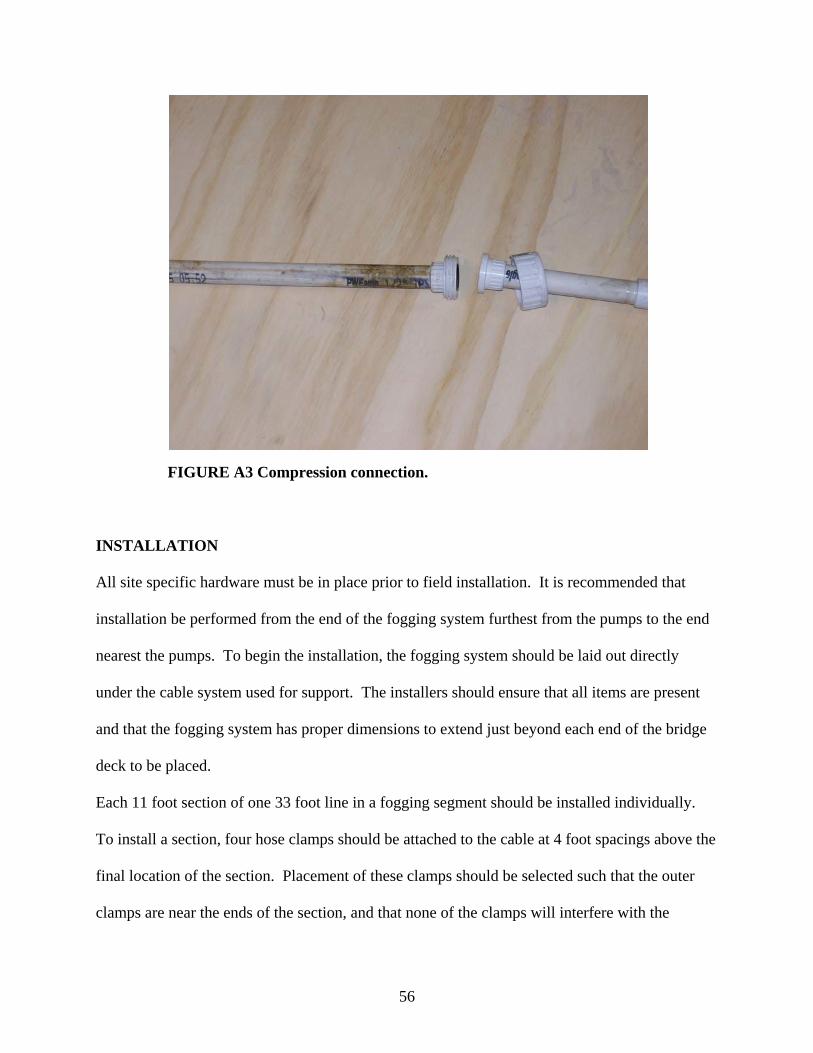
FIGURE A3 Compression connection.
INSTALLATION
All site specific hardware must be in place prior to field installation. It is recommended that
installation be performed from the end of the fogging system furthest from the pumps to the end
nearest the pumps. To begin the installation, the fogging system should be laid out directly
under the cable system used for support. The installers should ensure that all items are present
and that the fogging system has proper dimensions to extend just beyond each end of the bridge
deck to be placed.
Each 11 foot section of one 33 foot line in a fogging segment should be installed individually.
To install a section, four hose clamps should be attached to the cable at 4 foot spacings above the
final location of the section. Placement of these clamps should be selected such that the outer
clamps are near the ends of the section, and that none of the clamps will interfere with the
56
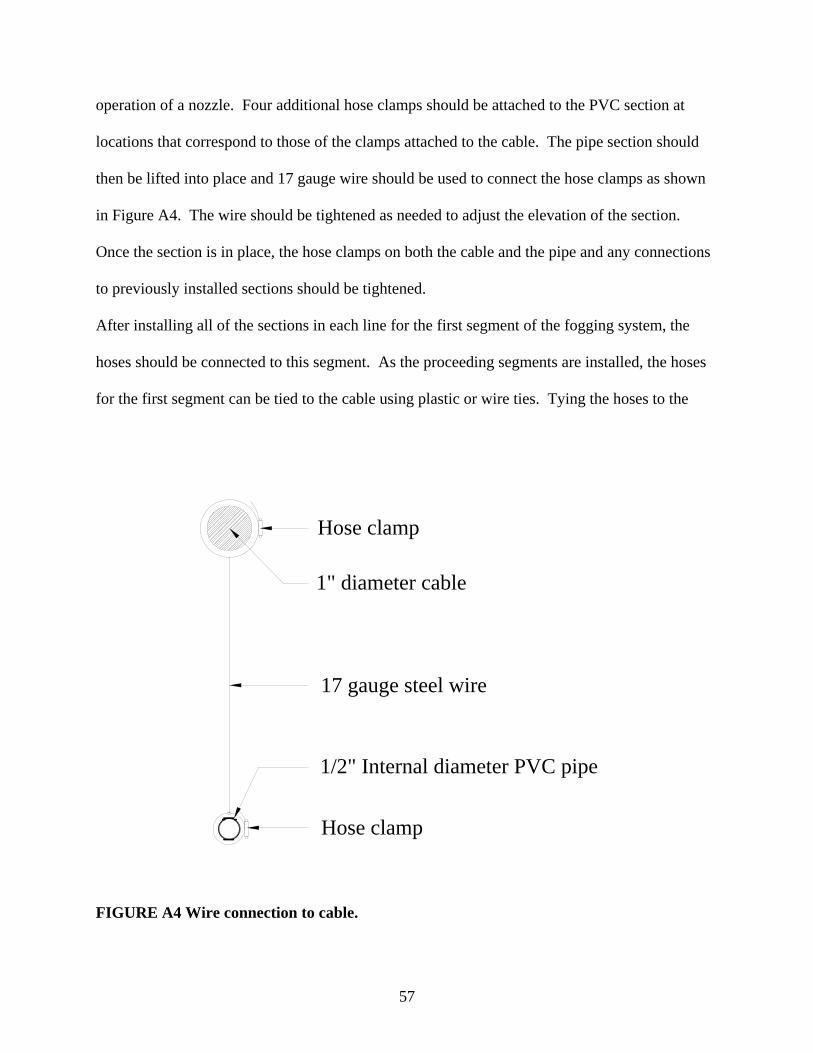
operation of a nozzle. Four additional hose clamps should be attached to the PVC section at
locations that correspond to those of the clamps attached to the cable. The pipe section should
then be lifted into place and 17 gauge wire should be used to connect the hose clamps as shown
in Figure A4. The wire should be tightened as needed to adjust the elevation of the section.
Once the section is in place, the hose clamps on both the cable and the pipe and any connections
to previously installed sections should be tightened.
After installing all of the sections in each line for the first segment of the fogging system, the
hoses should be connected to this segment. As the proceeding segments are installed, the hoses
for the first segment can be tied to the cable using plastic or wire ties. Tying the hoses to the
Hose clamp
1" diameter cable
17 gauge steel wire
1/2" Internal diameter PVC pipe
Hose clamp
FIGURE A4 Wire connection to cable.
57
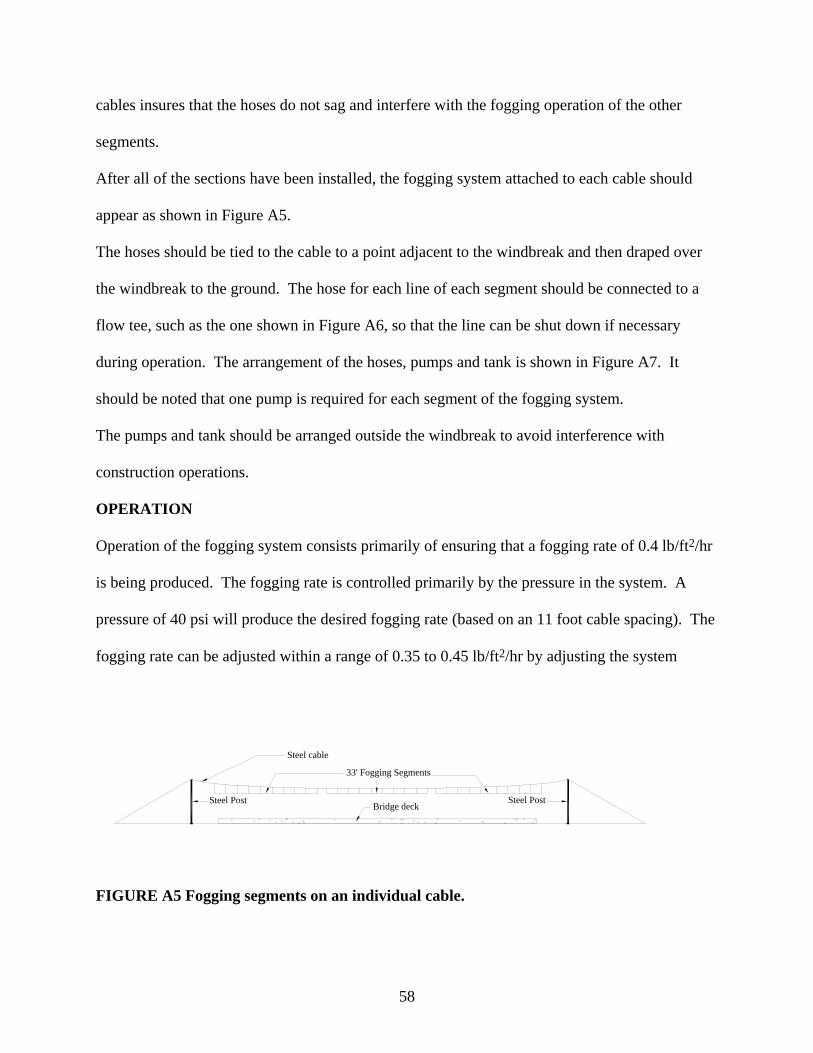
cables insures that the hoses do not sag and interfere with the fogging operation of the other
segments.
After all of the sections have been installed, the fogging system attached to each cable should
appear as shown in Figure A5.
The hoses should be tied to the cable to a point adjacent to the windbreak and then draped over
the windbreak to the ground. The hose for each line of each segment should be connected to a
flow tee, such as the one shown in Figure A6, so that the line can be shut down if necessary
during operation. The arrangement of the hoses, pumps and tank is shown in Figure A7. It
should be noted that one pump is required for each segment of the fogging system.
The pumps and tank should be arranged outside the windbreak to avoid interference with
construction operations.
OPERATION
Operation of the fogging system consists primarily of ensuring that a fogging rate of 0.4 lb/ft2/hr
is being produced. The fogging rate is controlled primarily by the pressure in the system. A
pressure of 40 psi will produce the desired fogging rate (based on an 11 foot cable spacing). The
fogging rate can be adjusted within a range of 0.35 to 0.45 lb/ft2/hr by adjusting the system
Bridge deck
33' Fogging Segments
Steel Post Steel Post
Steel cable
FIGURE A5 Fogging segments on an individual cable.
58
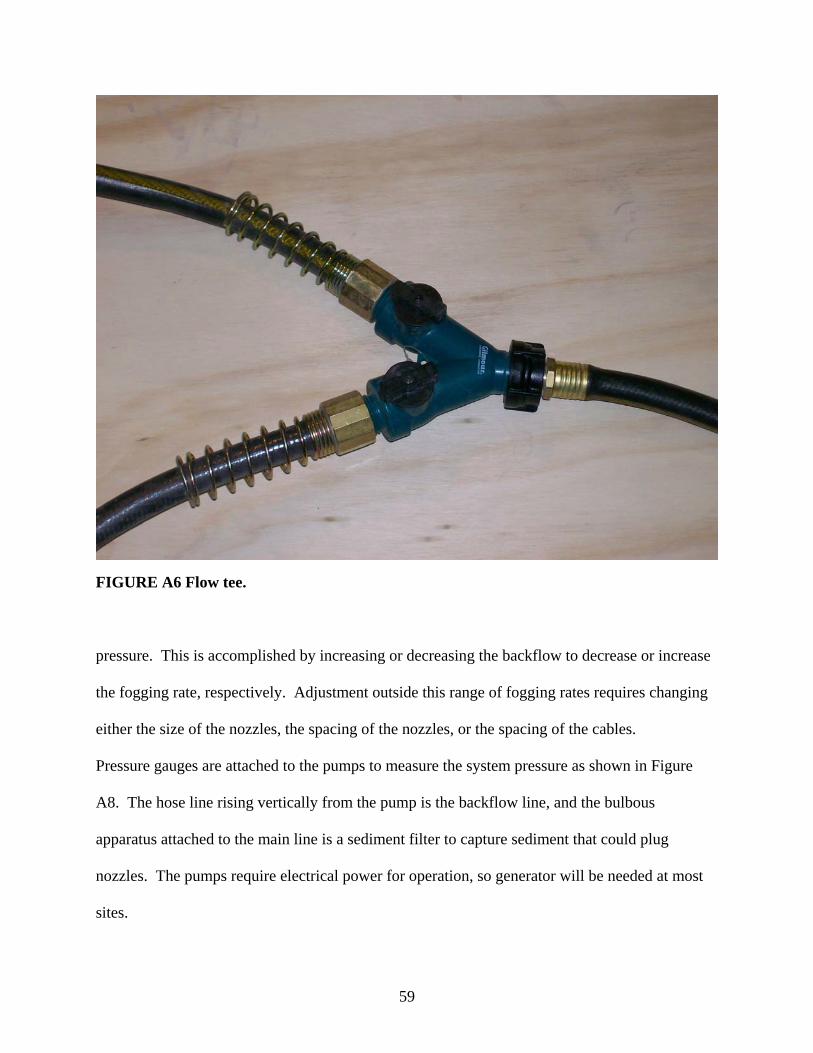
FIGURE A6 Flow tee.
pressure. This is accomplished by increasing or decreasing the backflow to decrease or increase
the fogging rate, respectively. Adjustment outside this range of fogging rates requires changing
either the size of the nozzles, the spacing of the nozzles, or the spacing of the cables.
Pressure gauges are attached to the pumps to measure the system pressure as shown in Figure
A8. The hose line rising vertically from the pump is the backflow line, and the bulbous
apparatus attached to the main line is a sediment filter to capture sediment that could plug
nozzles. The pumps require electrical power for operation, so generator will be needed at most
sites.
59
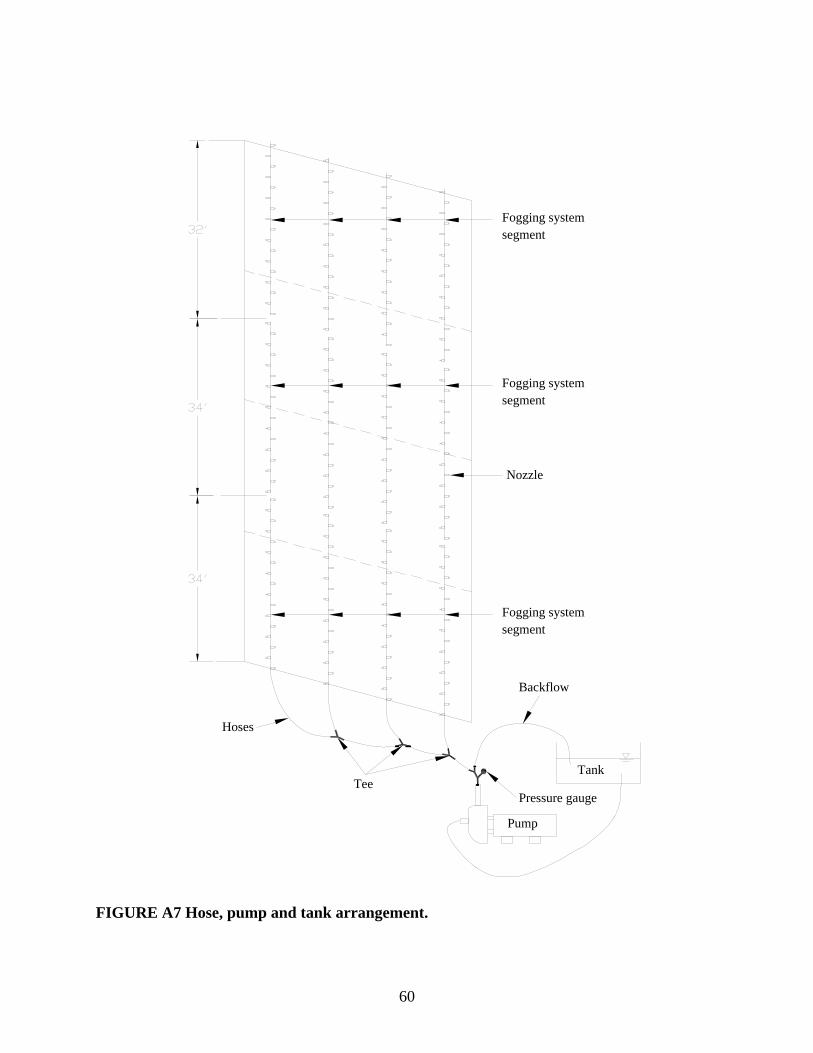
Fogging systemsegment
Fogging systemsegment
Fogging systemsegment
Nozzle
Pump
Tank
Backflow
Hoses
Tee
Pressure gauge
FIGURE A7 Hose, pump and tank arrangement.
60
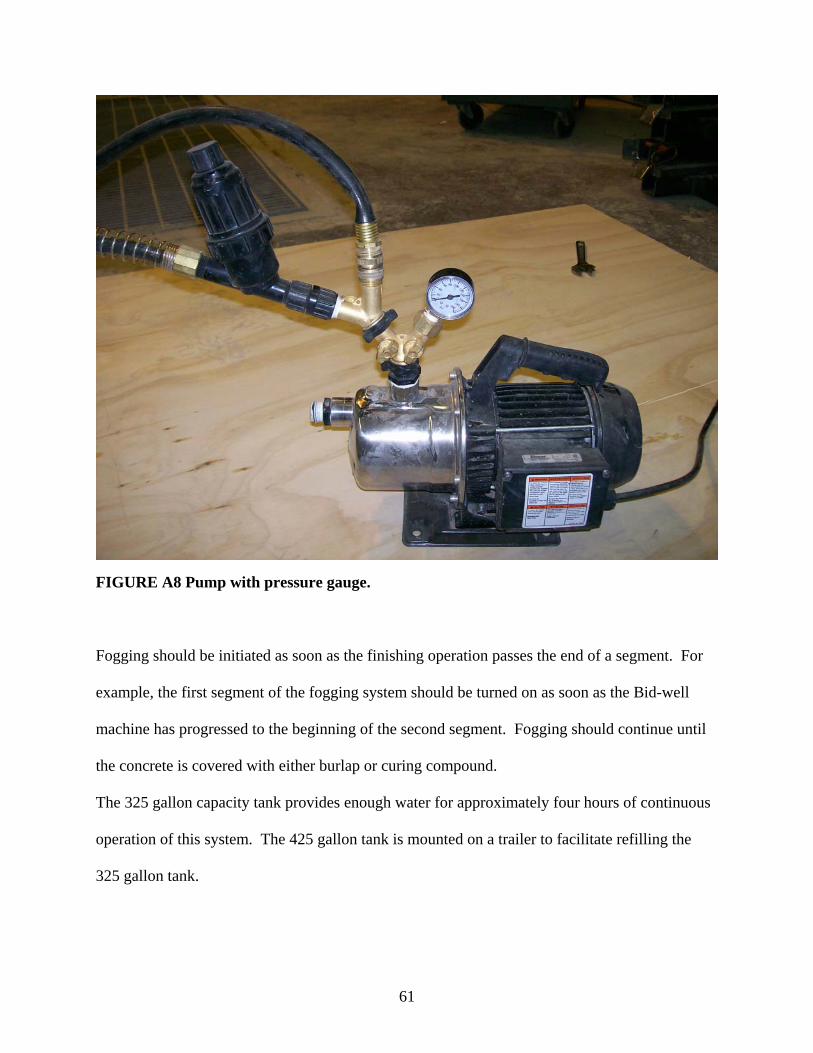
FIGURE A8 Pump with pressure gauge.
Fogging should be initiated as soon as the finishing operation passes the end of a segment. For
example, the first segment of the fogging system should be turned on as soon as the Bid-well
machine has progressed to the beginning of the second segment. Fogging should continue until
the concrete is covered with either burlap or curing compound.
The 325 gallon capacity tank provides enough water for approximately four hours of continuous
operation of this system. The 425 gallon tank is mounted on a trailer to facilitate refilling the
325 gallon tank.
61
2
New Mexico Department of Transportation RESEARCH BUREAU 7500B Pan American Freeway NE PO Box 94690 Albuquerque, NM 87199-4690 Tel: (505) 841-9145


![[AGENCY] CONTRACTS AND PROCUREMENT POLICY AND PROCEDURES ...dot.state.nm.us/content/dam/nmdot/Transit_Rail/ProcurementManual... · [agency] contracts and procurement policy and procedures](https://img.pdfslide.us/doc/110x75/5ae0bbb27f8b9a6e5c8dd48a/agency-contracts-and-procurement-policy-and-procedures-dotstatenmuscontentdamnmdottransitrailprocurementmanualagency.jpg)