Embed Size (px)
Citation preview
1
Interim Financial Results for the three months ended 31 March 2018
This commentary relates to the interim non audited financial statements for the three months ended 31
March 2018 presented in accordance with Sri Lanka Accounting Standard 34 (LKAS 34) on “Interim Financial
Statements”. The Sri Lanka Accounting Standard – SLFRS 9 Financial Instruments is effective for annual
periods beginning on or after 01 January 2018. However, as per the “Statement of Alternative Treatment
(SoAT) on the Figures in the Interim Financial Statements”, CA Sri Lanka has granted the option to prepare
the interim financial statements continuing the application of LKAS 39 Financial Instruments: Recognition
and Measurement. The Bank has decided to use this option.
DFCC drives its core business forward in Q 1
DFCC continues to aggressively persue its role as a commercial bank by strengthening its core business,
creating momentum in the industry with its constantly evolving best in class offerings and creating a culture
of service amongst its people.
GROUP RESULTS
The DFCC Group comprises DFCC Bank PLC (DFCC), and its subsidiaries - Lanka Industrial Estates Limited
(LINDEL), DFCC Consulting (Pvt) Limited (DCPL) and Synapsys Limited (SL), the joint venture company - Acuity
Partners (Pvt) Limited (APL) and the associate company - National Asset Management Limited (NAMAL).
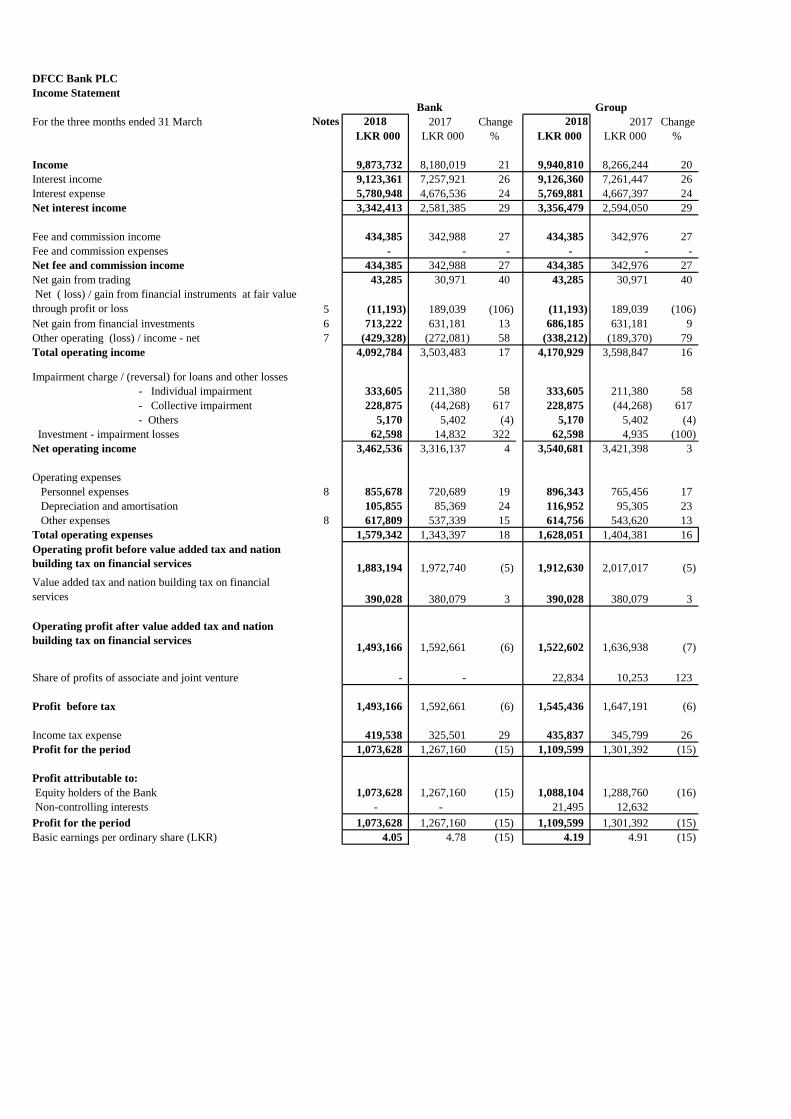
For quarter ended 31 March 2018, the DFCC Group recorded a profit before tax of LKR 1,545 million and
profit after tax of LKR1,110 million as compared to LKR 1,647 million and LKR 1,301 million respectively in
the comparative period in 2017.
BANK RESULTS
Income Statement
The Bank reported a profit before tax of LKR 1,493 million and a profit after tax of LKR 1,074 million
compared to LKR 1,593 million and LKR 1,267 million in the comparative period in 2017, a drop of 6% and
15% respectively.
The Bank recorded a growth of 17% in total operating income amounting to LKR 4,093 million for the quarter
ended 31 March 2018 compared to LKR 3,503 in the comparative period in 2017. However due to the higher
charge for impairment as a result of Bank’s prudent provisioning policies, the net operating income recorded
a growth of only 4%.
The Bank’s NPL ratio increased to 3.12% as at March 2018 from 2.77% recorded in December 2017 as a
result of adverse environmental conditions in the operating environment. The industry NPL ratio also
recorded an upward trend.
2
The Bank has strengthened processes whereby close follow up measures are taken to arrest defaults at an
early stage and all efforts are made to swiftly recover loans in default.
The Bank achieved a notable growth in its core business operations during the quarter under review.
During the current period, net interest income grew by 29% to LKR 3,342 million from LKR 2,581 million in
the 1st quarter of 2017 while net fee and commission income grew by 27% to LKR 434 million from LKR
343 million in the comparable period. Interest margin improved to 4.0% during the quarter under
review from 3.6% in the comparable period.
Operating expenses increased from LKR 1,343 million to LKR 1,579 million (18%) in the comparable period
due to branch expansion and business promotions that were carried out during the first quarter 2018. Bank
added 10 fully fledged branches during the period April 2017 to March 2018 and continued its drive to
expand its franchise through business promotions, which helped to increase income streams.
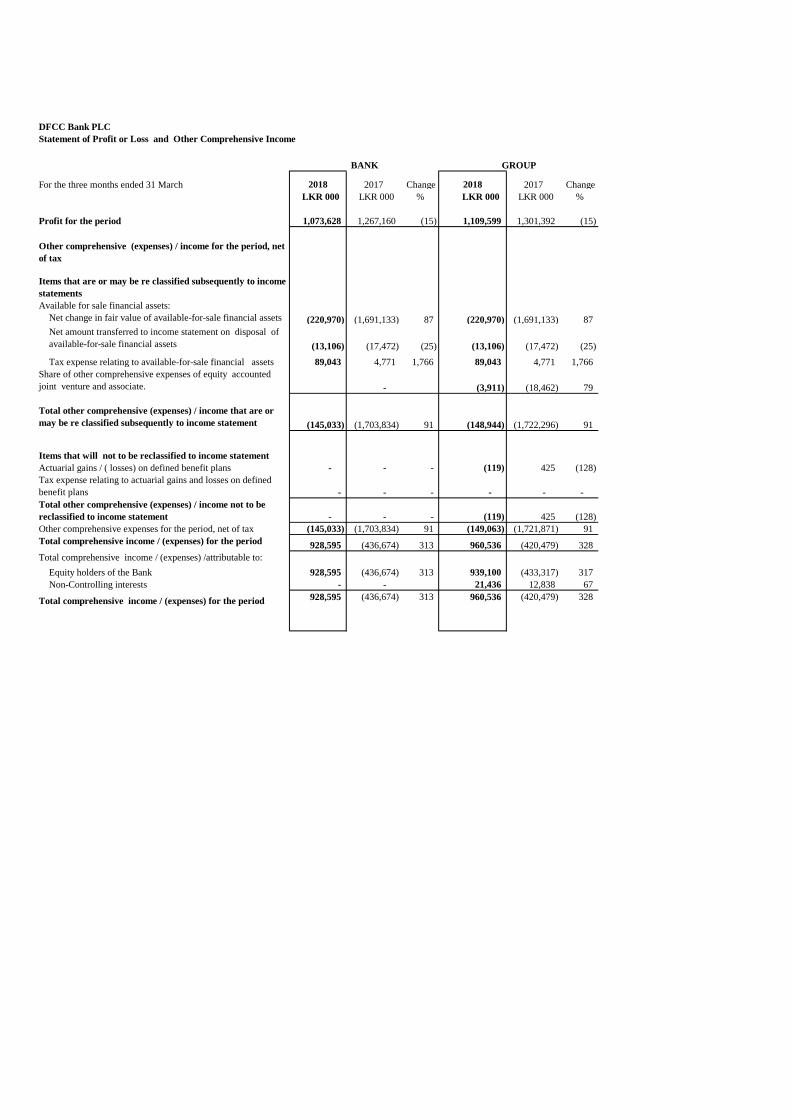
Other comprehensive income before tax improved by LKR 1,475 million (86%) over the previous period.
Mark to market impact on investment in equity securities under available for sales investment has improved
by LKR 1,771 Million year on year while mark to market impact on fixed income securities declined by LKR
296 million.
Financial Position
Total assets of the Bank grew by LKR 67,236 million year on year which reflects a 24% growth compared to
March 2017. The growth in total assets from December 2017 was LKR 18,393 Million (6%).
Continuing the growth strategy, Bank’s Loans to and receivables from other customers (Loans and advances)
grew by LKR 35,475 million to LKR 222,588 million compared to LKR 187,113 million as at 31 March 2017
reflecting a growth of 19%. First quarter 2018 growth in Loans and advances was LKR 8,912 million.
Reflecting the success of the deposit promotional campaigns and also public trust in the Bank, the deposit
base increased by LKR 56,925 million (40%) from LKR 143,625 million in March 2017 to LKR 200,550 million
as at 31 March 2018. The Bank’s low cost deposits (CASA) ratio was 19.6% compared to 21.3% as at 31
December 2017.
This is a result of an increased growth in time deposits versus savings which is reflected in the first quarter.
With the impending promotional campaigns planned to mobilise low cost deposits this position will be
corrected in the coming months.
The Bank continues to enjoy long term concessionary credit lines which improves the ratio to 28.4% as at 31
March 2018.
Equity & Capital Requirements
The Bank has successfully issued BASEL III compliant Tier II listed rated unsecured subordinated redeemable
debenture of LKR 7 billion (oversubscribed on opening day) in order to sustain the planned lending growth
and to maintain stable Basel III compliant ratio. The Bank has comfortably met minimum capital requirement
ratios under Basel III. As at 31 March 2018, the Group’s Tier 1 capital adequacy ratio stood at 12.462% while
3
the total capital adequacy ratio stood at 18.242%. DFCC Bank recorded Tier 1 and total capital adequacy
ratios of 12.074% and 17.877% respectively as at 31st March 2018 compared to tier I and total ratios of
12.68% and 16.13% respectively as at 31st December 2017. The ratios reported are well above the minimum
regulatory requirements of 7.875% and 11.875%.
Future Business Outlook
The overall performance of the quarter indicates that DFCC Bank is well positioned to serve the nation as a
commercial bank through a range of financial services that will promote wealth creation across the country.
The Bank is inculcating in its entire staff a culture of providing excellence to customers at all touch points.
The Bank is in line with targets set for Q 1 as per the Board approved 3 year plan. Whilst planning our growth
strategy we have set into motion an array of financially prudent measures, digitalization initiatives,
customized financial solutions coupled with convenience, branch expansion and other innovative products &
services to position ourselves to becoming the preferred consumer bank in the banking landscape. The
state-of-the-art Payments and Cash Management (PCM) solution & the new range of Credit Cards launched
will facilitate in making DFCC’s consumer banking proposition much stronger. Delivering sustainable value to
all our stakeholders underpins our efforts as we partner our customers on the path to financial growth.
Lakshman Silva
Director/Chief Executive Officer
26 April 2018
DFCC Bank PLC
Income Statement
For the three months ended 31 March Notes 2018 2017 Change 2018 2017 Change
LKR 000 LKR 000 % LKR 000 LKR 000 %
Income 9,873,732 8,180,019 21 9,940,810 8,266,244 20
Interest income 9,123,361 7,257,921 26 9,126,360 7,261,447 26
Interest expense 5,780,948 4,676,536 24 5,769,881 4,667,397 24
Net interest income 3,342,413 2,581,385 29 3,356,479 2,594,050 29
Fee and commission income 434,385 342,988 27 434,385 342,976 27
Fee and commission expenses - - - - - -
Net fee and commission income 434,385 342,988 27 434,385 342,976 27
Net gain from trading 43,285 30,971 40 43,285 30,971 40
Net ( loss) / gain from financial instruments at fair value
through profit or loss 5 (11,193) 189,039 (106) (11,193) 189,039 (106)
Net gain from financial investments 6 713,222 631,181 13 686,185 631,181 9
Other operating (loss) / income - net 7 (429,328) (272,081) 58 (338,212) (189,370) 79
Total operating income 4,092,784 3,503,483 17 4,170,929 3,598,847 16
Impairment charge / (reversal) for loans and other losses
- Individual impairment 333,605 211,380 58 333,605 211,380 58
- Collective impairment 228,875 (44,268) 617 228,875 (44,268) 617
- Others 5,170 5,402 (4) 5,170 5,402 (4)
Investment - impairment losses 62,598 14,832 322 62,598 4,935 (100)
Net operating income 3,462,536 3,316,137 4 3,540,681 3,421,398 3
Operating expenses
Personnel expenses 8 855,678 720,689 19 896,343 765,456 17
Depreciation and amortisation 105,855 85,369 24 116,952 95,305 23
Other expenses 8 617,809 537,339 15 614,756 543,620 13
Total operating expenses 1,579,342 1,343,397 18 1,628,051 1,404,381 16
Operating profit before value added tax and nation
building tax on financial services 1,883,194 1,972,740 (5) 1,912,630 2,017,017 (5)
Value added tax and nation building tax on financial
services 390,028 380,079 3 390,028 380,079 3
Operating profit after value added tax and nation
building tax on financial services1,493,166 1,592,661 (6) 1,522,602 1,636,938 (7)
Share of profits of associate and joint venture - - 22,834 10,253 123
Profit before tax 1,493,166 1,592,661 (6) 1,545,436 1,647,191 (6)
Income tax expense 419,538 325,501 29 435,837 345,799 26
Profit for the period 1,073,628 1,267,160 (15) 1,109,599 1,301,392 (15)
Profit attributable to:
Equity holders of the Bank 1,073,628 1,267,160 (15) 1,088,104 1,288,760 (16)
Non-controlling interests - - 21,495 12,632
Profit for the period 1,073,628 1,267,160 (15) 1,109,599 1,301,392 (15)
Basic earnings per ordinary share (LKR) 4.05 4.78 (15) 4.19 4.91 (15)
Bank Group
DFCC Bank PLC
Statement of Profit or Loss and Other Comprehensive Income
For the three months ended 31 March 2018 2017 Change 2018 2017 Change
LKR 000 LKR 000 % LKR 000 LKR 000 %
Profit for the period 1,073,628 1,267,160 (15) 1,109,599 1,301,392 (15)
Available for sale financial assets:
Net change in fair value of available-for-sale financial assets (220,970) (1,691,133) 87 (220,970) (1,691,133) 87
Net amount transferred to income statement on disposal of
available-for-sale financial assets (13,106) (17,472) (25) (13,106) (17,472) (25)
Tax expense relating to available-for-sale financial assets 89,043 4,771 1,766 89,043 4,771 1,766
- (3,911) (18,462) 79
(145,033) (1,703,834) 91 (148,944) (1,722,296) 91
- - - (119) 425 (128)
- - - - - -
- - - (119) 425 (128)
(145,033) (1,703,834) 91 (149,063) (1,721,871) 91
928,595 (436,674) 313 960,536 (420,479) 328
Equity holders of the Bank 928,595 (436,674) 313 939,100 (433,317) 317
Non-Controlling interests - - 21,436 12,838 67
928,595 (436,674) 313 960,536 (420,479) 328
BANK GROUP
Other comprehensive (expenses) / income for the period, net
of tax
Items that are or may be re classified subsequently to income
statements
Share of other comprehensive expenses of equity accounted
joint venture and associate.
Total other comprehensive (expenses) / income that are or
may be re classified subsequently to income statement
Items that will not to be reclassified to income statement
Total comprehensive income / (expenses) /attributable to:
Total comprehensive income / (expenses) for the period
Actuarial gains / ( losses) on defined benefit plans
Tax expense relating to actuarial gains and losses on defined
benefit plans
Total other comprehensive (expenses) / income not to be
reclassified to income statement
Other comprehensive expenses for the period, net of tax
Total comprehensive income / (expenses) for the period
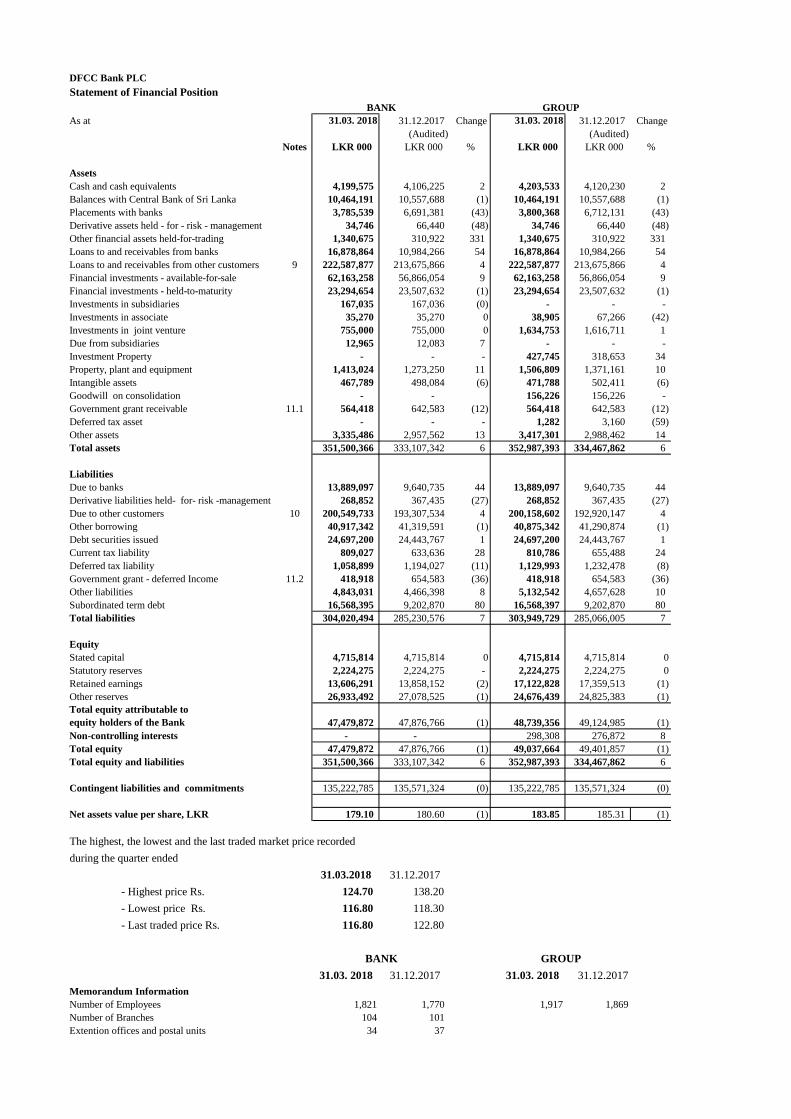
DFCC Bank PLC
Statement of Financial Position
As at 31.03. 2018 31.12.2017 Change 31.03. 2018 31.12.2017 Change
(Audited) (Audited)
Notes LKR 000 LKR 000 % LKR 000 LKR 000 %
Assets
Cash and cash equivalents 4,199,575 4,106,225 2 4,203,533 4,120,230 2
Balances with Central Bank of Sri Lanka 10,464,191 10,557,688 (1) 10,464,191 10,557,688 (1)
Placements with banks 3,785,539 6,691,381 (43) 3,800,368 6,712,131 (43)
Derivative assets held - for - risk - management 34,746 66,440 (48) 34,746 66,440 (48)
Other financial assets held-for-trading 1,340,675 310,922 331 1,340,675 310,922 331
Loans to and receivables from banks 16,878,864 10,984,266 54 16,878,864 10,984,266 54
Loans to and receivables from other customers 9 222,587,877 213,675,866 4 222,587,877 213,675,866 4
Financial investments - available-for-sale 62,163,258 56,866,054 9 62,163,258 56,866,054 9
Financial investments - held-to-maturity 23,294,654 23,507,632 (1) 23,294,654 23,507,632 (1)
Investments in subsidiaries 167,035 167,036 (0) - - -
Investments in associate 35,270 35,270 0 38,905 67,266 (42)
Investments in joint venture 755,000 755,000 0 1,634,753 1,616,711 1
Due from subsidiaries 12,965 12,083 7 - - -
Investment Property - - - 427,745 318,653 34
Property, plant and equipment 1,413,024 1,273,250 11 1,506,809 1,371,161 10
Intangible assets 467,789 498,084 (6) 471,788 502,411 (6)
Goodwill on consolidation - - 156,226 156,226 -
Government grant receivable 11.1 564,418 642,583 (12) 564,418 642,583 (12)
Deferred tax asset - - - 1,282 3,160 (59)
Other assets 3,335,486 2,957,562 13 3,417,301 2,988,462 14
Total assets 351,500,366 333,107,342 6 352,987,393 334,467,862 6
Liabilities
Due to banks 13,889,097 9,640,735 44 13,889,097 9,640,735 44
Derivative liabilities held- for- risk -management 268,852 367,435 (27) 268,852 367,435 (27)
Due to other customers 10 200,549,733 193,307,534 4 200,158,602 192,920,147 4
Other borrowing 40,917,342 41,319,591 (1) 40,875,342 41,290,874 (1)
Debt securities issued 24,697,200 24,443,767 1 24,697,200 24,443,767 1
Current tax liability 809,027 633,636 28 810,786 655,488 24
Deferred tax liability 1,058,899 1,194,027 (11) 1,129,993 1,232,478 (8)
Government grant - deferred Income 11.2 418,918 654,583 (36) 418,918 654,583 (36)
Other liabilities 4,843,031 4,466,398 8 5,132,542 4,657,628 10
Subordinated term debt 16,568,395 9,202,870 80 16,568,397 9,202,870 80
Total liabilities 304,020,494 285,230,576 7 303,949,729 285,066,005 7
Equity
Stated capital 4,715,814 4,715,814 0 4,715,814 4,715,814 0
Statutory reserves 2,224,275 2,224,275 - 2,224,275 2,224,275 0
Retained earnings 13,606,291 13,858,152 (2) 17,122,828 17,359,513 (1)
Other reserves 26,933,492 27,078,525 (1) 24,676,439 24,825,383 (1)
Total equity attributable to
equity holders of the Bank 47,479,872 47,876,766 (1) 48,739,356 49,124,985 (1)
Non-controlling interests - - 298,308 276,872 8
Total equity 47,479,872 47,876,766 (1) 49,037,664 49,401,857 (1)
Total equity and liabilities 351,500,366 333,107,342 6 352,987,393 334,467,862 6
Contingent liabilities and commitments 135,222,785 135,571,324 (0) 135,222,785 135,571,324 (0)
Net assets value per share, LKR 179.10 180.60 (1) 183.85 185.31 (1)
The highest, the lowest and the last traded market price recorded
during the quarter ended
31.03.2018 31.12.2017
- Highest price Rs. 124.70 138.20
- Lowest price Rs. 116.80 118.30
- Last traded price Rs. 116.80 122.80
31.03. 2018 31.12.2017 31.03. 2018 31.12.2017
Memorandum Information
Number of Employees 1,821 1,770 1,917 1,869
Number of Branches 104 101
Extention offices and postal units 34 37
BANK GROUP
BANK GROUP
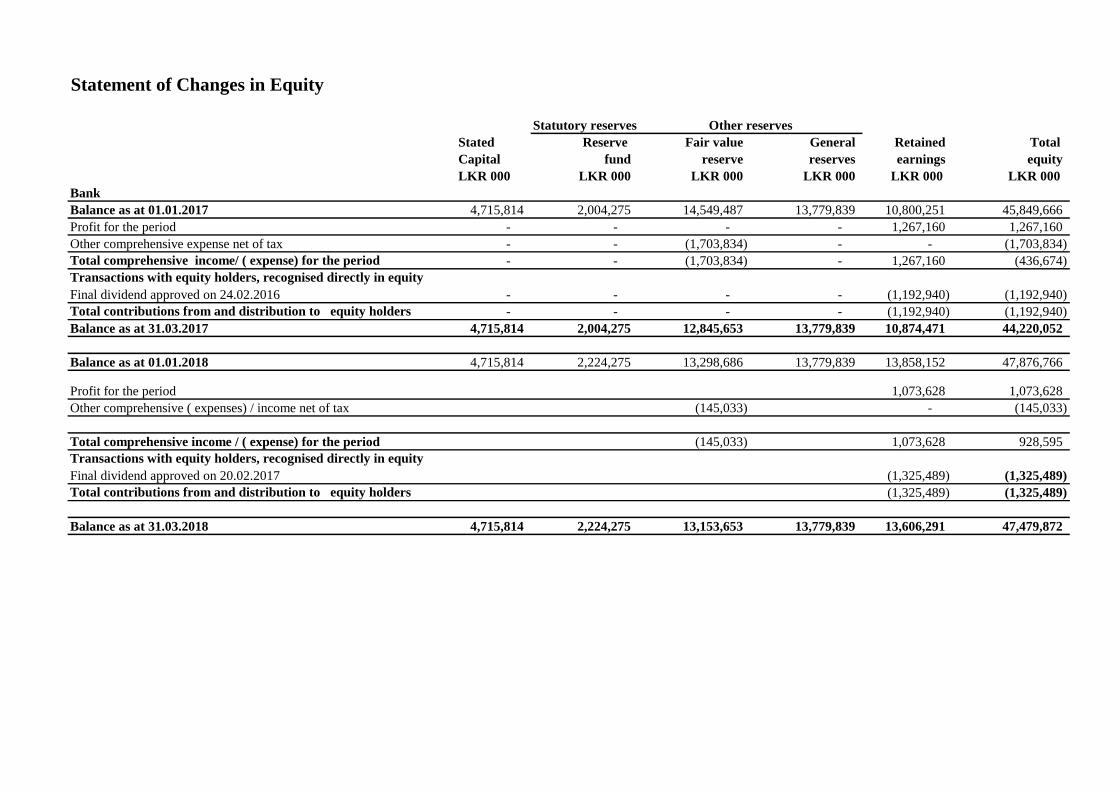
Statement of Changes in Equity
Stated Reserve Fair value General Retained Total
Capital fund reserve reserves earnings equity
LKR 000 LKR 000 LKR 000 LKR 000 LKR 000 LKR 000
Bank
Balance as at 01.01.2017 4,715,814 2,004,275 14,549,487 13,779,839 10,800,251 45,849,666
Profit for the period - - - - 1,267,160 1,267,160
Other comprehensive expense net of tax - - (1,703,834) - - (1,703,834)
Total comprehensive income/ ( expense) for the period - - (1,703,834) - 1,267,160 (436,674)
Transactions with equity holders, recognised directly in equity
Final dividend approved on 24.02.2016 - - - - (1,192,940) (1,192,940)
Total contributions from and distribution to equity holders - - - - (1,192,940) (1,192,940)
Balance as at 31.03.2017 4,715,814 2,004,275 12,845,653 13,779,839 10,874,471 44,220,052
Balance as at 01.01.2018 4,715,814 2,224,275 13,298,686 13,779,839 13,858,152 47,876,766
Profit for the period 1,073,628 1,073,628
Other comprehensive ( expenses) / income net of tax (145,033) - (145,033)
Total comprehensive income / ( expense) for the period (145,033) 1,073,628 928,595
Transactions with equity holders, recognised directly in equity
Final dividend approved on 20.02.2017 (1,325,489) (1,325,489)
Total contributions from and distribution to equity holders (1,325,489) (1,325,489)
Balance as at 31.03.2018 4,715,814 2,224,275 13,153,653 13,779,839 13,606,291 47,479,872
Statutory reserves Other reserves
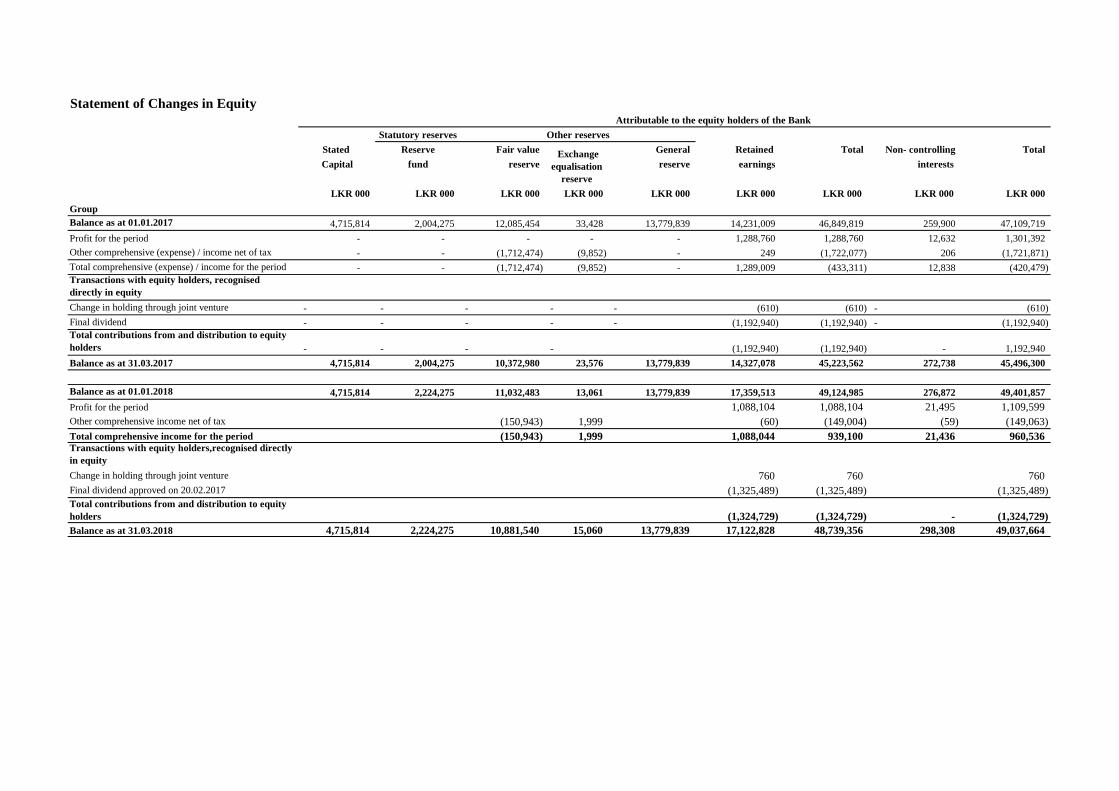
Statement of Changes in Equity
Stated Reserve Fair value General Retained Total Non- controlling Total
Capital fund reserve reserve earnings interests
LKR 000 LKR 000 LKR 000 LKR 000 LKR 000 LKR 000 LKR 000 LKR 000 LKR 000
Group
Balance as at 01.01.2017 4,715,814 2,004,275 12,085,454 33,428 13,779,839 14,231,009 46,849,819 259,900 47,109,719
Profit for the period - - - - - 1,288,760 1,288,760 12,632 1,301,392
Other comprehensive (expense) / income net of tax - - (1,712,474) (9,852) - 249 (1,722,077) 206 (1,721,871)
Total comprehensive (expense) / income for the period - - (1,712,474) (9,852) - 1,289,009 (433,311) 12,838 (420,479)
Transactions with equity holders, recognised
directly in equity
Change in holding through joint venture - - - - - (610) (610) - (610)
Final dividend - - - - - (1,192,940) (1,192,940) - (1,192,940)
Total contributions from and distribution to equity
holders - - - - (1,192,940) (1,192,940) - 1,192,940
Balance as at 31.03.2017 4,715,814 2,004,275 10,372,980 23,576 13,779,839 14,327,078 45,223,562 272,738 45,496,300
Balance as at 01.01.2018 4,715,814 2,224,275 11,032,483 13,061 13,779,839 17,359,513 49,124,985 276,872 49,401,857
Profit for the period 1,088,104 1,088,104 21,495 1,109,599
Other comprehensive income net of tax (150,943) 1,999 (60) (149,004) (59) (149,063)
Total comprehensive income for the period (150,943) 1,999 1,088,044 939,100 21,436 960,536 Transactions with equity holders,recognised directly
in equity
Change in holding through joint venture 760 760 760
Final dividend approved on 20.02.2017 (1,325,489) (1,325,489) (1,325,489)
Total contributions from and distribution to equity
holders (1,324,729) (1,324,729) - (1,324,729)
Balance as at 31.03.2018 4,715,814 2,224,275 10,881,540 15,060 13,779,839 17,122,828 48,739,356 298,308 49,037,664
Attributable to the equity holders of the Bank
Statutory reserves Other reserves
Exchange
equalisation
reserve
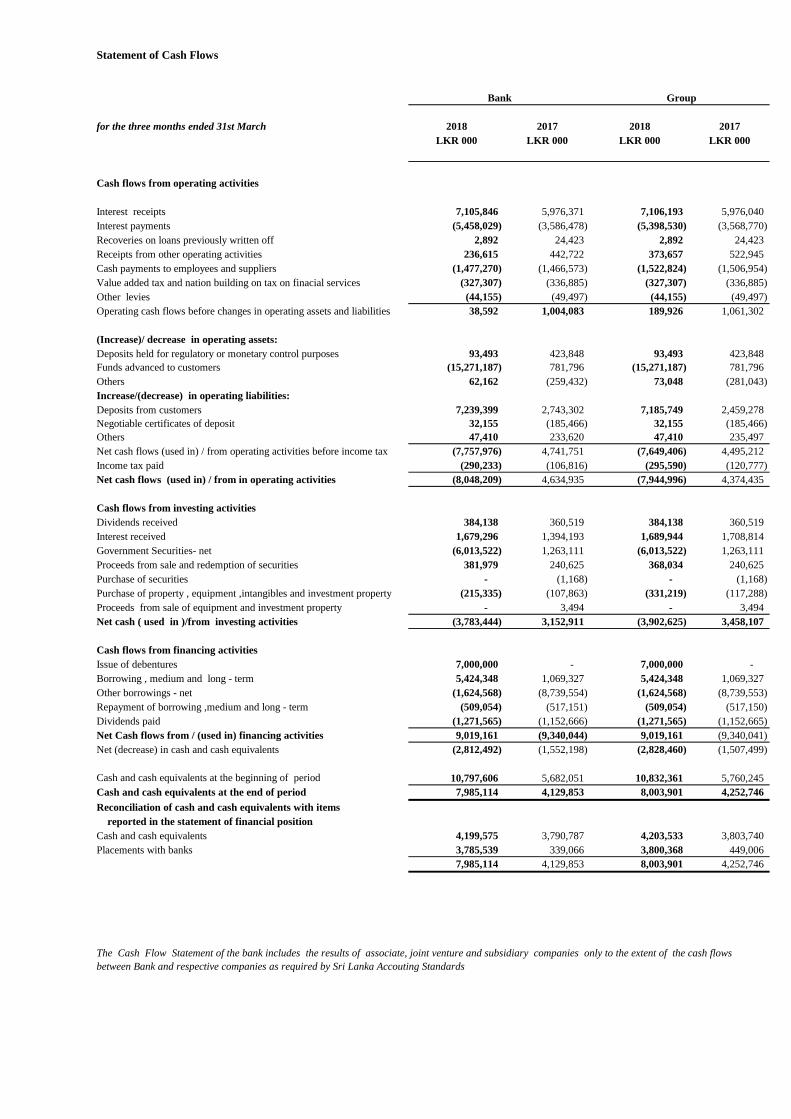
Statement of Cash Flows
for the three months ended 31st March 2018 2017 2018 2017
LKR 000 LKR 000 LKR 000 LKR 000
Cash flows from operating activities
Interest receipts 7,105,846 5,976,371 7,106,193 5,976,040
Interest payments (5,458,029) (3,586,478) (5,398,530) (3,568,770)
Recoveries on loans previously written off 2,892 24,423 2,892 24,423
Receipts from other operating activities 236,615 442,722 373,657 522,945
Cash payments to employees and suppliers (1,477,270) (1,466,573) (1,522,824) (1,506,954)
Value added tax and nation building on tax on finacial services (327,307) (336,885) (327,307) (336,885)
Other levies (44,155) (49,497) (44,155) (49,497)
Operating cash flows before changes in operating assets and liabilities 38,592 1,004,083 189,926 1,061,302
(Increase)/ decrease in operating assets:
Deposits held for regulatory or monetary control purposes 93,493 423,848 93,493 423,848
Funds advanced to customers (15,271,187) 781,796 (15,271,187) 781,796
Others 62,162 (259,432) 73,048 (281,043)
Increase/(decrease) in operating liabilities:
Deposits from customers 7,239,399 2,743,302 7,185,749 2,459,278
Negotiable certificates of deposit 32,155 (185,466) 32,155 (185,466)
Others 47,410 233,620 47,410 235,497
Net cash flows (used in) / from operating activities before income tax (7,757,976) 4,741,751 (7,649,406) 4,495,212
Income tax paid (290,233) (106,816) (295,590) (120,777)
Net cash flows (used in) / from in operating activities (8,048,209) 4,634,935 (7,944,996) 4,374,435
Cash flows from investing activities
Dividends received 384,138 360,519 384,138 360,519
Interest received 1,679,296 1,394,193 1,689,944 1,708,814
Government Securities- net (6,013,522) 1,263,111 (6,013,522) 1,263,111
Proceeds from sale and redemption of securities 381,979 240,625 368,034 240,625
Purchase of securities - (1,168) - (1,168)
Purchase of property , equipment ,intangibles and investment property (215,335) (107,863) (331,219) (117,288)
Proceeds from sale of equipment and investment property - 3,494 - 3,494
Net cash ( used in )/from investing activities (3,783,444) 3,152,911 (3,902,625) 3,458,107
Cash flows from financing activities
Issue of debentures 7,000,000 - 7,000,000 -
Borrowing , medium and long - term 5,424,348 1,069,327 5,424,348 1,069,327
Other borrowings - net (1,624,568) (8,739,554) (1,624,568) (8,739,553)
Repayment of borrowing ,medium and long - term (509,054) (517,151) (509,054) (517,150)
Dividends paid (1,271,565) (1,152,666) (1,271,565) (1,152,665)
Net Cash flows from / (used in) financing activities 9,019,161 (9,340,044) 9,019,161 (9,340,041)
Net (decrease) in cash and cash equivalents (2,812,492) (1,552,198) (2,828,460) (1,507,499)
Cash and cash equivalents at the beginning of period 10,797,606 5,682,051 10,832,361 5,760,245
Cash and cash equivalents at the end of period 7,985,114 4,129,853 8,003,901 4,252,746
Reconciliation of cash and cash equivalents with items
reported in the statement of financial position
Cash and cash equivalents 4,199,575 3,790,787 4,203,533 3,803,740
Placements with banks 3,785,539 339,066 3,800,368 449,006
7,985,114 4,129,853 8,003,901 4,252,746
Bank Group
The Cash Flow Statement of the bank includes the results of associate, joint venture and subsidiary companies only to the extent of the cash flows
between Bank and respective companies as required by Sri Lanka Accouting Standards
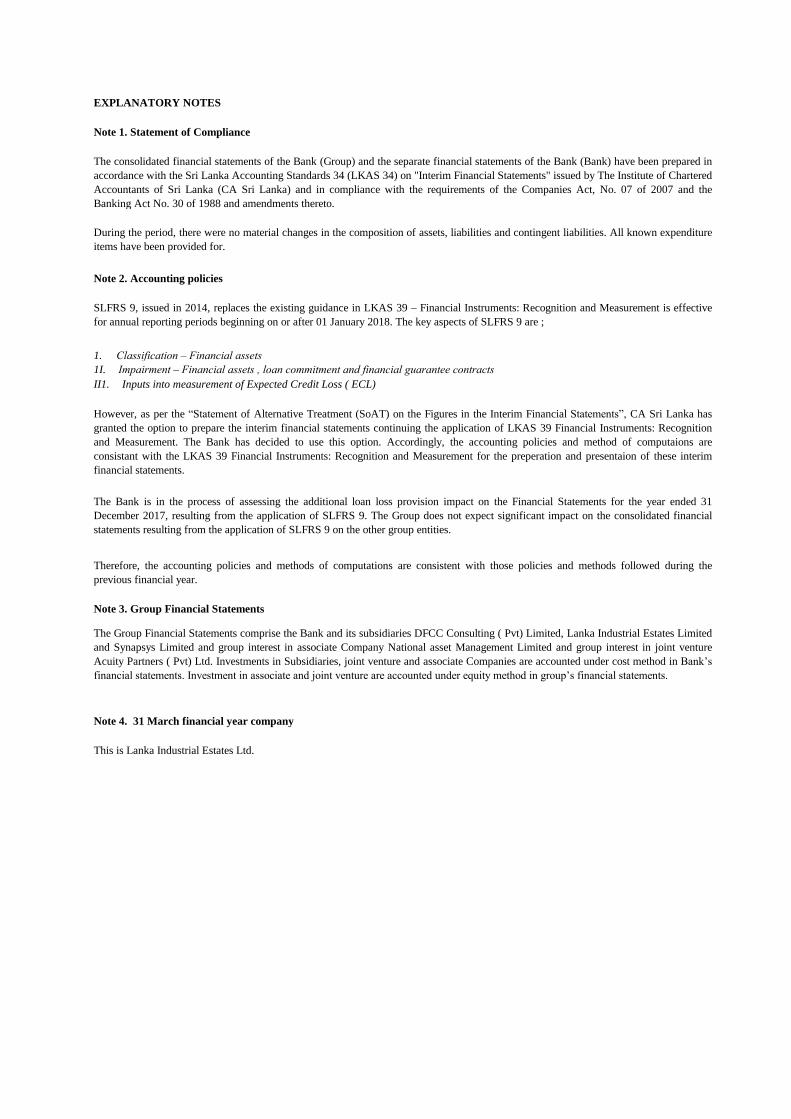
EXPLANATORY NOTES
Note 1. Statement of Compliance
Note 2. Accounting policies
1. Classification – Financial assets
Note 3. Group Financial Statements
Note 4. 31 March financial year company
The consolidated financial statements of the Bank (Group) and the separate financial statements of the Bank (Bank) have been prepared in
accordance with the Sri Lanka Accounting Standards 34 (LKAS 34) on "Interim Financial Statements" issued by The Institute of Chartered
Accountants of Sri Lanka (CA Sri Lanka) and in compliance with the requirements of the Companies Act, No. 07 of 2007 and the
Banking Act No. 30 of 1988 and amendments thereto.
During the period, there were no material changes in the composition of assets, liabilities and contingent liabilities. All known expenditure
items have been provided for.
Therefore, the accounting policies and methods of computations are consistent with those policies and methods followed during the
previous financial year.
The Group Financial Statements comprise the Bank and its subsidiaries DFCC Consulting ( Pvt) Limited, Lanka Industrial Estates Limited
and Synapsys Limited and group interest in associate Company National asset Management Limited and group interest in joint venture
Acuity Partners ( Pvt) Ltd. Investments in Subsidiaries, joint venture and associate Companies are accounted under cost method in Bank’s
financial statements. Investment in associate and joint venture are accounted under equity method in group’s financial statements.
This is Lanka Industrial Estates Ltd.
1I. Impairment – Financial assets , loan commitment and financial guarantee contracts
However, as per the “Statement of Alternative Treatment (SoAT) on the Figures in the Interim Financial Statements”, CA Sri Lanka has
granted the option to prepare the interim financial statements continuing the application of LKAS 39 Financial Instruments: Recognition
and Measurement. The Bank has decided to use this option. Accordingly, the accounting policies and method of computaions are
consistant with the LKAS 39 Financial Instruments: Recognition and Measurement for the preperation and presentaion of these interim
financial statements.
SLFRS 9, issued in 2014, replaces the existing guidance in LKAS 39 – Financial Instruments: Recognition and Measurement is effective
for annual reporting periods beginning on or after 01 January 2018. The key aspects of SLFRS 9 are ;
The Bank is in the process of assessing the additional loan loss provision impact on the Financial Statements for the year ended 31
December 2017, resulting from the application of SLFRS 9. The Group does not expect significant impact on the consolidated financial
statements resulting from the application of SLFRS 9 on the other group entities.
II1. Inputs into measurement of Expected Credit Loss ( ECL)
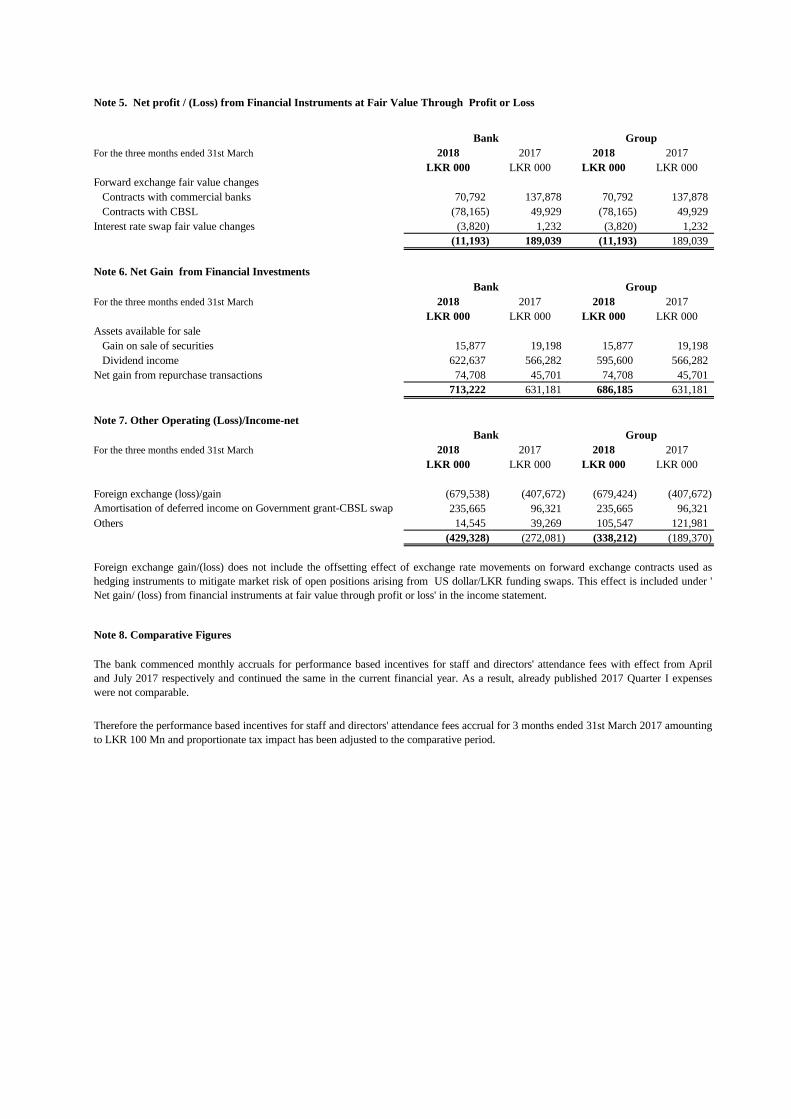
Note 5. Net profit / (Loss) from Financial Instruments at Fair Value Through Profit or Loss
For the three months ended 31st March 2018 2017 2018 2017
LKR 000 LKR 000 LKR 000 LKR 000
Forward exchange fair value changes
Contracts with commercial banks 70,792 137,878 70,792 137,878
Contracts with CBSL (78,165) 49,929 (78,165) 49,929
Interest rate swap fair value changes (3,820) 1,232 (3,820) 1,232
(11,193) 189,039 (11,193) 189,039
Note 6. Net Gain from Financial Investments
For the three months ended 31st March 2018 2017 2018 2017
LKR 000 LKR 000 LKR 000 LKR 000
Assets available for sale
Gain on sale of securities 15,877 19,198 15,877 19,198
Dividend income 622,637 566,282 595,600 566,282
Net gain from repurchase transactions 74,708 45,701 74,708 45,701
713,222 631,181 686,185 631,181
Note 7. Other Operating (Loss)/Income-net
For the three months ended 31st March 2018 2017 2018 2017
LKR 000 LKR 000 LKR 000 LKR 000
Foreign exchange (loss)/gain (679,538) (407,672) (679,424) (407,672)
Amortisation of deferred income on Government grant-CBSL swap 235,665 96,321 235,665 96,321
Others 14,545 39,269 105,547 121,981
(429,328) (272,081) (338,212) (189,370)
Note 8. Comparative Figures
Bank Group
Bank Group
Bank Group
Foreign exchange gain/(loss) does not include the offsetting effect of exchange rate movements on forward exchange contracts used as
hedging instruments to mitigate market risk of open positions arising from US dollar/LKR funding swaps. This effect is included under '
Net gain/ (loss) from financial instruments at fair value through profit or loss' in the income statement.
The bank commenced monthly accruals for performance based incentives for staff and directors' attendance fees with effect from April
and July 2017 respectively and continued the same in the current financial year. As a result, already published 2017 Quarter I expenses
were not comparable.
Therefore the performance based incentives for staff and directors' attendance fees accrual for 3 months ended 31st March 2017 amounting
to LKR 100 Mn and proportionate tax impact has been adjusted to the comparative period.
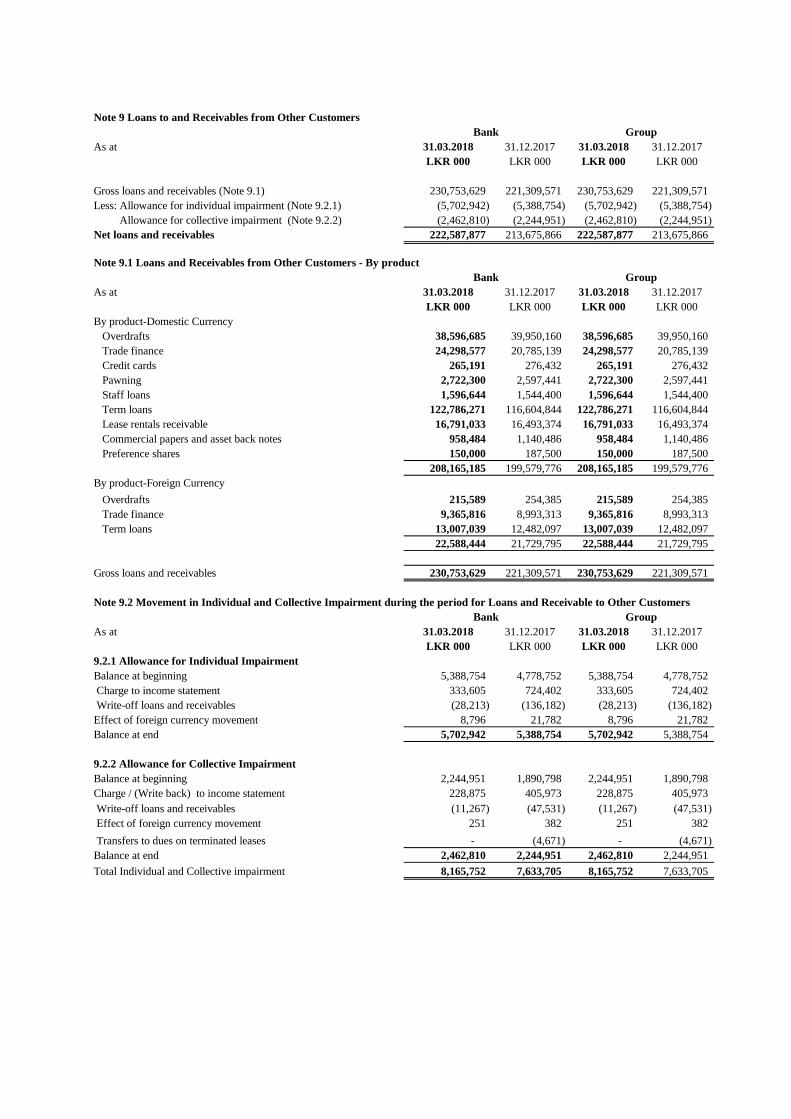
Note 9 Loans to and Receivables from Other Customers
As at 31.03.2018 31.12.2017 31.03.2018 31.12.2017
LKR 000 LKR 000 LKR 000 LKR 000
Gross loans and receivables (Note 9.1) 230,753,629 221,309,571 230,753,629 221,309,571
Less: Allowance for individual impairment (Note 9.2.1) (5,702,942) (5,388,754) (5,702,942) (5,388,754)
Allowance for collective impairment (Note 9.2.2) (2,462,810) (2,244,951) (2,462,810) (2,244,951)
Net loans and receivables 222,587,877 213,675,866 222,587,877 213,675,866
Note 9.1 Loans and Receivables from Other Customers - By product
As at 31.03.2018 31.12.2017 31.03.2018 31.12.2017
LKR 000 LKR 000 LKR 000 LKR 000
By product-Domestic Currency
Overdrafts 38,596,685 39,950,160 38,596,685 39,950,160
Trade finance 24,298,577 20,785,139 24,298,577 20,785,139
Credit cards 265,191 276,432 265,191 276,432
Pawning 2,722,300 2,597,441 2,722,300 2,597,441
Staff loans 1,596,644 1,544,400 1,596,644 1,544,400
Term loans 122,786,271 116,604,844 122,786,271 116,604,844
Lease rentals receivable 16,791,033 16,493,374 16,791,033 16,493,374
Commercial papers and asset back notes 958,484 1,140,486 958,484 1,140,486
Preference shares 150,000 187,500 150,000 187,500
208,165,185 199,579,776 208,165,185 199,579,776
By product-Foreign Currency
Overdrafts 215,589 254,385 215,589 254,385
Trade finance 9,365,816 8,993,313 9,365,816 8,993,313
Term loans 13,007,039 12,482,097 13,007,039 12,482,097
22,588,444 21,729,795 22,588,444 21,729,795
Gross loans and receivables 230,753,629 221,309,571 230,753,629 221,309,571
As at 31.03.2018 31.12.2017 31.03.2018 31.12.2017
LKR 000 LKR 000 LKR 000 LKR 000
9.2.1 Allowance for Individual Impairment
Balance at beginning 5,388,754 4,778,752 5,388,754 4,778,752
Charge to income statement 333,605 724,402 333,605 724,402
Write-off loans and receivables (28,213) (136,182) (28,213) (136,182)
Effect of foreign currency movement 8,796 21,782 8,796 21,782
Balance at end 5,702,942 5,388,754 5,702,942 5,388,754
9.2.2 Allowance for Collective Impairment
Balance at beginning 2,244,951 1,890,798 2,244,951 1,890,798
Charge / (Write back) to income statement 228,875 405,973 228,875 405,973
Write-off loans and receivables (11,267) (47,531) (11,267) (47,531)
Effect of foreign currency movement 251 382 251 382
Transfers to dues on terminated leases - (4,671) - (4,671)
Balance at end 2,462,810 2,244,951 2,462,810 2,244,951
Total Individual and Collective impairment 8,165,752 7,633,705 8,165,752 7,633,705
Bank Group
Bank Group
Note 9.2 Movement in Individual and Collective Impairment during the period for Loans and Receivable to Other Customers
Bank Group
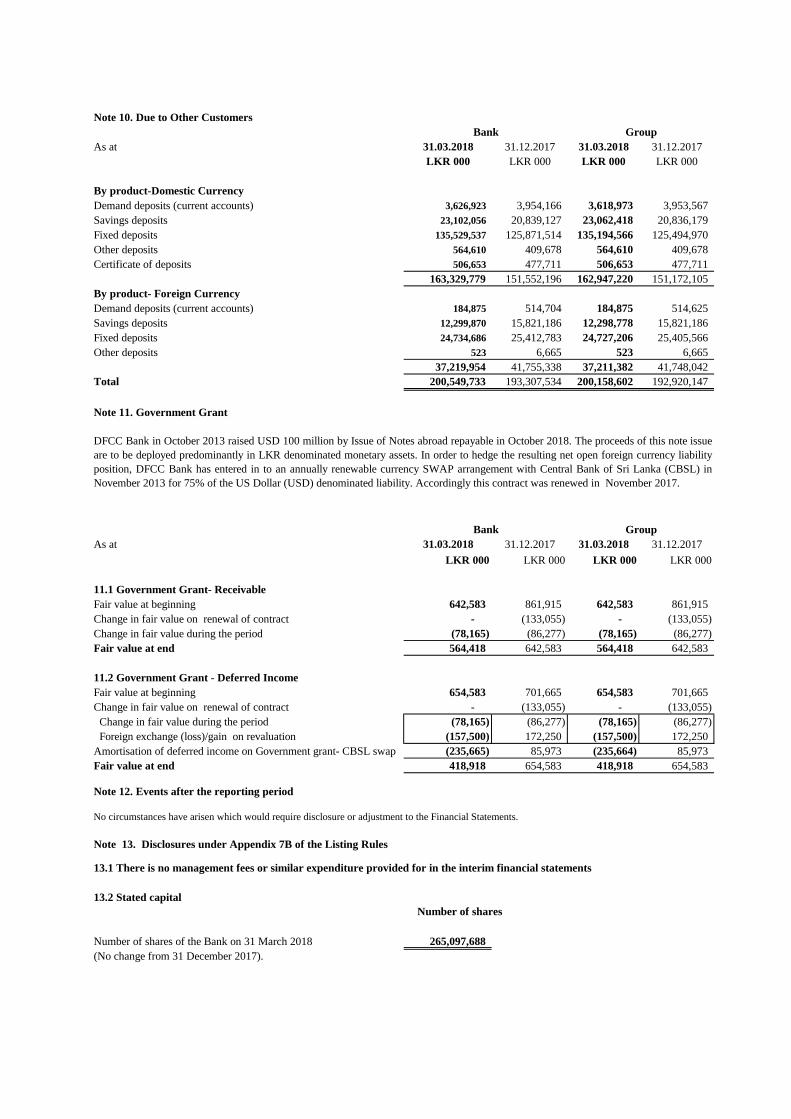
Note 10. Due to Other Customers
As at 31.03.2018 31.12.2017 31.03.2018 31.12.2017
LKR 000 LKR 000 LKR 000 LKR 000
By product-Domestic Currency
Demand deposits (current accounts) 3,626,923 3,954,166 3,618,973 3,953,567
Savings deposits 23,102,056 20,839,127 23,062,418 20,836,179
Fixed deposits 135,529,537 125,871,514 135,194,566 125,494,970
Other deposits 564,610 409,678 564,610 409,678
Certificate of deposits 506,653 477,711 506,653 477,711
163,329,779 151,552,196 162,947,220 151,172,105
By product- Foreign Currency
Demand deposits (current accounts) 184,875 514,704 184,875 514,625
Savings deposits 12,299,870 15,821,186 12,298,778 15,821,186
Fixed deposits 24,734,686 25,412,783 24,727,206 25,405,566
Other deposits 523 6,665 523 6,665
37,219,954 41,755,338 37,211,382 41,748,042
Total 200,549,733 193,307,534 200,158,602 192,920,147
Note 11. Government Grant
As at 31.03.2018 31.12.2017 31.03.2018 31.12.2017
LKR 000 LKR 000 LKR 000 LKR 000
11.1 Government Grant- Receivable
Fair value at beginning 642,583 861,915 642,583 861,915
Change in fair value on renewal of contract - (133,055) - (133,055)
Change in fair value during the period (78,165) (86,277) (78,165) (86,277)
Fair value at end 564,418 642,583 564,418 642,583
11.2 Government Grant - Deferred Income
Fair value at beginning 654,583 701,665 654,583 701,665
Change in fair value on renewal of contract - (133,055) - (133,055)
Change in fair value during the period (78,165) (86,277) (78,165) (86,277)
Foreign exchange (loss)/gain on revaluation (157,500) 172,250 (157,500) 172,250
Amortisation of deferred income on Government grant- CBSL swap (235,665) 85,973 (235,664) 85,973
Fair value at end 418,918 654,583 418,918 654,583
Note 12. Events after the reporting period
No circumstances have arisen which would require disclosure or adjustment to the Financial Statements.
Note 13. Disclosures under Appendix 7B of the Listing Rules
13.1 There is no management fees or similar expenditure provided for in the interim financial statements
13.2 Stated capital
Number of shares
Number of shares of the Bank on 31 March 2018 265,097,688
(No change from 31 December 2017).
DFCC Bank in October 2013 raised USD 100 million by Issue of Notes abroad repayable in October 2018. The proceeds of this note issue
are to be deployed predominantly in LKR denominated monetary assets. In order to hedge the resulting net open foreign currency liability
position, DFCC Bank has entered in to an annually renewable currency SWAP arrangement with Central Bank of Sri Lanka (CBSL) in
November 2013 for 75% of the US Dollar (USD) denominated liability. Accordingly this contract was renewed in November 2017.
Bank Group
Bank Group
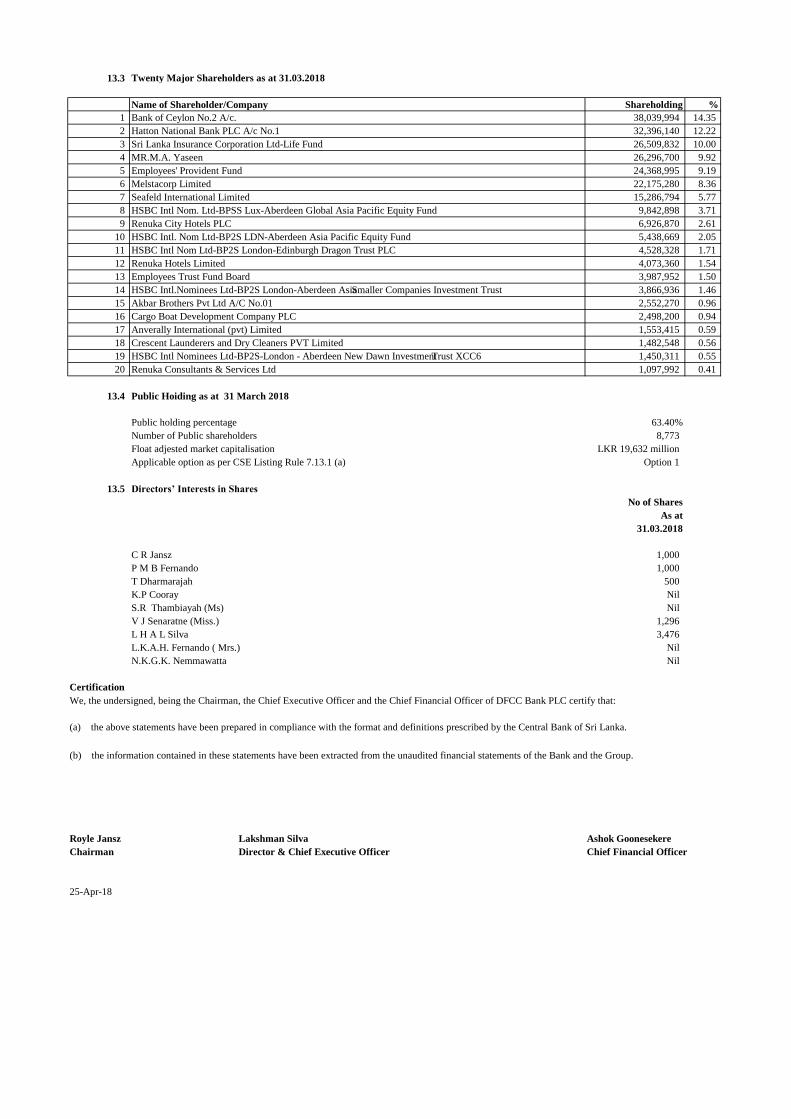
13.3 Twenty Major Shareholders as at 31.03.2018
Name of Shareholder/Company Shareholding %
1 Bank of Ceylon No.2 A/c. 38,039,994 14.35
2 Hatton National Bank PLC A/c No.1 32,396,140 12.22
3 Sri Lanka Insurance Corporation Ltd-Life Fund 26,509,832 10.00
4 MR.M.A. Yaseen 26,296,700 9.92
5 Employees' Provident Fund 24,368,995 9.19
6 Melstacorp Limited 22,175,280 8.36
7 Seafeld International Limited 15,286,794 5.77
8 HSBC Intl Nom. Ltd-BPSS Lux-Aberdeen Global Asia Pacific Equity Fund 9,842,898 3.71
9 Renuka City Hotels PLC 6,926,870 2.61
10 HSBC Intl. Nom Ltd-BP2S LDN-Aberdeen Asia Pacific Equity Fund 5,438,669 2.05
11 HSBC Intl Nom Ltd-BP2S London-Edinburgh Dragon Trust PLC 4,528,328 1.71
12 Renuka Hotels Limited 4,073,360 1.54
13 Employees Trust Fund Board 3,987,952 1.50
14 HSBC Intl.Nominees Ltd-BP2S London-Aberdeen Asia Smaller Companies Investment Trust 3,866,936 1.46
15 Akbar Brothers Pvt Ltd A/C No.01 2,552,270 0.96
16 Cargo Boat Development Company PLC 2,498,200 0.94
17 Anverally International (pvt) Limited 1,553,415 0.59
18 Crescent Launderers and Dry Cleaners PVT Limited 1,482,548 0.56
19 HSBC Intl Nominees Ltd-BP2S-London - Aberdeen New Dawn Investment Trust XCC6 1,450,311 0.55
20 Renuka Consultants & Services Ltd 1,097,992 0.41
13.4 Public Hoiding as at 31 March 2018
Public holding percentage 63.40%
Number of Public shareholders 8,773
Float adjested market capitalisation LKR 19,632 million
Applicable option as per CSE Listing Rule 7.13.1 (a) Option 1
13.5 Directors’ Interests in Shares
No of Shares
As at
31.03.2018
C R Jansz 1,000
P M B Fernando 1,000
T Dharmarajah 500
K.P Cooray Nil
S.R Thambiayah (Ms) Nil
V J Senaratne (Miss.) 1,296
L H A L Silva 3,476
L.K.A.H. Fernando ( Mrs.) Nil
N.K.G.K. Nemmawatta Nil
Certification
Royle Jansz Lakshman Silva Ashok Goonesekere
Chairman Director & Chief Executive Officer Chief Financial Officer
25-Apr-18
We, the undersigned, being the Chairman, the Chief Executive Officer and the Chief Financial Officer of DFCC Bank PLC certify that:
(a) the above statements have been prepared in compliance with the format and definitions prescribed by the Central Bank of Sri Lanka.
(b) the information contained in these statements have been extracted from the unaudited financial statements of the Bank and the Group.
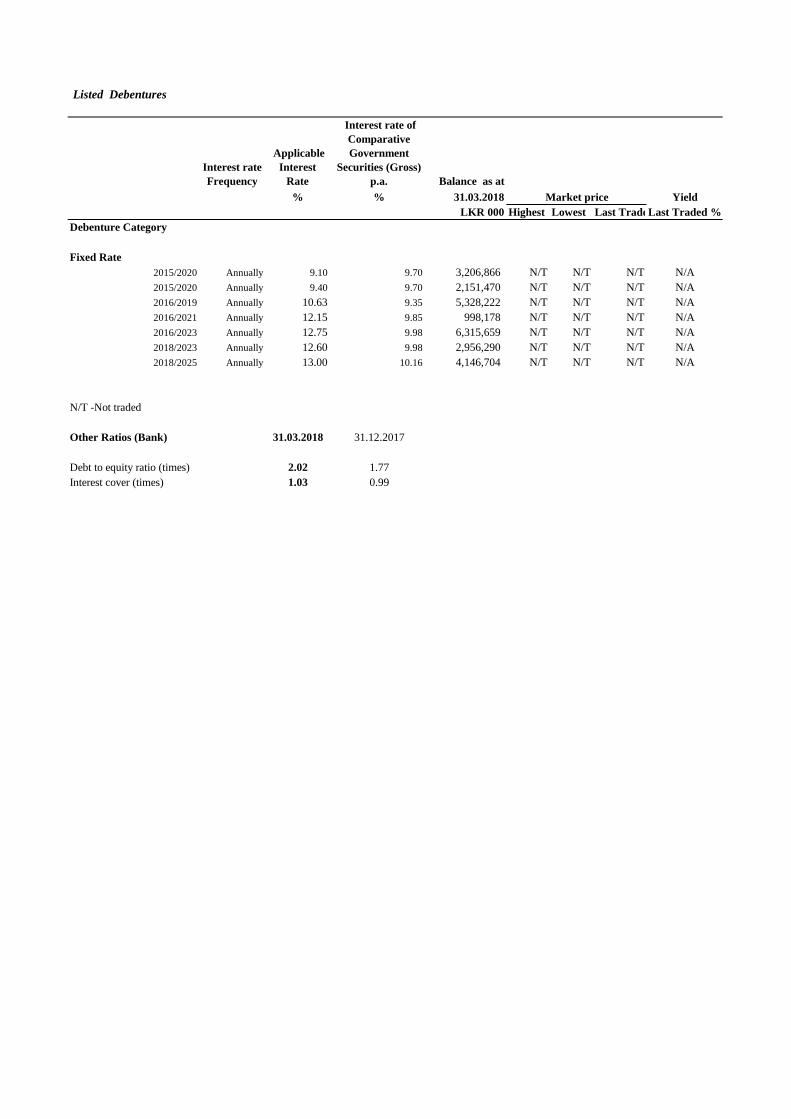
Listed Debentures
Interest rate
Frequency
Applicable
Interest
Rate
Interest rate of
Comparative
Government
Securities (Gross)
p.a. Balance as at
% % 31.03.2018 Yield
LKR 000 Highest Lowest Last TradedLast Traded %
Debenture Category
Fixed Rate
2015/2020 Annually 9.10 9.70 3,206,866 N/T N/T N/T N/A
2015/2020 Annually 9.40 9.70 2,151,470 N/T N/T N/T N/A
2016/2019 Annually 10.63 9.35 5,328,222 N/T N/T N/T N/A
2016/2021 Annually 12.15 9.85 998,178 N/T N/T N/T N/A
2016/2023 Annually 12.75 9.98 6,315,659 N/T N/T N/T N/A
2018/2023 Annually 12.60 9.98 2,956,290 N/T N/T N/T N/A
2018/2025 Annually 13.00 10.16 4,146,704 N/T N/T N/T N/A
N/T -Not traded
Other Ratios (Bank) 31.03.2018 31.12.2017
Debt to equity ratio (times) 2.02 1.77
Interest cover (times) 1.03 0.99
Market price
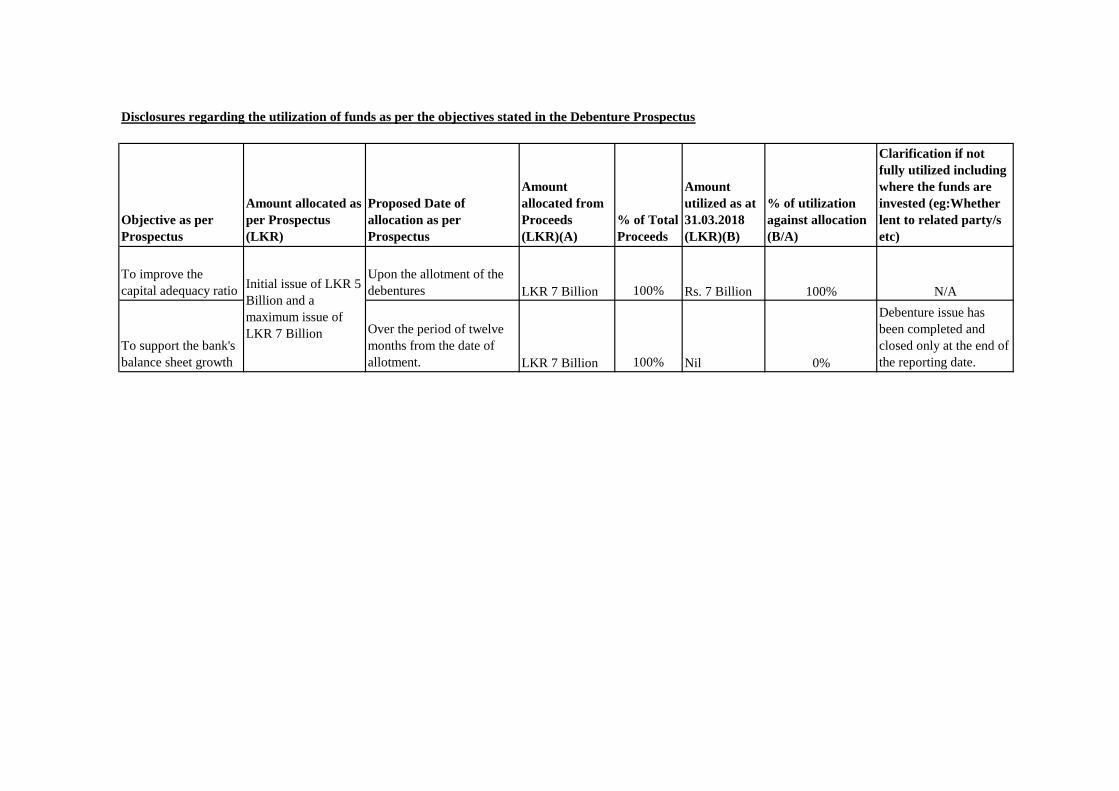
Disclosures regarding the utilization of funds as per the objectives stated in the Debenture Prospectus
Objective as per
Prospectus
Amount allocated as
per Prospectus
(LKR)
Proposed Date of
allocation as per
Prospectus
Amount
allocated from
Proceeds
(LKR)(A)
% of Total
Proceeds
Amount
utilized as at
31.03.2018
(LKR)(B)
% of utilization
against allocation
(B/A)
Clarification if not
fully utilized including
where the funds are
invested (eg:Whether
lent to related party/s
etc)
To improve the
capital adequacy ratio
Upon the allotment of the
debentures LKR 7 Billion 100% Rs. 7 Billion 100% N/A
To support the bank's
balance sheet growth
Over the period of twelve
months from the date of
allotment. LKR 7 Billion 100% Nil 0%
Debenture issue has
been completed and
closed only at the end of
the reporting date.
Initial issue of LKR 5
Billion and a
maximum issue of
LKR 7 Billion
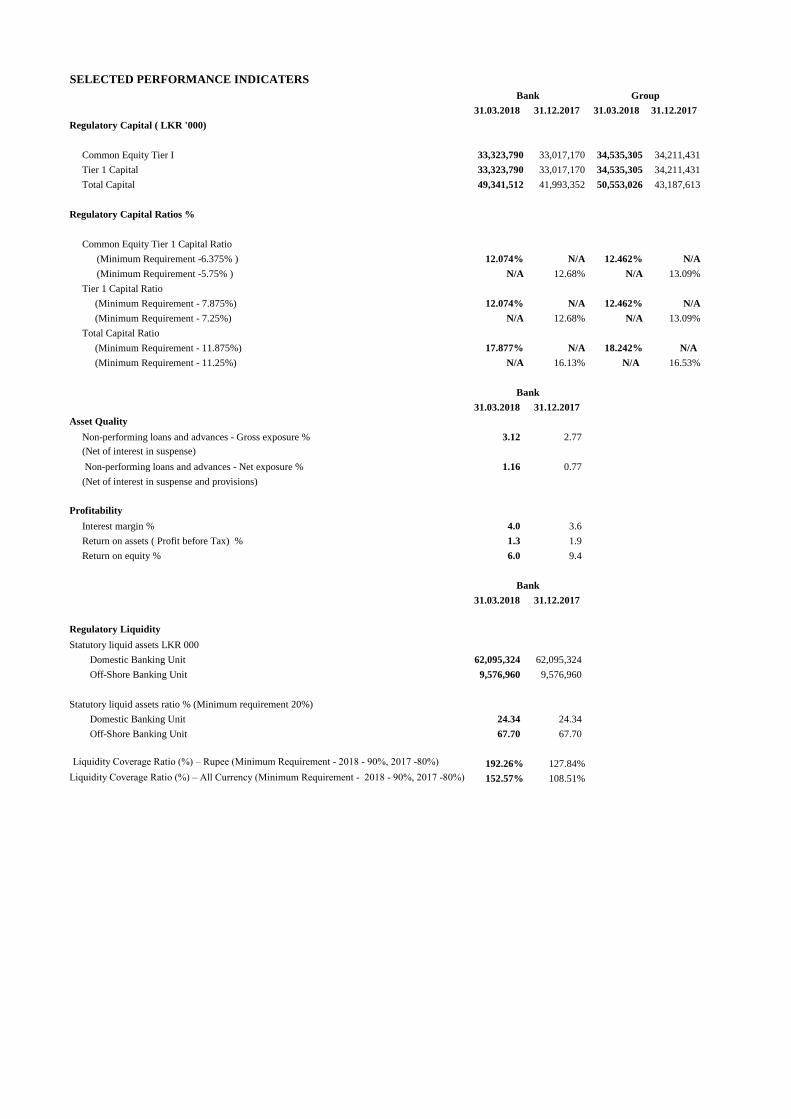
SELECTED PERFORMANCE INDICATERS
31.03.2018 31.12.2017 31.03.2018 31.12.2017
Regulatory Capital ( LKR '000)
Common Equity Tier I 33,323,790 33,017,170 34,535,305 34,211,431
Tier 1 Capital 33,323,790 33,017,170 34,535,305 34,211,431
Total Capital 49,341,512 41,993,352 50,553,026 43,187,613
Regulatory Capital Ratios %
Common Equity Tier 1 Capital Ratio
(Minimum Requirement -6.375% ) 12.074% N/A 12.462% N/A
(Minimum Requirement -5.75% ) N/A 12.68% N/A 13.09%
Tier 1 Capital Ratio
(Minimum Requirement - 7.875%) 12.074% N/A 12.462% N/A
(Minimum Requirement - 7.25%) N/A 12.68% N/A 13.09%
Total Capital Ratio
(Minimum Requirement - 11.875%) 17.877% N/A 18.242% N/A
(Minimum Requirement - 11.25%) N/A 16.13% N/A 16.53%
31.03.2018 31.12.2017
Asset Quality
Non-performing loans and advances - Gross exposure % 3.12 2.77
(Net of interest in suspense)
Non-performing loans and advances - Net exposure % 1.16 0.77
(Net of interest in suspense and provisions)
Profitability
Interest margin % 4.0 3.6
Return on assets ( Profit before Tax) % 1.3 1.9
Return on equity % 6.0 9.4
31.03.2018 31.12.2017
Regulatory Liquidity
Statutory liquid assets LKR 000
Domestic Banking Unit 62,095,324 62,095,324
Off-Shore Banking Unit 9,576,960 9,576,960
Statutory liquid assets ratio % (Minimum requirement 20%)
Domestic Banking Unit 24.34 24.34
Off-Shore Banking Unit 67.70 67.70
Liquidity Coverage Ratio (%) – Rupee (Minimum Requirement - 2018 - 90%, 2017 -80%) 192.26% 127.84%
Liquidity Coverage Ratio (%) – All Currency (Minimum Requirement - 2018 - 90%, 2017 -80%) 152.57% 108.51%
Bank Group
Bank
Bank
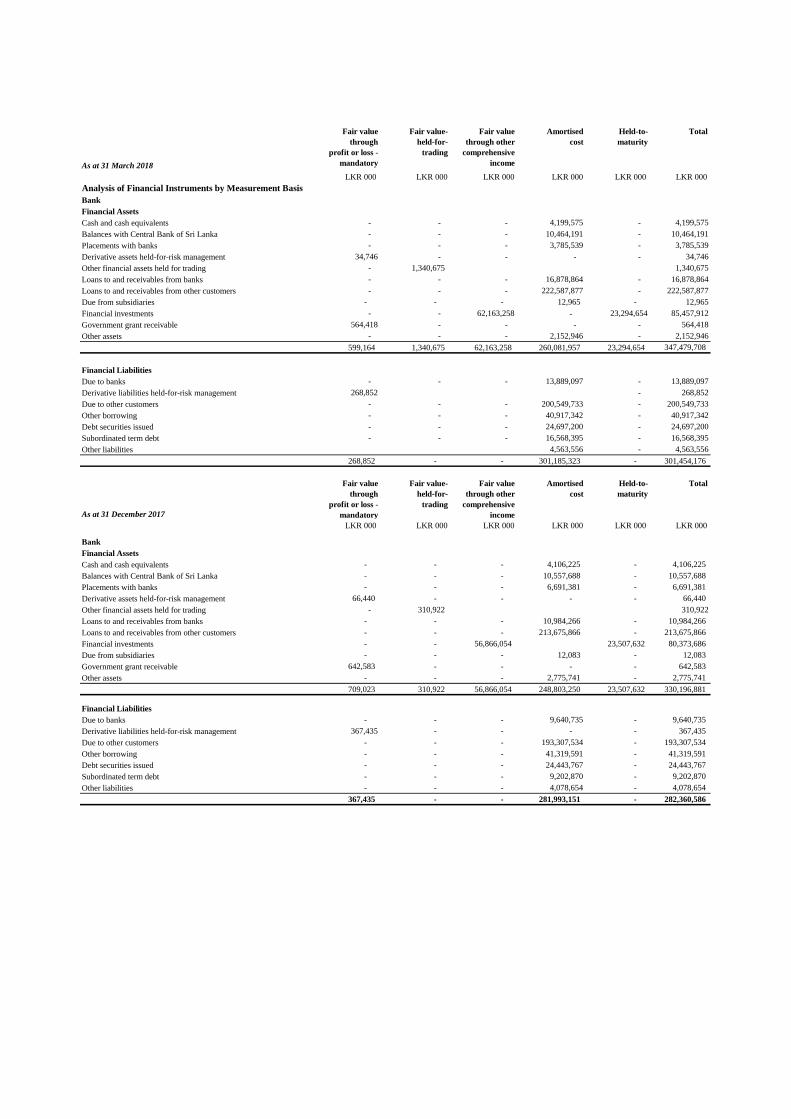
As at 31 March 2018
Fair value
through
profit or loss -
mandatory
Fair value-
held-for-
trading
Fair value
through other
comprehensive
income
Amortised
cost
Held-to-
maturity
Total
LKR 000 LKR 000 LKR 000 LKR 000 LKR 000 LKR 000
Analysis of Financial Instruments by Measurement Basis
Bank
Financial Assets
Cash and cash equivalents - - - 4,199,575 - 4,199,575
Balances with Central Bank of Sri Lanka - - - 10,464,191 - 10,464,191
Placements with banks - - - 3,785,539 - 3,785,539
Derivative assets held-for-risk management 34,746 - - - - 34,746
Other financial assets held for trading - 1,340,675 1,340,675
Loans to and receivables from banks - - - 16,878,864 - 16,878,864
Loans to and receivables from other customers - - - 222,587,877 - 222,587,877
Due from subsidiaries - - - 12,965 - 12,965
Financial investments - - 62,163,258 - 23,294,654 85,457,912
Government grant receivable 564,418 - - - - 564,418
Other assets - - - 2,152,946 - 2,152,946
599,164 1,340,675 62,163,258 260,081,957 23,294,654 347,479,708
Financial Liabilities
Due to banks - - - 13,889,097 - 13,889,097
Derivative liabilities held-for-risk management 268,852 - 268,852
Due to other customers - - - 200,549,733 - 200,549,733
Other borrowing - - - 40,917,342 - 40,917,342
Debt securities issued - - - 24,697,200 - 24,697,200
Subordinated term debt - - - 16,568,395 - 16,568,395
Other liabilities 4,563,556 - 4,563,556
268,852 - - 301,185,323 - 301,454,176
As at 31 December 2017
Fair value
through
profit or loss -
mandatory
Fair value-
held-for-
trading
Fair value
through other
comprehensive
income
Amortised
cost
Held-to-
maturity
Total
LKR 000 LKR 000 LKR 000 LKR 000 LKR 000 LKR 000
Bank
Financial Assets
Cash and cash equivalents - - - 4,106,225 - 4,106,225
Balances with Central Bank of Sri Lanka - - - 10,557,688 - 10,557,688
Placements with banks - - - 6,691,381 - 6,691,381
Derivative assets held-for-risk management 66,440 - - - - 66,440
Other financial assets held for trading - 310,922 310,922
Loans to and receivables from banks - - - 10,984,266 - 10,984,266
Loans to and receivables from other customers - - - 213,675,866 - 213,675,866
Financial investments - - 56,866,054 23,507,632 80,373,686
Due from subsidiaries - - - 12,083 - 12,083
Government grant receivable 642,583 - - - - 642,583
Other assets - - - 2,775,741 - 2,775,741
709,023 310,922 56,866,054 248,803,250 23,507,632 330,196,881
Financial Liabilities
Due to banks - - - 9,640,735 - 9,640,735
Derivative liabilities held-for-risk management 367,435 - - - - 367,435
Due to other customers - - - 193,307,534 - 193,307,534
Other borrowing - - - 41,319,591 - 41,319,591
Debt securities issued - - - 24,443,767 - 24,443,767
Subordinated term debt - - - 9,202,870 - 9,202,870
Other liabilities - - - 4,078,654 - 4,078,654
367,435 - - 281,993,151 - 282,360,586
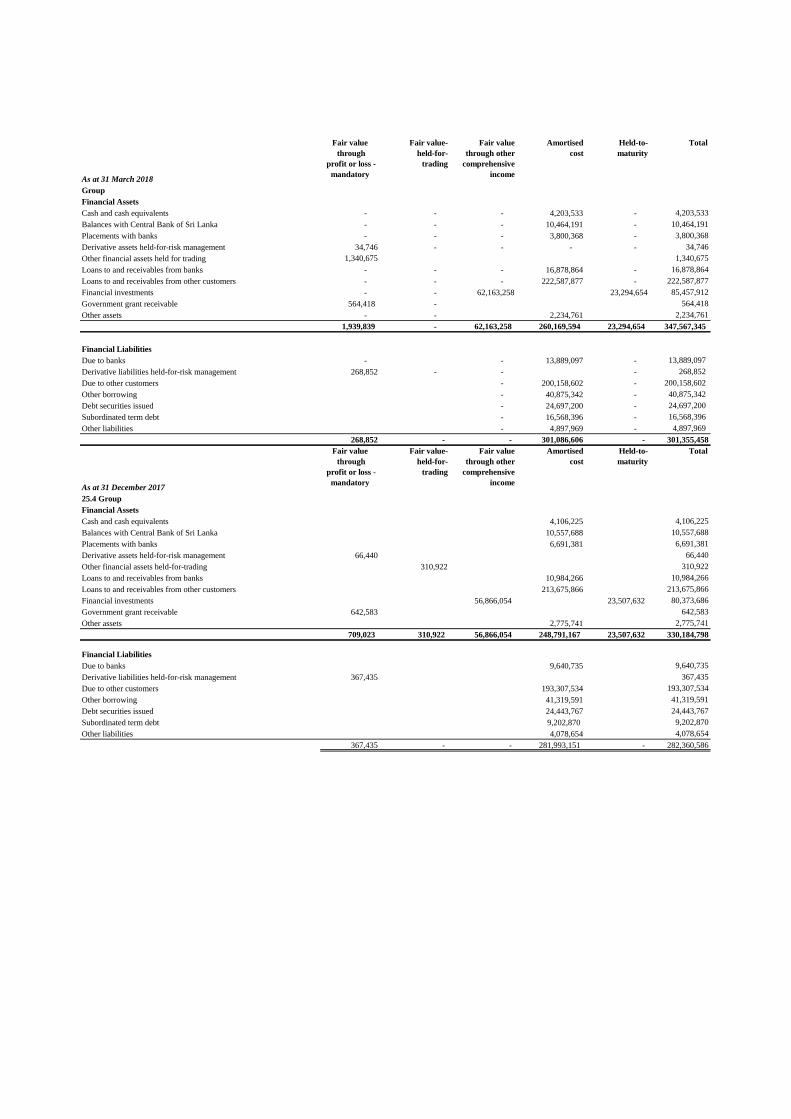
As at 31 March 2018
Fair value
through
profit or loss -
mandatory
Fair value-
held-for-
trading
Fair value
through other
comprehensive
income
Amortised
cost
Held-to-
maturity
Total
Group
Financial Assets
Cash and cash equivalents - - - 4,203,533 - 4,203,533
Balances with Central Bank of Sri Lanka - - - 10,464,191 - 10,464,191
Placements with banks - - - 3,800,368 - 3,800,368
Derivative assets held-for-risk management 34,746 - - - - 34,746
Other financial assets held for trading 1,340,675 1,340,675
Loans to and receivables from banks - - - 16,878,864 - 16,878,864
Loans to and receivables from other customers - - - 222,587,877 - 222,587,877
Financial investments - - 62,163,258 23,294,654 85,457,912
Government grant receivable 564,418 - 564,418
Other assets - - 2,234,761 2,234,761
1,939,839 - 62,163,258 260,169,594 23,294,654 347,567,345
Financial Liabilities
Due to banks - - 13,889,097 - 13,889,097
Derivative liabilities held-for-risk management 268,852 - - - 268,852
Due to other customers - 200,158,602 - 200,158,602
Other borrowing - 40,875,342 - 40,875,342
Debt securities issued - 24,697,200 - 24,697,200
Subordinated term debt - 16,568,396 - 16,568,396
Other liabilities - 4,897,969 - 4,897,969
268,852 - - 301,086,606 - 301,355,458
As at 31 December 2017
Fair value
through
profit or loss -
mandatory
Fair value-
held-for-
trading
Fair value
through other
comprehensive
income
Amortised
cost
Held-to-
maturity
Total
25.4 Group
Financial Assets
Cash and cash equivalents 4,106,225 4,106,225
Balances with Central Bank of Sri Lanka 10,557,688 10,557,688
Placements with banks 6,691,381 6,691,381
Derivative assets held-for-risk management 66,440 66,440
Other financial assets held-for-trading 310,922 310,922
Loans to and receivables from banks 10,984,266 10,984,266
Loans to and receivables from other customers 213,675,866 213,675,866
Financial investments 56,866,054 23,507,632 80,373,686
Government grant receivable 642,583 642,583
Other assets 2,775,741 2,775,741
709,023 310,922 56,866,054 248,791,167 23,507,632 330,184,798
Financial Liabilities
Due to banks 9,640,735 9,640,735
Derivative liabilities held-for-risk management 367,435 367,435
Due to other customers 193,307,534 193,307,534
Other borrowing 41,319,591 41,319,591
Debt securities issued 24,443,767 24,443,767
Subordinated term debt 9,202,870 9,202,870
Other liabilities 4,078,654 4,078,654
367,435 - - 281,993,151 - 282,360,586
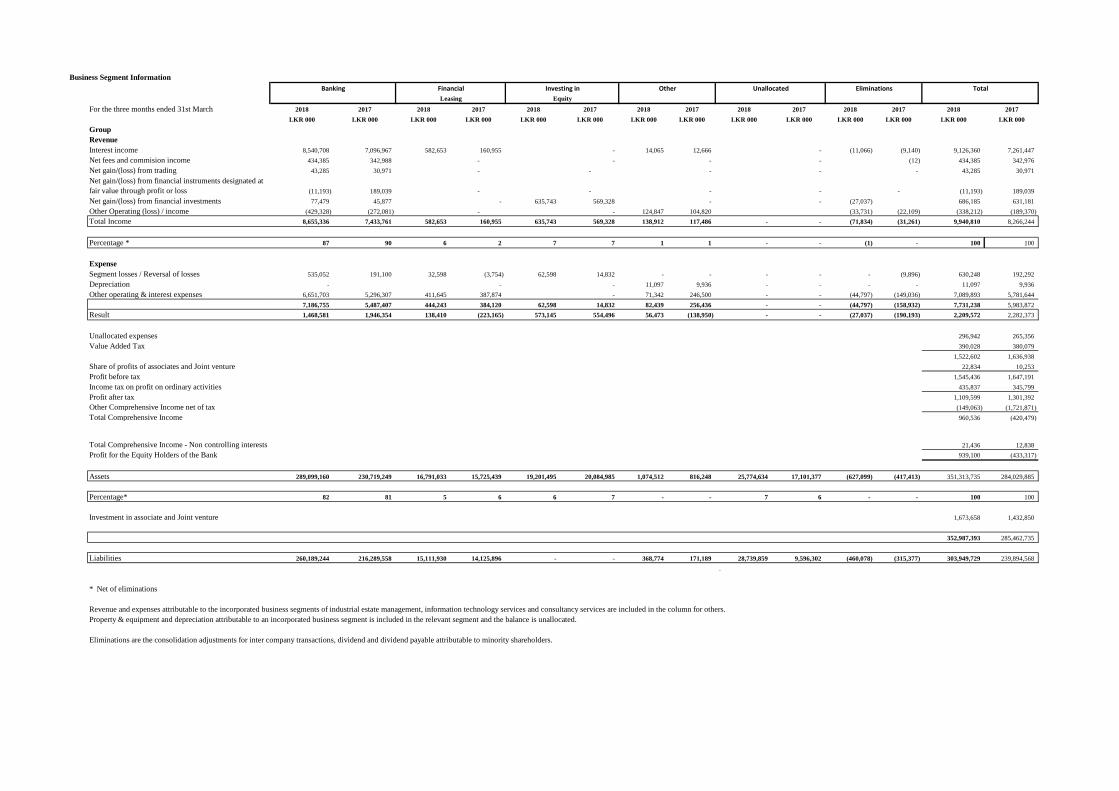
Business Segment Information
For the three months ended 31st March 2018 2017 2018 2017 2018 2017 2018 2017 2018 2017 2018 2017 2018 2017
LKR 000 LKR 000 LKR 000 LKR 000 LKR 000 LKR 000 LKR 000 LKR 000 LKR 000 LKR 000 LKR 000 LKR 000 LKR 000 LKR 000
Group
Revenue
Interest income 8,540,708 7,096,967 582,653 160,955 - 14,065 12,666 - (11,066) (9,140) 9,126,360 7,261,447
Net fees and commision income 434,385 342,988 - - - - (12) 434,385 342,976
Net gain/(loss) from trading 43,285 30,971 - - - - - 43,285 30,971
Net gain/(loss) from financial instruments designated at
fair value through profit or loss (11,193) 189,039 - - - - - (11,193) 189,039
Net gain/(loss) from financial investments 77,479 45,877 - 635,743 569,328 - - (27,037) 686,185 631,181
Other Operating (loss) / income (429,328) (272,081) - - 124,847 104,820 (33,731) (22,109) (338,212) (189,370)
Total Income 8,655,336 7,433,761 582,653 160,955 635,743 569,328 138,912 117,486 - - (71,834) (31,261) 9,940,810 8,266,244
Percentage * 87 90 6 2 7 7 1 1 - - (1) - 100 100
Expense
Segment losses / Reversal of losses 535,052 191,100 32,598 (3,754) 62,598 14,832 - - - - - (9,896) 630,248 192,292
Depreciation - - - 11,097 9,936 - - - - 11,097 9,936
Other operating & interest expenses 6,651,703 5,296,307 411,645 387,874 - 71,342 246,500 - - (44,797) (149,036) 7,089,893 5,781,644
7,186,755 5,487,407 444,243 384,120 62,598 14,832 82,439 256,436 - - (44,797) (158,932) 7,731,238 5,983,872
Result 1,468,581 1,946,354 138,410 (223,165) 573,145 554,496 56,473 (138,950) - - (27,037) (190,193) 2,209,572 2,282,373
Unallocated expenses 296,942 265,356
Value Added Tax 390,028 380,079
1,522,602 1,636,938
Share of profits of associates and Joint venture 22,834 10,253
Profit before tax 1,545,436 1,647,191
Income tax on profit on ordinary activities 435,837 345,799
Profit after tax 1,109,599 1,301,392
Other Comprehensive Income net of tax (149,063) (1,721,871)
Total Comprehensive Income 960,536 (420,479)
Total Comprehensive Income - Non controlling interests 21,436 12,838
Profit for the Equity Holders of the Bank 939,100 (433,317)
Assets 289,099,160 230,719,249 16,791,033 15,725,439 19,201,495 20,084,985 1,074,512 816,248 25,774,634 17,101,377 (627,099) (417,413) 351,313,735 284,029,885
Percentage* 82 81 5 6 6 7 - - 7 6 - - 100 100
Investment in associate and Joint venture 1,673,658 1,432,850
352,987,393 285,462,735
Liabilities 260,189,244 216,289,558 15,111,930 14,125,896 - - 368,774 171,189 28,739,859 9,596,302 (460,078) (315,377) 303,949,729 239,894,568
.
* Net of eliminations
Eliminations are the consolidation adjustments for inter company transactions, dividend and dividend payable attributable to minority shareholders.
Total
Leasing Equity
Revenue and expenses attributable to the incorporated business segments of industrial estate management, information technology services and consultancy services are included in the column for others.
Property & equipment and depreciation attributable to an incorporated business segment is included in the relevant segment and the balance is unallocated.
Banking Financial Investing in Other Unallocated Eliminations