Embed Size (px)
Citation preview
Research Article Open Access
Rábago-Remy et al., Ind Eng Manage 2014, 3:4DOI: 10.4172/2169-0316.1000137
Volume 3 • Issue 4 • 1000137Ind Eng ManageISSN: 2169-0316, IEM an open access journal
Industrial Engineering & ManagementInd
ustri
al En
gineering & Management
ISSN: 2169-0316
Keywords: Control charts; orthogonal array; Process capability analysis; Six sigma; Variability reduction
IntroductionNowadays modern industries must achieve a good control level in
their process to be successful with their workforce. The achievement of this goal is relevant for the business competitiveness as well as the satisfaction of the customer needs that become more demanding every day, and demand a greater quality in the products or required services. It excels the industries to take measures in their workforce, even in the design of their process to adapt to the customer requirements and not taking the risk to be off the market.
One of the tools to improve the quality of a process is the process capability analysis, which consists of quantifying process variability. This tool is used generally in the process variability analysis with respect to the requirements or specifications of the product, helping the developing and manufacturing staff to eliminate or reduce this variability in a great extent [1].
According to the norms for elaborated tomato (Lycopersicum esculentum) concentrate [2] tomato paste is a product made of tomato concentrate that contains 24% or more natural tomato soluble solids. The elaborated tomato concentrate is the product prepared from the concentrate of the pulp taken from red tomatoes conveniently healthy and ripe. This pulp is winnowed with the purpose of eliminating the skin, seeds, and other hard or secondary substances from the finished product. The product obtained after the thermic treatment has a texture in the way of red pasta.
Based on the time and temperature of the process, it is possible to obtain whether ketchup or tomato paste. The most popular culinary use for this type of products is the making of the pizza sauce, and the most common market packaging is in can or vacuum bag. One of the advantages that tomato paste has is that it can stand long periods of conservation, superior to other tomato canned products.
This research was carried out in the can filling area of the tomato paste elaboration process, in a tomato processing factory located in the
city of Culiacan, Mexico. In this company there is a problem of excess filling in the cans, which is reflected in the final product quality and economic losses. The general objective of this research was to make a process capability analysis of the tomato paste filling, having as a purpose the variability reduction of the canned tomato paste filling process.
Materials and MethodsDescription and analysis of the process
The production process of the canned tomato paste is continuous and closed; it starts with the arrival of the raw material to the factory, afterwards an inspection is done by the Quality Control Department to accept it or refuse it. Once it is accepted, it is inspected to know the ripeness percentage that the tomato has. Once the raw material has an adequate ripeness, it is transported through a transporting band where a two-period wash is done. After that it is conducted to the selection tables where a classification is done by hand.
After that process, the raw material is pumped to the poachers where it is ground, and a thermic treatment is given that produces a softening and it facilitates its pealing. Once the skin is removed, the pulp is extracted with mills. The next step is to take the pulp to the
*Corresponding author: Jesús Gabriel Rangel-Peraza, Departamento de Estudios de Posgrado e Investigación, Instituto Tecnológico de Culiacán, Juan de Dios Batiz 310 Pte. Col. Guadalupe. Culiacán Sinaloa, México CP. 80220, Tel: +52 6677133804; E-mail: [email protected]
Received August 20, 2014; Accepted September 15, 2014; Published September 22, 2014
Citation: Rábago-Remy DM, Padilla-Gasca E, Rangel-Peraza JG (2014) Statistical Quality Control and Process Capability Analysis for Variability Reduction of the Tomato Paste Filling Process. Ind Eng Manage 3: 137. doi: 10.4172/2169-0316.1000137
Copyright: © 2014 Rábago-Remy DM, et al. This is an open-access article distributed under the terms of the Creative Commons Attribution License, which permits unrestricted use, distribution, and reproduction in any medium, provided the original author and source are credited.
Statistical Quality Control and Process Capability Analysis for Variability Reduction of the Tomato Paste Filling ProcessDulce María Rábago-Remy, Edith Padilla-Gasca and Jesús Gabriel Rangel-Peraza*Departamento de Estudios de Posgrado e Investigación, Instituto Tecnológico de Culiacán, Juan de Dios Batiz 310 Pte. Col. Guadalupe. Culiacán Sinaloa, México
AbstractIn this research some techniques for process statistical control were applied, such as frequency histograms, Pareto
diagrams, process capability analysis and control charts. The purpose of this investigation was to reduce the variability of the canned tomato paste filling process coming from a tomato processing food industry that has problems with the net weight of their processed product. The results of the process capability analysis showed that 35.52% of the observations were out of the specifications during the months in study, which generates a real capability of the process (Cpk) of 0.124, and it indicates that the process does not have enough ability to fulfill the required specifications by the firm. The process potential capability (Cp) is 0.676. Given that Cpk < Cp, then it is concluded that the process is not centered, indicating that the measurement of the filling process is away from the center of the specifications. The process fits 0.371 sigma between the process mean and the nearest specification limit. It was estimated that 40.42% of the cans produced during February did not meet the specifications required, and neither did a 16.84% during March. In consequence of this, it was necessary to identify the potential causes of the can excess fillings. Afterwards, it was proposed an orthogonal array L9 to adequate the process to the company filling specifications. The optimum operating conditions achieved a 5.28 sigma process quality. In addition, it was noted that the process had only 77.49 parts per million (ppm) out of specification. This situation places the tomato paste filling process as a world class quality process.

Citation: Rábago-Remy DM, Padilla-Gasca E, Rangel-Peraza JG (2014) Statistical Quality Control and Process Capability Analysis for Variability Reduction of the Tomato Paste Filling Process. Ind Eng Manage 3: 137. doi: 10.4172/2169-0316.1000137
Page 2 of 7
Volume 3 • Issue 4 • 1000137Ind Eng ManageISSN: 2169-0316, IEM an open access journal
evaporator to eliminate part of the remaining water, concentrating the final product of this stage. The following stage of the process is the concentrate pasteurization with the purpose of eliminating the pathogen agents that the food may have. After pasteurization, the product is taken to the filling stage, where the cans are filled one by one using pistons. Once the cans are filled, a sealing machine seals the product and finally, through a transporting band, the product is taken to a cooling stage where the cans are submerged in cold water. Each of the cans is dried by air induction, and they are put in racks for labeling and packaging for their final sale.
This current research was carried out in the final stage of the tomato paste elaboration process, where a daily sample was gathered every hour from the filler. The information obtained from the sample was registered in a chart. The sample consists in a full and closed can, same that was chosen randomly from the transporting band. The sample was weighed in a digital scale, where the can was weighed full. The digital scale was calibrated daily through 3 patterned weights of 1,000 g., 100g and 10 g. The product’s net weight specification established by the company is 3,000g ± 100g. It is worth to mention that the net weight of the product comprehends the weights of the can, lid and the tomato paste.
Statistical analysis
Histogram: A histogram is a graphical representation of the distribution of data. It is an estimate of the probability distribution of a continuous variable. It allows detecting patterns that are difficult to observe in a simple numeric table and some properties can be observed: shape, central tendency and dispersion [3].
Process capability analysis: The process capability analysis is defined as the engineering study to estimate the process capability [4]. The process capability measures the process ability to meet the specification requirements of a quality characteristic [5]. The process capability analysis is an essential part of an integral program of quality improvement. The graph used for process capability analysis is shown
in Figure 1. They are widely used in the industry, since they allow to observe the specification limits: the lower specification limit (LSL) and the upper specification limit (USL). Therefore it is possible to visualize the average µ that represents the process central tendency, and the nominal value τ is the nominal value or target.
Process capability indices: The process capability indices compare the tolerance of the product specification limits (USL-LSL) with the amplitude of the process real variation (measured in sigma). The process capabilities indices are: potential process capability index (Cp), real process capability index (Cpk), process centering index (K) and Taguchi index (Cpm). These indices can be analyzed in short and long term [6].
• Cp Index
The potential process capability index (Cp) compares the specification variations allowed for the process with the amplitude of the real variation of it [7] which comes from dividing the width by the amplitude of the process natural variation, as shown in equation 1. In which σ symbolizes the standard deviation of the process and USL along with LSL represent the upper and lower specification of the quality characteristic in study, respectively.
Table 1 details the categories of the process in study in function of the Cp values.
6P
USL LSLCσ−
= (1)
• Cpk Index
The real process capacity index can be seen as an adjustment to the index Cp to take into account the process centering. The Cpk magnitude concerning Cp is a direct measurement of how far from the center the process is operating [8]. Equation 2 is used for its calculation, in which µ represents the process average, σ the standard deviation and USL and LSL lower and upper specifications respectively.
min , 3 3 pk
µ LSL USL µC − − = σ σ (2)
• K Index
An important aspect at the moment of making a process capability study is to evaluate if the quality characteristic is centered with respect to the specifications. Therefore it is useful to calculate the centered index of the process K as it is suggested in equation 3.
( )
( )µ 100 312
NKUSL LSL
−= ×
−
When the K value is positive, it means that the process average (µ) is greater to the nominal value (τ) and it is negative when µ< τ. The absolute values under 20% are considered acceptable in terms of process centering [4].
• Cpm taguchi index
According to Taguchi, a process is improved when the process variability is reduced to around its nominal value, and not only to meet the requirements for this product. Therefore Taguchi index is similar to Cpk , however it considers in a simultaneous way the process centered and variability [9]. Cpm is calculated by the Equation 4.
6pm
US LSCτ−
= (4)
Table 2, shows the process values in function of Cpm for its correct interpretation.
Figure 1: Process capability analysis graph.
LSL USLµ τ
Index valueCp
Class or process category Decision (if the process is centered)
Cp 2.2 World class It has six sigma qualityCp > 1.33 1 Adequate
1 < Cp <1.33 2 Partially adequate, requires a strict control.
0.67 < Cp < 1 3Not adequate for the job. A process analysis is necessary. Requires serious modifications
to reach a satisfactory quality
Cp < 0.67 4 Not adequate for the job. Requires very serious modifications
Table 1. Cp values and their interpretation [7] .
Citation: Rábago-Remy DM, Padilla-Gasca E, Rangel-Peraza JG (2014) Statistical Quality Control and Process Capability Analysis for Variability Reduction of the Tomato Paste Filling Process. Ind Eng Manage 3: 137. doi: 10.4172/2169-0316.1000137
Page 3 of 7
Volume 3 • Issue 4 • 1000137Ind Eng ManageISSN: 2169-0316, IEM an open access journal
Xbar control chart: The control charts focuses the attention towards the special causes of variation when they appear and reflect the variation magnitude due to common causes. The Xbar and R control charts are the most important and useful monitoring statistical techniques for process control [10].
The Xbar plots the mean value for the quality characteristic across all units in the sample. An Xbar control chart has a central line (CL) that suggests the mean value of the quality characteristic that was measured. Two horizontal lines are shown as well, which represent the upper control limit and the lower control limit. These limits are obtained from the following equations.
2 UCL X A R= + (5)CL X (6)
2 LCL X A R= − (7)
In equations 5 and 7, UCL refers to the upper control limit, and LCL is associated to the lower control limit. X¯ is the mean value of n observations and R¯ is the range, which is the difference between the maximum and minimum observation of a sample. A2 is a sample size-specific anti-biasing constant. The anti-biasing constants are typically found in the appendices of textbooks on statistical process control [11].
Normality test: To be able to apply the process capability analysis and the Xbar control charts, it is necessary to prove that the data fits a normal distribution [12]. The goodness of fit test is commonly used to know the data behavior [13]. With the purpose of using the equations previously described for the process capability indices and the control charts, it was necessary to sure that the filling process follows a normal distribution. A normality test was used to determine if filling process data set is well-modeled by a normal distribution. Therefore, the null-hypothesis of this test is that this data is normally distributed.
The Anderson-Darling test is applied to the gathered information, and Minitab 16 was used to prove the null hypothesis that the
information has been gathered from a population with normal probability distribution. The Anderson-Darling statistical test is given in the following formula.
2CriticalA = -N – S (8)
Where:
N = is the total of the data
S = is the Anderson-Darling statistical which is obtained by the following equation
S= ( )( ) ( )( )11
2 1 ln ln 1N
N ii
i F Yi F YN + −
=
− + − ∑ (9)
Where:
I= is the observation number.
F(yi) = Is the normal accumulated probability distribution with specified mean and variance from the sample in order from the lowest to the highest value.
F(YN+1-I) = Is the normal accumulated probability distribution with specified mean and variance from the sample in order from the highest to the lowest.
The null hypothesis is accepted if the value 2CriticalA is less than A2.
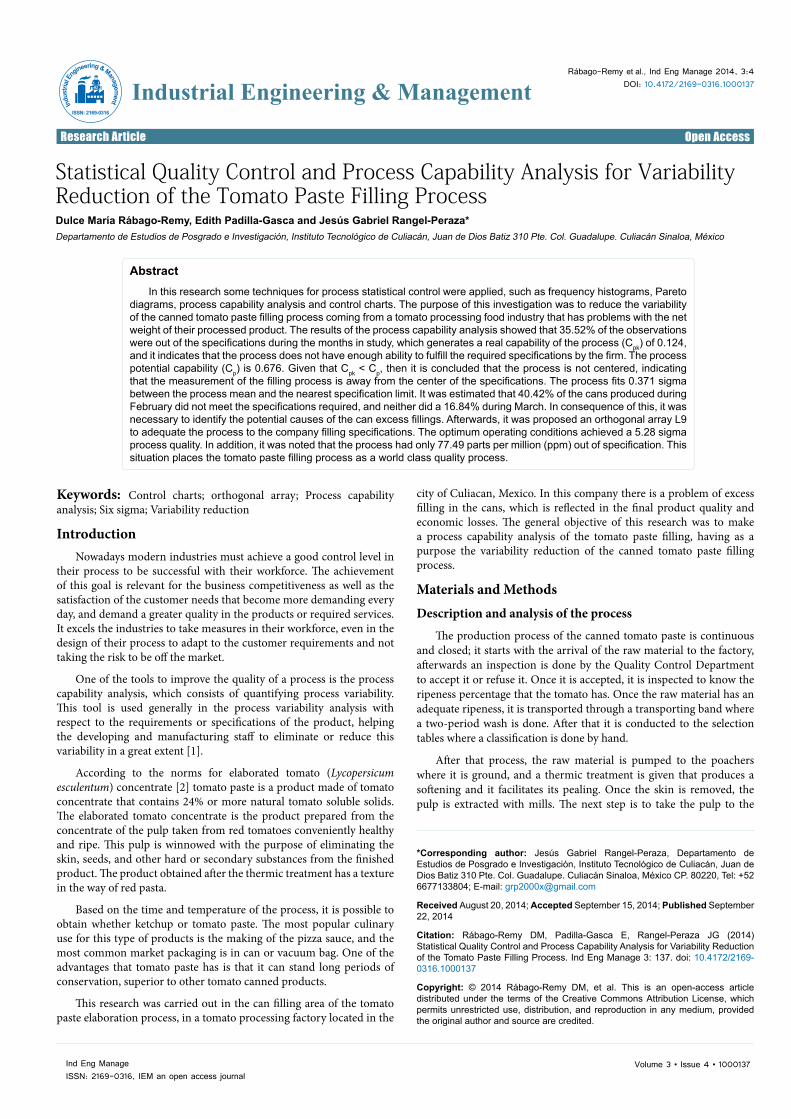
Results and DiscussionThe can filling net weight behavior during the months of study is
shown in Figure 2, where the average value is located approximately in 3,081.68 g. A total of 652 samples were depicted in the aforementioned graph. The data showed a Gauss bell-shaped distribution; however the central tendency is greater than the target value of 3,000 g, meaning that the process is moved from the center towards the right. It is also observed that there is a good amount of cans found outside the company’s upper filling specification of 3,100 g, which means that a good part of the tomato paste overfilled the cans.
February results
To prove that the net weights during this month fit a normal distribution, the Anderson-Darling statistical test was applied, at the time of substituting the data in Equation 8 previously mentioned. The following result was obtained: the value A2 = 0.653, which is a lower value than the critical value (A2critic = 0.752). Therefore the null hypothesis was accepted, meaning that the data gathered in February showed a normal distribution. The normal behavior can be corroborated in Figure 3, since the data fitted to the blue line that represents the normal distribution.
Figure 4 shows the behavior of tomato paste filling process on February 2011. This analysis includes four samples per day, with a total sample size of 152. The net weight specification limits of the tomato paste can, located at LSL=2,900 g and USL=3,100 g. This behavior is similar to the one observed for the process as a global form. A great number of samples were found over USL, even the average volume of the filling net weight during this month is very similar to the global analysis shown before.
Table 3 shows the results for the tomato filling process capability analysis during February 2011. According to the potential process capability index value observed in this study (Cp =0.677), the process is not suitable for the task [14]. Therefore it is imperative to make serious modifications in order to reach a satisfactory quality. On the
Index valueCpm
Interpretation
Cpm < 1 The process does not meet the specifications, whether it is by centralization problems, or variability excess.
Cpm > 1 The process meets the specifications and the average is found within the third central part of the specification band.
Cpm > 1.33 The process meets the specifications and the average is found within the fifth central part of the specification band.
Table 2. Cpm values and their interpretation [7].
Figure 2: Tomato paste filling process capability graph.
120
100
80
60
40
20
0
Frequency USL Mean Target
Frec
uenc
y
Net Weight
2915
.829
34.2
2529
52.6
529
71.0
7529
89.5
3007
.925
3026
.35
3044
.775
3063
.230
81.6
2531
00.0
531
18.4
7531
36.9
3155
.325
3173
.75
3192
.175
3210
.632
29.0
2532
47.4
532
65.8
7532
84.3
3302
.725
3321
.15
3339
.575

Citation: Rábago-Remy DM, Padilla-Gasca E, Rangel-Peraza JG (2014) Statistical Quality Control and Process Capability Analysis for Variability Reduction of the Tomato Paste Filling Process. Ind Eng Manage 3: 137. doi: 10.4172/2169-0316.1000137
Page 4 of 7
Volume 3 • Issue 4 • 1000137Ind Eng ManageISSN: 2169-0316, IEM an open access journal
other hand, since this value is greater than the one obtained for the real process capability index (Cpk = 0.081), it could be recognized that the process is not centered, which means that the filling process mean is found far away from the center of the specifications, and there exist a strong possibility to produce units greater to the volume that goes over the upper specification limits, situation that is also observed in Figure 4.
When process centering index (K) was calculated, it was proved that the mean of the net weights was moved towards the right of the target of 3,000 g., in an 88.072%, which contributes in a great extent to the low process capability to meet the upper specification. A way to take into account in a simultaneous form the center as well as the process variability is calculating the Taguchi index (Cpm), which is equal to Cpm = 0.330. This value is less than 1, which means that the filling process does not meet the specifications because of the centering problems and the high variability of the process.
According to this, the can filling process with tomato paste fits 0.242 sigma between the process mean and the nearest specification limit on February 2011, therefore it is estimated that the 40.42% of the
cans produced by this filling process does not meet the specifications required by the company.
Figure 5 shows the tomato paste filling process mean control chart of February 2011. An irregular behavior is observed and fluctuations of the can weights along the time of the sample gathering are shown. The values move around the center line of the Xbar control chart, which is located in 3,079 g. When the process control limits are put into a chart, it is noticed that some values are found outside the control limits, then it is assumed that the tomato paste filling is out of statistical control.
According to filling process capability analysis, it is suggested to set new tolerance limits for the process. These new tolerance limits were calculated according to the methodology suggested by Miller and Freund [15]. According to the results, the process is under statistical control with the new established limits [10], where the lower recommended limit (LRL-95) is 3,024 and the upper recommended limit (URL-95) is 3,134 g. It is important to mention that, even though these new limits were set, the target value is not reached yet.
March results
The Anderson-Darling test proved that the net weights gathered during March fit a normal distribution. The net weight for this test comprises the daily mean value of filling process (n= 27). In Figure 6 shows that the information obtained (red dots) has a good adjustment with respect to the blue line that represents a theoretical behavior of the normal distribution. Furthermore a statistical value was obtained from Anderson-Darling. (A2) of 0.587, value that is less than 2
CriticalA= 0.752, which makes it possible to assure that the average of the net weights obtained in March follow a normal distribution.
Figure 3: Normal probability plot for February 2011.
99.9
99
9590
8070605040302010
5
1
0.12900 3000 3100 3200 3300
Perc
enta
ge
February
Figure 4: Process capability graph for February 2011.
Process data LSL Target USL Sample mean Sample Stand. devi. (Within) Stand. devi. (General)
2900300031003088.0715249.288949.2074
2940 3000 3060 3120 3180 3240
WithinGeneral
LSL Target USL
IndexCp = 0.677Cpk = 0.081K = 88.072Cpm = 0.330Pp = 0.666Ppk = 0.079Zc = 0.242
Table 3. Process capability analysis during February 2011.
Figure 5: Xbar control chart for February 2011.
3250
3200
3150
3100
3050
3000
2950
2900
28501 2 3 4 5 6 7 8 9 10 11 12 13 14 15
USL
LSL
Data
LRL-95URL-95
Sample
Wei
ght(g
)
Figure 6: Normal probability graph for March 2011.
99
95
90
80706050403020
10
5
13020 3040 3060 3080 3100 3120 3140
Perc
enta
ge
March

Citation: Rábago-Remy DM, Padilla-Gasca E, Rangel-Peraza JG (2014) Statistical Quality Control and Process Capability Analysis for Variability Reduction of the Tomato Paste Filling Process. Ind Eng Manage 3: 137. doi: 10.4172/2169-0316.1000137
Page 5 of 7
Volume 3 • Issue 4 • 1000137Ind Eng ManageISSN: 2169-0316, IEM an open access journal
The process behavior with specification limits is shown in Figure 7. It is possible to observe that in spite of using the daily mean for March 2011, the capability behavior of the can filling process was similar to the one observed in February 2011.
A summary of the results of the filling process for March is shown in Table 4. The obtained value for Cp is 1.55, therefore the filling process of the cans falls in category 1, according to classification suggested by Gutierrez-pulido and de la Vara Salazar [7], which means that the process is adequate. However the real process capability index (Cpk) is 0.320. Since Cpk ‹ Cp, the process is not centered and the average of the filling process is far away from the target value. This situation is similar to what was observed in February with a process centering index (K) equals to 79.467. The fact that the mean net weight is moved towards the right of the target is confirmed with the Taguchi index value (Cpm) obtained, which is equal to 0.405 [16],
The results show that the process of the tomato paste filling fits 0.960 sigma during March. Therefore it is estimated that the 16.84%
of the cans produced by this filling process does not meet the required specifications.
Figure 8 shows the Xbar control chart for March 2011, where the filling process mean was above 3,079 g. In this figure it is observed that a value is found outside the lower control limit and two more over the upper control limit, reason why it is assumed that the process is not under statistical control. Moreover, there is an increasing tendency observed in the last 3 days of monitoring.
Based on the results of the previous process capability analysis, it is suggested to set some new tolerance limits for the filling process. These new specification limits were calculated according to the methodology suggested by Montgomery [4]. With these new limits, it was proved that the process meets the specification limits established by the company. These new limits are the natural or real limits, and they are calculated based on the natural variation of the data: Lower recommended limit (LRL-95) in 3,024 g and the upper recommended limit (URL-95) in 3,135 g. It is important to point out that exactly as it was observed with the data of the previous month, the target value of the can filling is not reached.
Experimental designAccording to the process capability analysis and control charts,
the filling of tomato paste process is unstable, highly variable and does not meet the specifications. In consequence of this, it was necessary to make an analysis to identify the potential causes of the can excess fillings. Once these causes are identified, an experimental design has to be carried out to adequate the process to the company filling specifications.
The potential causes that can have an effect on the net weight of the tomato paste cans are identified in Figure 9. These potential factors were generated by brainstorming and then they were organized in a cause-and-effect diagram.
From the figure above and taking into account the prior knowledge of the filling process, the problems identified during process capability analysis are attributed to four factors:
X1: Can Size (Sizes 1, 2 and 3)
X2: Filling velocity (5 gpm 10 gpm to 15 gpm)
X3: Process Temperature (75°C, 82.5°C and 90°C)
X4: Tomato Firmness (60 N, 45 N, 30 N)
Three levels were selected to each cause identified to test which of these are vital. The methodology that is used to identify the factors that have an effect on response variable is known as design of experiments.
Figure 7: Process capability graph for March 2011.
Process data LSL Target USL Sample mean Sample Stand. devi. (Within) Stand. devi. (General)
2900300031003079.472721.585721.3792
2925 2970 3015 3060 3105 3150
WithinGeneral
LSL Target USL
IndexCp = 1.559Cpk = 0.320K = 79.467Cpm = 0.405Pp = 0.666Ppk = 0.137Zc = 0.960Zm = 0.550
Table 4. Analysis of the process capability results during March 2011.
Figure 8: Xbar control chart for March 2011.
USLLSL
DataLRL-95
URL-95
3200
3150
3100
3050
3000
29501 2 3 4 5 6 7 8 9 10 11 12 13 14 15 16 17 18 19 20 21 22 23 24 25 26 27
Sample
Wei
ght (
g)
Figure 9: Cause-and-effect diagram of the tomato paste filling process.
Tomato paste filling (Net weight)
Measurement Material Personnel
Environment Methods Machines
Calibration
Scales
Tomato Quality
Can Size
Inspectors
Operators
Training
Nozzles
Filling speed
Paste Temperature
Air Temperature
AngleHumidity
Citation: Rábago-Remy DM, Padilla-Gasca E, Rangel-Peraza JG (2014) Statistical Quality Control and Process Capability Analysis for Variability Reduction of the Tomato Paste Filling Process. Ind Eng Manage 3: 137. doi: 10.4172/2169-0316.1000137
Page 6 of 7
Volume 3 • Issue 4 • 1000137Ind Eng ManageISSN: 2169-0316, IEM an open access journal
show that the largest effects coincide precisely with the significant factors distinguished. Both significant factors have a positive effect on the dependent variable. The faster the filling velocity, the higher the mean net weight of cans. Therefore, it is recommended to operate at a lower velocity because a better control of the filling process is achieved. In this regard, the best operating condition for filling velocity to achieve the specified net weight is at 5 gallons per minute (gpm).
Also, it was observed that the higher the process temperature, the higher process variability. Therefore, it is recommended to work at a process temperature of 75°C. This temperature is essential for tight packaging and it removes the Oxygen (O2) present in the can, situation that inhibits the oxidation of the tomato paste [18].
A multiple regression analysis was performed using the experimental design data. Through this analysis, a mathematical model was developed, which explains 92.36% of the tomato filling process variability. The mathematical model for this study is:
1 2 3 4 2882.35 – 3.1 2.76889 1.41556 0.033703Y X X X X= + + +
Where,
Y = Net weight.
This model was used as an objective function to optimize the filling process. The mathematical optimization of the tomato paste filling process is the selection of the best operating conditions to meet the specified target value (3.000 g). This process was carried out using the Statgraphics software and the optimal levels obtained from orthogonal array are given in Table 7.
According to the mathematical model, if filling process is operated under optimum conditions suggested in this study, the mean net weight of tomato paste cans should be 2991.7 g. The results imply that the filling of tomato paste was moved left, so it could meet the specifications of the company.
Centering the process and reducing variability
In order to test the hypothesis presented above, a new process capability analysis was carried out for the tomato paste filling process
The company has three different providers for the can size (1, 2 and 3). Filling velocity was controlled directly by the filling valve with velocities of 5, 10 and 15 gallons per minute (gpm). In case of process temperature factor, the filling process was controlled at temperatures of 75°C, 82.5°C and 90°C. Finally, the raw material (tomato) quality was determined by the firmness following the methodology proposed by Osuna-Enciso [17]. The values for tomato firmness were 30, 45 and 60 N.
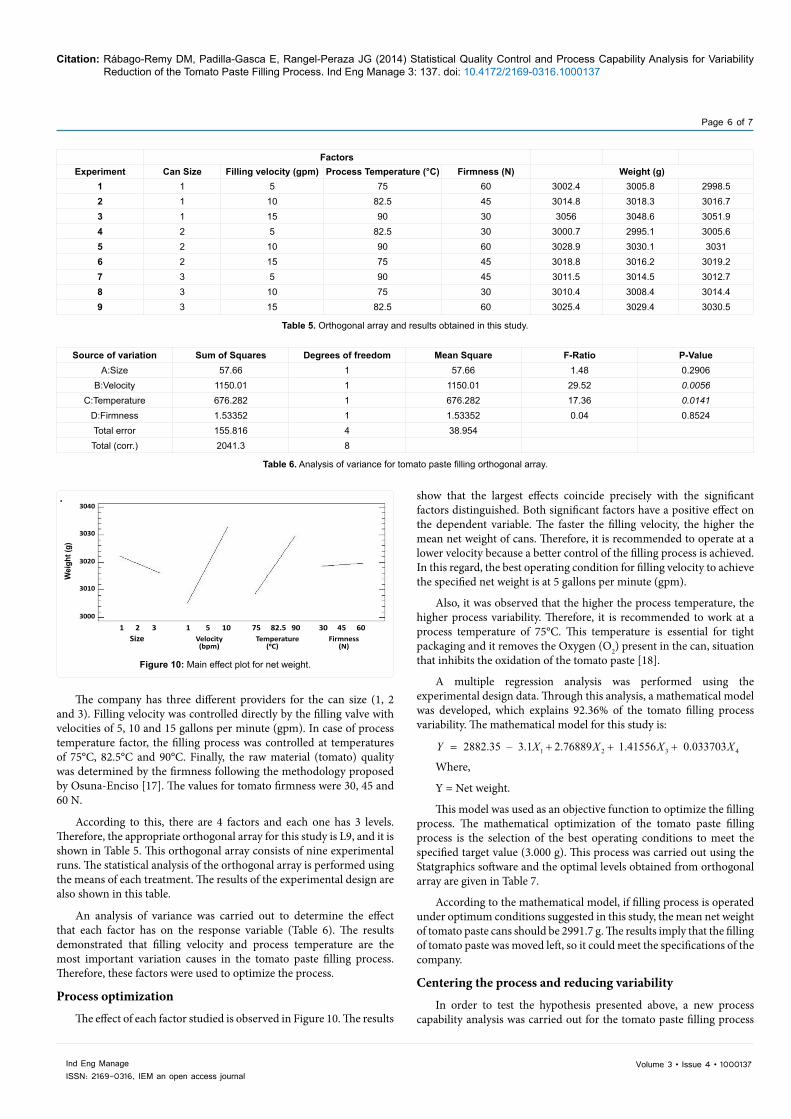
According to this, there are 4 factors and each one has 3 levels. Therefore, the appropriate orthogonal array for this study is L9, and it is shown in Table 5. This orthogonal array consists of nine experimental runs. The statistical analysis of the orthogonal array is performed using the means of each treatment. The results of the experimental design are also shown in this table.
An analysis of variance was carried out to determine the effect that each factor has on the response variable (Table 6). The results demonstrated that filling velocity and process temperature are the most important variation causes in the tomato paste filling process. Therefore, these factors were used to optimize the process.
Process optimization
The effect of each factor studied is observed in Figure 10. The results
FactorsExperiment Can Size Filling velocity (gpm) Process Temperature (°C) Firmness (N) Weight (g)
1 1 5 75 60 3002.4 3005.8 2998.52 1 10 82.5 45 3014.8 3018.3 3016.73 1 15 90 30 3056 3048.6 3051.94 2 5 82.5 30 3000.7 2995.1 3005.65 2 10 90 60 3028.9 3030.1 30316 2 15 75 45 3018.8 3016.2 3019.27 3 5 90 45 3011.5 3014.5 3012.78 3 10 75 30 3010.4 3008.4 3014.49 3 15 82.5 60 3025.4 3029.4 3030.5
Table 5. Orthogonal array and results obtained in this study.
Source of variation Sum of Squares Degrees of freedom Mean Square F-Ratio P-ValueA:Size 57.66 1 57.66 1.48 0.2906
B:Velocity 1150.01 1 1150.01 29.52 0.0056C:Temperature 676.282 1 676.282 17.36 0.0141
D:Firmness 1.53352 1 1.53352 0.04 0.8524Total error 155.816 4 38.954Total (corr.) 2041.3 8
Table 6. Analysis of variance for tomato paste filling orthogonal array.
.
Figure 10: Main effect plot for net weight.
1 2 3 1 5 10 75 82.5 90 30 45 60
3040
3030
3020
3010
3000
Wei
ght (
g)
Size Velocity(bpm)
Temperature(0C)
Firmness(N)

Citation: Rábago-Remy DM, Padilla-Gasca E, Rangel-Peraza JG (2014) Statistical Quality Control and Process Capability Analysis for Variability Reduction of the Tomato Paste Filling Process. Ind Eng Manage 3: 137. doi: 10.4172/2169-0316.1000137
Page 7 of 7
Volume 3 • Issue 4 • 1000137Ind Eng ManageISSN: 2169-0316, IEM an open access journal
under the optimum operating conditions. The results of the process capability analysis are shown in Figure 11. During one month, five samples were taken from filling process and the daily mean value was used for this new analysis (n=30).
This figure shows that real capability of the process (Cpk) increased from a value of 0.124 to 1.76. Similarly, the process potential capability (Cp) was improved, and it achieved a value of 1.78. These values indicate that the tomato paste filling process is now capable to meet the required specifications [7]. Consequently, the results show that it was possible to center the filling process and the variability was reduced.
The reduction of process variability was done by setting the tomato paste filling process parameters. These new operating conditions allowed achieving a 5.28 sigma quality. In addition, it was noted that the process has only 77.49 parts per million (ppm) out of specification. This quality value places the tomato paste filling process as a world class quality process [19].
ConclusionAn evaluation of the can filling process with tomato paste was
carried out through a process capability analysis. According to the Cp and Cpk index values, it is possible to assume that the process in both months did not have enough ability to meet the specifications required by the company.
The mean net weight of the can filling process was moved towards the right, therefore there was a probability of 81.68% to produce higher value units over the upper specification limit. It was proved that the filling process is decentralized from its nominal value. Besides the Xbar control charts shows that the filling process was not under statistical control during February and March.
Due to the results obtained, an analysis to identify the potential causes of the can excess fillings was carried out and an experimental design was carried out to adequate the process to the company filling specifications. The statistical analysis for the orthogonal array demonstrated that filling velocity and process temperature are the most important variation causes in the tomato paste filling process. Therefore, these factors were used to optimize the process.
Then, the tomato paste filling process was operated at a low filling velocity (5 gpm) because a better control of the filling process was found at this level. Likewise, it was recommended to work at a process temperature of 75°C.
Operating the tomato paste filling process under optimum conditions allowed achieving a 5.28 sigma quality. Therefore a variability reduction was demonstrated through this study, situation that even placed the tomato paste filling process as a world class quality process.
References
1. Brosnan T, Sun DW (2004) Improving quality inspection of food products bycomputer vision––a review. Journal of Food Engineering 61: 3-16.
2. CODEX (1995) Norma del Codex para los concentrados de tomate elaborados. Italia: FAO.
3. Verdoy J, Mahiques J, Sagasta S, Silvent R (2006) Manual de controlestadístico de calidad: teoría y aplicaciones (3rdedn), Publicacions de laUniversitat Jaume I, Castello de la Plana.
4. Montgomery D (2011) Control Estadístico de la Calidad (3rdedn), LimusaWiley, México.
5. Niza-Ribeiro J, Noordhuizen J, Menezes JC (2004) Capability index- Astatistical process control tool to aid in udder health control in dairy herds.Journal of Dairy Science 87: 2459-2467.
6. Chao MT, Lin, DKJ (2006) Another look at the process capability index. Quality and Realiability Engineering 22: 153-163.
7. Gutiérrez H, De la Vara R (2009) Control Estadístico de Calidad y Seis Sigma(2ndedn) McGraw-Hill, Mexico.
8. Hung-Chin L, Gwo-Ji S (2005) Practical implementation of the capability index Cpk based on the control chart data. Quality Engineering 17: 371-390.
9. Boyles RA (1991) The Taguchi capability index. Journal of Quality Technology23:17-26.
10. Escalante EJ (2008) Seis-sigma: Metodología y Técnicas. Limusa, México.
11. Koutras MV, Bersimis S, Maravelakis PE (2007) Statistical process controlusing Shewhart control chats with supplementary runs rules. Methodol.Comput. Appl. Probab 9: 207-224.
12. Han C (2006) Effect of testing normality on estimating process capabilityindices. Quality Engineering 18: 391-395.
13. Dos santos M (2001) Estadística básica: Un enfoque no paramétrico. UNAM,México
14. Scagliarini M (2011) Multivariate process capability using principal componentanalysis in the presence of measurement errors. AStA Advances in StatisticalAnalysis 95: 113-128.
15. Miller I, Freund JE (2004) Probabilidad y Estadística para ingenieros. Espana,Reverte.
16. Guevara RD, Vargas JA (2007) Comparación de índices de capacidad deprocesos con datos autocorrelacionados. Revista Colombiana de Estadística30: 301-316.
17. Osuna Enciso T, Sanudo Barajas JA, Muy Rangel M, Basilio-Heredia J, Valdez Torres B, et al. (2012) Aplicacion precosecha de etefon para mejorar la calidad de mangos’ Tommy Atkins’ para procesado industrial. Rev Fitotec Mex 35: 69-74.
18. Badui Dergal S (2006) Química de los alimentos (4thedn) Pearson AddisonWesley, Mexico.
19. Dahlgaard JJ, Dahlgaard Park SM (2006) Lean production, six sigma quality,TQM and company culture. The TQM magazine 18: 263-281.
Size Velocity (gpm) Temperature (°C) Firmness (N)3 5 75 30
T able 7: Optimum operation levels for tomato filling process.
Figure 11: Process capability analysis under optimum conditions.
Process Data LSL Target USL Sample Mean Sample StDev (Overall) StDev (Within)
2900300031003001.113021.854118.7384
2910 2940 2970 3000 3030 3060 3090
LSL USL
Overall Capability
Potential (Within) Capability
PpPPLPPUPpkCpm
CpCPLCPUCpk
1.781.801.761.76
1.531.541.511.511.52