Embed Size (px)
Citation preview
NATIONAL ENERGY RESEARCH SCIENTIFIC COMPUTING CENTER
1
A Comparison of Performance Analysis Tools on the NERSC SP
Jonathan Carter
NERSC User Services

NATIONAL ENERGY RESEARCH SCIENTIFIC COMPUTING CENTER
2
Performance Tools on the IBM SP
• PE Benchmarker– IBM PSSP– Trace and visualize hardware counters values or MPI and user-defined
events
• Paraver– European Center for Parallelism at Barcelona (CEPBA)– Trace and visualize program states, hardware counters values, and MPI and
user-defined events
• Vampir– Pallas GmbH– Trace and visualize MPI and user-defined events
• PAPI, HPMlib, poe+, etc.– Tools based on pmapi hardware-counter interface– Summaries over entire execution
NATIONAL ENERGY RESEARCH SCIENTIFIC COMPUTING CENTER
3
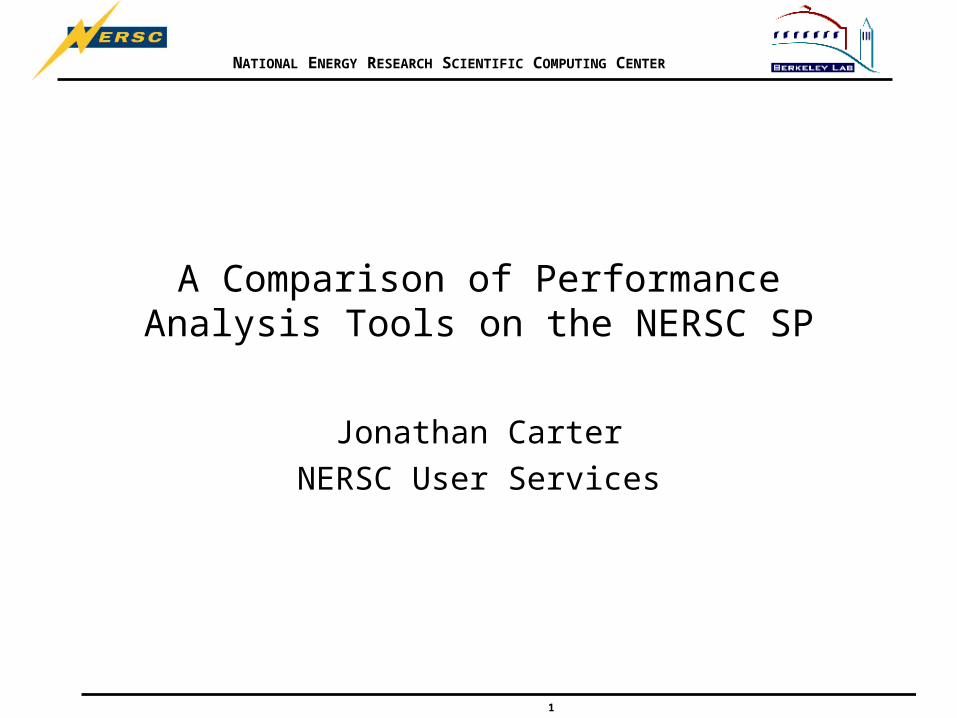
Example Program
• Solve Poisson equation on a 2D grid using Jacobi iteration
),(),(
),(2
yxgyxu
yxfu
)( ,2
,11,1,,1411
, jik
jik
jik
jik
jik
ji fhuuuuu
NATIONAL ENERGY RESEARCH SCIENTIFIC COMPUTING CENTER
4
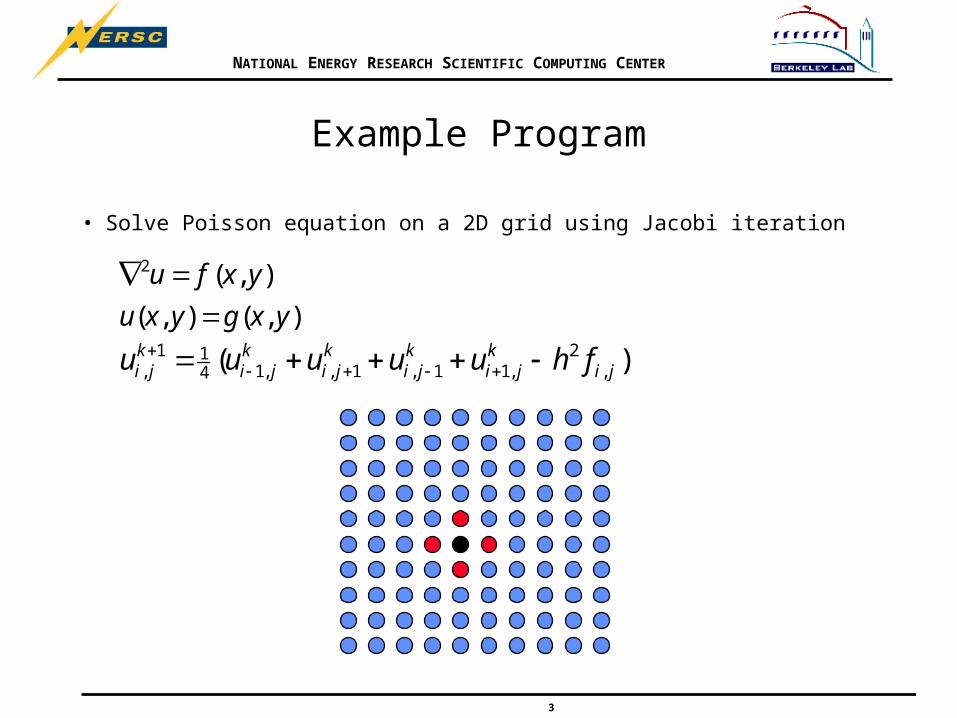
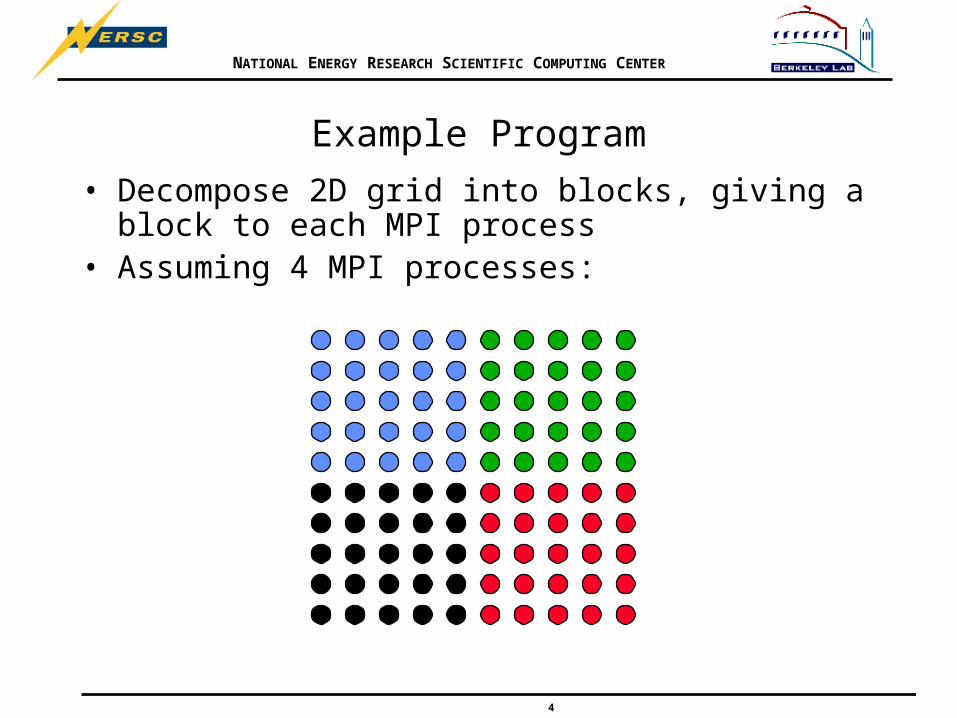
Example Program
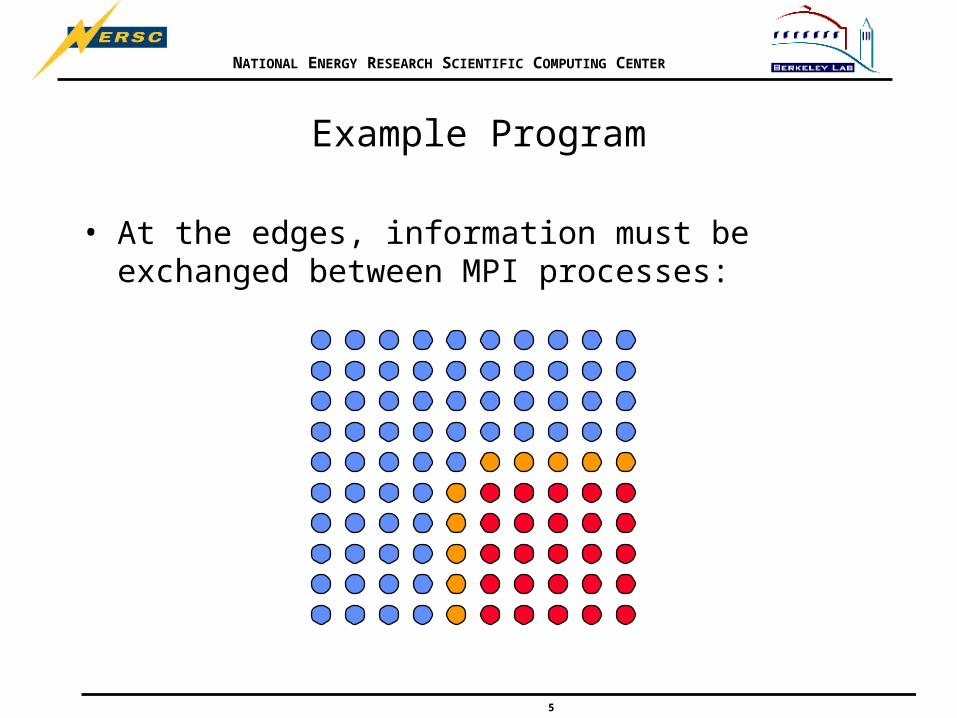
• Decompose 2D grid into blocks, giving a block to each MPI process
• Assuming 4 MPI processes:
NATIONAL ENERGY RESEARCH SCIENTIFIC COMPUTING CENTER
5
Example Program
• At the edges, information must be exchanged between MPI processes:
NATIONAL ENERGY RESEARCH SCIENTIFIC COMPUTING CENTER
6
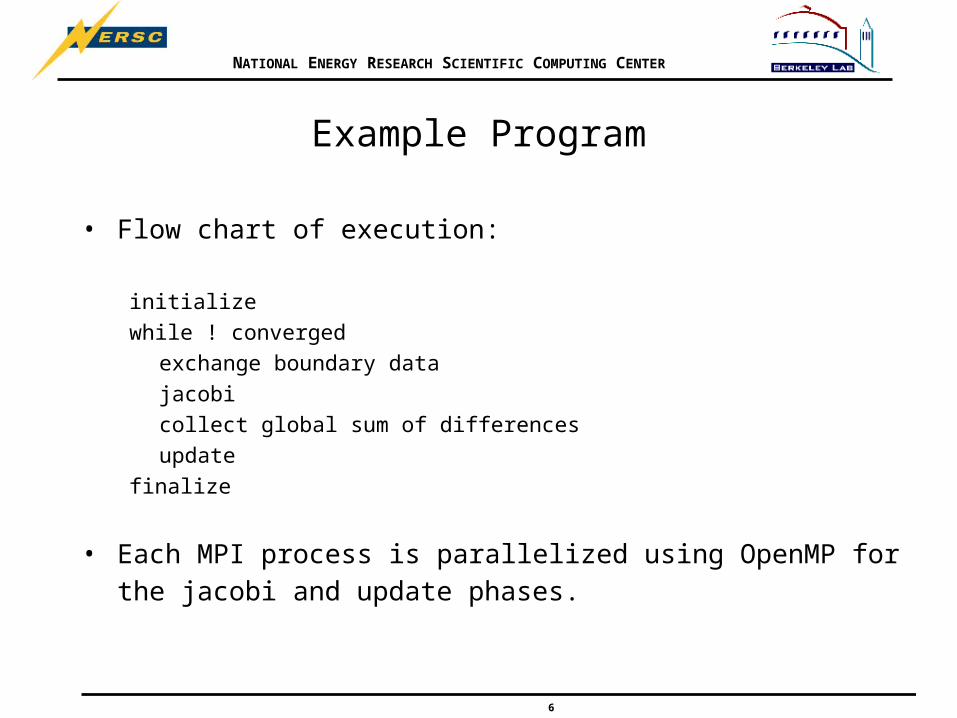
Example Program
• Flow chart of execution:
initialize
while ! converged
exchange boundary data
jacobi
collect global sum of differences
update
finalize
• Each MPI process is parallelized using OpenMP for the jacobi and
update phases.
NATIONAL ENERGY RESEARCH SCIENTIFIC COMPUTING CENTER
7
PE Benchmarker
• Performance Collection Tool (pct)– Application is run under the control of pct, uses DPCL to insert
probes into executable before it runs.
– Collects hardware/OS profiles at a thread level on a routine by routine basis
– Collects MPI event statistics
• Performance Visualization Tool (pvt)– Graphical display of execution statistics
• MPI events– Summaries only (utestats), relies on ANL jumpshot to visualize MPI
timelines

NATIONAL ENERGY RESEARCH SCIENTIFIC COMPUTING CENTER
8
Performance Collection Tool
• Available with a graphical or command line interface
• May collect MPI event statistics or hardware/OS profiles (hardware counters, cpu time, etc.)
• Limitations:– Instrumentation takes place after program has been launched by
POE. For a large number of source files and routines, this can take a considerable amount of time.
– Requires 512 MB of shared memory segments
NATIONAL ENERGY RESEARCH SCIENTIFIC COMPUTING CENTER
9
Performance Collection Tool
• For MPI event statistics– Select subset of MPI processes
– Select subset of source files or routines
– Select subset of MPI events
– Add user-defined events
• For hardware/OS profiles– Select subset of processes
– Select subset of timers, memory usage, hardware-counter group
– Define hardware-counter groups (several already predefined)
NATIONAL ENERGY RESEARCH SCIENTIFIC COMPUTING CENTER
10
Performance Collection Tool
• Must use "threaded" compilers for MPI tracing
• Must set environment variable MP_UTE=YES before linking MPI application if tracing of MPI events is required
• To run module load java
pct
NATIONAL ENERGY RESEARCH SCIENTIFIC COMPUTING CENTER
11
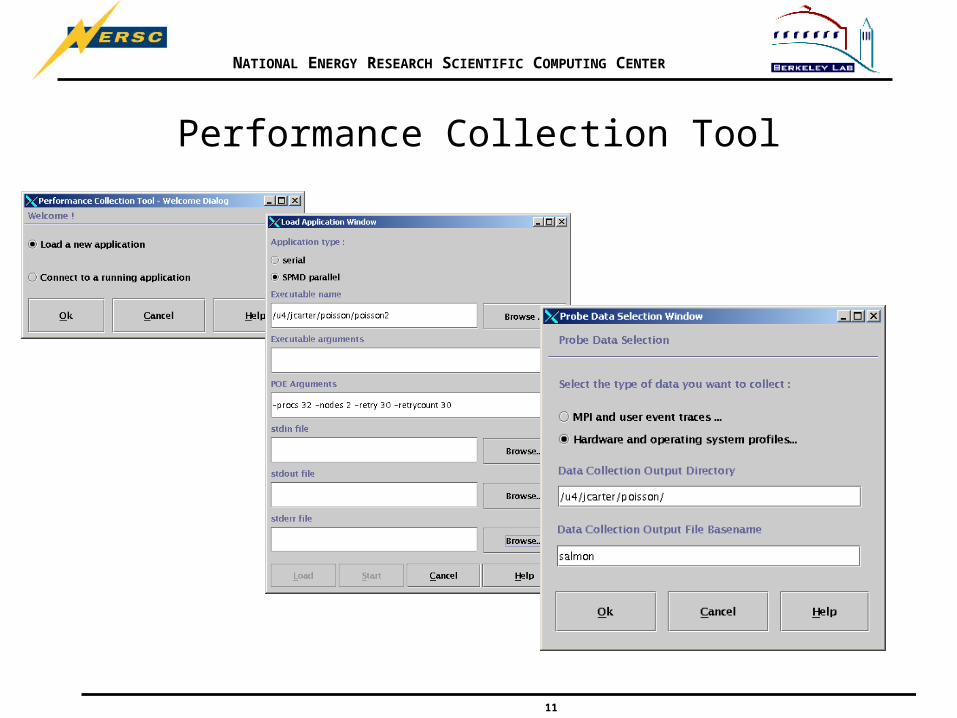
Performance Collection Tool
NATIONAL ENERGY RESEARCH SCIENTIFIC COMPUTING CENTER
12
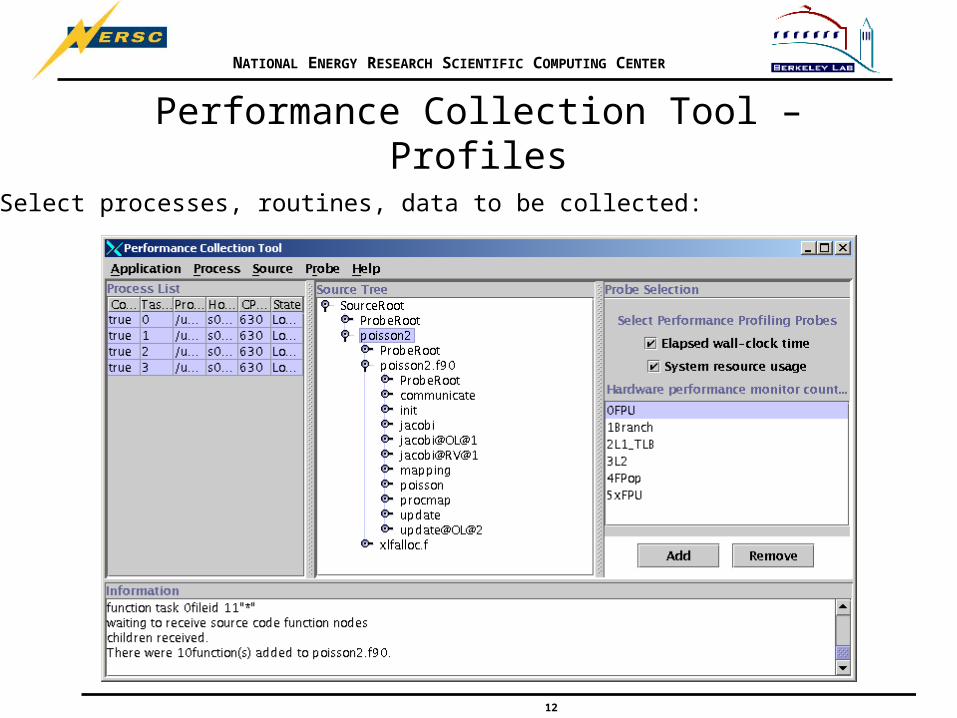
Performance Collection Tool – Profiles
Select processes, routines, data to be collected:
NATIONAL ENERGY RESEARCH SCIENTIFIC COMPUTING CENTER
13
Performance Collection Tool – Profiles
• After the application completes:– Files named basename.cdf.xx created, one per process
– Contain hardware profiles that can be viewed with the Performance Visualization Tool
– Generally files are not too large
NATIONAL ENERGY RESEARCH SCIENTIFIC COMPUTING CENTER
14
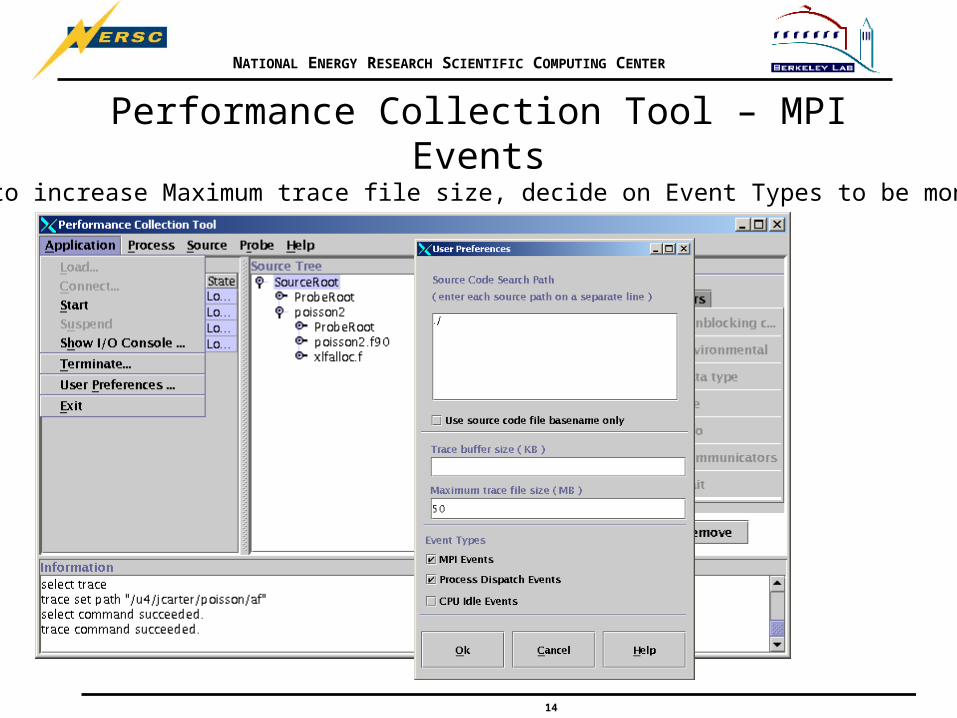
Performance Collection Tool – MPI Events
May need to increase Maximum trace file size, decide on Event Types to be monitored:
NATIONAL ENERGY RESEARCH SCIENTIFIC COMPUTING CENTER
15
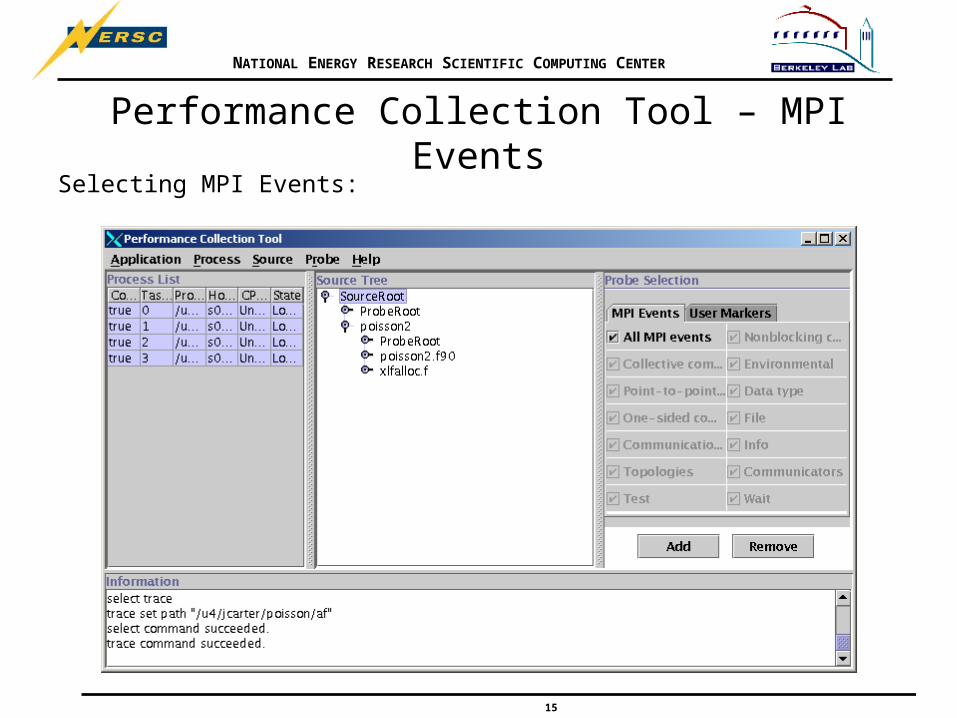
Performance Collection Tool – MPI EventsSelecting MPI Events:

NATIONAL ENERGY RESEARCH SCIENTIFIC COMPUTING CENTER
16
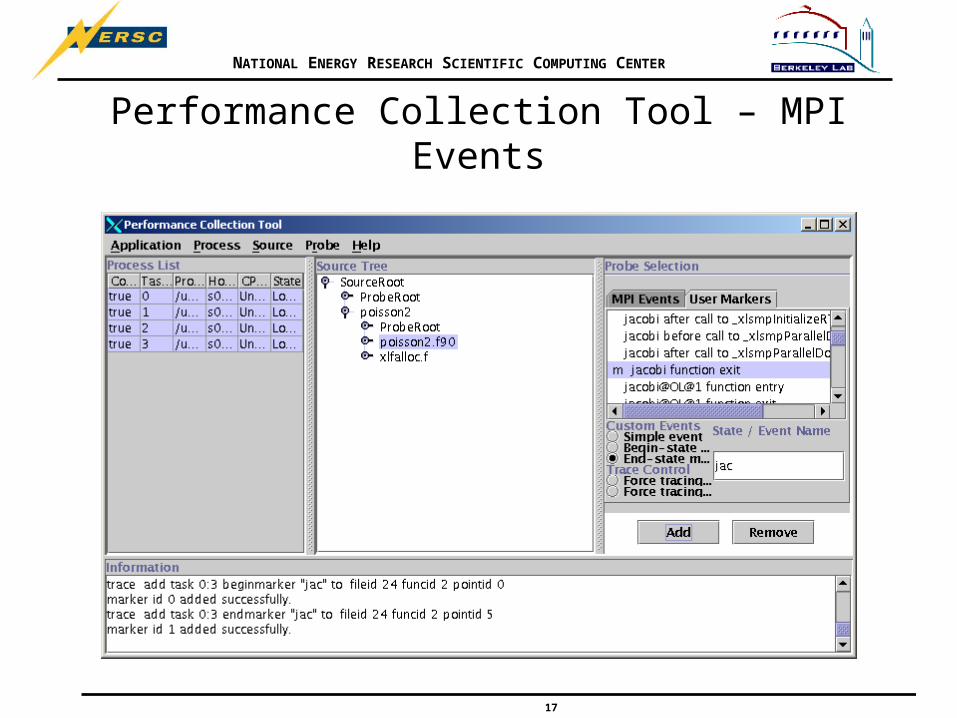
Performance Collection Tool – MPI EventsSelecting User Markers:
NATIONAL ENERGY RESEARCH SCIENTIFIC COMPUTING CENTER
17
Performance Collection Tool – MPI Events
NATIONAL ENERGY RESEARCH SCIENTIFIC COMPUTING CENTER
18
Performance Collection Tool – MPI Events
• After the application completes:– Files named basename.xx created, one per node (xx is rank of one
random task per node)
– Files are generally large (AIX trace files)• Depends on what is traced: mpi, process, idle
– Need to preprocess files with the uteconvert command to produce UTE files
– Can collect statistics directly from UTE files using utestats command, and use the slogmerge in order to view with jumpshot
NATIONAL ENERGY RESEARCH SCIENTIFIC COMPUTING CENTER
19
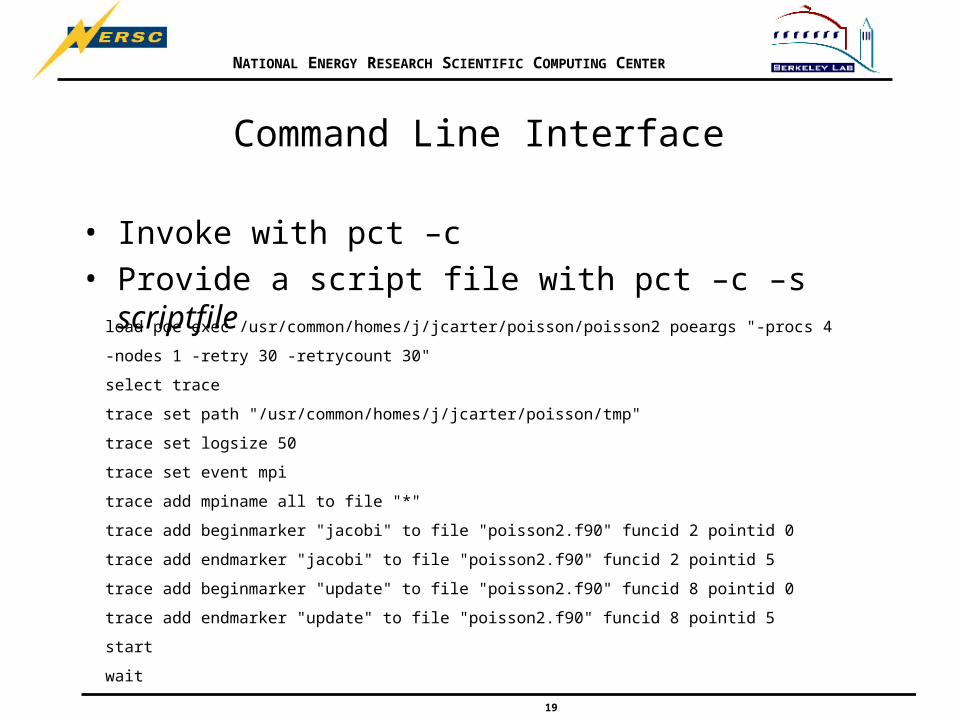
Command Line Interface
• Invoke with pct –c• Provide a script file with pct –c –s scriptfile
load poe exec /usr/common/homes/j/jcarter/poisson/poisson2 poeargs "-procs 4
-nodes 1 -retry 30 -retrycount 30"
select trace
trace set path "/usr/common/homes/j/jcarter/poisson/tmp"
trace set logsize 50
trace set event mpi
trace add mpiname all to file "*"
trace add beginmarker "jacobi" to file "poisson2.f90" funcid 2 pointid 0
trace add endmarker "jacobi" to file "poisson2.f90" funcid 2 pointid 5
trace add beginmarker "update" to file "poisson2.f90" funcid 8 pointid 0
trace add endmarker "update" to file "poisson2.f90" funcid 8 pointid 5
start
wait
NATIONAL ENERGY RESEARCH SCIENTIFIC COMPUTING CENTER
20
Performance Visualization Tool
• View hardware/OS profiles
• To runmodule load java
pvt basename.cdf.*
NATIONAL ENERGY RESEARCH SCIENTIFIC COMPUTING CENTER
21
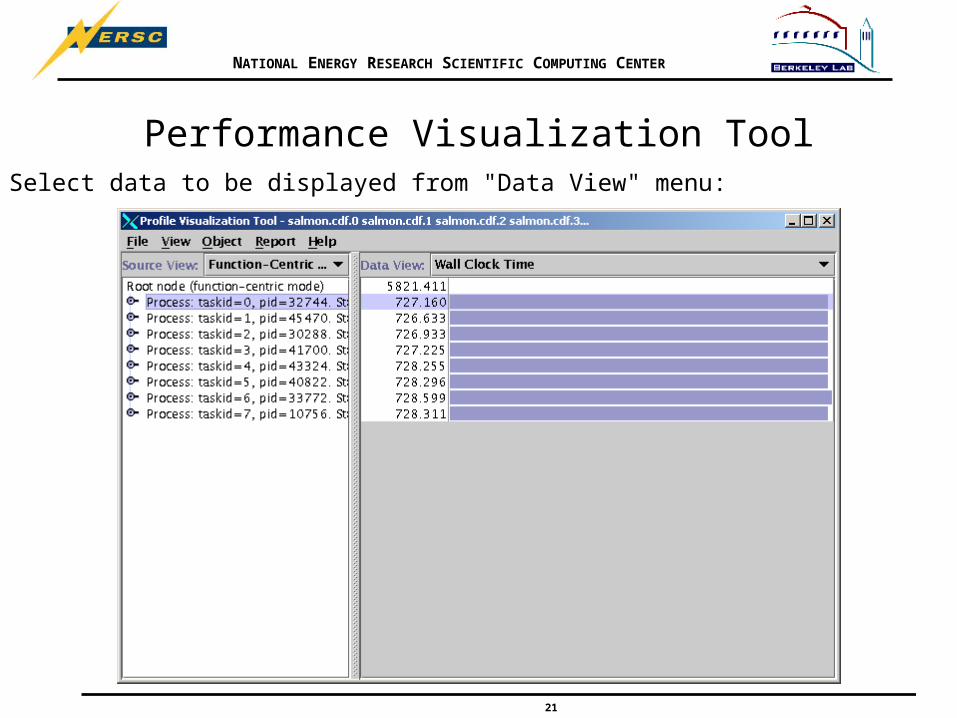
Performance Visualization ToolSelect data to be displayed from "Data View" menu:
NATIONAL ENERGY RESEARCH SCIENTIFIC COMPUTING CENTER
22
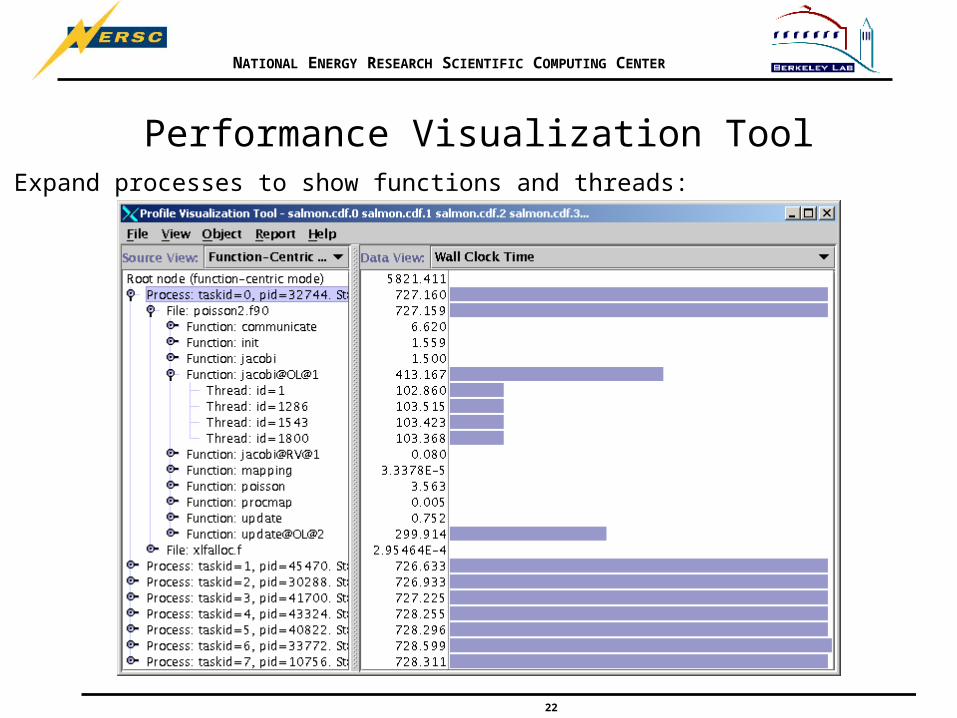
Performance Visualization ToolExpand processes to show functions and threads:

NATIONAL ENERGY RESEARCH SCIENTIFIC COMPUTING CENTER
23
Performance Visualization ToolSelect Thread-Centric View for another way of grouping results:
NATIONAL ENERGY RESEARCH SCIENTIFIC COMPUTING CENTER
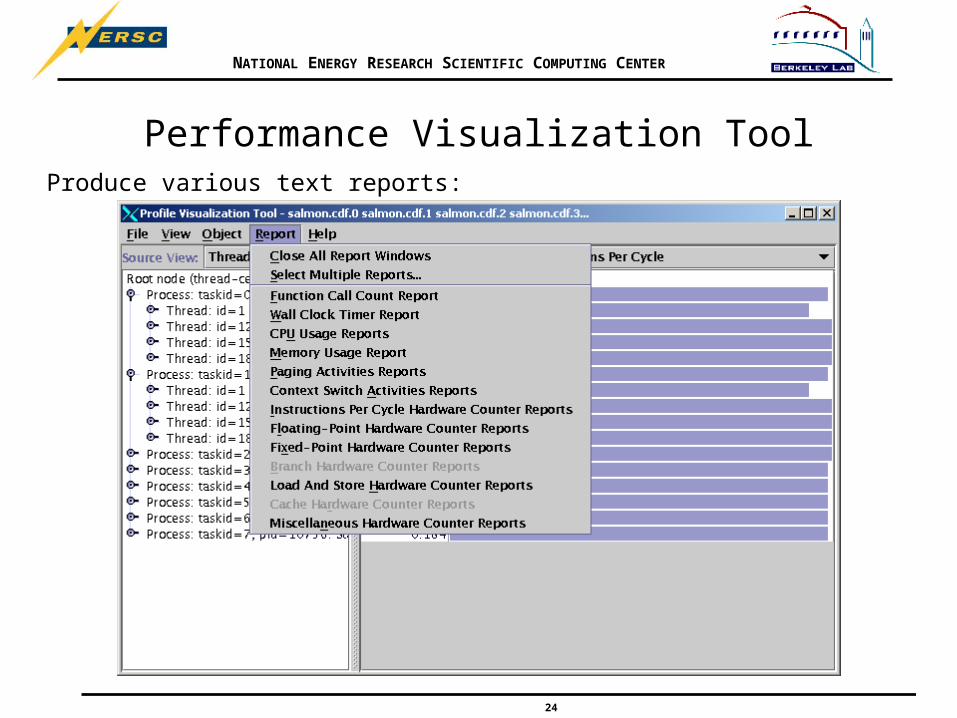
24
Performance Visualization ToolProduce various text reports:
NATIONAL ENERGY RESEARCH SCIENTIFIC COMPUTING CENTER
25
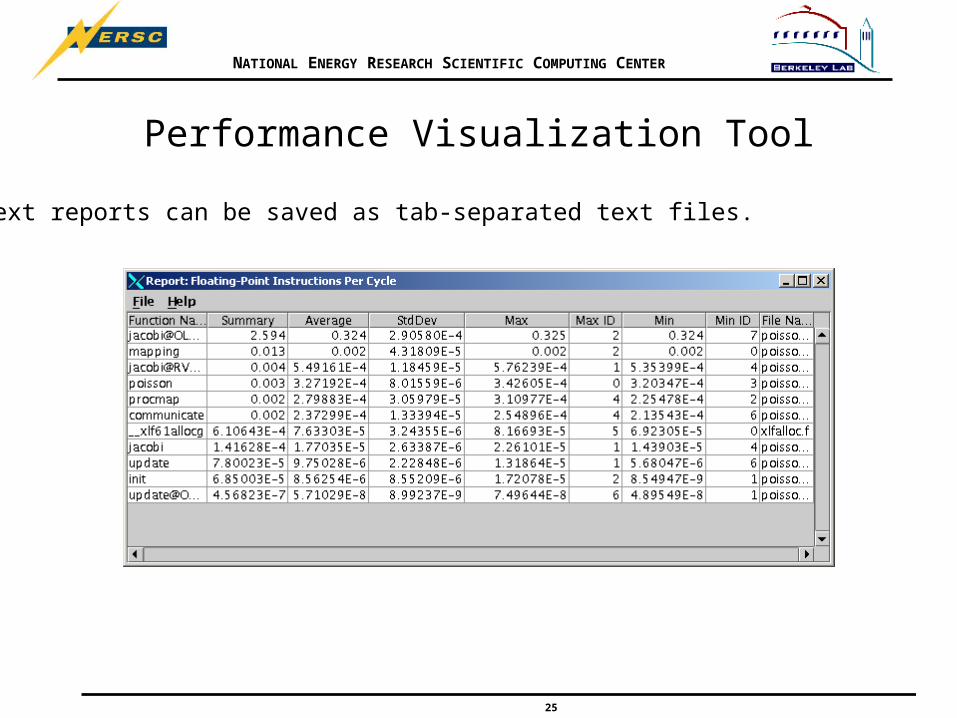
Performance Visualization Tool
Text reports can be saved as tab-separated text files.
NATIONAL ENERGY RESEARCH SCIENTIFIC COMPUTING CENTER
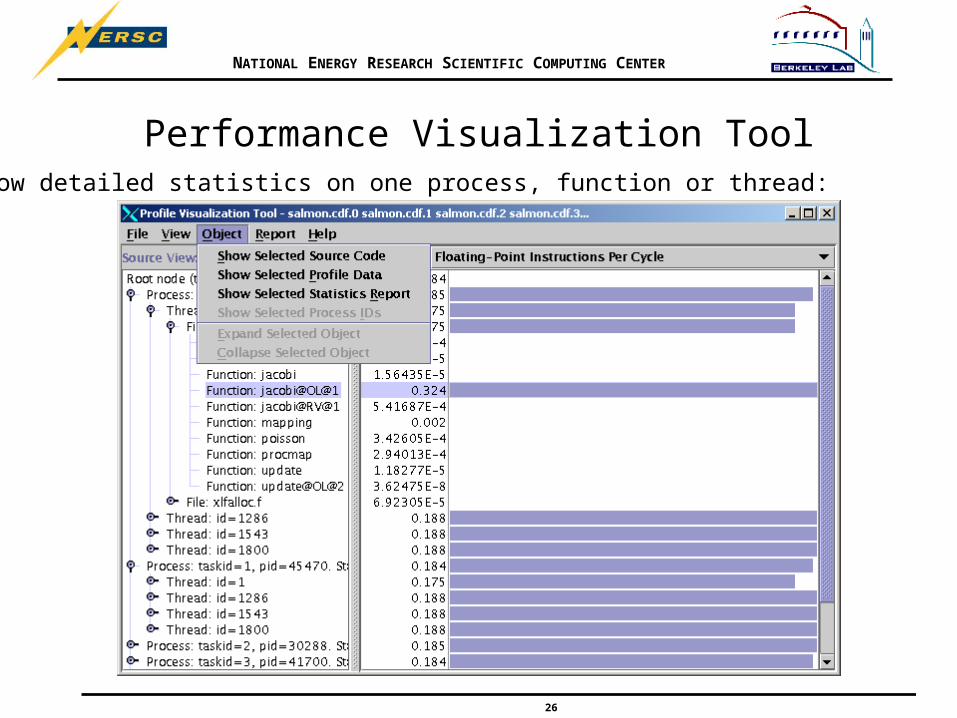
26
Performance Visualization ToolShow detailed statistics on one process, function or thread:
NATIONAL ENERGY RESEARCH SCIENTIFIC COMPUTING CENTER
27
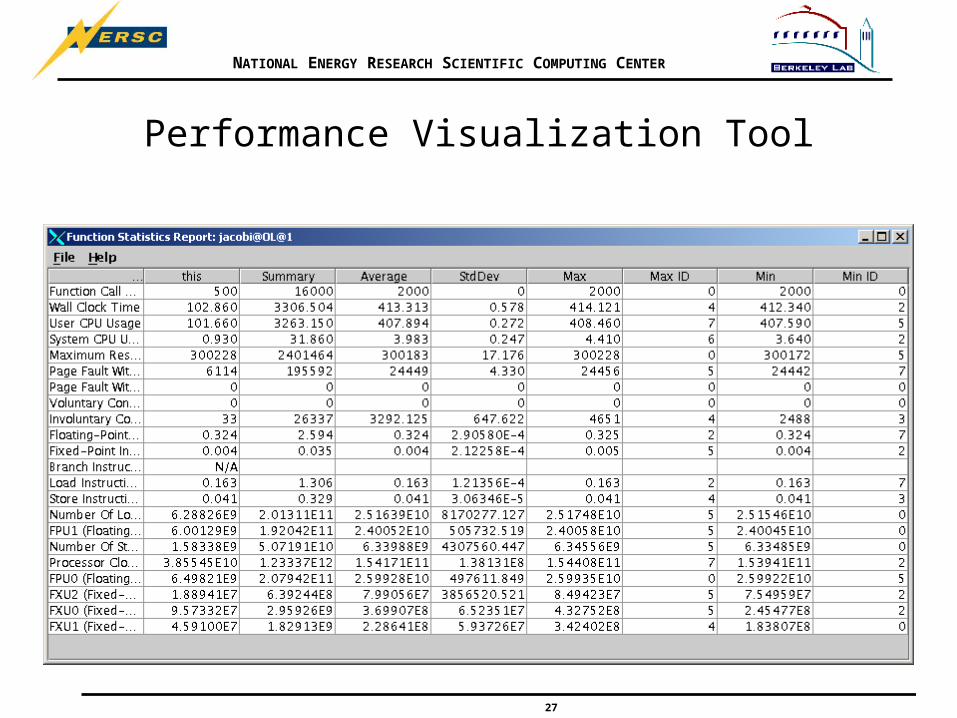
Performance Visualization Tool
NATIONAL ENERGY RESEARCH SCIENTIFIC COMPUTING CENTER
28
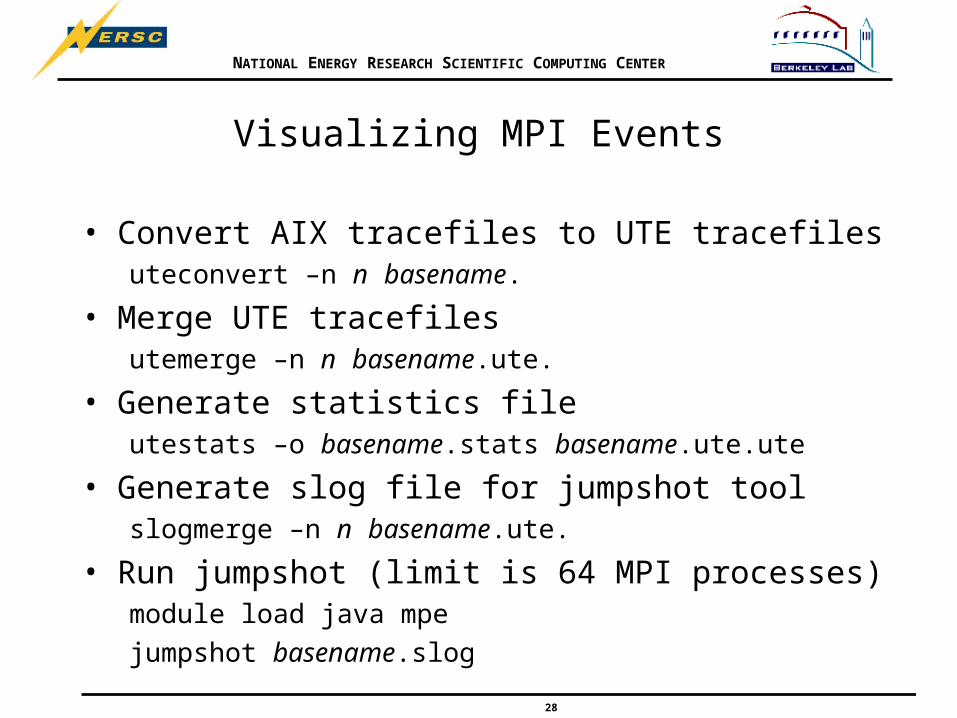
Visualizing MPI Events
• Convert AIX tracefiles to UTE tracefilesuteconvert –n n basename.
• Merge UTE tracefilesutemerge –n n basename.ute.
• Generate statistics fileutestats –o basename.stats basename.ute.ute
• Generate slog file for jumpshot toolslogmerge –n n basename.ute.
• Run jumpshot (limit is 64 MPI processes)module load java mpe
jumpshot basename.slog

NATIONAL ENERGY RESEARCH SCIENTIFIC COMPUTING CENTER
29
jumpshotEntire profile is divided into frames, select frame, select MPI-Process or Thread, then click "Display".
NATIONAL ENERGY RESEARCH SCIENTIFIC COMPUTING CENTER
30
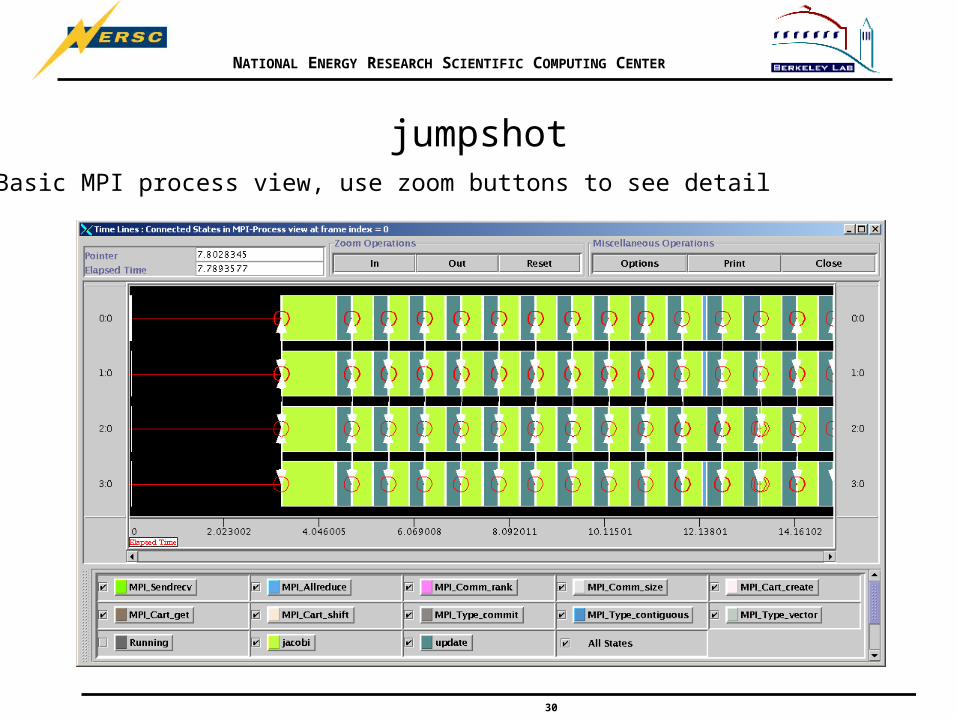
jumpshotBasic MPI process view, use zoom buttons to see detail

NATIONAL ENERGY RESEARCH SCIENTIFIC COMPUTING CENTER
31
jumpshot
NATIONAL ENERGY RESEARCH SCIENTIFIC COMPUTING CENTER
32
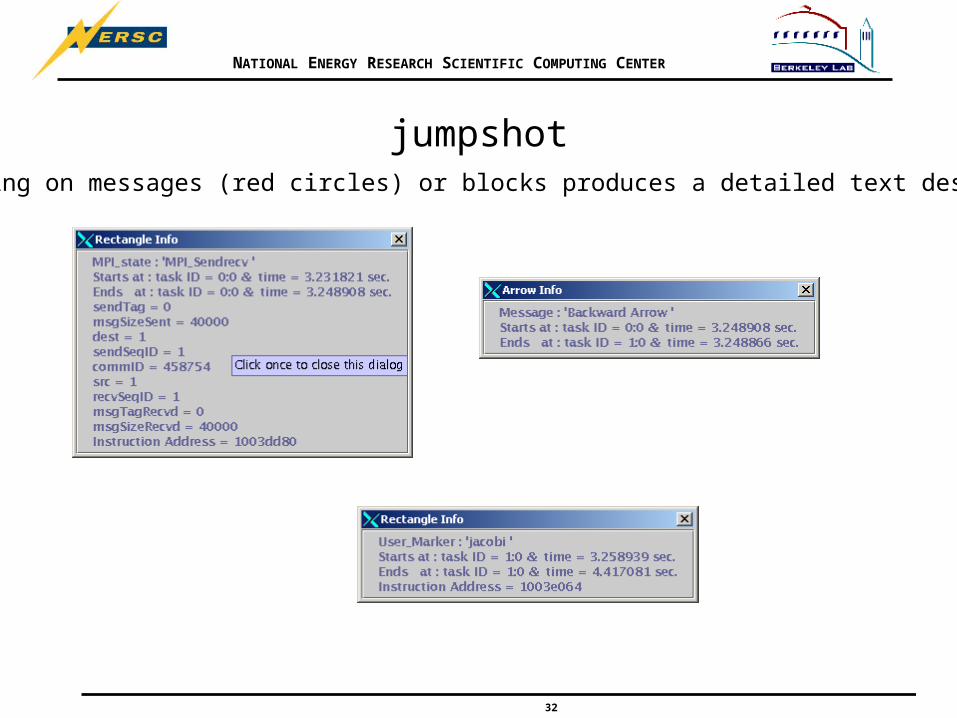
jumpshotClicking on messages (red circles) or blocks produces a detailed text description:
NATIONAL ENERGY RESEARCH SCIENTIFIC COMPUTING CENTER
33
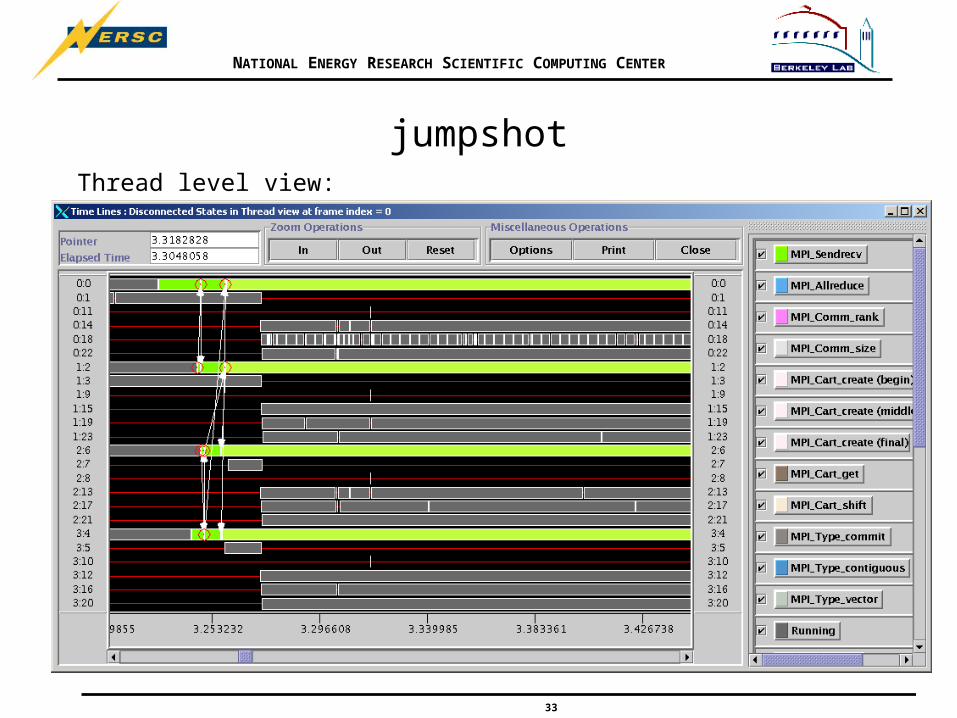
jumpshotThread level view:
NATIONAL ENERGY RESEARCH SCIENTIFIC COMPUTING CENTER
34
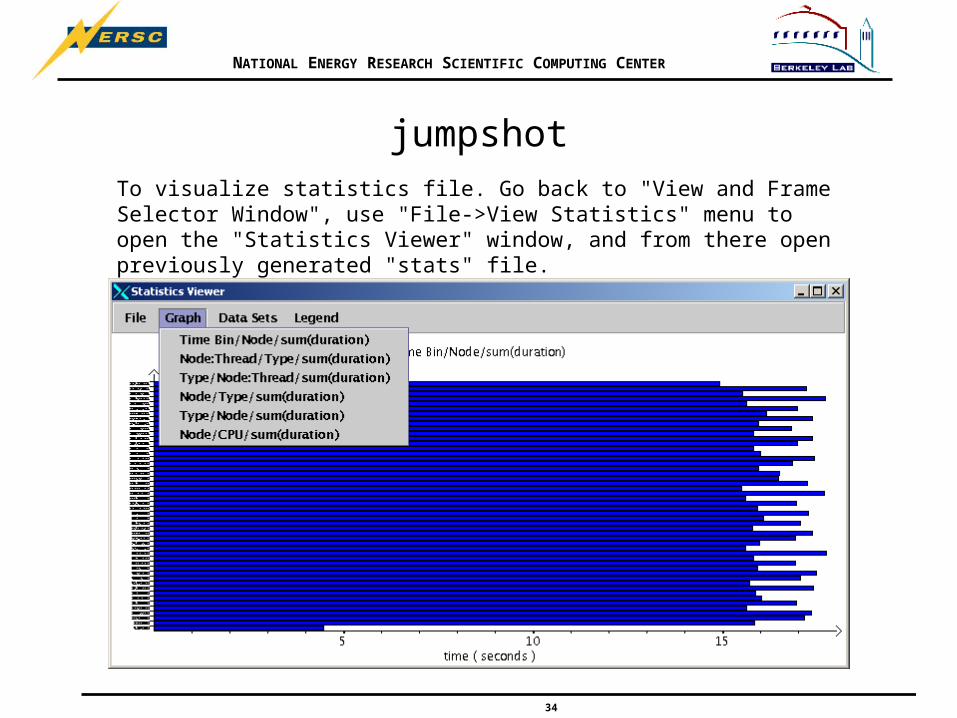
jumpshotTo visualize statistics file. Go back to "View and Frame Selector Window", use "File->View Statistics" menu to open the "Statistics Viewer" window, and from there open previously generated "stats" file.

NATIONAL ENERGY RESEARCH SCIENTIFIC COMPUTING CENTER
35
jumpshot
NATIONAL ENERGY RESEARCH SCIENTIFIC COMPUTING CENTER
36
Further Reading
• IBM PE for AIX, Operation and Use, Volume 2– Chapter 3 and Appendix A
– http://hpcf.nersc.gov/vendor_docs/ibm/pe/am103mst.html
• Tour of Jumpshot– /usr/common/usg/mpe/1.2.2/share/jumpshot-3/doc/TourStepByStep.pdf
NATIONAL ENERGY RESEARCH SCIENTIFIC COMPUTING CENTER
37
CEPBA Tools
• Run application under the control of ompitrace– Uses DPCL technology to insert probes into executable
• Merge trace files with omp2prv• Visualize results with paraver
NATIONAL ENERGY RESEARCH SCIENTIFIC COMPUTING CENTER
38
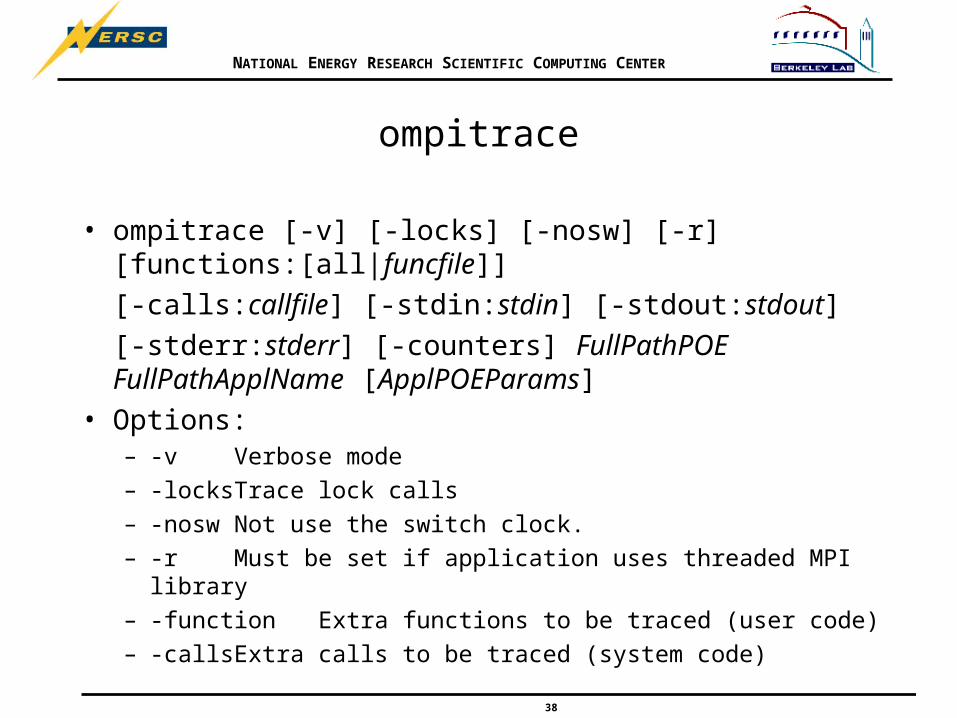
ompitrace
• ompitrace [-v] [-locks] [-nosw] [-r] [functions:[all|funcfile]]
[-calls:callfile] [-stdin:stdin] [-stdout:stdout]
[-stderr:stderr] [-counters] FullPathPOE FullPathApplName [ApplPOEParams]
• Options:– -v Verbose mode
– -locks Trace lock calls
– -nosw Not use the switch clock.
– -r Must be set if application uses threaded MPI library
– -function Extra functions to be traced (user code)
– -calls Extra calls to be traced (system code)
NATIONAL ENERGY RESEARCH SCIENTIFIC COMPUTING CENTER
39
ompitrace
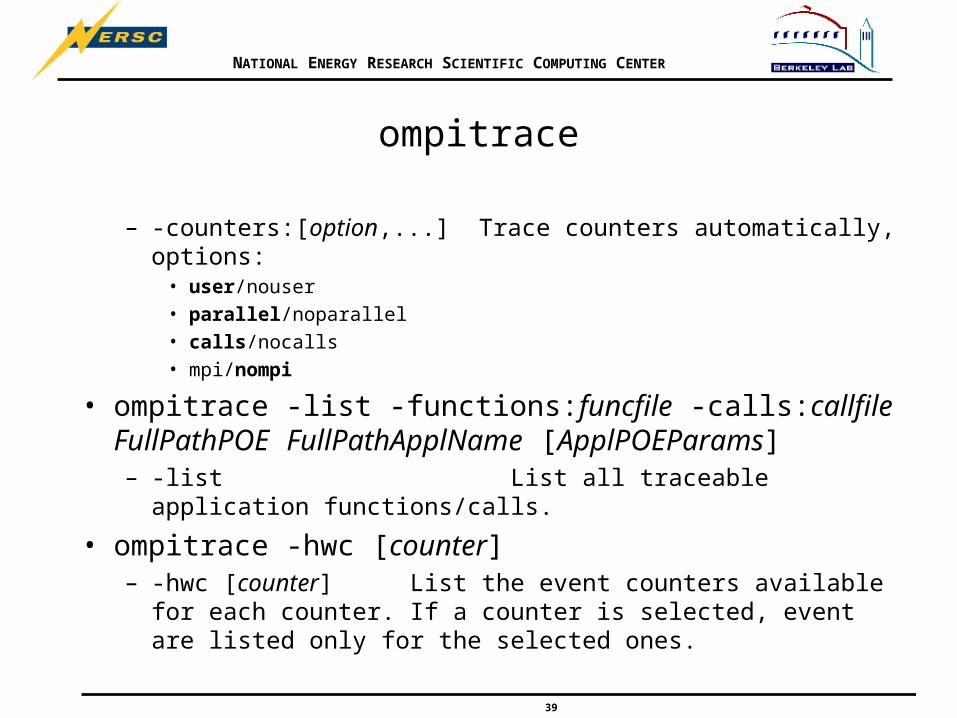
– -counters:[option,...] Trace counters automatically, options:• user/nouser
• parallel/noparallel
• calls/nocalls
• mpi/nompi
• ompitrace -list -functions:funcfile -calls:callfile FullPathPOE FullPathApplName [ApplPOEParams] – -list List all traceable application functions/calls.
• ompitrace -hwc [counter] – -hwc [counter] List the event counters available for each counter.
If a counter is selected, event are listed only for the selected ones.

NATIONAL ENERGY RESEARCH SCIENTIFIC COMPUTING CENTER
40
Related environment variables
• MPTRACE_ADDFUNCTIONS: Filename containing additional functions to trace.
• MPTRACE_DIR: Output temporary/tracefile directory.• MPTRACE_BUFFER_SIZE: Number of events allowed in
thread event buffers.• MPTRACE_FILE_SIZE: Maximum trace file size in
Mbytes• MPTRACE_COUNTERS: Hardware event traced for each
hardware counter. Can use $MPTRACE_FPHWC to use same set as hpmcount command.
• MPTRACE_LABELS: User manually event traced labels.
NATIONAL ENERGY RESEARCH SCIENTIFIC COMPUTING CENTER
41
ompitrace
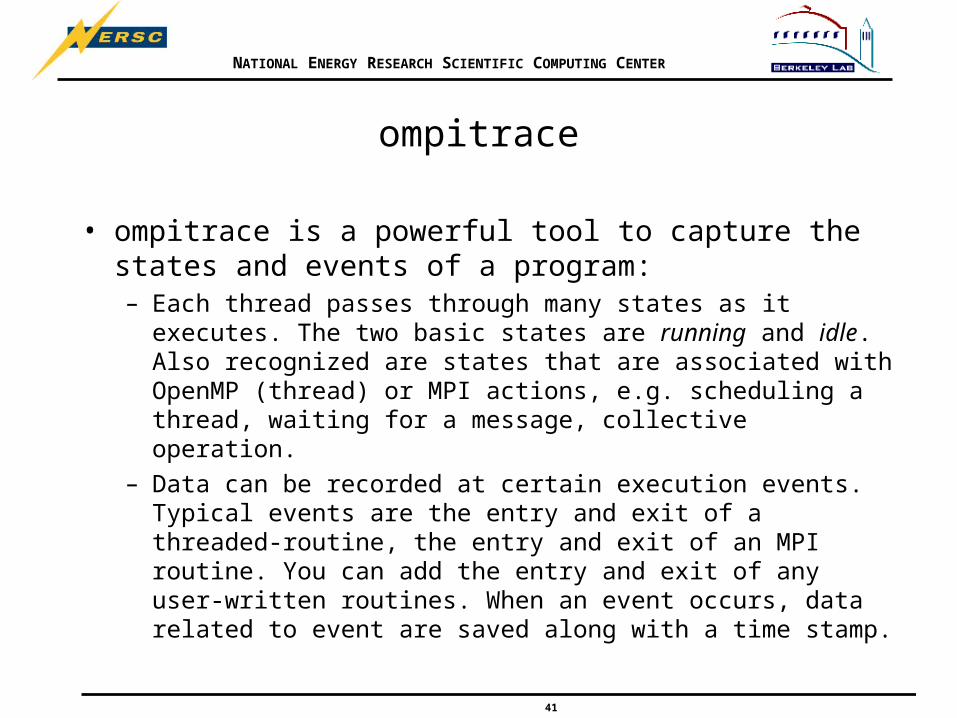
• ompitrace is a powerful tool to capture the states and events of a program:– Each thread passes through many states as it executes. The two basic
states are running and idle. Also recognized are states that are associated with OpenMP (thread) or MPI actions, e.g. scheduling a thread, waiting for a message, collective operation.
– Data can be recorded at certain execution events. Typical events are the entry and exit of a threaded-routine, the entry and exit of an MPI routine. You can add the entry and exit of any user-written routines. When an event occurs, data related to event are saved along with a time stamp.
NATIONAL ENERGY RESEARCH SCIENTIFIC COMPUTING CENTER
42
ompitrace
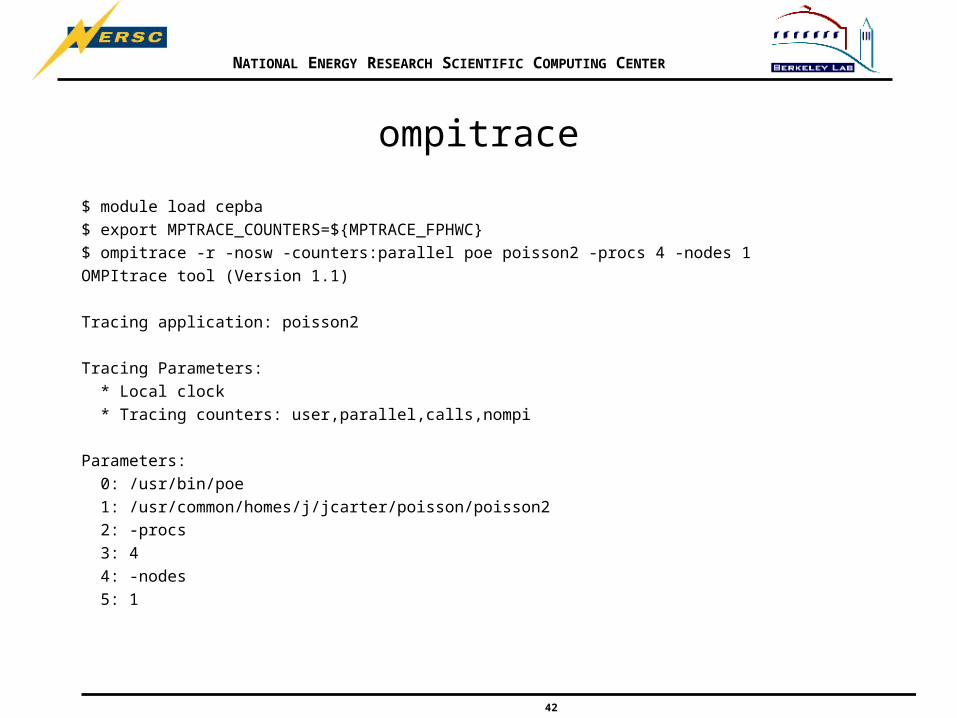
$ module load cepba
$ export MPTRACE_COUNTERS=${MPTRACE_FPHWC}
$ ompitrace -r -nosw -counters:parallel poe poisson2 -procs 4 -nodes 1
OMPItrace tool (Version 1.1)
Tracing application: poisson2
Tracing Parameters:
* Local clock
* Tracing counters: user,parallel,calls,nompi
Parameters:
0: /usr/bin/poe
1: /usr/common/homes/j/jcarter/poisson/poisson2
2: -procs
3: 4
4: -nodes
5: 1
NATIONAL ENERGY RESEARCH SCIENTIFIC COMPUTING CENTER
43
ompitrace
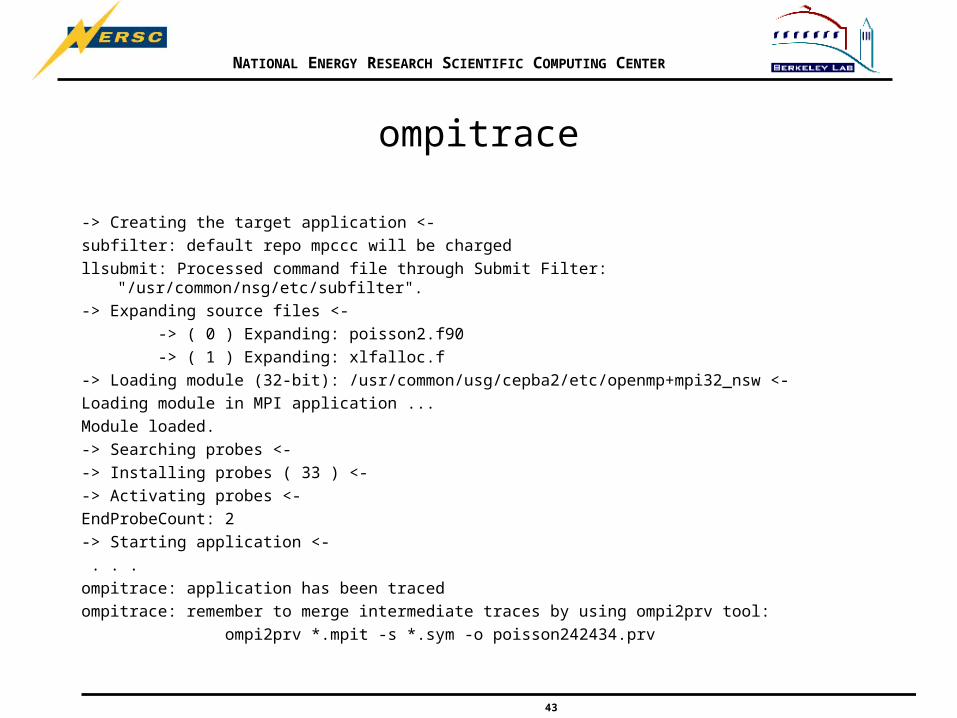
-> Creating the target application <-
subfilter: default repo mpccc will be charged
llsubmit: Processed command file through Submit Filter: "/usr/common/nsg/etc/subfilter".
-> Expanding source files <-
-> ( 0 ) Expanding: poisson2.f90
-> ( 1 ) Expanding: xlfalloc.f
-> Loading module (32-bit): /usr/common/usg/cepba2/etc/openmp+mpi32_nsw <-
Loading module in MPI application ...
Module loaded.
-> Searching probes <-
-> Installing probes ( 33 ) <-
-> Activating probes <-
EndProbeCount: 2
-> Starting application <-
. . .
ompitrace: application has been traced
ompitrace: remember to merge intermediate traces by using ompi2prv tool:
ompi2prv *.mpit -s *.sym -o poisson242434.prv
NATIONAL ENERGY RESEARCH SCIENTIFIC COMPUTING CENTER
44
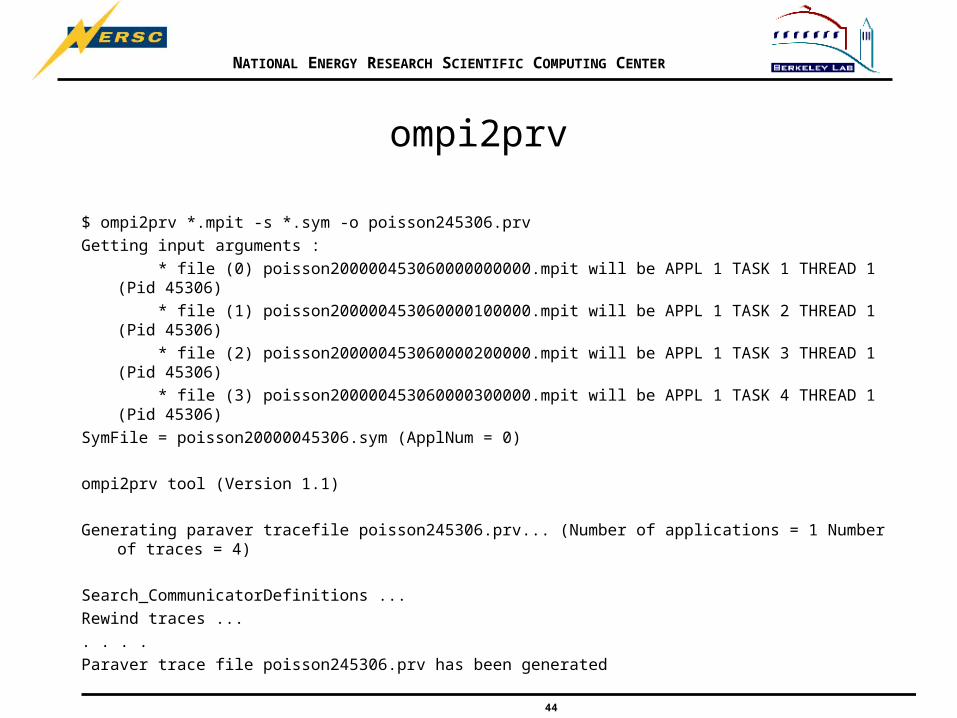
ompi2prv
$ ompi2prv *.mpit -s *.sym -o poisson245306.prv
Getting input arguments :
* file (0) poisson200000453060000000000.mpit will be APPL 1 TASK 1 THREAD 1 (Pid 45306)
* file (1) poisson200000453060000100000.mpit will be APPL 1 TASK 2 THREAD 1 (Pid 45306)
* file (2) poisson200000453060000200000.mpit will be APPL 1 TASK 3 THREAD 1 (Pid 45306)
* file (3) poisson200000453060000300000.mpit will be APPL 1 TASK 4 THREAD 1 (Pid 45306)
SymFile = poisson20000045306.sym (ApplNum = 0)
ompi2prv tool (Version 1.1)
Generating paraver tracefile poisson245306.prv... (Number of applications = 1 Number of traces = 4)
Search_CommunicatorDefinitions ...
Rewind traces ...
. . . .
Paraver trace file poisson245306.prv has been generated
NATIONAL ENERGY RESEARCH SCIENTIFIC COMPUTING CENTER
45
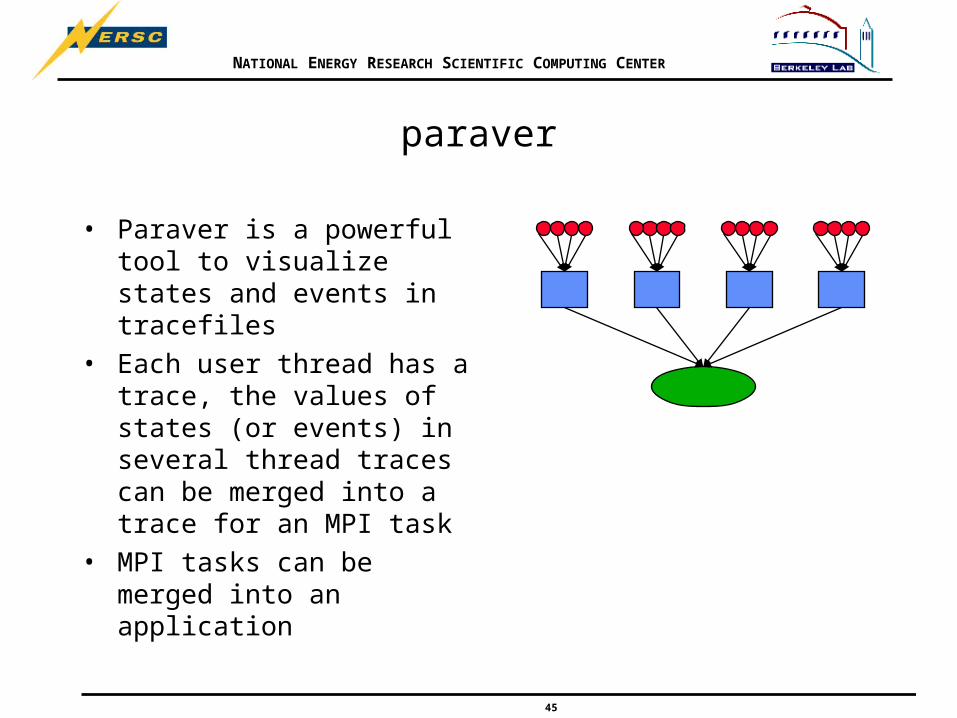
paraver
• Paraver is a powerful tool to visualize states and events in tracefiles
• Each user thread has a trace, the values of states (or events) in several thread traces can be merged into a trace for an MPI task
• MPI tasks can be merged into an application
NATIONAL ENERGY RESEARCH SCIENTIFIC COMPUTING CENTER
46
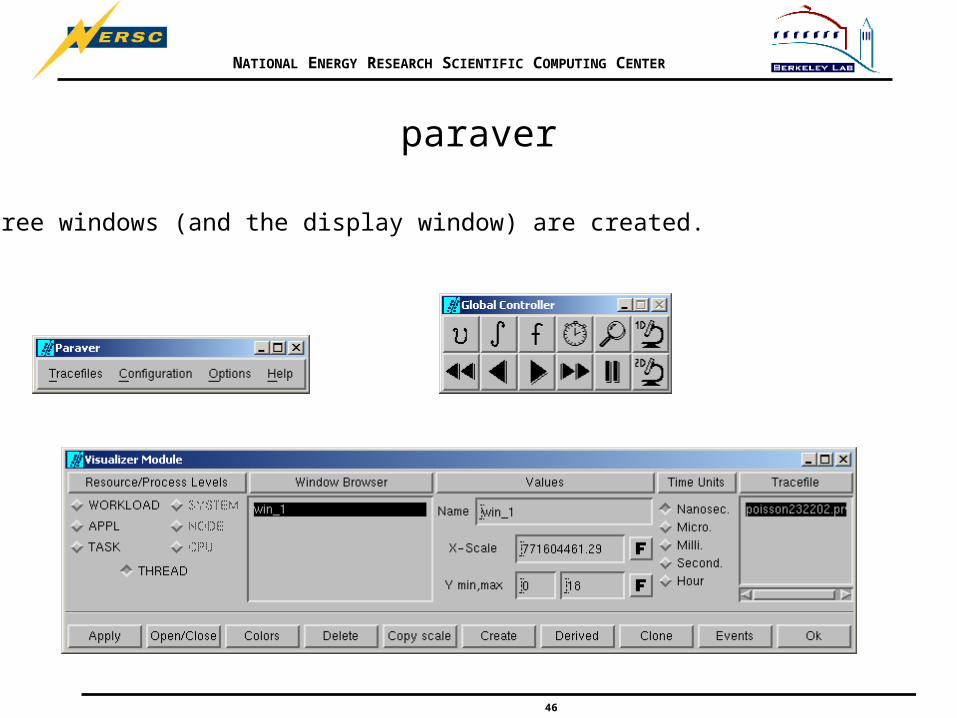
paraver
Three windows (and the display window) are created.
NATIONAL ENERGY RESEARCH SCIENTIFIC COMPUTING CENTER
47
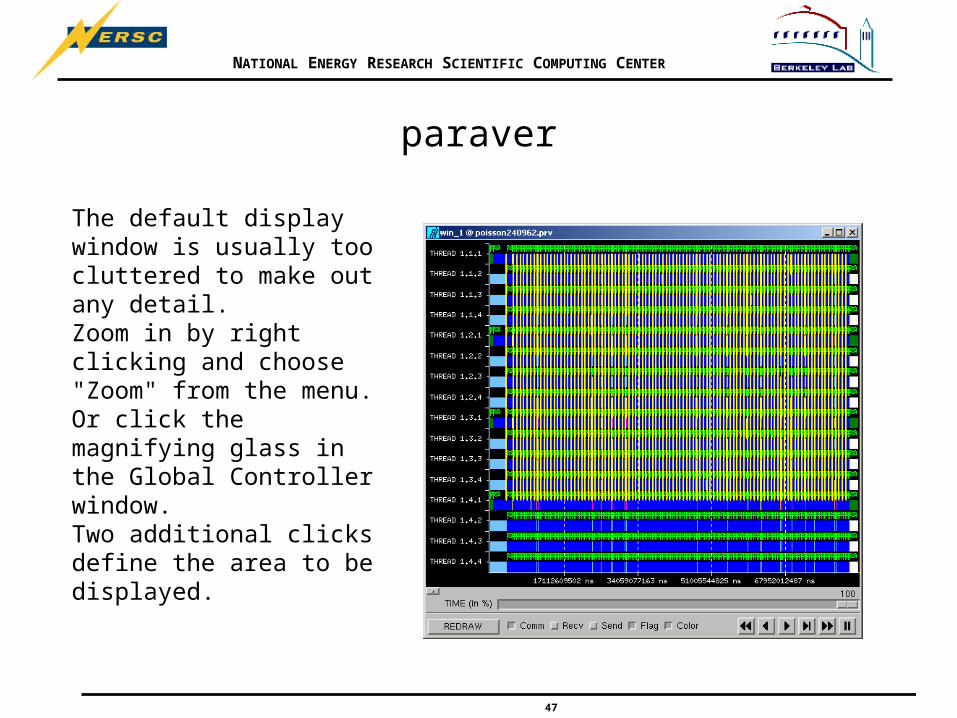
paraver
The default display window is usually too cluttered to make out any detail.Zoom in by right clicking and choose "Zoom" from the menu.Or click the magnifying glass in the Global Controller window.Two additional clicks define the area to be displayed.
NATIONAL ENERGY RESEARCH SCIENTIFIC COMPUTING CENTER
48
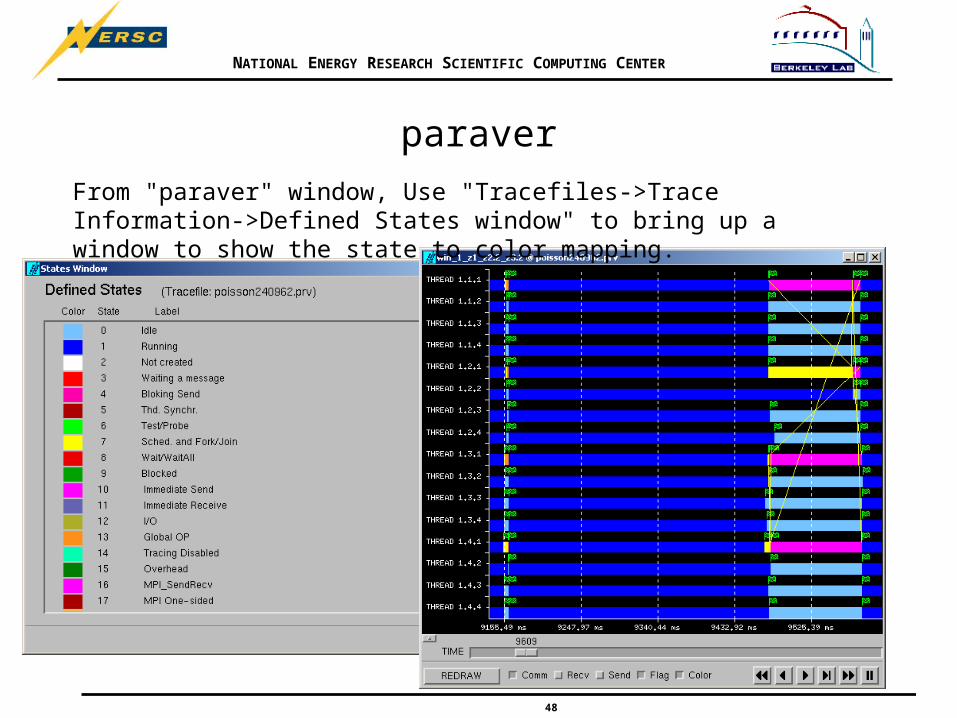
paraver
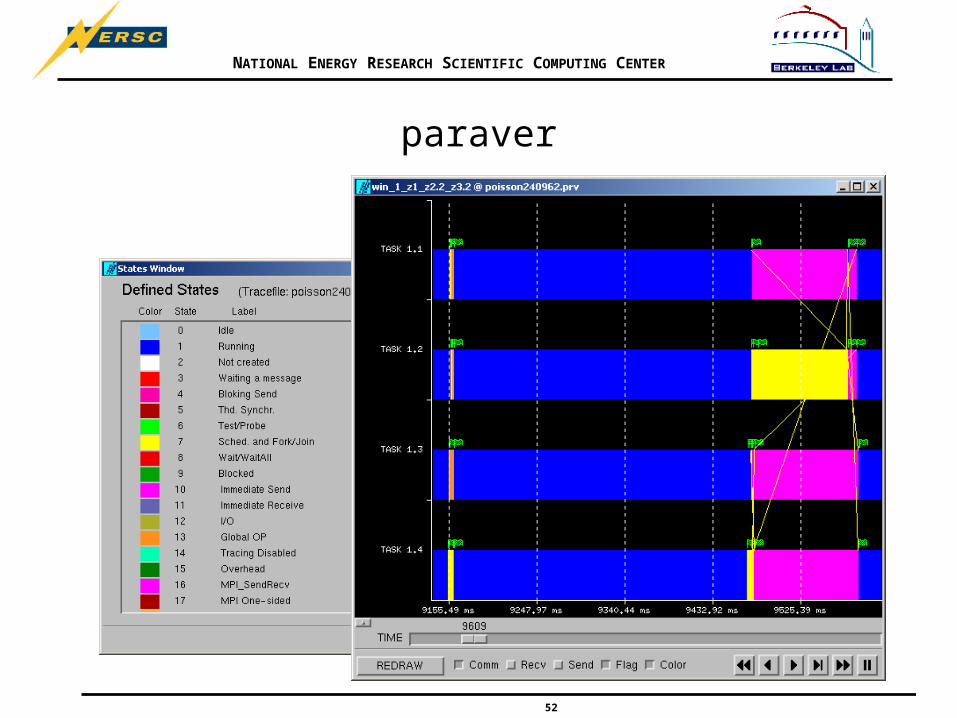
From "paraver" window, Use "Tracefiles->Trace Information->Defined States window" to bring up a window to show the state to color mapping.
NATIONAL ENERGY RESEARCH SCIENTIFIC COMPUTING CENTER
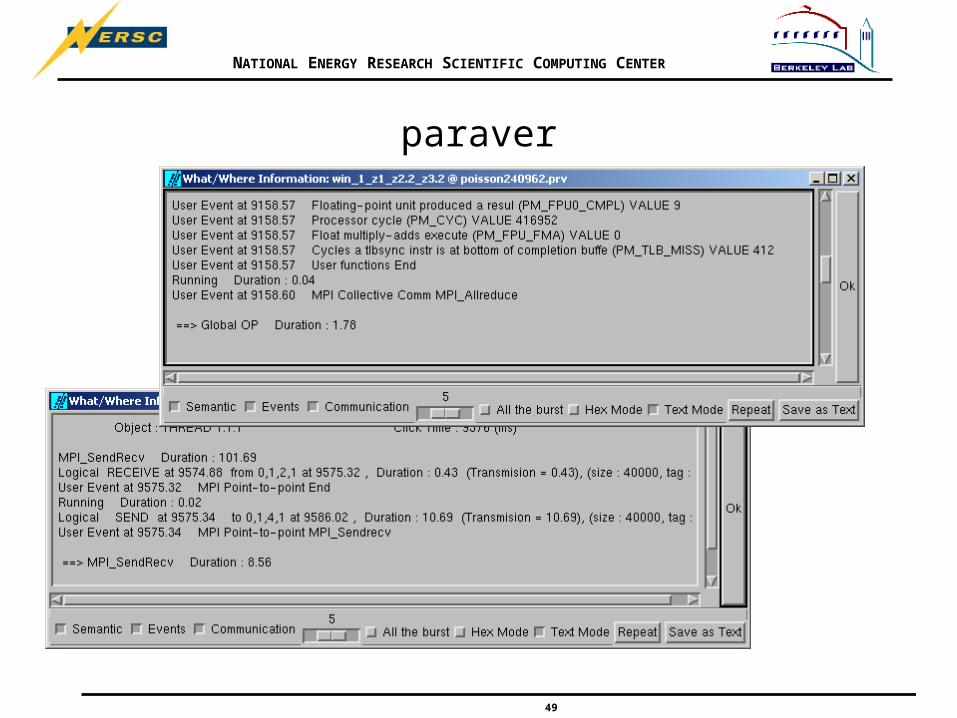
49
paraver
NATIONAL ENERGY RESEARCH SCIENTIFIC COMPUTING CENTER
50
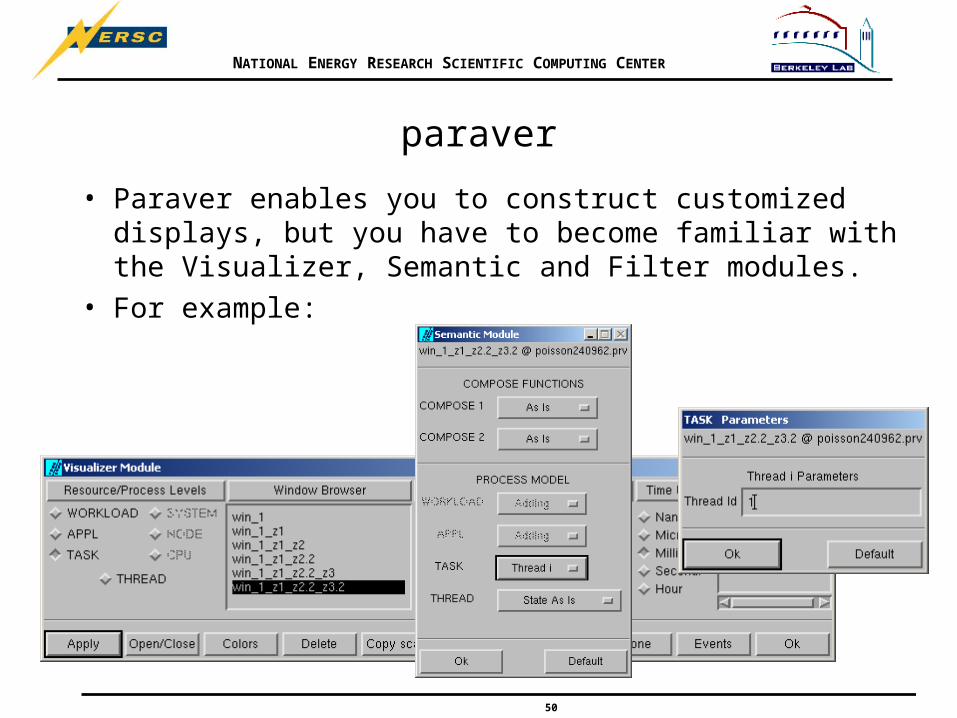
paraver
• Paraver enables you to construct customized displays, but you have to become familiar with the Visualizer, Semantic and Filter modules.
• For example:
NATIONAL ENERGY RESEARCH SCIENTIFIC COMPUTING CENTER
51
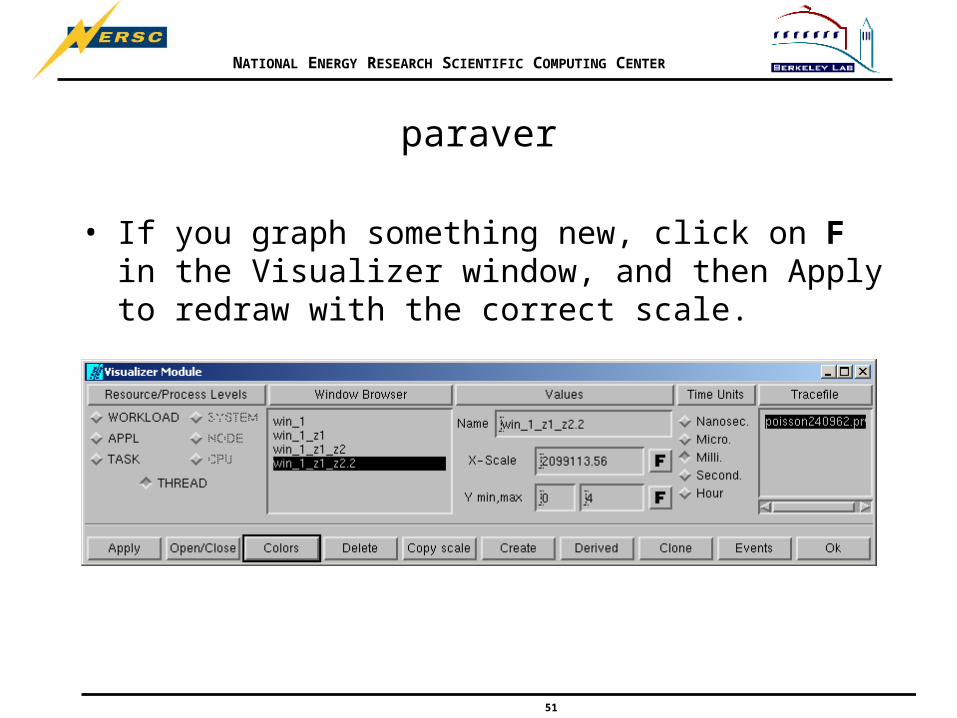
paraver
• If you graph something new, click on F in the Visualizer window, and then Apply to redraw with the correct scale.
NATIONAL ENERGY RESEARCH SCIENTIFIC COMPUTING CENTER
52
paraver
NATIONAL ENERGY RESEARCH SCIENTIFIC COMPUTING CENTER
53
paraver
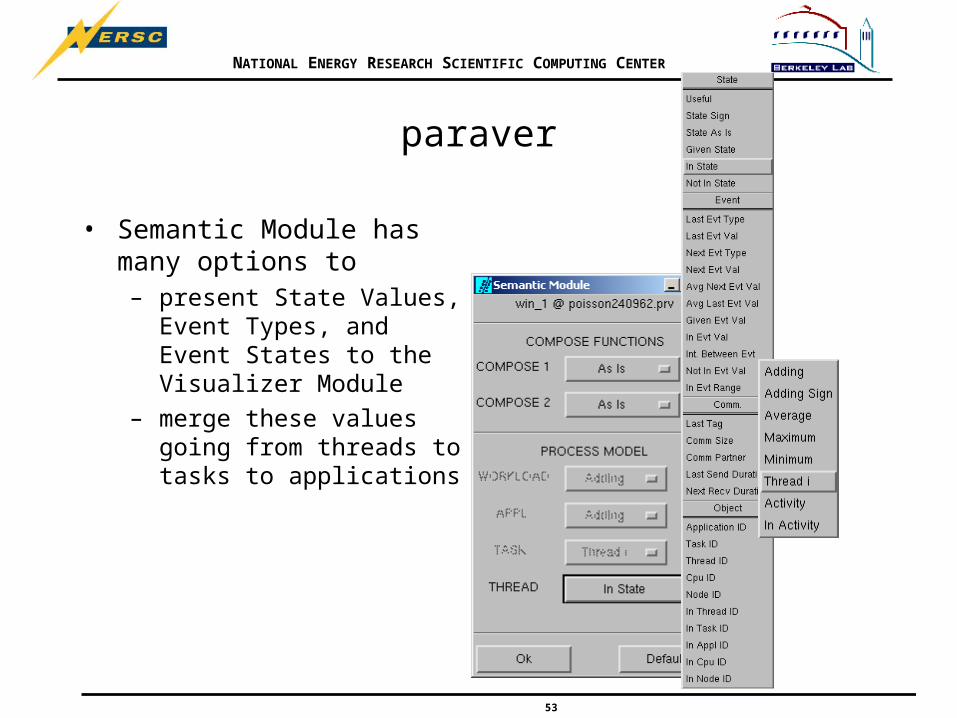
• Semantic Module has many options to – present State Values, Event
Types, and Event States to the Visualizer Module
– merge these values going from threads to tasks to applications
NATIONAL ENERGY RESEARCH SCIENTIFIC COMPUTING CENTER
54
paraver
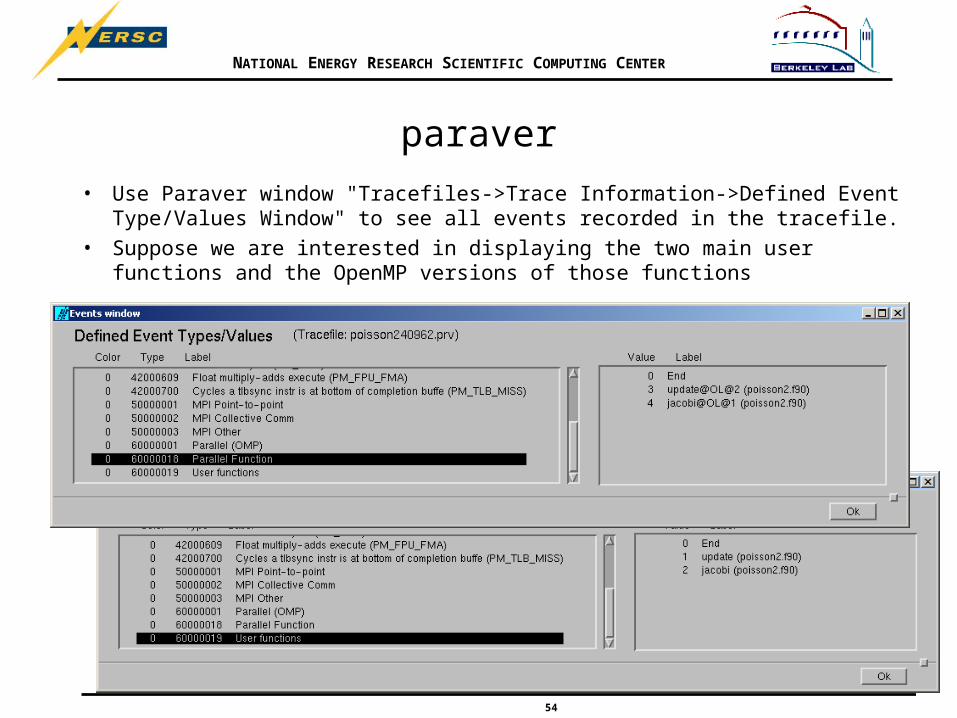
• Use Paraver window "Tracefiles->Trace Information->Defined Event Type/Values Window" to see all events recorded in the tracefile.
• Suppose we are interested in displaying the two main user functions and the OpenMP versions of those functions
NATIONAL ENERGY RESEARCH SCIENTIFIC COMPUTING CENTER
55
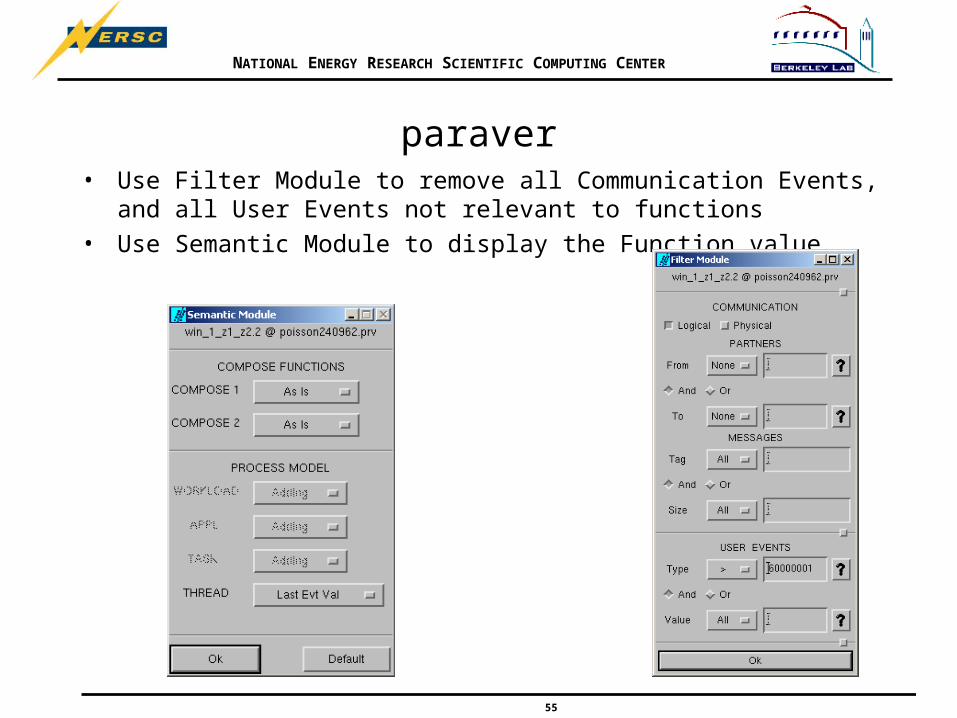
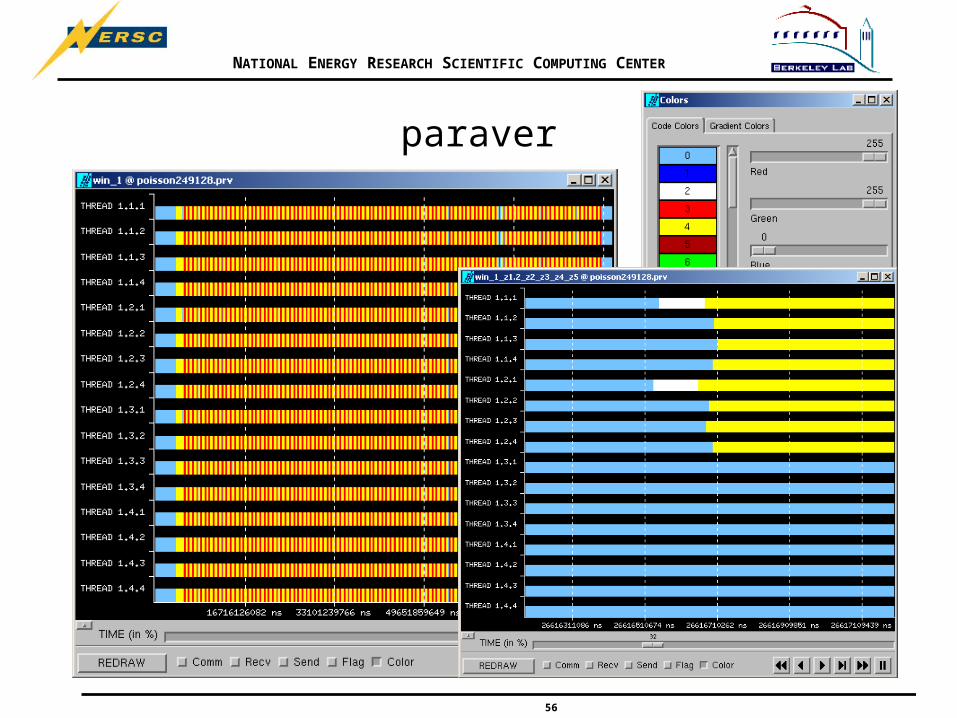
paraver• Use Filter Module to remove all Communication Events, and all User Events not
relevant to functions
• Use Semantic Module to display the Function value
NATIONAL ENERGY RESEARCH SCIENTIFIC COMPUTING CENTER
56
paraver
NATIONAL ENERGY RESEARCH SCIENTIFIC COMPUTING CENTER
57
paraver
• The 1D and 2D Analyzer modules can be used to evaluate statistics on state values and event values.
• The 1D Analyzer evaluates a set of functions applied to the output of the semantic module.
• The 2D Analyzer produces a matrix of values, paraver objects vs. states, events, or event values.
NATIONAL ENERGY RESEARCH SCIENTIFIC COMPUTING CENTER
58
1D Analyzer example:
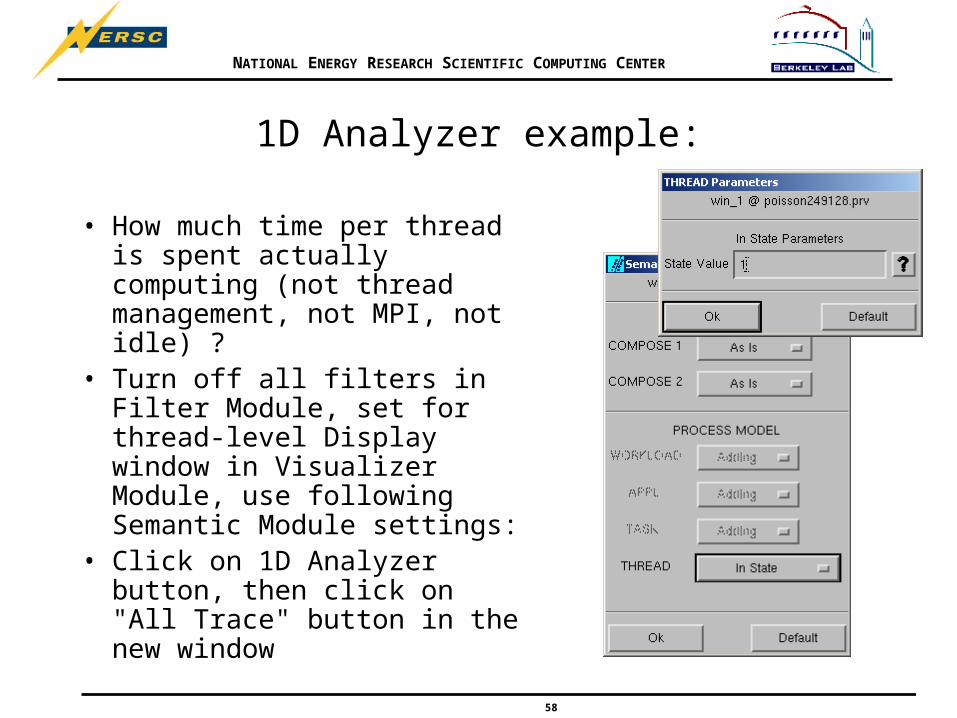
• How much time per thread is spent actually computing (not thread management, not MPI, not idle) ?
• Turn off all filters in Filter Module, set for thread-level Display window in Visualizer Module, use following Semantic Module settings:
• Click on 1D Analyzer button, then click on "All Trace" button in the new window
NATIONAL ENERGY RESEARCH SCIENTIFIC COMPUTING CENTER
59
1D Analyzer
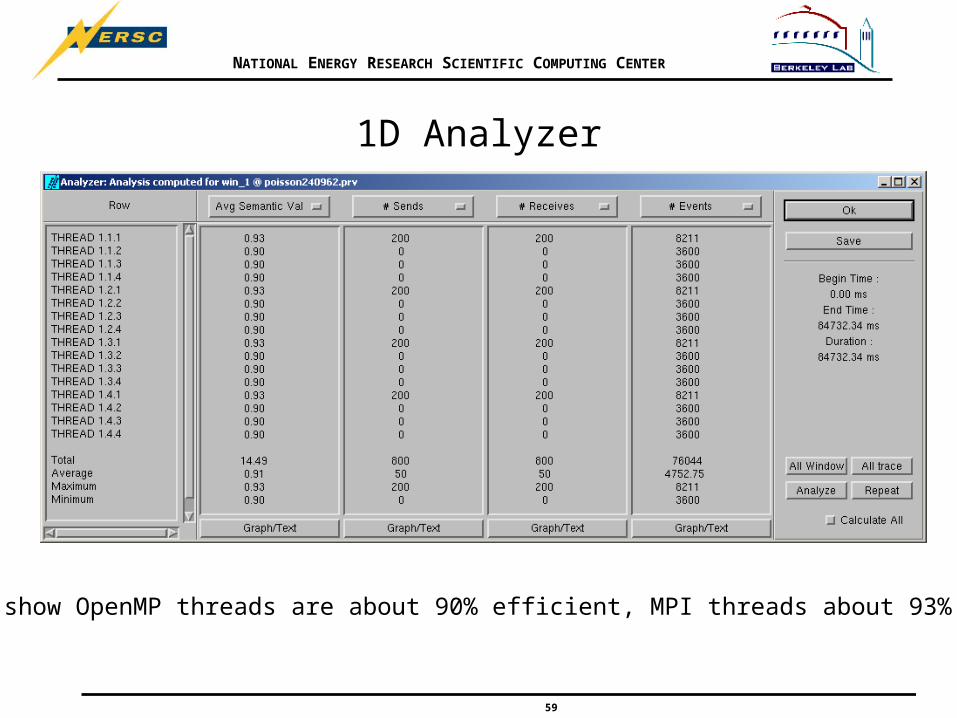
Results show OpenMP threads are about 90% efficient, MPI threads about 93% efficient.
NATIONAL ENERGY RESEARCH SCIENTIFIC COMPUTING CENTER
60
Derived Views
• Power 3 hardware counter values can be visualized over the whole run
• Mflop/s is given approximately by adding the values of the PM_FPU0_CMPL, PM_FPU1_CMPL, PM_FPU_FMA events
• Create three display windows each showing the values of one counter and then add them.

NATIONAL ENERGY RESEARCH SCIENTIFIC COMPUTING CENTER
61
Displaying First Event
• PM_FPU1_CMPL is event 42000135, so filter for this event only
• Choose "Avg Next Evt Val" for the thread Semantic Module
• Computes last value minus first value divided by time multiplied by "Factor"• Units of time are indicated in Visualizer Module
NATIONAL ENERGY RESEARCH SCIENTIFIC COMPUTING CENTER
62
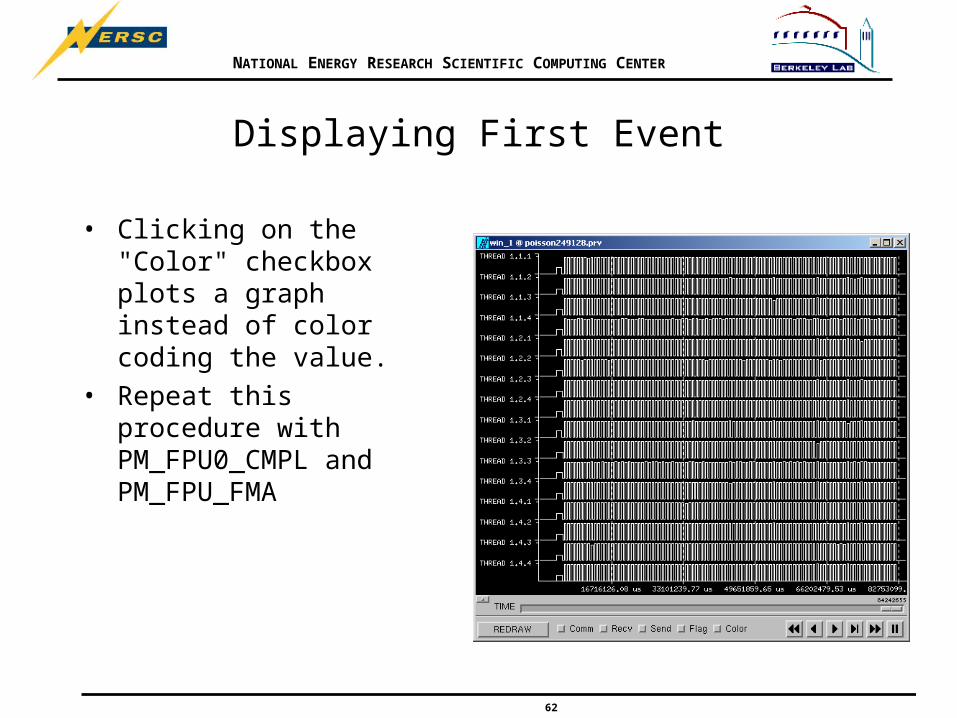
Displaying First Event
• Clicking on the "Color" checkbox plots a graph instead of color coding the value.
• Repeat this procedure with PM_FPU0_CMPL and PM_FPU_FMA
NATIONAL ENERGY RESEARCH SCIENTIFIC COMPUTING CENTER
63
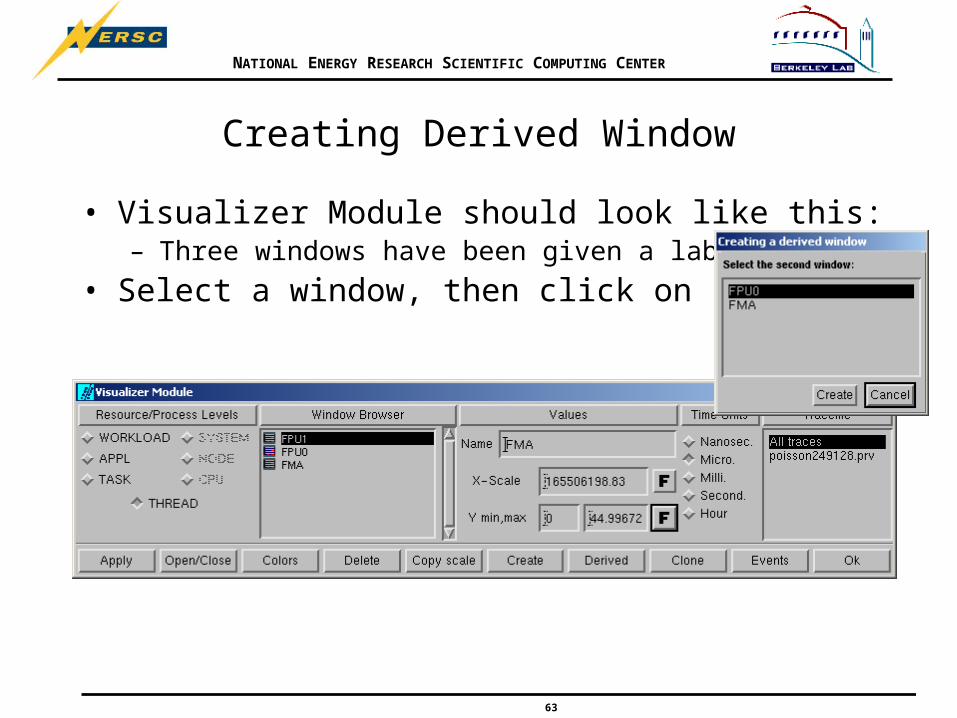
Creating Derived Window
• Visualizer Module should look like this:– Three windows have been given a label
• Select a window, then click on "Derived"
NATIONAL ENERGY RESEARCH SCIENTIFIC COMPUTING CENTER
64
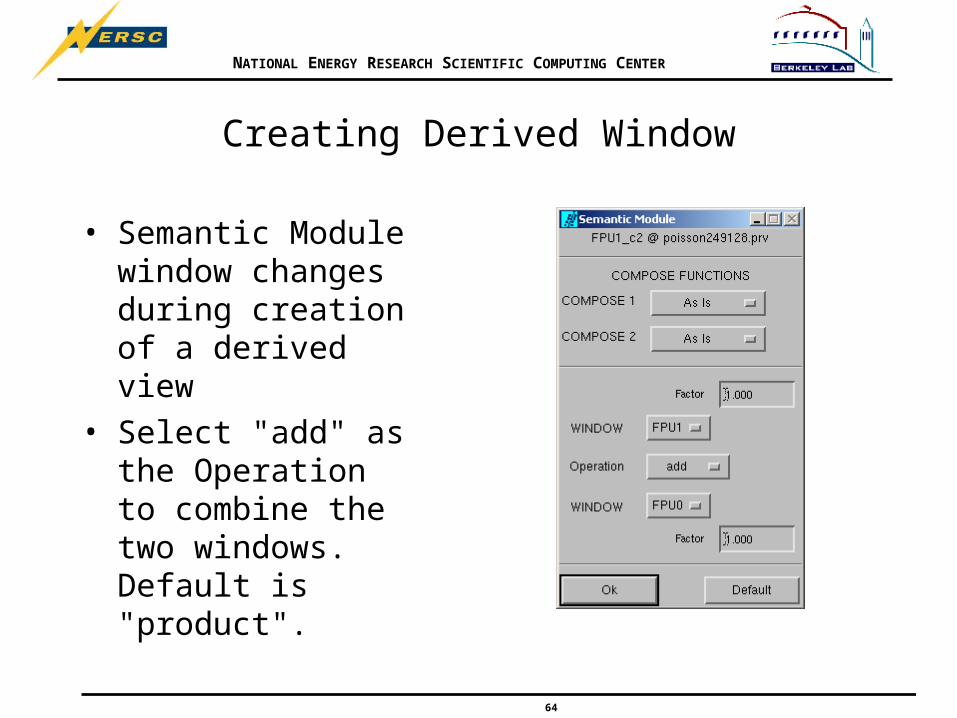
Creating Derived Window
• Semantic Module window changes during creation of a derived view
• Select "add" as the Operation to combine the two windows. Default is "product".

NATIONAL ENERGY RESEARCH SCIENTIFIC COMPUTING CENTER
65
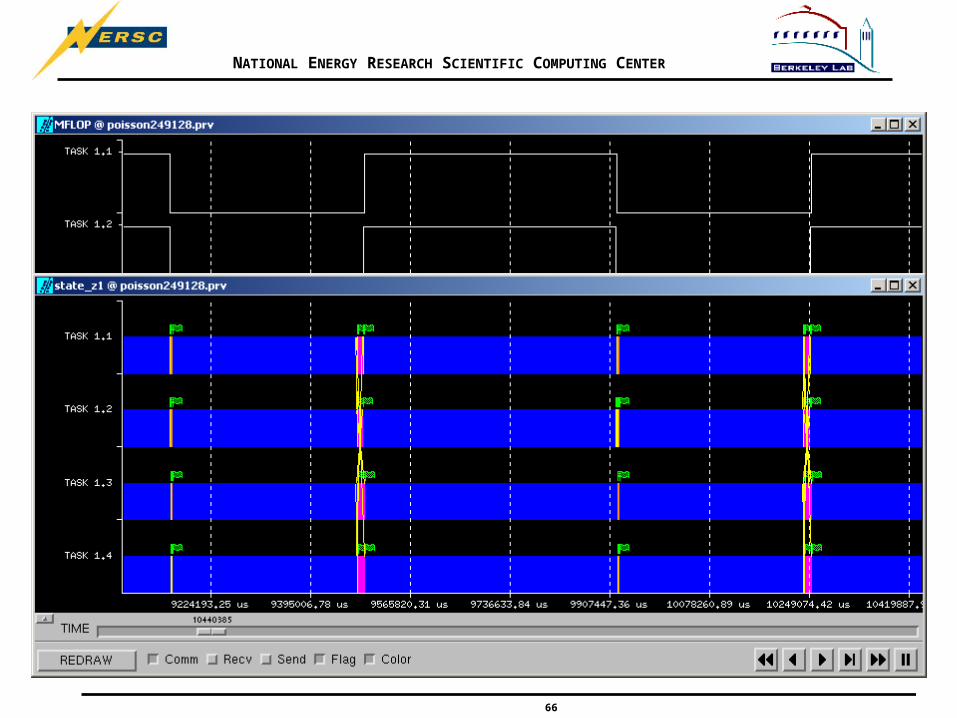
Creating Derived Window
• Add FMA window to FPU0+FPU1 window
NATIONAL ENERGY RESEARCH SCIENTIFIC COMPUTING CENTER
66
NATIONAL ENERGY RESEARCH SCIENTIFIC COMPUTING CENTER
67
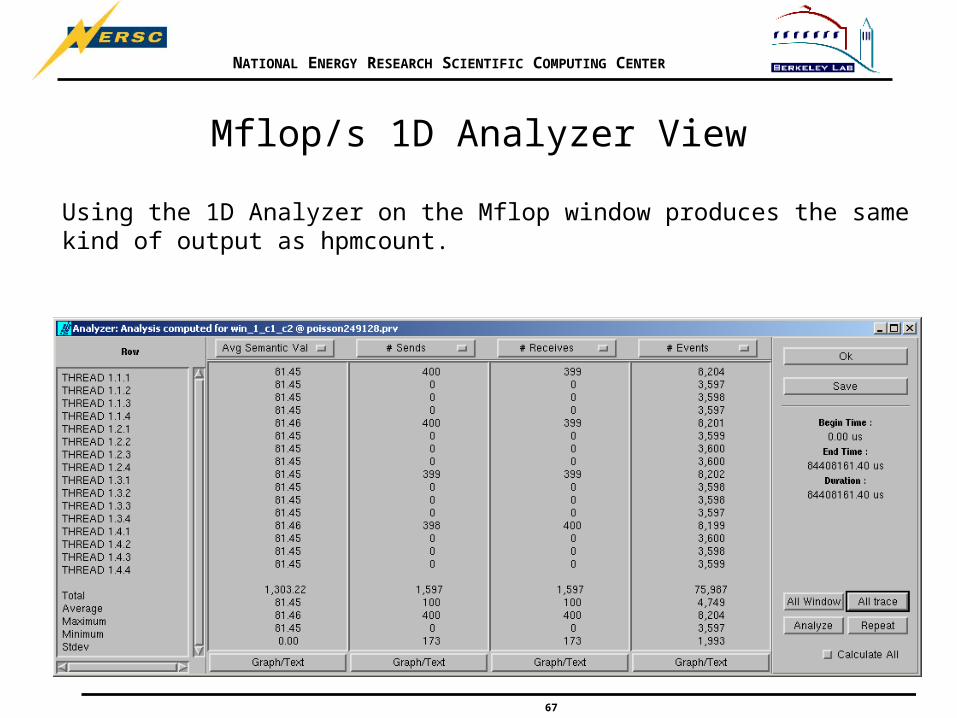
Mflop/s 1D Analyzer View
Using the 1D Analyzer on the Mflop window produces the same kind of output as hpmcount.
NATIONAL ENERGY RESEARCH SCIENTIFIC COMPUTING CENTER
68
Further Reading
• CEPBA Tools– http://www.cepba.upc.es/paraver/index.html
– Not completely updated for IBM SP
NATIONAL ENERGY RESEARCH SCIENTIFIC COMPUTING CENTER
69
おわり