Embed Size (px)
Citation preview
Confidential and proprietary information of N-able, Inc. – Do not distribute or duplicate without N-able’s express written permission.Confidential and proprietary information of N-able, Inc. – Do not distribute or duplicate without N-able’s express written permission.
June 2021
Investor
Presentation
Confidential and proprietary information of N-able, Inc. – Do not distribute or duplicate without N-able’s express written permission.
DisclaimersGeneral This presentation and the accompanying oral presentation do not constitute an offer or invitation for the sale or purchase of securities and has been prepared solely for informational purposes. The information contained in this presentation (the “Presentation”) has been prepared to assist financial analysts in making their own evaluation of N-able, Inc. in connection with publishing independent research reports and for no other purpose. This Presentation is subject to updating, completion, revision, verification and further amendment. None of N-able or its respective affiliates has authorized anyone to provide interested parties with additional or different information. The information contained herein does not purport to be all-inclusive or contain all of the information that may be required to make a full analysis of N-able.
Forward-Looking StatementsThis presentation contains certain forward-looking statements within the meaning of the federal securities law. These forward-looking statements are based on management's beliefs and assumptions and on information currently available to management and involve known and unknown risks, uncertainties and other factors that may cause actual results, performance or achievements to be materially different from any future results, performance or achievements expressed or implied by the forward-looking statements. Forward-looking statements include all statements that are not historical facts and may be identified by terms such as “aim,” “anticipate,” “believe,” “can,” “could,” “seek,” “should,” “feel,” “expect,” “will,” “would,” “plan,” “project,” “intend,” “estimate,” “continue,” or similar expressions and the negatives of those terms. Forward-looking statements involve known and unknown risks, uncertainties and other factors that may cause actual results, performance or achievements to be materially different from any future results, performance or achievements expressed or implied by the forward-looking statements. Factors that could cause or contribute to such differences include, but are not limited to, the following: (a) the risk that the spin-off may not be completed in a timely manner or at all; (b) our ability to defend against and mitigate cyberattacks, such as the cyberattack on SolarWinds Orion Software Platform and internal systems (the “Cyber Incident”), to our IT systems and those of our MSP partners and their SME customers; (c) potential tax liabilities that may arise as a result of the spin-off; (d) our ability to operate as an independent publicly traded company, including compliance with applicable laws and regulations; (d) financial, legal, reputational and other risks to us related to the Cyber Incident, including risks that the incident may result in the loss, compromise or corruption of data, loss of business as a result of termination or non-renewal of agreements or reduced purchases or upgrades of our products, severe reputational damage adversely affecting customer, partner and vendor relationships and investor confidence, increased attrition of personnel and distraction of key and other personnel; (e) the possibility that the global COVID-19 pandemic and the Cyber Incident may adversely affect our business, results of operations and financial condition; (f) any of the following factors either generally or as a result of the impacts of the global COVID-19 pandemic on the global economy or on our business operations and financial condition or on the business operations and financial conditions of our MSP partners and their SME customers: (1) reductions in information technology spending or delays in purchasing decisions by our MSP partners and their SME customers, (2) the inability to sell products to new MSP partners or to sell additional products or upgrades to our existing MSP partners, (3) any decline in our renewal or net revenue retention rates, (4) the inability to generate significant volumes of high quality sales leads from our digital marketing initiatives and convert such leads into new business at acceptable conversion rates, (5) the timing and adoption of new products, product upgrades or pricing model changes by us our competitors, (6) potential foreign exchange gains and losses related to expenses and sales denominated in currencies other than the functional currency of an associated entity, and (7) risks associated with our international operations; (g) the possibility that our operating income could fluctuate and may decline as percentage of revenue as we make further expenditures to support our business or expand our operations; (h) our inability to successfully identify, complete, and integrate acquisitions and manage our growth effectively; (i) our status as a controlled company; (j) Our status as an emerging growth company; and (k) such other risks and uncertainties described more fully in documents filed with or furnished to the Securities and Exchange Commission by us or by SolarWinds Corporation, including the risk factors discussed in our registration statement on Form 10, as filed with the Securities and Exchange Commission on April 6, 2021 and the SolarWinds Annual Report on Form 10-K for the period ended December 31, 2020 filed on March 1, 2021. All information provided in this presentation is as of the date hereof and we undertake no duty to update this information except as required by law.
2

Confidential and proprietary information of N-able, Inc. – Do not distribute or duplicate without N-able’s express written permission.
Disclaimers continued
Non-GAAP Financial MeasuresIn addition to financial information prepared in accordance with generally accepted accounting principles in the United States (“GAAP”), we use certain non-GAAP financial measures to clarify and enhance our understanding, and aid in the period. We believe that these non-GAAP financial measures provide supplemental information that is meaningful when assessing our operating performance because they exclude the impact of certain amounts that our management and board of directors do not consider part of core operating results when assessing our operational performance, allocating resources, preparing annual budgets and determining compensation. The excluded items include the impact of purchase accounting, amortization of acquired intangible assets, stock-based compensation, acquisition and sponsor related costs, restructuring charges, unrealized foreign currency gains (losses) and certain debt-related costs. Please see the appendix at the end of this presentation for a description of these adjustments and a reconciliation of each non-GAAP financial measure to its nearest GAAP equivalent. The non-GAAP measures have limitations, and you should not consider them in isolation or as a substitute for our GAAP financial information.
Presentation of FinancialsThe spin-off of N-able by SolarWinds Corporation is anticipated to be completed towards the beginning of the third quarter of 2021. The Company’s financial statements for the periods prior to the spin-off are presented on a “carve-out” basis. The historical financial information in this presentation we have included does not reflect what our financial condition, results of operations or cash flows would have been had we been a stand-alone entity during the historical periods presented, or what our financial condition, results of operations or cash flows will be in the future as an independent entity. Accordingly, these historical results should not be relied upon as an indicator of our future performance. In addition, our financial projections do not include any costs or liabilities associated with the Cyber Incident.
ConfidentialityThis presentation and the accompanying oral presentation are strictly confidential and is for you to familiarize yourself with the company. All confidential information is subject to the terms of the non-disclosure agreement entered into between the parties and we request that you keep such information we provide at this meeting confidential and that you do not disclose any of the information to any other parties without our prior express written permission.
3
Confidential and proprietary information of N-able, Inc. – Do not distribute or duplicate without N-able’s express written permission.
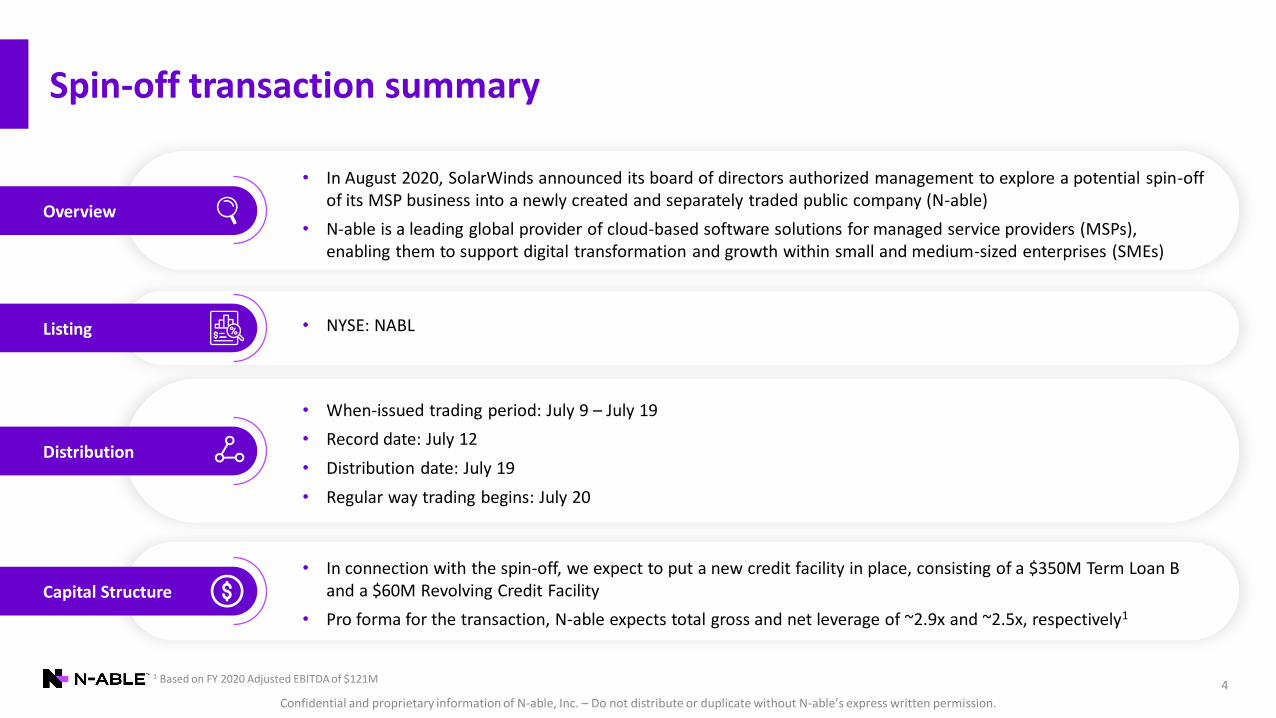
Spin-off transaction summary
Overview
• In August 2020, SolarWinds announced its board of directors authorized management to explore a potential spin-off of its MSP business into a newly created and separately traded public company (N-able)
• N-able is a leading global provider of cloud-based software solutions for managed service providers (MSPs), enabling them to support digital transformation and growth within small and medium-sized enterprises (SMEs)
Listing • NYSE: NABL
Distribution
• When-issued trading period: July 9 – July 19
• Record date: July 12
• Distribution date: July 19
• Regular way trading begins: July 20
Capital Structure
• In connection with the spin-off, we expect to put a new credit facility in place, consisting of a $350M Term Loan B and a $60M Revolving Credit Facility
• Pro forma for the transaction, N-able expects total gross and net leverage of ~2.9x and ~2.5x, respectively1
41 Based on FY 2020 Adjusted EBITDA of $121M

Confidential and proprietary information of N-able, Inc. – Do not distribute or duplicate without N-able’s express written permission.
Spin-off optimizes focus on N-able’s business and value creation
5
Enhanced management and employee focus on strategic initiatives
Creation of standalone, growth-oriented targeting “Rule of 50” company
Targeted investments and capital allocation to maximize for growth
Unique brand identity that resonates with MSP partners

Confidential and proprietary information of N-able, Inc. – Do not distribute or duplicate without N-able’s express written permission.
Company Overview

Confidential and proprietary information of N-able, Inc. – Do not distribute or duplicate without N-able’s express written permission.
Empowering MSPs
through purpose-built technology to enable
and accelerate digital transformation for
small to medium-sized enterprises
7

Confidential and proprietary information of N-able, Inc. – Do not distribute or duplicate without N-able’s express written permission.
N-able at a glance
Note: Metrics represent 2020A financials on a carve-out basis from SolarWinds Corporation unless otherwise noted.Includes Non-GAAP financial measures. See Non-GAAP Reconciliations in Appendix for further details. 8
25K+MSP partners
109%Dollar-based net
retention rate
$303MRevenue
15%YoY Revenue growth
Rule of 50Target
100%Recurring revenue model
>1,400>$50K ARR MSPs
500K+SME customers
87%Non-GAAP Gross margin
Confidential and proprietary information of N-able, Inc. – Do not distribute or duplicate without N-able’s express written permission.
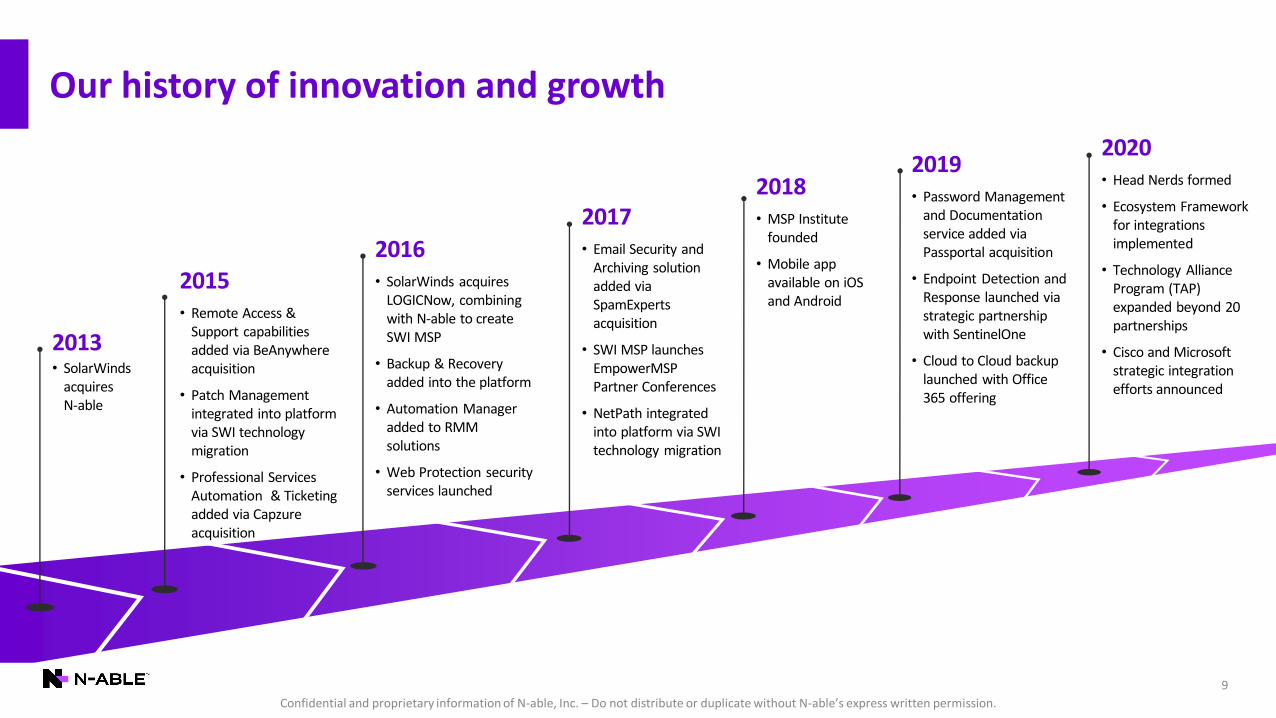
Our history of innovation and growth
9
2013• SolarWinds
acquires N-able
2015• Remote Access &
Support capabilities added via BeAnywhere acquisition
• Patch Management integrated into platform via SWI technology migration
• Professional Services Automation & Ticketing added via Capzure acquisition
2016• SolarWinds acquires
LOGICNow, combining with N-able to create SWI MSP
• Backup & Recovery added into the platform
• Automation Manager added to RMM solutions
• Web Protection security services launched
2017• Email Security and
Archiving solution added via SpamExperts acquisition
• SWI MSP launches EmpowerMSP Partner Conferences
• NetPath integrated into platform via SWI technology migration
2018• MSP Institute
founded
• Mobile app available on iOS and Android
2019• Password Management
and Documentation service added via Passportal acquisition
• Endpoint Detection and Response launched via strategic partnership with SentinelOne
• Cloud to Cloud backup launched with Office 365 offering
2020• Head Nerds formed
• Ecosystem Framework for integrations implemented
• Technology Alliance Program (TAP) expanded beyond 20 partnerships
• Cisco and Microsoft strategic integration efforts announced
Confidential and proprietary information of N-able, Inc. – Do not distribute or duplicate without N-able’s express written permission.
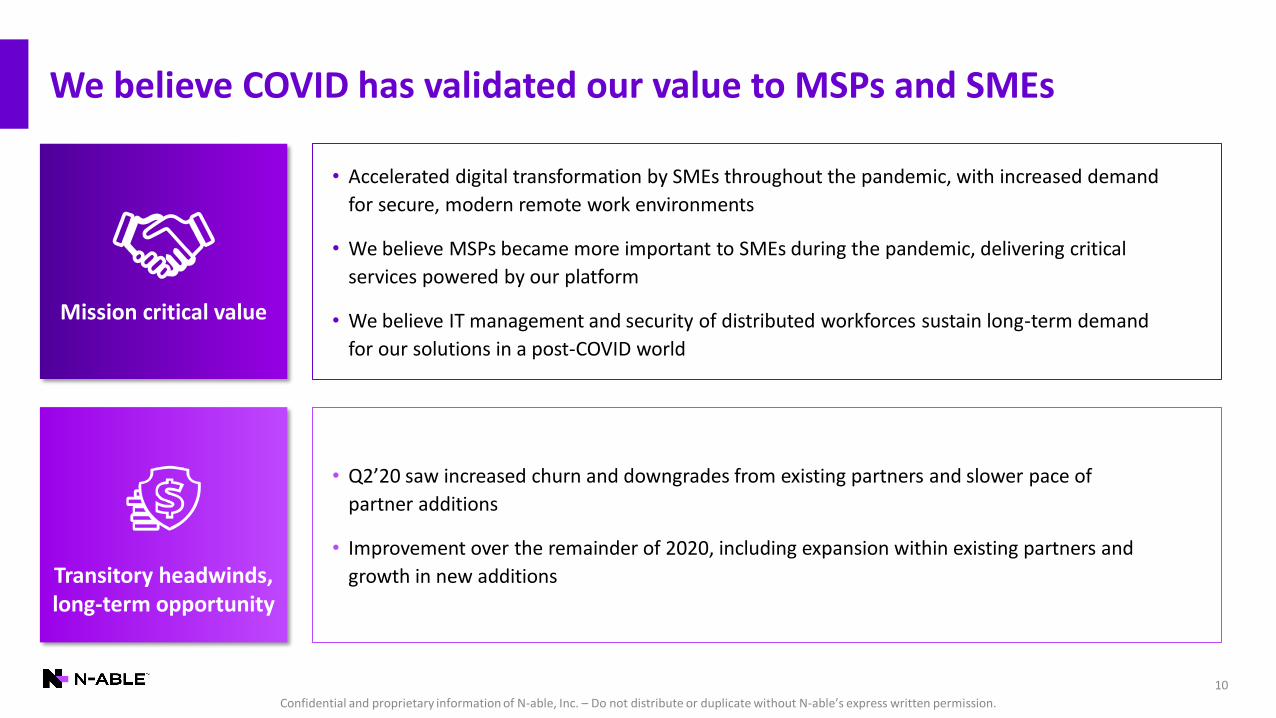
We believe COVID has validated our value to MSPs and SMEs
10
Mission critical value
Transitory headwinds, long-term opportunity
• Accelerated digital transformation by SMEs throughout the pandemic, with increased demand
for secure, modern remote work environments
• We believe MSPs became more important to SMEs during the pandemic, delivering critical
services powered by our platform
• We believe IT management and security of distributed workforces sustain long-term demand
for our solutions in a post-COVID world
• Q2’20 saw increased churn and downgrades from existing partners and slower pace of
partner additions
• Improvement over the remainder of 2020, including expansion within existing partners and
growth in new additions

Confidential and proprietary information of N-able, Inc. – Do not distribute or duplicate without N-able’s express written permission.
Update on cyber incident
11
• On 12/14/20, SolarWinds announced that it had been the victim of a cyberattack on its Orion Software Platform and internal systems (the “Cyber Incident”)
• Based on investigations to date:
• Malicious code known as Sunburst was injected into builds of SolarWinds’ Orion Software Platform released between March and June 2020, which if present and activated, could potentially allow an attacker to compromise the server on which the Orion Software Platform was installed
• SolarWinds has not identified Sunburst in any of its more than 70 non-Orion products and tools, including, as previously disclosed, any of our N-able solutions
• The threat actor compromised credentials and conducted research and surveillance through persistent access to the SolarWinds software development environment and internal systems, including its Office 365 environment, for at least nine months prior to initiating a test run of its ability to inject code into builds of the Orion Software Platform in October 2019
• During this entire period, we were a part of the SolarWinds’ shared environment and the threat actor had persistent access to our systems and Office 365 environment
• The threat actor created and moved files that we believe contained source code for our products and that may have contained data about our MSP partners and data relating to trial and product activation of our N-central On Demand solution
• The threat actor accessed the email accounts of certain of our personnel, some of which contained information related to current or former employees and MSP partners
• We believe the cyber incident has had an adverse impact on our reputation, new subscription sales and net retention rates, including in the first quarter of 2021, but we expect such impacts to diminish over time in the absence of new discoveries or events
Confidential and proprietary information of N-able, Inc. – Do not distribute or duplicate without N-able’s express written permission.
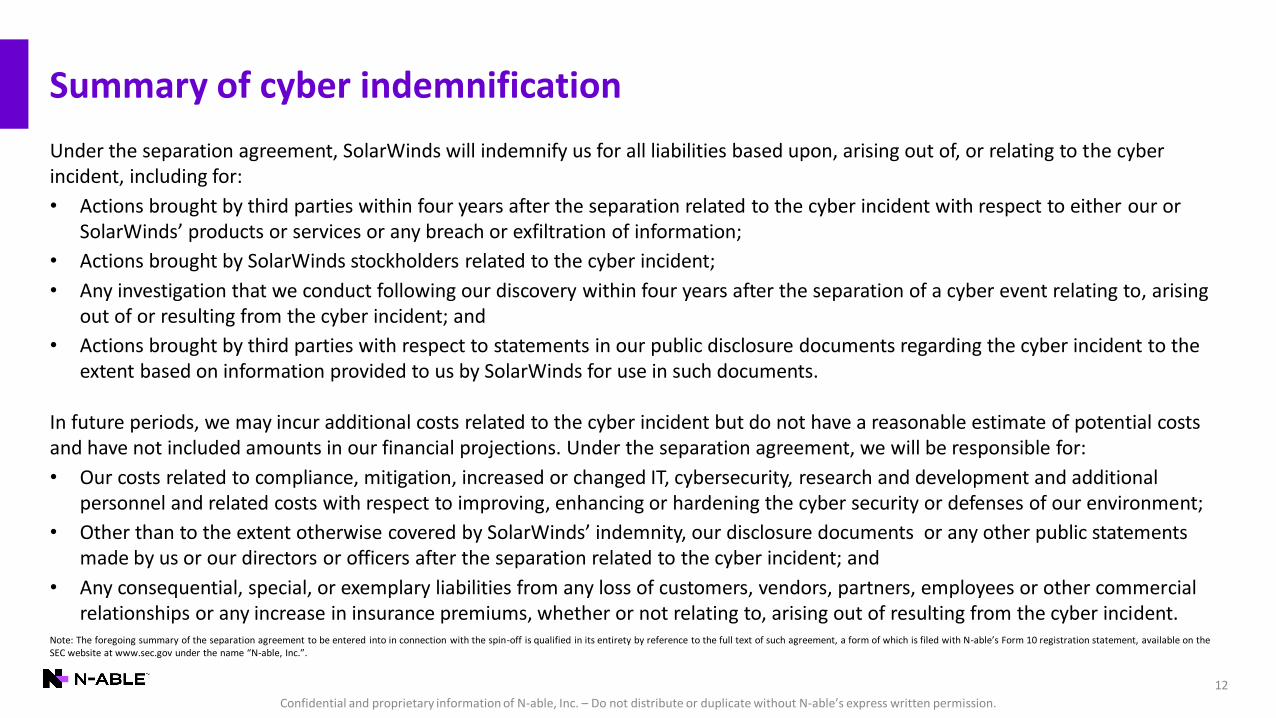
Summary of cyber indemnification
12
Under the separation agreement, SolarWinds will indemnify us for all liabilities based upon, arising out of, or relating to the cyber incident, including for:
• Actions brought by third parties within four years after the separation related to the cyber incident with respect to either our or SolarWinds’ products or services or any breach or exfiltration of information;
• Actions brought by SolarWinds stockholders related to the cyber incident;
• Any investigation that we conduct following our discovery within four years after the separation of a cyber event relating to, arising out of or resulting from the cyber incident; and
• Actions brought by third parties with respect to statements in our public disclosure documents regarding the cyber incident to the extent based on information provided to us by SolarWinds for use in such documents.
In future periods, we may incur additional costs related to the cyber incident but do not have a reasonable estimate of potential costs and have not included amounts in our financial projections. Under the separation agreement, we will be responsible for:
• Our costs related to compliance, mitigation, increased or changed IT, cybersecurity, research and development and additional personnel and related costs with respect to improving, enhancing or hardening the cyber security or defenses of our environment;
• Other than to the extent otherwise covered by SolarWinds’ indemnity, our disclosure documents or any other public statementsmade by us or our directors or officers after the separation related to the cyber incident; and
• Any consequential, special, or exemplary liabilities from any loss of customers, vendors, partners, employees or other commercial relationships or any increase in insurance premiums, whether or not relating to, arising out of resulting from the cyber incident.
Note: The foregoing summary of the separation agreement to be entered into in connection with the spin-off is qualified in its entirety by reference to the full text of such agreement, a form of which is filed with N-able’s Form 10 registration statement, available on the SEC website at www.sec.gov under the name “N-able, Inc.”.

Confidential and proprietary information of N-able, Inc. – Do not distribute or duplicate without N-able’s express written permission.
13
Digital transformation is a priority for SMEs
1 IDC FutureScape: Worldwide SMB 2019 Predictions
of SMEs will have digital transformation as a key
part of their IT strategies by end of 2023167%
Cloud /Hybrid IT
Security Distributed workforce
Digital-first,Always-on
Confidential and proprietary information of N-able, Inc. – Do not distribute or duplicate without N-able’s express written permission.
14
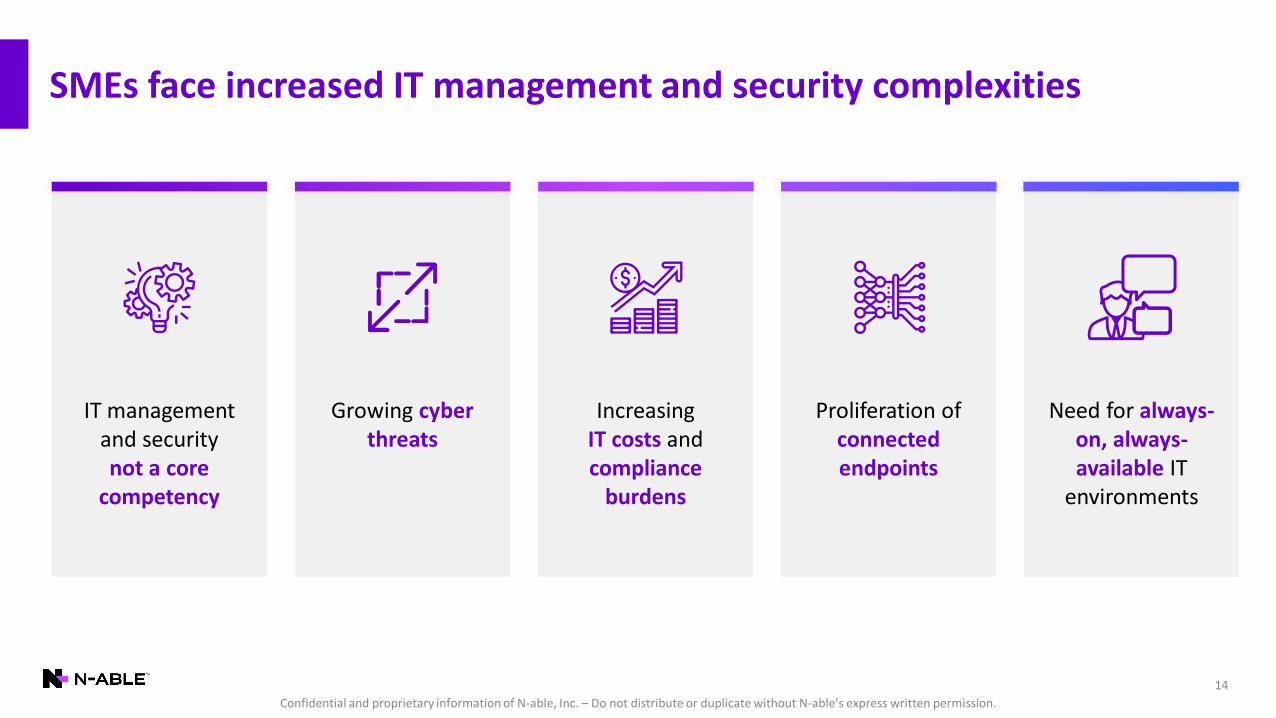
SMEs face increased IT management and security complexities
IT management and security not a core
competency
Growing cyber threats
IncreasingIT costs and compliance
burdens
Proliferation of connected endpoints
Need for always-on, always-available IT
environments

Confidential and proprietary information of N-able, Inc. – Do not distribute or duplicate without N-able’s express written permission.
SMEs face vendor and channel sprawl for IT needs
15
SME ITneeds
Value-add resellersSystems integrators
IT consultants
Independent software vendors
SaaS application vendors
Print / copy vendors
MSSPs
Cloud service providers
Telcos

Confidential and proprietary information of N-able, Inc. – Do not distribute or duplicate without N-able’s express written permission.
MSPs
SMEs are increasingly relying on MSPs for proactive and recurring IT services
16
Rise of the managed IT services model…
Enable SMEs’ digital transformation / cloud journey
Trusted security provider
Single source for SMEs’IT needs
Address growing ITcomplexity and risk
Confidential and proprietary information of N-able, Inc. – Do not distribute or duplicate without N-able’s express written permission.
17
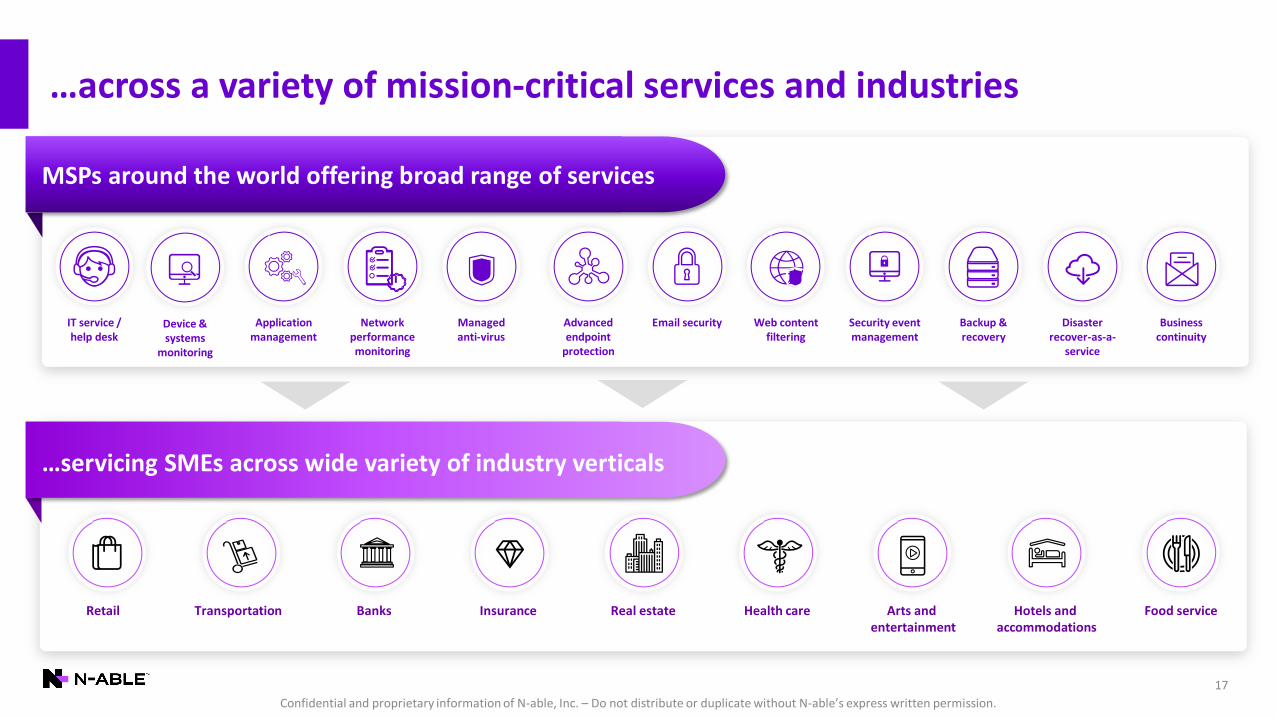
…across a variety of mission-critical services and industries
MSPs around the world offering broad range of services
IT service /help desk
Application management
…servicing SMEs across wide variety of industry verticals
Network performance monitoring
Managed anti-virus
Advanced endpoint
protection
Web content filtering
Backup & recovery
Business continuity
Retail Transportation Banks Insurance Real estate Health care Arts andentertainment
Hotels and accommodations
Food service
Email security Security event management
Disaster recover-as-a-
service
Device & systems
monitoring
!

Confidential and proprietary information of N-able, Inc. – Do not distribute or duplicate without N-able’s express written permission.
1 Gartner “Small and Midsize Business IT Spending, Worldwide, 2018-2024,” 18 February, 2021Note: Global SME IT Managed Services Spend and N-able TAM estimates based on Frost & Sullivan “Total Addressable Market for SMB IT Managed Service Providers,” February 2021 18
Large and attractive market opportunity
20252020MSPs prefer purpose-built solutions that both address disparate SME customers’ needs
and improve their own operational efficiency
$253BGlobal SME IT
Managed Services Spend$133B
Global SME ITManaged Services
Spend
$44BN-able TAM$23B
N-able TAM
SME IT spending reached~$1.2T in 20201
SMEs increasingly reliant onMSPs for all IT needs
MSPs have many IT vendors to choose from
Confidential and proprietary information of N-able, Inc. – Do not distribute or duplicate without N-able’s express written permission.
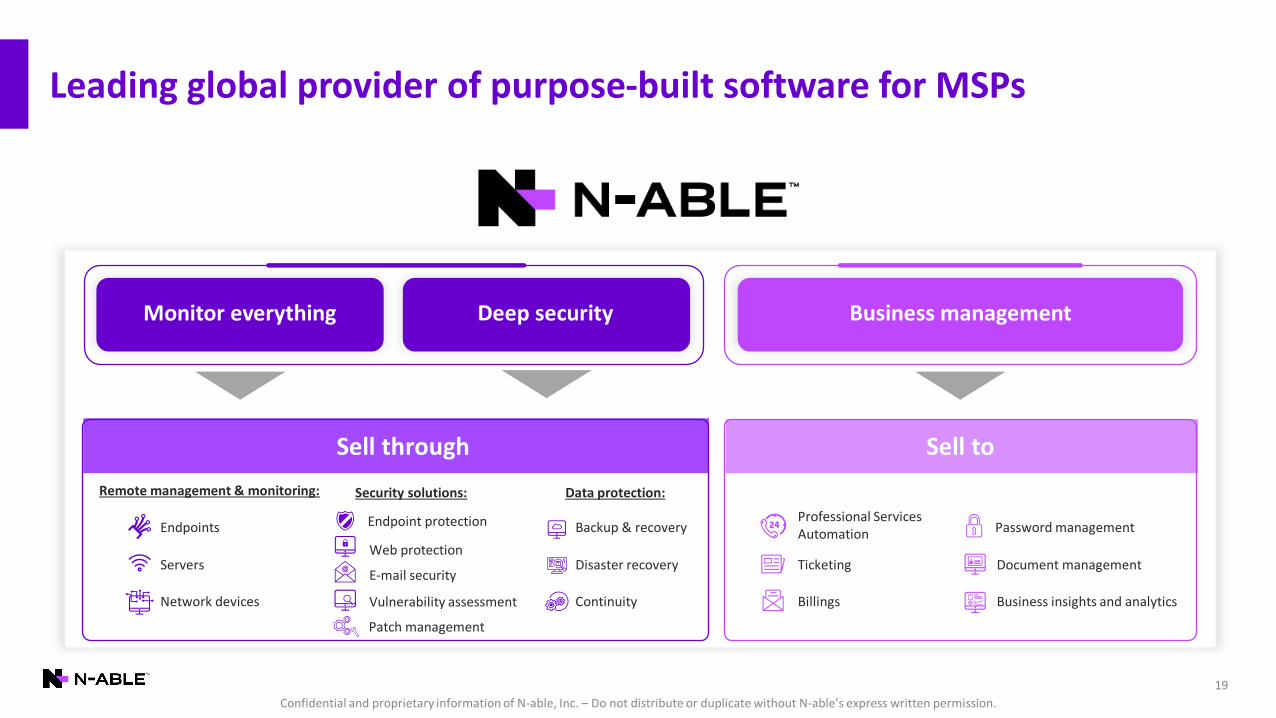
Leading global provider of purpose-built software for MSPs
19
Business management
Sell through Sell to
Data protection:
Backup & recovery
Disaster recovery
Continuity
Remote management & monitoring:
Endpoints
Servers
Network devices
Professional ServicesAutomation
Ticketing
Billings
Security solutions:
Endpoint protection
Web protection
E-mail security
Vulnerability assessment
Password management
Document management
Business insights and analytics
Monitor everything Deep security
Patch management
Confidential and proprietary information of N-able, Inc. – Do not distribute or duplicate without N-able’s express written permission.
20
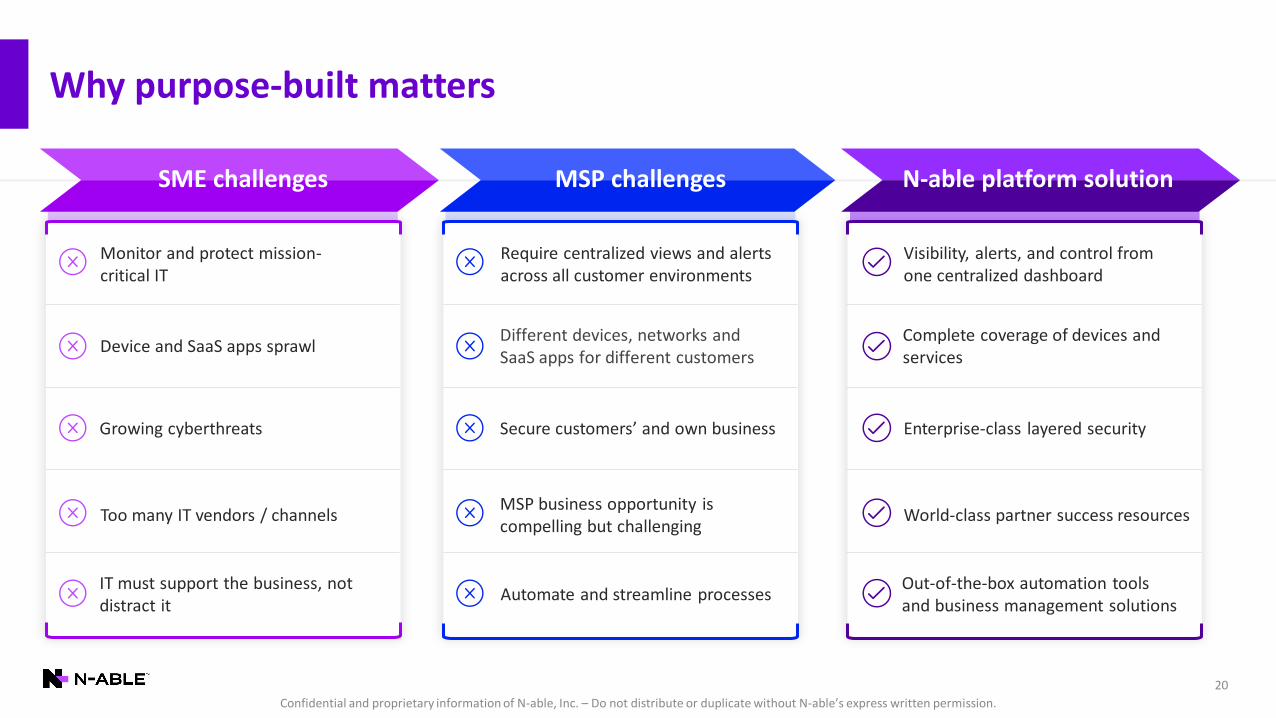
Why purpose-built matters
Visibility, alerts, and control from one centralized dashboard
Require centralized views and alerts across all customer environments
Enterprise-class layered securitySecure customers’ and own business
World-class partner success resourcesMSP business opportunity is compelling but challenging
Different devices, networks and SaaS apps for different customers
Automate and streamline processes
Complete coverage of devices and services
Out-of-the-box automation tools and business management solutions
Device and SaaS apps sprawl
Monitor and protect mission-critical IT
Growing cyberthreats
IT must support the business, not distract it
Too many IT vendors / channels
SME challenges MSP challenges N-able platform solution

Confidential and proprietary information of N-able, Inc. – Do not distribute or duplicate without N-able’s express written permission.
21
Why we win: Breadth and depth of platform
MonitorEverything
LayeredSecurity
PartnerSuccess
Confidential and proprietary information of N-able, Inc. – Do not distribute or duplicate without N-able’s express written permission.
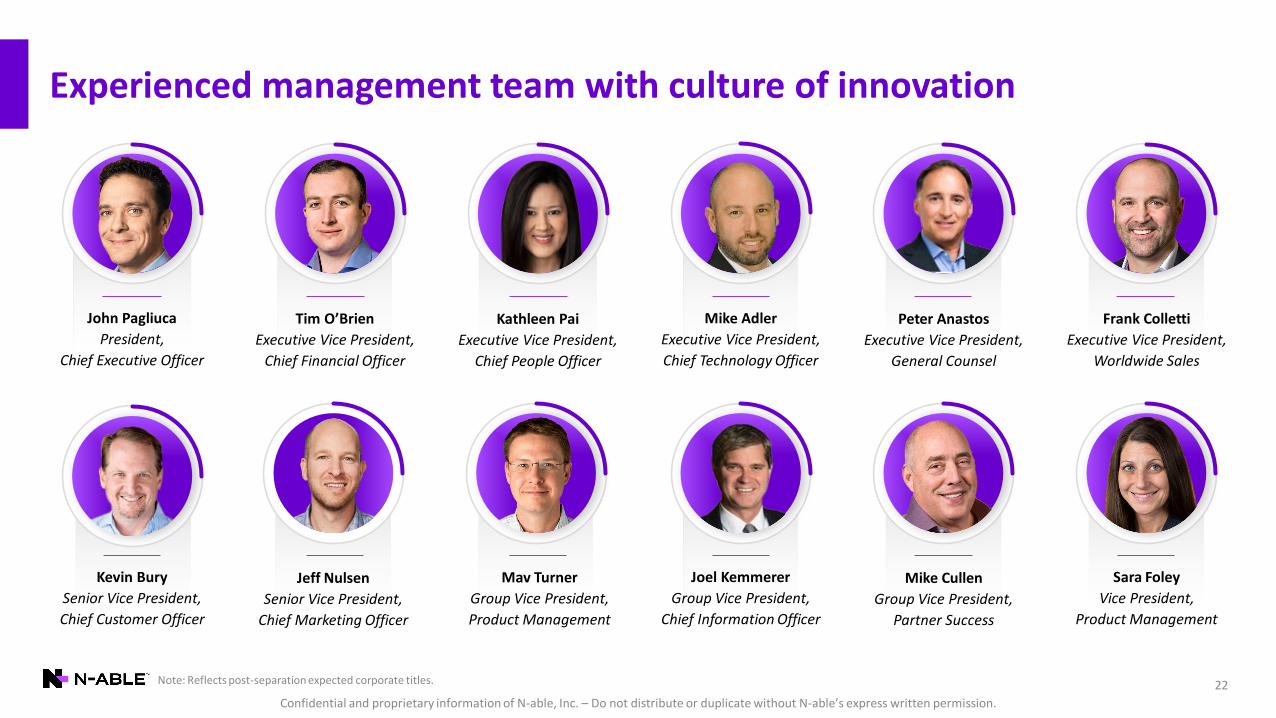
Experienced management team with culture of innovation
22Note: Reflects post-separation expected corporate titles.
Mike Cullen
Group Vice President,
Partner Success
Mav Turner
Group Vice President,
Product Management
Jeff Nulsen
Senior Vice President,
Chief Marketing Officer
Sara Foley
Vice President,
Product Management
Joel Kemmerer
Group Vice President,
Chief Information Officer
Kevin Bury
Senior Vice President,
Chief Customer Officer
Tim O’Brien
Executive Vice President,
Chief Financial Officer
Mike Adler
Executive Vice President,
Chief Technology Officer
Frank Colletti
Executive Vice President,
Worldwide Sales
Peter Anastos
Executive Vice President,
General Counsel
John Pagliuca
President,
Chief Executive Officer
Kathleen Pai
Executive Vice President,
Chief People Officer
Confidential and proprietary information of N-able, Inc. – Do not distribute or duplicate without N-able’s express written permission.
Platform & Technology Overview
Confidential and proprietary information of N-able, Inc. – Do not distribute or duplicate without N-able’s express written permission.
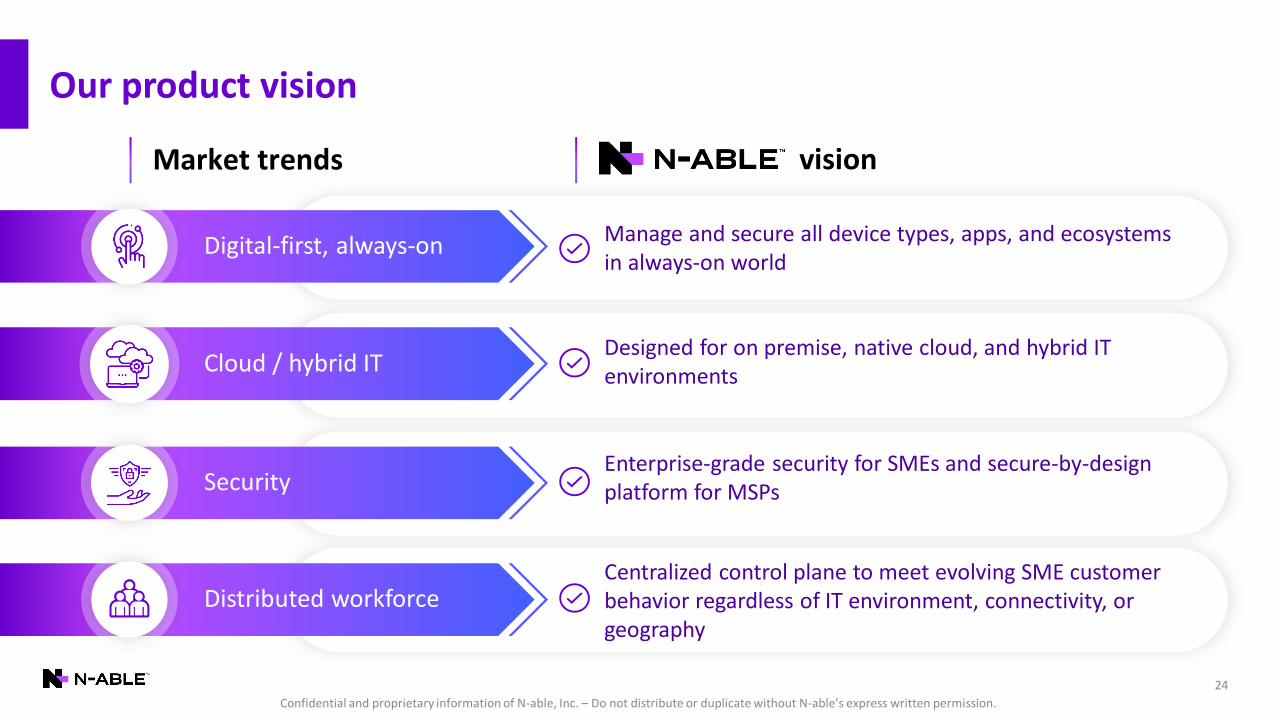
Our product vision
24
Market trends
Digital-first, always-on
Cloud / hybrid IT
Security
Distributed workforce
Manage and secure all device types, apps, and ecosystems in always-on world
Designed for on premise, native cloud, and hybrid IT environments
Enterprise-grade security for SMEs and secure-by-design platform for MSPs
Centralized control plane to meet evolving SME customer behavior regardless of IT environment, connectivity, or geography
vision

Confidential and proprietary information of N-able, Inc. – Do not distribute or duplicate without N-able’s express written permission.
25
N-able’s platform and solutions
Architectural Features
SaaS Self-managedBackup, Recovery
& Disaster RecoveryEndpoint
ProtectionPatch
ManagementWeb Protection
& Content FilteringMail Protection and Archiving
RiskIntelligence
Remote Monitoring& Management
Security and Data Protection
ProfessionalServices
Automation
Password &Documentation Management
Desktop Management
Business Management
Unified Agents ExtensibilityMulti-tenant Secure Design Automation

Confidential and proprietary information of N-able, Inc. – Do not distribute or duplicate without N-able’s express written permission.
26
We win because of how we are architected
Architectural Features
Unified Agents ExtensibilityMulti-tenant Secure Design Automation
SaaS Self-managedBackup, Recovery
& Disaster RecoveryEndpoint
ProtectionPatch
ManagementWeb Protection
& Content FilteringMail Protection and Archiving
RiskIntelligence
Remote Monitoring& Management
Security and Data Protection
Password &Documentation Management
Desktop Management
Business Management
ProfessionalServices
Automation
Key Architectural Design Elements
Multi-tier, multi-tenancy Unified agent management ExtensibilitySecure design Automation
Manage complex and heterogenous customer IT environments across on prem, cloud, and hybrid
MSPs can seamlessly deploy new solutions, features, and updates to customers
Rapid integration with many third-party solutions, giving partners choice and customized experiences
Secure Software Development Lifecycle is a continuously improving process
100+ out-of-the-box policies to automate common tasks and resolution of frequently occurring issues

Confidential and proprietary information of N-able, Inc. – Do not distribute or duplicate without N-able’s express written permission.
27
• Enhanced endpoint protection and threat detection solutions
• MFA everywhere
• Tighter privileged access
• Bolstered security team
• Enhanced threat modeling
• New, highly secure build systems
• Separation of duties
• Improved monitoring and ongoing static code analysis
• Expanded vulnerability management
• Increased pen testing and red teams
• Improved incident response process
• Reassess security backlog
Further secureinternal
environment
Enhancedevelopmentenvironment
Ensure securityand integrity of
our solutions
Secure by Design Elements
To date, have not identified Sunburst in any N-able
solutions
MSP partners depend on us not only for security solutions, but also expect secure architecture
Increased security, monitoring, and authentication of our
solutions
Cyber AttackConsiderations
Secure architectural design
Confidential and proprietary information of N-able, Inc. – Do not distribute or duplicate without N-able’s express written permission.
28
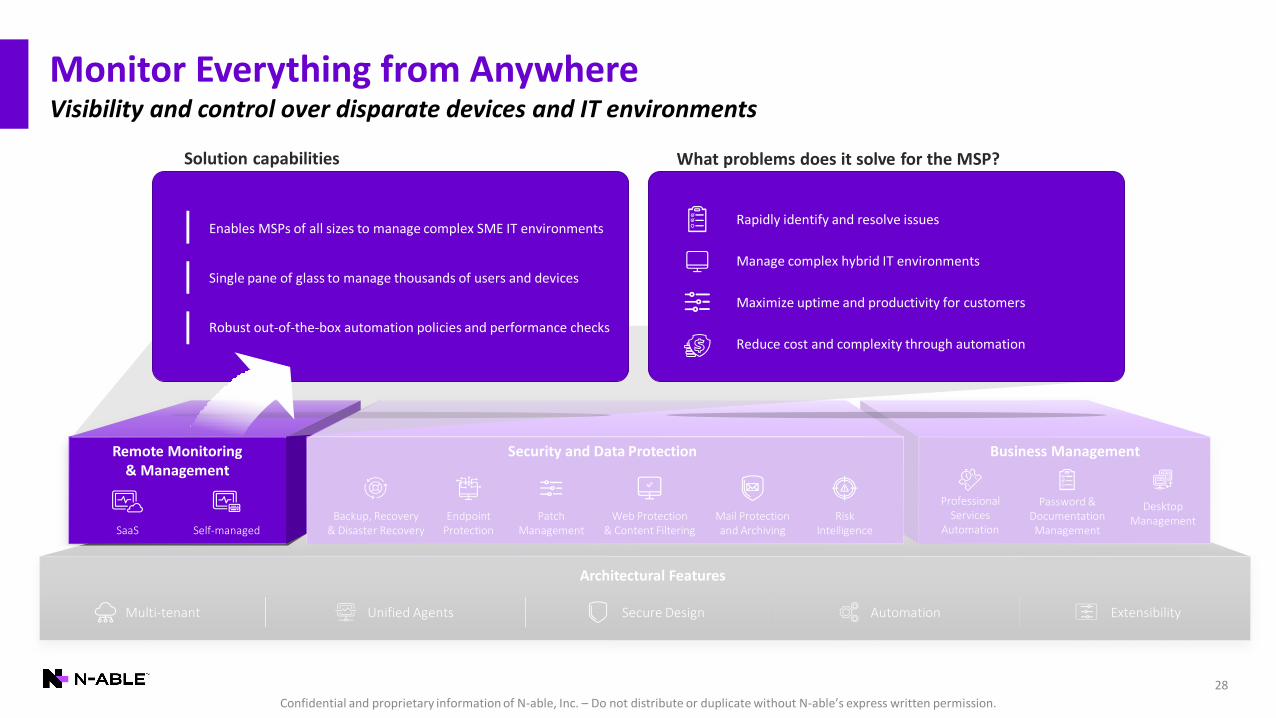
Monitor Everything from AnywhereVisibility and control over disparate devices and IT environments
Solution capabilities What problems does it solve for the MSP?
Architectural Features
SaaS Self-managedBackup, Recovery
& Disaster RecoveryEndpoint
ProtectionPatch
ManagementWeb Protection
& Content FilteringMail Protection and Archiving
RiskIntelligence
Remote Monitoring& Management
Security and Data Protection
Password &Documentation Management
Desktop Management
Business Management
ProfessionalServices
Automation
Unified Agents ExtensibilityMulti-tenant Secure Design Automation
Enables MSPs of all sizes to manage complex SME IT environments
Single pane of glass to manage thousands of users and devices
Robust out-of-the-box automation policies and performance checks
Rapidly identify and resolve issues
Manage complex hybrid IT environments
Maximize uptime and productivity for customers
Reduce cost and complexity through automation

Confidential and proprietary information of N-able, Inc. – Do not distribute or duplicate without N-able’s express written permission.
29
Layered SecurityComprehensive defense via integrated solutions
Architectural Features
SaaS Self-managed
Remote Monitoring& Management
Password &Documentation Management
Desktop Management
Business Management
Backup, Recovery & Disaster Recovery
Endpoint Protection
PatchManagement
Web Protection & Content Filtering
Mail Protection and Archiving
RiskIntelligence
Security and Data Protection
ProfessionalServices
Automation
Unified Agents ExtensibilityMulti-tenant Secure Design Automation
Solution capabilities What problems does it solve for the MSP?
Layered protection spanning network and systems infrastructure, applications, and end user devices via:
Protect SME customers from multiple attack vectors
Preventative protection + recoverability = complete defense
Platform integration and unified agent approach enable seamless deployment
✓ Data protection
✓ Patch management
✓ Endpoint security
✓ Web protection
✓ E-mail security and archiving
✓ Vulnerability assessment solutions
Confidential and proprietary information of N-able, Inc. – Do not distribute or duplicate without N-able’s express written permission.
30
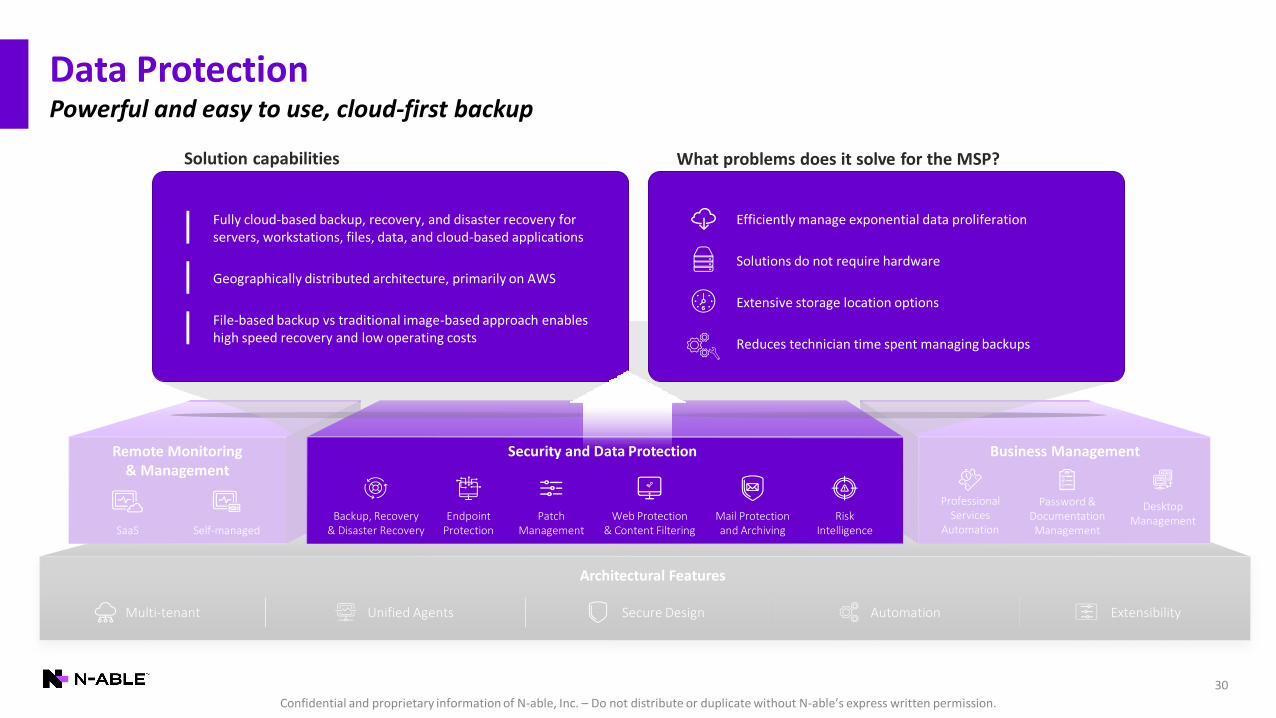
Data ProtectionPowerful and easy to use, cloud-first backup
Architectural Features
SaaS Self-managed
Remote Monitoring& Management
Password &Documentation Management
Desktop Management
Business Management
Backup, Recovery & Disaster Recovery
Endpoint Protection
PatchManagement
Web Protection & Content Filtering
Mail Protection and Archiving
RiskIntelligence
Security and Data Protection
ProfessionalServices
Automation
Unified Agents ExtensibilityMulti-tenant Secure Design Automation
Solution capabilities What problems does it solve for the MSP?
Fully cloud-based backup, recovery, and disaster recovery for servers, workstations, files, data, and cloud-based applications
Geographically distributed architecture, primarily on AWS
File-based backup vs traditional image-based approach enables high speed recovery and low operating costs
Efficiently manage exponential data proliferation
Solutions do not require hardware
Extensive storage location options
Reduces technician time spent managing backups

Confidential and proprietary information of N-able, Inc. – Do not distribute or duplicate without N-able’s express written permission.
31
Business Management Solutions
Architectural Features
SaaS Self-managed
Remote Monitoring& Management
Password &Documentation Management
Desktop Management
Business Management
Backup, Recovery & Disaster Recovery
Endpoint Protection
PatchManagement
Web Protection & Content Filtering
Mail Protection and Archiving
RiskIntelligence
Security and Data Protection
Increase MSP operational efficiency and scale
ProfessionalServices
Automation
Unified Agents ExtensibilityMulti-tenant Secure Design Automation
Solution capabilities What problems does it solve for the MSP?
Improve MSP technician operational efficiency
Improve customer uptime, productivity, and satisfaction
Workflow optimization increases scale and margins
Simplifies secure storage and audited access to passwords
PSA solution enables MSPs to organize workforce, track support issues, schedule technicians, and streamline billing processes
Password and document repositories support secure role-based access into customer environments
Confidential and proprietary information of N-able, Inc. – Do not distribute or duplicate without N-able’s express written permission.
Architectural Features
32
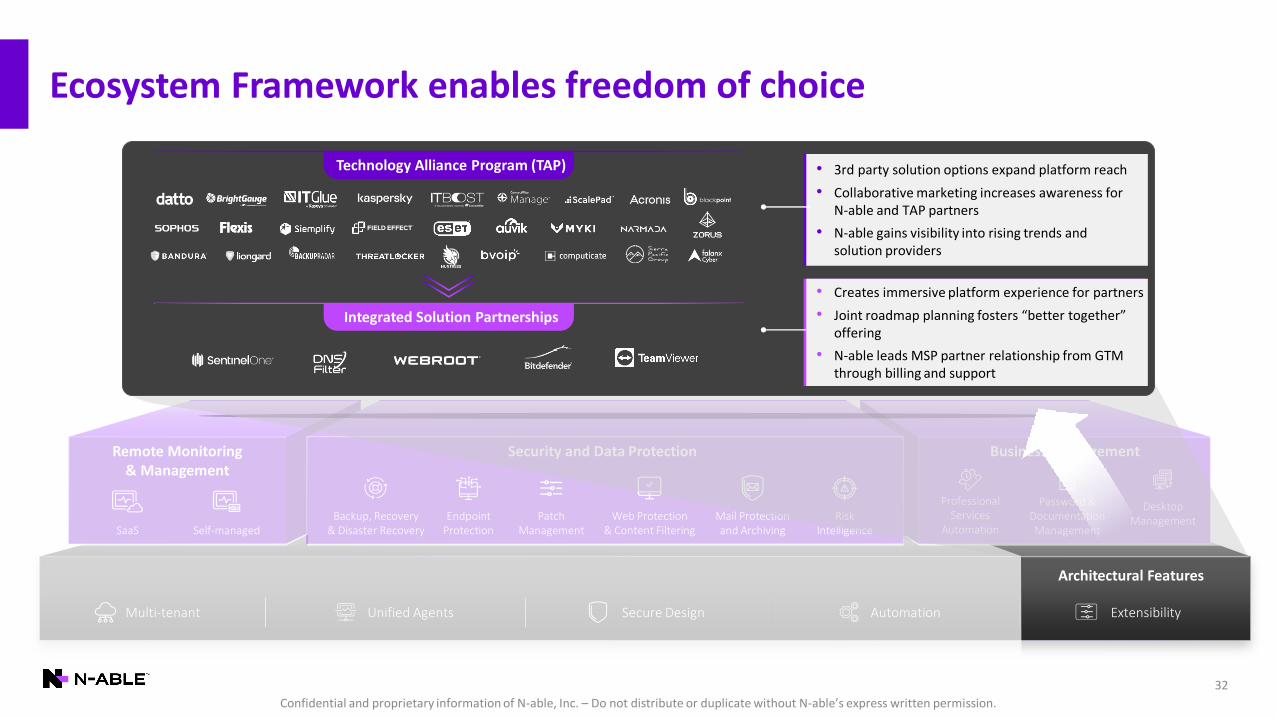
Ecosystem Framework enables freedom of choice
SaaS Self-managed
Remote Monitoring& Management
Password &Documentation Management
Desktop Management
Business Management
Backup, Recovery & Disaster Recovery
Endpoint Protection
PatchManagement
Web Protection & Content Filtering
Mail Protection and Archiving
RiskIntelligence
Security and Data Protection
ProfessionalServices
Automation
Unified Agents ExtensibilityMulti-tenant Secure Design Automation
Technology Alliance Program (TAP)
Integrated Solution Partnerships
• 3rd party solution options expand platform reach
• Collaborative marketing increases awareness for N-able and TAP partners
• N-able gains visibility into rising trends and solution providers
• Creates immersive platform experience for partners
• Joint roadmap planning fosters “better together” offering
• N-able leads MSP partner relationship from GTM through billing and support

Confidential and proprietary information of N-able, Inc. – Do not distribute or duplicate without N-able’s express written permission.
Architectural Features
33
Horizontal expansion via enterprise tech partnerships
SaaS Self-managed
Remote Monitoring& Management
Password &Documentation Management
Desktop Management
Business Management
Backup, Recovery & Disaster Recovery
Endpoint Protection
PatchManagement
Web Protection & Content Filtering
Mail Protection and Archiving
RiskIntelligence
Security and Data Protection
ProfessionalServices
Automation
Unified Agents ExtensibilityMulti-tenant Secure Design Automation
• Pairs N-able’s multi-tier, multi-tenant RMM with Intune MDM for consolidated management and reporting
• Building out our Azure server monitoring capabilities and M365 Cloud Backup
• Robust MDM capabilities for Apple devices, including multi-tenancy, remote control, and integrated backup and EDR
• Once we manage Macs, we can layer on additional services
• Cisco integration expands our monitoring breadth and gives partners direct path to discover and monitor Cisco Meraki devices

Confidential and proprietary information of N-able, Inc. – Do not distribute or duplicate without N-able’s express written permission.
What’s next
34
Tech Trends Impacting SMEs N-able Platform Capabilities and Priorities
▪ Growing attack surfaces▪ Dissipating network boundaries▪ Data proliferation
Layered Security
▪ Layered security approach
▪ Network management and security
▪ Scalable and efficient data management
▪ Permanent distributed workforces
▪ Increasing cloud / hybrid IT complexity
▪ AI augmentationPlatform and Productivity
▪ Leading cloud-based platform
▪ Cloud-native RMM and security
▪ Next-gen technician efficiency
▪ SaaS proliferation▪ IoT devices▪ Co-managed IT
Monitor Everything
▪ Identity management and controls
▪ Monitor breadth and depth
▪ Enterprise-class scalability

Confidential and proprietary information of N-able, Inc. – Do not distribute or duplicate without N-able’s express written permission.
Go-to-Market &Partner Success

Confidential and proprietary information of N-able, Inc. – Do not distribute or duplicate without N-able’s express written permission.
36
Our GTM and multi-dimensional land and expand strategy
High-velocity, low-touch insidesales motion with frictionless free trial approach to acquire MSPs…
…driving efficient growth as MSP partners drive sales…
…by adding new SME customers… …that add new devices, services, and drive usage
N-able Sales Reps
Localized distributor model internationally
25K+ MSP Partners500K+ SME Customers
Devices/Networks
Services
UsageFric
tio
nle
ss t
ria
l ap
pro
ach
1 2 3 4
!
Po
we
red
by N
-able P
latform

Confidential and proprietary information of N-able, Inc. – Do not distribute or duplicate without N-able’s express written permission.
37
Best-in-class partner success and support
MSP Partners
We train our MSP partners to:
▪ Navigate dynamic market trends
▪ Improve technical expertise
▪ Create new revenue streams using our platform
▪ Increase operating efficiency and scale
▪ Ultimately become better business operators
In addition to:
▪ 24/7/365 technical support
▪ Customer care and account management
▪ Onboarding
▪ Post-sales engineering
▪ Dedicated partner success teams

Confidential and proprietary information of N-able, Inc. – Do not distribute or duplicate without N-able’s express written permission.
Best-in-class partner success initiatives
38
Partner Success Managers
MSP Institute
Head Nerds (Boot Camps, Office Hours)
All Partner Meetings
MarketBuilder (marketing automation)
Partner Advisory Groups
Zero to Many(OnDemand)
One to Many(Boot Camps & Office Hours)
91% Average CSAT score of MSP partners (2020)
>55K (4.7 of 5 stars)
MSP Institute courses completed since October 2018
>10KAttending Nerd Activities since Feb 2020
Automation Cookbook
Social/Community Interaction
Partners get access to:

Confidential and proprietary information of N-able, Inc. – Do not distribute or duplicate without N-able’s express written permission.
39
The value of our differentiated go-to-market model
Financial impactGo-to-market approach
Targeted inside-sales strategy Cost efficient pipeline generation and conversion
Localized channel strategy High international revenue mix
Acquiring MSPs that will grow alongside us Natural revenue expansion
MSPs serve as extension of our sales footprint Product-led growth with high operating leverage
Best-in-class partner success initiatives Strong dollar-based net retention rates
Confidential and proprietary information of N-able, Inc. – Do not distribute or duplicate without N-able’s express written permission.
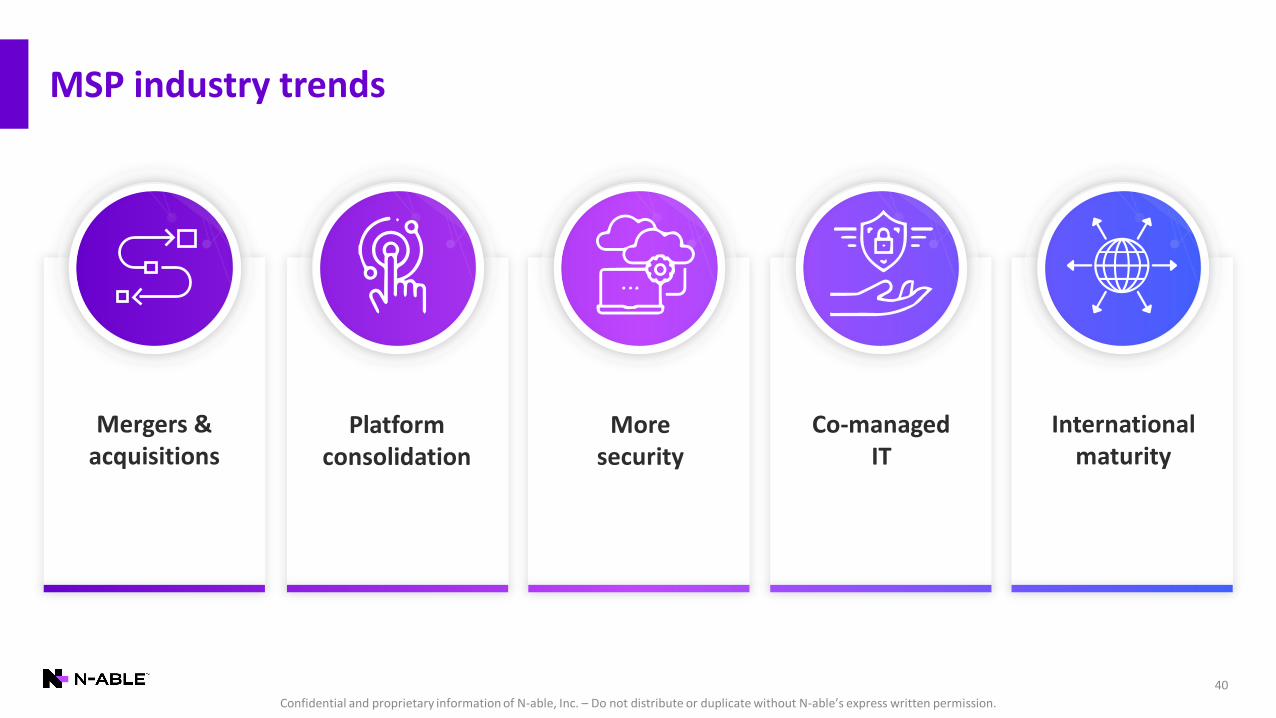
MSP industry trends
40
Moresecurity
Co-managedIT
Platform consolidation
International maturity
Mergers &acquisitions

Confidential and proprietary information of N-able, Inc. – Do not distribute or duplicate without N-able’s express written permission.
41
Case study A: MSP acquirer standardizing on N-able
Exit
AR
R
$0
$50
$100
$150
$200
$250
$300
$350
$400
2016 2017 2018 2019 2020
Data Protection Security Business Management
$337KARR in 2020
18.9KDevices Managed
Long-term N-able partner with locations throughout Central US and
Midwest; has acquired many smaller MSPs over time and standardized
nearly all customers on N-able platform.
$64KARR in 2016
12.6KDevices Managed
RMM
$000s
Growth on N-able platform:
• Grew ARR from $64K in 2016 to $337K in 2020 (51% CAGR)
• Nearly doubled total ARR from $172K 2019 to $337K in 2020
• Data protection ARR grew from $6K in 2018 to $42K in 2020
• EDR ARR ramped form $4K in 2019 to $155K in 2020
Value we deliver:
• Ability to scale and standardize as they acquire new MSPs
• Advanced technical training and customizations
• Account managers help set and execute on strategic roadmap
MSP industry trends in play:
• M&A, platform consolidation, more security, co-managed IT
EDR &Business
Management Adoption
Data Protection Adoption
Confidential and proprietary information of N-able, Inc. – Do not distribute or duplicate without N-able’s express written permission.
42
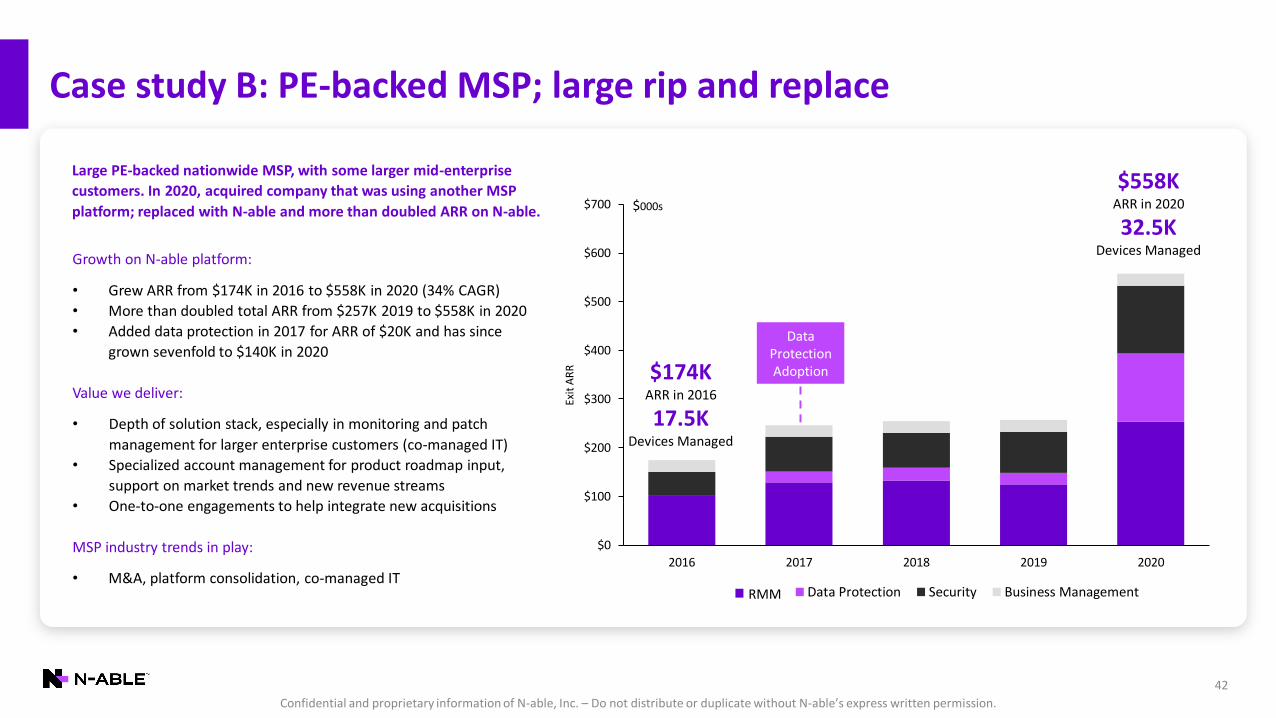
Case study B: PE-backed MSP; large rip and replace
Exit
AR
R
$0
$100
$200
$300
$400
$500
$600
$700
2016 2017 2018 2019 2020
Data Protection Security Business Management
$558KARR in 2020
32.5KDevices Managed
Large PE-backed nationwide MSP, with some larger mid-enterprise
customers. In 2020, acquired company that was using another MSP
platform; replaced with N-able and more than doubled ARR on N-able.
$174KARR in 2016
17.5KDevices Managed
RMM
$000s
Growth on N-able platform:
• Grew ARR from $174K in 2016 to $558K in 2020 (34% CAGR)
• More than doubled total ARR from $257K 2019 to $558K in 2020
• Added data protection in 2017 for ARR of $20K and has since
grown sevenfold to $140K in 2020
Value we deliver:
• Depth of solution stack, especially in monitoring and patch
management for larger enterprise customers (co-managed IT)
• Specialized account management for product roadmap input,
support on market trends and new revenue streams
• One-to-one engagements to help integrate new acquisitions
MSP industry trends in play:
• M&A, platform consolidation, co-managed IT
Data Protection Adoption

Confidential and proprietary information of N-able, Inc. – Do not distribute or duplicate without N-able’s express written permission.
43
Case study C: European-based, multinational MSP
$48KARR in 2016
$0
$20
$40
$60
$80
$100
$120
$140
$160
2016 2017 2018 2019 2020
Data Protection Security Business ManagementRMM
$143KARR in 2020
Exit
AR
R
$000s
Amsterdam-based MSP with global customer base. Have embraced
majority of N-able solutions and built service delivery around N-able.
Growth on N-able platform:
• Grew ARR from $48K in 2016 to $143K in 2020 (31% CAGR)
• RMM ARR grew from $34K in 2016 to $93K in 2020
• Data protection ARR grew from <$1K in 2016 to $17K in 2020
• Security ARR grew from ~$10K in 2016 to >$30K in 2020
Value we deliver:
• Single pane of glass to easily aggregate customer data across
multiple customers on real-time basis
• Sells to end customers “fully managed” all-inclusive contracts that
are powered by N-able solution stack
MSP industry trends in play:
• Platform consolidation, more security, international
Confidential and proprietary information of N-able, Inc. – Do not distribute or duplicate without N-able’s express written permission.
44
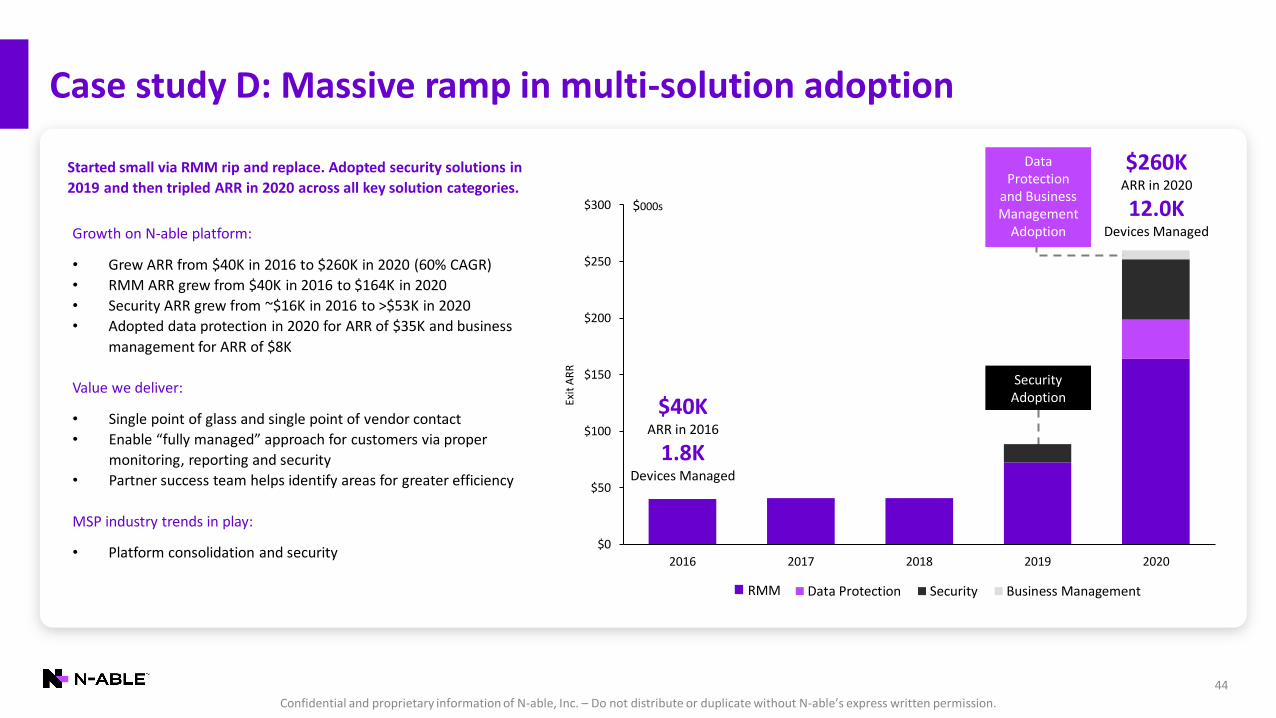
Case study D: Massive ramp in multi-solution adoption
RMM
$0
$50
$100
$150
$200
$250
$300
2016 2017 2018 2019 2020
Data Protection Security Business Management
SecurityAdoption$40K
ARR in 2016
1.8KDevices Managed
$260KARR in 2020
12.0KDevices Managed
Data Protection
and Business Management
Adoption
Exit
AR
R
$000s
Started small via RMM rip and replace. Adopted security solutions in
2019 and then tripled ARR in 2020 across all key solution categories.
Growth on N-able platform:
• Grew ARR from $40K in 2016 to $260K in 2020 (60% CAGR)
• RMM ARR grew from $40K in 2016 to $164K in 2020
• Security ARR grew from ~$16K in 2016 to >$53K in 2020
• Adopted data protection in 2020 for ARR of $35K and business
management for ARR of $8K
Value we deliver:
• Single point of glass and single point of vendor contact
• Enable “fully managed” approach for customers via proper
monitoring, reporting and security
• Partner success team helps identify areas for greater efficiency
MSP industry trends in play:
• Platform consolidation and security

Confidential and proprietary information of N-able, Inc. – Do not distribute or duplicate without N-able’s express written permission.
Financial Overview
Confidential and proprietary information of N-able, Inc. – Do not distribute or duplicate without N-able’s express written permission.
46
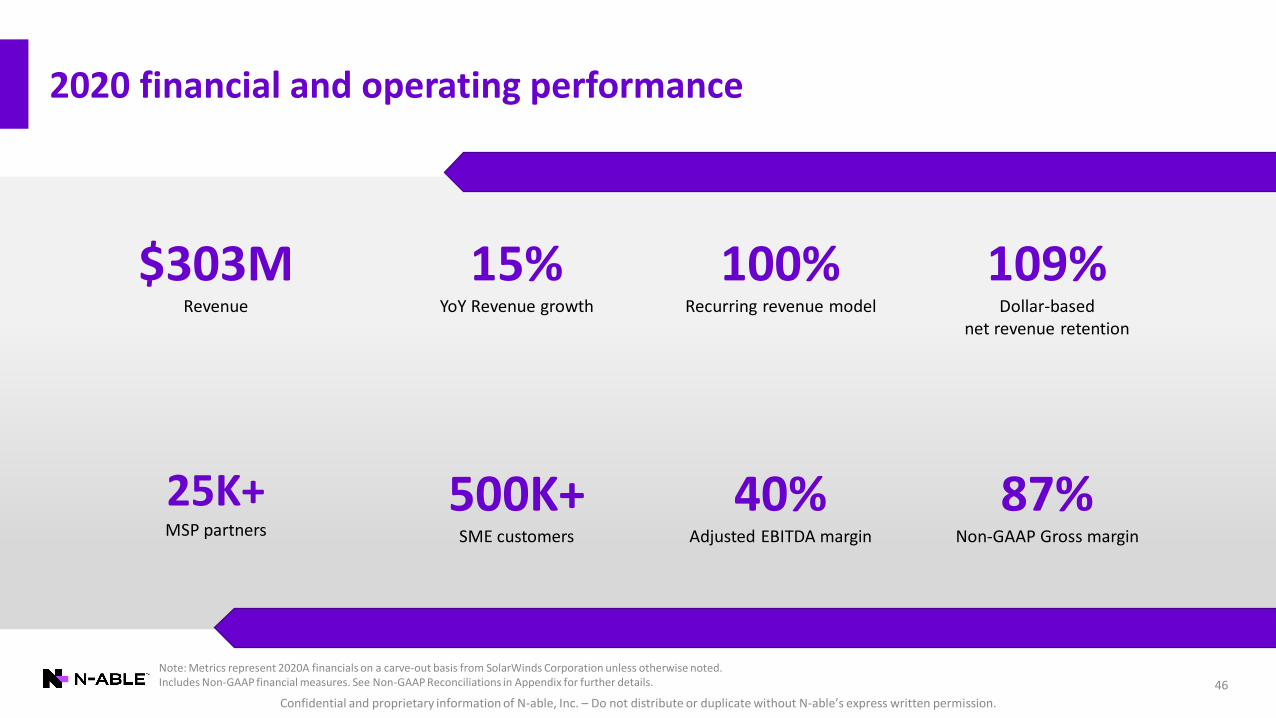
2020 financial and operating performance
25K+MSP partners
$303MRevenue
109%Dollar-based
net revenue retention
500K+SME customers
40%Adjusted EBITDA margin
15%YoY Revenue growth
100%Recurring revenue model
87%Non-GAAP Gross margin
Note: Metrics represent 2020A financials on a carve-out basis from SolarWinds Corporation unless otherwise noted.Includes Non-GAAP financial measures. See Non-GAAP Reconciliations in Appendix for further details.

Confidential and proprietary information of N-able, Inc. – Do not distribute or duplicate without N-able’s express written permission.
MSPs prefer purpose-built platforms and solutions that address disparate SME customers’ needsand improve their own operational efficiency
MSP industry supply chain
47
SME IT spending in 2020 - $1.2T1
SMEs increasingly reliant on MSPs for IT managementand security
MSPs have various vendorsto choose from
MSPs want to improvescale & margin
1 Gartner “Small and Midsize Business IT Spending, Worldwide, 2018-2024,” 18 February, 2021Note: Global SME IT Managed Services Spend and N-able TAM estimates based on Frost & Sullivan “Total Addressable Market for SMB IT Managed Service Providers” (February 2021)
Confidential and proprietary information of N-able, Inc. – Do not distribute or duplicate without N-able’s express written permission.
48
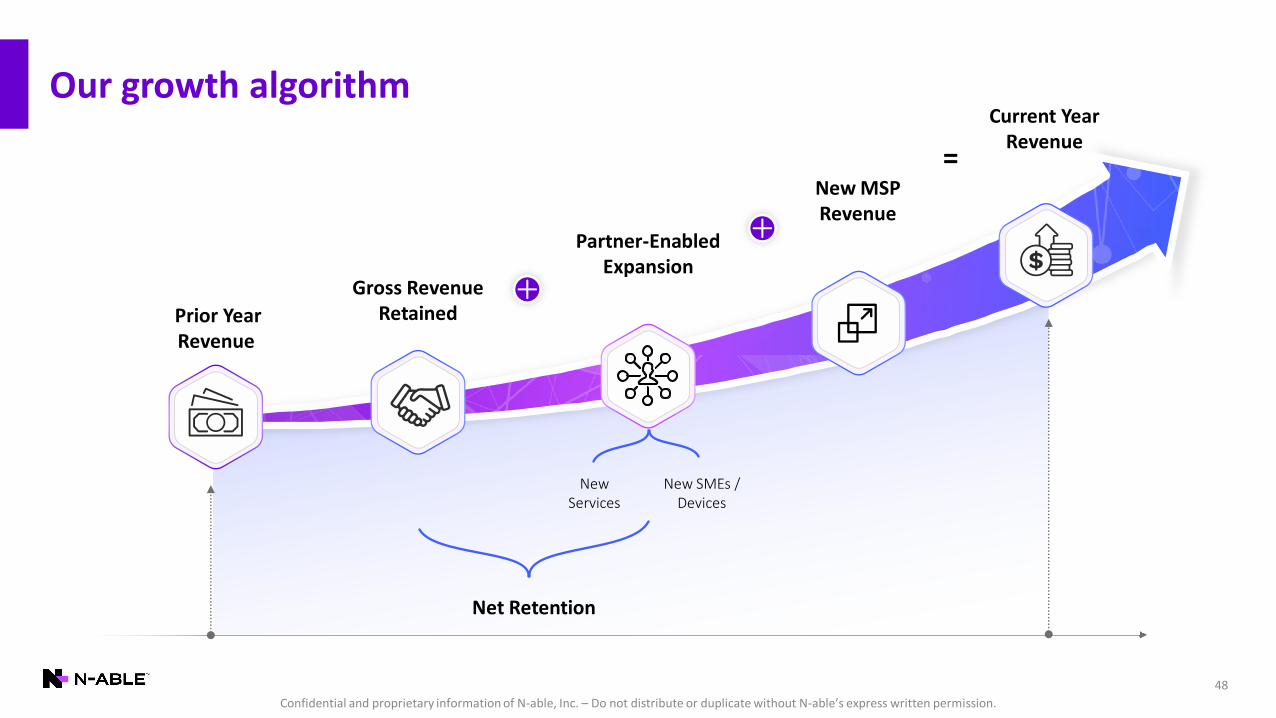
Our growth algorithm
New MSPRevenue
Current YearRevenue
Gross RevenueRetained
Net Retention
Partner-EnabledExpansion
=
Prior YearRevenue
NewServices
New SMEs /Devices
Confidential and proprietary information of N-able, Inc. – Do not distribute or duplicate without N-able’s express written permission.
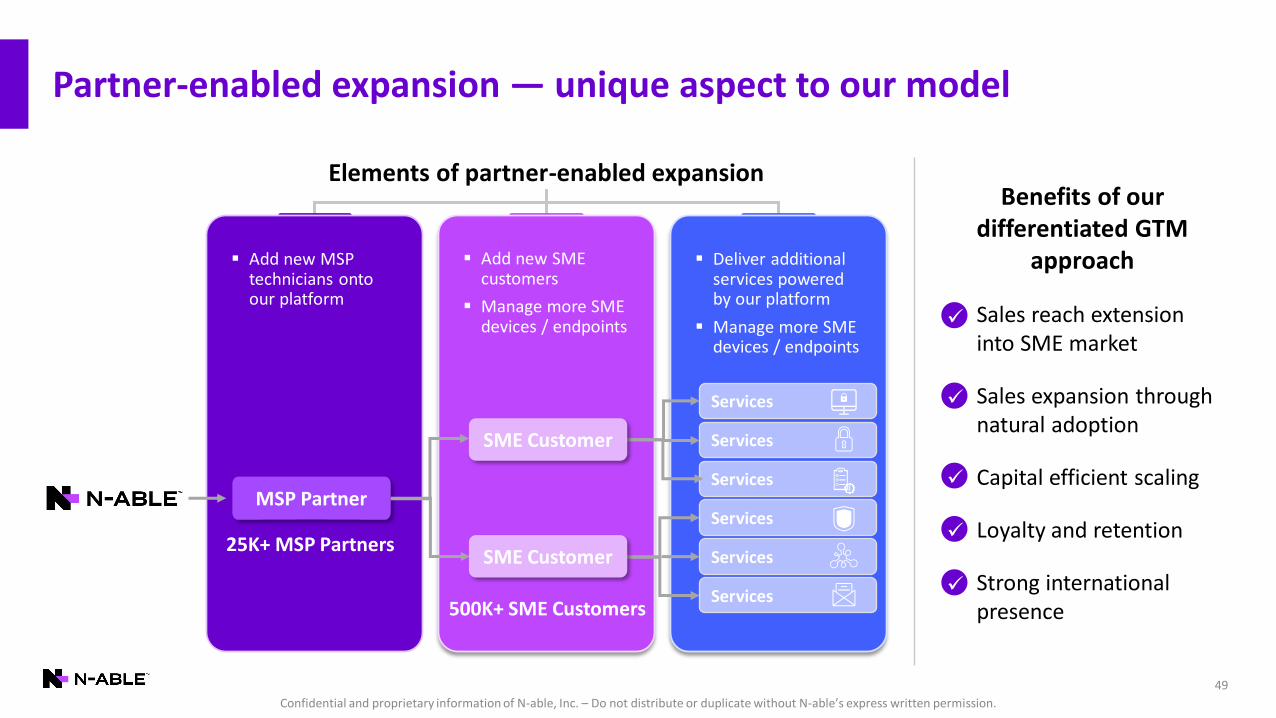
▪ Add new MSP technicians onto our platform
▪ Add new SME customers
▪ Manage more SME devices / endpoints
▪ Deliver additional services powered by our platform
▪ Manage more SME devices / endpoints
Partner-enabled expansion — unique aspect to our model
49
MSP Partner
25K+ MSP Partners
500K+ SME Customers
Services
Services
Services
Elements of partner-enabled expansion
Services
Services
Services
!
Benefits of our differentiated GTM
approach
▪ Sales reach extension into SME market
▪ Sales expansion through natural adoption
▪ Capital efficient scaling
▪ Loyalty and retention
▪ Strong international presence
✓
✓
✓
✓
✓
SME Customer
SME Customer
Confidential and proprietary information of N-able, Inc. – Do not distribute or duplicate without N-able’s express written permission.
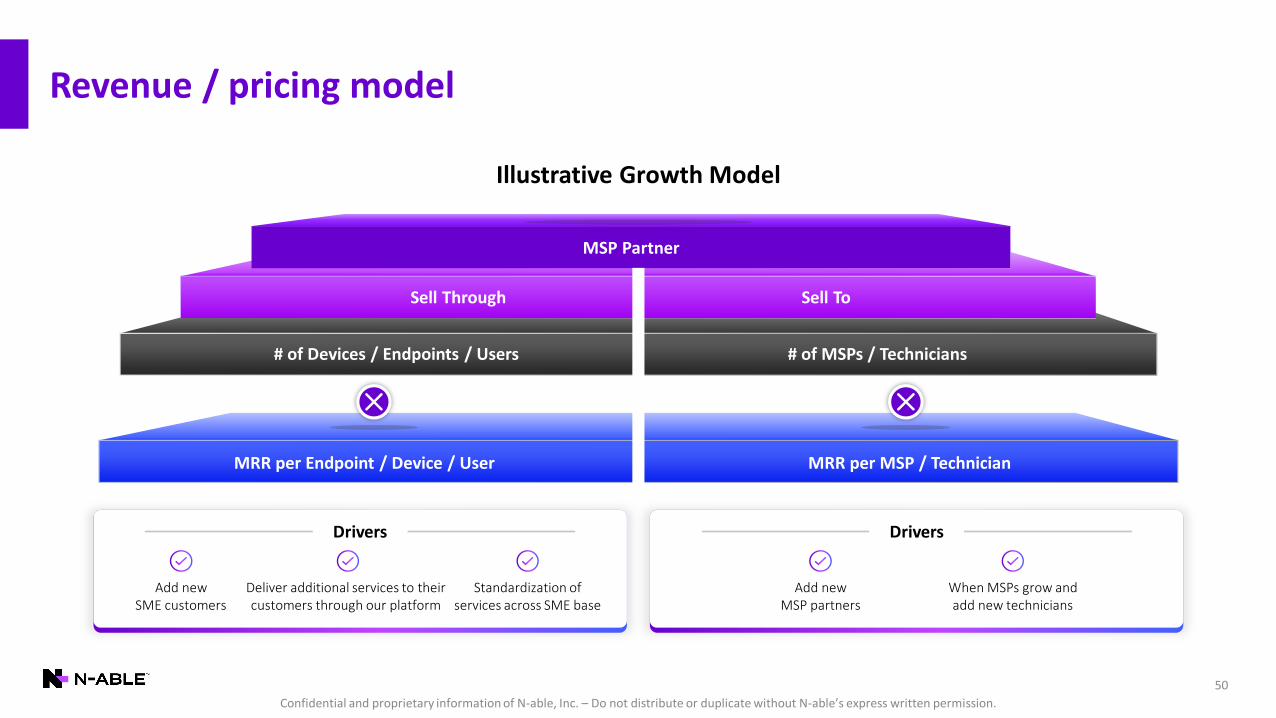
When MSPs grow andadd new technicians
Add newMSP partners
Drivers
Deliver additional services to their customers through our platform
Add newSME customers
Standardization ofservices across SME base
Drivers
Revenue / pricing model
50
MRR per Endpoint / Device / User MRR per MSP / Technician
Illustrative Growth Model
MSP Partner
Sell Through Sell To
# of Devices / Endpoints / Users # of MSPs / Technicians

Confidential and proprietary information of N-able, Inc. – Do not distribute or duplicate without N-able’s express written permission.
Strong track record for consistent revenue growth and at scale
Note: Metrics represent financials on a carve-out basis from SolarWinds Corporation unless otherwise noted. Quarterly revenue presented may not precisely sum to annual revenue due to rounding. 51
Annual revenue ($M)
$228
$264
$303
2018 2019 2020
15% 15%Y/Y growth:
$61$66 $67
$70$73 $73
$76$80
$83
Q1'19 Q2'19 Q3'19 Q4'19 Q1'20 Q2'20 Q3'20 Q4'20 Q1'21
Quarterly revenue ($M)
12% 17% 16% 17% 20% 12% 14% 15% 14%Y/Y growth:
12% 18% 16% 18% 20% 13% 15% 16% 15%
Y/Y subscription growth:
COVID impact

Confidential and proprietary information of N-able, Inc. – Do not distribute or duplicate without N-able’s express written permission.
$228$264
$303
2018 2019 2020
Attractive financial profile
52
$198$231
$265
2018 2019 2020
$81$103 $121
2018 2019 2020
$66 $65 $100
2018 2019 2020
- 15% 15%Growth: 87% 88% 87%Margin:
36% 39% 40%Margin:
Adjusted EBITDA ($M) Unlevered free cash flow ($M)
Revenue ($M) Non-GAAP Gross profit ($M)
Note: Metrics represent financials on a carve-out basis from SolarWinds Corporation unless otherwise noted.Includes Non-GAAP financial measures. See Non-GAAP Reconciliations in Appendix for further details.
29% 25% 33%Margin:
81% 63% 83%uFCF conversion:

Confidential and proprietary information of N-able, Inc. – Do not distribute or duplicate without N-able’s express written permission.
108% 108% 109%
2018 2019 2020
53
Highly visible and predictable revenue model
84% 86% 86%
2018 2019 2020
Average revenue per partner ($000s)
Dollar-based net revenue retention
Partners spending ARR of $50K+
Gross revenue retention
$8.9$10.2
$11.6
2018 2019 2020
833
1,117
1,473
2018 2019 2020
Note: Metrics represent financials on a carve-out basis from SolarWinds Corporation unless otherwise noted.
Confidential and proprietary information of N-able, Inc. – Do not distribute or duplicate without N-able’s express written permission.
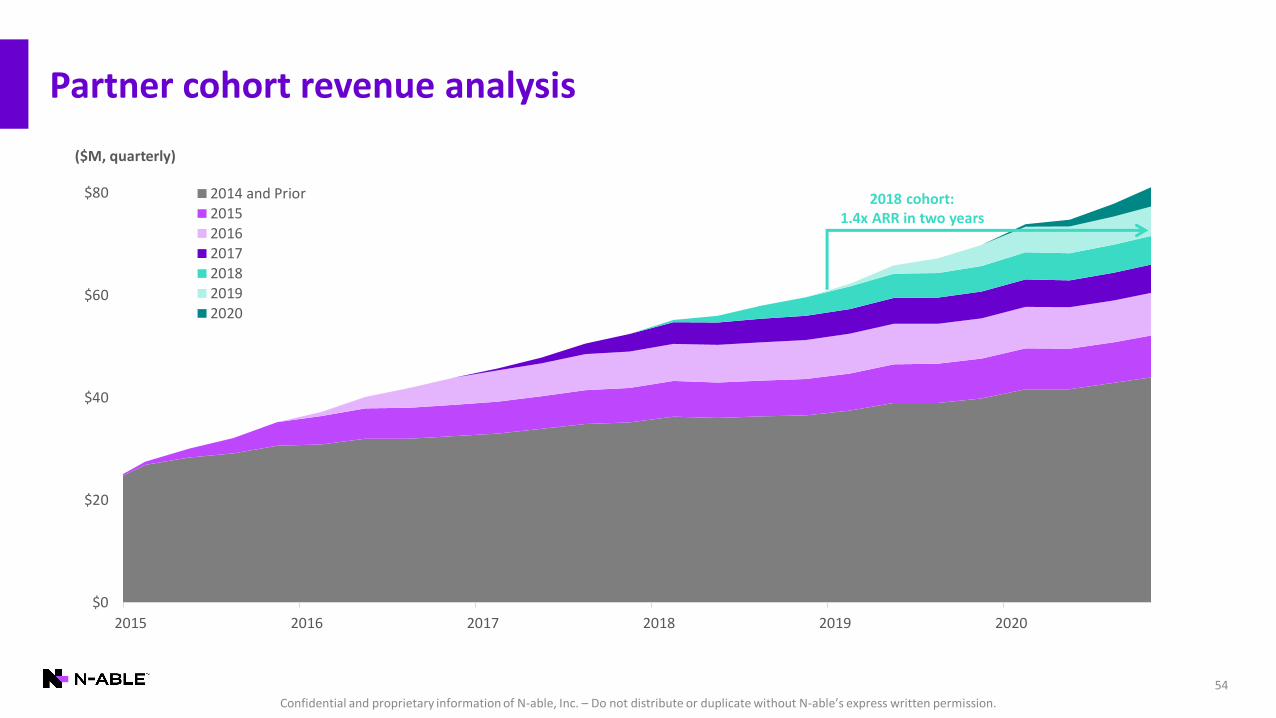
Partner cohort revenue analysis
54
$0
$20
$40
$60
$80
2015 2016 2017 2018 2019 2020
2014 and Prior
2015
20162017201820192020
($M, quarterly)
2018 cohort:1.4x ARR in two years
Confidential and proprietary information of N-able, Inc. – Do not distribute or duplicate without N-able’s express written permission.
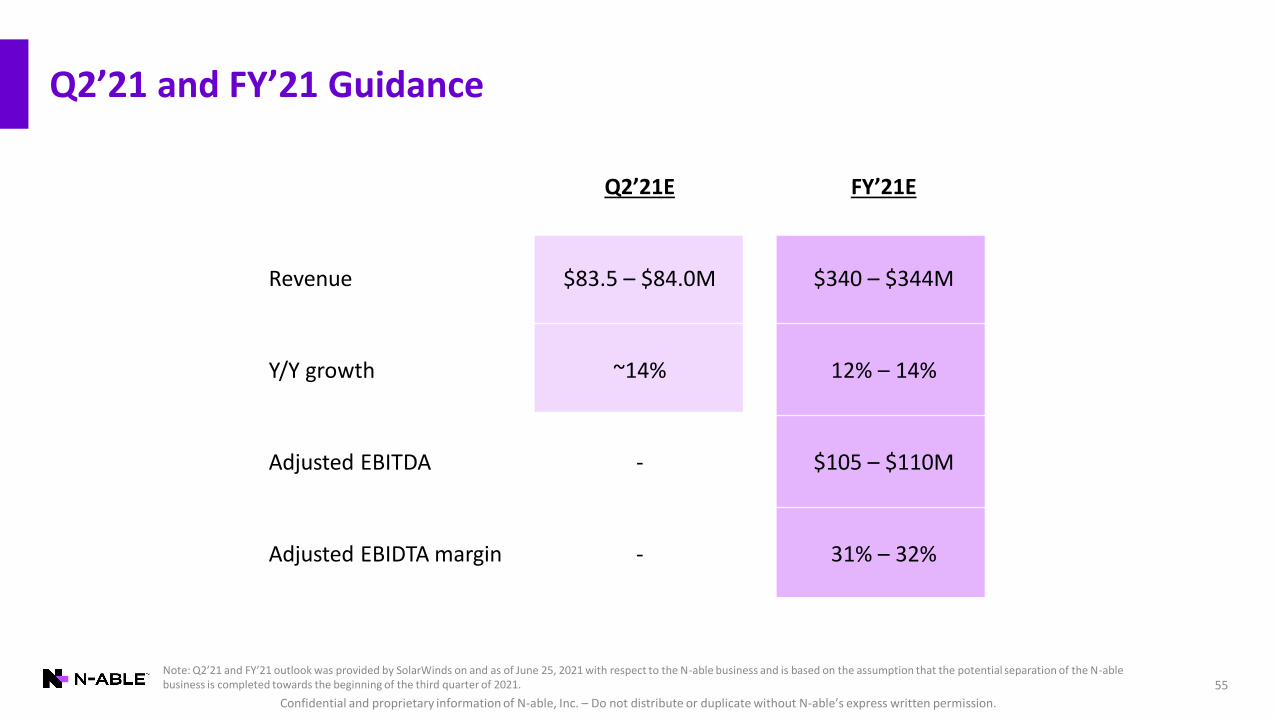
Q2’21E FY’21E
Revenue $83.5 – $84.0M $340 – $344M
Y/Y growth ~14% 12% – 14%
Adjusted EBITDA - $105 – $110M
Adjusted EBIDTA margin - 31% – 32%
Q2’21 and FY’21 Guidance
55Note: Q2’21 and FY’21 outlook was provided by SolarWinds on and as of June 25, 2021 with respect to the N-able business and is based on the assumption that the potential separation of the N-able business is completed towards the beginning of the third quarter of 2021.

Confidential and proprietary information of N-able, Inc. – Do not distribute or duplicate without N-able’s express written permission.
56
2021 and medium-term targets% of total revenue, except for revenue growth
Rule of 50
2019 2020 2021EMedium-
Term Target
Revenue growth 15% 15% 12 - 14% 15 - 17%
Gross margin 88% 87% 87 - 88% 87 - 88%
S&M 25% 25% 28 - 29% 27 - 28%
R&D 13% 13% 15 - 16% 14 - 15%
G&A 13% 12% 12 - 13% 10 - 11%
Adjusted EBITDA margin 39% 40% 31 - 32% 33 - 35%
Note: All financial metrics except for revenue growth are presented on a non-GAAP basis. See Non-GAAP Reconciliations in Appendix for further details. 2019 and 2020 metrics represent financials on a carve-out basis from SolarWinds Corporation. FY’21 outlook was provided by SolarWinds on and as of June 25, 2021 with respect to the N-able business and is based on the assumption that the potential separation of the N-able business is completed towards the beginning of the third quarter of 2021.
Confidential and proprietary information of N-able, Inc. – Do not distribute or duplicate without N-able’s express written permission.
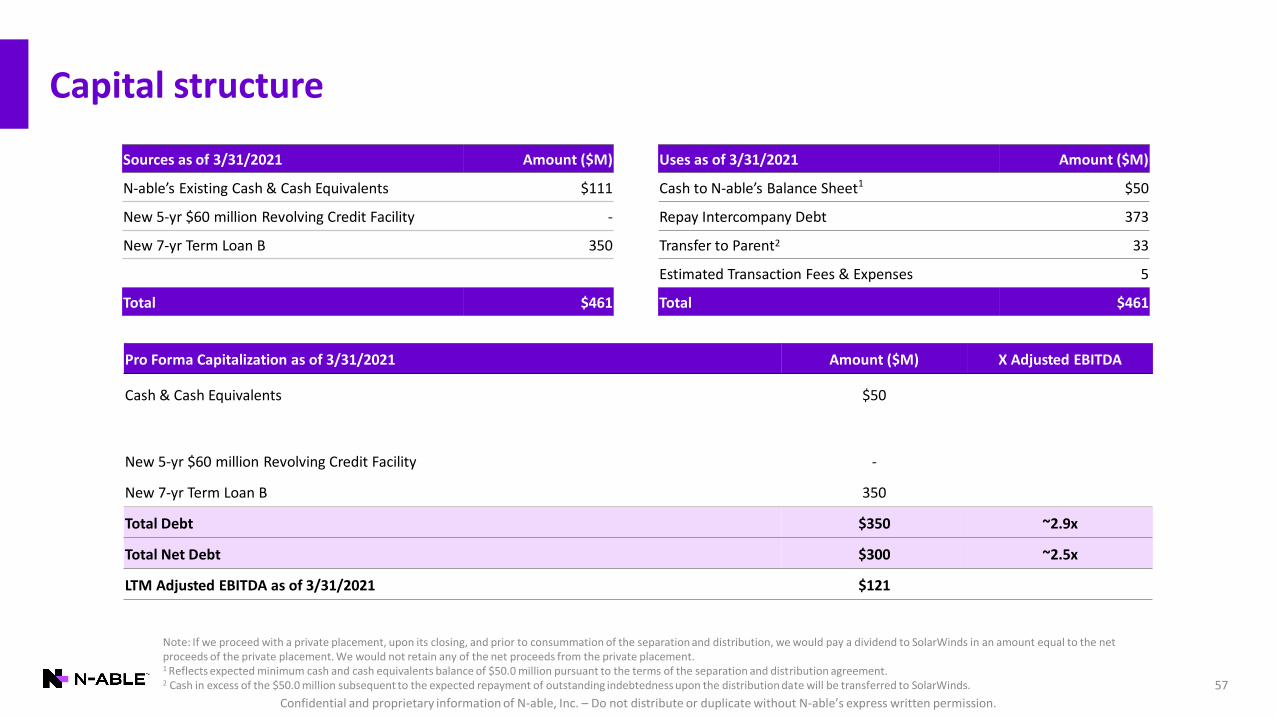
Capital structure
57
Sources as of 3/31/2021 Amount ($M)
N-able’s Existing Cash & Cash Equivalents $111
New 5-yr $60 million Revolving Credit Facility -
New 7-yr Term Loan B 350
Total $461
Pro Forma Capitalization as of 3/31/2021 Amount ($M) X Adjusted EBITDA
Cash & Cash Equivalents $50
New 5-yr $60 million Revolving Credit Facility -
New 7-yr Term Loan B 350
Total Debt $350 ~2.9x
Total Net Debt $300 ~2.5x
LTM Adjusted EBITDA as of 3/31/2021 $121
Uses as of 3/31/2021 Amount ($M)
Cash to N-able’s Balance Sheet1 $50
Repay Intercompany Debt 373
Transfer to Parent2 33
Estimated Transaction Fees & Expenses 5
Total $461
Note: If we proceed with a private placement, upon its closing, and prior to consummation of the separation and distribution, we would pay a dividend to SolarWinds in an amount equal to the net proceeds of the private placement. We would not retain any of the net proceeds from the private placement. 1 Reflects expected minimum cash and cash equivalents balance of $50.0 million pursuant to the terms of the separation and distribution agreement.2 Cash in excess of the $50.0 million subsequent to the expected repayment of outstanding indebtedness upon the distribution date will be transferred to SolarWinds.
Confidential and proprietary information of N-able, Inc. – Do not distribute or duplicate without N-able’s express written permission.
58
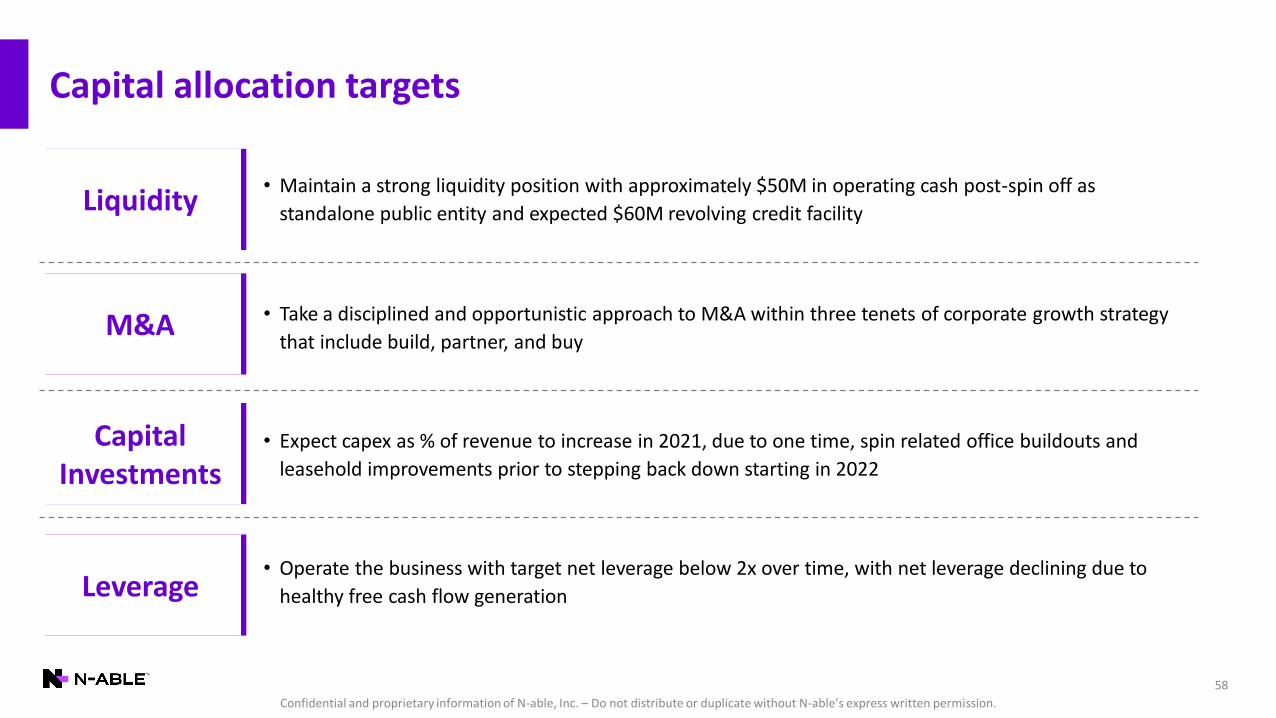
Capital allocation targets
Liquidity• Maintain a strong liquidity position with approximately $50M in operating cash post-spin off as
standalone public entity and expected $60M revolving credit facility
Capital Investments
• Expect capex as % of revenue to increase in 2021, due to one time, spin related office buildouts and
leasehold improvements prior to stepping back down starting in 2022
M&A • Take a disciplined and opportunistic approach to M&A within three tenets of corporate growth strategy
that include build, partner, and buy
Leverage• Operate the business with target net leverage below 2x over time, with net leverage declining due to
healthy free cash flow generation

Confidential and proprietary information of N-able, Inc. – Do not distribute or duplicate without N-able’s express written permission.
Investment Highlights

Confidential and proprietary information of N-able, Inc. – Do not distribute or duplicate without N-able’s express written permission.
60
Key investment highlights
Leading global provider of software enabling MSPs to power digital transformation for SMEs1
Attractive market opportunity driven by growing SME IT needs and increasing reliance on MSPs2
Multi-dimensional, “one to many” land and expand strategy with high velocity go-to-market4
Best-in-class financial profile with 100% subscription model and profitability at scale5
6 Experienced management team with strong industry roots and culture of innovation
3 Purpose-built platform that monitors and secures IT regardless of environment or location

Confidential and proprietary information of N-able, Inc. – Do not distribute or duplicate without N-able’s express written permission.
Purpose-built to address key SME and MSP challenges
61
Growing cyber threats
Managing IT complexity
Growing compliance costs
Distributed workforces
Device and application sprawl
SME Challenges
Platform consolidation
M&A
More security
International maturity
Co-managed IT
MSP Trends
Monitor Everything
Leading purpose-built platform for MSPs
Layered Security
Best-in-Class Partner Success
Robust automation
N-able Platform Capabilities
Confidential and proprietary information of N-able, Inc. – Do not distribute or duplicate without N-able’s express written permission.
62
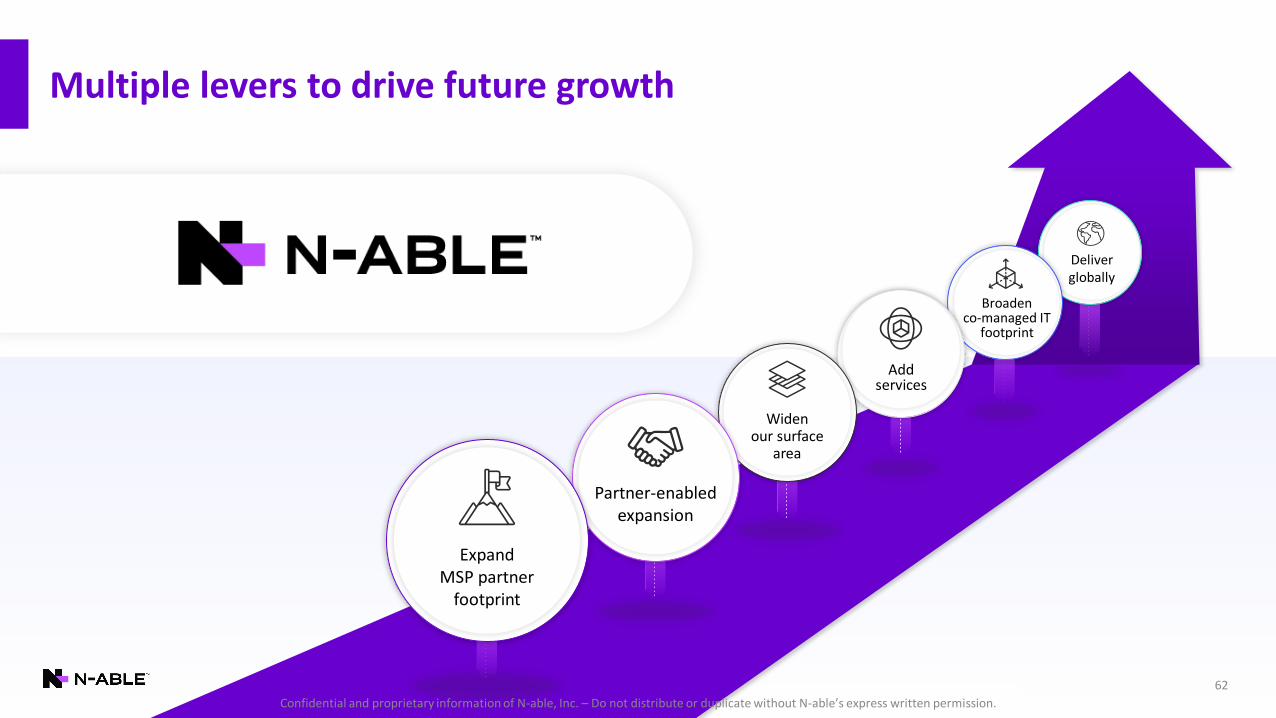
Multiple levers to drive future growth
Confidential and proprietary information of N-able, Inc. – Do not distribute or duplicate without N-able’s express written permission.
Deliverglobally
Broadenco-managed IT
footprint
Addservices
Widenour surface
area
Partner-enabledexpansion
ExpandMSP partner
footprint

Confidential and proprietary information of N-able, Inc. – Do not distribute or duplicate without N-able’s express written permission.
Appendix
Confidential and proprietary information of N-able, Inc. – Do not distribute or duplicate without N-able’s express written permission.
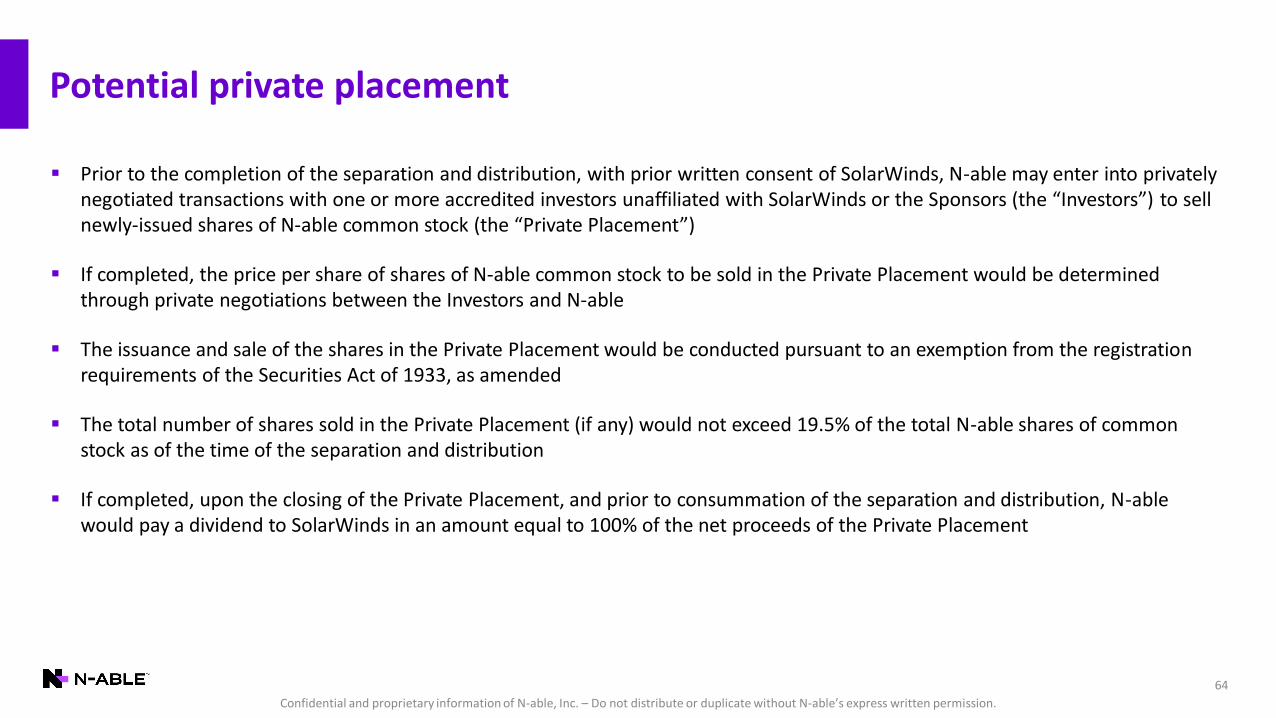
Potential private placement
64
▪ Prior to the completion of the separation and distribution, with prior written consent of SolarWinds, N-able may enter into privately negotiated transactions with one or more accredited investors unaffiliated with SolarWinds or the Sponsors (the “Investors”) to sell newly-issued shares of N-able common stock (the “Private Placement”)
▪ If completed, the price per share of shares of N-able common stock to be sold in the Private Placement would be determined through private negotiations between the Investors and N-able
▪ The issuance and sale of the shares in the Private Placement would be conducted pursuant to an exemption from the registration requirements of the Securities Act of 1933, as amended
▪ The total number of shares sold in the Private Placement (if any) would not exceed 19.5% of the total N-able shares of common stock as of the time of the separation and distribution
▪ If completed, upon the closing of the Private Placement, and prior to consummation of the separation and distribution, N-able would pay a dividend to SolarWinds in an amount equal to 100% of the net proceeds of the Private Placement
Confidential and proprietary information of N-able, Inc. – Do not distribute or duplicate without N-able’s express written permission.
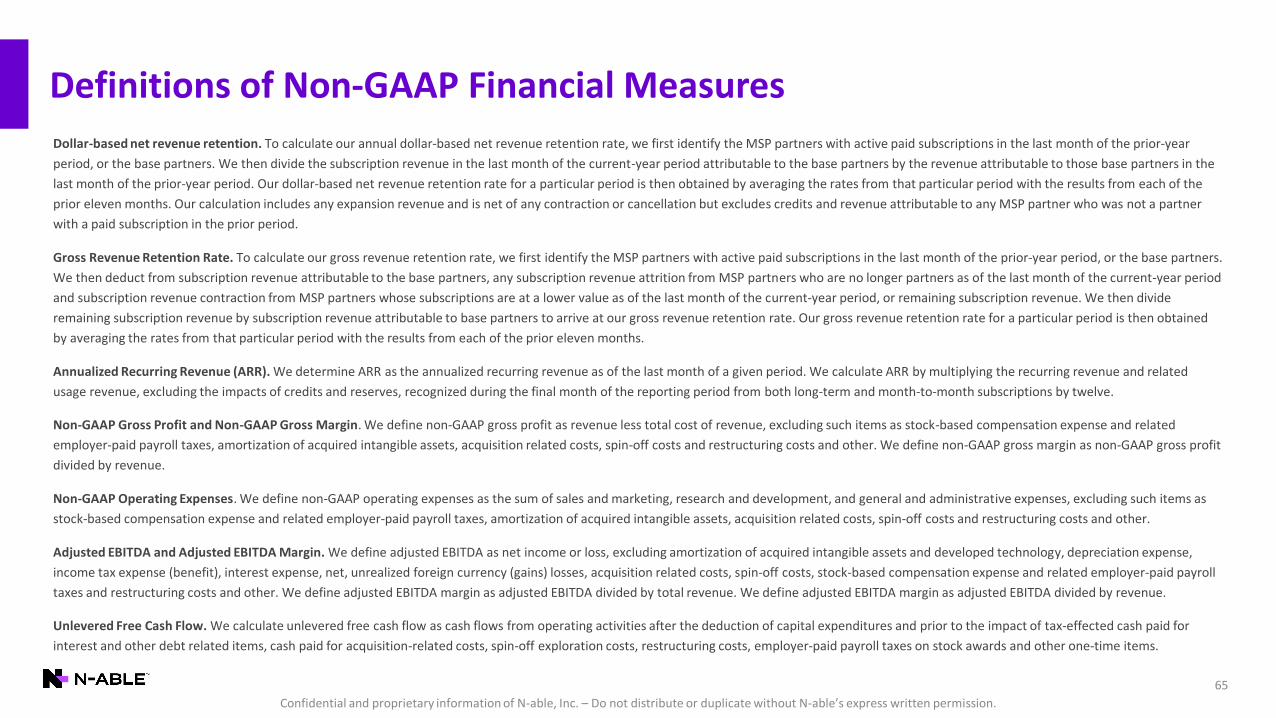
Definitions of Non-GAAP Financial Measures
65
Dollar-based net revenue retention. To calculate our annual dollar-based net revenue retention rate, we first identify the MSP partners with active paid subscriptions in the last month of the prior-year
period, or the base partners. We then divide the subscription revenue in the last month of the current-year period attributable to the base partners by the revenue attributable to those base partners in the
last month of the prior-year period. Our dollar-based net revenue retention rate for a particular period is then obtained by averaging the rates from that particular period with the results from each of the
prior eleven months. Our calculation includes any expansion revenue and is net of any contraction or cancellation but excludes credits and revenue attributable to any MSP partner who was not a partner
with a paid subscription in the prior period.
Gross Revenue Retention Rate. To calculate our gross revenue retention rate, we first identify the MSP partners with active paid subscriptions in the last month of the prior-year period, or the base partners.
We then deduct from subscription revenue attributable to the base partners, any subscription revenue attrition from MSP partners who are no longer partners as of the last month of the current-year period
and subscription revenue contraction from MSP partners whose subscriptions are at a lower value as of the last month of the current-year period, or remaining subscription revenue. We then divide
remaining subscription revenue by subscription revenue attributable to base partners to arrive at our gross revenue retention rate. Our gross revenue retention rate for a particular period is then obtained
by averaging the rates from that particular period with the results from each of the prior eleven months.
Annualized Recurring Revenue (ARR). We determine ARR as the annualized recurring revenue as of the last month of a given period. We calculate ARR by multiplying the recurring revenue and related
usage revenue, excluding the impacts of credits and reserves, recognized during the final month of the reporting period from both long-term and month-to-month subscriptions by twelve.
Non-GAAP Gross Profit and Non-GAAP Gross Margin. We define non-GAAP gross profit as revenue less total cost of revenue, excluding such items as stock-based compensation expense and related
employer-paid payroll taxes, amortization of acquired intangible assets, acquisition related costs, spin-off costs and restructuring costs and other. We define non-GAAP gross margin as non-GAAP gross profit
divided by revenue.
Non-GAAP Operating Expenses. We define non-GAAP operating expenses as the sum of sales and marketing, research and development, and general and administrative expenses, excluding such items as
stock-based compensation expense and related employer-paid payroll taxes, amortization of acquired intangible assets, acquisition related costs, spin-off costs and restructuring costs and other.
Adjusted EBITDA and Adjusted EBITDA Margin. We define adjusted EBITDA as net income or loss, excluding amortization of acquired intangible assets and developed technology, depreciation expense,
income tax expense (benefit), interest expense, net, unrealized foreign currency (gains) losses, acquisition related costs, spin-off costs, stock-based compensation expense and related employer-paid payroll
taxes and restructuring costs and other. We define adjusted EBITDA margin as adjusted EBITDA divided by total revenue. We define adjusted EBITDA margin as adjusted EBITDA divided by revenue.
Unlevered Free Cash Flow. We calculate unlevered free cash flow as cash flows from operating activities after the deduction of capital expenditures and prior to the impact of tax-effected cash paid for
interest and other debt related items, cash paid for acquisition-related costs, spin-off exploration costs, restructuring costs, employer-paid payroll taxes on stock awards and other one-time items.

Confidential and proprietary information of N-able, Inc. – Do not distribute or duplicate without N-able’s express written permission.
66
Non-GAAP reconciliations
Note: Metrics represent financials on a carve-out basis from SolarWinds Corporation unless otherwise noted.1. Forfeited tax shield related to interest payments assumes a statutory rate of 26.5% for our interest payments made by our Canadian entity and 0% for our interest payments made by our Cayman entity for the years ended December 31, 2020, 2019 and 2018.
1
Adjusted EBITDA($M) Q1'20 Q2'20 Q3'20 Q4'20 Q1'21 2018A 2019A 2020A
Net loss 1$ 3$ (1)$ (10)$ (4)$ (14)$ (3)$ (7)$
Amortization and depreciation 14 14 14 15 11 56 54 56
Income tax expense (benefit) 2 3 3 3 2 (4) 6 12
Interest expense, net 8 7 7 7 7 35 34 28
Unrealized foreign currency losses (gains) 0 1 0 0 0 2 (1) 2
Acquisition related costs 0 0 - 0 - 4 3 0
Spin-off costs - - 1 6 6 - - 7
Stock-based compensation 3 3 6 9 5 2 9 21
Restructuring costs and other 0 (0) 0 0 0 1 1 0
Adjusted EBITDA 27$ 31$ 31$ 31$ 28$ 81$ 103$ 121$
% margin 37% 43% 41% 38% 33% 36% 39% 40%
Unlevered Free Cash Flow($M) Q1'20 Q2'20 Q3'20 Q4'20 Q1'21 2018A 2019A 2020A
Cash flow from operations 12$ 33$ 24$ 16$ 13$ 52$ 26$ 86$
(-) Capital expenditures (3) (3) (3) (7) (5) (10) (8) (16)
Free cash flow 9 30 21 9 8 42 17 70
(+) Cash paid for interest, net of cash interest received 9 (0) 8 10 3 25 52 27
(+) Cash paid for acquisition-related costs, restructuring costs, spin-off exploration
costs, employer-paid payroll taxes on stock awards and other one-time items1 0 2 7 6 6 5 10
Unlevered free cash flow (excluding forfeited tax shield) 19 30 32 26 18 73 75 106
(-) Forfeited tax shield related to interest payments (2) - (2) (3) (1) (7) (10) (7)
Unlevered free cash flow 17$ 30$ 29$ 23$ 17$ 66$ 65$ 100$
% margin 23% 41% 39% 29% 21% 29% 25% 33%

Confidential and proprietary information of N-able, Inc. – Do not distribute or duplicate without N-able’s express written permission.
67
Non-GAAP reconciliations (cont’d)
Note: Metrics represent financials on a carve-out basis from SolarWinds Corporation unless otherwise noted.
Non-GAAP Cost of Revenue ($M) Q1'19 Q2'19 Q3'19 Q4'19 Q1'20 Q2'20 Q3'20 Q4'20 Q1'21 2018A 2019A 2020A
GAAP cost of revenue 14$ 14$ 14$ 15$ 15$ 15$ 16$ 17$ 14$ 57$ 57$ 63$
Amortization of acquired technologies (7) (6) (6) (6) (6) (6) (6) (7) (3) (26) (24) (24)
Stock-based compensation expense and
related employer-paid payroll taxes (1) (0) (0) (0) (0) (0) (0) (0) (0) (0) (1) (1)
Acquisition related costs (0) (0) (0) 0 (0) - - - - (0) (0) (0)
Non-GAAP cost of revenue 7$ 8$ 8$ 9$ 9$ 9$ 10$ 10$ 11$ 31$ 33$ 38$
Non-GAAP Sales and Marketing ($M) Q1'19 Q2'19 Q3'19 Q4'19 Q1'20 Q2'20 Q3'20 Q4'20 Q1'21 2018A 2019A 2020A
GAAP sales and marketing expense 17$ 18$ 18$ 18$ 18$ 19$ 21$ 24$ 26$ 62$ 70$ 82$
Stock-based compensation expense and
related employer-paid payroll taxes (1) (1) (0) (1) (1) (1) (1) (2) (1) (1) (2) (5)
Acquisition related costs (0) (0) (0) 0 - (0) - (0) - (2) (1) (0)
Restructuring costs and other - - (0) 0 - - - - - (0) (0) -
Spin-off exploration costs - - - - - - (0) (1) (0) - - (1)
Non-GAAP S&M expense 16$ 17$ 17$ 17$ 18$ 18$ 20$ 21$ 24$ 60$ 66$ 77$
Confidential and proprietary information of N-able, Inc. – Do not distribute or duplicate without N-able’s express written permission.
68
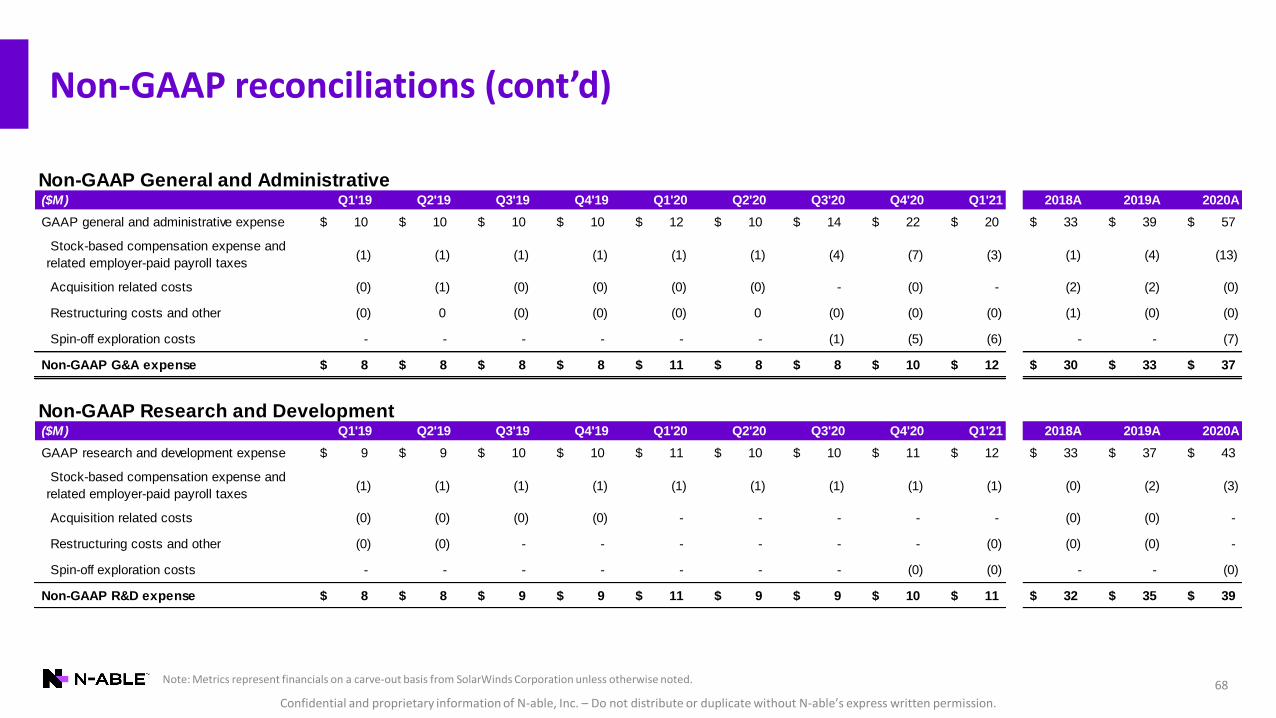
Non-GAAP reconciliations (cont’d)
Note: Metrics represent financials on a carve-out basis from SolarWinds Corporation unless otherwise noted.
Non-GAAP General and Administrative ($M) Q1'19 Q2'19 Q3'19 Q4'19 Q1'20 Q2'20 Q3'20 Q4'20 Q1'21 2018A 2019A 2020A
GAAP general and administrative expense 10$ 10$ 10$ 10$ 12$ 10$ 14$ 22$ 20$ 33$ 39$ 57$
Stock-based compensation expense and
related employer-paid payroll taxes (1) (1) (1) (1) (1) (1) (4) (7) (3) (1) (4) (13)
Acquisition related costs (0) (1) (0) (0) (0) (0) - (0) - (2) (2) (0)
Restructuring costs and other (0) 0 (0) (0) (0) 0 (0) (0) (0) (1) (0) (0)
Spin-off exploration costs - - - - - - (1) (5) (6) - - (7)
Non-GAAP G&A expense 8$ 8$ 8$ 8$ 11$ 8$ 8$ 10$ 12$ 30$ 33$ 37$
Non-GAAP Research and Development ($M) Q1'19 Q2'19 Q3'19 Q4'19 Q1'20 Q2'20 Q3'20 Q4'20 Q1'21 2018A 2019A 2020A
GAAP research and development expense 9$ 9$ 10$ 10$ 11$ 10$ 10$ 11$ 12$ 33$ 37$ 43$
Stock-based compensation expense and
related employer-paid payroll taxes (1) (1) (1) (1) (1) (1) (1) (1) (1) (0) (2) (3)
Acquisition related costs (0) (0) (0) (0) - - - - - (0) (0) -
Restructuring costs and other (0) (0) - - - - - - (0) (0) (0) -
Spin-off exploration costs - - - - - - - (0) (0) - - (0)
Non-GAAP R&D expense 8$ 8$ 9$ 9$ 11$ 9$ 9$ 10$ 11$ 32$ 35$ 39$