Embed Size (px)
Citation preview
NASA Technical Memorandum 103B12
An Assessment of the Government LiquidHydrogen Requirements for the 1995 - 2005
Time Frame Including Addendum, LiquidHydrogen Production and Commercial De-mand in the United States
July 1990
(NA_A-]M-!03_|2) AN AS_;LSS4ENT UF THE r,__ _) N91-161_,odOVr'&_JM_NT Li_dT_ HYDR_GLN _c.n,UTR_'MENTS F --TH#,U--
TH_ L_V_-?O05 TIME _RAMF INCLUOINC, A00ENL)UM, 7_/? NgI-I_L55
LI_JI r_ HY_RqbF_ PRL_nUCTIGN AND CUMMERCIAL Unc1_s
UFMAcJ_ IN THE UNIT2 n STAT_$ (NASA) -_p G3/Zg 03097_l
N/ ANational Aeronautics andSpace Administration
https://ntrs.nasa.gov/search.jsp?R=19910006853 2018-07-14T15:49:24+00:00Z

,w
NASA Technical Memorandum 103812
An Assessment of the Government LiquidHydrogen Requirements for the 1995 - 2005Time Frame Including Addendum, LiquidHydrogen Production and Commercial De-mand in the United States
Addison Bain
Center Support OperationsKennedy Space Center, Florida 32899
July 1990
National Aeronautics and
Space Administration
John F. Kennedy Space Center
I RIASA
TABLE OF CONTENTS
SUBJECT
AcknowledgmentsAbbreviations and AcronymsPurposescopeAuthorityIntroduction
Study ApproachReport FormatProgram/Project Discussion
Kennedy Space CenterStennis Space CenterOther NASA Centers
Vandenberg AFBEdwards AFB
Department of EnergyDepartment of CommerceGovernment Contractor Locations
The SEALAR ProgramThe HALE ProgramThe THESEUS Proararn
PAGE
°°°
III
iv11111233456678899
10
ACKNOWLEDGMENTS
A number of information sources were used to obtain the data needed to develop this report.The personnel listed under "LH2 Development Study Distribution Ust" at the back of thisreport were contacted for any relevant data or information useful in the report development.
Data used in this report regarding the commercial production levels and market demands wasobtained from the SRI International study under NASA-KSC Contract NAS10-11643.
III
ABBREVIATIONS AND ACRONYMS
AFBAFFTCALDPALSCCAFSDFRFDOEEAFBHALEJSCKKSCLaRCLeRCLH2LO2MSFCNASANASPNISTNOLANTSOBQOMVP&WR&DRL-10SEALARSSCSSMESTMESTSTPDVAFBWSTFMVTR
Air Force Base
Air Force Right Test Center (Edwards AFB)Advanced Launch Development ProgramAdvanced Launch SystemCape Canaveral Air Force StationDryden Flight Research FacilityDepartment of EnergyEdwards Air Force Base
High-Altitude Long-EnduranceJohnson Space Center1000 poundsJohn F. Kennedy Space CenterLangley Research CenterLewis Research Center (Cleveland, OH)LiquidHydrogenUquid OxygenGeorge C. Marshall Space Flight CenterNational Aeronautics and Space AdministrationNational Aerospace PlaneNational Institute of Standards and TechnologyNew Orleans, LANational Technical SystemsOn Board QuantityOrbital Maneuvering Vehicle ProjectPratt & WhitneyResearch & DevelopmentRocketdyne EngineSea Launch and Recovery VehicleStennis Space CenterSpace Shuttle Main EngineSpace Transportation Main EngineSpace Transportation SystemTons Per Day (730,000 #/yr)Vandenberg Air Force BaseWhite Sands Test FacilityWestem Test Range
iv
S/--.2 ._
N91-16167
AN ASSESSMENT OF THE GOVERNMENT UQUID HYDROGEN REQUIREMENTS FORTHE 1995- 2005 TIME FRAME
PURPOSE
The purpose of this report is to present the results of a govemment study of long range liquidhydrogen (LH2) requirements for the time period of 1995 through the year 2005. Theinformation in this report will be used to determine LH2 acquisition strategies to assure futureavailability of LH2 to support the variety of government programs as proposed.
SCOPE
The report reflects projected govemment LH2 consumption patterns and is presented ingeographical as well as programmatic aspects. In addition, current LH2 production levels andthe influence of the commercial marketplace is included based on data provided from aNASNKSC contracted study with SRI Intemational.
AUTHORITY
The Kennedy Space Center (KSC) is chartered to manage LH2 in support of all NASA programsand other government agency programs as prescribed by procurement regulations and mutualagreements.
INTRODUCTION
To assure an adequate supply of LH2 is available in support of various programs, it isimperative a long range projection of LH2 requirements be developed and maintained. Thisinformation is vital in the planning for necessary procurement actions and assuring adequateindustry lead time to acquiring the necessary production and distribution capabilities.
STUDY APPROACH
A number of personnel were contacted representing various organizations having knowledge ofpotential LH2 needs in terms of technical aspects, program guidelines, schedules or otheruseful data to assemble consumption projections. It was predetermined that it would not bepossible to guarantee LH2 amounts in specified time frames due to the typical dynamicbehavior of program changes experienced from budget considerations and policy decisions.Optimistic as well as pessimistic projections were provided. The optimistic projectionrepresents the LH2 requirements to current known schedules and contemplated projects beingapproved as currently proposed by the respective project office. The pessimistic projection issimply an arbitrary lower estimate on the part of the data source. Specific explanations areprovided in the text.
The charting (exhibits) shows LH2 projections in tons per day (TPD) which equates to 730,000pounds on an annual basis. Data was normalized on an annual basis. "Peaks" and "valleys" insite specific daily or monthly demands, although a very significant logistics concem, were notconsidered in this study.
REPORT FORMAT
The report content is structured in the following manner:
Program/Project Discussion
Each specific program or project is discussed regarding its scope,technical aspects, assumptions, method of data derivation, andscheduling information.
Data Display
Explanations are provided on the methods selected for displayingand summarizing the data.
Exhibit Discussion
A discussion is provided for each exhibit to orient the reader withthe chart data.
Concluding Observations
2
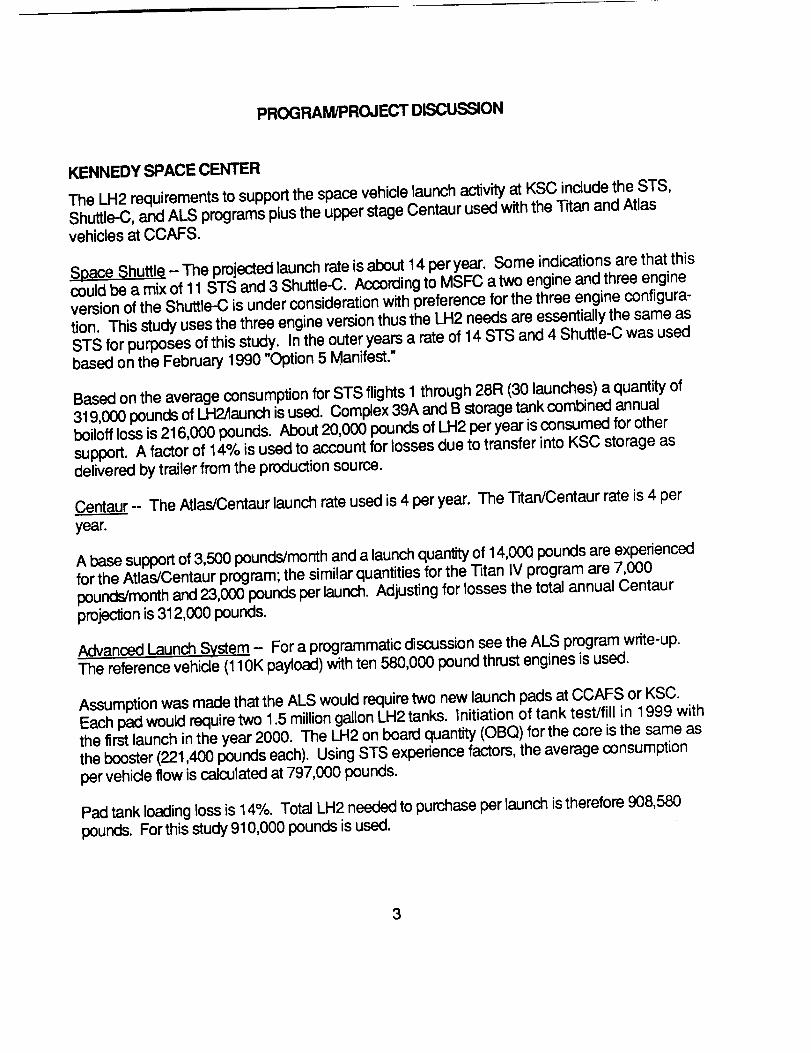
PROGRAM/PROJECT DISCUSSION
KENNEDY SPACE CENTER
The LH2 requirements to support the space vehicle launch activity at KSC include the STS,Shuttle-C, and ALS programs plus the upper stage Centaur used with the "l-danand Atlasvehicles at CCAFS.
Space Shuttle - The projected launch rate is about 14 per year. Some indications are that thiscould be a mix of 11 STS and 3 Shuttle-C. According to MSFC a two engine and three engineversion of the Shuttle-C is under consideration with preference for the three engine configura-tion. This study uses the three engine version thus the LH2 needs are essentially the same asSTS for purposes of this study. In the outer years a rate of 14 STS and 4 Shuttle-C was usedbased on the February 1990 "Option 5 Manifest."
Based on the average consumption for STS flights 1 through 28R (30 launches) a quantity of319,000 pounds of LH2Aaunch is used. Complex 39A and B storage tank combined annualboiloffloss is 216,000 pounds. About 20,000 pounds of LH2 per year is consumed for othersupport. A factor of 14% is used to account for losses due to transfer into KSC storage asdelivered by trailer from the production source.
Centaur -- The Atlas/Centaur launch rate used is 4 per year. The Titan/Centaur rate is 4 peryear.
A base support of 3,500 pounds/month and a launch quantity of 14,000 pounds are experiencedfor the Atlas/Centaur program; the similar quantities for the Titan IV program are 7,000pounds/month and 23,000 pounds per launch. Adjusting for losses the total annual Centaurprojection is 312,000 pounds.
Advanced Launch System -- For a programmatic discussion see the ALS program write-up.The reference vehicle (110K payload) with ten 580,000 pound thrust engines is used.
Assumption was made that the ALS would require two new launch pads at CCAFS or KSC.Each pad would require two 1.5 million gallon LH2 tanks. Initiation of tank test/fill in 1999 withthe first launch in the year 2000. The LH2 on board quantity (OBQ) for the core is the same asthe booster (221,400 pounds each). Using STS experience factors, the average consumptionper vehicle flow is calculated at 797,000 pounds.
Pad tank loading loss is 14%. Total LH2 needed to purchase per launch is therefore 908,580pounds. For this study 910,000 pounds is used.
3
Experience shows a 0.25 factor for pad tank annual boUoff including transfer/filling losses.Therefore this loss is calculated as 885,000 pounds/year (4 tanks). This value would beconstant for each year. The launch rate (traffic model) is taken from a July 1989 manifest andslipped according to an April 1990 program review presentation, using 2 per year followed by 4per year in the initial part of the program.
STENNIS SPACE CENTER
The LH2 requirements to support SSC include the on-going SSME testing for Space Shuttlewith the addition of the ALS program involving thrust chamber, gas generator, turbopumpassembly and main engine testing.
SSME - The SSME testing program (requalification) involves engine fidngs for a variety oftest runs such as 1.5 seconds, 250 seconds, or 520 seconds duration. Usage per test is 50,000pounds plus 147 pounds per second of test. The ongoing program is an "8 test" per monthschedule. The quantity was calculated at 10,731,000 pounds per year and is used as a constantrequirement for purposes of this study.
ALS - The product requirement for the proposed ALS program is dependent on the enginedesign chosen and amount of developmental work required, associated with the engine and itssubcomponents. The flow rates and planned durations are normally known. Due to the natureof a hardware development program involving a sophisticated cryogenically fueled spacevehicle engine actual test durations and number of tests needed are simply unpredictable.Using an experience base of engine development history and knowledge of the proposed enginebasic performance characteristics a range of projections was however developed.
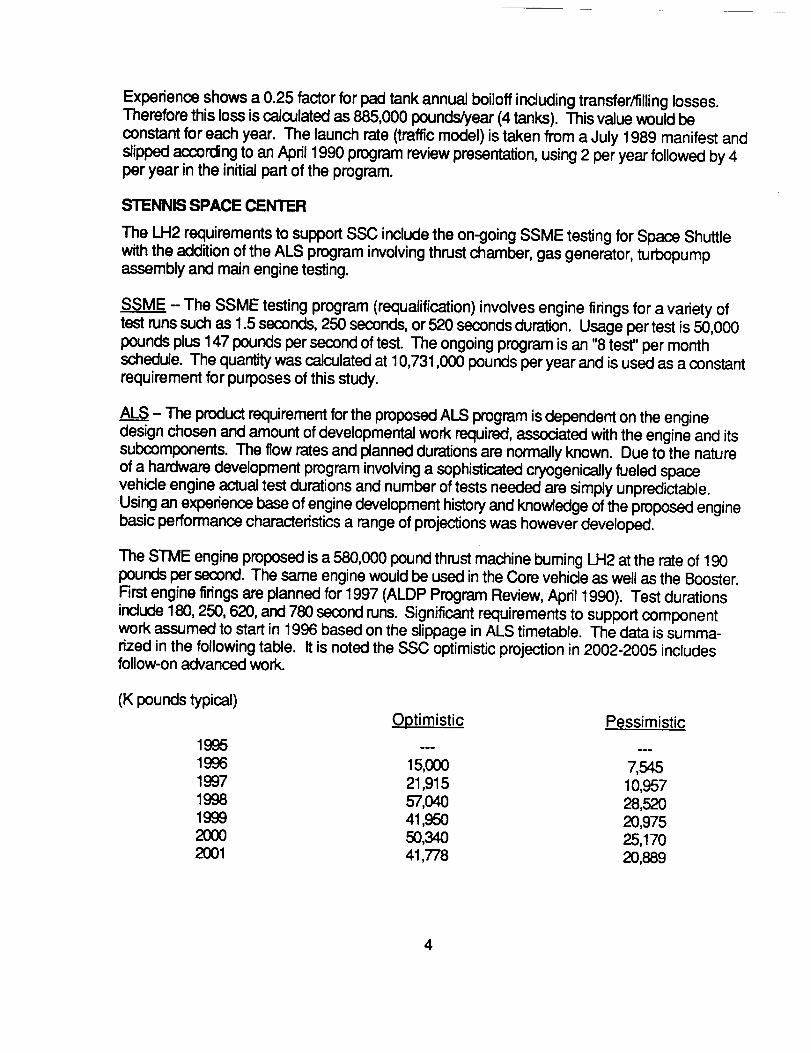
The STME engine proposed is a 580,000 pound thrust machine burning LH2 at the rate of 190pounds per second. The same engine would be used inthe Core vehicle as well as the Booster.First engine tidngs are planned for 1997 (ALDP Program Review, April 1990). Test durationsinclude 180, 250, 620, and 780 second runs. Significant requirements to support componentwork assumed to start in 1996 based on the slippage in ALS timetable. The data is summa-rized in the following table. It is noted the SSC optimistic projection in 2002-2005 includesfollow-on advanced work.
(K pounds typical)Optimistic Pessimistic
995 ..e ...
1996 15,000 7,5451997 21,915 10,9571998 57,040 28,52O1999 41,950 20,97520(X) 50,340 25,1702001 41,778 20,889
4
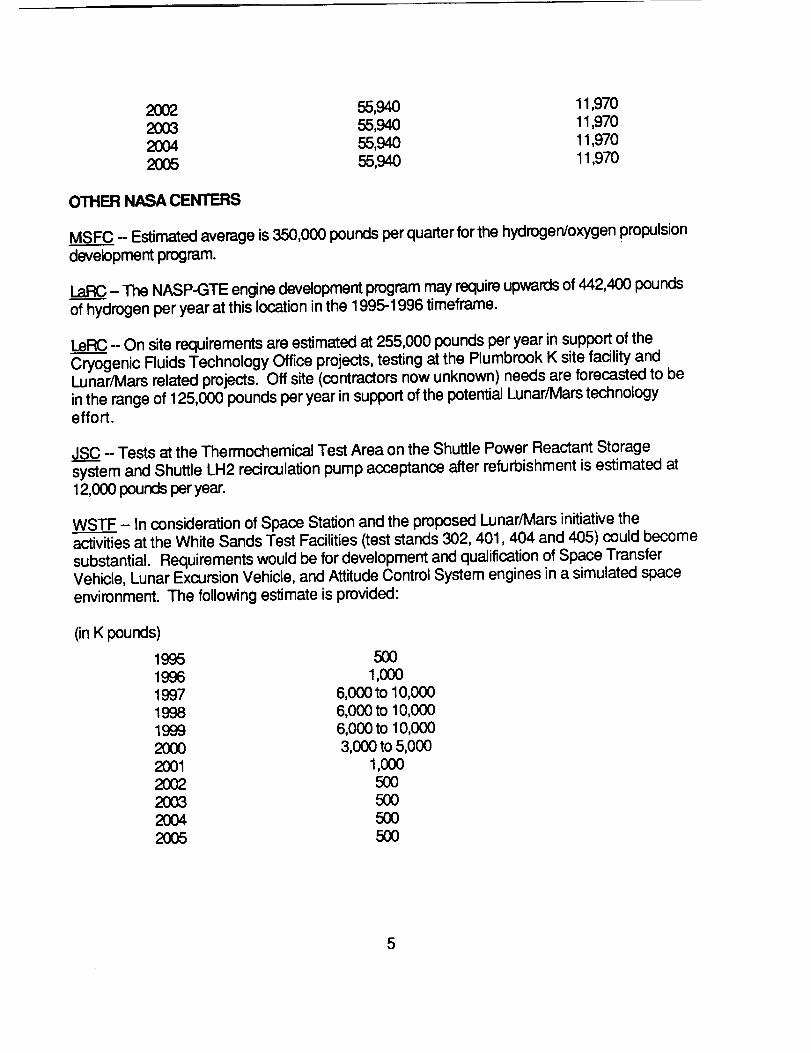
2002 55,940 11,9702003 55,940 11,9702004 55,940 11,9702005 55,940 11,970
OTHER NASA CENTERS
MSFC - Estimated average is 350,000 pounds per quarter for the hydrogen/oxygen propulsion
development program.
LaRC - The NASP-GTE engine development program may require upwards of 442,400 poundsof hydrogen per year at this location in the 1995-1996 timeframe.
LeRC - On site requirements are estimated at 255,000 pounds per year in support of theCryogenic Fluids Technology Office projects, testing at the Plumbrook K site facility andLunar/Mars related projects. Off site (contractors now unknown) needs are forecasted to bein the range of 125,000 pounds per year in support of the potential Lunar/Mars technologyeffort.
JSC - Tests at the Thermochemical Test Area on the Shuttle Power Reactant Storagesystem and Shuttle LH2 recirculation pump acceptance after refurbishment is estimated at12,000 pounds per year.
WSTF -- In consideration of Space Station and the proposed Lunar/Mars initiative theactivities at the White Sands Test Facilities (test stands 302, 401,404 and 405) could becomesubstantial. Requirements would be for development and qualification of Space TransferVehicle, Lunar Excursion Vehicle, and Attitude Control System engines in a simulated spaceenvironment. The following estimate is provided:
(in K pounds)
1995 5001996 1,0001997 6,000 to 10,0001998 6,000 to 10,0001999 6,000 to 10,0002OO0 3,000 to 5,0002001 1,00020O2 50O2O03 5OO2OO4 5O02O05 5OO
5
DFRF- A Structural Test Facility, using LH2, to perform thermal related tests on advancedairframe configurations is planned to be built by 1993/94. The initial work will be in support ofthe X-30 and NASP programs. For the timeframe of 1995 to 1999 the LH2 estimate is 300,000pounds per year, and for 2000 through 2005, 150,000 pounds per year in support of potentialadvanced space vehicle structures research.
VANDENBERG AFB
Centaur- T'_an IV/Centaur launches are planned at VAFB. Three launches per year of theT_n IV are planned however only one is planned to have the Centaur upper stage. Based onexperience of Centaur usage at CCAFS the VAFB estimate is 126,000 pounds per year.
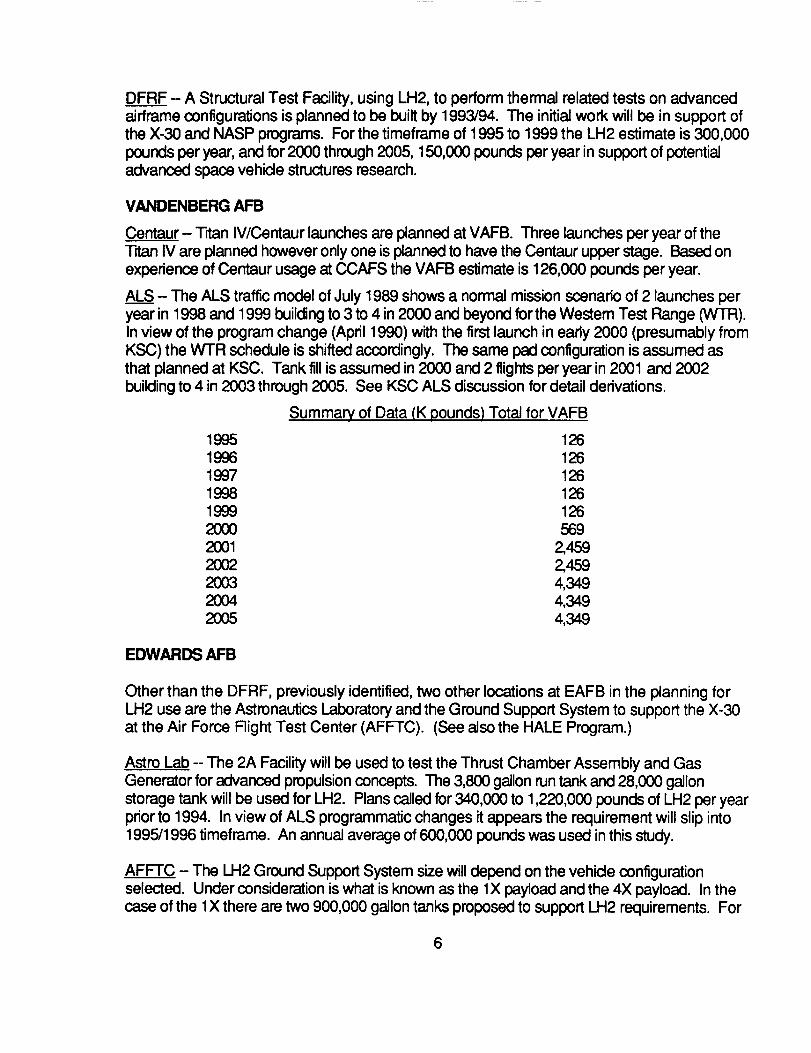
ALS - The ALS traffic model of July 1989 shows a normal mission scenario of 2 launches peryear in 1998 and 1999 buildingto 3 to 4 in 2000 and beyond for the Western Test Range (WTR).In view of the program change (April 1990) with the first launch in early 2000 (presumably fromKSC) the WTR schedule is shifted accordingly. The same pad cont_gur_on is assumed asthat planned at KSC. Tank fill is assumed in 2000 and 2 flightsper year in 2001 and 2002buildingto 4 in 2003 through 2005. See KSC ALS discussion for detail derivations.
Summary of Data (K pounds) Total for VAFB
1995 1261996 1261997 1261998 1261999 1262OO0 5692001 2,4592002 2,4592003 4,3492004 4,3492005 4,349
EDWARDS AFB
Other than the DFRF, previously identified, two other locations at EAFB in the planning forLH2 use are the Astronautics Laboratory and the Ground Support System to support the X-30at the Air Force Flight Test Center (AFFTC). (See also the HALE Program.)
Astro Lab -- The 2A Facility will be used to test the Thrust Chamber Assembly and GasGenerator for advanced propulsion concepts. The 3,800 gallon run tank and 28,000 gallonstorage tank will be used for LH2. Plans called for 340,000 to 1,220,000 pounds of LH2 per yearprior to 1994. In view of ALS programmatic changes it appears the requirement will slip into1995/1996 timeframe. An annual average of 600,000 pounds was used in this study.
AFFTC - The LH2 Ground Support System size will depend on the vehicle configurationselected. Under consideration is what is known as the lX payload and the 4X payload. In thecase of the lX there are two 900,000 gallon tanks proposed to support LH2 requirements. For
6
the 4X two 1,500,000 gallon tanks are proposed. The on-board quantity for 1X is about 120,000pounds and for the 4X about 200,000 pounds. For this study activation of the ground systemwas assumed for 1996 with the first flight in 1997. To determine the effect on LH2 require-ments during 1999 through 2002 a low and high range were picked to establish the rangemagnitude. The range looked at is for a 1X at 20 flights per year over 4 years at 165,000pounds per flight (allowing for losses) which equated to 3,300,000 pounds per year. The otheris for a 4X at 40 flights per year over 4 years at 280,000 pounds per flight, equating to10,200,000 pounds per year. For 2003 through 2005 a range of 825,000 to 2,800,000 pounds ofLH2 was selected (no data source) representing 5 to 10 operational flights per year (1X and 4Xrespectively).
DEPARTMENT OF ENERGY
The DOE has a number of research plants and laboratories engaged in projects requiring bulkgaseous hydrogen (delivered as liquid) and some direct liquid requirements. The followingsummarizes these requirements and locations.
West Coast
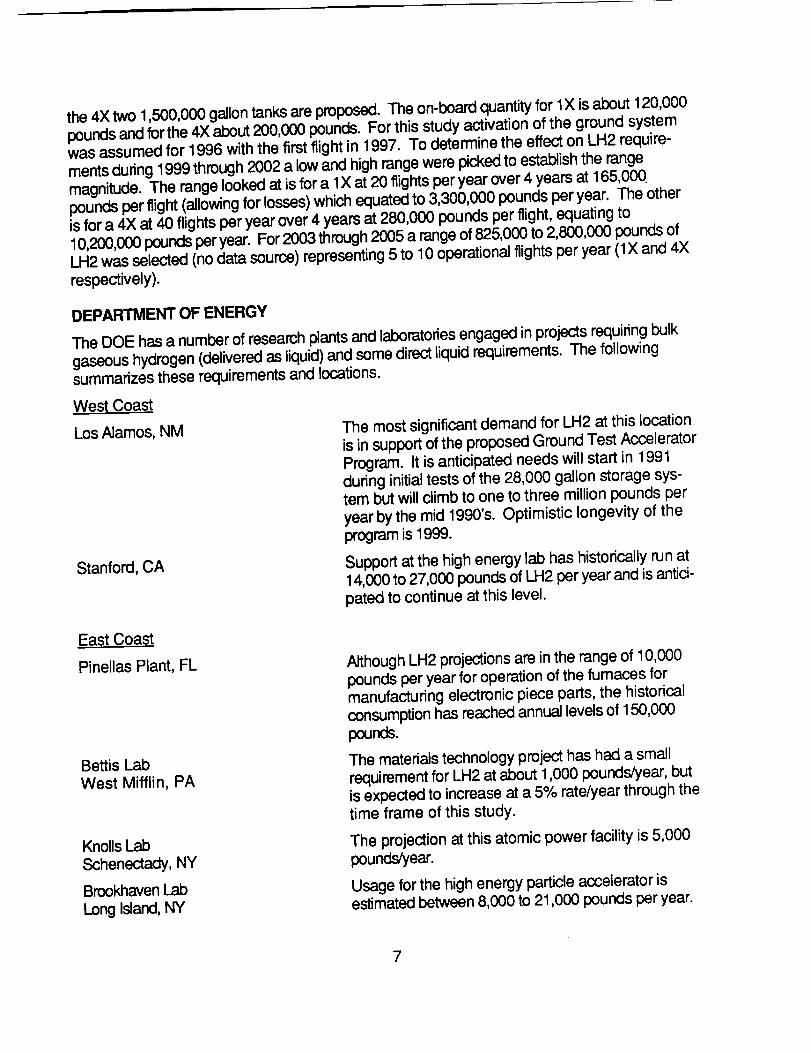
Los Alamos, NM
Stanford, CA
The most significant demand for I_H2 at this locationis in support of the proposed Ground Test AcceleratorProgram. It is anticipated needs will start in 1991during initial tests of the 28,000 gallon storage sys-tem but will climb to one to three million pounds peryear by the mid 1990's. Optimistic longevity of theprogram is 1999.
Support at the high energy lab has historically run at14,000 to 27,000 pounds of LH2 per year and is antici-pated to continue at this level.
East Coast
Pinellas Plant, FL
Bettis LabWest Mifflin, PA
Knolls Lab
Schenectady, NY
Brookhaven Lab
Long Island, NY
Although LH2 projections are in the range of 10,000pounds per year for operation of the furnaces formanufacturing electronic piece parts, the historicalconsumption has reached annual levels of 150,000pounds.
The materials technology project has had a smallrequirement for LH2 at about 1,000 pounds/year, butis expected to increase at a 5% rate/year through thetime frame of this study.
The projection at this atomic power facility is 5,000pounds_year.
Usage for the high energy particle accelerator isestimated between 8,000 to 21,000 pounds per year.
7
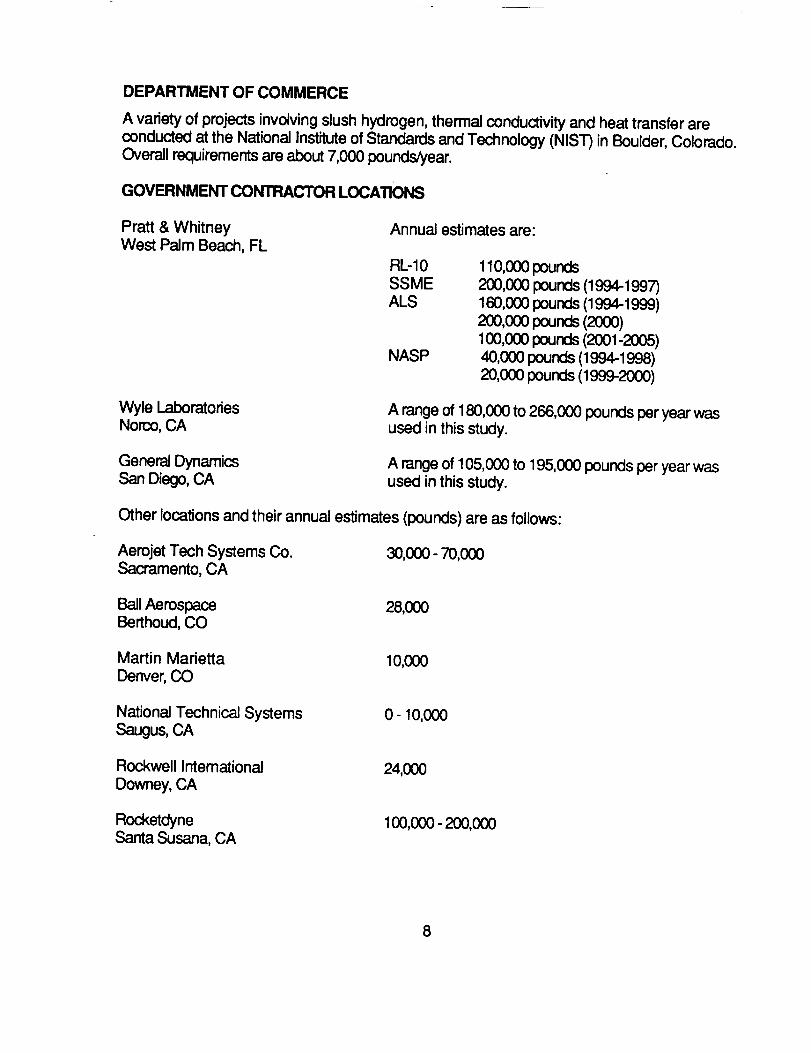
DEPARTMENTOF COMMERCE
A varietyof projects involving slush hydrogen, thermal conductivity and heat transfer areconducted at the National Institute of Standards and Technology (NIST) in Boulder, Colorado.
Overall requirements are about 7,000 pounds/year.
GOVERNMENT CONTRACTOR LOCATIONS
Pratt & WhitneyWest Palm Beach, FL
Annual estimates are:
RL-10SSMEALS
NASP
110,000 pounds200,000 pounds (1994-1997)160,000pounds (I994-1999)2oo,ooopounds(2(X)0)100,000 pounds (2001-2005)40,000 pounds (1994-1998)20,000pounds(1999-2000)
Wyle LaboratoriesNorco, CA
A range of 180,000 to 266,000 pounds per year wasused in this study.
General DynamicsSan Diego,CA
A range of 105,000 to 195,000 pounds per year wasused in this study.
Other locations and their annual estimates (pounds) are as follows:
Aerojet Tech Systems Co.Sacramento, CA
30,000- 70,000
Ball Aerospace 28,000Berthoud, CO
Martin Marietta 10,000Denver, CO
National Technical SystemsSaugus,CA
0-10,000
Rockwell Intemational
Downey, CA24,000
RocketdyneSanta Susana, CA
100,000 - 200,000
8
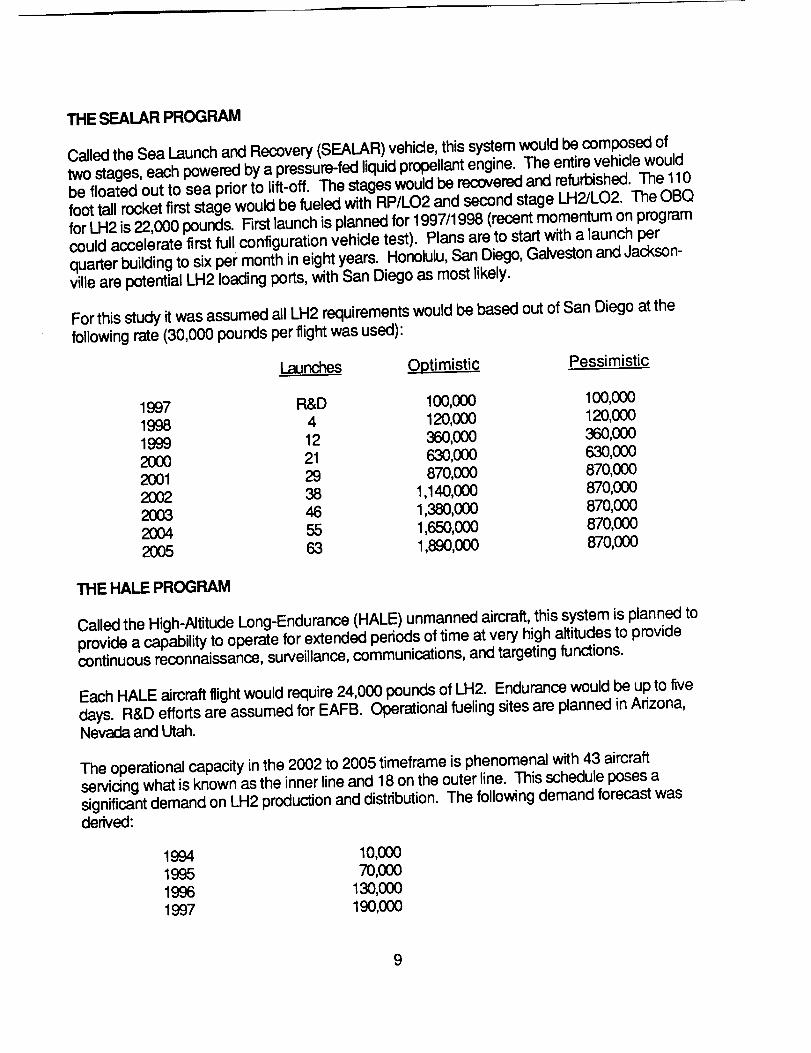
THE SEALAR PROGRAM
Called the Sea Launch and Recovery (SEALAR) vehicle, this system would be composed oftwo stages, each powered by a pressure-fed liquid propellant engine. The entire vehicle wouldbe floated out to sea prior to lift-off. The stages would be recovered and refurbished. The 110foot tall rocket first stage would be fueled with RP/LO2 and second stage LH2/LO2. The OBQfor LH2 is 22,000 pounds. First launch is planned for 1997/1998 (recent momentum on programcould accelerate first ful ! configuration vehicle test). Plans are to start with a launch perquarter building to six per month in eight years. Honolulu, San Diego, Galveston and Jackson-ville are potential LH2 loading ports, with San Diego as most likely.
For this study it was assumed all LH2 requirements would be based out of San Diego at thefollowing rate (30,000 pounds per flight was used):
Launches O.ptimistic Pessimistic
1997 R&D 100,000 100,0001998 4 120,000 120,0001999 12 360,000 360,0002000 21 630,000 630,0002001 29 870,000 870,0002002 38 1,140,000 870,0002003 46 1,380,000 870,0002004 55 1,650,000 870,0002005 63 1,890,000 870,000
THE HALE PROGRAM
Called the High-Altitude Long-Endurance (HALE) unmanned aircraft, this system is planned toprovide a capability to operate for extended periods of time at very high altitudes to providecontinuous reconnaissance, surveillance, communications, and targeting functions.
Each HALE aircraft flight would require 24,000 pounds of LH2. Endurance would be up to fivedays. R&D efforts are assumed for EAFB. Operational fueling sites are planned in Arizona,Nevada and Utah.
The operational capacity in the 2002 to 2005 timeframe is phenomenal with 43 aircraftservidng what is known as the inner line and 18 on the outer line. This schedule poses asignificant demand on LH2 production and distribution. The following demand forecast wasderived:
1994 10,0001995 70,0001996 130,0001997 190,000
9
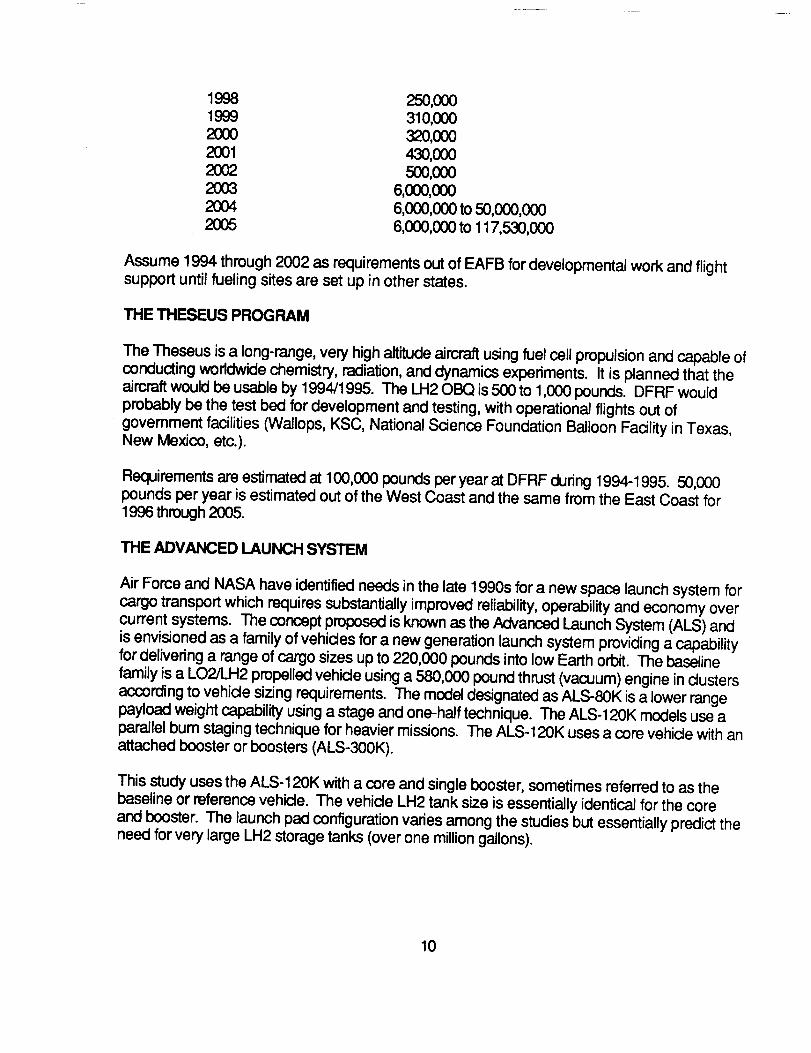
1998 250,0001999 310,0002000 320,0002001 430,0002002 500,0002003 6,000,0002004 6,000,000 to 50,000,0002005 6,000,000 tO 117,530,000
Assume 1994 through 2002 as requirements out of EAFB for developmental work and flightsupport until fueling sites are set up in other states.
THE THESEUS PROGRAM
The Theseus is a long-range, very high altitude aircraft using fuel cell propulsion and capable ofconducting worldwide chemistry, radiation, and dynamics experiments. It is planned that theaircraft would be usable by 1994/1995. The LH20BQ is 500 to 1,000 pounds. DFRF wouldprobably be the test bed for development and testing, with operationai flights out ofgovernment facilities (Wallops, KSC, National Science Foundation Balloon Facility in Texas,New Mexico, etc.).
Requirements are estimated at 100,000 pounds per year at DFRF during 1994-1995. 50,000pounds per year is estimated out of the West Coast and the same from the East Coast for1996 through 2(X)5.
THE ADVANCED LAUNCH SYSTEM
Air Force and NASA have identified needs in the late 1990s for a new space launch system forcargo transport which requires substantially improved reliability, operability and economy overcurrent systems. The concept proposed is known as the Advanced Launch System (ALS) andis envisioned as a family of vehicles for a new generation launch system providing a capabilityfor delivering a range of cargo sizes up to 220,000 pounds into low Earth orbit. The baselinefamily is a LO2/LH2 propelled vehicle using a 580,000 pound thrust (vacuum) engine in clustersaccording to vehicle sizing requirements. The model designated as ALS-80K is a lower rangepayload weight capability using a stage and one-half technique. The ALS-120K models use aparallel bum staging technique for heavier missions. The ALS-120K uses a core vehicle with anattached booster or boosters (ALS-300K).
This study uses the ALS-120K with a core and single booster, sometimes referred to as thebaseline or reference vehicle. The vehicle LH2 tank size is essentially identical for the coreand booster. The launch pad configuration varies among the studies but essentially predict theneed for very large LH2 storage tanks (over one million gallons).
10
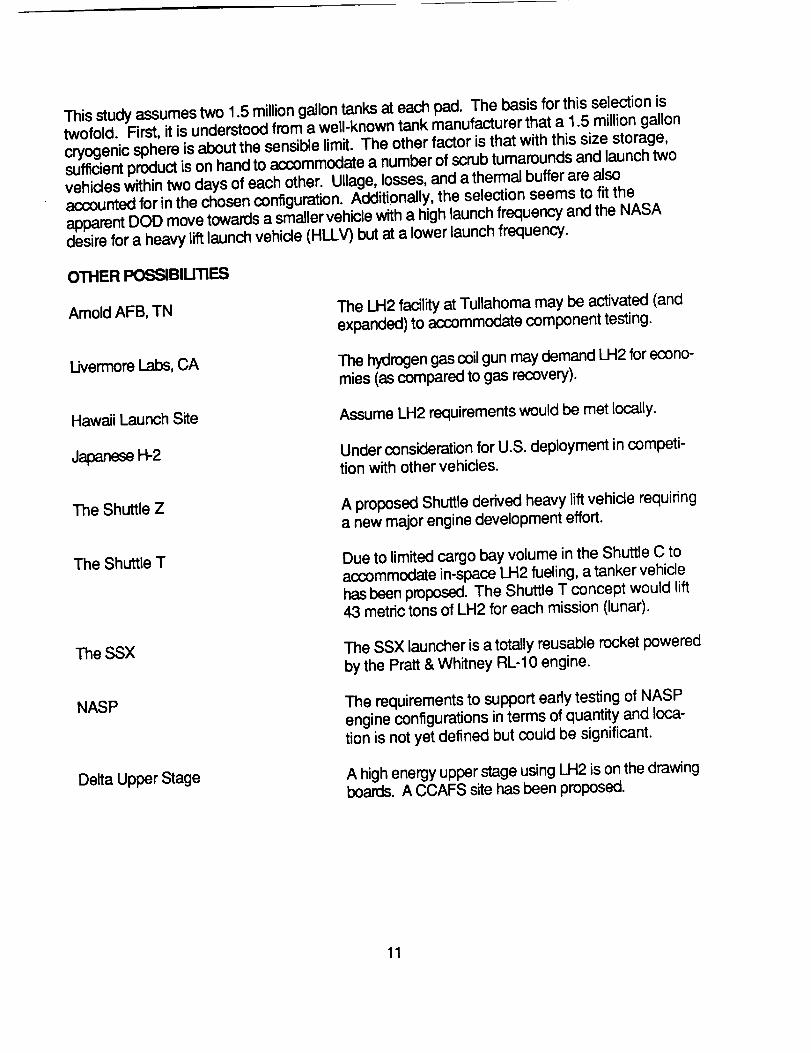
This studyassumestwo 1.5milliongallontanksat each pad. The basis for this selection istwofold. First, it is understoodfrom a well-knowntank manufacturerthat a 1.5 milliongalloncryogenicsphere is aboutthe sensiblelimit. The other factor is that with this size storage,sufficientproductis on handto accommodatea numberof scrubtumaroundsand launchtwovehicleswithintwo daysof each other. Ullage,losses,and athermalbufferare alsoaccountedfor in the chosenconfiguration.Additionally,the selectionseems to fit theapparentDOD movetowardsa smallervehiclewitha highlaunchfrequencyandthe NASAdesire for a heavylift launchvehicle (HLLV)but at a lower launchfrequency.
OTHER POSSlBlUTIES
Arnold AFB, TN The LH2 facility at Tullahoma may be activated (andexpanded) to accommodate component testing.
L.ivermoreLabs, CA The hydrogen gas coil gun may demand LH2 for econo-mies (as compared to gas recovery).
Hawaii Launch Site Assume LH2 requirements would be met locally.
Japanese H-2 Under consideration for U.S. deployment in competi-tion with other vehicles.
The Shuttle Z A proposed Shuttle derived heavy lift vehicle requiringa new major engine development effort.
The Shuttle T Due to limited cargo bay volume in the Shuttle C toaccommodate in-space LH2 fueling, a tanker vehiclehas been proposed. The Shuttle T concept would lift43 metric tons of LH2 for each mission (lunar).
The SSX The SSX launcher is a totally reusable rocket poweredby the Pratt & Whitney RL-10 engine.
NASP The requirements to support early testing of NASPengine configurations in terms of quantity and loca-tion is not yet defined but could be significant.
Delta Upper Stage A high energy upper stage using LH2 is on the drawingboards. A CCAFS site has been proposed.
11
U.S.HydrogenEnergyEcon-omy
Commercial Demand
Miscellaneous
Subject to pending legislation DOE and NASA may berequested to engage in R&D projects to promotenon-fossil derived LH2 production and commercialaircraft utilization of LH2 as a fuel. Increased envi-ronmental concerns, fossil fuel limitations, and inter-national competition for energy applications couldinspire increased use of hydrogen.
The variety of goods and services using hydrogen(currently 9,000,000 tons annually) is anticipated togrow. The LH2 demand (currently 30,000 tons) isanticipated to grow accordingly due to its transporteconomics to support the commercial industries. TheSRI study under KSC contract shows this growthpattern.
Further coordination is needed at some potentialsites such as Colorado Springs, TRW at RedondoBeach, CA (OMV project) and programs such as theNaval Unmanned Aerial Vehicle (UAV) projects.
12
DATADISPLAY
HistoricaJly LH2 contracting has been split between what has been termed "West Coast" and
"East Coast." The reason for this was simply due to the fact that production and majorconsuming sites were either concentrated in the California area or in the Mississippi/Ala-bama/Florida region. Today the West Coast contract provides LH2 services to California, NewMexico, and Colorado sites from a production plant near Los Angeles. The East Coastcontract serves Texas, Mississippi, Alabama, Florida, Virginia, and Ohio consuming sites froma production source in New Orleans. Typically the major space program needs have concen-trated at the engine test site in Mississippi (Stennis Space Center) and at the launch site inFlorida (Kennedy Space Center). In view of these factors the data has been summarized anddisplayed as shown in the following exhibits.
13
EXHIBIT DISCUSSION
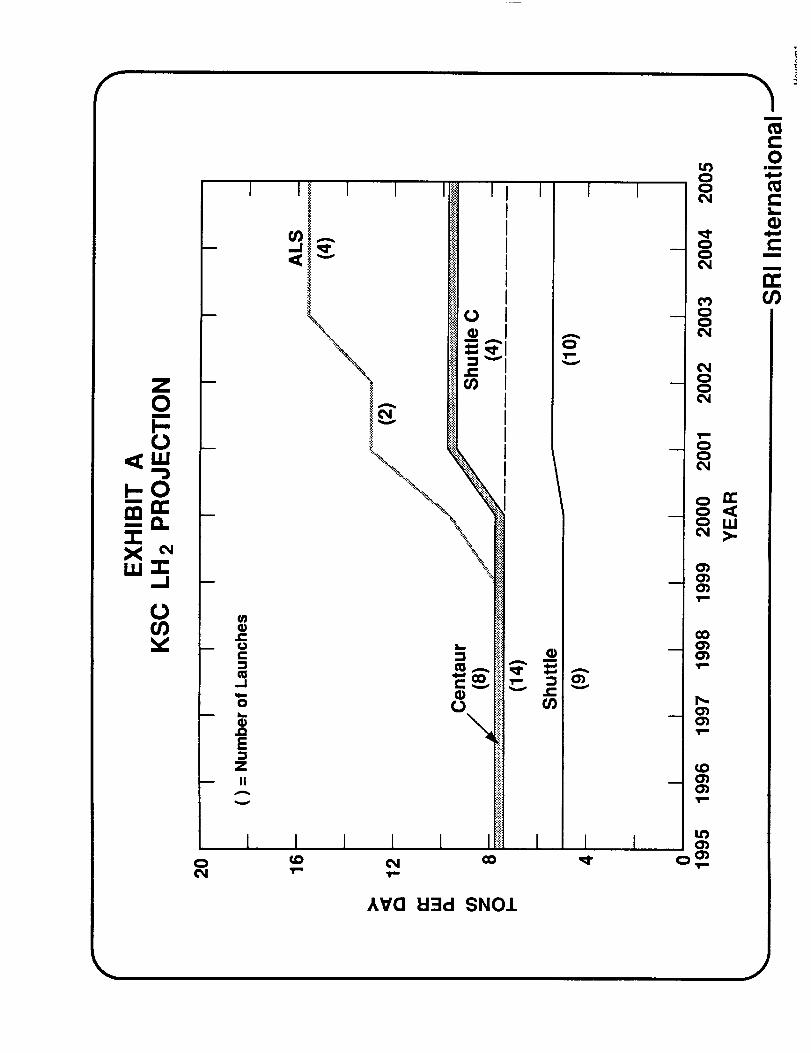
Exhibit A - This exhibit shows the LH2 projection in tons per day at the Kennedy SpaceCenter. The Shuttle launch requirements are depicted in the range of 9 to 14 launches peryear. The Shuttle launch rate of 14 could include 11 manned and 3 cargo configurations. Theproposed Shuttle-C _th LH2 payloads is shown at a launch rate of 4 per year. The influence ofthe Atlas Centaur and Titan Centaur launches from Cape Canaveral Air Force Station is shownat a total predicted rate of 8 per year. Assuming the first ALS launch is in the year 2000 theinfluence of a launch rate of 2 and then 4 per year is illustrated.
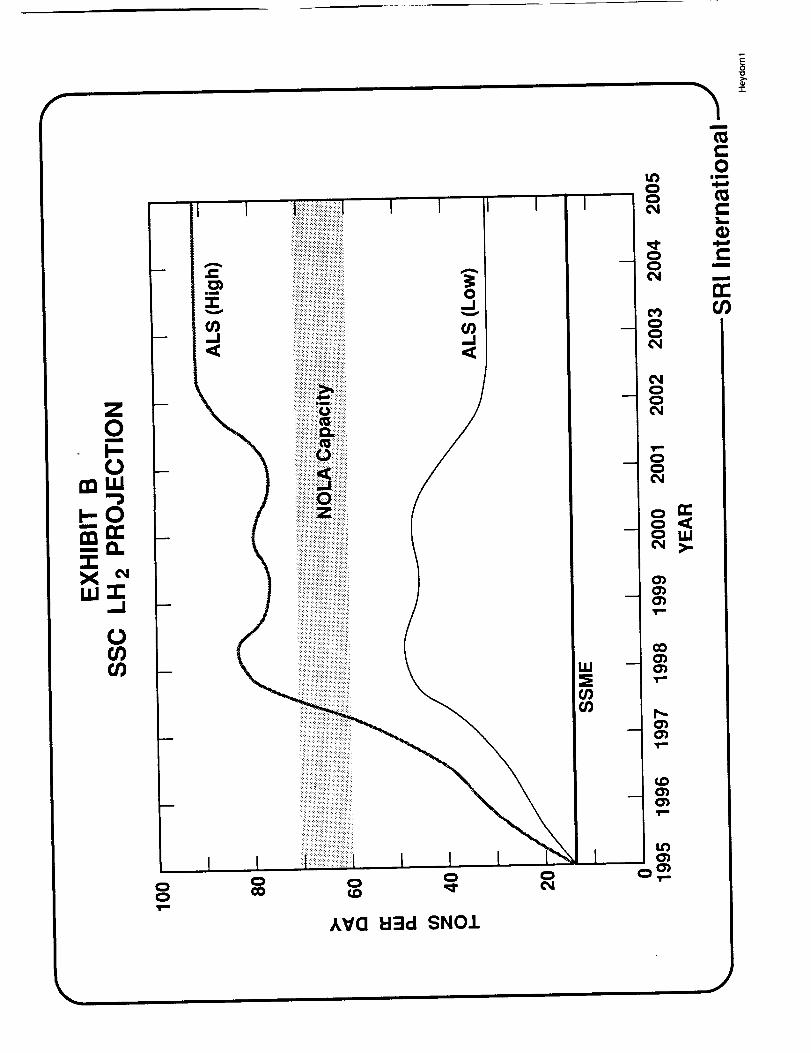
Exhibit B - This exhibit shows the LH2 projection in tons per day at the Stennis Space Center.The Shuttle SSME engine testing is predicted at a constant level. The significant influence ofthe proposed ALS program is illustrated with the "high" number indicating the optimisticprojection and the "low" as the pessimistic evaluation.
Currently the SSC requirements are being met by barging product from a nearby productionplant. Shown is the current/planned capacity of this plant (NOLA). Based on SRI data foron-stream factors and plant utilization factors the production to support government andcommercial requirements is plotted as a reference band. It is noted that about 30 TPD isroutinely committed to commercial accounts.
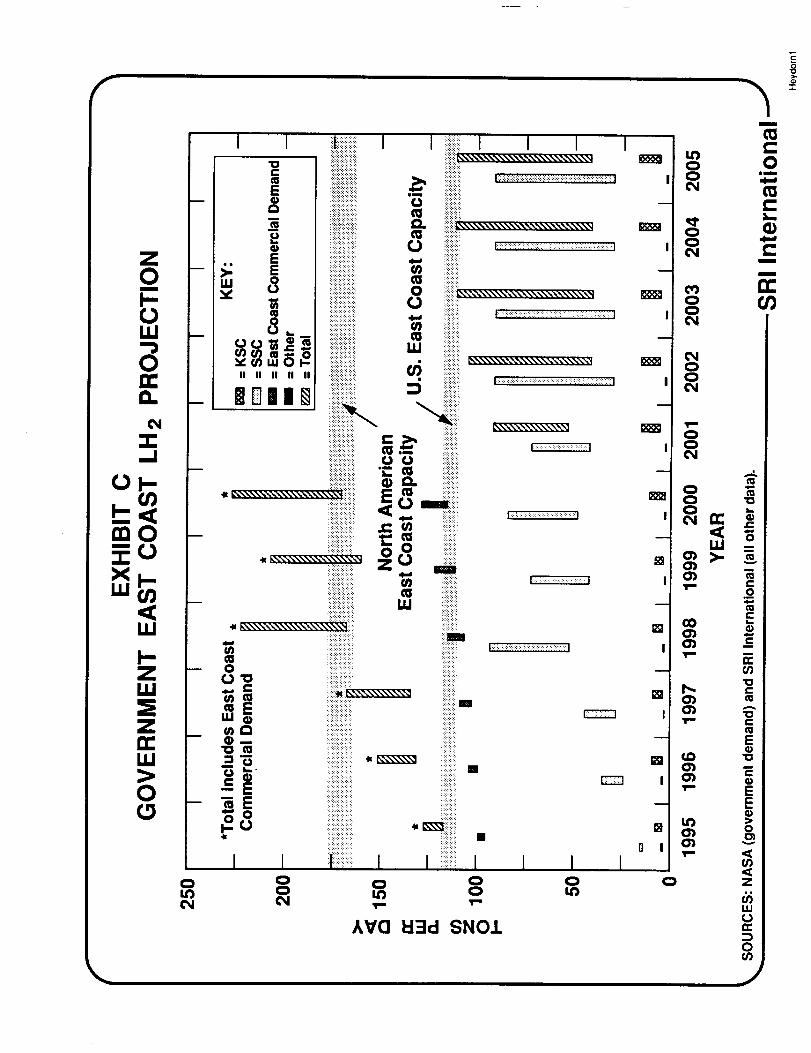
Exhibit C - This exhibit shows the tally of all government LH2 projections in tons per day forthe using sites (sites east of the Mississippi River plus JSC) under a potential East Coastcontract (or contracts).
The KSC data is the range of projections similarly shown in Exhibit A but in bar graph form.Like_se the SSC data (Exhibit B) is also shown in bar graph form. The "other" govemmentdata is in the range of 3 to 4 tons per day and includes MSFC, LeRC, LaRC, JSC, P&W, DOE,and Theseus.
As was shown in Exhibit B production capacity plots are also indicated. This includes the
current producing sites in New Orleans, LA, Ashtabula, OH, and Niagara Falls, NY. Althoughthere are production sources in Canada these are not only outside of the United States butwere sized and built primarily for Northeast U.S. and Canadian commercial markets, andtherefore are not considered significantly influential for govemment support. The effecthowever is shown by the North American East Coast capacity band. Also plotted is the SRIdata on commercial demand through the year 2000.
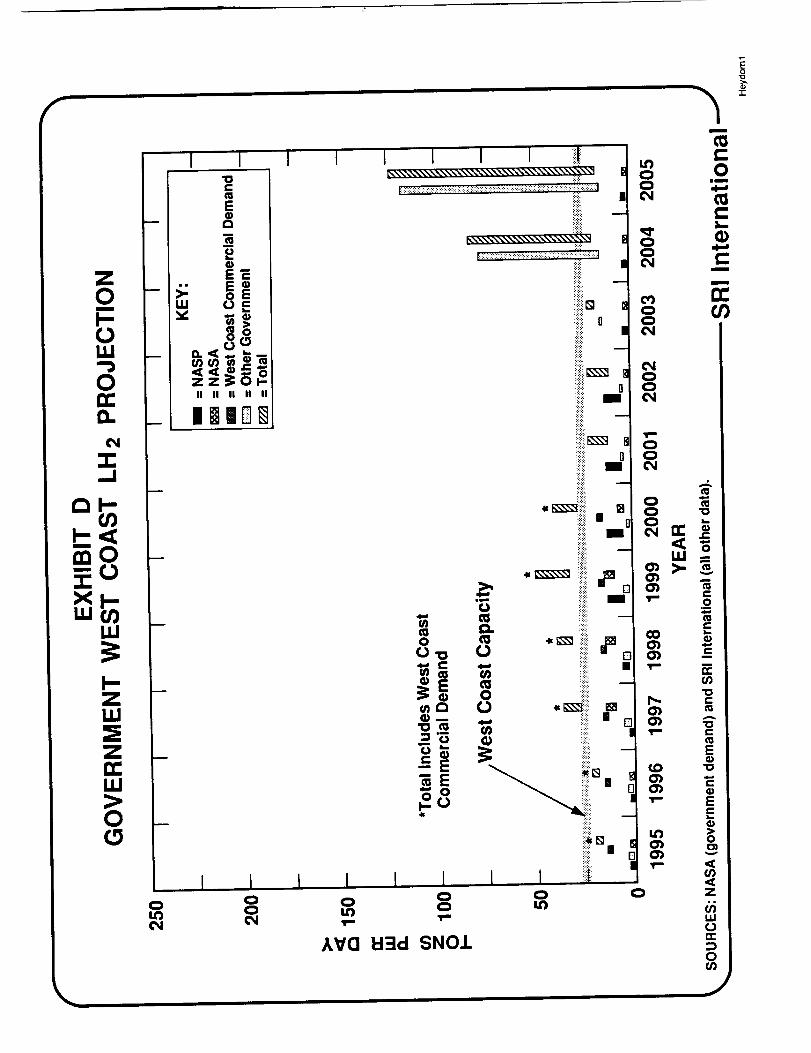
Exhibit D - This exhibit shows the tally of all govemment LH2 projections in tons per day forthe using sites under a potential West Coast contract (or contracts).
For this exhibit the data is displayed in more of a programmatic form. The NASA needsinclude the numerous small consuming locations at the contractor sites at Aerojet, Rockwell,Wyle, General Dynamics, Ball, NTS, and Martin Marietta. Also in this category the require-ments at DFRF and WSTF are included. The NASP is shown separately due to its potentialsignificance and primary location at EAFB.
14
The othergovemmentrequirementsincludeVAFB,HALE,DOE,Departmentof Commerce(NIST), and SEALAR.
Also referenced are the LH2 production capacities and projected commercial demands. Theproducing plants include the existing fadlities at Sacramento, CA and Ontario, CA.
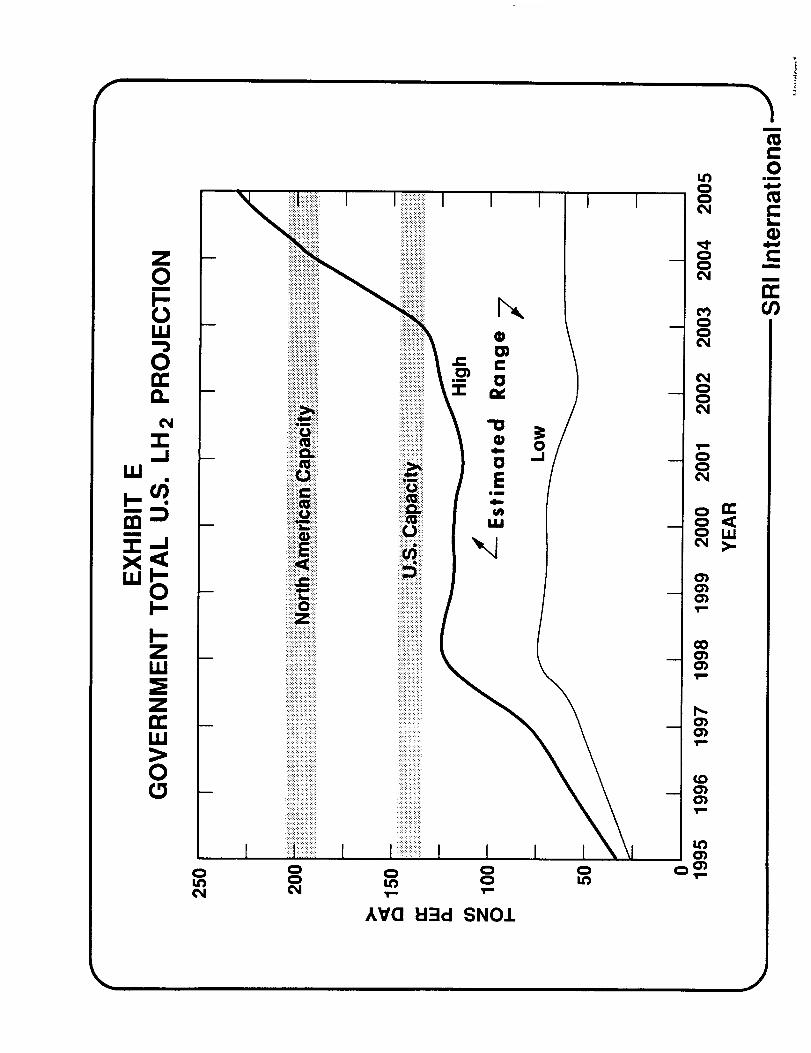
Exhibit E - This exhibit shows the total U. S. govemment LH2 projection in tons per day andillustrates the combination of Exhibit C (East Coast) and Exhibit D (West Coast) data. Forreference purposes the total U. S. LH2 production capadty is shown as well as the totalproduction in North America.
The term "high" was selected to show the tally of all optimistic projections and the "low" asthe tally of all program projections on a reduced scale.
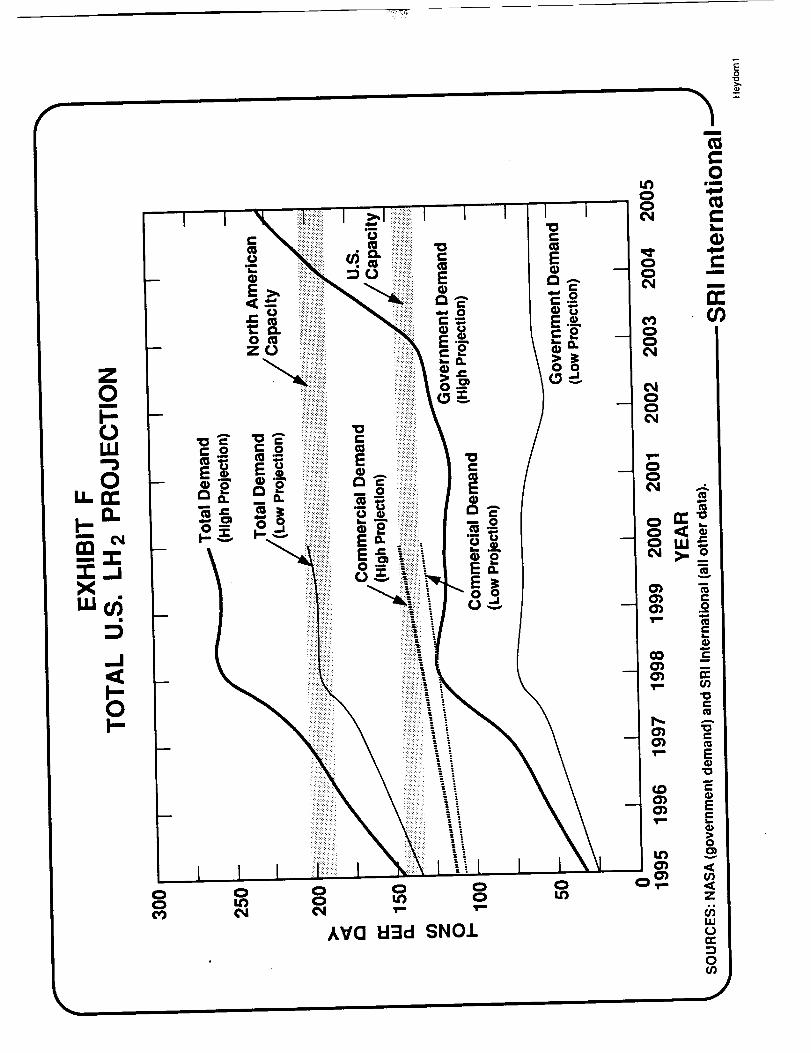
Exhibit F -- This exhibit is Exhibit E data with an overlay of commercial demand and itscombined influence with the govemment projection.
15
=_==.X _W_
U
I I I I
A
0.4#Bv
f-o
m
Nm
0Im
E
Z
IIA
0
I I
ktrO U3cl SNO.L
I.'3000,1
00¢N
00
00
m
omm
!._
r"m
m
rr
f
=,om
mn"--0."I-X _LU'r
.J
U
I i
AV(] El:::ld SNO.I.
1 I
LI.I
CO
m
0Is
¢..m
m
n-
f
+÷÷
--I
i..-
LU
I--ZLIJ
ZIZU,I
0
I I ii!iiiiiiiiiiiiiiiii i iiiiiiiiiiiilI i I I"o i!iiiiiiiiiiii!ii!!!! i!iiiiiii_''''''\'''\'\''\\\\_
iiiiiiiiiiiii!iiiii!_ ._ iiiii_iiiiii_- ,-, iiljiiiiiiiiiiiiiiil u iiiiiiiiiili_
._ iiiiiiiiiiiii!!!iiillo. !_i_!_i_'_.....................\.._ _
E ii}ili_iiiiiiiiiiili ._, iiiiiiiiiiii_
w _ iiiiiii!iiiiiiiiiiii_o iii!ii;ii_\\\\\\\\\.\\\\\\\\\_
8 ,- _{/) iiiiii!iiiiii!i;iiii!)iif:i::_i!:::!iiii:i:+:!:+:ii!:_:i:i:i:i:i:i:i.................!:!:i:!i:!:!:i:!:ii::cI I
ILl iiiiiiiiiiii__ _ 0 _!i_i_i_i_iii_ • iiiiii!iiiii_,.\\_:,.',=-\\-,\\\--\\\\\_._._ L_
,-, _) u__ _.. iiiiiiiiiiiiiii!i!i! _ ii_iiiiiiiilII II II II it i]]]]]i]ii]][]i!]]i]
m_iiiiiiiil]!}!iii!ili!i! _...............]:i:i:]:_:!:!:!:_:i:::!:i:::_::::::::_ I
,,_ _ !!!ii]!]]]][_
:_ 0 iiiiliiiiiii m
:,:÷=÷:,_
::::: ::::::::::::
::::::::::::::::::::::::::::::::::::::::
_i_!!i!ii[!i!::!i!i_]..............::::::::::::::::::: ::::::::::::
:_!!_i_ii_i_ili!i: : i]Ti]i!][i
•_ i,-_.\\\\\\_=,,\\\\\\\X\\_,t:.ii:: :::ii::!i::::::i! _]_iii:?: i_i!m::::::::::::::::::::::::: : _i_ii :::::::::::::::::::::::::::::::::::::::::::::::::::::i:il
:: ::::..::::::::::
-- ]]!i]:i;]][]]i ]]::i]?:]i0'Io
=E
"" 0
I0
IN
00
![ii_!_!ii:il]:i_!i
iiiiiiiiii!im,,. ,....
:iiiiiiii_i
iiiiiiiiiiiiililiiii• _ iii_i:i:_ii!!!iii!iiiii!iiiiii_ iiiii_iiiiiim_iiiil}iiiiiiiii_ii} iiiii_iiiiii::::::::::::::::::-: ::::::::::::
iiiiiiiiiiiiiiiiiiii iiiiiiiiiiii
iii}iiiiiii:iii}i:i: ,, _-_iiiiiiiii_i!i}iiiiiiiiiiiiiiii ...iiiiiiiiiili•
i_iiiii_!iii_i!iii_ I I _}i_!_!_i_I0 0
I
[]
O I
I I0 0
AYO 1:13d SNO.I.
i
o
o
cno
o
oo
031D
h- ,-03 e=
qD
t_E
OlD "1o0"1
4)
E
O) 0m
(/),¢Z
Oiu.I
0if)
-r
,,o,
_I
0
z_
Iii
0
I I l I i l l l ili!it,,\\\\\\\\\\\\\\\\\\-.\\\\\\\\\\\\\\\_}\\_ 0
,,,,,,_,,,,,,,,,,,,,,,,,,,,,,,,,,,,,,,,,,,,,i_i_:_::,
=_ !iii!2i-
..,,.. iili_ oIEIiiDB .......ii -
!?ii-
"_i_i_i .."o_ _,_ 0
- _ _. !!fill - _
:::::::
1 I I I I I I I i_ill _
AV'O El:Jd SNO.L =:30O3
m
0ilu
!__
C:m
m
n-03
___._.::)
I--
ZUJ
ZrrUJ>0
I I I I
AVO bl_d SN01
i
t_
0im
e,,
e"m
i
n-
f
::::::::::::::::::::
AVO l::l=Id SN01
CONCLUDINGOBSERVATIONS
1. The ALSand HALE programs may represent the predominant govemment needs for LH2 inthe long range. The extreme dispersion in predicted requirements for both of these programshowever make the LH2 acquisition strategy selection difficult.
2. The data as assembled for this initial report clearly indicates a need for KSC constantprogram/project surveillance and close coordination with those organizations. Also clear is theneed for KSC to monitor industry's plans for LH2 plant production and distribution expansion.
3. The uncertainty over the scope and location of the multitude of projects and programsmake quantifying the demand for a critical fuel such as hydrogen extremely difficult. The needfor a focused effort and continued close collaboration with aJlusers and LH2 producers isevident.
22
LH2 DEVELOPMENTSTUDYDISTRIBUTIONLIST
Wyle Laboratories, Inc.1841 Hillside AvenueAttn: Mr. D. L McGowanNorco, CA 91760
(714) 737-0871FAX-735-4030
The Aerospace Corporation2350 East El Segundo BoulevardAttn: Mr. Sherwin Lewis
(213)336-4512FAX-336-5833
The Aerospace CorporationP. O. Box 5068Attn: Mr. William Bartlett
Vandenberg AFB, CA 93437FTS-785-0273FAX-785-2003
Tennessee Valley AuthorityPurchasing DepartmentAttn: CST17W83/Mr. Roger DavisP. O. Box 11127
Chattanooga, TN 37401(615) 751-7188FAX-751-8326
Sverdrup Technology, Inc.Stennis Space CenterAttn: SSC Group/Mr. Charles R. FoxBay St. Louis, MS 39529FTS-949-2250FAX-494-1925
San Antonio Air Logistics CenterAttn: SFSP/Ms. Carmen Messer
Kelly AFB, TX 78241-5000(512) 925-6195FAX-(512) 925-8048

RockwellIntemationalCorporationRocketdyneDivisionAttn: SS09MIr.G. L. McGrath6633CanogaAvenueCanogaPark,CA91303FTS-981-5123FAX-N/A
RockwellIntemationalSpaceTransportationDivisionAttn: AB80,Dept.378,Div.841/Mr.PaulBrandes12214LakewoodBoulevardDowney,CA90241FTS-985-2443FAX-N/A
Pratt & Whitney AircraftP.O.Box 109600Attn: Ms.Cathy RobersonWestPaJmBeach,FL 33410-9600(407)796-1175FAX-(407)796-1273
NationalTechnicalSystems20988WestGoldenTriangleRoadAttn: Mr. Mick HoffSaugus,CA91350(805)259-8184FAX-254-4814
National Aerospace Plane JPOAFSC/NAS/Capt. Mike MeerschaertWright-Paterson AFB, OH 45433-6503(513)255-1854FAX-255-1856
NASA
NASA HeadquartersAttn: MOK/Mr. Tim SengWashington, DC 20546FTS-453-2578FAX-426-4483
NASANASAHeadquartersAttn: RP/Mr.William EscherWashington,DC 20546FTS-453-2858FAX-453-0608
NASANASAHeadquartersAttn: RP/Ms. Maria Lopez-TelladoWashington, DC 20546FTS-453-2856FAX-453-0608
NASA
Langley Research CenterAttn: 380/Ms. Suzanne Nelson
Hampton, VA 23665-5225FTS-928-3568FAX-928-3800
NASA
Stennis Space CenterAttn: GA20/Mr. Gerald PitaJo
Bay St. Louis, MS 30529FTS-494,- 1649FAX-494-1481
NASA
Kennedy Space CenterAttn: SI-PMS/Ms. Diane H. Holden
Kennedy Space Center, FL 32899FTS-823-4957FAX-823-7369
NASA
Kennedy Space CenterAttn: SI-PMS/Mr. H. T. Everett
Kennedy Space Center, FL 32899ETS-823-4957FAX-823-7369
NASA
Kennedy Space CenterAttn: SI-PMS/Mr. Leonard E. Nicholson
Kennedy Space Center, FL 32899FTS-823-4957FAX-823-7369

NASAKennedySpaceCenterAttn: DM-MED-41/Mr.Andy RodriguezKennedySpaceCenter,FL32899FTS-823-3313
NASAKennedy Space CenterAttn: PT-FPO/Mr. William Dickinson
Kennedy Space Center, FL 32899FTS-823-2780FAX-823-2217
NASA
Kennedy Space CenterAttn: PT-FLS/Mr. Tom Feaster
Kennedy Space Center, FL 32899FTS-823-7705FAX-823-2217
NASA
Marshall Space Flight CenterAttn: CN23/Mr. Steve CushmanHuntsville, AL 35812FTS-824-5653FAX-824-1154
NASA
Marshall Space Flight CenterAttn: AB35/Mr. Aubrey GreerHuntsville, AL 35812FTS-824-7886FAX-824-4435
NASA
Marshall Space Flight CenterAttn: HA31/Mr. S. F. MoreaHuntsville, AL 35812FTS-824-4082FAX-824-5890
NASA
MarshaJl Space Flight CenterAttn: HA41/Mr. Lawrence WearHuntsville, AL 35812FTS-824-3215FAX-824-5890

NASAMarshallSpace Flight CenterAttn: SA24/Ms. Agnes ThomasHuntsville, AL 35812FTS-824-0819FAX-824-9190
NASA
Stennis Space CenterAttn: SA57/Mr. Boyce MixBay St. Louis, MS 39529FTS-494-2225FAX-494-3248
NASA
Stennis Space CenterAttn: SA25/Mr. Warren Swanson
Bay St. Louis, MS 39529FTS-494-1655FAX-494-1481
NASALewis Research CenterAttn: 500-220/Mr. Richard DeWitt
21000 Brookpark RoadCleveland, OH 44135FTS..297-2601FAX-297-2629
NASALewis Research CenterAttn: 500-220/Mr. G. P. Richter
21000 Brookpark RoadCleveland, OH 44135FTS-297-2443FAX-294-5489 and 297-2629
NASALewis Research CenterAttn: 500-200/Mr. Ned Hannum
21000 Brookpark RoadCleveland, OH 44135FTS-297-2457FAX-297-2629
NASALewis Research Center
Attn: 1720/Mr. Hugh McLaughlin21000 BrookparkRoadCleveland, OH 44135FTS-297-3080FAX-297-8000
NASA
Johnson Space CenterAttn: EP6/Mr. Richard Bozeman, Jr.Houston, TX 77058FTS-525-4516FAX-N/A
NASA
Johnson Space CenterAttn: BD3/Ms. Gloria BrittonHouston, TX 77058FTS-525-4103FAX-525-6200
NASA
Johnson Space CenterAttn: MC5/Mr. Tom GallagherHouston, TX 77058FTS-525-1418FAX-525-2080
NASA
JSC White Sands Test FacilityAttn: RE/Ms. Janet ReeseP. O. Drawer MM
Las Cruces, NM 88004FTS-572-5137FAX-572-5015
NASA
JSC White Sands Test FacilityAttn: RF/Mr. Frank BenzP. O. Drawer MM
Las Cruces, NM 88004FTS-572-5722FAX-572-5260
NASAJSC White SandsTest FacilityAttn: RD2/Mr. IrwinSmithP.O. DrawerMMI_asCruces,NM88004FTS-572-5524FAX-572-5105
NASADrydenFlightResearchFacilityAttn: EED/Mr.WilliamShowersBox273EdwardsAFB,CA 93523-5000FTS-961-3368FAX-961-3567and961-3592
LosAlarnosNationalLaboratoriesP. O. Box 1663
Attn: F611/Dr. Fred EdeskutyLos Alamos, NM 87543FTS-843-4240FAX-843-3669 and 843-6937
General DynamicsSpace Systems DivisionAttn: V2o7136/Ms. Pamela MellP. O. Box 85990
San Diego, CA 92138(619) 576-5271FAX-576-6674
EG&G Florida, Inc.P. O. BOx 21267Attn: BOC_.,-027/Mr.Robert Laws
Kennedy Space Center, FL 32815(407) 867-2518FAX-823-2626
Dynamics Research CorporationSuite 802Attn: Mr. Robert Hulburt
1755 Jefferson Davis HighwayArlington, VA 22202(703) 521-3812FAX-421-4123

Department of Energy1000 Independence AvenueAttn: CE-341/Dr. Michael Gurevich
Washington, DC 20585FTS-896-6104FAX-896-4529
Department of Energy1000 Independence AvenueAttn: MA-422/Mr. James CavanaghWashington, DC 20585FTS-896-8173FAX-586-8134
Chemical Engineering Center (NBS)325 Broadway AvenueAttn: Director/Mr. Jesse HordBoulder, CO 80303-332FFS-320-5108FAX-320-3765
Bechtel National IncorporatedBox 3965Attn: MS4526D35/Mr. Norman SteinSan Francisco, CA 94119(415)768-0233FAX-768-3588
Ball Aerospace19750 Weld County Road #7Attn: Mr. Jim LewisBerthoud, CO 80513(303) 939-6111FAX-N/A
Naval Research LabCode: 8305/Mr. Mike Melich
Washington, DC 20375-5000(202) 7676609
Aurora Flight Sciences Corporation3107 Colvin St.
Attn: Dr. John S. LangfordAlexandria, VA 22314
('/03) 823-0497FAX (703) 751-6947
Department of Energy1000 Independence AvenueAttn: CE-341/Dr. Michael Gurevich
Washington, DC 20585FTS-896-6104FAX-896-4529
Department of Energy1000 Independence AvenueAttn: MA-42_r. James CavanaghWashington, DC 20585FTS-896-8173FAX-586-8134
Chemical Engineering Center (NBS)325 Broadway AvenueAttn: Director/Mr. Jesse HordBoulder, CO 80303-332F-I'S-320-5108FAX-320-3765
Bechtel National IncorporatedBox 3965Attn: MS4526D35/Mr. Norman SteinSan Francisco, CA 94119(415) 768-0233FAX-768-3588
Ball Aerospace19750 Weld County Road #7Attn: Mr. Jim LewisBerthoud, CO 80513(303) 939-6111FAX-N/A
Naval Research LabCode: 8305/Mr. Mike Melich
Washington, DC 20375-5000(202) 767-6609
Aurora Flight Sdences Corporation3107 Colvin St.
Attn: Dr. John S. LangfordAlexandria, VA 22314(703) 823-0497FAX (703) 751-6947
Air Force Systems CommandAttn: HQ SD/CLFRS/Capt. Kurt HeldLos Angeles AFB, CA 9(X)09-2960(213) 643-1262FAX-643-0338
Air Force Flight Test Center6510 Test WingAttn: AFFTC/DORH/Mr. Kurt Buehler
Edwards AFB, CA 93523
(805) 277-3457FAX-277-0354
Air Force Astronautics LaboratoryAttn: AL/TOAF/Ms. Margaret WhelanEdwards AFB, CA 93523-5000(805)275-5o84FAX-275-5084
Air Force Astronautics LaboratoryAttn: AFAL/RKLB/Lt. Bao K. NguyenEdwards AFB, CA 93523-5000(805) 275-5541FAX-275-5527
AF Wright Aeronautical LaboratoriesAttn: WRDC/TXAD/Mr. Charles PattersonWright-Patterson AFB, OH 45433-5553(513) 255-5288FAX-255-4659
Aerojet Tech Systems CompanyBuilding3308Attn: Dept. 9500/Mr. J. A. BardP. O. Box 13222
Sacramento, CA 95813(916) 355-3916FAX-N/A
Amoid Engineering Development CenterAttn: 4960 ABS/LGS/MSGT Billy AdamsArnold AFB, TN 37389(615)454-4413FAX-454-7330
Department of the Air ForceAerospace Test GroupAttn: WSMC/SVO/Col David P. SchmarjeVandenberg AFB, CA 93437-6021(8o5)
EG&G Vandenberg Operations DivisionAttn: Project Manager/Mr. Wayne BithellP.O. Box 5338
Vandenberg AFB, CA 93437(805) 865-0547
DISTRIBUTION UST
Airco Industrial Gases
Attn: Mr. William Hoenigmann575 Mountain Avenue
Murray Hill, NJ 07974
Air Products and Chemicals, Inc.Attn: Mr. Lawrence BelnoskiP.O. BOx 538
Allentown, PA 18195
Air Products and Chemicals, Inc.Attn: Mr. Chartes AndersonP.O. Box 538Allentown, PA 18195
Air Products and Chemicals, Inc.Attn: Ms. Joan KrichtenP.O. Box 538Allentown, PA 18195
Aga Gas, Inc.P. O. Box 94737Cleveland, OH 44101-4734
Big Three IndustriesP. O. Box 3047Houston, TX 77253
Consolidation Coal Company4000 Brownsville Road
Library, PA 15129
Electrolyser Corporation, Ltd.Attn: Dr. Alexander Stuart122 The West MallToronto, Ontario, Canada, M9C 1B9
Hoechst - Uhde Corporation560 Sylvan AvenueEnglewood Cliffs, NJ 07632
Hydrogen, Inc.Attn: Mr. Larry SloanP. O. Box 18-1236
Casselberry, FL 32718
UquidAir CorporationAttn: Mr. Robert Jennings2695 Villa Creek Drive, Suite 206DaJlas,"IX 75234
Uquid Air CorporationAttn: Mr. Claude Salama2121 N. Califomia BoulevardWalnut Creek, CA 94596
Liquid Air CorporationAttn: Mr. Howard Percy2121 N. California BoulevardWalnut Creek, CA 94596
Liquid Carbonic I/M Corporation135 South LaSalle Street
Chicago, IL 60603-5441
MG IndustriesP. O. BOx 945
Valley Forge, PA 19482
Solar Reactor Technologies2729 S.W. 22nd AvenueMiami, FL 33133
Union Carbide Corporation (Unde Division)Attn: Mr. Mario DeLucia
39 Old Ridgebury Road, R3Danbury, CT 06817-0001
Union Carbide Corporation (Unde Division)Attn: Mr. Michael Kerr
39 OkJP,k_jebury Road, PaDanbury, CT 06817-0001
Eagle Engineering, Inc.Attn: Mr. William AlfordTower BOx 772101 Executive Drive
Hampton, VA 23666
Institute of Gas TechnologyEnergy Development CenterAttn: Mr. Christopher Blazek4201 W. 36th Street
Chicago, IL 60632

Hydrogen Energy SystemsAttn: Mr. Aiessio Mezzina
531 Surrey RaceOceanside, NY 11572
Cryogenic Industries, Inc.Attn: Mr. Alex Zeballos2321 S. Pullman StreetSanta An& CA 92705-5506
S-R-B IndustriesAttn: Mr. E. L. Carr147 Meadow GL_de
San Antonio, TX 78227-1003
Astronautics Corporation of AmericaAttn: Mr. Richard Foster
5800 Cottage Grove RoadMadison, W153716-1387
Electric Power Research InstituteAttn: Dr. Ben Mehta3412 Hillview Avenue
Palo Alto, CA 94303
Texas A&M University/CESHRAttn: Dr. John Appleby238 Wisenbaker ERC
College Station, TX 77843
American Hydrogen AssociationAttn: Mr. Roy McAlisterP. O. Box 15075Phoenix, AZ 85060
National Hydrogen AssociationAttn: Mr. Jeffrey Serfass1101 Connecticut Avenue N.W., Suite 910Washington, DC 20036
SRI Intemational
Attn: Ms. Barbara Heydom333 Ravenswood AvenueMenlo Park, CA 94025
University of MiamiClean Energy Research InstituteAttn: Dr. T. Nejat VezirogluCoral Gables, FL 33124
Solar EnergyResearchInstituteAttn: Mr. William Hoagland1617 Cole Boulevard
Golden, CO 80401
Air Force Flight Test CenterAttn: Mr. Johnny Armstrong6510 Test Wing/DORHEdwards AFB, CA 93523
Mr. Peter Hoffman4104 Jefferson Street
Hyattsville, MD 20781
Dr. Paul Maxwell
2321 Raybum BuildingWashington, DC 20515
Florida Solar Energy CenterAttn: Dr. David Block300 State Road 401
Cape Canaveral, FL 32920
NASA
Kennedy Space CenterAttn: SI/Mr. J. E. Rice
Kennedy Space Center, FL 32899
NASA
Kennedy Space CenterAttn: SI/Mr. Marvin E Jones
Kennedy Space Center, FL 32899
NASA
Kennedy Space CenterAttn: SI-PRO/Mr. Wesley H. DeanKennedy Space Center, FL 32899
NASA
Kennedy Space CenterAttn: DA/Mr. Andrew J. PickettKennedy Space Center, FL 32899
NASA
Kennedy Space CenterAttn: PT/Mr. William H. Rock
Kennedy Space Center, FL 32899
NASAKennedy Space CenterAttn: DE/Mr. James D. PhillipsKennedy Space Center, FL 32899
NASA
Kennedy Space Centeri,
Attn: TV-FSD/Mr. Robert G. Ward, Jr.
Kennedy Space Center, FL 32899
NASAKennedy Space CenterAttn: DM-MED-4/Mr. William I. Moore
Kennedy Space Center, FL 32899
NASA
Kennedy Space CenterAttn: DM-MED/Mr. Sterling W. WalkerKennedy Space Center, FL 32899
NASA
Kennedy Space CenterAttn: DE-PMO/Mr. i3mothy M. CrossKennedy Space Center, FL 32899
NASA
Marshall Space Right CenterAttn: HA21/Mr. Craig E. SumnerHuntsville, AL 35812
NASALewis Research Center
Attn: 500-200/Mr. Frank D. Berkopec21000 Brookpark Road, FL 32899Cleveland, OH 44135
NASA
NASA HeadquartersAttn: HS/Ms. Deborah A. Cresthull
Washington, DC 20546
NASA
NASA HeadquartersAttn: QSO/Mr. Wayne R. FrazierWashington, DC 20546
NASANASAHeadquartersAttn: RP/Mr. John R. FaceyWashington, DC 20546
NASA
NASA HeadquartersAttn: MOK/Mr. William E. Oliver, Jr.
Washington, DC 20546
NASA
NASA HeadquartersAttn: LB/Mr. VincentJ. Sansevero
Washington, DC 20546
NASA
NASA HeadquartersAttn: MD/Mr. Ronald J. Harris
Washington, DC 20546
NASA
NASA HeadquartersAttn: M-3/Mr. ThomasA. Utsman
Washington, DC 20546
NASA
NASA HeadquartersAttn: FI/Dr. Leonard A. Harris
Washington, DC 20546
U. S. Air ForceESMCAttn: SE/Mr. L. J. Ullian
Patrick AFB, FL 32925

_/91-16168
Final Report • July _1990
SRI Project 8562
LIQUID HYDROGEN PRODUCTION ANDCOMMERCIAL DEMAND IN THE UNITEDSTATES
Prepared for:¢I"
JOHN F. KENNEDY SPACE CENTER
National Aeronautic<3 and Space Ad_nistrationProcuromen! Ollico
333 RavenswooclAvenue • Menlo Park,CA94025-3493 * (415)326-6200 • FAX: (415)326-5512 • Telex: 334486

CONTENTS
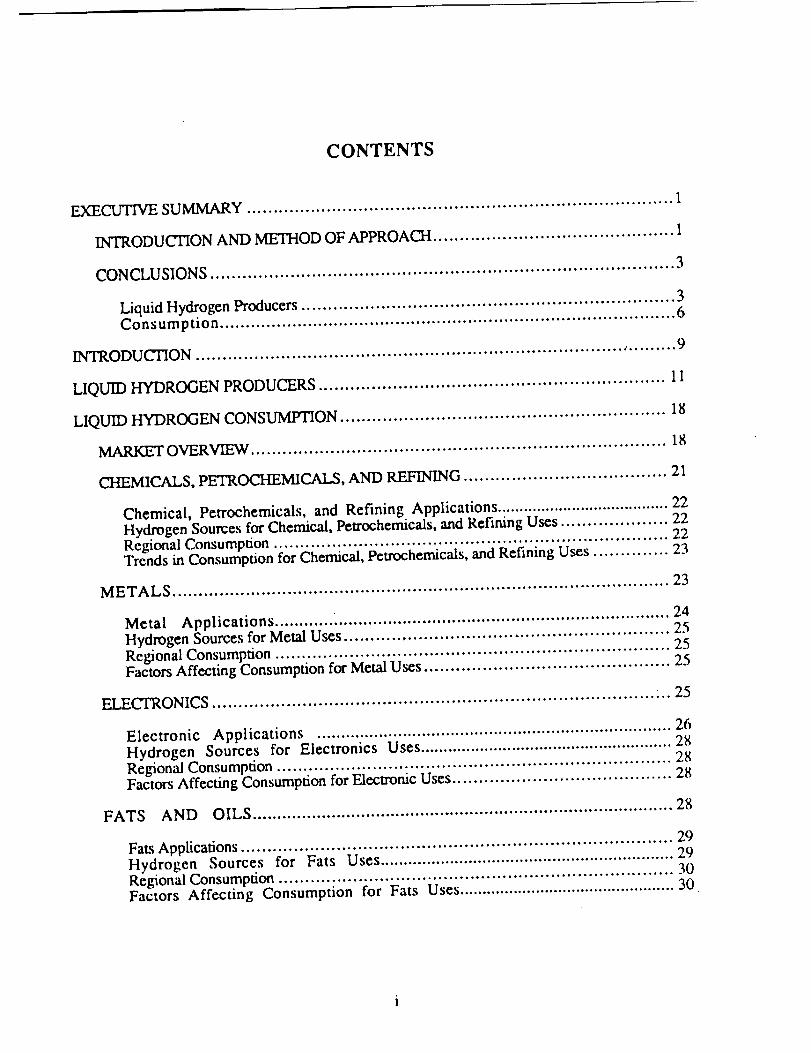
EXECUTIVE SUMMARY ................................................................................ I
INTRODUCTION AND ME'THOD OF APPROACH ............................................. 1
CONCLUSIONS ....................................................................................... 3
Liquid Hydrogen Producers ...................................................................... 3Consumption ........................................................................................ 6
INTRODUCTION .......................................................................................... 9
LIQUID HYDROGEN PRODUCERS ................................................................. 11
LIQUID HYDROGEN CONSUMPTION ............................................................. 18
MARKET OVERVIEW .............................................................................. 18
CHEMICALS, PETROCHEMICALS, AND REFINING ...................................... 21
Chemical, Petrochemicals, and Refining Applications ....................................... 22Hydrogen Sources for Chemical, Petrochemicals, and Refining Uses .................... 22Regional Consumption .......................................................................... 22Trends in Consumption for Chemical, Petrochemicals, and Refining Uses .............. 23
METALS ............................................................................................... 23
Metal Applications ............ _................................................................... 24Hydrogen Sources for Metal Uses ............................................................. 25Regional Consumption .......................................................................... 25
Factors Affecting Consumption for Metal Uses .............................................. 25
FJ _F.CTRONICS 25
Electronic Applications .......................................................................... 26Hydrogen Sources for Electronics Uses ....................................................... 28Regional Consumption .......................................................................... 28Factors Affecting Consumption for Electronic Uses ......................................... 28
FATS AND OILS ..................................................................................... 28
Fats Applications ................................................................................. 29Hydrogen Sources for Fats Uses ............................................................... 29Regional Consumption .......................................................................... 30Factors Affecting Consumption for Fats Uses ................................................ 30

CONTENTS (Concluded)
GLASS ................................................................................................. 31
Glass Applications ............................................................................... 31Hydrogen Sources for Glass Uses ............................................................. 31Regional Consumption .......................................................................... 32Factors Affecting Consumption for Glass Uses .............................................. 32
OTHER USES ........................................................................................ 33

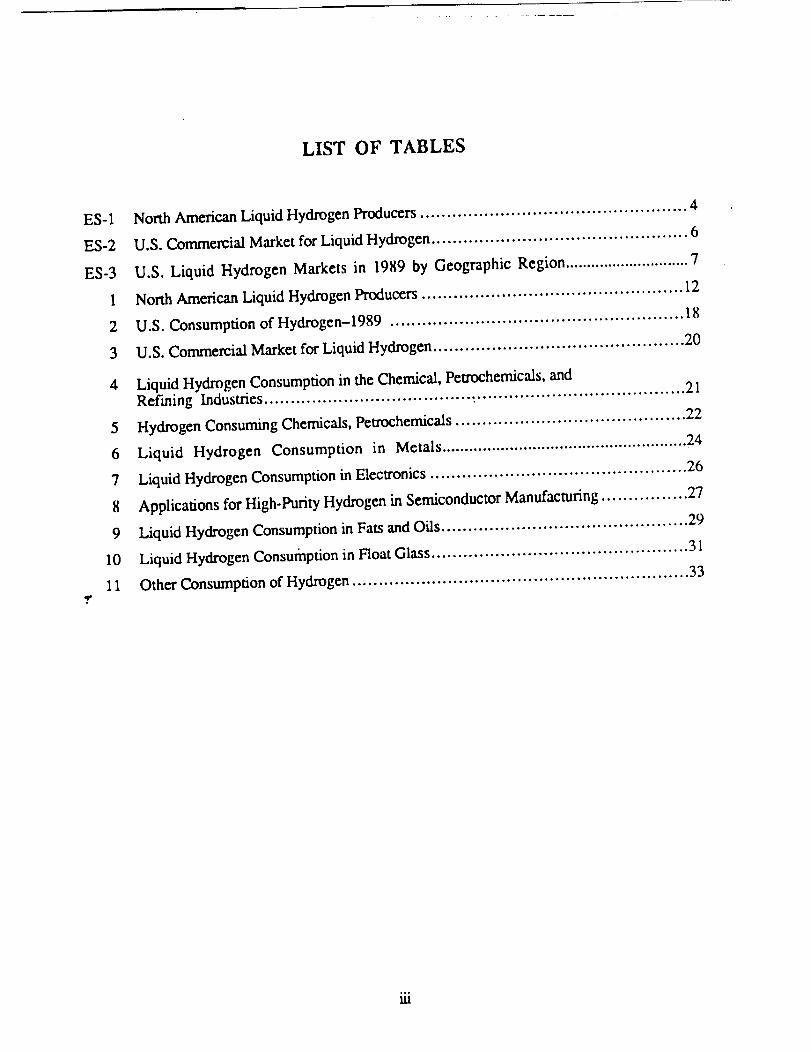
LIST OF TABLES
E$-I
ES-2
ES-3
1
2
3
4
5
6
7
8
9
10
11..r
North American Liquid Hydrogen Producers .................................................. 4
U.S. Commercial Market for Liquid Hydrogen ................................................ 6
U.S. Liquid Hydrogen Markets in 1989 by Geographic Region ............................. 7
North American Liquid Hydrogen Producers ................................................. 12
U.S. Consumption of Hydrogen-1989 ....................................................... 18
U.S. Commercial Market for Liquid Hydrogen ............................................... 20
Liquid Hydrogen Consumption in the Chemical, Petrochemicals, andRefining Industries ............................................................................... 21
Hydrogen Consuming Chemicals, Petrochemicals ........................................... 22
Liquid Hydrogen Consumption in Metals ...................................................... 24
Liquid Hydrogen Consumption in Electronics ................................................ 26
Applications for High-Purity Hydrogen in Semiconductor Manufacturing ................ 27
Liquid Hydrogen Consumption in Fats and Oils .............................................. 29
Liquid Hydrogen Consumption in Float Glass ................................................ 31
Other Consumption of Hydrogen ............................................................... 33
iii

LIST OF FIGURES
ES-1
1
2
3
4
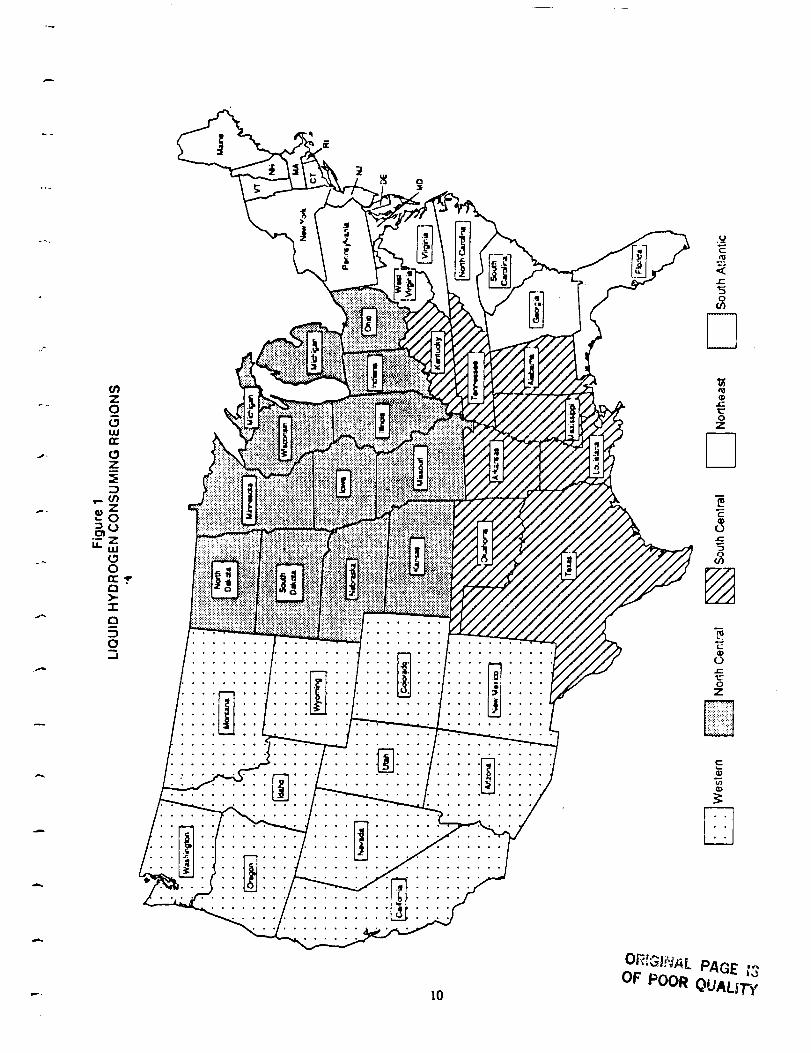
Liquid Hydrogen Consuming Regions .......................................................... 2
Liquid Hydrogen Consuming Regions ......................................................... 10
East Coast Liquid Hydrogen Projection ........................................................ 15
West Coast Liquid Hydrogen Projection ....................................................... 16
Total U.S. Liquid Hydrogen Projection ........................................................ 17
iv

EXECUTIVE SUMMARY
INTRODUCTION AND METHOD OF APPROACH
SRI International (SRI) is pleased to present this final report on liquid hydrogen production
and demand, under contract NAS10-11643. Kennedy Space Center (KSC), the single largest
purchaser of liquid hydrogen in the United States, manages liquid hydrogen in support of
government programs. Increased demand from the commercial sector, as well as NASA's heavy
reliance on hydrogen produced from a single hydrogen plant, has prompted KSC to evaluate
current and anticipated hydrogen production and consumption in the government and commercial
sectors, in order to determine the type of procurement best suited to meeting KSCs hydrogen
requirements. The government analysis was conducted by KSC. This study represents Ski's
assessment of the commercial sector.
To conduct this study, SRI compiled available information on hydrogen production, trade,
consumption and macro-economic trends likely to affect consumption. This information was
supplemented by extensive interviews with hydrogen producers, consumers and industry
organizations. Specific objectives of the study are as follows:
• Identify liquid hydrogen producers in the United States and Canada during the
1980-1989 period, including:
- Plant locations, capacities, date on stream and production process used
(e.g., burning natural gas or liquefaction of by-product hydrogen)Y
- True delivery capability assessed on a best-efforts basis.
• Compile information on expected changes in liquid hydrogen production
capabilities in the United States and Canada over the 1990-2000 period.
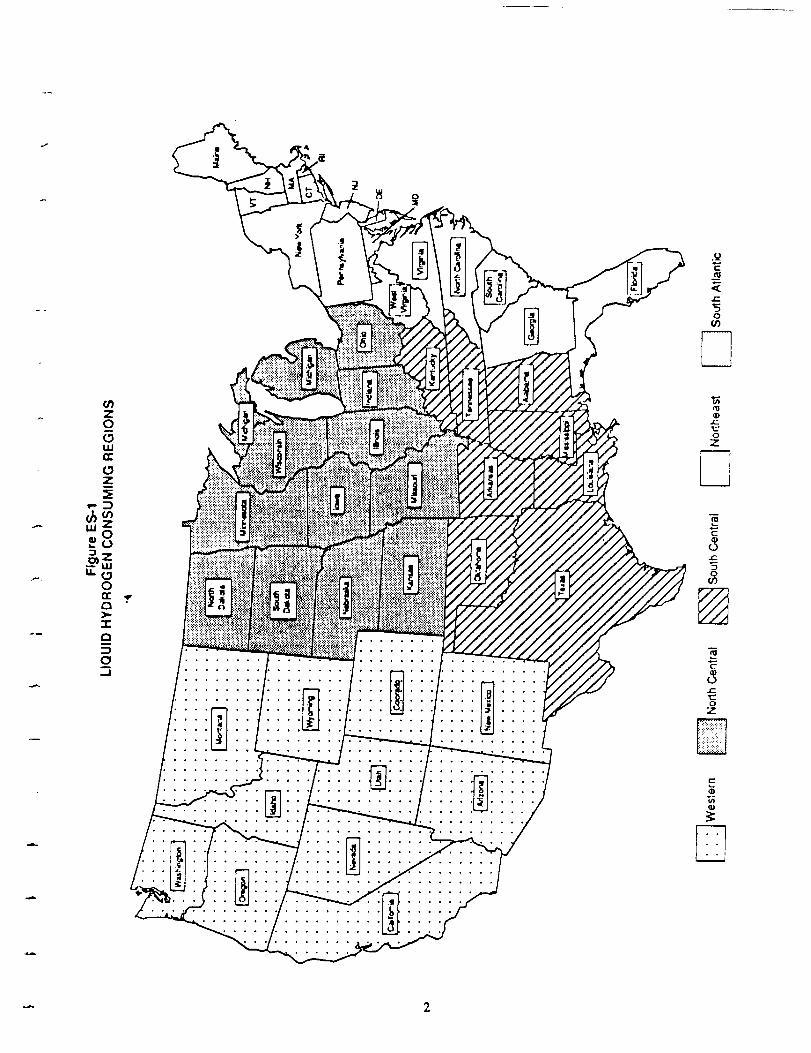
• Describe how hydrogen is used in each consuming industry and estimate U.S.
liquid hydrogen consumption for the chemicals, metals, electronics, fats and
oil, and glass industries, and report data on a regional basis as illustrated in
Figure ES- 1.
• Estimate historical consumption for the years 1980, 1985, 1987, 1988, 1989,
and future consumption for 1990, 1995, 2000.
• Assess the influence of international demands on U.S. plants, and in particular,
the influence of the Canadian market on Canadian and U.S. production.
"E
1,-
_50
(/)
£f)Z0
LUn-
Z
Z0(,_
-ic_:Z
o_ III
u._0
r._>,.-I-£:)::)0
........ o ° • °
• o o , ....
• • • • ...........
..... • • ° o o
t-
o
z
m
c
..l:2
0
if)
c-
1-
0
z
e-
CONCLUSIONs
As a result of this survey, SRI can present the following observations about the producers of
hydrogen, and some projections about the future use.
Liquid Hydrogen Producers
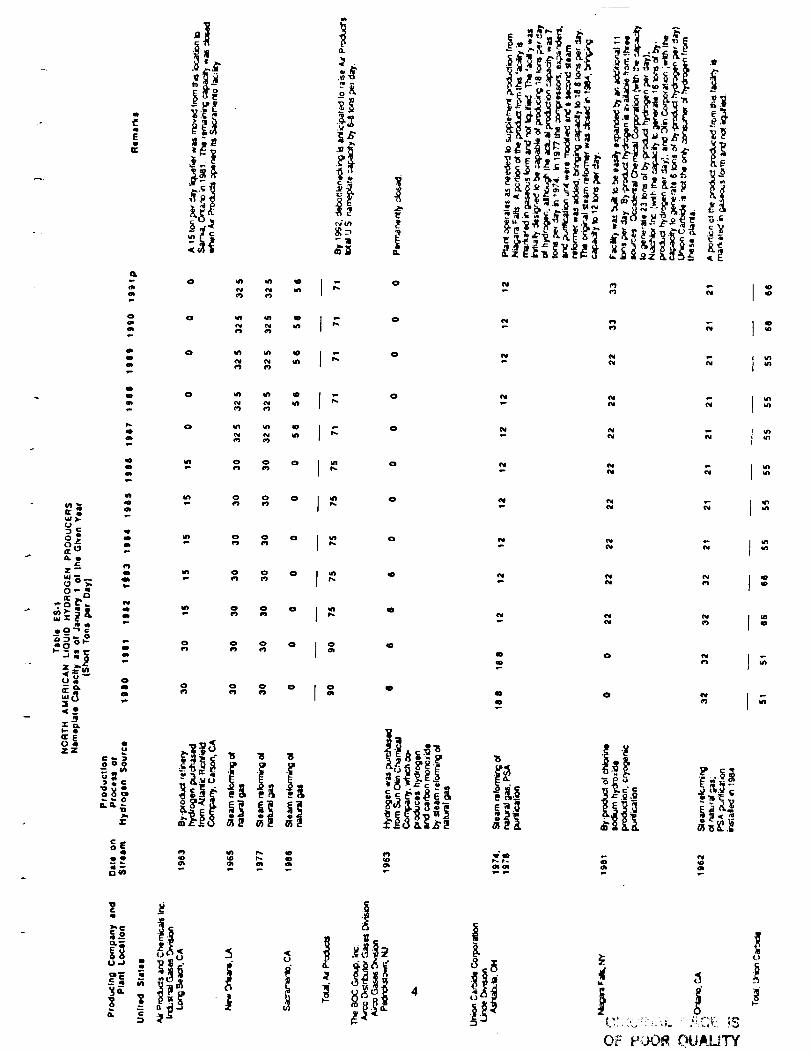
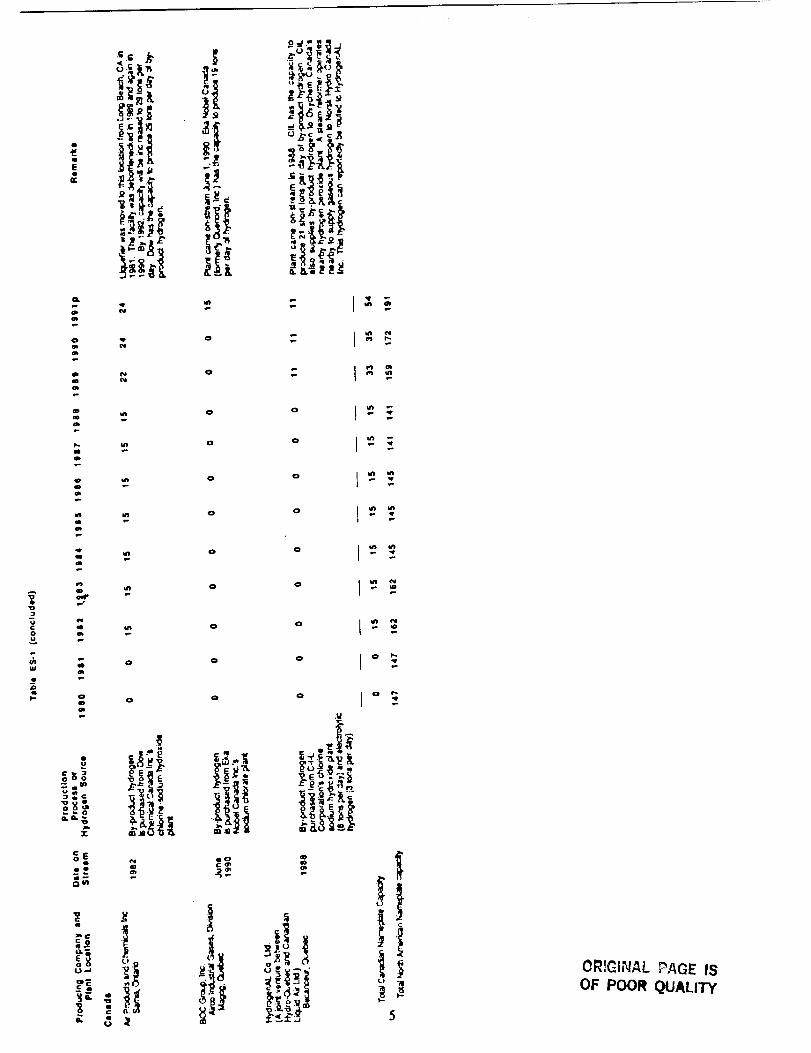
Four companies produce liquid hydrogen at 8 locations in North America. Three of the plants
are located in Canada; five are in the United States. A history of producers, plants capacities for
the 1980-1990 period is summarized in Table ES-1.
Significant changes that have taken place in terms of liquid hydrogen suppliers over the 1980-
1990 period include the following:
• Idle capacity on the West Coast was closed or moved east in order to be closerto the market.
• U.S. based capacity decreased 6.8% while Canadian capacity increased from no
capacity in 1980 to 50 tons per day by July 1990. Overall, this corresponds to
a 27% increase in North American capacity.
• The number of companies producing liquid hydrogen has expanded. In 1980,
Air Products, Airco, and Union Carbide all produced in the United States. In
1982, Airco ceased production and participated in the business as a distributor,
leaving Air Products and Union Carbide as the sole producers over the 1983-
1988 period. In 1988 the situation changed when HydrogenAL began
operating its liquid hydrogen plant in Becancour, Quebec. In June 1990, Airco
began operadng a plant in Magog, Quebec. Product from HydrogenAl's plant
is distributed in the umted States by Liquid Air Corporation.y
• The newer plants have tended to be smaller than previous plants and to use by-
product hydrogen streams.
Industry is still adjusting to the Canadian capacity that has recently come on stream. No
company has formally announced plans to construct a new liquid hydrogen plant in North America
although there have been rumors of plants being considered for the South Atlantic and the West
Coast. Air Products is in the process of debottlenecking its facilities, which will increase the
company's North American nameplate capacity to 106-108 tons per day by 1992. No company
has announced plans to close capacity, although it is reasonable to believe that Union Carbide will
permanently close its Ashtabula plant and add capacity elsewhere by 1995.
Nameplate capacities for any given year are somewhat higher than true delivery capability on
an annual basis when factors such as losses and downtime for plant maintenance are taken into
account. In general, it is estimated that plants are able to have 92% of nameplate capacity available
for delivery. One exception to this may be the Union Carbide plant at Ontario, CA, which is
difficult to rate effectively since the plant operates well under capacity due to insufficient demand
for product.
w),.
Z _
0 .,,-, I
.0-,':
_8<o
_e(rE04ZZ
I
E
o
_,_0
Q Q
Q,
m
OIO
Q
IR
Qa
mID
OI'-
I
Om
° _ " " I"0 _ _
o _ _f) g
c) IKI _-_ o
o o
m o o o
m o o o
_.__:_:_
. o ]
° I
0 0 0 C_ I 0
O.
0
o
0
0
0
o
0
_ _._ . _--.__._--:_..,_ . _.,__._._'_ _
P,,. t.
I"
7-,
J
0
I
E
o
kLI
¢I--
p
m
I
eJ
._ _ oO
p.
_ o
_ o_r
m
¢o o
o_
_ _.._ .QO
ii.L g, I
L _
P
o _ _
o _
o _
o _
5
OR!C_INAL ?_GE ISOF POOR QUALITY
Consumption
Although government use typically accounts for only about one fifth of all liquid hydrogen
consumed in the United States, it is the only application that requires significant volumes of liquid
hydrogen. For commercial consumers, liquid hydrogen is purchased for convenience or,
particularly for small volume users, economics. The liquid hydrogen is then vaporized and used in
gaseous form. This could change if a new market that consumed hydrogen in liquid form, such as
fuel for commercial aircraft, emerged. SRI does not anticipate this occurring before 2000.
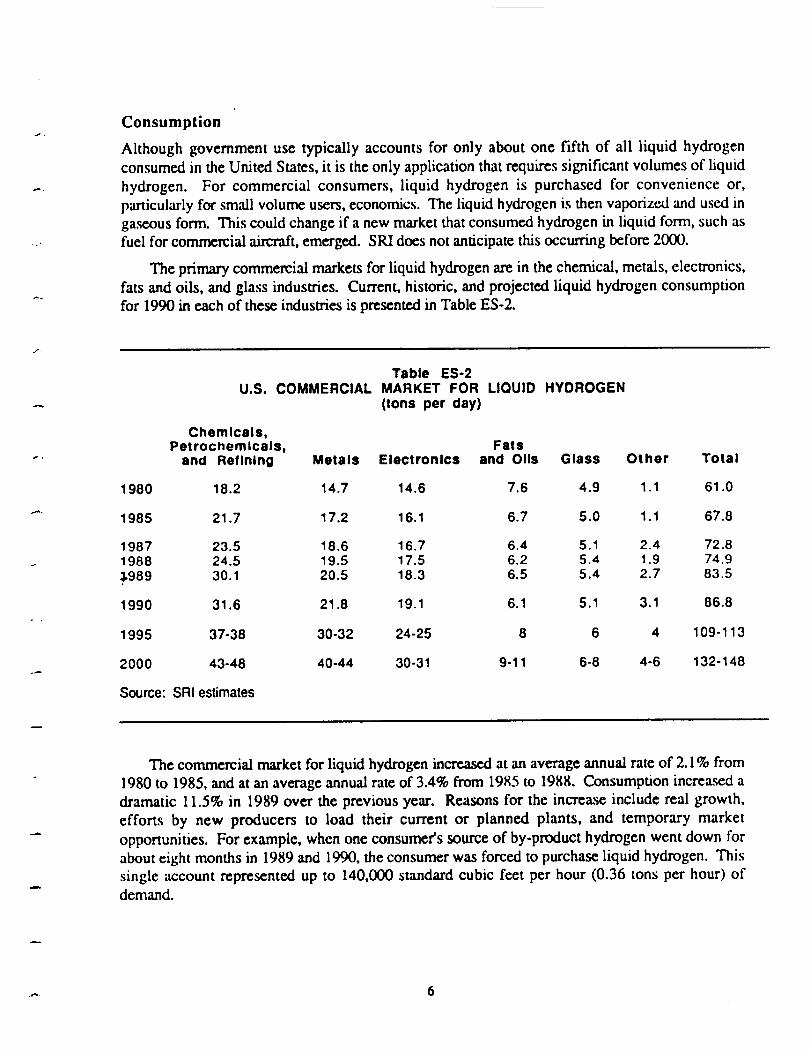
The primary commercial markets for liquid hydrogen are in the chemical, metals, electronics,
fats and oils, and glass industries. Current, historic, and projected liquid hydrogen consumption
for 1990 in each of these industries is presented in Table ES-2.
Table ES-2U.S. COMMERCIAL MARKET FOR LIQUID HYDROGEN
(tons per day)
Chemicals,Petrochemicals, Fats
and Refining Metals Electronics and Oils Glass Other Total
1980 18.2 14.7 14.6 7.6 4.9 1.1 61.0
1985 21.7 17.2 16.1 6.7 5.0 1.1 67.8
1987 23.5 18.6 16.7 6.4 5.1 2.4 72.81988 24.5 19.5 17.5 6.2 5.4 1.9 74.9
9989 30.1 20.5 18.3 6.5 5.4 2.7 83.5
1990 31.6 21.8 19.1 6.1 5.1 3.1 86.8
1995 37-38 30-32 24-25 8 6 4 109-113
2000 43-48 40-44 30-31 9-11 6-8 4-6 132-148
Source: SRI estimates
The commercial market for liquid hydrogen increased at an average annual rate of 2.1% from
1980 to 1985, and at an average annual rate of 3.,1% from 1985 to 1988. Consumption increased a
dramatic 11.5% in 1989 over the previous year. Reasons for the increase include real growth,
efforts by new producers to load their current or planned plants, and temporary market
opportunities. For example, when one consumer's source of by-product hydrogen went down for
about eight months in 1989 and 1990, the consumer was forced to purchase liquid hydrogen. This
single account represented up to 140,000 standard cubic feet per hour (0.36 tons per hour) of
demand.
Industry representatives have divergent views regarding future commercial demand for liquid
hydrogen, especially over the 1995-2000 period. Representatives have reported anticipated growth
rates ranging from 4% to 10%.
SRI forecasts U.S. consumption of liquid hydrogen to incre,xse 4% between 1989 and 1990,
then grow at an average annual rate of approximately 4.5% to 5.5% for the next five years. This
corresponds to growth at an average annual rate of 4.5% to 5.2% over the 1989 to 199.5 period.
Demand from 1995 to 2000 is forecast to increase at an average annual rate of 4.0% to 5.5%.
Overall, demand is forecast to increase at an average annual rate of 4.3% to 5.3% from 1989 to
2000. SRI believes that growth will increase at the lower end of the range predicted by industry
for the following reasons:
• A large part of growth in the industry has been through conversion of captive
gaseous hydrogen producers to purchasers of liquid hydrogen. There are
expected to be fewer opportunities for this son of growth in the future.
• In response to increased competition in supplying liquid hydrogen, some gas
companies appear to be convening large liquid hydrogen accounts to supplier
owned, on-site plants, which are generally longer term contracts.
• As plant loadings increase, gas companies are likely to emphasize servicing
more profitable accounts, causing some consumers to convert to captive
production.
• Demand in 1989 was unusually high.
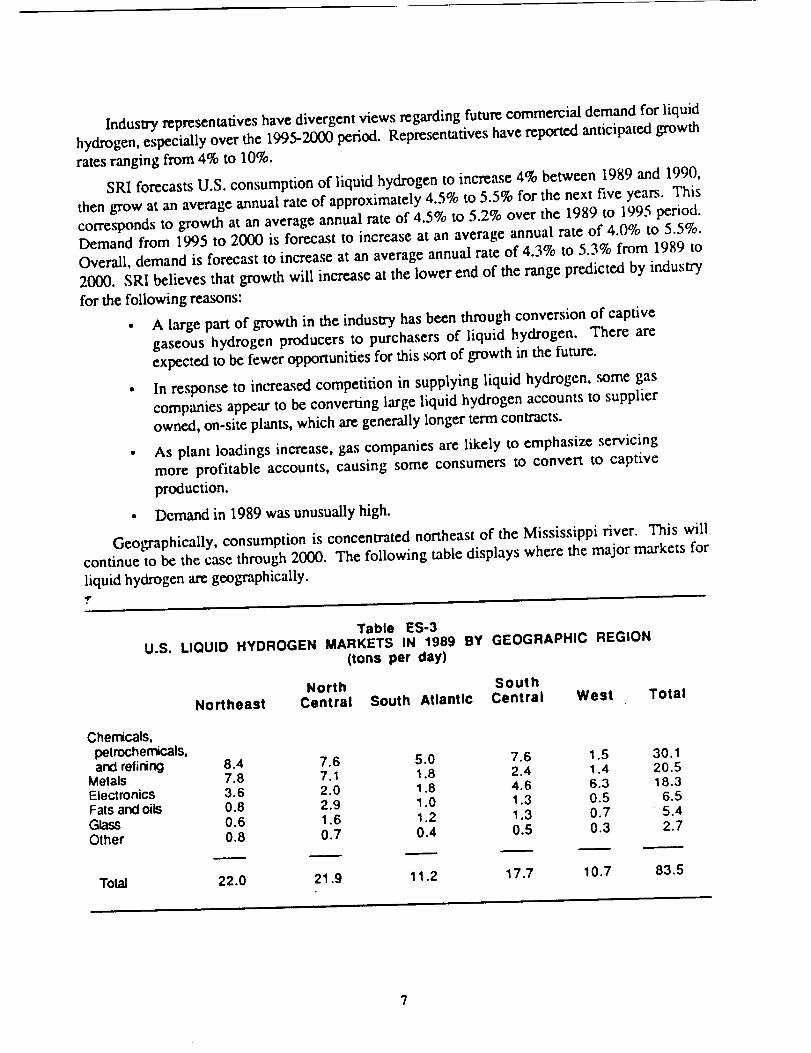
Geographically, consumption is concentrated northeast of the Mississippi river. This will
continue to be the case through 2000. The following table displays where the major markets for
liquid hydrogen arc geographically.qp-
Table ES-3U.S. LIQUID HYDROGEN MARKETS IN 1989 BY GEOGRAPHIC REGION
(tons per day)
Chemicals,
petrochemicals,and refining
MetalsElectronicsFats and oilsGlass
Other
"Iota/
North SOuthNortheast Central South Atlantic Central West
8.47.83.60.80.6
0.8
22.0
7.6 5.0 7.67.1 1.8 2.42.0 1.8 4.62.9 1.0 1.3
1.6 1.2 1.3O.7 0.4 O.5
21.9 11.2 17.7
Total
1.51.46.30.50.7
0.3
10.7
30.120.518.3
6.5
5.42.7
83.5
7

International demand has placed and will continue to place insignificant demands on U.S.
plants. It is expected that Canadian plants will continue to represent a significant source of liquid
hydrogen to the commercial ,sector.
Canada is reviewing a large scale project to export liquid hydrogen as an energy carrier to
Western Europe. Since it is highly uncertain whether the project will come to fruition before 2000,
and since the project would include the construction of a new hydrogen plant close to a shipping
terminal, it is assumed that offshore demands for Canadian hydrogen will be minimal.
J
t.
INTRODUCTION
SKI International (SRI) is pleased to present this final report on liquid hydrogen production
and demand, under contract NAS10-11643. Kennedy Space Center (KSC), the single largest
purchaser of liquid hydrogen in the United States, manages liquid hydrogen in support of
government programs. The first liquid hydrogen plants in the United States were built primarily to
supply government contracts for liquid hydrogen. With the increased availability of liquid
hydrogen, however, producers began to identify accounts in the commercial sector that would
benefit from purchasing product in liquid form. Increased demand from the commercial sector, as
well as NASA's heavy reliance on hydrogen produced from a single hydrogen plant, has prompted
KSC to evaluate current and anticipated hydrogen production and consumption in the government
and commercial sectors, in order to determine the type of procurement best suited to meeting KSCs
hydrogen requirements. The government analysis was conducted by KSC. This study represents
SKI's assessment of the commercial sector.
To conduct this study, SKI compiled available information on hydrogen production, trade,
consumption and macro-economic trends likely to affect consumption. This information was
supplemented by extensive interviews with hydrogen producers, consumers and industry
organizations. Specific objectives of the study are as follows:
• Identify liquid hydrogen producers in the United States and Canada during the
1980-1989 period, including:
- Plant locations, capacities, date on stream and production process used
.-, (e.g., burning natural gas or liquefaction of by-product hydrogen)
- True delivery capability assessed on a best-efforts basis.
• Compile information on expected changes in liquid hydrogen production
capabilities in the United States and Canada over the 1990-2000 period.
• Describe how hydrogen is used in each consuming industry and estimate U.S.
liquid hydrogen consumption for the chemicals, metals, electronics, fats and
oil, and glass industries, and report data on a regional basis as illustrated in
Figure I.
• Estimate historical consumption for the years 1980, 1985, 1987, 1988, 1989,
and future consumption for 1990, 1995, 2000.
• Assess the influence of international demands on U.S. plants, and in particular,
the influence of the Canadian market on Canadian and U.S. production.
The remainder of this report discusses the current producers and consumers of liquid
hydrogen, and suggests trends in consumption for the chemicals, metals, and electronicsindustries.
9
¢/'1ZO
C_LUn-eDZ
,..O r)Z
-¢'oOILT..Zu.J
On'-C3),-"1"C3_)O,.,.I
.'r
• • ° • ....
• • • • • ° °
• °
• • ° • • • • . ° •
tO
C_
r"
'5
,.irz.
o
Z
c
_3
"G
=-
O
z
DE
(D
OR,_I,W:_L PAGE _
OF POOR QUALITY
LIQUID HYDROGEN PRODUCERS
In 1980 three companies, Air Products and Chemicals, Inc. (Air Products), the Linde division
of Union Carbide Corporation (Union Carbide), and Airco Inc. (Airco, later acquired by BOC
Group, Inc.), produced liquid hydrogen in North America. All of the plants were located in the
United States. The hydrogen liquified at each of these facilities was hydrocarbon based.
Over the I980-1985 period, several changes occurred. Air Products and Union Carbide built
new plants that took advantage of by-product hydrogen streams in areas with comparatively
inexpensive electricity. Airco decided it was not economic to continue to operate its plant but
continued to participate in the liquid hydrogen business as a distributor. This left Air Products and
Union Carbide as the only North American producers over the 1983-1988 period.
Industry observers perceived the liquid hydrogen business to be profitable. This factor,
combined with Canada's interest in utilizing its relatively inexpensive and abundant supplies of
electricity, provided the right background for L'Air Liquide and BOC Group to enter the liquid
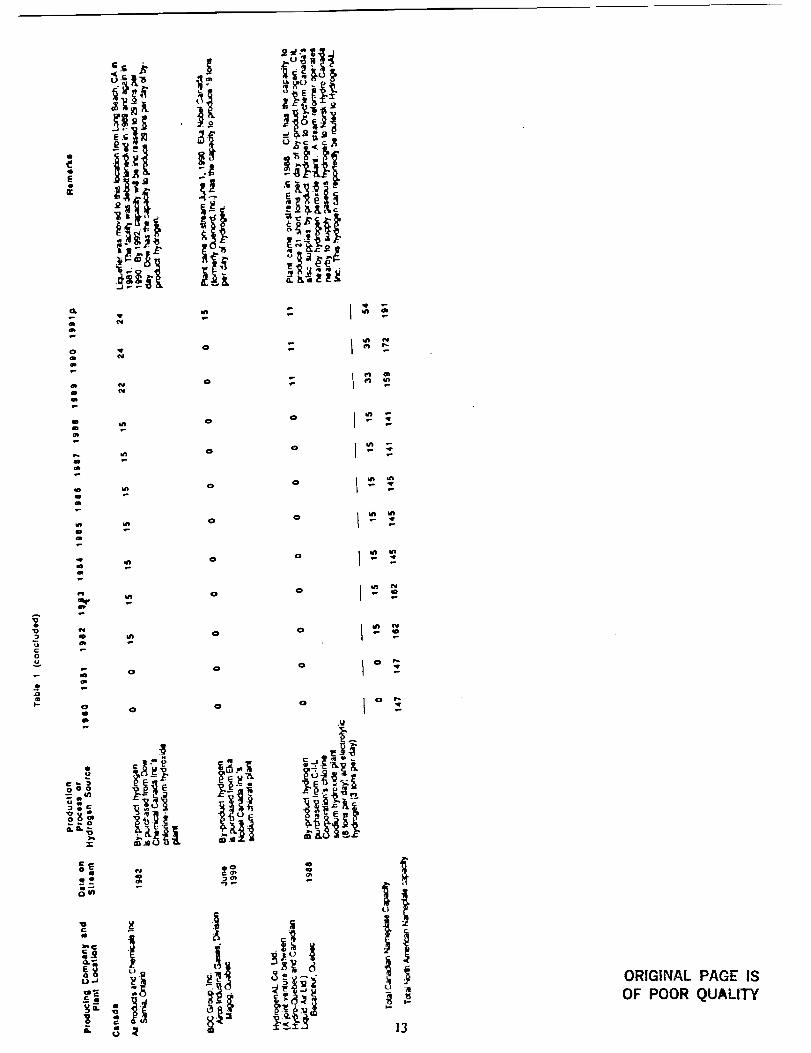
hydrogen business in North America. In 1988 HydrogenAL Co. Ltd., a joint venture between
Hydro-Quebec and Canadian Liquid Air (owned by L'Air Liquide SA, France), began operating a
liquid hydrogen plant in Becancour, Quebec. On June I, 1990, Airco (owned by BOC Group)
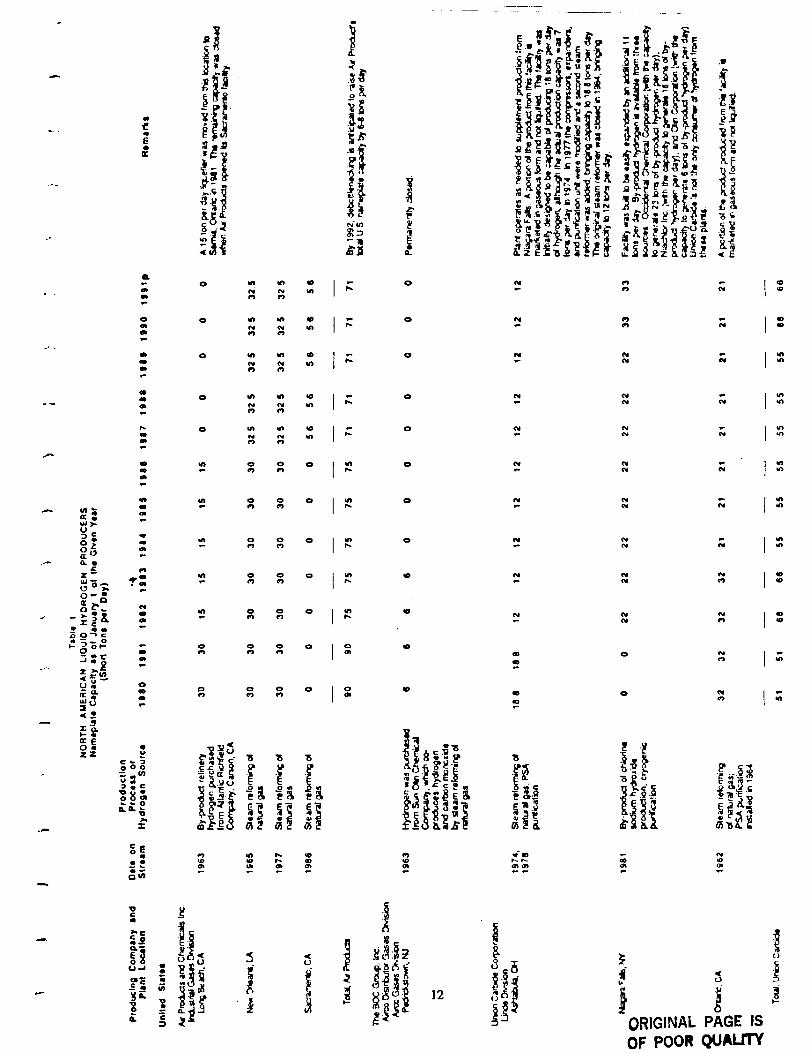
began operating a plant in Magog, Quebec. Table 1 identifies plant locations; capacities, dates on
stream, and production processes for liquid hydrogen producers in the United States and Canada
during the 1980-1991 period.
True delivery capability is somewhat lower than the nameplate capacity. Factors that are
,_ometimes quoted for converting nameplate capacity to true delivery capability include an on-
stream factor (the days per year the plant operates) and a utilization factor (the ratio of product
leaving the plant to product produced, which accounts for the losses associated with storing and
handling the product before it leaves the plant). Historically, industry observers have estimated
true production capacity at about 85% of nameplate capacity. In 1990, is is estimated that "all plants
axe able to produce 92% of nameplate capacity. Air Products is believed to rate its plants closer to
their delivery capabilities and may be able to produce at capacity on a short-term basis. Additional
product losses take place in delivering the product to the customer. Delivery losses will vary
depending on a supplier's delivery system and the number of tanks that must be f'dled at a customer
site. In general, delivery losses are minor, estimated at 2 to 3%.
Not all of the North American plants are currently operating at capacity. The two new
Canadian plants in Quebec, Magog and Becancour, are estimated to be running at about 50%
capacity. In the United States, the Union Carbide facility at Ashtabula, OH, is run as needed to
supplement production from Niagara Falls. Union Carbide's plant at Ontario, CA, is also not fully
loaded. Although officially rated at 21-22 tons per day, the Ontario, CA facility is not believed to
be ready to produce that amount on demand; industry _urces estimate that 17 tons per day may be
a more realistic nameplate capacity without modification to the plant or changes in operating
procedures. The Ashtabula and Ontario facilities are currently marketing a portion of the gas
stream available for liquefaction as gaseous hydrogen.
11
i!+._+_.
"+,to
t,++__-..,
_"Jt
'F
,+0.
+_ r. -'k,r" _I
-,+_j+;+_-+++•
im
oo
a
o m m
r..,
o
o
o
N
(M
e)
e_
uJ)-
Z _
_ o-,*¢*
<_
arEolZZ
oI
Q
I
0
Qm
• o
0 In _
o _ _0'1
o _
m o o o
o o o
o,, _, o o
_ _ o
C";_ .Y - 15 _5 "6
"_ ' " 'i_" "('_ _ o
0f_
0 _f_p_
o
om
oe
*0
_D
*_ om_
!+_'+.++'+++ ++:++++.++++-.++.+ +++.++++_'+.++g m6"++ _ & +'_+-
+_+_. ,++h o,+++i,.-.+P,.,.
ii <++i+++
<<J
]2
_+_
<
+, +ORIGINAL PAGE IS
OF POOR QUALITY
(.)
oiJ
,0mI-
E
er
,,L
o
o¢D
=.,tit
at
m
¢m
O,IBlib
L=.,_
"Jr
• o
-(; .t; =_"
II. !
_N
o
0
il
o
0
o
o
0
o
o
o I _' -
o I _' -
o L'._
.U
13
ORIGINAL PAGE IS
OF POOR QUALITY

J
Industry is still adjusting to the Canadian capacity that has recently come on stream. No
company has formally announced plans to construct a new liquid hydrogen plant in North America
although there have been rumors of plants being considered for the South Atlantic and the West
Coast. Air Products is currently conducting a debotflenecking program that will increase total
company capacity by 12 to 14 tons per day in terms of nameplate capacity, or 11 to 12 tons in
terrrts of actual production capability, by 1992 as compared to 1990.
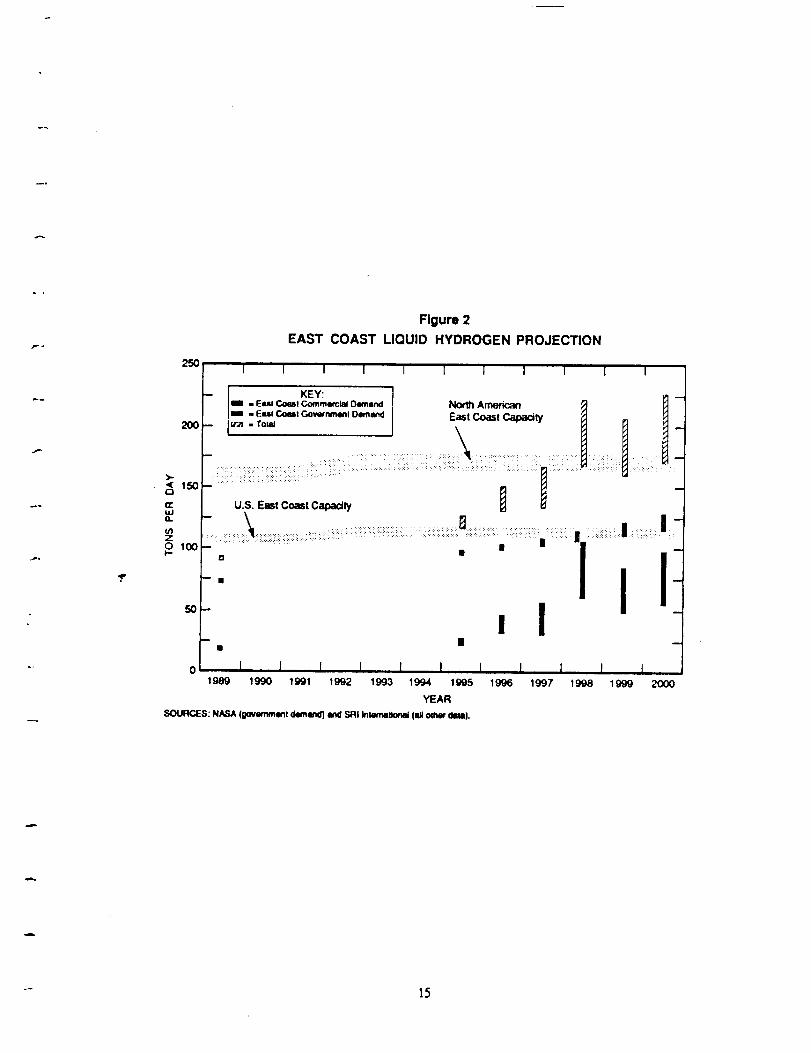
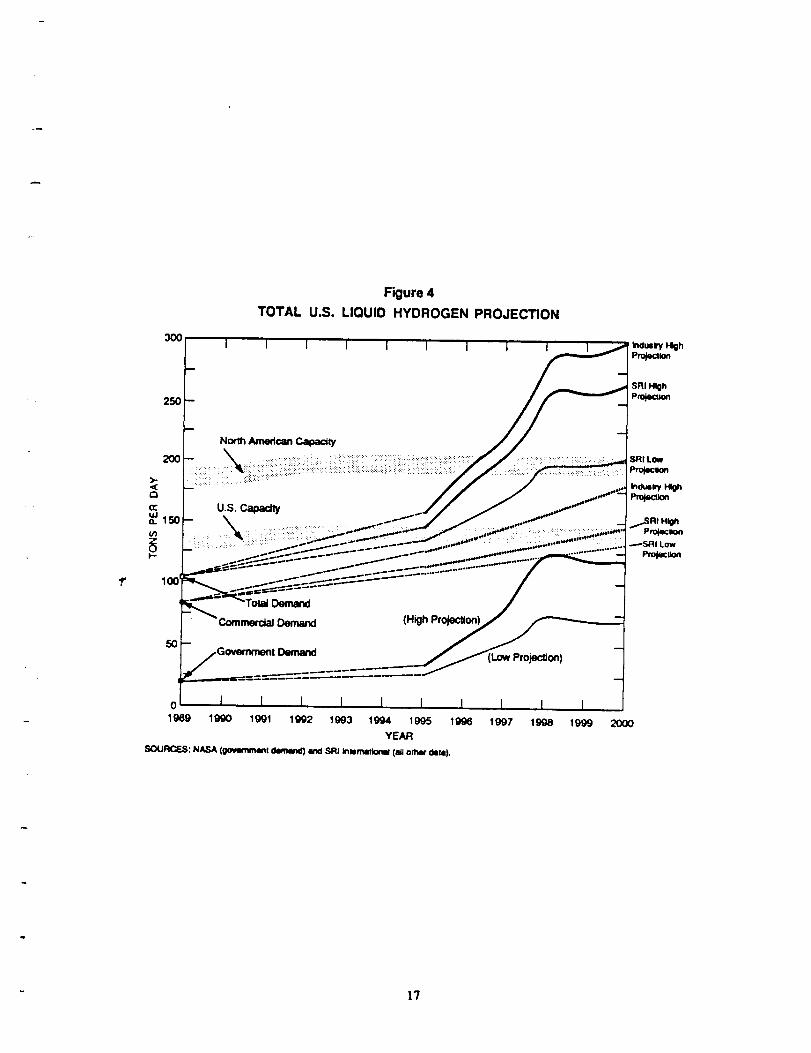
Despite the presence of excess capacity there have been times when extraordinary
circumstances have caused supplies to be short, for example, in late May of 1990, Air Products'
Sarnia plant was down for scheduled maintenance. Meanwhile, a strike curtailed deliveries from
the plants in Quebec, and Union Carbide's Ashtabula plant was down temporarily from fouling of
the catalyst. These supply problems, combined with a period of high demand for the space
program, caused a temporary problem in meeting demand despite the theoretical excess of capacity
as compared to demand. North American capacity is compared to current and future liquid
hydrogen demand as projected by SILl in Figures 2, 3, and 4. Figure 4 also shows how SILl's
projections compare to more optimistic forecasts.
14
"° 15
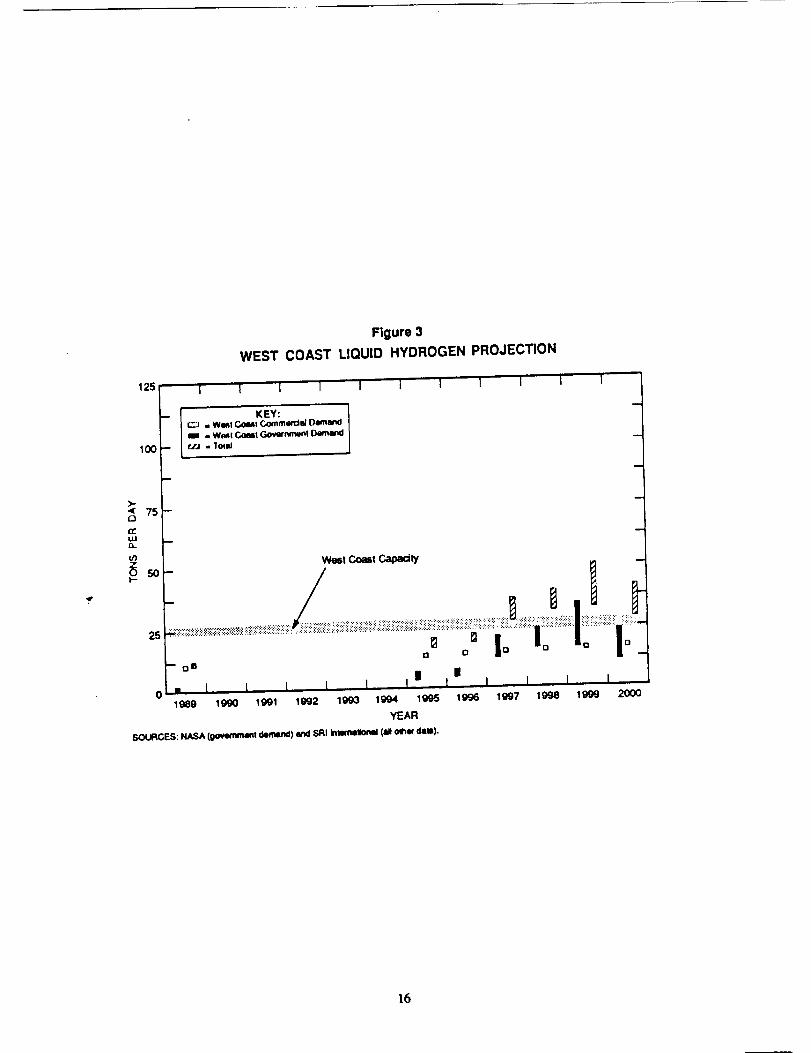
Figure 3
WEST COAST LIQUID HYDROGEN PROJECTION
125
_ I_- KEy.. Wlml Cout CommerctedDe=mend. W_l Coast Governmmnl Demand
100 r.-J . Tol=l
w
>.< 75--
(1:uJtt
o
0 1999 20001989 1990 1991 1992 1993 1994 1995 1996 1997 1998
YEAR
SOURCES: NASA (Oo_ent demand) and SRI InllmmllonJ (all olhlr dill).
t6
3OO
25O
Figure 4
TOTAL U.S. LIQUID HYDROGEN PROJECTION
Induslry High
Projecllon
2OO
_::_:i::::_i::__:: _
(:3
U.S. Capacity
(/)_150 _ ................................
5O
Oemand
Demand (High Projection)
Low Projec_on)
L1997 1998 2000
LIQUID HYDROGEN CONSUMPTION
MARKET OVERVIEW
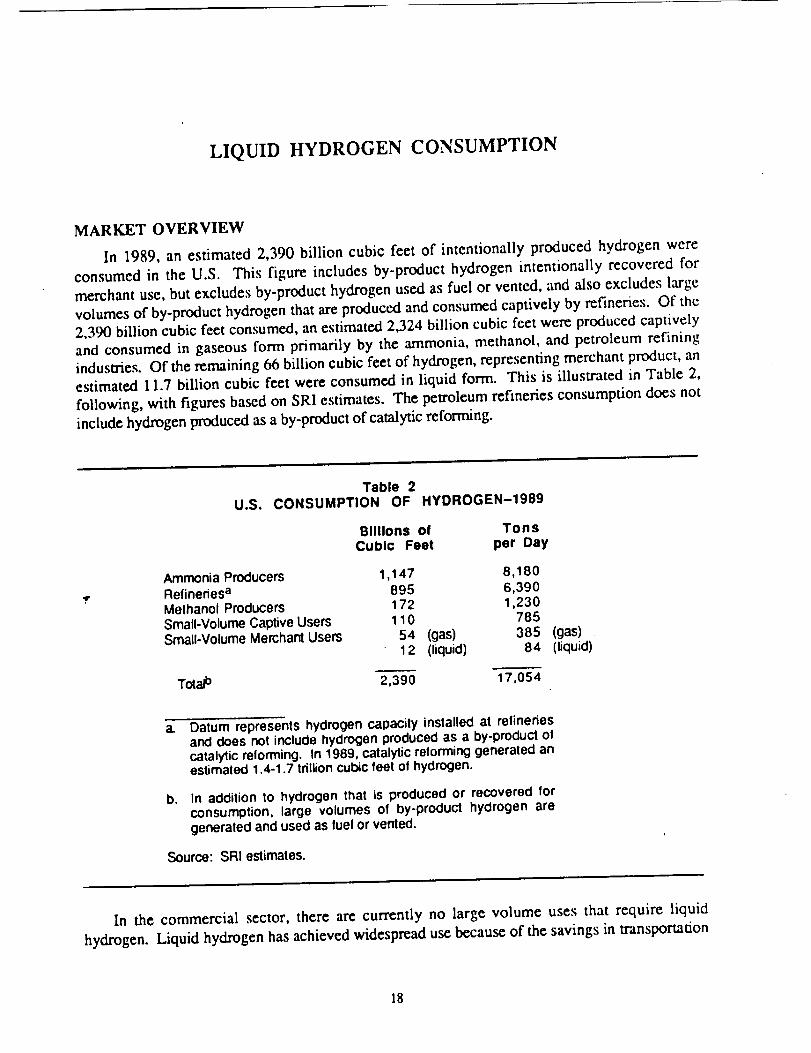
In 1989, an estimated 2,390 billion cubic feet of intentionally produced hydrogen were
consumed in the U.S. This figure includes by-product hydrogen intentionally recovered for
merchant use, but excludes by-product hydrogen used as fuel or vented, and also excludes large
volumes of by-product hydrogen that axe produced and consumed captively by refineries. Of the
2,390 billion cubic feet consumed, an estimated 2,324 billion cubic feet were produced captively
and consumed in gaseous form primarily by the ammonia, methanol, and petroleum refining
industries. Of the remaining 66 billion cubic feet of hydrogen, representing merchant product, an
estimated 11.7 billion cubic feet were consumed in liquid form. This is illustrated in Table 2,
following, with figures based on SRI estimates. The petroleum refineries consumption does not
include hydrogen produced as a by-product of catalytic reforming.
Table 2U.S. CONSUMPTION OF HYDROGEN-1989
Billions of TonsCubic Feet per Day
Ammonia Producers 1,147Refineries a 895Methanol Producers 172Small-Volume Captive Users 110Small-Volume Merchant Users 54
12
8,1806,3901,230
785(gas) 385 (gas)(liquid) 84 (liquid)
Totalb 2,390 17,054
a. Datum represents hydrogen capacity installed at refineriesand does not include hydrogen produced as a by-product ofcatalytic relorrning. In 1989, catalytic reforming generated anestimated 1.4-1.7 tdllion cubic feet of hydrogen.
b* In addition to hydrogen that is produced or recovered forconsumption, large volumes of by-product hydrogen aregenerated and used as luel or vented.
Source: SRI estimates.
In the commercial sector, there are currently no large volume uses that require liquid
hydrogen. Liquid hydrogen has achieved widespread use because of the savings in transportation
18
and handling costs for the liquid form compared to the gaseous form for consumers who find it is
not economic or otherwise feasible to produce hydrogen captively or purchase it via pipeline.
Some industries that use gaseous hydrogen will be more inclined to purchase it in liquid form
than others. For example, applications that need extremely high purity hydrogen will gcnerally
prefer to use liquid hydrogen because the process of liquefaction produces an extremely pure
product. Thus, the electronics industry has historically tended to use liquid hydrogen.
For the remaining industries-chemicals, metals, fats and oils, and glass-the decision to use
liquid hydrogen is primarily based on an individual company's proximity to a source of gaseous
hydrogen and the volumes of hydrogen consumed. For distances beyond 100 miles from the
source, liquid hydrogen can typically be delivered more economically than gas unless the gaseous
hydrogen can be delivered by pipeline. In general, bulk gas and bulk liquid hydrogen costs are
roughly the same for consumers purchasing 40 to 50 thousand standard cubic feet of product per
month. For larger purchases, gas is generally more expensive on a cost-per-unit basis. However,
with liquid hydrogen there are losses clue to evaporation. For this reason, liquid hydrogen is
generally not recommended for locations where less than 100,000 cubic feet per month areconsumed.
When a company's requirements are large enough, it becomes economic to have the hydrogen
produced at the consuming location. These plants are called captive plants if owned by the
consumer and on-site plants if owned and operated by an industrial gas company. Although on-
site hydrogen production costs can vary considerably depending on the price of the feedstock,
industry sources state that liquid hydrogen and on-site hydrogen costs are usually equiv',tlent for
locations that consume 8 to 10 million cubic feet per month. If consumption is greater, on-site
hydrogen is generally less expensive than liquid. This does not necessarily mean that all users of
over 10 million cubic feet will have an on-site plant installed. Companies with borderline
consumption are often willing to pay a bit more for liquid hydrogen for the following reasons:
• If a company's hydrogen requirements change, the company is not saddled with
a plant that it may no longer need.
• The company does not need to worry about plant maintenance or the reliability
of its hydrogen supply.
• Liquid hydrogen may be purchased in direct accordance with a company's
requirements if use rates are not continuous.
Companies with captive facilities may also purchase liquid hydrogen on occasion. For
example, liquid hydrogen may be purchased when the hydrogen plant is closed for scheduled
maintenance periods, if the hydrogen plant is not operating properly, or to supplement captive
hydrogen during periods of peak demand. Captive plants typically close for maintenance once a
year.
No changes in production technology that will significantly alter the economics of captive
production are anticipated by industry. However, it is unclear at this time what impact gas
separation membranes will have on the merchant hydrogen business. Membranes can be used to
clean up a by-product hydrogen sn'eam, displacing demand for generated or purchased hydrogen.
Membranes can only be used to concentrate hydrogen, not to produce hydrogen.
_- 19
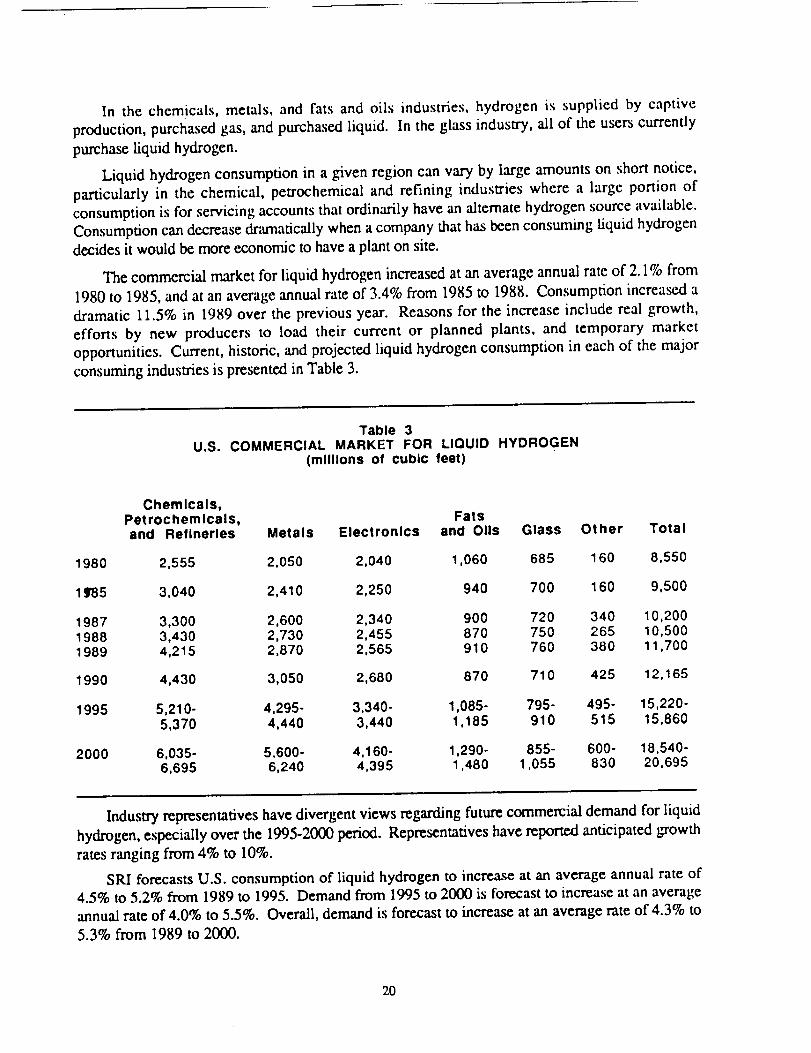
In the chem!cals, metals, and fats and oils industries, hydrogen is supplied by captive
production, purchased gas, and purchased liquid. In the glass industry, all of the users currently
purchase liquid hydrogen.
Liquid hydrogen consumption in a given region can vary by large amounts on short notice,
particularly in the chemical, petrochemical and refining industries where a large portion of
consumption is for servicing accounts that ordinarily have an alternate hydrogen source available.
Consumption can decrease dramatically when a company that has been consuming liquid hydrogen
decides it would be more economic to have a plant on site.
The commercial market for liquid hydrogen increased at an average annual rate of 2.1% from
1980 to 1985, and at an average annual rate of 3.4% from 1985 to 1988. Consumption increas_ a
dramatic 11.5% in 1989 over the previous year. Reasons for the increase include real growth,
efforts by new producers to load their current or planned plants, and temporary market
opportunities. Current, historic, and projected liquid hydrogen consumption in each of the major
consuming industries is presented in Table 3.
Table 3U.S. COMMERCIAL MARKET FOR LIQUID HYDROGEN
(millions of cubic feet)
Chemicals,Petrochemicals, Fatsand Refineries Metals Electronics and Oils Glass Other Total
1980 2,555 2,050 2,040 1,060 685 160 8,550
1185 3,040 2,410 2,250 940 700 160 9,500
1987 3,300 2,600 2,340 900 720 340 10,2001988 3,430 2,730 2,455 870 750 265 10,5001989 4,215 2,870 2,565 910 760 380 11,700
1990 4,430 3,050 2,680 870 710 425 12,165
1995 5,210- 4,295- 3,340- 1,085- 795- 495- 15,220-5,370 4,440 3,440 1,185 910 515 15,860
2000 6,035- 5,600- 4,160- 1,290- 855- 600- 18,540-6,695 6,240 4,395 1,480 1,055 830 20,695
Industry representatives have divergent views regarding future commercial demand for liquid
hydrogen, especially over the 1995-2000 period. Representatives have reported anticipated _owth
rates ranging from 4% to 10%.
SRI forecasts U.S. consumption of liquid hydrogen to increase at an average annual rate of
4.5% to 5.2% from 1989 to 1995. Demand from 1995 to 2000 is forecast to increase at an average
annual rate of 4.0% to 5.5%. Overall, demand is forecast to increase at an average rate of 4.3% to
5.3% from 1989 to 2000.
20
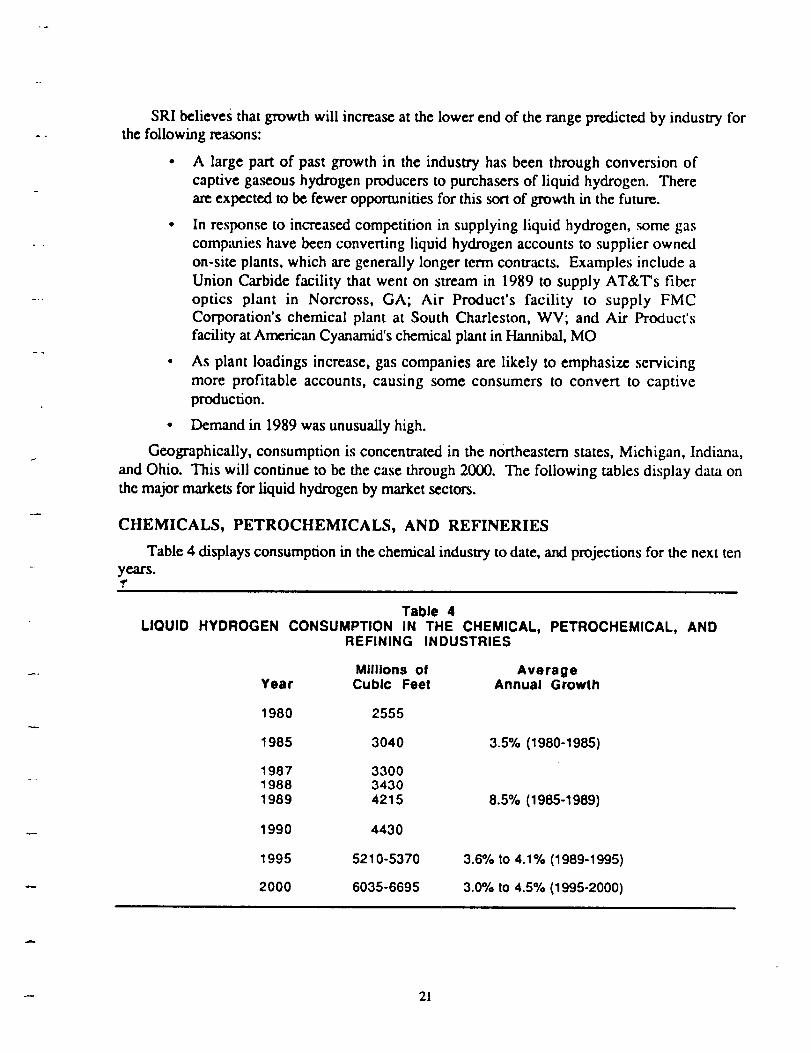
SRI believes that growth will increase at the lower end of the range predicted by industry for
the following reasons:
• A large part of past growth in the industry has been through conversion of
captive gaseous hydrogen producers to purchasers of liquid hydrogen. There
are expected to be fewer opportunities for this sort of growth in the future.
• In response to increased competition in supplying liquid hydrogen, some gas
companies have been converting liquid hydrogen accounts to supplier owned
on-site plants, which are generally longer term contracts. Examples include a
Union Carbide facility that went on stream in 1989 to supply AT&T's fiber
optics plant in Norcross, GA; Air Product's facility to supply FMC
Corporation's chemical plant at South Charleston, WV; and Air Product's
facility at American Cyanamid's chemical plant in Hannibal, MO
• As plant loadings increase, gas companies are likely to emphasize servicing
more profitable accounts, causing some consumers to convert to captive
production.
• Demand in 1989 was unusually high.
Geographically, consumption is concentrated in the northeastern states, Michigan, Indi,'ma,
and Ohio. This will continue to be the case through 2000. The following tables display data on
the major markets for liquid hydrogen by market sectors.
CHEMICALS, PETROCHEMICALS, AND REFINERIES
Table 4 displays consumption in the chemical industry to date, and projections for the next ten
years...y
LIQUIDTable 4
HYDROGEN CONSUMPTION IN THE CHEMICAL,REFINING INDUSTRIES
Millions ofYear Cubic Feet
1980 2555
1985 3040
1987 33001988 34301989 4215
1990 4430
1995 5210-5370
2000 6035-6695
PETROCHEMICAL, AND
AverageAnnual Growth
3.5% (1980-1985)
8.5% (1985-1989)
3.6% to 4.1% (1989-1995)
3.0% to 4.5% (1995-2000)
-- 21
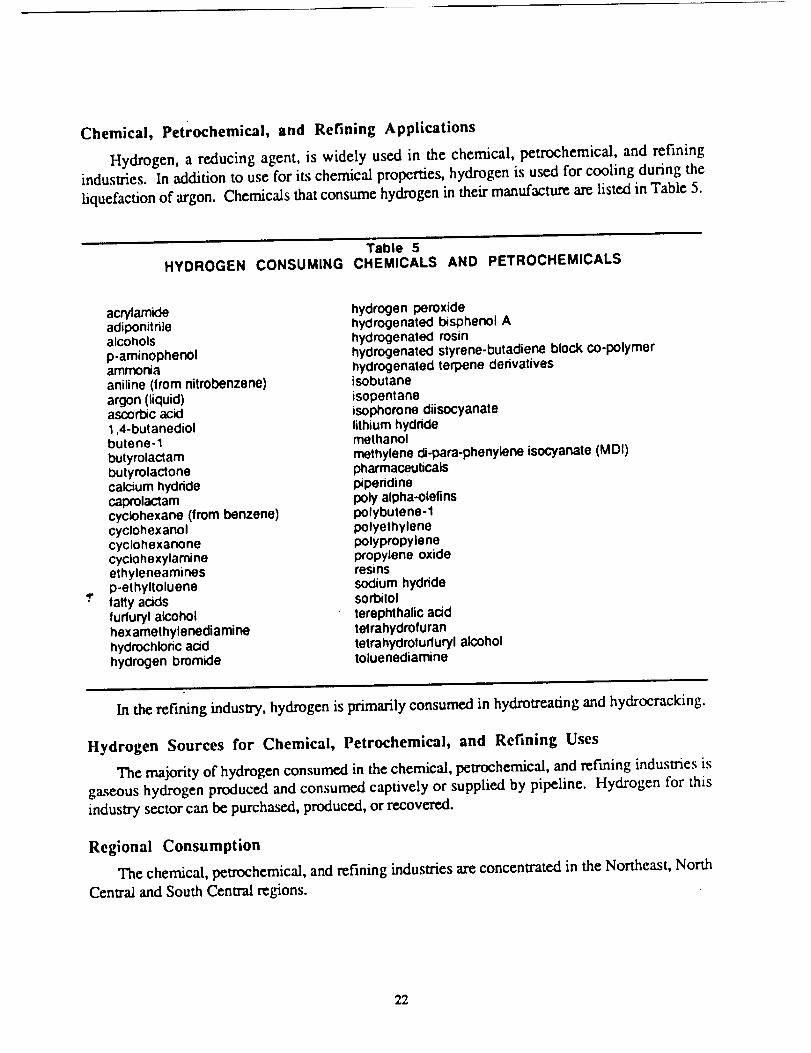
Chemical, Petrochemical, and Refining Applications
Hydrogen, a reducing agent, is widely used in the chemical, petrochemical, and refining
industries. In addition to use for its chemical properties, hydrogen is used for cooling during the
liquefaction of argon. Chemicals that consume hydrogen in their manufacture are listed in Table 5.
Table 5HYDROGEN CONSUMING CHEMICALS AND PETROCHEMICALS
.I"
acrylamideadiponitnlealcoholsp-aminophenolammoniaaniline (from nitrobenzene)argon (liquid)ascorbic acid1,4-butanediolbutene-1bulyrolactambutyrolactonecalcium hydridecaprolactamcyc_ohexane (from benzene)cyclohexanolcyclohexanonecyclohexylamineethyleneaminesp-ethyltolueneratty acidsfurfuryl alcoholhexamethylenediaminehydrochlonc acidhydrogen bromide
hydrogen peroxidehydrogenated bisphenol Ahydrogenated rosinhydrogenated styrene-butadiene block co-polymerhydrogenated terpene derivativesisobutaneisopentaneisophorone diisocyanatelithium hydridemethanolmethylene di-para-phenylene isocyanate (MDI)pharmaceuticalspiperidinepoly alpha-olefinspolybutene-1polyethylenepolypropylenepropylene oxideresinssodium hydridesorbilolterephthalic acidtetrahydrofurantetrahydrotuduryl alcoholtoluenediamine
In the refining industry, hydrogen is primarily consumed in hydrotreadng and hydrocracking.
Hydrogen Sources for Chemical, Petrochemical, and Refining Uses
The majority of hydrogen consumed in the chemical, petrochemical, and refining industries is
gaseous hydrogen produced and consumed captively or supplied by pipeline. Hydrogen for this
industry sector can be purchased, produced, or recovered.
Regional Consumption
The chemical, petrochemical, and refining industries are concentrated in the Northeast, North
Central and South Central regions.
22
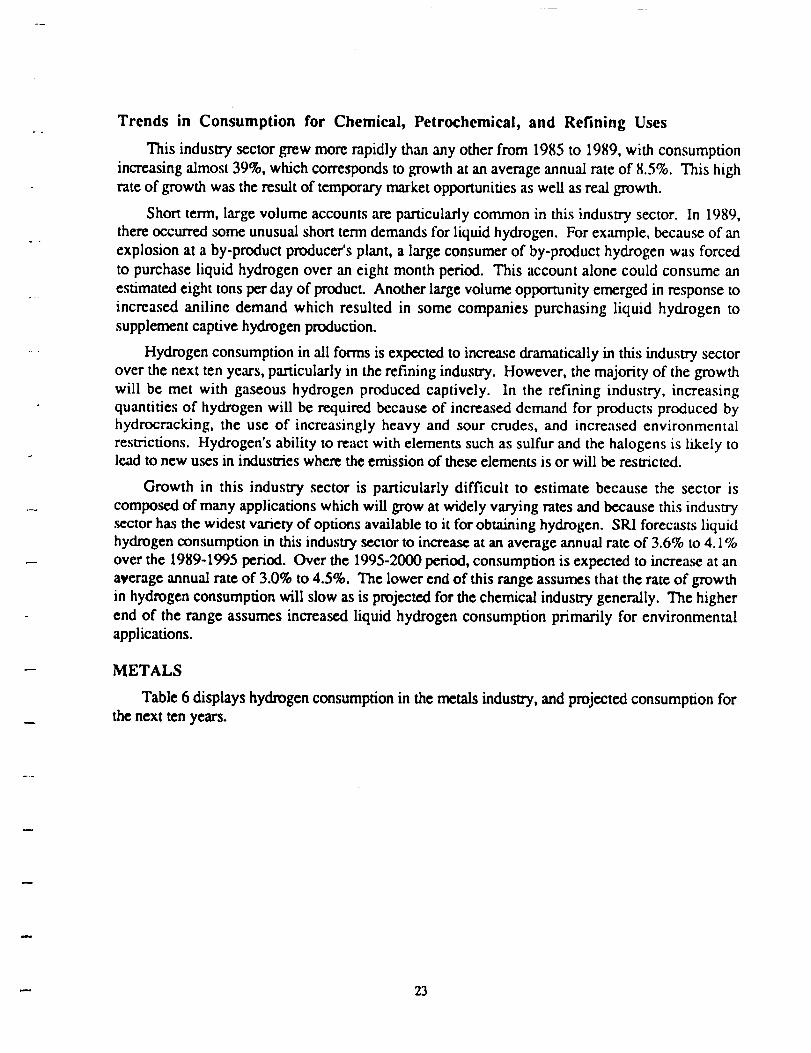
Trends in Consumption for Chemical, Petrochemical, and Refining Uses
This industry sector grew more rapidly than any other from 1985 to 1989, with consumption
increasing almost 39%, which corresponds to growth at an average annual rate of 8.5%. This high
rate of growth was the result of temporary market opportunities as well as real growth.
Short term, large volume accounts are particularly common in this industry sector. In 1989,
there occurred some unusual short term demands for liquid hydrogen. For example, because of an
explosion at a by-product producer's plant, a large consumer of by-product hydrogen was forced
to purchase liquid hydrogen over an eight month period. This account alone could consume an
estimated eight tons per day of product. Another large volume opportunity emerged in response to
increased aniline demand which resulted in some companies purchasing liquid hydrogen to
supplement captive hydrogen production.
Hydrogen consumption in all forms is expected to increase dramatically in this industry sector
over the next ten years, particularly in the refining industry. However, the majority of the growth
will be met with gaseous hydrogen produced captively. In the refining industry, increasing
quantities of hydrogen will be required because of increased demand for products produced by
hydrocracking, the use of increasingly heavy and sour etudes, and increased environmental
restrictions. Hydrogen's ability to react with elements such as sulfur and the halogens is likely tolead to new uses in industries where the emission of these elements is or will be restricted.
Growth in this industry sector is particularly difficult to estimate because the sector is
composed of many applications which will grow at widely varying rates and because this industry
sector has the widest variety of options available to it for obtaining hydrogen. SILl forecasts liquid
hydrogen consumption in this industry .sector to increase at an average annual rate of 3.6% to 4.1%
over the 1989-1995 period. Over the 1995-2000 period, consumption is expected to increase at an
a_,erage annual rate of 3.0% to 4.5%. The lower end of this range assumes that the rate of growth
in hydrogen consumption will slow as is projected for the chemical industry generally. The higher
end of the range assumes increased liquid hydrogen consumption primarily for environmental
applications.
METALS
Table 6 displays hydrogen consumption in the metals industry, and projected consumption for
the next ten years.
23
Table 6LIQUID HYDROGEN CONSUMPTION IN METALS
Millions ofYear Cubic Feet
1980 2.050
1985 2,410
1987 2,6001988 2.7301989 2,870
1990 3,050
1995 4,295-4440
2000 5,600-6,240
AverageAnnual Growth
3.3% (1980-1985)
4.5% (1985-1989)
7.0% tO .7.5% (1989-1995)
5.5% tO 7.0% (1995-2000)
Metal Applications
In the metals sector, liquid hydrogen is used in both primary metal production and secondary
metal processing. Primary operations that consume hydrogen include tungsten, tungsten carbide
and molybdenum metal powder production. Secondary operations that consume hydrogen include
heat treating, sintering, and brazing. The majority of hydrogen used in the metals industry is for
.¢condary operations rather than primary metal production.
In tungsten and molybdenum metal powder production, hydrogen acts as a reducing agent, to
reduce a tungsten or molybdenum oxide to its elemental form. In tungsten carbide production,
hydrogen reacts with a hydrocarbon atmosphere generated by the reaction of carbon black and
hydrogen to form tungsten carbide powder.
In secondary operations, hydrogen is commonly used as an atmosphere in furnaces that
require an atmosphere for reduction or to improve the thermal conductivity of the atmosphere.
Small quantifies of hydrogen arc sometimes used as a backfill gas in vacuum furnaces. Hydrogen
is used in large quantities for heat treating; specific heat u'eating operations that consume hydrogen
include normalizing low carbon steel prior to galvanizing, annealing of steel strip and coil, bright
annealing of stainless steel, and decarburizing. Types of companies likely to consume hydrogen
for heat treating include steel works, finishing mills, and in-house and commercial heat treaters.
Sintering is the process by which loose or compressed powders are bonded by heating at
temperatures below the melting points of the major constituents. Because powdered metals
undergoing sintering have such a large exposed surface area, hydrogen atmospheres are commonly
used to prevent oxidation. Metal compacts that arc typically sintered in a hydrogen atmosphere
includetoolsteel,stainlesssteel,and nickel-and cobalt-basealloys.
24

Brazing is a technique used largely in the aerospace and electronics industries to join pans.
Brazing joins solid materials together by heating them to a suitable temperature and by using a filler
metal having a liquidus above 840 degrees Fahrenheit and below the solidus of the base materials.
Hydrogen Sources for Metals Uses
Hydrogen for primary metal production is typically purchased in liquid form or produced
captively by steam reforming of natural gas. In secondary operations, a hydrogen atmosphere can
be obtained in a variety of ways, including generation from natural gas (endothermic or exothermic
atmospheres), dissociation of ammonia or methanol, and purchased hydrogen atmospheres. The
largest volume consumers, such as large steel producers, may be located on a pipeline.
Companies that make powdered metal pans have traditionally dissociated ammonia to generate
a hydrogen containing atmosphere. At in-house or commercial heat treating operations, generated
hydrogen atmospheres have been traditional. Industrial gas companies have targeted powdered
metal parts producers and heat treaters as potential liquid hydrogen markets and have been quite
successful at persuading many hydrogen users to convert to purchased atmospheres.
Regional Consumption
Consumption in this industry is concentrated in the Northeast and North Central states. The
steel industry is primarily located in the north central states, with a large concenwation also in the
Northeast. Many of the accounts in the North Central region are supplied with pipeline hydrogen.
Heat treating operations are more broadly distributed geographically, but tend to be more common
in regions with more equipment manufacturing, such as the Northeast and North Central regions.
The largest number of powdered metal manufacturers can be found in Pennsylvania. Ranked next
in quantity are Michigan, Illinois, California, Ohio and Massachusetts. Primary metal producers
tlrat purchase liquid hydrogen are almost all located in the Northeast.
Factors Affecting Consumption for Metals Uses
Liquid hydrogen consumption in the metals industry is expected to increase at an average
annual rate of 7.0% to 7.5% from 1989 to 1995. This high rate of growth will be sustained by
continued conversion from generated atmospheres to purchased atmospheres, high growth in the
powdered metals industry, and higher concentrations of hydrogen being used in bell annealers in
the steel industry.
From 1995 to 2000, the average annual rate of growth is expected to slow to 5.5% to 7.0%,
to reflect the decrease in opportunities for conversion to purchased atmospheres or high hydrogen
atmospheres.
ELECTRONICS
Table 7 displays hydrogen consumption in the electronics industry and projections for the next
ten years.
25
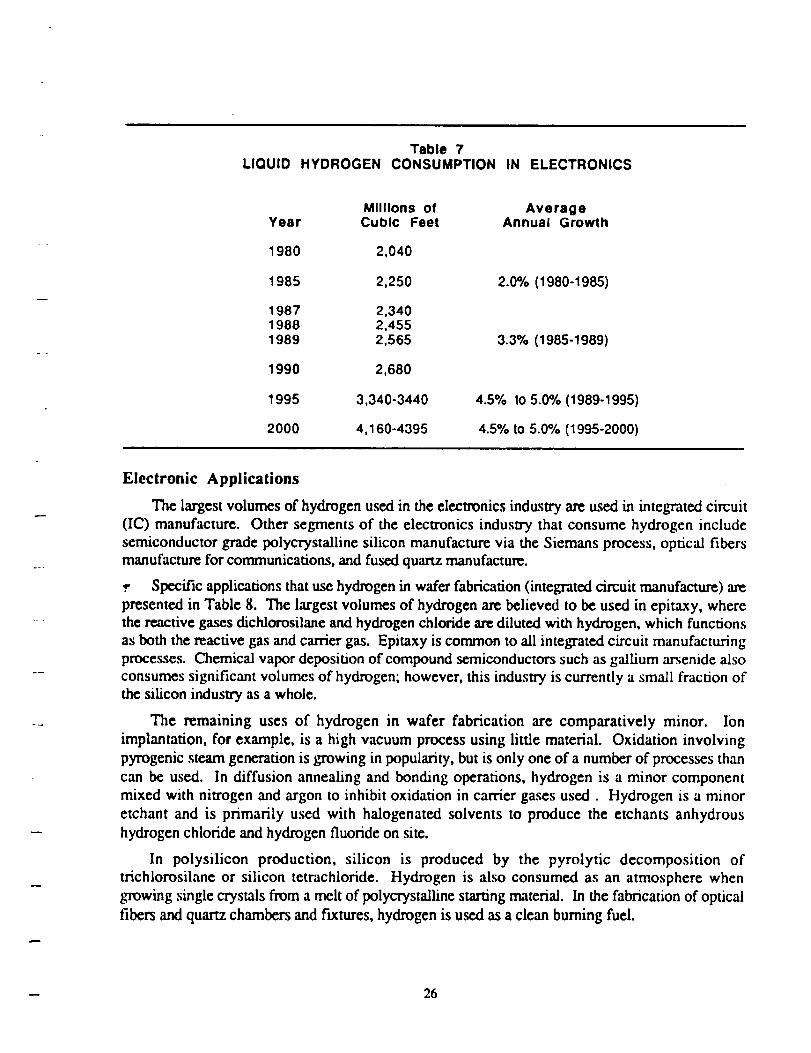
Table 7LIQUID HYDROGEN CONSUMPTION IN ELECTRONICS
Millions ofYear Cubic Feet
1980 2,040
1985 2,250
1987 2,3401988 2,4551989 2,565
1990 2,680
1995 3,340-3440
2000 4,160-4395
AverageAnnual Growth
2.0% (1980-1985)
3.3% (1985-1989)
4.5% tO 5.0% (1989-1995)
4.5% tO 5.0% (1995-2000)
Electronic Applications
The largest volumes of hydrogen used in the electronics industry are used in integrated circuit
(IC) manufacture. Other segments of the electronics industry that consume hydrogen include
semiconductor grade polycrystaUine silicon manufacture via the Siemans process, optical fibers
manufacture for communications, and fused quartz manufacture.
.,. Specific applications that use hydrogen in wafer fabrication (integrated circuit manufacture) are
presented in Table 8. The largest volumes of hydrogen are believed to be used in epitaxy, where
the reactive gases dichlorosilane and hydrogen chloride are diluted with hydrogen, which functions
as both the reactive gas and carrier gas. Epitaxy is common to all integrated circuit manufacturing
processes. Chemical vapor deposition of compound semiconductors such as gallium arsenide also
consumes significant volumes of hydrogen; however, this industry is currently a small fraction of
the silicon industry as a whole.
The remaining uses of hydrogen in wafer fabrication are comparatively minor. I0n
implantation, for example, is a high vacuum process using little material. Oxidation involving
pyrogenic steam generation is growing in popularity, but is only one of a number of processes than
can be used. In diffusion annealing and bonding operations, hydrogen is a minor component
mixed with nitrogen and argon to inhibit oxidation in carrier gases used. Hydrogen is a minor
etchant and is primarily used with halogenated solvents to produce the etchants anhydrous
hydrogen chloride and hydrogen fluoride on site.
In polysilicon production, silicon is produced by the pyrolytic decomposition of
trichlorosilane or silicon tetrachloride. Hydrogen is also consumed as an atmosphere when
growing single crystals from a melt of polycrystalline starting material. In the fabrication of optical
fibers and quartz chambers and fixtures, hydrogen is used as a clean burning fuel.
- 26
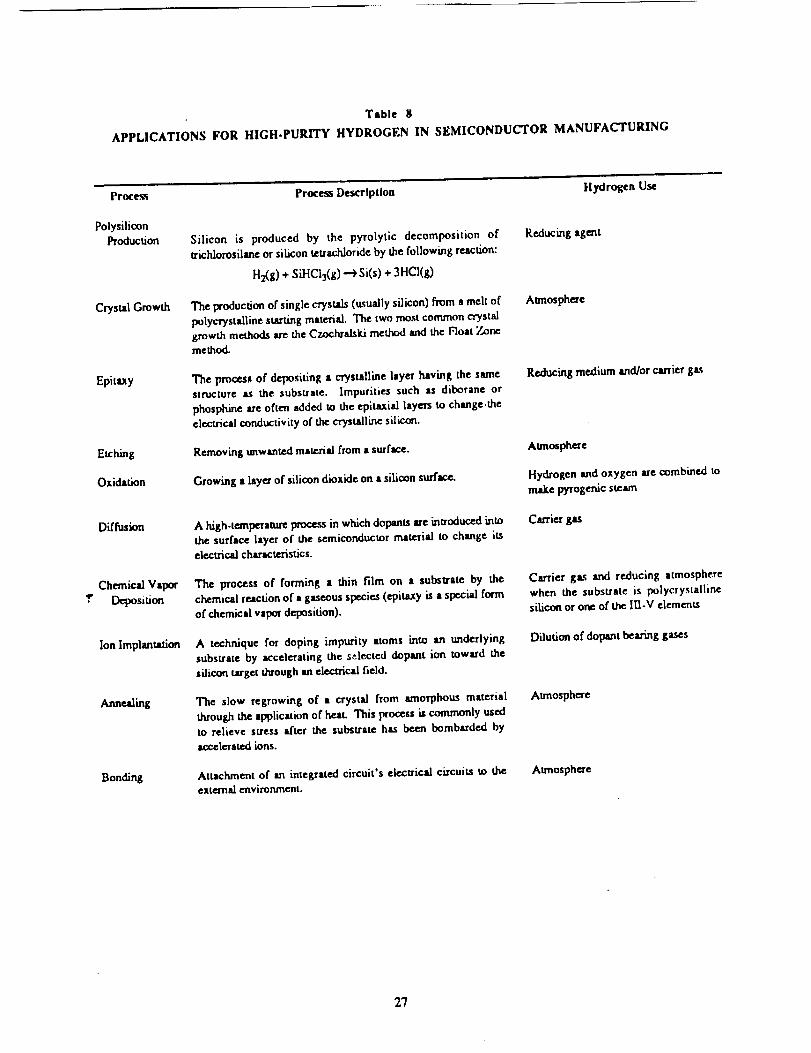
Table g
APPLICATIONS FOR HIGH-PURITY HYDROGEN IN SEMICONDUCTOR MANUFACTURING
Y
PFoce._'qi
Polysilicon
Production
CrystalGrowth
Epimxy
Diffusion
Chemical Vapor
Deposition
Ion Implantation
Annealing
Bonding
Process Description
Silicon is produced by the pyrolytic decomposition of
trichlorosilane or silicon tetraddoride by the following reaction:
H2(g) + SiHCI3(g) -_ Si(s) + 3HCI(g)
The productionof singlecrystals(usuallysilicon)from a meltof
polycrystalline starting material. The two most common crystal
growth methods are the Czochralski method and the Float Zone
method.
The process of depositing a crystalline layer having the same
structure as the substrate. Impurities such as diborane or
phosphine are often added to the epitaxial layers to change.the
electrical conductivity of the crystalline silicon.
Removing tmwanted material from a surf_e.
Growing • layer of silicon dioxide on a silicon surface.
A high.temperature process in which dopants are introduced into
the surface layer of the semiconductor materitl to change i_
electrical characteristics.
The process of forming a thin film on a subsu'ate by the
chemical reaction of a gaseous species (epitaxy is a special form
of chemical vapor deposition).
A technique for doping impurity atoms into an underlying
substrate by accelerating the selected dopant ion toward the
silicon target through an electrical field.
The slow regrowing of a crystal from amorphous material
through the application of heal This process is commonly used
to relieve stress after the substrate has been bombarded byaccelerated ions.
Attachment of an integrated circuit's electrical circuits to theexternal environment.
Hydrogen Use
Reducing agent
_DllOSphcrc
Reducing medium and/or carrier gs.s
Atmosphere
Hydrogen and oxygen are combined to
make pyrogenic steam
Carrier gas
Carrier gas and reducing atmosphere
when the substrate is polycrystalline
siliconor one of theIH-V elements
Dilution of dopant bearing gases
Aunosphcl"e
Atmosphere
27
Hydrogen Sources for Electronics Uses
Because of its high purity, liquid hydrogen has traditionally been the form of choice for
consumers purchasing hydrogen for wafer fabrication and polysilicon production.
Purity requirements for hydrogen for fuel use are not as stringent, which means that a
company's procurement decision will be based primarily on production and transportation
economics. Quartz fabricators tend to be small volume consumers that will purchase gas in tube
trailers. AT&T is the largest fiber optic manufacturer that uses hydrogen. AT&T purchased liquid
hydrogen at its Norcross, Georgia facility until its requirements grew large enough to justifyhaving Union Carbide operate an on site system at the site.
Regional Consumption
The electronics industry, in particular integrated circuit manufacture, tends to be concentrated
in the Western states, the South Central region and the Northeast. Fiber optics has been a large
end use in the South Atlantic states, polysilicon production in the Western and North Central
states, and quartz production in the North Centrad and South Atlantic states.
Factors Affecting Consumption for Electronics Uses
Liquid hydrogen consumption has not grown as rapidly as the electronic industry segments that
consume hydrogen, primarily due to increased efficiency of use. For example, polysilicon
production used to be a large market for liquid hydrogen, but unit requirements were vastly
reduced in the early 19g0s by the introduction of hydrogen recycling. It is believed that unit
hydrogen consumption for wafer fabrication will increase slightly because of the trend toward
CMOS and BiCMOS structures that are heavily dependant on epitaxy in their processing.
H/ydrogen has also been proposed as part of a system to replace CFCs used in cleaning solutions.
Liquid hydrogen consumption in electronics is projected to grow at an average annual rate of 4.5%to 5.0% from 1989 to 2000.
FATS AND OILS
Table 9 displays consumption in the fats industry, and projections for the next ten years.
28
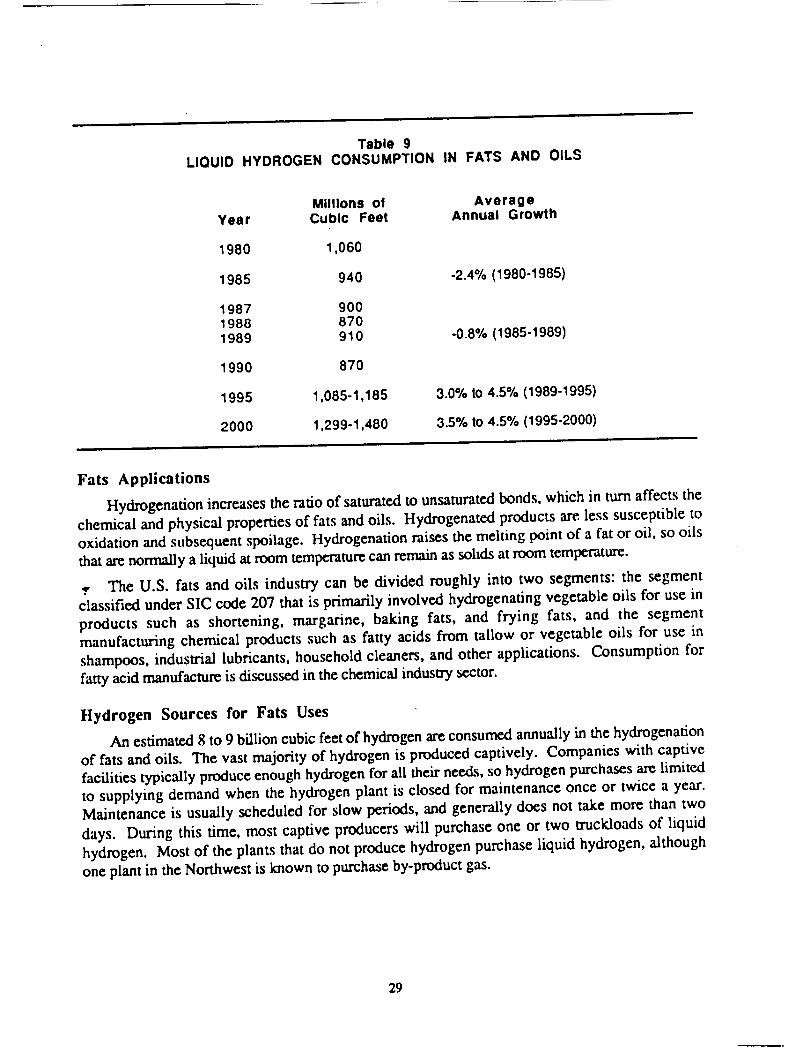
Table 9LIQUID HYDROGEN CONSUMPTION IN FATS AND OILS
Millions ofYear Cubic Feet
1980 1,060
1985 940
1987 9001988 8701989 910
1990 870
1995 1,085-1,185
2000 1,299-1,480
AverageAnnual Growth
-2.4%(1980-1985)
-0.8%(1985-1989)
3.0% tO 4.5% (1989-1995)
3.5% tO 4.5% (1995-2000)
Fats Applications
Hydrogenation increases the ratio of saturated to unsaturated bonds, which in turn affects the
chemical and physical properties of fats and oils. Hydrogenated products are less susceptible to
oxidation and subsequent spoilage. Hydrogenation raises the mehing point of a fat or oil, so oils
that are normally a liquid at room temperature can remain as solids at room temperature.
.'r The U.S. fats and oils industry can be divided roughly into two segments: the segment
classified under SIC code 207 that is primarily involved hydrogenating vegetable oils for use in
products such as shortening, margarine, baking fats, and frying fats, and the segment
manufacturing chemical products such as fatty acids from tallow or vegetable oils for use in
shampoos, industrial lubricants, household cleaners, and other applications. Consumption for
fatty acid manufacture is discussed in the chemical industry sector.
Hydrogen Sources for Fats Uses
An estimated 8 to 9 billion cubic feet of hydrogen are consumed annually in the hydrogenation
of fats and oils. The vast majority of hydrogen is produced captively. Companies with captive
facilities typicaUy produce enough hydrogen for all their needs, so hydrogen purchases are limited
to supplying demand when the hydrogen plant is closed for maintenance once or twice a year.
Maintenance is usually scheduled for slow periods, and generally does not take more than two
days. During this time, most captive producers will purchase one or two trucldoads of liquid
hydrogen. Most of the plants that do not produce hydrogen purchase liquid hydrogen, although
one plant in the Northwest is known to purchase by-product gas.
29
Regional Consumption
Demandfor this enduse is concentrated in the North Central region, which accounted for an
estimated 45% of liquid consumption in 1989.
Factors Affecting Consumption for Fats Uses
Production of hydrogenated fats and oils has increased at an average annual rate of about
2.7% over the past 10 years and should continue to grow at an average annual rate of about 1.5-
2.5% from 1990 to 2000. Liquid hydrogen consumption in this industry has not followed trends
in fats production. From 1980 to 1985, several larger companies expanded their market share and
consolidated production at large facilities with on-site generators. Although a few companies with
smaller hydrogen plants, generally based on ammonia dissociation or electrolysis, converted to
purchased gas or liquid product, this did not compensate for the decline in liquid hydrogen
consumption that took place as large liquid accounts converted to on-site production and some
smaller liquid hydrogen accounts ceased production.
From 1985 to 1990, consumption has fluctuated between 870 and 940 million cubic feet. In
any given year, demand is less likely to reflect industry growth than one-time incidents, such as
whether a fats processing plant has opened or closed or switched between captive and purchased
product. For example, the primary factors influencing the the change in consumption between
1989 and 1990 were the installation of a captive hydrogen plant at the Ag Processing Inc.,
St. Joseph, MO, facility, combined with the construction of the new Aarhus Inc. facility in Port
Newark, N J, that will use purchased hy_ogen.
It is expected that liquid hydrogen consumption in the fats and oils industry will grow at an
average annual rate of 3.0% to 4.5% from 1989 to 1995, and at an average annual rate of 3.5% to
.6.5% from 1995 to 2000. Assumptions behind this projection include the following:
• The trend toward industry consolidation, and in turn toward large plants with
captive hydrogen, has slowed.
• Hydrogen consumption per unit product will not decline and may increase.
• Recently developed fat substitutes, such as Simplesse from Monsanto Co. and
Olestra from Proctor & Gamble, will remain comparatively small volume
specialty products and wilt not erode the market for natural fats.
Hydrogen consumption per unit product is difficult to predict since several factors, often
contradictory, influence the amount of hydrogen consumed per unit of product. These factors
include changes in the degree of hydrogenation desired as well as changes in the efficiency of the
hydrogenation process.
One major factor that affects the degree of hydrogenation required is change in the types of
oils processed, which is in turn influenced by world vegetable oil prices and consumer
preferences. For example, in the mid-1980s comparatively low prices for palm oil led to large
increases in its use. Because palm oil was more saturated than most of the oils it replaced, less
hydrogenation was required.
In recent years, health concerns have led to a consumer preference for unsaturated fats: this
can lead to an increase in hydrogenation levels since unsaturated fats in many instances require
_ 3O
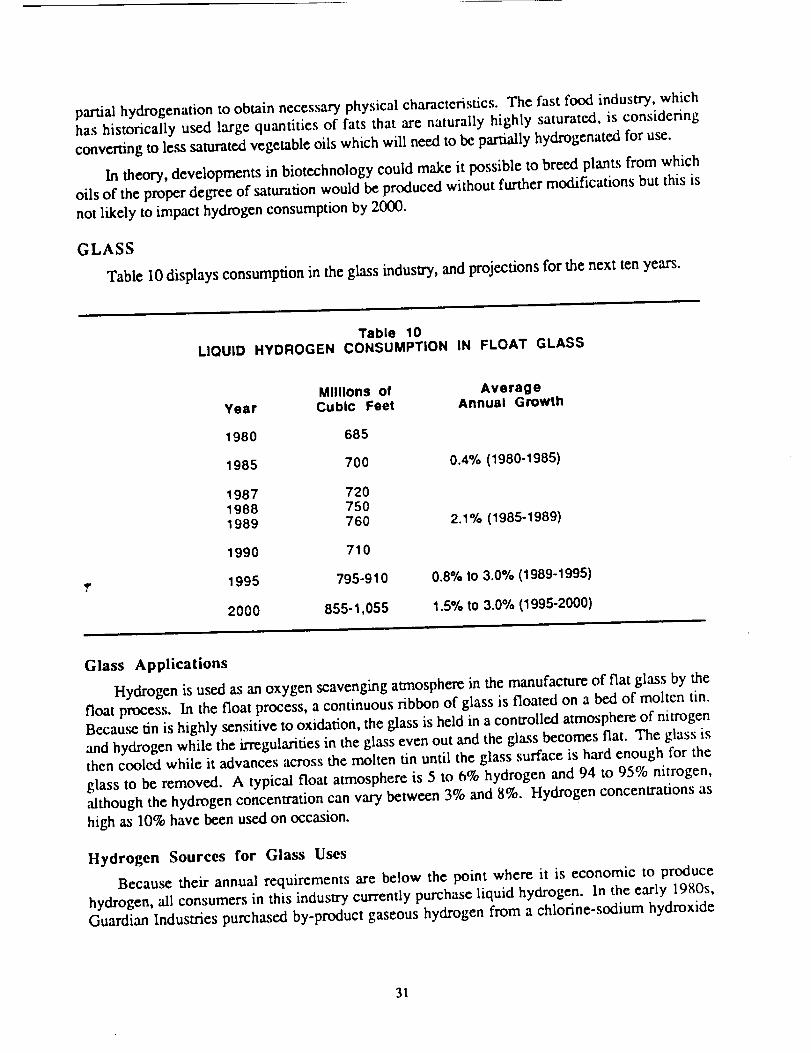
partial hydrogenation to obtain necessary physical characteristics. The fast food industry, which
has historically used large quantities of fats that are naturally highly saturated, is considering
converting to less saturated vegetable oils which will need to be partially hydrogenated for use.
In theory, developments in biotechnology could make it possible to breed plants from which
oils of the proper degree of saturation would be produced without further modifications but this is
not likely to impact hydrogen consumption by 2000.
GLASS
Table 10 displays consumption in the glass induslry, and projections for the next ten years.
Table 10LIQUID HYDROGEN CONSUMPTION IN FLOAT GLASS
Millions ofYear Cubic Feet
1980 685
1985 700
1987 7201988 7501989 760
1990 710
1995 795-910
2000 855-1,055
AverageAnnual Growth
0.4% (1980-1985)
2.1% (1985-1989)
0.8% to 3.0% (1989-1995)
1.5% to 3.0% (1995-2000)
Glass Applications
Hydrogen is used as an oxygen scavenging atmosphere in the manufacture of flat glass by the
float process. In the float process, a continuous ribbon of glass is floated on a bed of molten tin.
Because tin is highly sensitive to oxidation, the glass is held in a controlled atmosphere of nitrogen
and hydrogen while the irregularities in the glass even out and the glass becomes flat. The glass is
then cooled while it advances across the molten tin until the glass surface is hard enough for the
glass to be removed. A typical float atmosphere is 5 to 6% hydrogen and 94 to 95% nitrogen,
although the hydrogen concentration can vary between 3% and 8%. Hydrogen concentrations as
high as 10% have been used on occasion.
Hydrogen Sources for Glass Uses
Because their annual requirements are below the point where it is economic to produce
hydrogen, all consumers in this industry currently purchase liquid hydrogen. In the early 1980s,
Guardian Industries purchased by-product gaseous hydrogen from a chlorine-sodium hydroxide
31
plant near its Carleton, Michigan facility. Since the closure of that plant in early 1985, Guardian
has purchased liquid product.
During the next five to ten years it is expected that glass consumers will continue buying liquid
hydrogen from industrial gas suppliers. Consumers report that even if technology were available
to produce hydrogen captively in the quantities consumed in this industry, that they would be
reluctant to invest the capital necessary to build, operate, and maintain a hydrogen plant.
Regional Consumption
Most hydrogen for float glass production is consumed in the North Central region (30% of
1989 consumption), followed by the South Central and South Atlantic regions (24% and 22%,
respectively), and then the West and Northeast (13% and 11%, respectively).
Float glass tanks tend to be located near glass markets. For example, glass demand for the
automotive industry is concentrated in the North Central region. The newest float glass plants have
been built in the Western and South Atlantic states to supply demand associated with increased
construction. In the South Atlantic region, half of the U.S. mirror glass manufacturing industry is
located within approximately 150 miles of the Libby Glass's North Carolina plant.
Factors Affecting Consumption for Glass Uses
Hydrogen consumption tends to vary with two factors: float glass production and the
concentration of hydrogen in the controlled atmosphere. Float glass production levels are by far
the most important factor.
Float glass production reached record levels in 1987 and 1988 and several new plants came on
stream; (PPG Industries in Chehalis, WA, in late 1986; AFG Industries in Victorville, CA, in late
1987; Guardian Industries in Richburg, SC, in late 1988; AFG Industries Inc. in Spring Hill, KS,
'in January 1989; PPG Industries in Cumberland, MD, in late 1989). In 1989, production levels
remained flat. Because capacity grew more rapidly than demand, some older facilities were
temporarily closed in 1990 for maintenance (e.g., one of Ford's tanks at Tulsa, OK and Libbey's
unit at Lathrop, CA) or to avoid building up excessive inventories (e.g., AFG Industries at
Cinnaminson, N J, and one of three tanks at Ford's Nashville, TN facility). Float glass tanks tend
to operate near capacity or not at all.
In general, companies try to minimize hydrogen consumption to control costs. Since 1980,
companies have become more efficient in their hydrogen use. It appears unlikely that significant
further reductions in hydrogen consumption will take place.
Between 1989 and 1995, liquid hydrogen consumption in float glass production is expected to
increase at an average annual rate of 0.8% to 3.0%. Between 1995 and 2000 consumption is
forecast to increase at an average annual rate of 1.5% to 3.0%.
Regional growth is not expected to vary significantly from the national trend. None of the
major U.S. companies have announced new plant construction over the next five years, although it
is expected that the lines that are currently not operating will come back on stream. Currently the
West and South Atlantic are the regions least likely to build new plants since these are the areas
where new plants were most recently constructed. The West is especially experiencing
overcapacity currently. The West also has strict environmental regulations regarding furnace
- 32
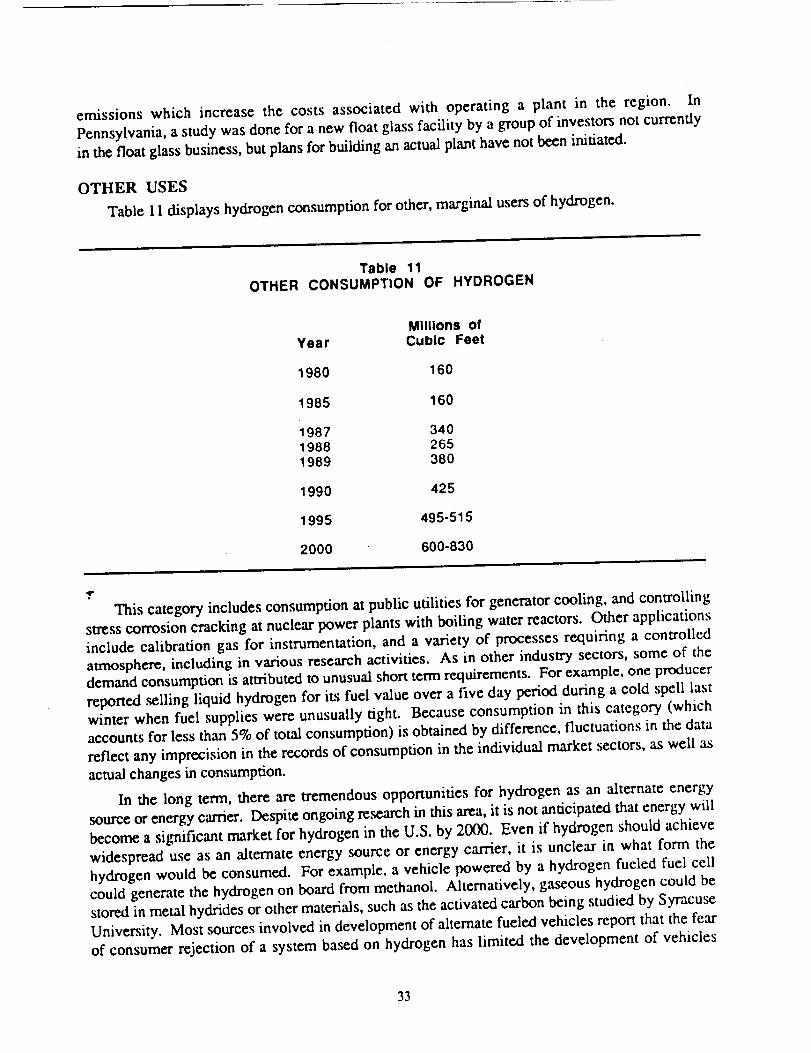
emissions which increase the costs associatedwith operating a plant in the region. In
Pennsylvania, a study was done for a new float glass facility by a group of investors not currently
in the float glass business, but plans for building an actual plant have not been initiated.
OTHER USES
Table 11 displays hydrogen consumption for other, marginal users of hydrogen.
Table 11OTHER CONSUMPTION OF HYDROGEN
Millions ofYear Cubic Feet
1980 160
1985 160
1987 3401988 2651989 380
1990 425
1995 495-515
2000 600-830
..r
This category includes consumption at public utilities for generator cooling, and controlling
stress corrosion cracking at nuclear power plants with boiling water reactors. Other applications
include calibration gas for instrumentation, and a variety of processes requiring a controlled
atmosphere, including in various research activities. As in other industry sectors, some of the
demand consumption is attributed to unusual short term requirements. For example, one producer
reported selling liquid hydrogen for its fuel value over a five day period during a cold spell last
winter when fuel supplies were unusually tight. Because consumption in this category (which
accounts for less than 5% of total consumption) is obtained by difference, fluctuations in the data
reflect any imprecision in the records of consumption in the individual market sectors, as well as
actual changes in consumption.
In the long term, there are tremendous opportunities for hydrogen as an alternate energy
source or energy carrier. Despite ongoing research in this area, it is not anticipated that energy will
become a significant market for hydrogen in the U.S. by 2000. Even if hydrogen should achieve
widespread use as an alternate energy source or energy carrier, it is unclear in what form the
hydrogen would be consumed. For example, a vehicle powered by a hydrogen fueled fuel cell
could generate the hydrogen on board from methanol. Alternatively, gaseous hydrogen could be
stored in metal hydrides or other materials, such as the activated carbon being studied by Syracuse
University. Most sources involved in development of alternate fueled vehicles report that the fear
of consumer rejection of a system based on hydrogen has limited the development of vehicles
33
fueled directly by hydrogen. It is thought that many individuals are only aware of hydrogen for its
role in the Hindenburg disaster, and would be unlikely to want a hydrogen tank on their car. In
general, liquid hydrogen is most likely to be required for projects that involve large scale or
nonzerrestrial transport, such as the proposed project for sending energy from Quebec to Western
Europe, and studies concerning hydrogen for use as an aircraft fuel.
The province of Quebec in Canada and the European Community arc currently studying the
feasibility of shipping hydrogen to Hamburg, West Germany. Under the current proposal, the
hydrogen would be produced electrolytically at a 100 mcgawatt plant in Quebec on the St.
Lawrence Seaway. The hydrogen could be shipped as liquid hydrogen, ammonia, or
mcthylcyclohexane. The initial phase of the project, which is nearing completion, will estimate the
cost of the concept with an accuracy of about 15%. On a preliminary basis, industry sources
indicate that shipping liquid hydrogen currently appears to be the most promising alternative.
However, it also appears that transporting hydrogen from Quebec to Hamburg, as opposed to
producing hydrogen in Hamburg, is unlikely to be justifiable on purely economic grounds. Once
the initial studies are complete, there is no funding mechanism in place for implementing the
program. Because it is highly uncertain whether the idea will be implemented, and because
hydrogen for the project would be produced from a dedicated plant, it is assumed that this project
will not impact the North American market for liquid hydrogen between now and 2000.
Industry sources indicate that development of hydrogen as a fuel for commercial aircraft is
unlikely to take place before development of the National Aerospace Plane, since expertise gained
from development of the aerospace plane could be transferred to commercial aircraft. This would
push development of commercial hydrogen fueled aircraft beyond 2000. It is possible that small
scale aircraft, such as the unmanned aircraft for atmospheric research applications proposed by
Aurora Flight Sciences Corporation, could consume liquid hydrogen by 2000. Current estimates
put hydrogen consumption at 300 pounds per flight for the Aurora. If the concept is in fact
dtveloped, it is unlikely that more than one or two flights would take place before 2000.
International demand has placed and will continue to place only minor demands on U.S.
plants. It is expected that Canadian plants will continue to represent a significant source of liquid
hydrogen to the commercial sector.
In 1989, trade with Canada is estimated to have resulted in the net import of 2,700 million
cubic feet (19.3 tons per day) of liquid hydrogen. This hydrogen primarily served liquid hydrogen
demand in the Northeast and North Central regions.
Report Documentation PageNal_i ,_on_ul_s ancIS_e A_r_ntr_slr-3lOm
1. Report No.
NASA TM 103812
2. GovernmentAccessionNo.
4. Title and Subtitle
An Assessment of the Government Liquid Hydrogen
Requirements for the 1995-2005 Timeframe Including
Addendum, Liquid Hydrogen Production and CommercialDemand in the United States
7. Author(s)
Addison Bain
Barbara Heydorn (Addendum)
9. PedormingOrganization Name and Address
NASA, John F. Kennedy Space Center
Kennedy Space Center, FL 32899
3. Recipient'sCatalog No.
5. Repo_ Date
July 1990
6. PerformingOrganization Code
SI
8. PerformingOrganization Report No.
10. Work Unit No.
11. Contract or Grant No.
13. Type of Repo_ and PeriodCovered
Technical Memorandum
1990
12. SDonsoring Agency Name and Address
National Aeronautics and Space Administration
Washington, DC 20546 14. Sponsoring AgencyCode
15, Supplementary Notes
16. Abstract
Hydrogen, particularly liquid hydrogen, will continue to be an integral element in
virtually every major space related program as well as numerous aeronautical
programs and a variety of research projects throughout the United States. Liquid
hydrogen has also become a significant merchant product to serve certain commercial
markets requiring bulk hydrogen for providing many consumer goods and services.
Liquid hydrogen is not a universally available commodity (production) as compared to
other commonly used cryogens and industrial gases. The number of supply sources
historically have been limited to regions having concentrated consumption patterns.
Namely this has been the Southwest, Southeast, and Northeast regions. Except for
the Northeast, which is predominantly a commercial demand area, production plant
location and size were typically gauged by needs contemplated by the government.
With the increased space program activity and the possible reality of new programs
it becomes necessary to assess all future programs on a collective and unified basis
to assure that proper planning and contractual commitments are timely to meet
everyone's needs. This report is an initial attempt to identify projected require-
ments on a long range basis.
17. Key Words (Suggested by Author(s))
Liquid Hydrogen
18. Distribution Statement
Unclassified - Unlimited
19. SecudW Classif. (of this repo_l
Unclassified
_. Security Cla_if. (of this page)
Unciassified
21. No. of pages 22. Price
NASA FORM 1626 OCT86


II I