Embed Size (px)
Citation preview

Published by Manhattan Institute
Revealing the source of A
merica’s oil
Understanding the risks of nuclear energy
E
xploring the potential of energy alternatives
Assessing the state of our natural environm
ent
Forecasting the future of our energy supply
Informing A
mericans about basic energy issues
ENERGY THE ENVIRONMENT:
MYTHS FACTSS
EC
ON
D E
DITIO
N
by Drew
Thornley
Rev
U
nder
SE
CS
EC
SE
C
E N E R G Y A N D T H E E N V I R O N M E N T : M Y T H S A N D F A C T S
by Drew ThornleySECOND EDITION
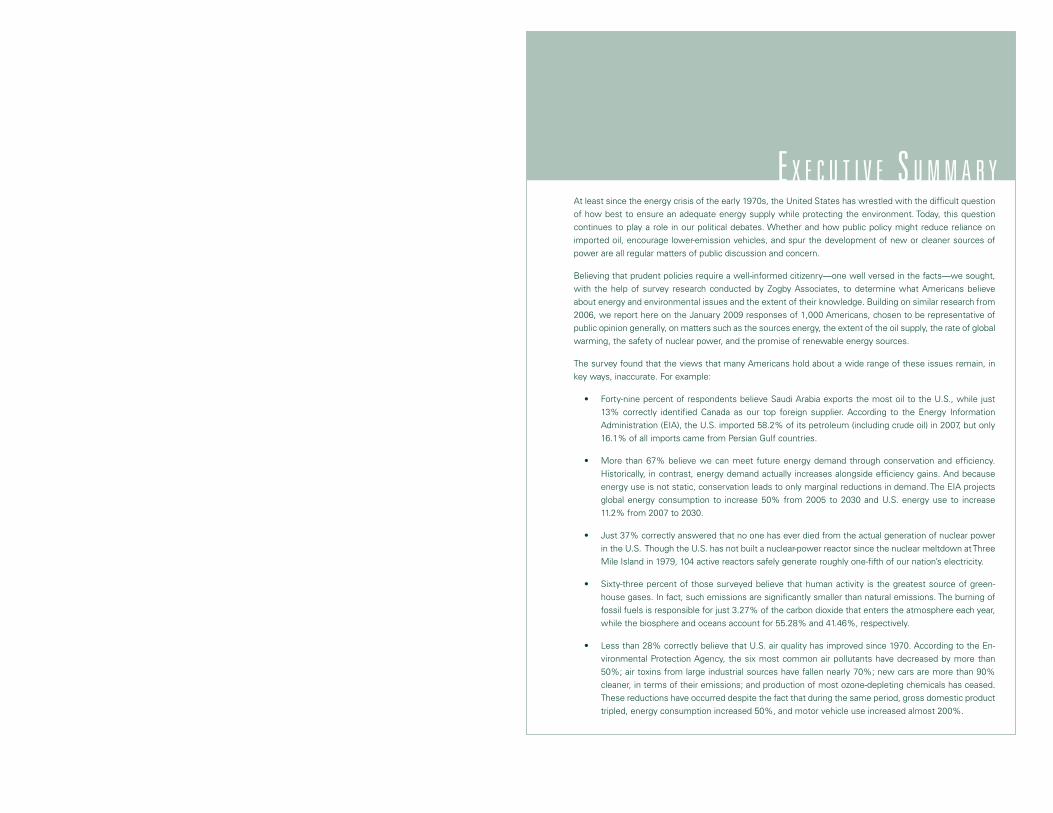
E X E C U T I V E S U M M A R YAt least since the energy crisis of the early 1970s, the United States has wrestled with the difficult question of how best to ensure an adequate energy supply while protecting the environment. Today, this question continues to play a role in our political debates. Whether and how public policy might reduce reliance on imported oil, encourage lower-emission vehicles, and spur the development of new or cleaner sources of power are all regular matters of public discussion and concern.
Believing that prudent policies require a well-informed citizenry—one well versed in the facts—we sought, with the help of survey research conducted by Zogby Associates, to determine what Americans believe about energy and environmental issues and the extent of their knowledge. Building on similar research from 2006, we report here on the January 2009 responses of 1,000 Americans, chosen to be representative of public opinion generally, on matters such as the sources energy, the extent of the oil supply, the rate of global warming, the safety of nuclear power, and the promise of renewable energy sources.
The survey found that the views that many Americans hold about a wide range of these issues remain, in key ways, inaccurate. For example:
• Forty-nine percent of respondents believe Saudi Arabia exports the most oil to the U.S., while just 13% correctly identified Canada as our top foreign supplier. According to the Energy Information Administration (EIA), the U.S. imported 58.2% of its petroleum (including crude oil) in 2007, but only 16.1% of all imports came from Persian Gulf countries.
• More than 67% believe we can meet future energy demand through conservation and efficiency. Historically, in contrast, energy demand actually increases alongside efficiency gains. And because energy use is not static, conservation leads to only marginal reductions in demand. The EIA projects global energy consumption to increase 50% from 2005 to 2030 and U.S. energy use to increase 11.2% from 2007 to 2030.
• Just 37% correctly answered that no one has ever died from the actual generation of nuclear power in the U.S. Though the U.S. has not built a nuclear-power reactor since the nuclear meltdown at Three Mile Island in 1979, 104 active reactors safely generate roughly one-fifth of our nation’s electricity.
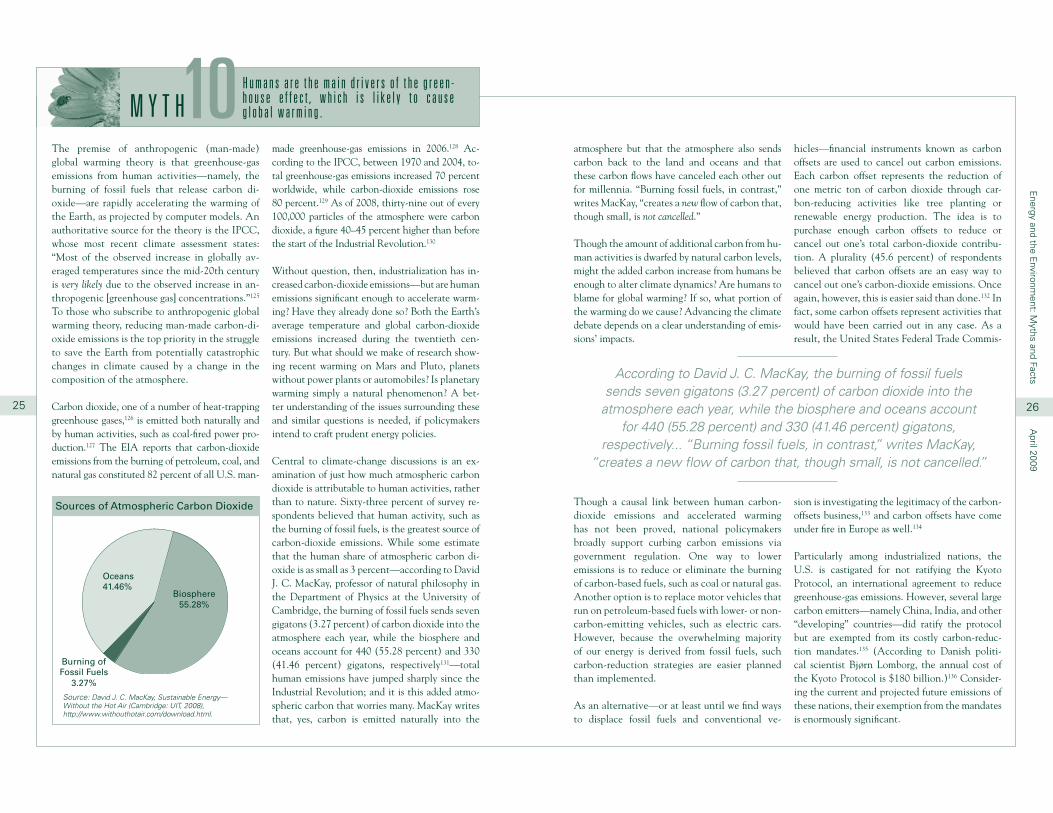
• Sixty-three percent of those surveyed believe that human activity is the greatest source of green-house gases. In fact, such emissions are significantly smaller than natural emissions. The burning of fossil fuels is responsible for just 3.27% of the carbon dioxide that enters the atmosphere each year, while the biosphere and oceans account for 55.28% and 41.46%, respectively.
• Less than 28% correctly believe that U.S. air quality has improved since 1970. According to the En-vironmental Protection Agency, the six most common air pollutants have decreased by more than 50%; air toxins from large industrial sources have fallen nearly 70%; new cars are more than 90% cleaner, in terms of their emissions; and production of most ozone-depleting chemicals has ceased. These reductions have occurred despite the fact that during the same period, gross domestic product tripled, energy consumption increased 50%, and motor vehicle use increased almost 200%.
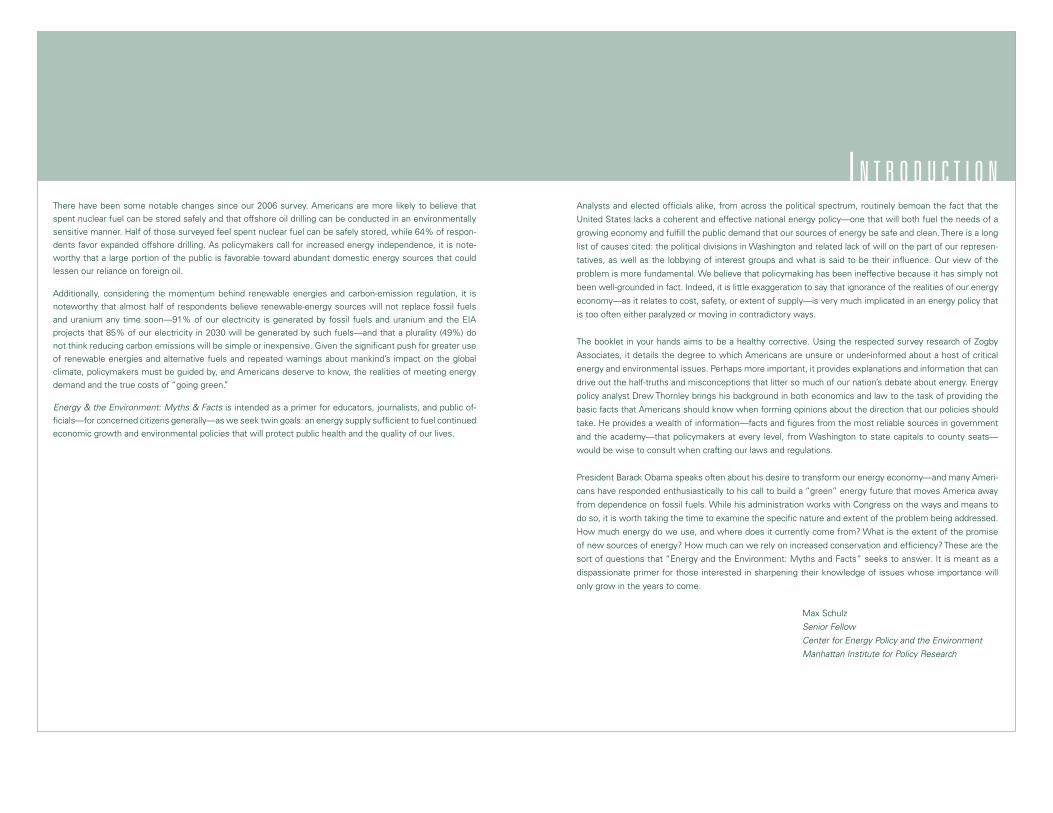
I N T R O D U C T I O NAnalysts and elected officials alike, from across the political spectrum, routinely bemoan the fact that the
United States lacks a coherent and effective national energy policy—one that will both fuel the needs of a
growing economy and fulfill the public demand that our sources of energy be safe and clean. There is a long
list of causes cited: the political divisions in Washington and related lack of will on the part of our represen-
tatives, as well as the lobbying of interest groups and what is said to be their influence. Our view of the
problem is more fundamental. We believe that policymaking has been ineffective because it has simply not
been well-grounded in fact. Indeed, it is little exaggeration to say that ignorance of the realities of our energy
economy—as it relates to cost, safety, or extent of supply—is very much implicated in an energy policy that
is too often either paralyzed or moving in contradictory ways.
The booklet in your hands aims to be a healthy corrective. Using the respected survey research of Zogby
Associates, it details the degree to which Americans are unsure or under-informed about a host of critical
energy and environmental issues. Perhaps more important, it provides explanations and information that can
drive out the half-truths and misconceptions that litter so much of our nation’s debate about energy. Energy
policy analyst Drew Thornley brings his background in both economics and law to the task of providing the
basic facts that Americans should know when forming opinions about the direction that our policies should
take. He provides a wealth of information—facts and figures from the most reliable sources in government
and the academy—that policymakers at every level, from Washington to state capitals to county seats—
would be wise to consult when crafting our laws and regulations.
President Barack Obama speaks often about his desire to transform our energy economy—and many Ameri-
cans have responded enthusiastically to his call to build a “green” energy future that moves America away
from dependence on fossil fuels. While his administration works with Congress on the ways and means to
do so, it is worth taking the time to examine the specific nature and extent of the problem being addressed.
How much energy do we use, and where does it currently come from? What is the extent of the promise
of new sources of energy? How much can we rely on increased conservation and efficiency? These are the
sort of questions that “Energy and the Environment: Myths and Facts” seeks to answer. It is meant as a
dispassionate primer for those interested in sharpening their knowledge of issues whose importance will
only grow in the years to come.
Max Schulz
Senior Fellow
Center for Energy Policy and the Environment
Manhattan Institute for Policy Research
There have been some notable changes since our 2006 survey. Americans are more likely to believe that spent nuclear fuel can be stored safely and that offshore oil drilling can be conducted in an environmentally sensitive manner. Half of those surveyed feel spent nuclear fuel can be safely stored, while 64% of respon-dents favor expanded offshore drilling. As policymakers call for increased energy independence, it is note-worthy that a large portion of the public is favorable toward abundant domestic energy sources that could lessen our reliance on foreign oil.
Additionally, considering the momentum behind renewable energies and carbon-emission regulation, it is noteworthy that almost half of respondents believe renewable-energy sources will not replace fossil fuels and uranium any time soon—91% of our electricity is generated by fossil fuels and uranium and the EIA projects that 85% of our electricity in 2030 will be generated by such fuels—and that a plurality (49%) do not think reducing carbon emissions will be simple or inexpensive. Given the significant push for greater use of renewable energies and alternative fuels and repeated warnings about mankind’s impact on the global climate, policymakers must be guided by, and Americans deserve to know, the realities of meeting energy demand and the true costs of “going green.”
Energy & the Environment: Myths & Facts is intended as a primer for educators, journalists, and public of-ficials—for concerned citizens generally—as we seek twin goals: an energy supply sufficient to fuel continued economic growth and environmental policies that will protect public health and the quality of our lives.
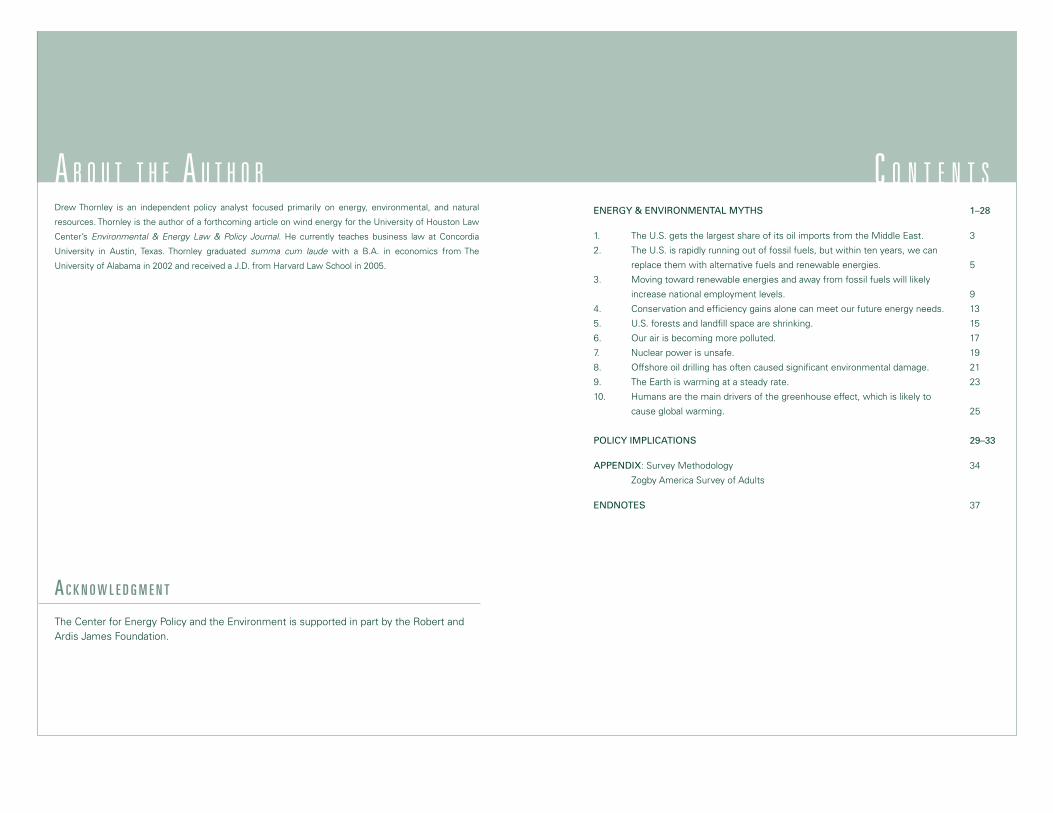
C O N T E N T SENERGY & ENVIRONMENTAL MYTHS 1–28
1. The U.S. gets the largest share of its oil imports from the Middle East. 3
2. The U.S. is rapidly running out of fossil fuels, but within ten years, we can
replace them with alternative fuels and renewable energies. 5
3. Moving toward renewable energies and away from fossil fuels will likely
increase national employment levels. 9
4. Conservation and efficiency gains alone can meet our future energy needs. 13
5. U.S. forests and landfill space are shrinking. 15
6. Our air is becoming more polluted. 17
7. Nuclear power is unsafe. 19
8. Offshore oil drilling has often caused significant environmental damage. 21
9. The Earth is warming at a steady rate. 23
10. Humans are the main drivers of the greenhouse effect, which is likely to
cause global warming. 25
POLICY IMPLICATIONS 29–33
APPENDIX: Survey Methodology 34
Zogby America Survey of Adults
ENDNOTES 37
A B O U T T H E A U T H O RDrew Thornley is an independent policy analyst focused primarily on energy, environmental, and natural
resources. Thornley is the author of a forthcoming article on wind energy for the University of Houston Law
Center’s Environmental & Energy Law & Policy Journal. He currently teaches business law at Concordia
University in Austin, Texas. Thornley graduated summa cum laude with a B.A. in economics from The
University of Alabama in 2002 and received a J.D. from Harvard Law School in 2005.
A C K N O W L E D G M E N T
The Center for Energy Policy and the Environment is supported in part by the Robert and Ardis James Foundation.

E N E R G Y &
E N V I R O N M E N T A L M Y T H S
Energy and the E
nvironment: M
yths and FactsA
pril 2009
CONCLUSION
Of course, many Americans understandably op-pose sending large sums of money to countries neither democratic nor allied with the U.S. Our withdrawal from these markets, however, while perhaps a worthy goal in itself, would not stop those nations from realizing revenues from the sale of oil to other buyers, particularly fast-grow-ing, petroleum-hungry India and China.
However, given our current level of oil consump-tion, the U.S. is not in a position to import oil solely from our friends and allies, particularly if we choose not to extract available domestic-oil resources. The size of our oil demand, the amount of domestic oil currently off-limits to extraction, and rising global demand combine to mean that the U.S. cannot limit imports to a select group of countries. Rather, we buy oil through a global marketplace. To reduce our reliance on imported oil from all sources, we will have to accelerate domestic-oil extraction, increase our use of elec-tric vehicles and vehicles powered by nonpetro-leum-based liquid fuels, and/or decrease our level of consumption.
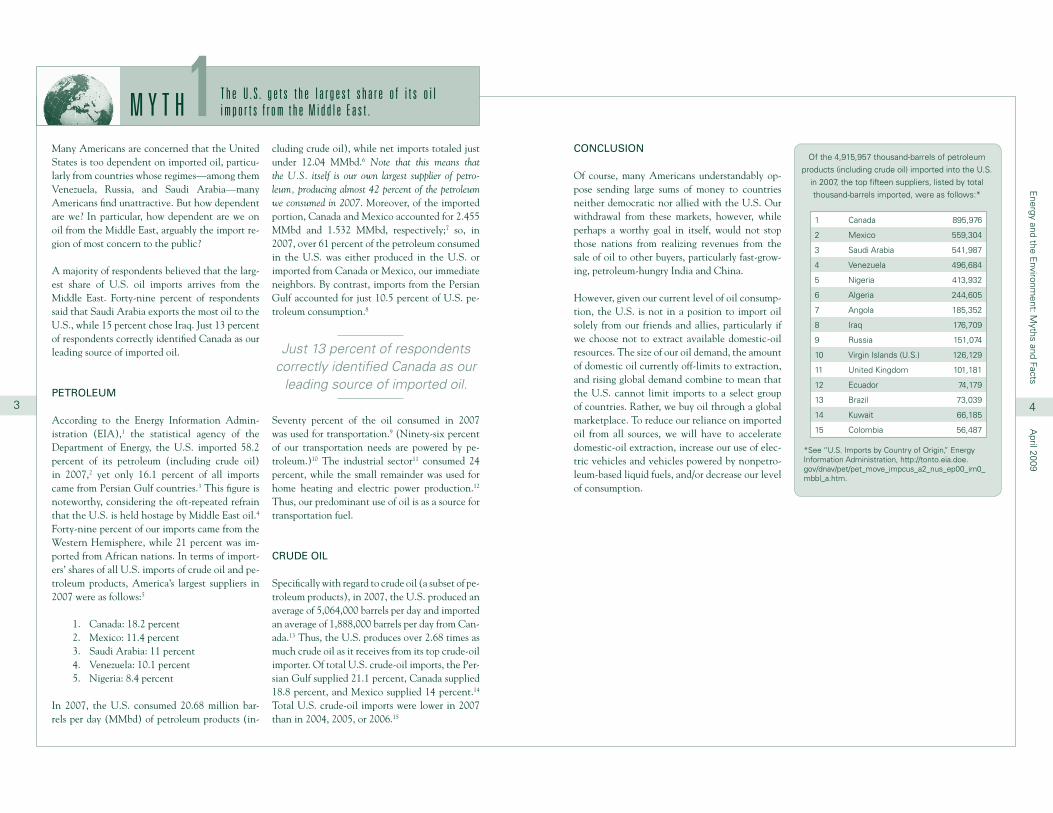
Of the 4,915,957 thousand-barrels of petroleum products (including crude oil) imported into the U.S.
in 2007, the top fifteen suppliers, listed by total thousand-barrels imported, were as follows:*
1 Canada 895,976
2 Mexico 559,304
3 Saudi Arabia 541,987
4 Venezuela 496,684
5 Nigeria 413,932
6 Algeria 244,605
7 Angola 185,352
8 Iraq 176,709
9 Russia 151,074
10 Virgin Islands (U.S.) 126,129
11 United Kingdom 101,181
12 Ecuador 74,179
13 Brazil 73,039
14 Kuwait 66,185
15 Colombia 56,487
*See “U.S. Imports by Country of Origin,” Energy Information Administration, http://tonto.eia.doe.gov/dnav/pet/pet_move_impcus_a2_nus_ep00_im0_mbbl_a.htm.
M Y T H T h e U . S . g e t s t h e l a r g e s t s h a r e o f i t s o i l i m p o r t s f r o m t h e M i d d l e E a s t .1
3
Many Americans are concerned that the United States is too dependent on imported oil, particu-larly from countries whose regimes—among them Venezuela, Russia, and Saudi Arabia—many Americans find unattractive. But how dependent are we? In particular, how dependent are we on oil from the Middle East, arguably the import re-gion of most concern to the public?
A majority of respondents believed that the larg-est share of U.S. oil imports arrives from the Middle East. Forty-nine percent of respondents said that Saudi Arabia exports the most oil to the U.S., while 15 percent chose Iraq. Just 13 percent of respondents correctly identified Canada as our leading source of imported oil.
PETROLEUM
According to the Energy Information Admin-istration (EIA),1 the statistical agency of the Department of Energy, the U.S. imported 58.2 percent of its petroleum (including crude oil) in 2007,2 yet only 16.1 percent of all imports came from Persian Gulf countries.3 This figure is noteworthy, considering the oft-repeated refrain that the U.S. is held hostage by Middle East oil.4 Forty-nine percent of our imports came from the Western Hemisphere, while 21 percent was im-ported from African nations. In terms of import-ers’ shares of all U.S. imports of crude oil and pe-troleum products, America’s largest suppliers in 2007 were as follows:5
1. Canada: 18.2 percent2. Mexico: 11.4 percent3. Saudi Arabia: 11 percent4. Venezuela: 10.1 percent5. Nigeria: 8.4 percent
In 2007, the U.S. consumed 20.68 million bar-rels per day (MMbd) of petroleum products (in-
cluding crude oil), while net imports totaled just under 12.04 MMbd.6 Note that this means that the U.S. itself is our own largest supplier of petro-leum, producing almost 42 percent of the petroleum we consumed in 2007. Moreover, of the imported portion, Canada and Mexico accounted for 2.455 MMbd and 1.532 MMbd, respectively;7 so, in 2007, over 61 percent of the petroleum consumed in the U.S. was either produced in the U.S. or imported from Canada or Mexico, our immediate neighbors. By contrast, imports from the Persian Gulf accounted for just 10.5 percent of U.S. pe-troleum consumption.8
Seventy percent of the oil consumed in 2007 was used for transportation.9 (Ninety-six percent of our transportation needs are powered by pe-troleum.)10 The industrial sector11 consumed 24 percent, while the small remainder was used for home heating and electric power production.12 Thus, our predominant use of oil is as a source for transportation fuel.
CRUDE OIL
Specifically with regard to crude oil (a subset of pe-troleum products), in 2007, the U.S. produced an average of 5,064,000 barrels per day and imported an average of 1,888,000 barrels per day from Can-ada.13 Thus, the U.S. produces over 2.68 times as much crude oil as it receives from its top crude-oil importer. Of total U.S. crude-oil imports, the Per-sian Gulf supplied 21.1 percent, Canada supplied 18.8 percent, and Mexico supplied 14 percent.14 Total U.S. crude-oil imports were lower in 2007 than in 2004, 2005, or 2006.15
4
Just 13 percent of respondents correctly identified Canada as our
leading source of imported oil.
Energy and the E
nvironment: M
yths and FactsA
pril 2009
dent? Ironically, because renewables are not com-mercially viable technologies, the goal of energy independence is at odds with reducing our use of conventional fuels. Unless we are willing to cut our energy use drastically, cutting back on import-ed fuel means that our consumption of domestic fossil fuels and uranium must increase. Moreover, even if everyone agreed that we should replace such fuels with renewables, significant economic and technological barriers stand in the way of a quick and easy transition.
Almost half (49.4 percent) of respondents be-lieved that renewable sources of energy—hydro-electric, geothermal, wind, solar, and biomass—are on track to replace fossil fuels in the near future. While the possibility of a rapid increase in the contribution of renewables cannot be ruled out entirely, current growth trends do not put us on a track to replace fossil fuels anytime soon.
Renewable energy sources met about 7 percent of our total energy needs in 2007. Of this 7 percent,
biomass energy contributed 53 percent, hydro-electric energy contributed 36 percent, wind en-ergy and geothermal energy contributed 5 percent each, and solar energy contributed 1 percent.26 Renewable energies accounted for 8.3 percent of the nation’s electricity generation in 2007,27 down from 9 percent in 200328—though the EIA proj-ects the share to increase in the years ahead. The largest share of renewable-generated electricity in 2007 came from hydroelectric energy (71 per-cent), followed by biomass (16 percent), wind (9 percent), geothermal (4 percent), and solar (0.2 percent).29
Given renewable energies’ current costs and tech-nological limitations, as well as the limitations of an electricity grid and fuel-pipeline system designed for traditional power sources and fuels, renewables are not expected to be major players in our fuel-supply mix in the near term. The EIA projects that renewables—including hydroelec-tric power—will account for 14 percent of total U.S. electricity generation in 2030.30 (Wind en-
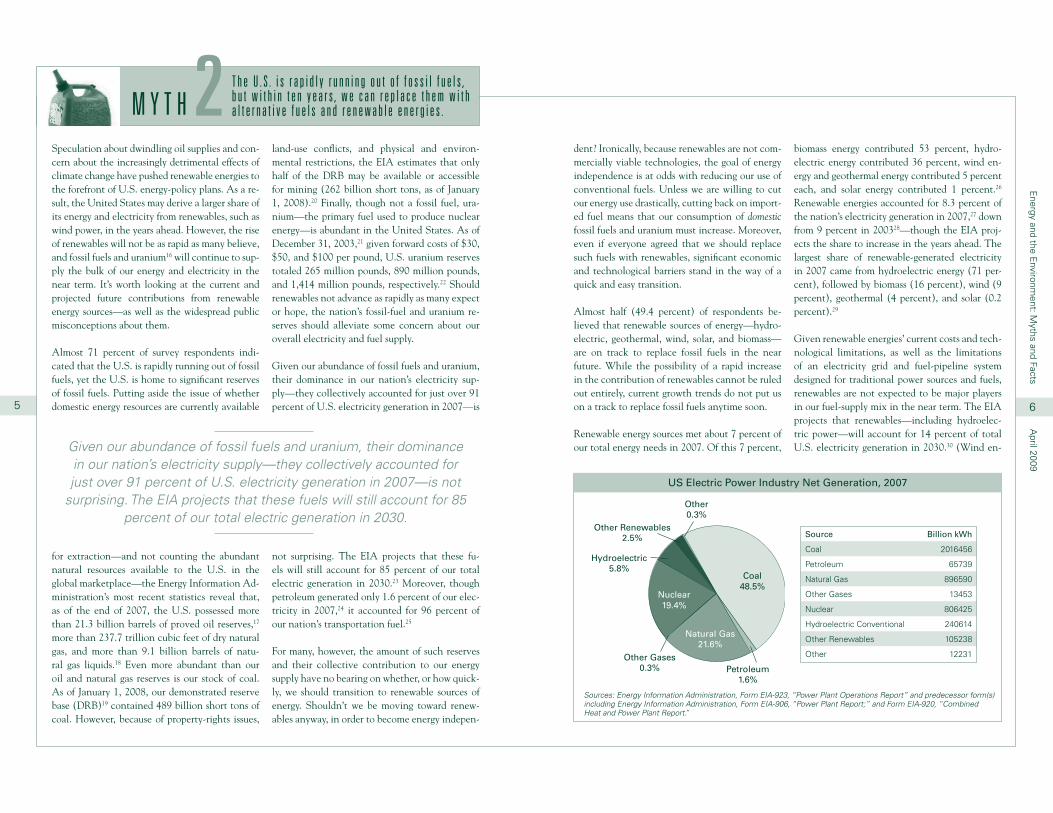
Source Billion kWh
Coal 2016456
Petroleum 65739
Natural Gas 896590
Other Gases 13453
Nuclear 806425
Hydroelectric Conventional 240614
Other Renewables 105238
Other 12231
Coal48.5%
Nuclear19.4%
Natural Gas21.6%
Other0.3%
Petroleum1.6%
Other Renewables2.5%
Hydroelectric5.8%
Other Gases0.3%
US Electric Power Industry Net Generation, 2007
Sources: Energy Information Administration, Form EIA-923, “Power Plant Operations Report” and predecessor form(s) including Energy Information Administration, Form EIA-906, “Power Plant Report;” and Form EIA-920, “Combined Heat and Power Plant Report.”
T h e U . S . i s r a p i d l y r u n n i n g o u t o f f o s s i l f u e l s , b u t w i t h i n t e n y e a r s , w e c a n r e p l a c e t h e m w i t h a l t e r n a t i v e f u e l s a n d r e n e w a b l e e n e r g i e s .M Y T H 2
5
Speculation about dwindling oil supplies and con-cern about the increasingly detrimental effects of climate change have pushed renewable energies to the forefront of U.S. energy-policy plans. As a re-sult, the United States may derive a larger share of its energy and electricity from renewables, such as wind power, in the years ahead. However, the rise of renewables will not be as rapid as many believe, and fossil fuels and uranium16 will continue to sup-ply the bulk of our energy and electricity in the near term. It’s worth looking at the current and projected future contributions from renewable energy sources—as well as the widespread public misconceptions about them.
Almost 71 percent of survey respondents indi-cated that the U.S. is rapidly running out of fossil fuels, yet the U.S. is home to significant reserves of fossil fuels. Putting aside the issue of whether domestic energy resources are currently available
for extraction—and not counting the abundant natural resources available to the U.S. in the global marketplace—the Energy Information Ad-ministration’s most recent statistics reveal that, as of the end of 2007, the U.S. possessed more than 21.3 billion barrels of proved oil reserves,17 more than 237.7 trillion cubic feet of dry natural gas, and more than 9.1 billion barrels of natu-ral gas liquids.18 Even more abundant than our oil and natural gas reserves is our stock of coal. As of January 1, 2008, our demonstrated reserve base (DRB)19 contained 489 billion short tons of coal. However, because of property-rights issues,
land-use conflicts, and physical and environ-mental restrictions, the EIA estimates that only half of the DRB may be available or accessible for mining (262 billion short tons, as of January 1, 2008).20 Finally, though not a fossil fuel, ura-nium—the primary fuel used to produce nuclear energy—is abundant in the United States. As of December 31, 2003,21 given forward costs of $30, $50, and $100 per pound, U.S. uranium reserves totaled 265 million pounds, 890 million pounds, and 1,414 million pounds, respectively.22 Should renewables not advance as rapidly as many expect or hope, the nation’s fossil-fuel and uranium re-serves should alleviate some concern about our overall electricity and fuel supply.
Given our abundance of fossil fuels and uranium, their dominance in our nation’s electricity sup-ply—they collectively accounted for just over 91 percent of U.S. electricity generation in 2007—is
not surprising. The EIA projects that these fu-els will still account for 85 percent of our total electric generation in 2030.23 Moreover, though petroleum generated only 1.6 percent of our elec-tricity in 2007,24 it accounted for 96 percent of our nation’s transportation fuel.25
For many, however, the amount of such reserves and their collective contribution to our energy supply have no bearing on whether, or how quick-ly, we should transition to renewable sources of energy. Shouldn’t we be moving toward renew-ables anyway, in order to become energy indepen-
6
Given our abundance of fossil fuels and uranium, their dominance in our nation’s electricity supply—they collectively accounted for just over 91 percent of U.S. electricity generation in 2007—is not
surprising. The EIA projects that these fuels will still account for 85 percent of our total electric generation in 2030.

Energy and the E
nvironment: M
yths and FactsA
pril 2009
cents per MWh, natural gas and petroleum liquids received 25 cents each, hydroelectric energy took in 67 cents, and nuclear power grabbed $1.59.36 Without these generous taxpayer-funded subsidies, renewable energies would not be competitive with conventional energy sources.
Like renewable energies, hybrid cars and alter-native-fuel vehicles (AFVs), including electric cars, have become more prominent in fuel-pol-icy discussions, and they are more prevalent on U.S. roads than ever.37 Almost two-thirds (62.7 percent) of respondents believed that such ve-hicles will constitute a large portion of all U.S. automobiles in ten years—but again, projections are less optimistic.
From 2003 to 2006, AFV use increased by an annual average of just over 6.27 percent38—but, with 250,851,833 registered vehicles in the U.S. in 2006,39 AFVs made up just one-quarter of 1 per-cent of all registered vehicles in 2006. And, ac-cording to J. D. Power & Associates, sales of hy-brid cars—which run on either gasoline or diesel and electricity generated onboard—will account for just 7 percent of the car market in 2015, up from 2.2 percent in 2007.40
As our energy economy increasingly relies on electricity, it is important to assess whether elec-tric cars and plug-in electric hybrids (PHEVs), which are powered completely and partially, re-spectively, by batteries charged by electric grids, are ultimately more environmentally friendly than hybrid cars or even vehicles that run on conventional fuels. Opinions vary. “Odds are those batteries won’t be recharged with solar or wind energy,” writes John Voelcker in Spectrum, the flagship publication of IEEE, formerly known as the Institute of Electrical and Electronics En-gineers, Inc.41 “In most places, grid power is for many decades going to come from the burning of fossil fuels, which generate their own emissions.”42 In other words, if coal plants supply the electric grid with the bulk of the power needed to charge electric cars, will overall greenhouse-gas (GHG)
emissions increase? Voelcker writes, “The moral of the story: If you’re concerned about the carbon footprint of your vehicle travel, definitely buy a plug-in—if you live in Norway, Brazil, France, or other areas with largely carbon-free electricity. Otherwise, have a look at your local grid—and think twice if you live in a place with lots of old coal-fired power plants. For you, a conventional hybrid may be kinder to the planet.”43
On the other hand, many studies reveal that re-placing conventional vehicles and hybrids with electric cars and PHEVs will lead to an overall reduction in GHG emissions. The American Council for an Energy-Efficient Economy writes that PHEVs “will reduce both their fuel consump-tion and their emissions of various pollutants rel-ative to current vehicles, including non-plug-in hybrid-electric vehicles” and that “the advantage of plug-ins over hybrids is large in areas where electricity is generated with low-carbon fuels, and much more modest elsewhere.”44 Using three sce-narios for the level of PHEV market penetration and three scenarios for electric-sector carbon-di-oxide intensity, the Electric Power Research In-stitute and the National Resource Defense Coun-cil produced nine possible outcomes for PHEVs’ effects on overall GHG emissions. Their study concluded that annual and cumulative GHG emissions would decline significantly under each outcome and that each region of the country would see reductions in GHG emissions.45
As politicians and policymakers continue to wor-ry about climate change, foreign oil dependence, and the availability of domestic energy resources, renewable energies and alternative fuels will po-tentially play larger roles in meeting our country’s energy needs. However, because of the high costs of renewable energies and alternative transpor-tation fuels relative to their conventional coun-terparts and because of technological limitations and transmission-infrastructure inadequacies, conventional power sources and transportation fuels will remain the dominant suppliers of our nation’s energy for years to come.
ergy generated 0.77 percent of U.S. electricity in 200731 and is projected to generate 2.5 percent of U.S. electricity in 2030.)32 This translates to an average annual growth rate of 3.2 percent, the largest increase of any fuel type.33 The EIA says that this growth will be “fueled by the rapid ex-pansion of non-hydro renewable generation tech-nologies that qualify to meet State mandates for renewable energy production.”34
An oft-repeated refrain is that renewable ener-gies, in addition to being cleaner, are cheaper than their conventional fuel counterparts. Thus, it is not surprising that a majority (53.7 percent) of respondents indicated that it is cheaper to gen-erate electricity from renewable fuels like wind or the sun than it is to produce electricity from fossil fuels, like coal or natural gas. However, there is a difference between the cost of renewable fuels and the cost of producing energy from such fuels.
Though wind and solar rays are indeed free, wind energy and solar energy are costly, compared with the costs of conventional power generation. Sev-
eral factors make renewables more expensive, in-cluding high costs of materials and skilled labor, added operations costs to electric grids that were not built for intermittent resources, and lack of adequate transmission lines to carry power from remote areas (where the wind and the sun are most plentiful) to densely populated demand centers. In addition, large federal subsidies and state renewable energy mandates shift many costs of renewable energy production from generators to electric ratepayers, disguising the true costs of these technologies.
In addition, subsidies for wind and solar energy—which together generated less than 1 percent of our nation’s electricity supply in 2007—are signifi-cantly more generous than subsidies for conven-tional power generation, considering the amount of electricity generated by each source.35 In 2007, wind energy received $724 million in federal subsi-dies, valued at $23.37 per megawatt hour (MWh) of wind-generated electricity, while solar energy took in $174 million, at a subsidy-per-MWh value of $24.34. By contrast, coal received a subsidy of 44
Primary Energy Source FY 2007 Net Generation
(billion kilowatthours)
Subsidies and Support Allocated to Electric
Generation (million FY 2007 dollars)
Subsidies and Support per Unit of Production (dollars/
megawatthour)
Natural Gas and Petroleum Liquids 919 227 0.25
Coal 1,946 854 0.44
Hydroelectric 258 174 0.67
Biomass 40 36 0.89
Geothermal 15 14 0.92
Nuclear 794 1,267 1.59
Wind 31 724 23.37
Solar 1 174 24.34
Refined Coal 72 2,156 29.81
Subsidies for various fuel sources differ widely, when compared with the amount of electricity generated by each source.
Source: Energy Information Administration, Federal Financial Interventions and Subsidies in Energy Markets 2007, SR/CNEAF/2008-1 (Washington, DC, 2008).
7 8
Subsidies and Support to Electric Production by Selected Primary Energy Sources
Energy and the E
nvironment: M
yths and FactsA
pril 2009
alternative energies, American taxpayers will con-tinue to subsidize such technologies, as the gov-ernment attempts to support alternative energies until they are economically viable on their own.
SUBSIDIES FOR GREEN INDUSTRIES
The problem is that many technologies that have been funded and subsidized for years are still merely small contributors to our overall en-ergy supply. Wind energy and solar energy take in billions in R&D dollars and subsidies, yet they collectively generated less than 1 percent of our nation’s electricity in 2007.52 Aided by bil-lions of dollars in subsidies and protected from overseas competition by steep tariffs on imports, corn ethanol—which has two-thirds the energy content of gasoline—is still only a minor player in our nation’s transportation-fuel mix, and mul-tiple ethanol refiners are ceasing operations.53 Even so, government mandates require blend-ing increased amounts of corn ethanol and other alternative fuels into our gasoline supply in the coming years.
The wind, solar, and ethanol experiments have, to date, been three unsuccessful efforts by gov-ernment to “pick winners” in the energy indus-try. Perhaps the federal tax subsidies for these industries will ultimately prove to have seeded important new energy sources. But thus far, they have diverted resources to less productive, less efficient uses and have likely increased overall energy costs.54
GREEN JOBS
As politicians and policymakers worry about mankind’s possible impact on climate, lower-carbon-emitting technologies like wind power and solar power look particularly appealing. In addition to federal R&D and subsidies, the government will attempt to make the transition away from fossil fuels and toward green jobs through regulation of carbon-dioxide emissions. Most likely, such regulation would occur via carbon taxes or cap-and-trade programs.
Carbon taxes are straightforward and transparent, imposing a government-set cost on each metric ton of carbon dioxide emitted. Cap-and-trade programs, on the other hand, are essentially hid-den taxes. First, the government sets an overall emissions cap—which would be lowered over time—that is apportioned among major emitters via emission credits, which entitle the credit hold-ers to emit a certain amount of carbon dioxide.55 (The credits could be handed out by the govern-ment, or they could be auctioned off, in which case the government would take in substantial revenues from the purchasers of the credits.) Then, emitters
may buy and sell credits, depending on whether they are over or under their number of credits. The Obama administration’s original fiscal year 2010 budget assumes the implementation of an econ-omy-wide cap-and-trade regime to reduce green-house-gas emissions approximately 14 percent below 2005 levels by 2020, and approximately 83 percent below 2005 levels by 205056 and assumes a starting price of $20 per ton of carbon emissions,
M o v i n g t o w a r d r e n e w a b l e e n e r g i e s a n d a w a y f r o m f o s s i l f u e l s w i l l l i k e l y i n c r e a s e n a t i o n a l e m p l o y m e n t l e v e l s .M Y T H
9
3President Obama plans to create 5 million new jobs “by strategically investing $150 billion over the next ten years to catalyze private efforts to build a clean energy future.”46 Many people, including 53 percent of respondents, believe that such a fu-ture—an economy anchored in renewable ener-gies and alternative transportation fuels—is the path to economic progress and prosperity.
Most likely, the government will attempt to make the transition to such an economy through three main avenues: increasing expenditures for alternative-energy research and development (R&D); supporting existing renewable energy and alternative-fuel industries through mandates and subsidies; and imposing a regulatory regime, particularly on carbon emissions, that discourages traditional energy jobs in favor of so-called green jobs, which are jobs in the renewable energy and alternative-fuel sectors.
One cannot rule out the possibility that federally subsidized R&D will hasten technological break-throughs that lead to large numbers of high-pay-ing jobs in environmentally friendly industries. Moreover, since private financing is scant for some nascent technologies, public funding might be the only way for them to become commercially viable. Finally, though regulations that discour-age carbon-intensive energy sources will likely be very costly, one rationale for such regulations is that the economy currently does not recognize the possible negative effects of carbon; thus, industries have little incentive to change on their own.
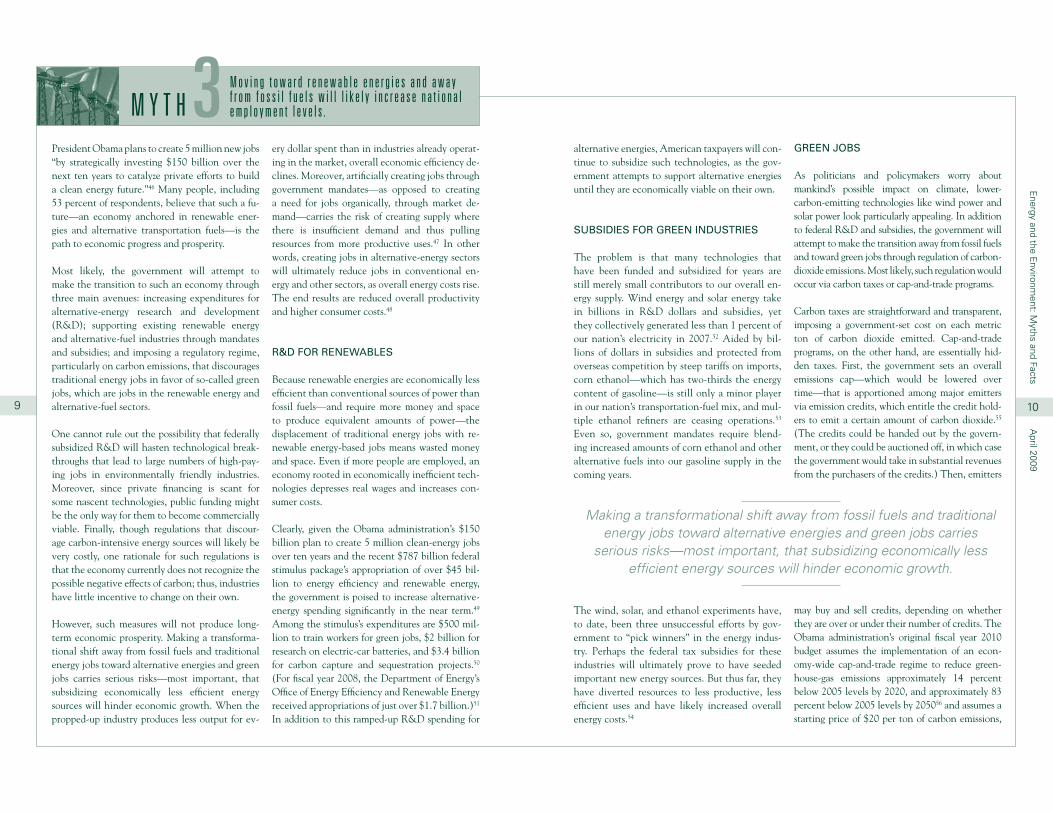
However, such measures will not produce long-term economic prosperity. Making a transforma-tional shift away from fossil fuels and traditional energy jobs toward alternative energies and green jobs carries serious risks—most important, that subsidizing economically less efficient energy sources will hinder economic growth. When the propped-up industry produces less output for ev-
ery dollar spent than in industries already operat-ing in the market, overall economic efficiency de-clines. Moreover, artificially creating jobs through government mandates—as opposed to creating a need for jobs organically, through market de-mand—carries the risk of creating supply where there is insufficient demand and thus pulling resources from more productive uses.47 In other words, creating jobs in alternative-energy sectors will ultimately reduce jobs in conventional en-ergy and other sectors, as overall energy costs rise. The end results are reduced overall productivity and higher consumer costs.48
R&D FOR RENEWABLES
Because renewable energies are economically less efficient than conventional sources of power than fossil fuels—and require more money and space to produce equivalent amounts of power—the displacement of traditional energy jobs with re-newable energy-based jobs means wasted money and space. Even if more people are employed, an economy rooted in economically inefficient tech-nologies depresses real wages and increases con-sumer costs.
Clearly, given the Obama administration’s $150 billion plan to create 5 million clean-energy jobs over ten years and the recent $787 billion federal stimulus package’s appropriation of over $45 bil-lion to energy efficiency and renewable energy, the government is poised to increase alternative-energy spending significantly in the near term.49 Among the stimulus’s expenditures are $500 mil-lion to train workers for green jobs, $2 billion for research on electric-car batteries, and $3.4 billion for carbon capture and sequestration projects.50 (For fiscal year 2008, the Department of Energy’s Office of Energy Efficiency and Renewable Energy received appropriations of just over $1.7 billion.)51 In addition to this ramped-up R&D spending for
10
Making a transformational shift away from fossil fuels and traditional energy jobs toward alternative energies and green jobs carries
serious risks—most important, that subsidizing economically less efficient energy sources will hinder economic growth.
Energy and the E
nvironment: M
yths and FactsA
pril 2009
i Cost projections included estimates of GDP loss, job loss, and increases in the cost of energy and electricity.
ii For more on the estimated costs of the Lieberman-Warner bill, see “The Cost of Warner-Lieberman,” Institute for Energy Research, http://www.instituteforenergyresearch.org/cost-of-climate-change-policies/. For more on a number of different carbon-reduction analyses, see “The Cost of Climate Regulation for American Households,” Bryan Buckley and Sergey Mityakov, George C. Marshall Institute, March 2, 2009,
http://www.marshall.org/pdf/materials/636.pdf.
iii Testimony of Anne E. Smith, Ph.D., November 8, 2007, http://epw.senate.gov/public/index.cfm?FuseAction=Files.View&FileStore_id=80bc79be-c338-4a76-b438-205eb79da3d5.
iv “Analysis of The Lieberman-Warner Climate Security Act (S. 2191) Using The National Energy Modeling System (NEMS/ACCF/NAM),” American Council for Capital Formation and the National Association of Manufacturers, http://www.accf.org/pdf/NAM/fullstudy031208.pdf. For an interesting exchange concerning The Washington Post’s citing of the ACCF/NAM study, see “Eric Pooley discussion paper,” Joan Shorenstein Center on the Press, Politics and Public Policy, Harvard Kennedy School,
http://www.hks.harvard.edu/presspol/publications/papers/discussion_papers/d49_pooley_full.html.
v “Some 5,000 steel workers from across the continent protested outside European Union headquarters Tuesday to demand their industry be exempt from planned pollution caps, which they fear will lead to job losses. Unions from across the 27-nation bloc are backing steel companies to pressure EU governments and lawmakers to water down rules to cut pollution and carbon dioxide emissions. They say such regulation would lead to higher production costs and job losses.” See “European Steel Workers Protest EU Pollution Cap,” Constant Brand, Associated Press, December 2, 2008,
http://www.manufacturing.net/News-European-Steel-Workers-Protest-EU-Pollution-Cap.aspx?menuid=.
vi “Cap and trade plan would send prices soaring and put a staggering burden on U.S. consumers,” Mark J. Perry, Canada Free Press, February 4, 2009, http://www.canadafreepress.com/index.php/article/8205. “Cap-and-trade regimes have advantages, notably the ability to set a limit on emissions and to integrate with other countries. But they are complex and vulnerable to lobbying and special pleading, and they do not guarantee success. The experience of the European Union is Exhibit A…the Europeans have not had much success reducing greenhouse gas emissions.” See “Climate Change Solutions,” The Washington Post, February 16, 2009,
http://www.washingtonpost.com/wp-dyn/content/article/2009/02/15/AR2009021501425.html.
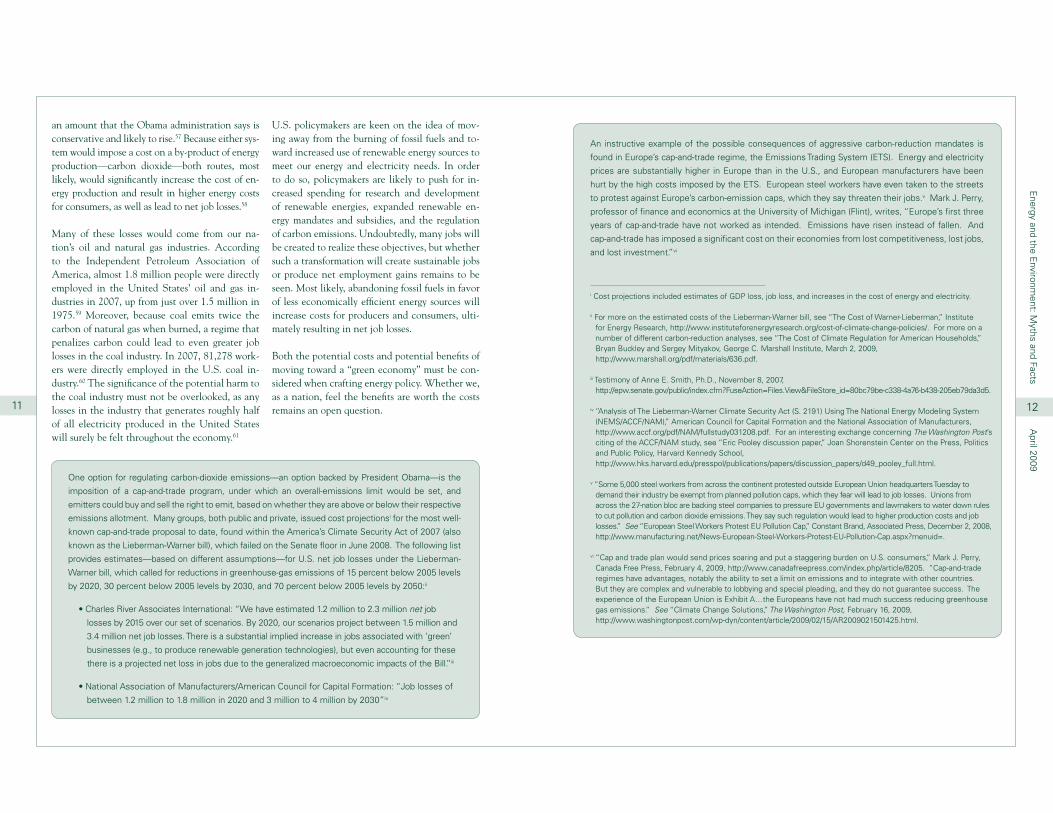
An instructive example of the possible consequences of aggressive carbon-reduction mandates is
found in Europe’s cap-and-trade regime, the Emissions Trading System (ETS). Energy and electricity
prices are substantially higher in Europe than in the U.S., and European manufacturers have been
hurt by the high costs imposed by the ETS. European steel workers have even taken to the streets
to protest against Europe’s carbon-emission caps, which they say threaten their jobs.v Mark J. Perry,
professor of finance and economics at the University of Michigan (Flint), writes, “Europe’s first three
years of cap-and-trade have not worked as intended. Emissions have risen instead of fallen. And
cap-and-trade has imposed a significant cost on their economies from lost competitiveness, lost jobs,
and lost investment.”vi
an amount that the Obama administration says is conservative and likely to rise.57 Because either sys-tem would impose a cost on a by-product of energy production—carbon dioxide—both routes, most likely, would significantly increase the cost of en-ergy production and result in higher energy costs for consumers, as well as lead to net job losses.58
Many of these losses would come from our na-tion’s oil and natural gas industries. According to the Independent Petroleum Association of America, almost 1.8 million people were directly employed in the United States’ oil and gas in-dustries in 2007, up from just over 1.5 million in 1975.59 Moreover, because coal emits twice the carbon of natural gas when burned, a regime that penalizes carbon could lead to even greater job losses in the coal industry. In 2007, 81,278 work-ers were directly employed in the U.S. coal in-dustry.60 The significance of the potential harm to the coal industry must not be overlooked, as any losses in the industry that generates roughly half of all electricity produced in the United States will surely be felt throughout the economy.61
One option for regulating carbon-dioxide emissions—an option backed by President Obama—is the
imposition of a cap-and-trade program, under which an overall-emissions limit would be set, and
emitters could buy and sell the right to emit, based on whether they are above or below their respective
emissions allotment. Many groups, both public and private, issued cost projectionsi for the most well-
known cap-and-trade proposal to date, found within the America’s Climate Security Act of 2007 (also
known as the Lieberman-Warner bill), which failed on the Senate floor in June 2008. The following list
provides estimates—based on different assumptions—for U.S. net job losses under the Lieberman-
Warner bill, which called for reductions in greenhouse-gas emissions of 15 percent below 2005 levels
by 2020, 30 percent below 2005 levels by 2030, and 70 percent below 2005 levels by 2050:ii
• Charles River Associates International: “We have estimated 1.2 million to 2.3 million net job
losses by 2015 over our set of scenarios. By 2020, our scenarios project between 1.5 million and
3.4 million net job losses. There is a substantial implied increase in jobs associated with ‘green’
businesses (e.g., to produce renewable generation technologies), but even accounting for these
there is a projected net loss in jobs due to the generalized macroeconomic impacts of the Bill.”iii
• National Association of Manufacturers/American Council for Capital Formation: “Job losses of
between 1.2 million to 1.8 million in 2020 and 3 million to 4 million by 2030”iv
U.S. policymakers are keen on the idea of mov-ing away from the burning of fossil fuels and to-ward increased use of renewable energy sources to meet our energy and electricity needs. In order to do so, policymakers are likely to push for in-creased spending for research and development of renewable energies, expanded renewable en-ergy mandates and subsidies, and the regulation of carbon emissions. Undoubtedly, many jobs will be created to realize these objectives, but whether such a transformation will create sustainable jobs or produce net employment gains remains to be seen. Most likely, abandoning fossil fuels in favor of less economically efficient energy sources will increase costs for producers and consumers, ulti-mately resulting in net job losses.
Both the potential costs and potential benefits of moving toward a “green economy” must be con-sidered when crafting energy policy. Whether we, as a nation, feel the benefits are worth the costs remains an open question.11 12

Energy and the E
nvironment: M
yths and FactsA
pril 2009
ed States. They’re wrong: the industrial sector68 is the largest end user of energy. Of the 101.6 quadrillion British thermal units (quads) of en-ergy consumed in the U.S. in 2007, the industri-al sector consumed 32.32 quads (31.81 percent), while the commercial,69 residential,70 and trans-portation71 sectors consumed 18.43 quads (18.14 percent), 21.75 quads (21.41 percent), and 29.1 quads (28.64 percent), respectively.72
However, these figures give a misleading impres-sion of how and why we use energy. Moreover, the sector breakdowns do not compare apples with apples, so they are not particularly instruc-tive. For example, industrial activities could in-clude transportation in and around factories, so the lines separating the sectors are not clear-cut.
Efficiency gains this large ought to have had a dramatic impact on supply and demand—and they
did. The price of transportation and electricity fell steadily. And the total amount of fuel consumed in
those sectors rose apace. Efficiency may curtail demand in the short term, for the specific task at
hands. But its long-tern impact is just the opposite. When steam-powered plants, jet turbines, and car
engines, light bulbs, electric motors, air conditioners, and computers were much less efficient than
today, they also consumed much less energy. The more efficient they grew, the more of them we
built, and the more we used them—and the more energy they consumed overall. Per unit of energy
used, the United States produces more than twice as much GDP today as it did in 1950—and total
energy consumption in the United States has also risen three-fold.
—From The Bottomless Well (p.111)
A much simpler way to express and understand the breakdown in our nation’s energy usage is to break down energy usage into three categories: electricity, raw heat, and transportation. Of the 100 or so quads of fuel we use annually, roughly 40 quads generate electricity, 30 quads generate raw heat, and 30 quads move vehicles. Energy con-sumption is, therefore, not dominated by driving or any other single activity or sector but rather is spread fairly evenly across the whole range of economic activity, none of which is immune to the efficiency paradox.
As our population grows (and with it, our energy needs), as emerging economies like China and India feverishly build infrastructure for the future, and as the global economy attempts to rebound, the need for energy sources that can meet bulk energy demands will be more vital than ever. Increases in energy efficiency and personal conservation are welcome, but we should not expect them to deliver more than marginal benefits. Because energy consumption is not flat, putting all our eggs in the efficiency and conservation baskets will not adequately move us forward.
C o n s e r v a t i o n a n d e f f i c i e n c y g a i n s a l o n e c a n m e e t o u r f u t u r e e n e r g y n e e d s .M Y T H 4
13
Many believe that one way to lower our nation’s energy demand is to increase energy efficiency. However, history reveals a paradox: the more ef-ficiently we use energy, the more energy we end up using.
In The Bottomless Well, Peter Huber and Mark Mills explain this efficiency conundrum: “Effi-ciency fails to curb demand because it lets more people do more, and do it faster—and more/more/faster invariably swamps all the efficiency gains.”62 Ironically, they write, “efficiency in-creases consumption. It makes what we ultimately consume cheaper, and lower price almost always increases consumption. To curb energy consump-tion, you have to lower efficiency, not raise it.”63 In terms of the amount of energy consumed to produce a (constant) dollar’s worth of gross do-mestic product, the United States’ energy effi-ciency improved 49 percent between 1949 and 2000, according to the EIA. However, during the same period, U.S. energy consumption increased a whopping 208 percent.64
That over two-thirds (67.6 percent) of respon-dents believe that the U.S. can meet future en-ergy needs via conservation and efficiency gains is understandable, considering the massive amount of U.S. energy consumption, both cumulative and per capita. It’s reasonable to assume that, if we can just find more efficient ways to produce and use energy, we can lower our overall con-sumption; yet for this to be true—for efficiency gains to produce a decrease in overall consump-tion—energy demand must be flat.
However, energy use is not static. In fact, it grows every year and is projected to continue growing. Efficiency gains may result in slight energy-use re-ductions at the margins, but they cannot control or curtail bulk energy demands. Like efficiency gains, personal conservation—such as turning off the light when you leave a room or not running your air conditioner twenty-four hours a day—may result in slight energy-use reductions but will not make a huge dent in overall energy consump-tion. As our population continues to grow, this will only become more true.
The EIA projects global energy consumption to increase 50 percent from 2005 to 203065 and U.S. energy use to increase 11.2 percent from 2007 to 2030.66 Pennsylvania State University professor Frank Clemente says that, in order to meet en-ergy demand in 2030, the U.S. will need all of the following power increases:67
• Nuclear power production: 38 percent• Oil production: 43 percent• Renewable energy production: 61 percent• Natural gas production: 64 percent• Coal production: 74 percent
The main sources of our total energy consump-tion are not well understood. Over half (52.6 percent) of respondents chose driving and trans-portation as the main uses of energy in the Unit-
Transportation
ElectricityHeat
Of the 100 or so quadrillion BTUs of fuel we use annually, roughly 40 quads generate
electricity, 30 quads generate raw heat, and 30 quads move vehicles.
Source: The Bottomless Well (Figure 1.6 on p. 11) by Peter W. Huber & Mark P. Mills.
14
Like efficiency gains, personal conservation…may result in slight
energy-use reductions but will not make a huge dent in overall
energy consumption.
Primary Fuel Uses

Energy and the E
nvironment: M
yths and FactsA
pril 2009
one-third of the nation’s land area—and are sta-ble or even growing.78 Thus, the growth of U.S. forests lessens the impact of clearing forests for landfill space.
According to the United States Forest Service (USFS), forest area has been “relatively stable” for the past hundred years, even while the U.S. population has nearly tripled.79 A United Na-tions report reveals that, as of 2005, the U.S. had the fourth-largest forest area (303 million hect-ares) of any country, while the U.S.’s annual net gain in forest area (159,000 hectares per year) from 2000 to 2005 was also the fourth-largest of any country.80 USFS data reveal the stability of overall forest area in the U.S. since the early twentieth century:81
Year Forest area (thousands of acres)
1907 753,823
1920 729,755
1938 746,171
1953 747,434
1963 755,916
1977 735,785
1987 730,263
1997 742,854
2007 751,228
5M Y T H U . S . f o r e s t s a n d l a n d f i l l s p a c e a r e s h r i n k i n g .
15
Bleak reports and doomsday-scenario projections are commonplace when it comes to energy and the environment: The air is getting dirtier. Our rivers are more contaminated. We’re running out of fossil fuels. Unless we cut back on energy use, we’ll run out of energy. The same holds true for solid waste disposal, which, like other forms of waste, increases with increased energy consumption. So do we have sufficient space to dispose of our solid waste? More than three-quarters (76.7 percent) of survey respondents believe that the United States is running out of space for its garbage and that, unless more people start recycling, we will no lon-ger have sufficient space for waste disposal. The reality is quite different.
The number of operating landfills in the U.S. has declined precipitously over the last two decades, falling from 7,924 in 1988 to 1,754 in 2007—though barely at all since 2002, when there were 1,767 landfills. However, average landfill size has increased, and, according to the U.S. Envi-ronmental Protection Agency’s Office of Solid Waste, nationwide landfill capacity “does not ap-pear to be a problem.”73
If there is any threat that might exist to U.S. landfill capacity, it doesn’t stem from a lack of ad-equate landfill space or because we don’t recycle enough—Americans recycled one-third of the trash generated in the U.S. in 200774—but rather from regulations that close off suitable areas for solid waste disposal.75 The Environmental Lit-
eracy Council points out that building landfills is “an expensive and time-consuming process, pri-marily due to community opposition (the NIMBY syndrome: Not In My Backyard) and regulations requiring increasingly sophisticated engineering measures to ensure safety.”76 However, while some localities oppose landfills, many—particularly ru-ral areas—welcome landfills because of the rev-enues that they generate for their communities.
Though the U.S. currently has ample landfill ca-pacity, perhaps there are legitimate reasons to op-pose landfills themselves. Some argue that they pose environmental risks to surrounding areas and leak dangerous toxins. Others, understand-
ably, oppose turning open spaces into waste-dis-posal sites, disrupting natural habitats. However, with regard to environmental risk, landfills do not pose a significant threat.
Modern landfills are designed to keep air, light, and moisture away from the waste, in essence mummifying the waste to prevent decay and min-imize the release of liquids and gases. Small re-leases (if any) are vented and drained to prevent environmental harm.
In addition to concern about the possible en-vironmental impact, many environmentalists worry that clearing space for additional landfills will pose a significant risk to our nation’s forests. However, U.S. forests are abundant77—covering
16
According to the U.S. Environmental Protection Agency’s Office of Solid Waste, nationwide landfill capacity “does not appear to be a problem.” According to the United States Forest Service (USFS),
forest area has been “relatively stable” for the past hundred years, even while the U.S. population has nearly tripled.
Even after the industrialization of American farmland and the rapid population growth in the United States during the twentieth century—along with the attendant rises in consumption and waste—U.S. landfill space and forests are not in short supply.
Energy and the E
nvironment: M
yths and FactsA
pril 2009
1980 vs 2007 1990 vs 2007
CO -55 -44
Pb -97 -72
NOX -39 -33
VOC -50 -35
Direct PM10 -65 -33
Direct PM2.5— -51
SO2 -49 -45
1980 vs 2007 1990 vs 2007
CO -76 -67
O3 (8-hr) -21 -9
Pb -94 -80
NO2 -43 -35
PM10 (24-hr) — -28
PM2.5 (annual) — -11
PM2.5 (24-hr) — -9
SO2 -68 -54Notes:
1. — Trend data not available2. PM2.5 air quality based on data since 2000.3. Direct PM10 emissions for 1980 are based on data since 1985.4. Negative numbers indicate improvements in air quality or reductions in emissions.
Source: U.S. Environmental Protection Agency
M Y T H O u r a i r i s b e c o m i n g m o r e p o l l u t e d .6
17
Given our country’s reliance on fossil fuels for power production and the increase in vehicle use, it is perhaps not surprising that many people believe that air quality in the United States has declined in recent years. Of those surveyed, al-most half (47.6 percent) indicated that U.S. air quality has gotten worse since 1970. Only 27.5 percent responded that air quality in the U.S. has improved significantly since then.
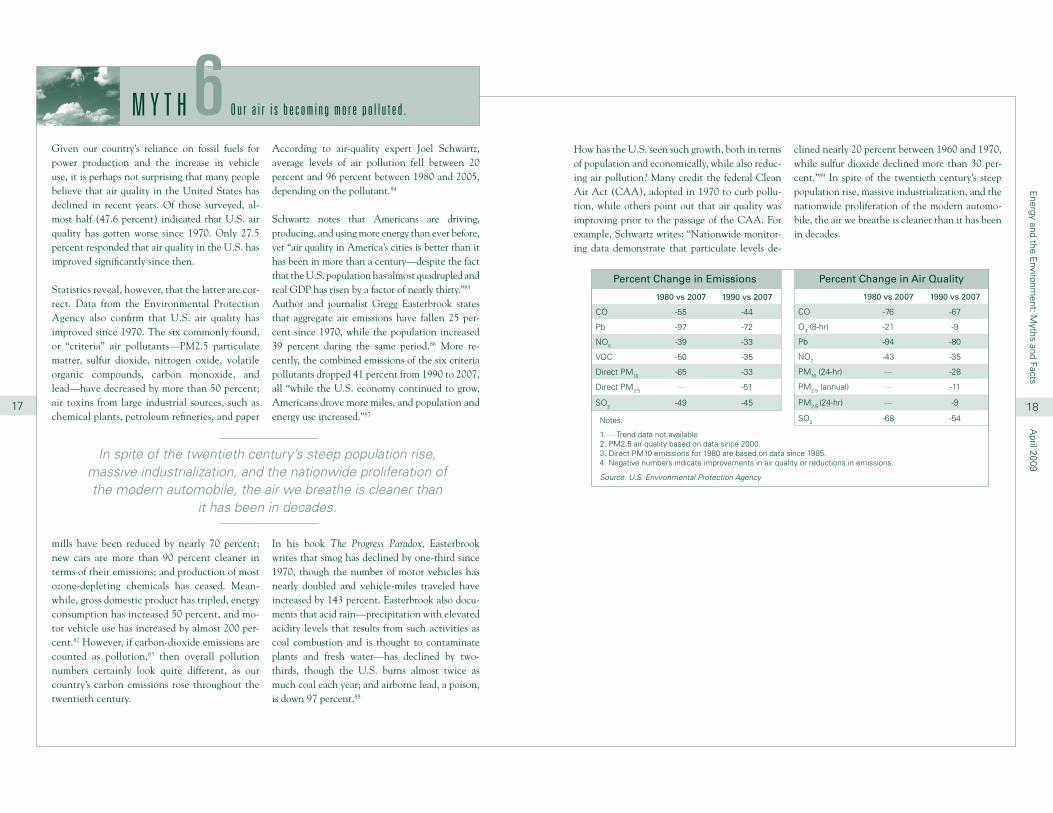
Statistics reveal, however, that the latter are cor-rect. Data from the Environmental Protection Agency also confirm that U.S. air quality has improved since 1970. The six commonly found, or “criteria” air pollutants—PM2.5 particulate matter, sulfur dioxide, nitrogen oxide, volatile organic compounds, carbon monoxide, and lead—have decreased by more than 50 percent; air toxins from large industrial sources, such as chemical plants, petroleum refineries, and paper
mills have been reduced by nearly 70 percent; new cars are more than 90 percent cleaner in terms of their emissions; and production of most ozone-depleting chemicals has ceased. Mean-while, gross domestic product has tripled, energy consumption has increased 50 percent, and mo-tor vehicle use has increased by almost 200 per-cent.82 However, if carbon-dioxide emissions are counted as pollution,83 then overall pollution numbers certainly look quite different, as our country’s carbon emissions rose throughout the twentieth century.
According to air-quality expert Joel Schwartz, average levels of air pollution fell between 20 percent and 96 percent between 1980 and 2005, depending on the pollutant.84
Schwartz notes that Americans are driving, producing, and using more energy than ever before, yet “air quality in America’s cities is better than it has been in more than a century—despite the fact that the U.S. population has almost quadrupled and real GDP has risen by a factor of nearly thirty.”85 Author and journalist Gregg Easterbrook states that aggregate air emissions have fallen 25 per-cent since 1970, while the population increased 39 percent during the same period.86 More re-cently, the combined emissions of the six criteria pollutants dropped 41 percent from 1990 to 2007, all “while the U.S. economy continued to grow, Americans drove more miles, and population and energy use increased.”87
In his book The Progress Paradox, Easterbrook writes that smog has declined by one-third since 1970, though the number of motor vehicles has nearly doubled and vehicle-miles traveled have increased by 143 percent. Easterbrook also docu-ments that acid rain—precipitation with elevated acidity levels that results from such activities as coal combustion and is thought to contaminate plants and fresh water—has declined by two-thirds, though the U.S. burns almost twice as much coal each year; and airborne lead, a poison, is down 97 percent.88
18
In spite of the twentieth century’s steep population rise, massive industrialization, and the nationwide proliferation of the modern automobile, the air we breathe is cleaner than
it has been in decades.
How has the U.S. seen such growth, both in terms of population and economically, while also reduc-ing air pollution? Many credit the federal Clean Air Act (CAA), adopted in 1970 to curb pollu-tion, while others point out that air quality was improving prior to the passage of the CAA. For example, Schwartz writes: “Nationwide monitor-ing data demonstrate that particulate levels de-
clined nearly 20 percent between 1960 and 1970, while sulfur dioxide declined more than 30 per-cent.”89 In spite of the twentieth century’s steep population rise, massive industrialization, and the nationwide proliferation of the modern automo-bile, the air we breathe is cleaner than it has been in decades.
Percent Change in Emissions Percent Change in Air Quality

Energy and the E
nvironment: M
yths and FactsA
pril 2009
able location at Yucca Mountain, Nevada, were stalled for years by regulatory hurdles. President Obama recently backed away from the proposal, announcing in his fiscal year 2010 federal budget request that funding for the project will be cut, while his administration devises an alternate plan for permanent nuclear-waste storage.98
Tucker and others challenge the very notion of nuclear “waste” and are critical of the U.S. for not reusing nuclear fuel after its first use by a nuclear reactor for power production. In 1976, President Ford issued a presidential directive suspending reprocessing of spent nuclear fuel, and, in 1977, President Carter outlawed nuclear fuel reprocess-ing.99 Though President Reagan lifted President Carter’s ban in 1981, the necessary private capital to support nuclear fuel reprocessing had already fled the U.S. We do not reprocess spent nuclear
fuel, in spite of the value and safety of doing so. (France safely reprocesses spent nuclear fuel.) Tucker writes, “Nearly all the material in a spent fuel rod is recyclable or easily handled.”100 Moore agrees, asserting that “95 percent of the potential energy is still contained in the used fuel after the first cycle.”101
Nuclear power is ramping up throughout the world. France will continue to meet the majority of its electricity needs via nuclear energy, and China and India have plans for rapid expansion of nuclear facilities. For decades, the United States has pro-duced nuclear power and stored used nuclear fuel safely. All indications are that modern nuclear power technology and extensive procedural safe-guards will continue to provide Americans with safe, reliable nuclear power production and spent-fuel storage.
Activity Millirems
Typical yearly dose, all sources 360.00
Full set of dental X-rays 40.00
Chest X-ray 8.00
Flying round-trip from D.C. To Los Angeles 5.00
Living outside nuclear power plant for a year 0.10
Health Risk Expected Life Lost
Smoking a pack of cigarettes a day 6 years
Being 15 percent overweight 2 years
Working in construction 227 days
Working in cuclear plant (1,000 mrem/yr) 51 days
Typicla annual background radiation dose (360 mrem/yr) 18 days
Measuring Radiation’s Effects
The exact effect depends on the specific type and intensity of the radiation exposure. In general, however, a 3-millirem exposure imposes the same chance of death — 1 in a million — as each of the following common life experiences:
• Spending 2 days in New York City (because of the air quality) • Riding 1 mile on a motorcycle or 300 miles in a car (because of the risk of collision) • Eating 40 tablespoons of peanut butter (because of aflotoxin) or 10 charbroiled steaks • Smoking 1 cigarette Source: U.S. Nuclear Regulatory Commission
M Y T H N u c l e a r p o w e r i s u n s a f e .7
19
On March 28, 1979, just days after the release of the movie The China Syndrome raised fears about the dangers of nuclear power production, a partial meltdown of a nuclear reactor occurred at Pennsyl-vania’s Three Mile Island (TMI) nuclear power fa-cility. The meltdown, the only major nuclear acci-dent in the history of the United States, confirmed for many that nuclear power is dangerous. Thirty years later, no new nuclear power reactor has been built in the U.S.
A plurality (38.3 percent) of respondents believe that U.S. nuclear power generation—meaning the actual generation of power from nuclear reactors—has led to at least one death, while almost an equal percentage of respondents (36.8 percent) correctly answered that no one has ever died from U.S. nu-clear power production.90 Almost one-quarter (24.9 percent) were unsure. Thus, the belief that deaths have resulted from U.S. nuclear power generation does not appear to be as widely held as some other energy myths. Still, the percentages indicate that public understanding of nuclear power’s risks re-mains significantly at odds with the facts.
According to the Nuclear Regulatory Commission, “Since commercial nuclear power plants began op-erating in the United States, there have been no physical injuries or fatalities from exposure to radi-ation from the plants among members of the U.S. public. Even the country’s worst nuclear power plant accident at Three Mile Island resulted in no identifiable health impacts.”91 Patrick Moore, co-founder of Greenpeace and now an ardent support-er of nuclear power, contends that TMI is actually a success story. “The concrete containment struc-ture did just what it was designed to do—prevent radiation from escaping into the environment.”92
In addition to concerns about possible dangers of nuclear power production, a common fear about nuclear energy (shared by 42 percent of respon-dents) is that nuclear waste cannot be stored safely. Interestingly, almost half (49.8 percent) of respon-
dents believed that nuclear waste can be stored safely. Additional nuclear energy production in the U.S. is likely, particularly if we expand our use of low- or non-carbon-emitting technologies. The issue of nuclear-waste storage will then become increasingly important. What will we do with the spent fuel? Is spent fuel safe in the first place?
Like the safety fears, concerns about storing used, or spent, nuclear fuel are unfounded. According to the U.S. Environmental Protection Agency, “Most nuclear waste is low-level radioactive waste.”93 Currently, the U.S. has 104 active nuclear reactors, which generate roughly 19 percent of our nation’s electricity.94 For decades, the U.S has safely stored used nuclear fuel at its nuclear facilities, as have other countries.95 Most notably, France, which gen-erates about 80 percent of its electricity from nu-clear power, has no trouble safely storing the spent nuclear fuel. Author and journalist William Tucker notes: “All of France’s nuclear waste from 25 years of producing 75 percent of its electricity is stored beneath the floor of one room at Le Hague. The lifetime output for each French citizen would fit in a soda can.”96
However, the issue of nuclear-waste storage is a long-term issue, and, in the U.S., nuclear facilities were not built to store spent fuel permanently.97 Available storage space is declining, and long-term storage solutions are needed. Plans for building a permanent repository for used nuclear fuel at a suit-
20
According to the Nuclear Regulatory Commission, “Since commercial nuclear power plants
began operating in the United States, there have been no physical injuries or fatalities from exposure to radiation from the plants among
members of the U.S. public.”

Energy and the E
nvironment: M
yths and FactsA
pril 2009
waters and over 45 percent of the petroleum that enters ocean waters worldwide.108 Thus, in per-centage terms, North America’s oil-drilling ac-tivities spill less oil into the ocean than the global average, suggesting that our drilling is compara-tively safe for the environment.
Ironically, research shows that drilling can ac-tually reduce natural seepage, as it relieves the pressure that drives oil and gas up from ocean floors and into ocean waters. In 1999, two peer-reviewed studies found that natural seepage in the northern Santa Barbara Channel was sig-nificantly reduced by oil production. The re-searchers documented that natural seepage de-clined 50 percent around Platform Holly over a twenty-two-year period, concluding that, as oil was pumped from the reservoir, the pressure that drives natural seepage dropped.109
Offshore oil drilling is carefully monitored for en-vironmental safety. Using state-of-the-art tech-nology and employing a range of procedural safe-guards, U.S. offshore drilling has a track record of minimal environmental impact. Modern oil drill-
Natural Seeps63%
Spills by Petroleum Users
33%
Pipeline Related1%
Ships & Barges2%
Drilling1%
Source: National Research Council
ing is even designed to withstand hurricanes and tropical storms. According to the MMS, 3,050 of the Gulf of Mexico’s 4,000 platforms and 22,000 of the 33,000 miles of the Gulf’s pipelines were in the direct path of either Hurricane Katrina or Hur-ricane Rita. The hurricanes destroyed 115 drilling platforms, damaged 52 others, and damaged 535 pipeline segments, yet “there was no loss of life and no major oil spills attributed to either storm.”110
All forms of energy production come with risks, both to humans and to the environment. Offshore oil drilling is no exception. Spills from offshore drilling and tankers undoubtedly will continue to occur, but they are rare and are decreasing in frequency; and the amount of oil spilled from rigs and tankers is small, compared with the amount of oil extracted and with the amount of oil that enters ocean waters naturally from ocean floors. As technology continues to advance, and as com-panies find themselves accountable to a public increasingly concerned about environmental stewardship, drilling for oil in our coastal waters will continue to be conducted in a safe and envi-ronmentally conscious manner.
Sources of Petroleum in North American Waters, 1990-1999
M Y T H O f f s h o r e o i l d r i l l i n g h a s o f t e n c a u s e d s i g n i f i c a n t e n v i r o n m e n t a l d a m a g e .8
21
In January 1969, a natural gas blowout on an oil rig miles off the coast of Santa Barbara, Califor-nia, spilled 80,000 gallons of oil into the Pacific Ocean and onto surrounding beaches. Twenty years later, in March 1989, the Exxon Valdez oil tanker struck a reef and spilled 10.4 million gal-lons of oil into Prince William Sound, Alaska, af-fecting 1,300 miles of shoreline.
These two great oil spills are perhaps the principal sources of public antipathy toward offshore drilling for natural resources. Images of spilled oil bubbling to the ocean’s surface and covering birds and other wildlife have firmly cemented in much of the pub-lic mind that offshore drilling is dangerous, that it inflicts tremendous environmental harm, and that its costs are not worth its benefits. Thus the means by which the U.S. obtains about 25 percent of the nation’s natural gas production and about 24 per-cent of its oil production102 have become, under-standably, linked to environmental degradation.
A majority (64.4 percent) of respondents favored expanded offshore oil drilling, while 31.8 percent opposed it. Over 42 percent of those who op-posed it believed that the U.S. already uses too much oil. Interestingly, even smaller percentages of those who opposed expanded drilling cited concerns that offshore drilling is the major cause of oil spills into the ocean (17.5 percent) or that oil rigs damage the environment (26.6 percent). Perhaps many are aware of offshore drilling’s suc-cessful track record.
Since 1975, offshore drilling in the Exclusive Eco-nomic Zone (within 200 miles of U.S. coasts) has
a safety record of 99.999 percent, meaning that only 0.0001 percent of the oil produced has been spilled.103 With regard to the Outer Continental Shelf (U.S. waters under federal, rather than state, jurisdiction),104 between 1993 and 2007 there were 651 oil spills, releasing 47,800 barrels of oil. Given 7.5 billion barrels of oil produced during that period, one barrel of oil has been spilled in the OCS per 156,900 barrels produced.105
Research published in 2000 by the U.S. Minerals Management Service (MMS)106 documents the decreasing occurrence of crude-oil spills in the OCS. Revising previous estimates first published in 1994, the authors analyzed data through 1999 and concluded that oil-spill rates for OCS plat-forms, tankers, and barges continued to decline.107 Additionally, the number of oil spills from plat-forms, tankers, and pipelines is small, relative to the amount of oil extracted and transported. Even so, oil spills remain an unpleasant reality of
offshore oil drilling. Certainly, any amount of oil spilled into the ocean is undesirable, but offshore oil operations contribute relatively little of the oil that enters ocean waters each year.
For example, ocean floors naturally seep more oil into the ocean than do oil-drilling accidents and oil-tanker spills combined. (However, such seepage generally does not rise to the surface or reach the coastlines and, thus, is not as apparent as oil-drilling spills.) According to the National Academies’ National Research Council, natural processes are responsible for over 60 percent of the petroleum that enters North American ocean
22
Since 1975, offshore drilling in the Exclusive Economic Zone (within 200 miles of U.S. coasts) has a safety record of 99.999 percent,
meaning that only 0.0001 percent of the oil produced has been spilled.
Energy and the E
nvironment: M
yths and FactsA
pril 2009
challenges in analyzing older data.”121 Such limi-tations and challenges highlight the difficulties of accurately determining how much our tempera-ture has changed. Yet one thing is certain: climate changes and always has. According to the U.S. Environmental Protection Agency: “From glacial periods (or ‘ice ages’) where ice covered signifi-cant portions of the Earth to interglacial periods where ice retreated to the poles or melted entire-ly—the climate has continuously changed.”122
Our limited knowledge and understanding of the myriad intricacies of the Earth’s complex climate system make climate-change discussions necessar-ily inconclusive.123 “While most scientists agree that anthropogenic [man-made] global warming
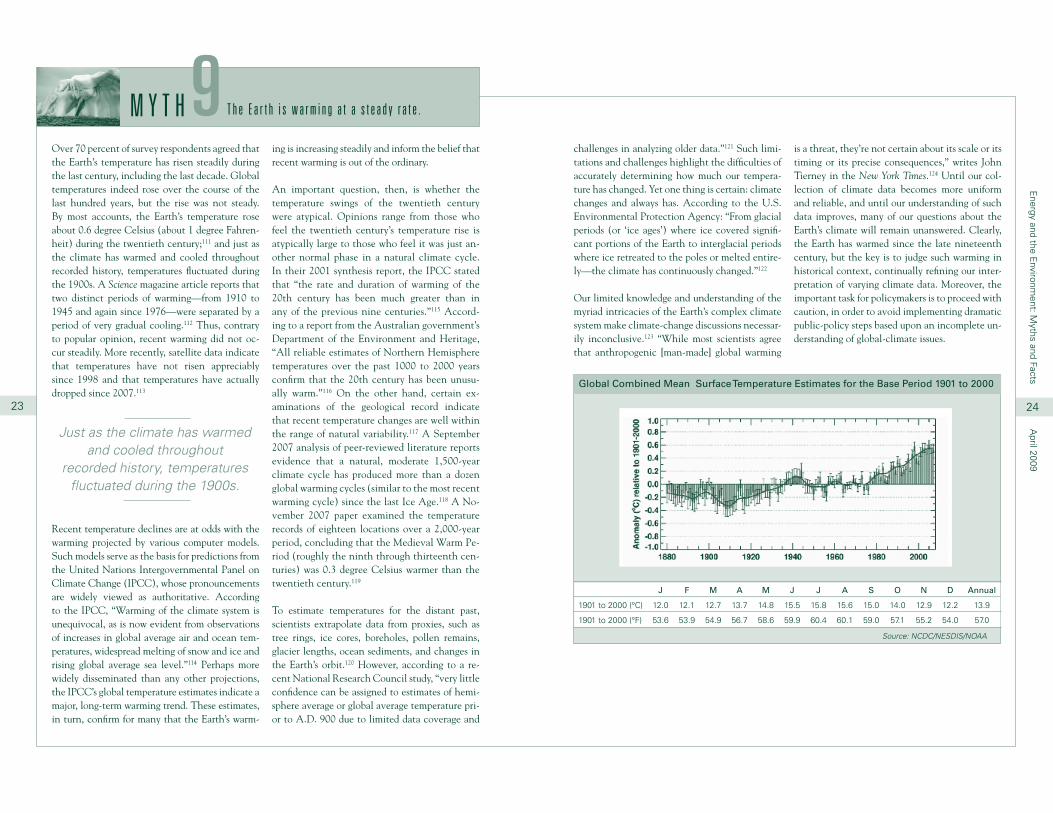
J F M A M J J A S O N D Annual
1901 to 2000 (°C) 12.0 12.1 12.7 13.7 14.8 15.5 15.8 15.6 15.0 14.0 12.9 12.2 13.9
1901 to 2000 (°F) 53.6 53.9 54.9 56.7 58.6 59.9 60.4 60.1 59.0 57.1 55.2 54.0 57.0
is a threat, they’re not certain about its scale or its timing or its precise consequences,” writes John Tierney in the New York Times.124 Until our col-lection of climate data becomes more uniform and reliable, and until our understanding of such data improves, many of our questions about the Earth’s climate will remain unanswered. Clearly, the Earth has warmed since the late nineteenth century, but the key is to judge such warming in historical context, continually refining our inter-pretation of varying climate data. Moreover, the important task for policymakers is to proceed with caution, in order to avoid implementing dramatic public-policy steps based upon an incomplete un-derstanding of global-climate issues.
Global Combined Mean Surface Temperature Estimates for the Base Period 1901 to 2000
Source: NCDC/NESDIS/NOAA
M Y T H T h e E a r t h i s w a r m i n g a t a s t e a d y r a t e .9
23
Over 70 percent of survey respondents agreed that the Earth’s temperature has risen steadily during the last century, including the last decade. Global temperatures indeed rose over the course of the last hundred years, but the rise was not steady. By most accounts, the Earth’s temperature rose about 0.6 degree Celsius (about 1 degree Fahren-heit) during the twentieth century;111 and just as the climate has warmed and cooled throughout recorded history, temperatures fluctuated during the 1900s. A Science magazine article reports that two distinct periods of warming—from 1910 to 1945 and again since 1976—were separated by a period of very gradual cooling.112 Thus, contrary to popular opinion, recent warming did not oc-cur steadily. More recently, satellite data indicate that temperatures have not risen appreciably since 1998 and that temperatures have actually dropped since 2007.113
Recent temperature declines are at odds with the warming projected by various computer models. Such models serve as the basis for predictions from the United Nations Intergovernmental Panel on Climate Change (IPCC), whose pronouncements are widely viewed as authoritative. According to the IPCC, “Warming of the climate system is unequivocal, as is now evident from observations of increases in global average air and ocean tem-peratures, widespread melting of snow and ice and rising global average sea level.”114 Perhaps more widely disseminated than any other projections, the IPCC’s global temperature estimates indicate a major, long-term warming trend. These estimates, in turn, confirm for many that the Earth’s warm-
ing is increasing steadily and inform the belief that recent warming is out of the ordinary.
An important question, then, is whether the temperature swings of the twentieth century were atypical. Opinions range from those who feel the twentieth century’s temperature rise is atypically large to those who feel it was just an-other normal phase in a natural climate cycle. In their 2001 synthesis report, the IPCC stated that “the rate and duration of warming of the 20th century has been much greater than in any of the previous nine centuries.”115 Accord-ing to a report from the Australian government’s Department of the Environment and Heritage, “All reliable estimates of Northern Hemisphere temperatures over the past 1000 to 2000 years confirm that the 20th century has been unusu-ally warm.”116 On the other hand, certain ex-aminations of the geological record indicate that recent temperature changes are well within the range of natural variability.117 A September 2007 analysis of peer-reviewed literature reports evidence that a natural, moderate 1,500-year climate cycle has produced more than a dozen global warming cycles (similar to the most recent warming cycle) since the last Ice Age.118 A No-vember 2007 paper examined the temperature records of eighteen locations over a 2,000-year period, concluding that the Medieval Warm Pe-riod (roughly the ninth through thirteenth cen-turies) was 0.3 degree Celsius warmer than the twentieth century.119
To estimate temperatures for the distant past, scientists extrapolate data from proxies, such as tree rings, ice cores, boreholes, pollen remains, glacier lengths, ocean sediments, and changes in the Earth’s orbit.120 However, according to a re-cent National Research Council study, “very little confidence can be assigned to estimates of hemi-sphere average or global average temperature pri-or to A.D. 900 due to limited data coverage and
24
Just as the climate has warmed and cooled throughout
recorded history, temperatures fluctuated during the 1900s.
Energy and the E
nvironment: M
yths and FactsA
pril 2009
atmosphere but that the atmosphere also sends carbon back to the land and oceans and that these carbon flows have canceled each other out for millennia. “Burning fossil fuels, in contrast,” writes MacKay, “creates a new flow of carbon that, though small, is not cancelled.”
Though the amount of additional carbon from hu-man activities is dwarfed by natural carbon levels, might the added carbon increase from humans be enough to alter climate dynamics? Are humans to blame for global warming? If so, what portion of the warming do we cause? Advancing the climate debate depends on a clear understanding of emis-sions’ impacts.
Though a causal link between human carbon-dioxide emissions and accelerated warming has not been proved, national policymakers broadly support curbing carbon emissions via government regulation. One way to lower emissions is to reduce or eliminate the burning of carbon-based fuels, such as coal or natural gas. Another option is to replace motor vehicles that run on petroleum-based fuels with lower- or non-carbon-emitting vehicles, such as electric cars. However, because the overwhelming majority of our energy is derived from fossil fuels, such carbon-reduction strategies are easier planned than implemented.
As an alternative—or at least until we find ways to displace fossil fuels and conventional ve-
hicles—financial instruments known as carbon offsets are used to cancel out carbon emissions. Each carbon offset represents the reduction of one metric ton of carbon dioxide through car-bon-reducing activities like tree planting or renewable energy production. The idea is to purchase enough carbon offsets to reduce or cancel out one’s total carbon-dioxide contribu-tion. A plurality (45.6 percent) of respondents believed that carbon offsets are an easy way to cancel out one’s carbon-dioxide emissions. Once again, however, this is easier said than done.132 In fact, some carbon offsets represent activities that would have been carried out in any case. As a result, the United States Federal Trade Commis-
sion is investigating the legitimacy of the carbon-offsets business,133 and carbon offsets have come under fire in Europe as well.134
Particularly among industrialized nations, the U.S. is castigated for not ratifying the Kyoto Protocol, an international agreement to reduce greenhouse-gas emissions. However, several large carbon emitters—namely China, India, and other “developing” countries—did ratify the protocol but are exempted from its costly carbon-reduc-tion mandates.135 (According to Danish politi-cal scientist Bjørn Lomborg, the annual cost of the Kyoto Protocol is $180 billion.)136 Consider-ing the current and projected future emissions of these nations, their exemption from the mandates is enormously significant.
M Y T H H u m a n s a r e t h e m a i n d r i v e r s o f t h e g r e e n -h o u s e e f f e c t , w h i c h i s l i k e l y t o c a u s e g l o b a l w a r m i n g .10
25
The premise of anthropogenic (man-made) global warming theory is that greenhouse-gas emissions from human activities—namely, the burning of fossil fuels that release carbon di-oxide—are rapidly accelerating the warming of the Earth, as projected by computer models. An authoritative source for the theory is the IPCC, whose most recent climate assessment states: “Most of the observed increase in globally av-eraged temperatures since the mid-20th century is very likely due to the observed increase in an-thropogenic [greenhouse gas] concentrations.”125 To those who subscribe to anthropogenic global warming theory, reducing man-made carbon-di-oxide emissions is the top priority in the struggle to save the Earth from potentially catastrophic changes in climate caused by a change in the composition of the atmosphere.
Carbon dioxide, one of a number of heat-trapping greenhouse gases,126 is emitted both naturally and by human activities, such as coal-fired power pro-duction.127 The EIA reports that carbon-dioxide emissions from the burning of petroleum, coal, and natural gas constituted 82 percent of all U.S. man-
made greenhouse-gas emissions in 2006.128 Ac-cording to the IPCC, between 1970 and 2004, to-tal greenhouse-gas emissions increased 70 percent worldwide, while carbon-dioxide emissions rose 80 percent.129 As of 2008, thirty-nine out of every 100,000 particles of the atmosphere were carbon dioxide, a figure 40–45 percent higher than before the start of the Industrial Revolution.130
Without question, then, industrialization has in-creased carbon-dioxide emissions—but are human emissions significant enough to accelerate warm-ing? Have they already done so? Both the Earth’s average temperature and global carbon-dioxide emissions increased during the twentieth cen-tury. But what should we make of research show-ing recent warming on Mars and Pluto, planets without power plants or automobiles? Is planetary warming simply a natural phenomenon? A bet-ter understanding of the issues surrounding these and similar questions is needed, if policymakers intend to craft prudent energy policies.
Central to climate-change discussions is an ex-amination of just how much atmospheric carbon dioxide is attributable to human activities, rather than to nature. Sixty-three percent of survey re-spondents believed that human activity, such as the burning of fossil fuels, is the greatest source of carbon-dioxide emissions. While some estimate that the human share of atmospheric carbon di-oxide is as small as 3 percent—according to David J. C. MacKay, professor of natural philosophy in the Department of Physics at the University of Cambridge, the burning of fossil fuels sends seven gigatons (3.27 percent) of carbon dioxide into the atmosphere each year, while the biosphere and oceans account for 440 (55.28 percent) and 330 (41.46 percent) gigatons, respectively131—total human emissions have jumped sharply since the Industrial Revolution; and it is this added atmo-spheric carbon that worries many. MacKay writes that, yes, carbon is emitted naturally into the
26
According to David J. C. MacKay, the burning of fossil fuels sends seven gigatons (3.27 percent) of carbon dioxide into the
atmosphere each year, while the biosphere and oceans account for 440 (55.28 percent) and 330 (41.46 percent) gigatons,
respectively... “Burning fossil fuels, in contrast,” writes MacKay, “creates a new flow of carbon that, though small, is not cancelled.”
Burning of Fossil Fuels
3.27%
Biosphere 55.28%
Oceans41.46%
Sources of Atmospheric Carbon Dioxide
Source: David J. C. MacKay, Sustainable Energy—Without the Hot Air (Cambridge: UIT, 2008), http://www.withouthotair.com/download.html.
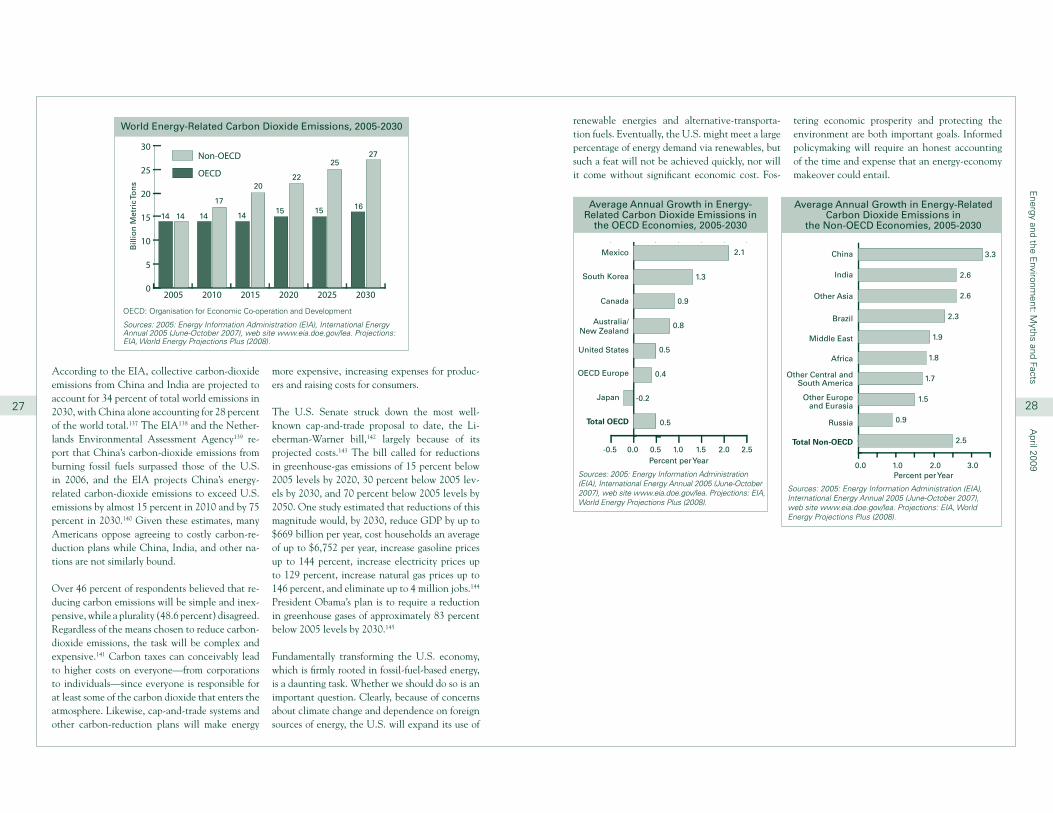
Energy and the E
nvironment: M
yths and FactsA
pril 2009
According to the EIA, collective carbon-dioxide emissions from China and India are projected to account for 34 percent of total world emissions in 2030, with China alone accounting for 28 percent of the world total.137 The EIA138 and the Nether-lands Environmental Assessment Agency139 re-port that China’s carbon-dioxide emissions from burning fossil fuels surpassed those of the U.S. in 2006, and the EIA projects China’s energy-related carbon-dioxide emissions to exceed U.S. emissions by almost 15 percent in 2010 and by 75 percent in 2030.140 Given these estimates, many Americans oppose agreeing to costly carbon-re-duction plans while China, India, and other na-tions are not similarly bound.
Over 46 percent of respondents believed that re-ducing carbon emissions will be simple and inex-pensive, while a plurality (48.6 percent) disagreed. Regardless of the means chosen to reduce carbon-dioxide emissions, the task will be complex and expensive.141 Carbon taxes can conceivably lead to higher costs on everyone—from corporations to individuals—since everyone is responsible for at least some of the carbon dioxide that enters the atmosphere. Likewise, cap-and-trade systems and other carbon-reduction plans will make energy
27
more expensive, increasing expenses for produc-ers and raising costs for consumers.
The U.S. Senate struck down the most well-known cap-and-trade proposal to date, the Li-eberman-Warner bill,142 largely because of its projected costs.143 The bill called for reductions in greenhouse-gas emissions of 15 percent below 2005 levels by 2020, 30 percent below 2005 lev-els by 2030, and 70 percent below 2005 levels by 2050. One study estimated that reductions of this magnitude would, by 2030, reduce GDP by up to $669 billion per year, cost households an average of up to $6,752 per year, increase gasoline prices up to 144 percent, increase electricity prices up to 129 percent, increase natural gas prices up to 146 percent, and eliminate up to 4 million jobs.144 President Obama’s plan is to require a reduction in greenhouse gases of approximately 83 percent below 2005 levels by 2030.145
Fundamentally transforming the U.S. economy, which is firmly rooted in fossil-fuel-based energy, is a daunting task. Whether we should do so is an important question. Clearly, because of concerns about climate change and dependence on foreign sources of energy, the U.S. will expand its use of
28
OECD: Organisation for Economic Co-operation and Development
Sources: 2005: Energy Information Administration (EIA), International Energy Annual 2005 (June-October 2007), web site www.eia.doe.gov/lea. Projections: EIA, World Energy Projections Plus (2008).
World Energy-Related Carbon Dioxide Emissions, 2005-2030
0
5
10
15
20
25
30Non-OECD
OECD
203020252020201520102005
2.1Mexico
South Korea
Canada
Australia/New Zealand
United States
OECD Europe
Japan
Total OECD
1.3
0.9
0.8
0.5
0.4
-0.2
0.5
0.0 0.5 1.0 1.5 2.0 2.5
0.0 1.0 2.0 3.0
China
India
Other Asia
Brazil
Middle East
Africa
Other Central and South America
Russia
Total Non-OECD
Other Europe and Eurasia
Sources: 2005: Energy Information Administration (EIA), International Energy Annual 2005 (June-October 2007), web site www.eia.doe.gov/lea. Projections: EIA, World Energy Projections Plus (2008).
Average Annual Growth in Energy-Related Carbon Dioxide Emissions in
the OECD Economies, 2005-2030
renewable energies and alternative-transporta-tion fuels. Eventually, the U.S. might meet a large percentage of energy demand via renewables, but such a feat will not be achieved quickly, nor will it come without significant economic cost. Fos-
tering economic prosperity and protecting the environment are both important goals. Informed policymaking will require an honest accounting of the time and expense that an energy-economy makeover could entail.
14 14 14
17
14
20
15
22
15
25
16
27
Average Annual Growth in Energy-Related Carbon Dioxide Emissions in
the Non-OECD Economies, 2005-2030
Sources: 2005: Energy Information Administration (EIA), International Energy Annual 2005 (June-October 2007), web site www.eia.doe.gov/lea. Projections: EIA, World Energy Projections Plus (2008).
3.3
2.6
2.6
2.3
1.9
1.8
1.7
1.5
0.9
2.5-0.5
Percent per Year
Percent per Year
Bill
ion
Met
ric T
on
s

P O L I C Y I M P L I C A T I O N S

Energy and the E
nvironment: M
yths and FactsA
pril 2009
the mandate, the tide of public opinion turned against corn ethanol, as the burning of large por-tions of our nation’s corn crop helped raise food prices worldwide, and as new research revealed that the massive land clearing required for the corn-ethanol business potentially increases, rath-er than decreases, the amount of carbon in the atmosphere. In spite of billions of taxpayer-subsi-dized dollars and protective tariffs, the domestic ethanol industry fell into disarray, with dozens of
ethanol refiners going bankrupt because of falling ethanol prices and resulting excess refining capac-ity. The corn-ethanol debacle is a prime example of the law of unintended consequences and of the potential of myth-based thinking to lead to pre-mature—and, ultimately, unsuccessful—energy policies that harm the economy and, often, even the environment.
Similarly, we may be acting too quickly to limit carbon-dioxide emissions, despite indications that the Earth’s climate is not warming as quickly as many believe. According to computer models and media accounts, the Earth’s temperature is on a breakaway upward trajectory. However, though the Earth’s average temperature increased about one degree Fahrenheit during the twentieth century, its climb was not constant. Rather, two distinct warming periods were separated by a period of global cooling. Additionally, satellite data indicate that the second warming period of the twentieth century has recently halted and, perhaps, is in reverse. Computer models did not project such a shift. We simply cannot be sure we understand the myriad intricacies of global climate dynamics, at least not sufficiently
to justify sweeping attempts to regulate carbon dioxide, the supposed chief culprit of climate change. Particularly since such regulations would come at enormous economic cost—potentially hitting every industry, business, and consumer—the risks of rushing to judgment are substantial. Unless we proceed cautiously, aggressive climate measures could raise energy and electricity prices, curtail economic output, and reduce overall employment.
Along with unconfirmed fears of humans’ impact on climate, the mistaken belief that U.S. cities are becoming more polluted has sparked oppo-sition to building new coal-fired power plants. Though the idea that carbon dioxide is a pollut-ant is recent (and unproven) and though air qual-ity in our cities has steadily improved for decades, many oppose new coal plants. If carried to its log-ical extreme, misplaced fears about climate and pollution could bar not only new coal plants but could also shut down existing coal plants, effec-tively closing off the source of half of our nation’s electricity supply.
Finally, due to the inefficiencies of renewable en-ergies and alternative fuels, the possibility of U.S. energy independence anytime in the near future is a myth. However, the U.S. is well positioned to meet our future energy needs, for instead of fo-cusing all our resources on a single energy source or energy supplier, we have a diversified portfolio of energy resources and numerous supplies that act as an effective hedge against supply disrup-tions. For example, contrary to popular opinion, the U.S. imports oil from dozens of nations and is not overly reliant on any single country or region.
31
In a democracy, a well-informed public can play an important role in helping elected officials make wise policy decisions. But many Americans be-lieve in energy myths that shape their views and influence public-policy debates. Consider some of the most widely accepted ideas and how energy-policy decisions may reflect these beliefs.
The belief that nuclear energy is unsafe has re-sulted in an unwritten moratorium on new nu-clear power plants. Since the partial meltdown of a nuclear reactor at Three Mile Island in 1979, not a single nuclear reactor has been built in the United States. Moreover, in 1977 President Jimmy Carter outlawed the reprocessing of spent nuclear fuel, even though almost all the material in a nuclear rod can be safely reused following the first nuclear cycle. Though no one has ever died from the production of nuclear power in the U.S., though we have safely generated nuclear power and stored nuclear waste for decades, and though other countries are increasingly turning to nuclear power to help meet their energy needs—notably France, which generates 80 percent of its electric-ity from nuclear power—fear has held nuclear en-ergy advancement hostage for thirty years. These
unfounded fears have caused us to miss out on three decades’ worth of safe, reliable power that produces virtually zero carbon emissions. And we’ve lost all that time, too, which we could have spent training a workforce to wield and manage nuclear power technology.Additionally, the notion that offshore drilling is environmentally dangerous has kept off-limits abundant domestic sources of oil and natural gas,
making the U.S. the only country with significant known reserves of oil and natural gas that refuses to tap them. Since the 1979 oil spill off Santa Barbara’s coast, much of the public has viewed oil drilling as overly harmful to our ocean waters; but the track record of offshore drilling reveals a history of safety and of minimal environmental impact. Since 1975, offshore drilling in the Ex-clusive Economic Zone (within 200 miles of the U.S. coast) has a safety record of 99.999 percent, meaning that only 0.0001 percent of the oil pro-duced has been spilled.146 In spite of oil’s safety record, however, large portions of our oil- and natural gas–rich coastal waters remain off-lim-its to exploration and development. The result: U.S. dependence on foreign sources of energy has grown over time, as we have neglected to reap the benefits—economically and geopolitically—of our abundant natural resources.
Just as misguided fears may stymie the respon-sible development and use of certain resources, unrealistic hopes may accelerate the rollout of others—more appealing philosophically but less efficient economically. The deeply held view that renewable fuels hold immediate promise argu-
ably played a part in the nation’s aggressive move toward corn ethanol. Hoping that corn ethanol can play a large role in powering our nation’s ve-hicles, the U.S. Congress increased the amount of ethanol that must be blended into our trans-portation-fuel mix from 9 billion gallons in 2008 to 10.5 billion gallons in 2009 and 15 billion gallons in 2015. As it turns out, such a decision was premature. Just months after Congress upped
32
The corn-ethanol debacle is a prime example of the law of unintended consequences and of the potential of myth-based
thinking to lead to premature—and, ultimately, unsuccessful—energy policies that harm the economy and, often, even the environment.
Instead of rushing to judgment based on political expediency, unproven theories, or fear, policymakers should focus on
realistic energy policies that meet our needs today without creating liabilities for us tomorrow.
POLICY IMPLICATIONS: Building on the Facts

Energy and the E
nvironment: M
yths and FactsA
pril 2009
A P P E N D I X S U R V E Y M E T H O D O L O G Y
Zogby International conducted an omnibus telephone survey of [adults].
The sample is [1000 adult] interviews with approximately [44] questions asked. Samples are randomly drawn
from telephone cd’s of national listed sample. Zogby International surveys employ sampling strategies in
which selection probabilities are proportional to population size within area codes and exchanges. Up to six
calls are made to reach a sampled phone number. Cooperation rates are calculated using one of AAPOR’s
approved methodologiesi and are comparable to other professional public-opinion surveys conducted using
similar sampling strategies.ii Weighting by [region, party, age, race, religion, gender] is used to adjust for non-
response. The margin of error is +/- 3.2 percentage points. Margins of error are higher in sub-groups.
i See COOP4 (p.38) in Standard Definitions: Final Dispositions of Case Codes and Outcome Rates of Surveys. The American Association for Public Opinion Research, (2000).
ii Cooperation Tracking Study: April 2003 Update, Jane M. Sheppard and Shelly Haas. The Council for Marketing & Opinion Research (CMOR). Cincinnati, Ohio (2003).
Only 16 percent of our 2007 oil imports came from the Persian Gulf, for example, while over 61 percent of the petroleum consumed in the U.S. in 2007 was either produced here or imported from Canada and Mexico, our immediate neighbors. In spite of such balance, misplaced fears that we are overly dependent on dangerous regimes for our oil supply could hasten government mandates and subsidies for unproven technologies that divert resources from more efficient uses—and raise the overall cost of energy for consumers.
Misguided energy policies ultimately tend to produce economic harm, both to producers and consumers. Though its economic impact is of-ten overlooked, energy policy affects everyone’s pocketbook. Higher energy prices inevitably lead to higher prices and job losses throughout the economy. Additionally, since the poorest house-holds spend the largest share of their incomes on energy, policies that raise the price of energy dis-proportionately hurt the poor. Politicians would do well to remember this as they consider Presi-dent Obama’s plan to reduce greenhouse-gas emissions approximately 83 percent by 2050.147 According to the Congressional Budget Office, just a 15 percent reduction in emissions from
1998 levels would impose an additional $680 (measured in constant 2006 dollars) in costs on the poorest 20 percent of our population, the largest percentage increase (3.3 percent) of the five economic quintiles.148
As our survey shows, many Americans hold inac-curate ideas about key energy issues. From class-rooms to press rooms to legislative halls, energy myths abound. The pervasiveness of such misun-derstandings about energy often leads to energy policies driven by emotion, rather than by facts; to premature, rather than prudent, legislation and regulations; and to constrictive, rather than growth-oriented, economic outcomes.
Instead of rushing to judgment based on politi-cal expediency, unproven theories, or fear, poli-cymakers should focus on realistic energy policies that meet our needs today without creating lia-bilities for us tomorrow. Scientific, technological, and economic realities, rather than myths, must guide energy-policy decisions. Separating myths from realities is essential if Americans are to con-tinue to depend on reliable and affordable sources of energy.
33 34
Energy and the E
nvironment: M
yths and FactsA
pril 2009
11. Do you agree or disagree with the following statement - Unless more people recycle on a regular basis, the United States will run out of landfill space for garbage and other solid waste.
12. Do you agree or disagree with the following statement - Moving toward renewable energies and away from fossil fuels will significantly increase national employment levels.
13. Do you agree or disagree with the following statement - Reducing carbon emissions will be a simple, inexpensive way to fight global warming.
14. Generally speaking, would you say the air quality in America’s cities has gotten better or worse since 1970, or has it stayed the same?
15. Have there been any deaths related to the production of nuclear power in the United States?
Percent
Agree 76.7
Disagree 20.8
NS 2.5
16. Do you agree or disagree that nuclear waste can be stored safely?
17. Federal regulations were recently changed to permit more offshore oil drilling. Do you agree or disagree with this decision?
18. Which of the following statements best describes why you disagree with the federalregulations permitting more offshore oil drilling?
Percent
Agree 52.9
Disagree 33.5
NS 13.6
Percent
Agree 46.5
Disagree 48.6
NS 5.0
Percent
Better 27.5
Worse 47.6
Stayed the same 17.3
NS 7.6
Percent
Agree 49.8
Disagree 42.0
NS 8.2
Percent
Agree 64.4
Disagree 31.8
NS 3.8
Percent
Oil drilling is the major cause of oil spills into the ocean
5.6
Oil-drilling rigs damage the environment
8.5
We use too much oil 13.5
None of these/Other 3.7
NS 0.5
Missing 68.2
Z o g b y A m e r i c a A d u l t s 1 / 2 9 / 0 9 t h r u 2 / 4 / 0 9
35
1. To the best of your knowledge, which country exports the most oil to the United States.
2. Do you agree or disagree with the following statement.The United States can meet its future energy demand through conservation and efficiency.
3. Do you agree or disagree with the following statement - Most of the United States’ energy supply is used for driving and transportation.
4. Do you agree or disagree with the following statement - We must move to renewable energy because we are rapidly running out of oil, natural gas, and other fossil fuels.
5. Do you agree or disagree with the following statement - At current growth rates, alternative vehicles like hybrid and electric cars will make up a large percentage of the United States’ automobile fleet in ten years.
6. Do you agree or disagree with the following statement - At current growth rates, renewable sources of energy, such as wind and solar power, will soon replace fossil fuels like coal, natural gas, and nuclear power, in meeting our energy and electricity needs.
7. Do you agree or disagree with the following statement - Generating electricity from renewable energies like the wind and the sun is less expensive than generating electricity from coal or natural gas.
8. Do you agree or disagree with the following statement - The Earth’s temperature has climbed steadily for the last 100 years, including the last decade.
9. Do you agree or disagree with the following statement - Human activity, such as the burning of fossil fuels, is the greatest source of greenhouse gases, which many believe contribute to global warming.
10. Do you agree or disagree with the following statement - An easy way to cancel out one’s impact on the atmosphere is through the purchase of carbon offsets, credits representing activities meant to reduce carbon emissions.
Percent
Mexico 6.1
Saudi Arabia 48.9
Iraq 15.2
Canada 13.0
Russia 2.7
Other/None of the above 5.2
NS 8.9
Percent
Agree 67.6
Disagree 26.1
NS 6.3
Percent
Agree 52.6
Disagree 43.5
NS 4.0
Percent
Agree 70.6
Disagree 27.3
NS 2.1
Percent
Agree 49.4
Disagree 46.3
NS 4.3
Percent
Agree 53.7
Disagree 35.9
NS 10.4
Percent
Agree 70.2
Disagree 23.3
NS 6.5
Percent
Agree 63.0
Disagree 29.9
NS 7.1
Percent
Agree 45.6
Disagree 37.2
NS 17.2
Percent
Agree 62.7
Disagree 33.2
NS 4.1
36
The full poll results may be downloaded on line at www.manhattan-institute.org/energymyths
Percent
Yes 38.3
No 36.8
NS 24.9
Energy and the E
nvironment: M
yths and FactsA
pril 2009
the following types of activity: manufacturing (NAICS codes 31–33); agriculture, forestry, fishing and hunting (NAICS code 11); mining, including oil and gas extraction (NAICS code 21); and construction (NAICS code 23). Overall energy use in this sector is largely for process heat and cooling and powering machinery, with lesser amounts used for facility heating, air conditioning, and lighting. Fossil fuels are also used as raw material inputs to manufactured products. Note: This sector includes generators that produce electricity and/or useful thermal output primarily to support the above-mentioned industrial activities.” See EIA, “Glossary,” supra, n. 9.
12 See EIA, “Petroleum Products: Consumption,” supra, n. 9.
13 See EIA, “Energy Basics 101,” http://www.eia.doe.gov/basics/energybasics101.html.
14 OPEC supplied 53.7 percent. See EIA, “U.S. Imports by Country of Origin,” supra, n. 3.
15 See ibid.
16 Uranium is the fuel most commonly used by nuclear power facilities. See EIA, “Nuclear Fuel—Uranium,” http://www.eia.doe.gov/kids/energyfacts/sources/non-renewable/nuclear.html#Nuclear%20Fuel.
17 See EIA, “Table 1. Total U.S. Proved Reserves of Crude Oil, Dry Natural Gas, and Natural Gas Liquids, 1997–2007,” http://www.eia.doe.gov/oil_gas/natural_gas/data_publications/crude_oil_natural_gas_reserves/cr.html. Proved reserves of 2007 were 345 million barrels (or 2 percent) more than proved reserves of 2006. As defined by the EIA, proved reserves are “estimated quantities that analysis of geologic and engineering data demonstrates with reasonable certainty are recoverable under existing economic and operating conditions” (EIA, “World Proved Reserves of Oil and Natural Gas, Most Recent Estimates,” August 27, 2008,
http://www.eia.doe.gov/emeu/international/reserves.html).
18 See EIA, “Table 1. Total U.S. Proved Reserves of Crude Oil, Dry Natural Gas, and Natural Gas Liquids, 1997–2007,” supra, n. 18.
19 The demonstrated reserve base is composed of coal resources that have been identified to specified levels of accuracy and may support economic mining under current technologies. See EIA, “Coal Reserves Current and Back Issues,” http://www.eia.doe.gov/cneaf/coal/reserves/reserves.html.
20 See ibid.
21 The 2003 uranium-reserves assessment is the EIA’s most recent assessment. See EIA, “U.S. Uranium Reserves Estimates,” June 2004, http://www.eia.doe.gov/cneaf/nuclear/page/reserves/ures.html.
22 See EIA, “U.S. Uranium Reserves by Forward-Cost,” June 2004, http://www.eia.doe.gov/cneaf/nuclear/page/reserves/urescost.html: “Uranium reserves that could be recovered as
a by-product of phosphate and copper mining are not included in these reserves. Reserves values in forward-cost categories are cumulative; that is, the quantity at each level of forward cost includes all reserves at the lower costs.”
23 EIA, “Table A8. Electricity Supply, Disposition, Prices, and Emissions,” Annual Energy Outlook 2009, http://www.eia.doe.gov/oiaf/aeo/pdf/appa.pdf#page=17.
24 See EIA, “Figure ES 1. US Electric Power Industry Net Generation, 2007,” http://www.eia.doe.gov/cneaf/electricity/epa/figes1.html.
25 See EIA, “Petroleum Products: Consumption,” supra, n. 9.
26 EIA, “How Much Renewable Energy Do We Use?,” http://tonto.eia.doe.gov/energy_in_brief/renewable_energy.cfm.
27 See EIA, “Figure ES 1. U.S. Electric Power Industry Net Generation, 2007,” supra, n. 25.
28 See EIA, “Electric Power Annual 2003” (Figure ES 2), http://tonto.eia.doe.gov/FTPROOT/electricity/034803.pdf.
29 EIA, “Total Renewable Net Generation by Energy Source and State,” May 2008, http://www.eia.doe.gov/cneaf/alternate/page/renew_energy_consump/table6.html.
37
E N D N O T E S1 See EIA, “How Dependent Are We on Foreign Oil?,” Energy in Brief, http://tonto.eia.doe.gov/energy_in_brief/foreign_oil_dependence.cfm.
2 The year 2007 is the most recent one for which final data are available from the Energy Information Administration. Preliminary data for 2008 indicate that Mexico will likely be replaced by Saudi Arabia as our second-largest petroleum supplier, while Mexico will likely rank third. See EIA, “Crude Oil and Total Petroleum Imports Top 15 Countries,”
http://www.eia.doe.gov/pub/oil_gas/petroleum/data_publications/company_level_imports/current/import.html.
3 See EIA, “Monthly Energy Review” (Table 3.3a, Petroleum Trade: Overview), http://www.eia.doe.gov/emeu/mer/pdf/pages/sec3_7.pdf. As defined by the EIA, the Persian Gulf includes
Bahrain, Iran, Iraq, Kuwait, Qatar, Saudi Arabia, and United Arab Emirates. See EIA, “U.S. Imports by Country of Origin,” http://tonto.eia.doe.gov/dnav/pet/pet_move_impcus_a2_nus_ep00_im0_mbbl_a.htm.
4 Similarly, many claim that the U.S. is too dependent on oil from the nations of the Organization of Petroleum Exporting Countries (OPEC), a cartel of major oil suppliers. However, less than half (44.4 percent) of all U.S. imports arrive from OPEC countries. See EIA, “Monthly Energy Review” (supra, n. 3). Moreover, though they are often mistaken as the same group of countries, OPEC and the Middle East are not the same group of countries, as OPEC includes both Middle Eastern and non–Middle Eastern nations. In 2007, the U.S. imported crude oil from the following OPEC nations: Algeria, Angola, Ecuador, Indonesia, Iraq, Kuwait, Libya, Nigeria, Qatar, Saudi Arabia, United Arab Emirates, and Venezuela. See EIA, “U.S. Imports by Country of Origin,” supra, n. 3.
5 See EIA, “How Dependent Are We on Foreign Oil?,” supra, n. 1.
6 See EIA, “U.S. Net Imports by Country,” Energy in Brief, http://tonto.eia.doe.gov/dnav/pet/pet_move_neti_a_ep00_IMN_mbblpd_a.htm. The EIA categorizes U.S.
petroleum consumption as “products supplied.” See EIA, “Monthly Energy Review,” `, n. 3.
7 See EIA, “U.S. Imports by Country of Origin,” http://tonto.eia.doe.gov/dnav/pet/pet_move_impcus_a2_nus_ep00_im0_mbblpd_a.htm.
8 OPEC accounted for 28.9 percent of U.S. petroleum consumption in 2007. See EIA, “Monthly Energy Review,” supra, n. 3.
9 See EIA, “Petroleum Products: Consumption,” http://www.eia.doe.gov/neic/infosheets/petroleumproductsconsumption.html. According to the EIA, “Transportation use leads growth in liquid fuels consumption. U.S. consumption of liquid fuels—including fuels from petroleum-based sources and, increasingly, those derived from non-petroleum primary fuels such as coal, biomass, and natural gas—totals 22.8 million barrels per day in 2030 in the Annual Energy Outlook 2008. That is an increase of 2.1 million barrels per day over the 2006 total.… All of the increase is in the transportation sector, which accounts for 73 percent of total liquid fuels consumption in 2030, up from 68 percent in 2006” (ibid.). The EIA defines the transportation sector as follows: “An energy-consuming sector that consists of all vehicles whose primary purpose is transporting people and/or goods from one physical location to another. Included are automobiles; trucks; buses; motorcycles; trains, subways, and other rail vehicles; aircraft; and ships, barges, and other waterborne vehicles. Vehicles whose primary purpose is not transportation (e.g., construction cranes and bulldozers, farming vehicles, and warehouse tractors and forklifts) are classified in the sector of their primary use.” See EIA, “Glossary,” http://www.eia.doe.gov/glossary/glossary_t.htm.
10 See EIA, “Petroleum Products: Consumption,” supra, n. 9.
11 The EIA defines the industrial sector as follows: “An energy-consuming sector that consists of all facilities and equipment used for producing, processing, or assembling goods. The industrial sector encompasses
38

Energy and the E
nvironment: M
yths and FactsA
pril 2009
41 John Voelcker, “How Green Is My Plug-In?,” IEEE Spectrum, March 2009, http://spectrum.ieee.org/mar09/7928. “A non-profit organization, IEEE is the world’s leading professional association for the advancement of technology” (“About IEEE,” http://www.ieee.org/web/aboutus/home/index.html).
42 Voelcker, “How Green Is My Plug-In?.”
43 Ibid.
44 James Kliesch and Therese Langer, “Plug-In Hybrids: An Environmental and Economic Performance Outlook,” American Council for an Energy-Efficient Economy, September 2006,
http://www.aceee.org/store/proddetail.cfm?CFID=1941952&CFTOKEN=35186425&ItemID=418&CategoryID=7.
45 See “Environmental Assessment of Plug-In Hybrid Electric Vehicles, Volume 1: Nationwide Greenhouse Gas Emissions,” Electric Power Research Institute and National Resource Defense Council, July 2007,
http://mydocs.epri.com/docs/public/000000000001015325.pdf.
46 The White House, “Energy and the Environment,” http://www.whitehouse.gov/agenda/energy_and_environment. Specifically, the Obama administration’s New Energy for America plan calls for renewable energy sources to generate 25 percent of the nation’s electricity by 2025, an 80 percent reduction in greenhouse gases by 2050, and 1 million plug-in hybrids on our roads by 2015.
47 According to one projection, 100 megawatts of wind power supports 100–200 temporary construction jobs, yet just 6–10 permanent jobs. See Larry Flowers, “Wind Energy Update,” National Renewable Energy Laboratory, January 2009, http://www.eere.energy.gov/windandhydro/windpoweringamerica/pdfs/wpa/wpa_update.pdf, p. 24.
48 According to Robert Michaels and Robert P. Murphy of the Institute for Energy Research, “It is highly questionable whether a government campaign to spur ‘green jobs’ would have net economic benefits. Indeed, the distortionary impacts of government intrusion into energy markets could prematurely force business to abandon current production technologies for more expensive ones. Furthermore, there would likely be negative economic consequences from forcing higher-cost alternative energy sources upon the economy. These factors would likely increase consumer energy costs and the costs of a wide array of energy-intensive goods, slow GDP growth and ironically may yield no net job gains. More likely, they would result in net job losses” (Robert Michaels and Robert P. Murphy, “Green Jobs: Fact or Fiction?,” Institute for Energy Research, January 2009,
http://www.instituteforenergyresearch.org/green-jobs-fact-or-fiction).
“Even if the program creates jobs building bridges or windmills, it necessarily prevents other jobs from being created,” writes John Stossel. “This is because government spending merely diverts money from private projects to government projects. Governments create no wealth. They only move it around while taking a cut for their trouble. So any jobs created over here come at the expense of jobs that would have been created over there” (John Stossel, “The Fallacy of ‘Green Jobs,’ ” RealClearPolitics.com, September 10, 2008,
http://www.realclearpolitics.com/articles/2008/09/green_jobs.html).
Reason magazine’s Jacob Sullum says that government plans to create jobs simply amount to “wasteful spending that will divert resources from more productive uses and ultimately result in lower employment than would otherwise occur” (Jacob Sullum, “Obama’s Job Fetish,” Reason Online, October 22, 2008,
http://www.reason.com/news/show/129554.html).
49 The Wall Street Journal reports that the federal stimulus bill “will allow clean-energy companies to get federal support in the form of cash grants from the Energy Department, rather than credits to be used against taxable income. It also offers a wider range of tax credits for clean tech, especially wind power” (“Clean Energy: Congress Comes through for Clean Tech; Will Industry?,” Environmental Capital, Wall Street Journal, February 13, 2009, http://blogs.wsj.com/environmentalcapital/2009/02/13/clean-energy-congress-comes-through-for-clean-tech-will-industry).
50 See “Summary: American Recovery and Reinvestment,” U.S. House of Representatives Committee on Appropriations, February 13, 2009, http://appropriations.house.gov/pdf/PressSummary02-13-09.pdf.
51 See “Fiscal Year 2009 Budget in Brief,” U.S. Department of Energy Office of Energy Efficiency and Renewable Energy, http://www1.eere.energy.gov/ba/pba/pdfs/FY09_budget_brief.pdf.
39
30 EIA, “Table A8. Electricity Supply, Disposition, Prices, and Emissions,” supra, n. 24.
31 EIA, “Net Generation by Other Renewables: Total (All Sectors),” http://www.eia.doe.gov/cneaf/electricity/epm/table1_1_a.html.
32 EIA, “Year-by-Year Reference Case Tables (2006–2030)” (Tables 8 and 16), http://www.eia.doe.gov/oiaf/aeo/aeoref_tab.html.
33 EIA, “Table A8. Electricity Supply, Disposition, Prices, and Emissions,” supra, n. 24.
34 EIA, “How Much Renewable Energy Do We Use?,” supra, n. 27. “However, EIA projects renewable energy’s share of total worldwide electricity generation will decrease slightly: from 18 percent of generation in 2005 to 15 percent in 2030. Although worldwide renewable energy is expected to increase, it will be outpaced by growth in other electricity generation sources” (EIA, International Energy Outlook 2008 [Tables H7 and H12], June 2008). According to the EIA, “World electricity generation nearly doubles in the IEO2008 reference case from 2005 to 2030. In 2030, generation in the non-OECD countries is projected to exceed generation in the OECD countries by 46 percent. Over the next 25 years, the world will become increasingly dependent on electricity to meet its energy needs. Electricity is expected to remain the fastest-growing form of end-use energy worldwide through 2030, as it has been over the past several decades. Nearly one-half of the projected increase in energy consumption worldwide from 2005 to 2030 is attributed to electricity generation in the IEO2008 reference case. Since 1990, growth in net generation has outpaced the growth in total energy consumption (2.9 percent per year and 1.9 percent per year, respectively), and generation is expected to increase at an average annual rate of 2.6 percent through 2030 as the growth in demand for electricity continues to outpace growth in total energy use (Figure 52)” (EIA, International Energy Outlook 2008 [Chapter 5—Electricity], June 2008, http://www.eia.doe.gov/oiaf/ieo/electricity.html).
35 See Gilbert E. Metcalf, “Taxing Energy in the United States: Which Fuels Does the Tax Code Favor?,” Manhattan Institute, January 2009, http://www.manhattan-institute.org/html/eper_04.htm.
36 See EIA, “How Much Does the Federal Government Spend on Energy-Specific Subsidies and Support?,” http://tonto.eia.doe.gov/energy_in_brief/energy_subsidies.cfm. Robert J. Michaels, professor of economics at California State University, Fullerton, writes, “According to the U.S. Energy Information Administration, wind’s costs per kilowatt-hour hit bottom in 2002 and have since increased by 60 percent. In 2004, the levelized cost of a coal-fired kilowatt hour was 3.53 cents, compared to 4.31 cents for nuclear, 5.47 for gas and 5.7 for wind. According to a study by Gilbert Metcalf of Tufts University for the National Bureau of Economic Research, removing subsidies to nuclear and wind power takes the former to 5.94 cents and the latter to 6.64” (Robert J. Michaels, “Hot Air and Wind,” National Review Online, December 20, 2007,
http://article.nationalreview.com/?q=MTlhN2I4ZDhmZTg2N2NmM2EzNmExYTEwNWRjNzU3Mzk).
37 Hybrid cars are powered by electricity and either gasoline or diesel. Alternative-fuel vehicles include electric cars and cars that can run on natural gas or an E85 blend (85 percent ethanol / 15 percent gasoline). Hybrids are not considered AFVs, according to the Department of Energy. See EIA, “Table V1. Estimated Number of Alternative Fueled Vehicles in Use in the United States, by Fuel Type, 2003–2006,” May 2008,
http://www.eia.doe.gov/cneaf/alternate/page/atftables/afvtransfuel_II.html#inuse.
38 EIA estimates the following number of AFVs in use in the U.S. from 2003 through 2006: 533,999 (2003); 565,492 (2004); 592,125 (2005); 634,562 (2006). See EIA, “Table V1. Estimated Number of Alternative Fueled Vehicles in Use in the United States, by Fuel Type, 2003–2006,” supra, n. 38. “In 1997, some vehicle manufacturers began including E85-fueling capability in certain model lines of vehicles. For 2006, the EIA estimates that the number of E-85 vehicles that are capable of operating on E85, gasoline, or both, is about 6 million. Many of these alternative-fueled vehicles (AFVs) are sold and used as traditional gasoline-powered vehicles. In this table, AFVs in use include only those E85 vehicles believed to be used as AFVs. These are primarily fleet-operated vehicles” (ibid.).
39 See Bureau of Transportation Statistics, “Table 1-11: Number of U.S. Aircraft, Vehicles, Vessels, and Other Conveyances,” http://www.bts.gov/publications/national_transportation_statistics/html/table_01_11.html.
40 See “J. D. Power Sees Three-Fold Growth for Hybrids by 2015,” HybridCars.com, April 8, 2008, http://www.hybridcars.com/news/jd-power-forecasts-three-fold-growth-hybrids-and-diesels.html.
40
Energy and the E
nvironment: M
yths and FactsA
pril 2009
consuming technologies always rises, with or without new laws from Congress. Total consumption of primary fuels rises alongside. The historical facts are beyond dispute: When jet turbines, steam power plants and car engines were much less efficient than they are today, they consumed much less total energy, too” (Peter Huber, “The Efficiency Paradox,” Forbes, August 20, 2001, http://www.forbes.com/free_forbes/2001/0820/064.html).
64 See EIA, “History of Energy in the United States: 1635–2000,” Annual Energy Review 2007, http://www.eia.doe.gov/emeu/aer/eh/total.html. “The history of the twentieth century is one of gigantic increases in efficiency—and even larger increases in consumption. The American economy has experienced massive efficiency gains: for each unit of energy, we produce more than twice as much GDP today than we did in 1950. Yet during that period of time, our national total energy consumption has tripled. Paradoxically, when it comes to energy, the more we save, the more we consume” (Max Schulz, “Energy & the Environment: Myths & Facts,” Manhattan Institute, April 2007, http://www.manhattan-institute.org/pdf/Energy_and_Environment_Myths.pdf, p. 9).
65 See EIA, International Energy Outlook 2008, June 2008, http://www.eia.doe.gov/oiaf/ieo/highlights.html. The International Energy Agency says that world energy demand will increase 45 percent between now and 2030, an average annual increase of 1.6 percent. See IEA, World Energy Outlook 2008, http://www.iea.org/weo/2008.asp.
66 See EIA, Annual Energy Outlook 2009: Early Release Overview, http://www.eia.doe.gov/oiaf/aeo/index.html. For perspective, the United States consumed less than 32 quads in 1949. See EIA, “Primary Energy Consumption by Source, 1949–2007,” http://www.eia.doe.gov/aer/txt/ptb0103.html.
67 See Frank Clemente, “Energy Realities Facing the United States,” http://www.alec.org/am/pdf/nrtf/clemente.pdf.
68 The EIA defines the industrial sector as follows: “An energy-consuming sector that consists of all facilities and equipment used for producing, processing, or assembling goods. The industrial sector encompasses the following types of activity: manufacturing (NAICS codes 31–33); agriculture, forestry, fishing and hunting (NAICS code 11); mining, including oil and gas extraction (NAICS code 21); and construction (NAICS code 23). Overall energy use in this sector is largely for process heat and cooling and powering machinery, with lesser amounts used for facility heating, air conditioning, and lighting. Fossil fuels are also used as raw material inputs to manufactured products. Note: This sector includes generators that produce electricity and/or useful thermal output primarily to support the above-mentioned industrial activities.” See EIA, “Glossary,” supra, n. 9.
69 See EIA, “Glossary,” supra, n. 11. 9.
70 The EIA defines the residential sector as follows: “An energy-consuming sector that consists of living quarters for private households. Common uses of energy associated with this sector include space heating, water heating, air conditioning, lighting, refrigeration, cooking, and running a variety of other appliances. The residential sector excludes institutional living quarters. Note: Various EIA programs differ in sectoral coverage.” See EIA, “Glossary,” supra, n. 9.
71 The EIA defines the transportation sector as follows: “An energy-consuming sector that consists of all vehicles whose primary purpose is transporting people and/or goods from one physical location to another. Included are automobiles; trucks; buses; motorcycles; trains, subways, and other rail vehicles; aircraft; and ships, barges, and other waterborne vehicles. Vehicles whose primary purpose is not transportation (e.g., construction cranes and bulldozers, farming vehicles, and warehouse tractors and forklifts) are classified in the sector of their primary use.” See EIA, “Glossary,” supra, n. 9.
72 See EIA, “Energy Consumption by Sector,” Annual Energy Review 2007, http://www.eia.doe.gov/aer/pdf/pages/sec2.pdf. 73 “Municipal Solid Waste in the United States: 2007 Facts and Figures,” United States Environmental Protection
Agency, Office of Solid Waste, November 2008, http://www.epa.gov/osw/nonhaz/municipal/pubs/msw07-rpt.pdf, p. 14. According to Clemson University professor Daniel K. Benjamin, in the mid-1990s, nationwide landfill capacity stood at about fourteen years and rose to more than eighteen years by 2001. See Daniel K. Benjamin, “Eight Great Myths of Recycling,” Property and Environment Research Center, PERC Policy Series no. PS-28 (September 2003), http://www.perc.org/pdf/ps28.pdf. Professor Benjamin, who says that the United States has more landfill capacity than ever before, contends that the total space required to contain all of the country’s garbage for the next hundred years is just ten square miles.
52 Analyzing effective tax rates—which are used to calculate what energy-related investments will return after taxes, taking into account subsidies for such investments—Tufts economist Gilbert Metcalf finds that solar energy and wind energy are the most heavily subsidized energy technologies, with effective subsidy rates of 245 and 164 percent, respectively. See Metcalf, “Taxing Energy in the United States: Which Fuels Does the Tax Code Favor?.” According to the EIA, in 2007, wind energy received $724 million in federal subsidies, valued at $23.37 per megawatt hour (MWh) of wind-generated electricity, while solar energy took in $174 million, at a subsidy-per-MWh value of $24.34. Coal received a subsidy of 44 cents per MWh, natural gas and petroleum liquids received 25 cents each, hydroelectric energy received 67 cents, and nuclear power grabbed $1.59. See EIA, “How Much Does the Federal Government Spend on Energy-Specific Subsidies and Support?,” supra, n. 37.
53 The New York Times reports that ethanol plants “are shutting down virtually every week.” According to the Times, “Bob Dinneen, president of the Renewable Fuels Association, a trade group, estimated that of the country’s 150 ethanol companies and 180 plants, 10 or more companies have shut down 24 plants over the last three months. That has idled about 2 billion gallons out of 12.5 billion gallons of annual production capacity. Mr. Dinneen estimated that a dozen more companies were in distress” (Clifford Krauss, “Ethanol, Just Recently a Savior, Is Struggling,” New York Times, February 11, 2009, http://www.nytimes.com/2009/02/12/business/12ethanol.html?_r=1&emc=eta1).
54 “Creating millions of green-collar jobs, via legislative mandates and taxpayer-funded subsidies, will require trillions of dollars (and vast mineral resources) to dismantle an existing infrastructure that works—and replace it with one that is mostly experimental. It will pink-slip tens of millions of direct and indirect jobs that depend on abundant, reliable, affordable energy from hydrocarbon and nuclear power” (Paul Driessen, “Green-Collar Jobs—or Con Jobs?,” Science and Public Policy Institute Commentary and Essay series, February 6, 2009,
http://scienceandpublicpolicy.org/images/stories/papers/commentaries/green_collar_or_con_jobs.pdf). “If you throw enough tax subsidies at something, you’re bound to get some new jobs. But if the money for those subsidies comes from higher energy taxes—and a cap and trade regime would amount to as much $1.2 trillion of new taxes—millions of jobs in carbon-using industry are also going to be lost” (“The ‘Green Jobs’ Myth,” Wall Street Journal Europe, December 9, 2008, http://online.wsj.com/article/SB122886086448792609.html).
55 One credit would represent the right to emit one metric ton of carbon dioxide.
56 See “A New Era of Responsibility,” White House Office of Management and Budget, http://i.cdn.turner.com/cnn/2009/images/02/26/fy10.budget.pdf, p. 21.
57 See Stephen Power, “Carbon Trading to Raise Consumer Energy Prices,” Wall Street Journal, February 27, 2009, http://online.wsj.com/article/SB123566843777484625.html?mod.
58 Testifying before the U.S. Senate Committee on Environment and Public Works, Kenneth Green of the American Enterprise Institute commented on whether initiatives to combat carbon emissions, such as cap-and-trade regimes, would create “green jobs”: “The short answer, I would say, is that they might do so, but only at the expense of other jobs that would otherwise have been produced by the free market. Further, I’d suggest that the end result would be significantly less jobs on net, less overall economic growth on net, and most likely, the loss of existing capital as a by-product.… Because the market is superior at efficiently identifying and providing what people want than are planners, it is virtually certain that the lost jobs in any regulatory scenario will outnumber the created jobs in a regulatory scenario” (testimony of Kenneth P. Green, September 25, 2007,
http://www.aei.org/publications/pubID.26871,filter.all/pub_detail.asp).
59 “Oil & Gas Employment,” Independent Petroleum Association of America, http://www.ipaa.org/reports/industrystats/usps/usps.asp?Table=Chart18.
60 EIA, “Coal Mining Productivity by State and Mine Type” (Table 21), September 2008, http://www.eia.doe.gov/cneaf/coal/page/acr/table21.html.61 See EIA, “Figure ES 1. US Electric Power Industry Net Generation, 2007,” supra, n. 25.
62 Peter Huber and Mark Mills, The Bottomless Well (New York: Basic Books, 2005), p. 112.
63 Ibid., p. 123. Huber states: “Collectively, combustion engines burn about 80% of all the thermal energy we use in the U.S. But the total amount of fuel they burn has risen right alongside their efficiency.… The efficiency of energy-
41 42
Energy and the E
nvironment: M
yths and FactsA
pril 2009
83 A 2007 ruling by the United States Supreme Court (Massachusetts v. EPA) opened the door for the Environmental Protection Agency to regulate emissions of carbon dioxide. Though carbon dioxide traditionally has not been considered a conventional pollutant harmful to human health, the Court, in a 5-4 decision, found that the EPA has the authority, under the Clean Air Act, to regulate carbon-dioxide emissions. Regardless of whether carbon emissions are ultimately regulated by the EPA, pollution—in the traditional sense of the word—has declined steadily in the U.S. for decades.
84 “For example, sulfur dioxide, which results mainly from the burning of coal and the smelting of some metals, is down 63 percent, while carbon monoxide, the vast majority of which comes from automobiles, is down 74 percent. At the same time, coal usage increased more than 60 percent and miles of driving nearly doubled” (Joel Schwartz, “Blue Skies, High Anxiety,” The American, May/June 2007, http://www.american.com/archive/2007/may-june-magazine-contents/blue-skies-high-anxiety). According to Schwartz, “Virtually the entire nation now meets federal standards for sulfur dioxide, carbon monoxide, nitrogen dioxide, and lead. The country is also near full compliance for the U.S. Environmental Protection Agency’s older standards for ozone (the “one-hour” standard) and particulate matter (the “PM10” standard for airborne particulate matter less than ten micrometers in diameter).”
85 Ibid.
86 James Taylor, “Easterbrook Rebuts New York Times on Bush Clean Air Policy,” Environment & Climate News, July 2004, http://www.heartland.org/policybot/results.html?artId=15263. Easterbrook notes that air pollution stands at half as much, per capita, as in 1970, noting that “[p]articulate emissions have declined 14 percent in the last decade. Acid rain emissions from power plants have fallen 41 percent since 1980 and have fallen 9 percent since Bush’s election. Nitrogen oxide emissions from power plants have declined 33 percent since 1990.”
87 “National Air Quality Status and Trends through 2007” (Air Pollution), Environmental Protection Agency, http://www.epa.gov/air/airtrends/2008/report/AirPollution.pdf. See also “National Air Quality Status and Trends
through 2007” (Six Common Pollutants), Environmental Protection Agency, http://www.epa.gov/air/airtrends/2008/report/SixCommonPollutants.pdf.
88 See Gregg Easterbrook, The Progress Paradox: How Life Gets Better While People Feel Worse (New York: Random House, 2004), p. 42.
89 Schwartz, “Blue Skies, High Anxiety”: “Pittsburgh reduced particulate levels by more than 75 percent between the early 1900s and 1970. Chicago, Cincinnati, and New York all have records going back to the 1930s or 1940s showing large reductions in smoke levels.”
90 In a similar survey conducted in 2006, almost 45 percent of respondents were “not sure” how many people were killed as a result of the meltdown at Three Mile Island. Roughly one in six respondents correctly identified that the accident resulted in no fatalities. Nearly 12 percent thought that more than one hundred people died, while almost 10 percent put the figure at twenty-seven deaths. See Schulz, “Energy & the Environment.”
91 “Backgrounder on Emergency Preparedness at Nuclear Power Plants,” United States Nuclear Regulatory Commission, http://www.nrc.gov/reading-rm/doc-collections/fact-sheets/emerg-plan-prep-nuc-power-bg.html.
92 Patrick Moore, “Going Nuclear: A Green Makes the Case,” April 16, 2006, Washington Post, http://www.washingtonpost.com/wp-dyn/content/article/2006/04/14/AR2006041401209_pf.html.
93 “Nuclear Power and the Environment,” Environmental Protection Agency, http://www.eia.doe.gov/kids/energyfacts/sources/non-renewable/nuclear.html#Environment.
94 See EIA, “Frequently Asked Questions—Electricity,” http://tonto.eia.doe.gov/ask/electricity_faqs.asp.
95 For more on the storage of used nuclear fuel, see “Fact Sheet on Storage of Spent Nuclear Fuel,” United States Nuclear Regulatory Commission, http://www.nrc.gov/reading-rm/doc-collections/fact-sheets/storage-spent-fuel-fs.html; “Nuclear Waste Storage,” Nuclear Energy Institute, http://www.nei.org/keyissues/nuclearwastedisposal; “Radioactive Wastes: Myths and Realities,” World Nuclear Association, June 2006, http://www.world-nuclear.org/info/inf103.html; and Bernard Cohen, “Examining Risks of Nuclear Waste Disposal,” Marshall Institute, June 24, 2008, http://www.marshall.org/pdf/materials/590.pdf.
96 William Tucker, “Going Nuclear: A Memo to John McCain,” National Review Online, October 15, 2008, http://article.nationalreview.com/?q=ZDIwMjVjMTIyZTQ1NTJhNjM1YzFmZmFmNWVkNDA4ZjE.
See James Thayer, “Recycle This!,” The Weekly Standard, January 26, 2006, http://www.weeklystandard.com/Content/Public/Articles/000/000/006/603wxcce.asp?pg=2. Professor Benjamin
writes, “Various authors have calculated just how much space it would take to accommodate America’s garbage. The answer is: not much. If we permitted the rubbish to reach the height it did at New York’s Fresh Kills site (255 feet), a landfill that would hold all of America’s garbage for the next century would be only about 10 miles on a side.… To be more colorful, Ted Turner’s Flying D ranch outside Bozeman, Montana, could handle all of America’s trash for the next century—with 50,000 acres left over for his bison” (Benjamin, “Eight Great Myths of Recycling”).
In 1990, “A. Clark Wiseman of Gonzaga University pointed out that, given projected waste increases, we would still be able to fit the next 1,000 years of trash in a single landfill 120 feet deep, with 44-mile sides. Wiseman’s point is clear: land disposal needs are small compared to the available land in the three million square miles of the contiguous United States” (Angela Logomasini, “Solid and Hazardous Waste,” Competitive Enterprise Institute, http://cei.org/pdf/2346.pdf, p. 185, citing A. Clark Wiseman, U.S. Wastepaper Recycling Policies: Issues and Effects [Washington, D.C.: Resources for the Future, August 1990], p. 2).
74 This figure includes composted waste. “In 2007, Americans generated about 254 million tons of trash and recycled and composted 85 million tons of this material, equivalent to a 33.4 percent recycling rate” (“Municipal Solid Waste Generation, Recycling, and Disposal in the United States: Facts and Figures for 2007,” U.S. Environmental Protection Agency, http://www.epa.gov/epawaste/nonhaz/municipal/pubs/msw07-fs.pdf).
75 Recycling is not always what is best for the environment, given the amount of energy required during the recycling process. In fact, says Peter Huber, “Recycling brings more pollution to the city to collect sorted trash, pollutes more water to remove ink from newsprint.… Most of the time, the best thing to do with our copious wastes is to bury them. With rare exceptions recycling is the worst possible option” (Peter Huber, Hard Green: Saving the Environment from the Environmentalists [New York: Basic Books, 1999], pp. 33 and 114).
76 “Landfills,” Environmental Literacy Council, http://www.enviroliteracy.org/article.php/63.html.
77 “National Report on Sustainable Forests—2010 (Draft),” United States Department of Agriculture, December 8, 2008, http://www.fs.fed.us/research/sustain/2010SustainabilityReport/documents/draft2010sustainabilityreport.pdf.
78 The Industrial Revolution brought about advances in agricultural production, namely through the mechanization of farming and chemical advancements and the displacement of wood by steel and other metals. As a result, farmers were able to get greater crop yields from equal or less space. Fewer trees needed to be cleared, and the deforestation that characterized preindustrial years was halted during the twentieth century. Says Peter Huber, “For the first time in history, a Western civilization has halted, and then reversed, the decline of its woodlands” (Huber, Hard Green, p. 101).
79 “National Report on Sustainable Forests—2010 (Draft),” supra, n. 85. The same conclusion was reported in a 2002 report from the USDA’s Forest Service, which “the total area of forest land has been fairly stable for nearly 100 years” (W. Brad Smith et al., “Forest Resources of the United States, 2002,” U.S. Department of Agriculture Forest Service, http://nrs.fs.fed.us/pubs/gtr/gtr_nc241.pdf, p. 1). According to the 2002 report, U.S. forests covered 749 million acres.
80 “Global Forest Resources Assessment 2005,” Food and Agriculture Organization of the United Nations, Rome, 2006, ftp://ftp.fao.org/docrep/fao/008/A0400E/A0400E00.pdf, pp. 16 and 21. The Western Wood Products Association states: “U.S. lumber demand is expected to finish 2008 at 40.9 billion board feet, the third consecutive annual decline in demand and 36 percent below the 2005 peak. For 2009, lumber demand is forecast to fall to 35 billion board feet, the lowest annual consumption since 1982” (“Lumber Forecast Revised Downward Due to Weak Housing Market, Economy,” Western Wood Products Association press release, January 6, 2009, http://www2.wwpa.org/ABOUTWWPA/Newsroom/tabid/817/Default.aspx).
81 “Forest Resources of the United States, 2007” (WO-GTR-78), United States Department of Agriculture Forest Service, 2008 (in draft), Table 3: Forest area in the United States by region, subregion, and State, 2007, 1997, 1987, 1977, 1953, 1938, 1920, 1907, and 1630.
82 “Understanding the Clean Air Act,” Environmental Protection Agency, http://www.epa.gov/air/caa/peg/understand.html.
43 44

Energy and the E
nvironment: M
yths and FactsA
pril 2009
oil handled for OCS pipeline spills greater than or equal to 1,000 barrels. According to the authors, eleven platform spills (crude oil, condensate, or diesel) and sixteen pipeline spills (crude oil or condensate) greater than or equal to 1,000 barrels occurred in the OCS between 1964 through 1999, while total production was estimated to be 12 billion barrels of crude oil and condensate during the same period. Worldwide, from 1974 through 1999, there were 278 crude-oil spills greater than or equal to1,000 barrels from self-propelled crude-oil carriers, while an estimated 239.67 billion barrels of crude oil moved worldwide during the same period. Forty-six crude-oil tanker spills greater than or equal to 1,000 barrels occurred in U.S. coastal and offshore waters (including U.S. territorial waters) from 1974 to 1999, while tankers moved an estimated 44.5 billion barrels of oil in U.S. waters during the same period.
108 See “Oil in the Sea III: Inputs, Fates and Effects,” National Academies’ National Research Council, http://www.nap.edu/catalog.php?record_id=10388. The report reveals that, of the 76 million gallons of oil that
enter North American ocean waters each year, 47 million gallons (or 62 percent) seep into the waters naturally from the ocean floor. According to the National Oceanic and Atmospheric Administration: “Apart from oil spills caused by human actions, oil also is released into the environment from natural oil seeps in the ocean bottom. One of the best-known areas where this happens is Coal Oil Point along the California Coast near Santa Barbara. An estimated 2,000 to 3,000 gallons of crude oil are released naturally from the ocean bottom every day just a few miles offshore from this beach.”
A study by the University of California Energy Institute reports that, during the 1990s, “natural seeps annually emitted an estimated 600,000 tons of oil into the ocean, approximately half the annual total (1,300,000 tons) entering the ocean. By comparison, spills from marine vessels accounted for 100,000 tons, terrestrial run-off 140,000 tons, and pipelines just 12,000 tons. In North America, seeps emit an estimate of 160,000 tons per year” (Ira Leifer, Jim Boles, and Bruce Luyendyk, “Measurements of Oil and Gas Emissions from a Marine Seep,” University of California Energy Institute, January 2007, http://repositories.cdlib.org/cgi/viewcontent.cgi?article=1037&context=ucei).
“Twice an Exxon Valdez spill worth of oil seeps into the Gulf of Mexico every year, according to a new study.… But the oil isn’t destroying habitats or wiping out ocean life. The ooze is a natural phenomena that’s been going on for many thousands of years,” according to Roger Mitchell, vice president of program development at the Earth Satellite Corporation (EarthSat) in Rockville, Maryland. “The wildlife have adapted and evolved and have no problem dealing with the oil” (Roger Mitchell, “Tons of Oil Seeps into Gulf of Mexico Each Year,” Earth Observatory, NASA, http://earthobservatory.nasa.gov/Newsroom/view.php?old=200001261633).
A joint NASA/Smithsonian study found the following amounts (in millions of gallons) of oil enter the oceans, world-wide, each year: runoff from land and municipal and industrial wastes: 363; routine maintenance: 137; hydrocarbons from air pollution, chiefly from cars and industry: 92; natural ocean-floor seepage: 62; major tanker accident/spills: 37; and offshore drilling: 15. See http://seawifs.gsfc.nasa.gov/OCEAN_PLANET/HTML/peril_oil_pollution.html.
Referring to the joint study, the Wall Street Journal states: “A joint study by NASA and the Smithsonian Institution, examining several decades’ worth of data, found that more oil seeps into the ocean naturally than from accidents involving tankers and offshore drilling. Natural seepage from underwater oil deposits leaks an average of 62 million gallons a year; offshore drilling, on the other hand, accounted for only 15 million gallons, the smallest source of oil leaking into the oceans. The vast majority of the oil that finds its way into the sea comes from dry land, NASA found. Runoff from cities, roads, industrial sites and garages deposits 363 million gallons into the sea, making runoff by far the single largest source of oil pollution in the oceans. ‘Every year oily road runoff from a city of 5 million could contain as much oil as one large tanker spill,’ notes the Smithsonian exhibit, ‘Ocean Planet.’ The second-largest source of ocean oil pollution was routine ship maintenance, accountable for 137 million gallons a year, NASA found—more than 2.5 times the amount that comes from tanker spills and offshore drilling combined. But no one is proposing that we ban cargo and cruise ships” (Andrew Cline, “Environmentalists Say Yes to Offshore Drilling,” Wall Street Journal, July 12, 2008,
http://online.wsj.com/article/SB121581714417147413.html).
109 See “Oil and Gas Seepage from Ocean Floor Reduced by Oil Production,” University of California, Santa Barbara, press release, November 18, 1999, http://www.ia.ucsb.edu/pa/display.aspx?pkey=412. For more information on California oil seeps, see “Stop Oil Seeps California,” http://www.soscalifornia.com.
110 Minerals Management Service, “Hurricane Katrina and Rita Research,” http://www.mms.gov/tarprojectcategories/hurricaneKatrinaRita.htm.
97 “Used nuclear fuel is stored at the nation’s nuclear power plants in steel-lined, concrete vaults filled with water or in massive, airtight steel or concrete-and-steel canisters” (“Storage of Used Nuclear Fuel,” Nuclear Energy Institute, http://www.nei.org/keyissues/nuclearwastedisposal/storageofusednuclearfuel).
98 “The Yucca Mountain program will be scaled back to those costs necessary to answer inquiries from the Nuclear Regulatory Commission, while the Administration devises a new strategy toward nuclear waste disposal” (“A New Era of Responsibility,” White House Office of Management and Budget,
http://i.cdn.turner.com/cnn/2009/images/02/26/fy10.budget.pdf, p. 65).
99 See Anthony Andrews, “Nuclear Fuel Reprocessing: U.S. Policy Development,” Congressional Research Service, http://www.fas.org/sgp/crs/nuke/RS22542.pdf.
100 Tucker, “Going Nuclear”: Ninety-five percent of a spent fuel rod is U-238—the same natural uranium that comes out of the ground. We could just put it back where it came from.… So why do we need Yucca Mountain, a huge repository designed to ‘bury’ 77,000 tons of ‘nuclear waste,’ when 95 percent of the material is non-fissioning natural uranium?... Instead of treating it in an environmentally efficient way and recycling, we ended up with huge, mixed-up gobs of material that we can’t think of anything to do with except ‘throw it away.’ ”
101 Moore, “Going Nuclear”: “Within 40 years, used fuel has less than one-thousandth of the radioactivity it had when it was removed from the reactor.”
102 See EIA, “Offshore—Petroleum and Natural Gas Production,” http://www.eia.doe.gov/kids/energyfacts/sources/non-renewable/offshore.html. According to the United States Minerals Management Service, the approximately 43 million leased acres of the Outer Continental Shelf account for about 15 percent of America’s domestic natural gas production and about 27 percent of America’s domestic oil production. See “Offshore Energy & Minerals Management (OEMM),” Minerals Management Service, http://www.mms.gov/offshore.
103 See EIA, “Offshore Petroleum and Natural Gas,” http://www.eia.doe.gov/kids/energyfacts/sources/non-renewable/offshore.html#oilgas. See also Minerals
Management Service, “What About an Oil Spill?,” http://www.gomr.mms.gov/homepg/offshore/egom/spill.html.
104 “State jurisdiction is defined as follows: Texas and the Gulf coast of Florida are extended 3 marine leagues (approximately 9 nautical miles) seaward from the baseline from which the breadth of the territorial sea is measured. Louisiana is extended 3 imperial nautical miles (imperial nautical mile = 6080.2 feet) seaward of the baseline from which the breadth of the territorial sea is measured. All other States’ seaward limits are extended 3 nautical miles (approximately 3.3 statute miles) seaward of the baseline from which the breadth of the territorial seaward is measured” (Minerals Management Service, “What Is the Outer Continental Shelf?,”
http://www.gomr.mms.gov/homepg/whoismms/whatsocs.html).
105 See “ ‘Snake Oil’: Debunking Three ‘Truths’ about Offshore Drilling,” editorial, Washington Post, August 12, 2008, http://www.washingtonpost.com/wp-dyn/content/article/2008/08/11/AR2008081102145.html. For more on drilling safety, see Minerals Management Service, “Safety and Oil Spill Research,”
http://www.mms.gov/offshore/SafetyandOilSpillResearch.htm.
106 The MMS is the United States Department of the Interior bureau that manages the nation’s natural gas, oil and other mineral resources on the Outer Continental Shelf.
107 See Cheryl McMahon Anderson and Robert P. Labelle, “Update of Comparative Occurrence Rates for Offshore Oil Spills,” U.S. Minerals Management Service, Spill Science & Technology Bulletin 6, nos. 5–6 (2000): 303–21, http://www.mms.gov/eppd/sciences/osmp/pdfs/AndersonAndLaBelle/AndersonAndLaBelle2000.pdf. According to the authors: Overall OCS platform spill occurrence rates continued to decline; OCS pipeline spill occurrence rates for spills greater than or equal to 1,000 barrels remained essentially unchanged; OCS pipeline spill occurrence rates for spills greater than or equal to 10,000 barrels decreased significantly; and worldwide tanker spill rates, rates for tanker spills in U.S. waters, and barge spills in U.S. waters decreased significantly.
Specifically, for the years 1964–99, the authors calculated the following oil-spill rates: (1) 0.32 spills per billion barrels of oil handled for OCS platform spills greater than or equal to 1,000 barrels; (2) 0.12 spills per billion barrels of oil handled for OCS platform spills greater than or equal to 10,000 barrels; and (3) 1.33 spills per billion barrels of
45 46
Energy and the E
nvironment: M
yths and FactsA
pril 2009
use change and variations in data quality, likely add up to a net warming bias in climate data, suggesting an overstatement of the rate of global warming over land” (Ross R. McKitrick and Patrick J. Michaels, “Quantifying the Influence of Anthropogenic Surface Processes and Inhomogeneities on Gridded Global Climate Data,” Journal of Geophysical Research [2007], http://www.agu.org/pubs/crossref/2007/2007JD008465.shtml).
For more on effects on temperature readings from urbanization and land-use changes, see S. Fred Singer and Dennis T. Avery, Unstoppable Global Warming: Every 1,500 Years (Lanham, Md.: Rowman & Littlefield, 2007), pp. 142–45. “Satellite and weather balloon temperature records show a very small warming trend during the past 27 and 50 years, respectively, far lower than what the models predict. The satellite and weather balloon data are real and are known to be accurate” (Singer and Avery, Unstoppable Global Warming, p. 148).
124 John Tierney, “Politics in the Guise of Pure Science,” New York Times, February 23, 2009, http://www.nytimes.com/2009/02/24/science/24tier.html?_r=1&emc=eta1.
125 “Climate Change 2007: Synthesis Report,” supra, n. 122. For a critique of the IPCC’s forecasting methods, see “Climate Issues & Questions,” 3rd ed., George C. Marshall Institute, http://www.marshall.org/pdf/materials/577.pdf.
126 Carbon dioxide is a minor greenhouse gas. According to Greenpeace International, methane is 23 times more powerful a greenhouse gas, in terms of its heat-trapping potential, than carbon dioxide; nitrous oxide is 296 times more powerful; hydrofluorocarbons are up to 20,000 times more powerful; perfluorocarbons are 5,700 to 10,000 times more powerful; and sulfur hexafluoride is 23,900 times more powerful. See Greenpeace International, “Other Gases,” http://www.greenpeace.org/international/campaigns/climate-change/science/other_gases.
127 Though greenhouse gases are routinely viewed negatively, “If it were not for naturally occurring greenhouse gases, the Earth would be too cold to support life as we know it. Without the greenhouse effect, the average temperature of the Earth would be about -2 degrees Fahrenheit rather than the +57 degrees Fahrenheit we currently experience” (EIA, “What Are Greenhouse Gases and How Much Are Emitted by the United States?,”
http://tonto.eia.doe.gov/energy_in_brief/greenhouse_gas.cfm).
128 See EIA, “Greenhouse Gases, Climate Change, and Energy,” May 2008, http://www.eia.doe.gov/bookshelf/brochures/greenhouse/Chapter1.htm.
129 See “Climate Change 2007: Synthesis Report,” supra, n. 122.
130 See Roy Spencer, “Global Warming: Natural or Man-Made?,” http://www.drroyspencer.com/global-warming-natural-or-manmade.
131 David J. C. MacKay, Sustainable Energy—Without the Hot Air (Cambridge: UIT, 2008), http://www.withouthotair.com/download.html. See also “Carbon Dioxide,” Atmosphere, Climate & Environment Information Programme, http://www.ace.mmu.ac.uk/Resources/Teaching_Packs/Key_Stage_4/Climate_Change/02p.html.
132 See Jeffrey Ball, “Green Goal of ‘Carbon Neutrality’ Hits Limit,” Wall Street Journal, December 30, 2008, http://online.wsj.com/article/SB123059880241541259-email.html.
133 See Christopher Joyce, “Carbon Offsets: Government Warns of Fraud Risk,” All Things Considered (National Public Radio), January 3, 2008, http://www.npr.org/templates/story/story.php?storyId=17814838. See also “Another Inconvenient Truth: Behind the Feel-Good Hype of Carbon Offsets, Some of the Deals Don’t Deliver,” Business Week, March 26, 2007, http://www.businessweek.com/magazine/content/07_13/b4027057.htm. “According to the World Bank, global trades in this market in 2007 were valued at more than $64 billion, more than doubling since 2006. Skip Willis, president and CEO of Carbon Capital Management, a Toronto-based ‘carbon monetization’ corporation, predicts that by the end of 2008 the global carbon trading system will have topped $100 billion. ‘This is a market that barely existed five years ago,’ Willis says” (Jennifer Barone, “Carbon Trading: Environmental Godsend or Giant Shell Game?,” Discover magazine, December 3, 2008,
http://discovermagazine.com/2008/dec/03-big-business-of-carbon-trading).
134 See Barone, “Carbon Trading.”
135 “The Kyoto signatories agreed to exempt developing countries from pollution limits. That has amounted to 139 nations” (Alan Zarembo, “Kyoto’s Failures Haunt New U.N. talks,” Los Angeles Times, December 3, 2007,
111 According to the United Nations Intergovernmental Panel on Climate Change, the Earth’s surface temperature increased 0.6 degree Celsius during the period 1860–2000. See “Climate Change 2001: The Scientific Basis” (WG1—Technical Summary, B.1 Observed Changes in Temperature), United Nations Intergovernmental Panel on Climate Change, http://www.ipcc.ch/ipccreports/tar/vol4/english/082.htm#b1.
112 See Francis W. Zwiers and Andrew J. Weaver, “Climate Change: The Causes of 20th Century Warming,” Science, December 15, 2000, http://www.sciencemag.org/cgi/content/summary/290/5499/2081. More recently, satellite data reveal a pause and subsequent reversal in rising temperatures. See Roy Spencer, “UAH Globally Averaged Satellite-Based Temperature of the Lower Troposphere (January 1979—January 2009),” http://www.drroyspencer.com/latest-global-temperatures. “All four major global temperature tracking outlets (Hadley, NASA’s GISS, UAH, RSS) have released updated data. All show that over the past year [2007], global temperatures have dropped precipitously.… The total amount of cooling ranges from 0.65C up to 0.75C.… For all four sources, it’s the single fastest temperature change ever recorded, either up or down” (Michael Asher, “Temperature Monitors Report Wide-Scale Global Cooling,” DailyTech, February 26, 2008,
http://www.dailytech.com/Temperature+Monitors+Report+Worldwide+Global+Cooling/article10866.htm).
113 See Spencer, “UAH Globally Averaged Satellite-Based Temperature of the Lower Troposphere.” See also “Feb 2008—Jan 2009 Divisional Ranks,” National Climatic Data Center/NESDIS/NOAA,
http://www.ncdc.noaa.gov/img/climate/research/2009/jan/02_01_2009_DvTempRank_pg.gif.
114 “Climate Change 2007: Synthesis Report” (Summary for Policymakers), United Nations Intergovernmental Panel on Climate Change, http://www.ipcc.ch/pdf/assessment-report/ar4/syr/ar4_syr_spm.pdf, p. 2.
115 “Climate Change 2001: Synthesis Report,” United Nations Intergovernmental Panel on Climate Change, http://www.ipcc.ch/ipccreports/tar/vol4/english/075.htm.
116 “Is Recent Climate Change Unusual in a Geological Context?,” Australian Greenhouse Office, Department of the Environment and Heritage, April 2005, http://www.climatechange.gov.au/science/hottopics/pubs/topic5.pdf.
117 See William J. Broad, “From a Rapt Audience, a Call to Cool the Hype,” New York Times, March 13, 2007, http://www.nytimes.com/2007/03/13/science/13gore.html?_r=1&ref=science.
118 See “Challenge to Scientific Consensus on Global Warming: Analysis Finds Hundreds of Scientists Have Published Evidence Countering Man-Made Global Warming Fears,” Center for Global Food Issues (press release), September 12, 2007, http://www.cgfi.org/2007/09/12/challenge-to-scientific-consensus-on-global-warming-analysis-finds-hundreds-of-scientists-have-published-evidence-countering-man-made-global-warming-fears.
119 See Craig Loehle, “A 2000-Year Global Temperature Reconstruction Based on Non-Treering Proxies,” Energy & Environment 18, nos. 7–8 (November 2007): 1049–58, http://www.ncasi.org/publications/Detail.aspx?id=3025. On the other hand, the EPA cites a 2006 study by the National Research Council finding that “temperatures at many, but not all, individual locations were higher during the past 25 years than any period of comparable length since A.D. 900. However, uncertainties associated with this statement increase substantially backward in time” (“Past Climate Change,” U.S. EPA, http://www.epa.gov/climatechange/science/pastcc.html).
120 See U.S. EPA, “Past Climate Change.”
121 “Surface Temperature Reconstructions for the Last 2,000 Years,” National Research Council, 2006, http://books.nap.edu/catalog.php?record_id=11676.
122 U.S. EPA, “Past Climate Change.” Richard Lindzen, Alfred P. Sloan Professor of Atmospheric Science at the Massachusetts Institute of Technology, writes that “the Earth and its climate are dynamic; they are always changing,” adding that “we do not understand the natural internal variability of climate change” (Richard Lindzen, “Don’t Believe the Hype,” Wall Street Journal, July 2, 2006, http://www.opinionjournal.com/extra/?id=110008597).
123 Even the issue of how much the climate has changed is unsettled. Temperature tracking is not done uniformly, temperature monitors can be influenced by land-use changes and by their placement in urban “heat islands,” and satellite data have only been around for three decades, providing just a snapshot from a limited time frame. Ross R. McKitrick and Patrick J. Michaels write that “nonclimatic factors, such as those related to land
47 48
http://articles.latimes.com/2007/dec/03/science/sci-kyoto3).
136 See Bjørn Lomborg, “Chill Out,” Washington Post, October 7, 2007, http://www.washingtonpost.com/wp-dyn/content/article/2007/10/05/AR2007100501676.html.
137 See EIA, International Energy Outlook 2008 (Chapter 7—Energy-Related Carbon Dioxide Emissions), June 2008, http://www.eia.doe.gov/oiaf/ieo/emissions.html. According to the International Energy Agency, “Three-quarters of the projected increase in energy-related CO2 emissions arises in China, India and the Middle East, and 97% in non-OECD countries as a whole” (“World Energy Outlook 2008 Fact Sheet: Global Energy Trends,” http://www.worldenergyoutlook.org/docs/weo2008/fact_sheets_08.pdf).
138 See EIA, “International Emissions Data: Energy-Related Carbon Emissions: Total Emissions,” http://www.eia.doe.gov/environment.html.
139 See Elisabeth Rosenthal, “China Increases Lead as Biggest Carbon Dioxide Emitter,” New York Times, June 14, 2008, http://www.nytimes.com/2008/06/14/world/asia/14china.html.
140 See supra, n. 145. In the Los Angeles Times, Alan Zarembo states that the nine countries with the fastest-growing carbon-dioxide emissions are in the developing world and that ten developing countries accounted for 75 percent of the growth in worldwide carbon-dioxide emissions between 1990 and 2005. “China’s emissions grew 138% over that period, catching up to U.S. levels and setting a pace to double them in less than a decade” (Zarembo, “Kyoto’s Failures Haunt New U.N. Talks”).
141 “Australia is the latest place to question the idea that climate-change legislation will be a free lunch, or nearly so. In a report commissioned by the Australian parliament, independent consultants found that the government’s optimistic cost estimates for climate-change legislation suffer from loads of flaws, from the future cost of energy to the ease at which industries can adapt to a low-carbon future. That means that the official line could be underestimating the costs of curbing emissions and overstating its benefits … regardless of what governments are saying, reducing economy-wide carbon emissions will almost certainly not be quick, cheap, or easy. Which makes an honest tallying of the costs and benefits all the more necessary to make climate policy work” (Keith Johnson, “Green Dreams: Australia’s and California’s Rosy Climate Visions Come Under Attack,” Environmental Capital [Wall Street Journal], February 2, 2009, http://blogs.wsj.com/environmentalcapital/2009/02/02/green-dreams-australias-and-californias-rosy-climate-visions-come-under-attack).
142 See Myth #3 for more on projected costs of the Lieberman-Warner bill.
143 See “EPA Analysis of the Lieberman-Warner Climate Security Act of 2008,” United States Environmental Protection Agency, Office of Atmospheric Programs, March 14, 2008,
http://www.epa.gov/climatechange/downloads/s2191_EPA_Analysis.pdf. “United Nations Secretary-General Ban Ki Moon has acknowledged that switching to ‘clean’ energy sources will cost the global economy $15 trillion to $20 trillion over the next two decades. Because there are so many uncertainties and variables involved with any cap-and-trade scheme, cost analyses of Lieberman-Warner show losses to the U.S. GDP of $1.7 trillion to $4.8 trillion over the next 20 years” (William F. Jasper, “Obama Cap-and-Trade Plan Uncaps Federal Power,” The New American, December 9, 2008, http://www.thenewamerican.com/reviews/correction-please/583).
144 See “United States Economic Impact from the Lieberman-Warner Proposed Legislation to Reduce Greenhouse Gas Emissions,” American Council for Capital Formation / National Association of Manufacturers, March 2008, http://www.accf.org/media/dynamic/1/media_191.pdf.
145 See “Jumpstarting the Economy and Investing for the Future,” Budget of the United States Government (fiscal year 2010), http://www.whitehouse.gov/omb/assets/fy2010_new_era/Jumpstarting_The_Economy.pdf.
146 See “Ocean Energy,” United States Department of the Interior Minerals Management Service, http://www.mms.gov/mmsKids/PDFs/OceanEnergyMMS.pdf. See also Minerals Management Service, “What About an Oil Spill?,” supra, n. 111.
147 See “Jumpstarting the Economy and Investing for the Future,” supra, n. 153.
148 See http://www.cbo.gov/ftpdocs/87xx/doc8769/11-01-CO2Emissions.htm.
49

The Center for E
nergy Policy and the Environm
ent advances ideas about the practical
application of free-market econom
ic principles to address today’s energy issues.
It challenges conventional wisdom
about energy supplies, production,
and consumption, and exam
ines the intersection of energy, the environment,
and economic and national security.
ww
w.m
anhattan-institute.org/cepe
PC
EC
EN
TE
R F
OR
EN
ER
GY
PO
LIC
Y A
ND
TH
E E
NV
IRO
NM
EN
TA
T
TH
E
MA
NH
AT
TA
N
IN
ST
IT
UT
E
E