Embed Size (px)
Citation preview
Journal of Earth Sciences and Geotechnical Engineering, vol. 5, no.3, 2015, 95-111
ISSN: 1792-9040 (print), 1792-9660 (online)
Scienpress Ltd, 2015
Mystery of Mosul Dam the Most Dangerous Dam in the
World: Dam Failure and its Consequences
Nadhir Al-Ansari1, Nasrat Adamo2, Issa E. Issa3, Varoujan K. Sissakian4 and Sven
Knutsson5
Abstract
Worries concerning the possibility of the dam failure due to the seepages under the
foundation of Mosul Dam during its construction and operation phases enhanced the
application of several dam failure models on Mosul Dam case. All the applied models gave
similar results. It was noticed through the models that the wave in case of the dam failure
will have a height of 54 m and the discharge will be of the order of 551000 m3/sec. This
wave will reach the capital city of Iraq “Baghdad” after about 38 hours. The discharge of
the River Tigris at Baghdad will be 46000 m3/sec and the height of the wave will reach 4m.
The propagation of the wave along this distance will cause a catastrophe. About 500000
civilians will die in addition to the unbelievable damage that will be caused to the
infrastructure of the country.
Keywords: Mosul Dam, Grouting, Dam failure, Flood wave.
1 Introduction
Dams are very important infrastructure to any country. They serve for different purposes,
e.g. flood control, water supply, hydropower generation, irrigation, navigation and
recreation benefits. Unfortunately, these huge structures represent risks to life and property
due to their potential to fail and cause catastrophic flooding [1]. There are many dam failure
events that were caused due to different reasons. For details of dam failure see [2,3].
Mitigation of such risks requires continuous inspection and maintenance of all dams. In
studying dam failure, the prediction of the reservoir outflow hydrograph and the routing of
the hydrograph through downstream valley to determine the dam failure consequences are
to be carried out. Usually, the prediction of the reservoir hydrograph is uncertain in
particular for embankment dams where the dam failure is due to progressive erosion
1,3,5Dept. of Civil, Environmental and Natural Resources Eng., Luleå University of Technology. 2Consultant Engineer, Sweden. 4Consultant Geologist.
96 Nadhir Al-Ansari et al.
processes that are complex and difficult to model [1]. Wahl [1] reviewed the modelling
strategies of dam failure and summarized them (see table1).
Table 1: Dam break flood modelling strategies. The first column indicates different
approaches to determine breach parameters and/or the breach outflow hydrograph [1]).
Regression model for Qp as
function of dam and
reservoir properties
Approximate breach
outflow hydrograph by
predicting peak outflow and
hydrograph shape directly.
Route breach outflow
hydrograph to determine
flooding consequences
Analytical model to predict
Qp with closedform
equations or charts as
functions of dam and
reservoir properties
Regression model for
breach parameters as
functions of dam and
reservoir properties
Provide breach parameters
as input to routing model,
which determines breach
outflow hydrograph by the
use of hydraulic equations
for flow through enlarging
breach Apply erosion model to
predict breach evolution and
the approximate breach
description in parametric
way for input to routing
model
Process- based erosion and hydraulic models that
simultaneously determine breach development and
resulting outflow hydrograph
The details of the regression models listed in table 1 can be obtained as follow:
1. Regression Models for Peak Outflow: [4,5,6].
2. Analytical Models to Predict Peak Outflow: [7,8].
3. Regression Models for Breach Parameters: [9,10].
4. Erosion Models Leading to Parametric Breach Descriptions: [8].
5. Process-Based Dam Breach Models Integrated with Dam-Break Flood Routing:
[11,12].
Dam failure is closely related to foundation and/ or spillway problems [13]. Leakage in the
foundation and embankments are the major reasons in the incidents of earth fill and rock fill
dams [13]. Foundation incidents are related to improper interpretation of the geology of the
site and improper treatment, while seepage from embankments is usually due to poor
construction work.
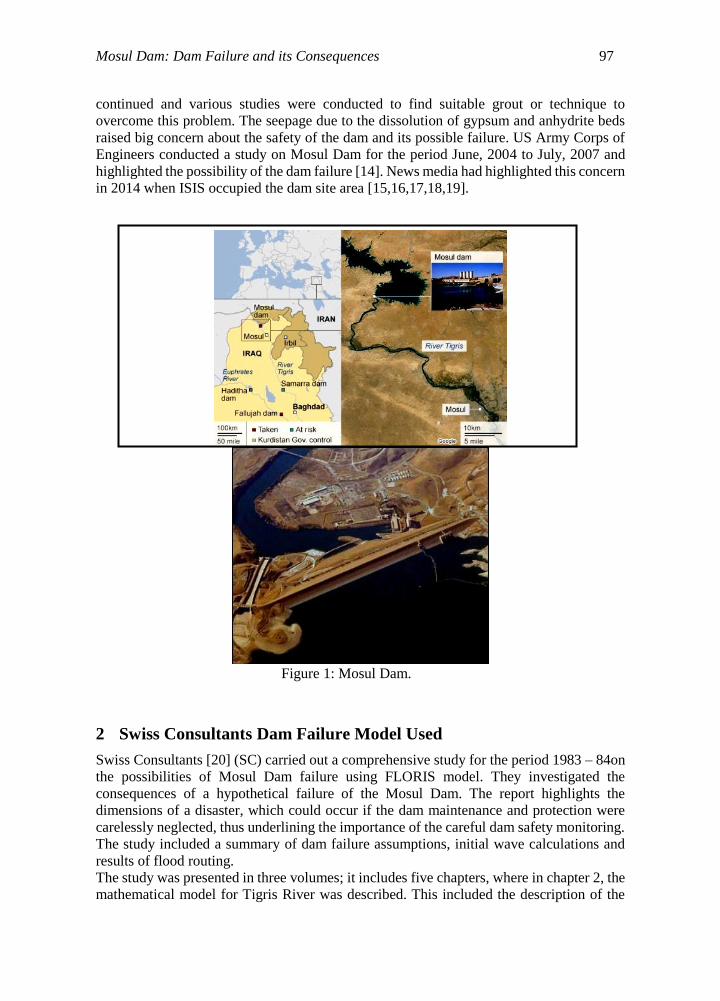
Construction work in Mosul Dam started on January 25th, 1981 and started operating on
July 24th, 1986 (Fig. 1). The dam was constructed on highly karstified beds of the Fatha
Formation. In view of this fact, grouting operations were conducted during the construction
period to fill the cavities, fissures, joints and cracks in the karstified beds. Unfortunately, all
the executed efforts did not stop the seepage under the foundation of the dam. After
impounding in 1986, new seepage locations were recognized. Grouting operations
Mosul Dam: Dam Failure and its Consequences 97
continued and various studies were conducted to find suitable grout or technique to
overcome this problem. The seepage due to the dissolution of gypsum and anhydrite beds
raised big concern about the safety of the dam and its possible failure. US Army Corps of
Engineers conducted a study on Mosul Dam for the period June, 2004 to July, 2007 and
highlighted the possibility of the dam failure [14]. News media had highlighted this concern
in 2014 when ISIS occupied the dam site area [15,16,17,18,19].
Figure 1: Mosul Dam.
2 Swiss Consultants Dam Failure Model Used
Swiss Consultants [20] (SC) carried out a comprehensive study for the period 1983 – 84on
the possibilities of Mosul Dam failure using FLORIS model. They investigated the
consequences of a hypothetical failure of the Mosul Dam. The report highlights the
dimensions of a disaster, which could occur if the dam maintenance and protection were
carelessly neglected, thus underlining the importance of the careful dam safety monitoring.
The study included a summary of dam failure assumptions, initial wave calculations and
results of flood routing.
The study was presented in three volumes; it includes five chapters, where in chapter 2, the
mathematical model for Tigris River was described. This included the description of the
98 Nadhir Al-Ansari et al.
model theory, the schematisation of the river channel downstream and of the dam and the
representation of Mosul reservoir. In chapter 3, calibration of the mathematical model for
the Tigris River was discussed and the calibration of the model was based on reproducing
historic floods. In chapter 4, dam break scenario and initial wave calculations were
explained. The assumptions surrounding the mechanism of dam failure and its
representation in the mathematical model were described. Finally, in chapter 5, results of
flood routing were given. This includes discharge and water level profiles to beyond
Baghdad. The magnitude of 1000 – 10000 years flood and the PMF (Probable Maximum
Flood), together with information on the discharge capacities of the main and fuse-plug
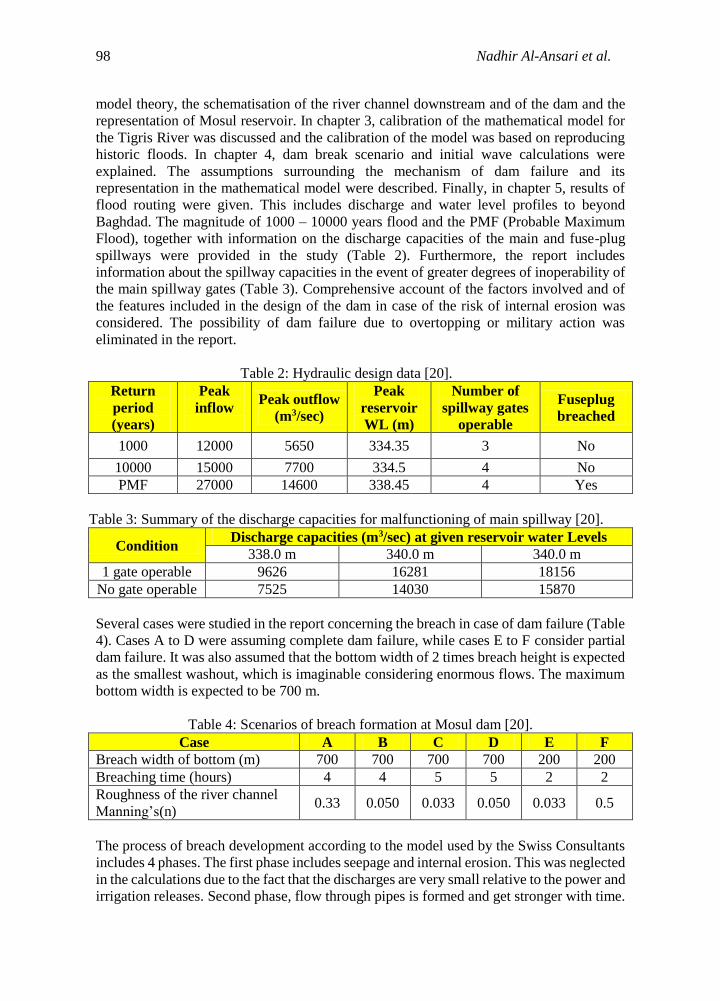
spillways were provided in the study (Table 2). Furthermore, the report includes
information about the spillway capacities in the event of greater degrees of inoperability of
the main spillway gates (Table 3). Comprehensive account of the factors involved and of
the features included in the design of the dam in case of the risk of internal erosion was
considered. The possibility of dam failure due to overtopping or military action was
eliminated in the report.
Table 2: Hydraulic design data [20].
Return
period
(years)
Peak
inflow
Peak outflow
(m3/sec)
Peak
reservoir
WL (m)
Number of
spillway gates
operable
Fuseplug
breached
1000 12000 5650 334.35 3 No
10000 15000 7700 334.5 4 No
PMF 27000 14600 338.45 4 Yes
Table 3: Summary of the discharge capacities for malfunctioning of main spillway [20].
Condition Discharge capacities (m3/sec) at given reservoir water Levels
338.0 m 340.0 m 340.0 m
1 gate operable 9626 16281 18156
No gate operable 7525 14030 15870
Several cases were studied in the report concerning the breach in case of dam failure (Table
4). Cases A to D were assuming complete dam failure, while cases E to F consider partial
dam failure. It was also assumed that the bottom width of 2 times breach height is expected
as the smallest washout, which is imaginable considering enormous flows. The maximum
bottom width is expected to be 700 m.
Table 4: Scenarios of breach formation at Mosul dam [20].
Case A B C D E F
Breach width of bottom (m) 700 700 700 700 200 200
Breaching time (hours) 4 4 5 5 2 2
Roughness of the river channel
Manning’s(n) 0.33 0.050 0.033 0.050 0.033 0.5
The process of breach development according to the model used by the Swiss Consultants
includes 4 phases. The first phase includes seepage and internal erosion. This was neglected
in the calculations due to the fact that the discharges are very small relative to the power and
irrigation releases. Second phase, flow through pipes is formed and get stronger with time.
Mosul Dam: Dam Failure and its Consequences 99
It was simulated by a gate, which gradually opens from 0 to 5 m. Its width equals the
weakened zone (94 m) and its height corresponds to 10% of the seepage zone. The duration
of this phase is 0 – 1 hour. In the third phase, it is assumed that the gate in phase two is
simultaneously changing to a breach of the same width and eroded down to the valley
bottom. The duration of this phase is 1 – 3 hours. In the fourth phase, the breach widens to
200 m for cases E and F and to 700 m for cases A to D. The duration is 2 hours for cases E
and F, 4 hours for cases A and B and 5 hours for cases C and D. It was also assumed that in
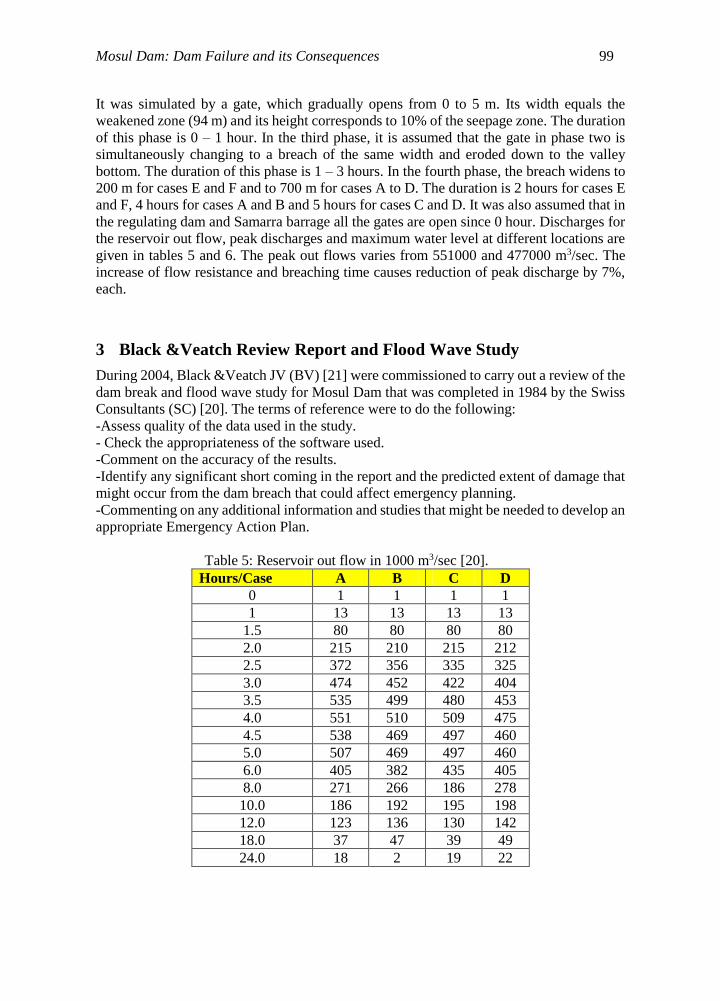
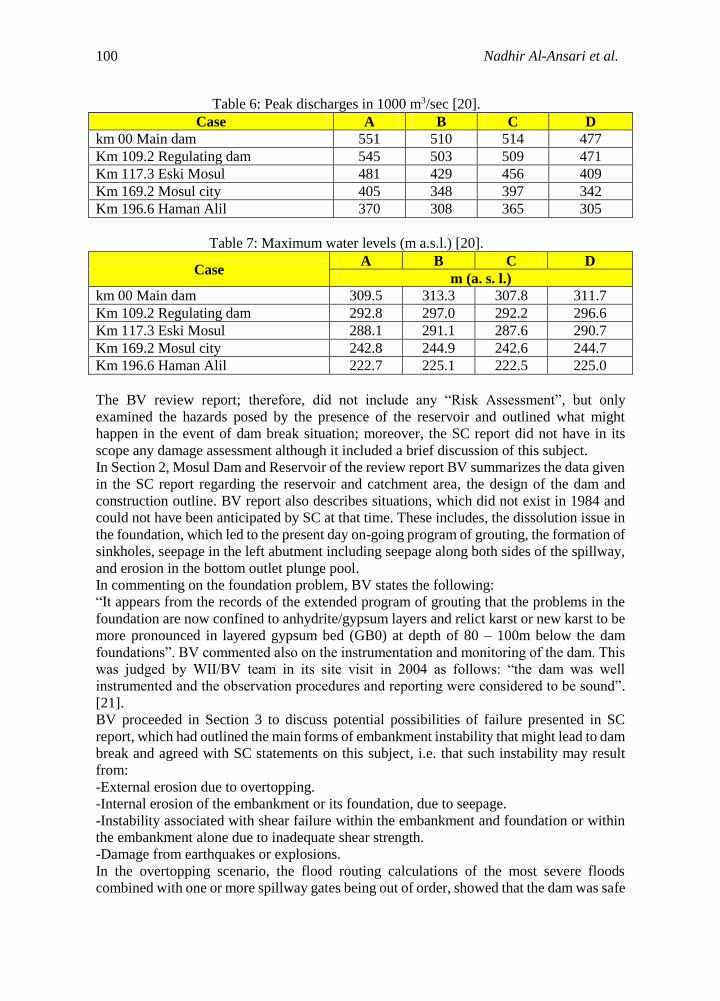
the regulating dam and Samarra barrage all the gates are open since 0 hour. Discharges for
the reservoir out flow, peak discharges and maximum water level at different locations are
given in tables 5 and 6. The peak out flows varies from 551000 and 477000 m3/sec. The
increase of flow resistance and breaching time causes reduction of peak discharge by 7%,
each.
3 Black &Veatch Review Report and Flood Wave Study
During 2004, Black &Veatch JV (BV) [21] were commissioned to carry out a review of the
dam break and flood wave study for Mosul Dam that was completed in 1984 by the Swiss
Consultants (SC) [20]. The terms of reference were to do the following:
-Assess quality of the data used in the study.
- Check the appropriateness of the software used.
-Comment on the accuracy of the results.
-Identify any significant short coming in the report and the predicted extent of damage that
might occur from the dam breach that could affect emergency planning.
-Commenting on any additional information and studies that might be needed to develop an
appropriate Emergency Action Plan.
Table 5: Reservoir out flow in 1000 m3/sec [20].
Hours/Case A B C D
0 1 1 1 1
1 13 13 13 13
1.5 80 80 80 80
2.0 215 210 215 212
2.5 372 356 335 325
3.0 474 452 422 404
3.5 535 499 480 453
4.0 551 510 509 475
4.5 538 469 497 460
5.0 507 469 497 460
6.0 405 382 435 405
8.0 271 266 186 278
10.0 186 192 195 198
12.0 123 136 130 142
18.0 37 47 39 49
24.0 18 2 19 22
100 Nadhir Al-Ansari et al.
Table 6: Peak discharges in 1000 m3/sec [20].
Case A B C D
km 00 Main dam 551 510 514 477
Km 109.2 Regulating dam 545 503 509 471
Km 117.3 Eski Mosul 481 429 456 409
Km 169.2 Mosul city 405 348 397 342
Km 196.6 Haman Alil 370 308 365 305
Table 7: Maximum water levels (m a.s.l.) [20].
Case A B C D
m (a. s. l.)
km 00 Main dam 309.5 313.3 307.8 311.7
Km 109.2 Regulating dam 292.8 297.0 292.2 296.6
Km 117.3 Eski Mosul 288.1 291.1 287.6 290.7
Km 169.2 Mosul city 242.8 244.9 242.6 244.7
Km 196.6 Haman Alil 222.7 225.1 222.5 225.0
The BV review report; therefore, did not include any “Risk Assessment”, but only
examined the hazards posed by the presence of the reservoir and outlined what might
happen in the event of dam break situation; moreover, the SC report did not have in its
scope any damage assessment although it included a brief discussion of this subject.
In Section 2, Mosul Dam and Reservoir of the review report BV summarizes the data given
in the SC report regarding the reservoir and catchment area, the design of the dam and
construction outline. BV report also describes situations, which did not exist in 1984 and
could not have been anticipated by SC at that time. These includes, the dissolution issue in
the foundation, which led to the present day on-going program of grouting, the formation of
sinkholes, seepage in the left abutment including seepage along both sides of the spillway,
and erosion in the bottom outlet plunge pool.
In commenting on the foundation problem, BV states the following:
“It appears from the records of the extended program of grouting that the problems in the
foundation are now confined to anhydrite/gypsum layers and relict karst or new karst to be
more pronounced in layered gypsum bed (GB0) at depth of 80 – 100m below the dam
foundations”. BV commented also on the instrumentation and monitoring of the dam. This
was judged by WII/BV team in its site visit in 2004 as follows: “the dam was well
instrumented and the observation procedures and reporting were considered to be sound”.
[21].
BV proceeded in Section 3 to discuss potential possibilities of failure presented in SC
report, which had outlined the main forms of embankment instability that might lead to dam
break and agreed with SC statements on this subject, i.e. that such instability may result
from:
-External erosion due to overtopping.
-Internal erosion of the embankment or its foundation, due to seepage.
-Instability associated with shear failure within the embankment and foundation or within
the embankment alone due to inadequate shear strength.
-Damage from earthquakes or explosions.
In the overtopping scenario, the flood routing calculations of the most severe floods
combined with one or more spillway gates being out of order, showed that the dam was safe
Mosul Dam: Dam Failure and its Consequences 101
against over topping judging from the available free board and spillway capacity. Even a
dam break would not be possible due to the additional capacity of the fuse plug spillway in
the most severe case.
In the consideration of possible failure due to internal erosion in the embankment or in the
foundation; SC put aside such possibility on the grounds that the embankment had a very
defensive design by the provision of a wide and very well compacted clay core and ample
filters upstream and downstream of the core and provision of drainage zones. And
similarly erosion in the foundation would be prevented by the construction of a multiple
row grout curtain extending down to a depth about the maximum height of the dam. BV
however, commented that although some maintenance works on the grout curtain had been
expected by SC, the large magnitude of this work was not anticipated or foreseen by SC at
the time when they prepared their study.
Finally, BV discussed the possibility of dam failure by military action, which was outlined
in SC report. In their assumed scenarios, SC had stated that such military action might
include the occupation and destruction of the dam by invading troops and decided that they
were not qualified to discuss such a strategic situation. On the destruction of the dam by air
attack, SC expressed the opinion, which was based on discussion with military experts that
a significant damage to the dam body requires very large charges and several hits in the
same location. The addition of thick rock armour on the dam crest would reduce the
damages even more. In addition, the concrete structures were heavily designed and
appreciable damage could not be inflicted on them. It is worth to mention here that the dam
body was hit by an air to ground missile in the 1991 Gulf War with no damage at all, the
powerhouse machine hall roof was damaged by another strike and two of the four tall surge
tanks were pierced by air missiles. All damages were repaired within six months after the
end of the war.
The last scenario examined by SC was that small enemy groups might attack the dam to
cause some damages and its ancillary structures. But due to the limited means at the
disposal of such groups and their restricted movement coupled with the unlikely event of
simultaneous flooding occurring at the same time; such dam break was judge as of very
remote possibility. This last assumption proved to be wrong in summer 2014 when ISIS
occupied the site and it was only matter of luck that this happened during the dry season and
the group did not have time to accumulate enough explosives before they were driven
away.
In their assessment of dam failure possibilities, SC concluded that the “largest unknown
factor” in Mosul Dam was the underground and the geologic conditions, which were not
simple. The conclusion of SC was based on the analysis of the historic frequencies of the
types of dam failure and also on local knowledge that a foundation conditions would
provide a larger contribution to the overall failure probability than any other single cause.
This conclusion was confirmed by BV. As a result, SC judged that, foundation failure as the
“least unlikely failure mode” in Mosul Dam. BV considered this to be a reasonable
judgment; which was strengthened, if anything, by the scope of the foundation grouting that
had been undertaken since the commissioning of the project. BV also concurred with SC’s
view that the ultimate size and shape of the breach were not likely to be sensitive to the
initial cause of the failure. BV then used different modelling procedures to check SC
findings; that was the decoupling of the derivation of the breach hydrograph (which was
discussed in Section 4) from the conditions, which would occur downstream (discussed in
section5).
102 Nadhir Al-Ansari et al.
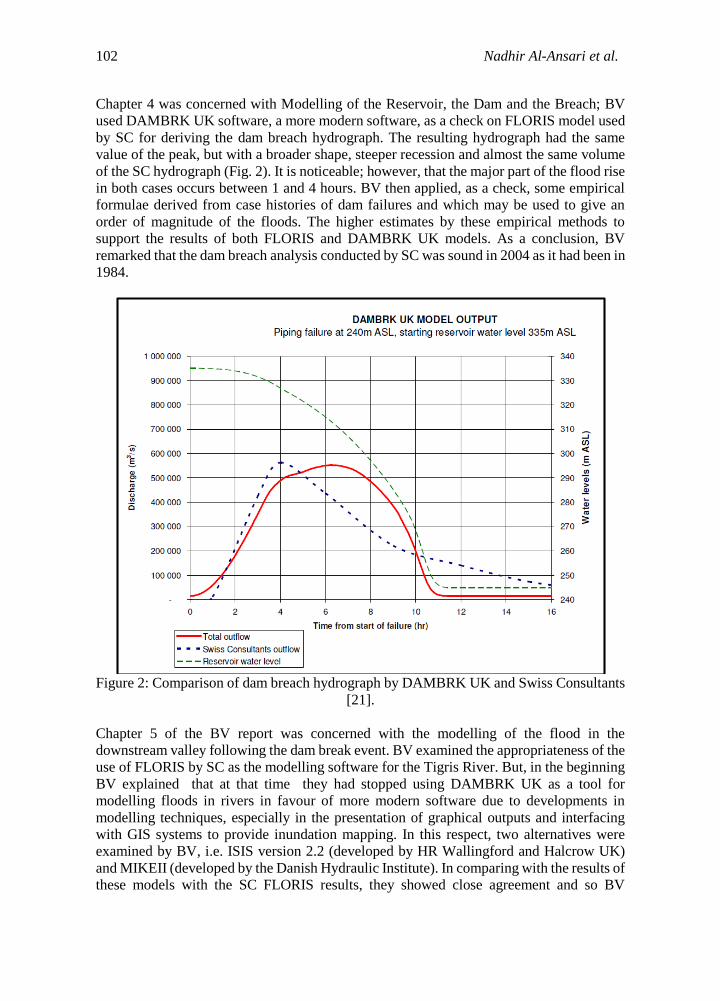
Chapter 4 was concerned with Modelling of the Reservoir, the Dam and the Breach; BV
used DAMBRK UK software, a more modern software, as a check on FLORIS model used
by SC for deriving the dam breach hydrograph. The resulting hydrograph had the same
value of the peak, but with a broader shape, steeper recession and almost the same volume
of the SC hydrograph (Fig. 2). It is noticeable; however, that the major part of the flood rise
in both cases occurs between 1 and 4 hours. BV then applied, as a check, some empirical
formulae derived from case histories of dam failures and which may be used to give an
order of magnitude of the floods. The higher estimates by these empirical methods to
support the results of both FLORIS and DAMBRK UK models. As a conclusion, BV
remarked that the dam breach analysis conducted by SC was sound in 2004 as it had been in
1984.
Figure 2: Comparison of dam breach hydrograph by DAMBRK UK and Swiss Consultants
[21].
Chapter 5 of the BV report was concerned with the modelling of the flood in the
downstream valley following the dam break event. BV examined the appropriateness of the
use of FLORIS by SC as the modelling software for the Tigris River. But, in the beginning
BV explained that at that time they had stopped using DAMBRK UK as a tool for
modelling floods in rivers in favour of more modern software due to developments in
modelling techniques, especially in the presentation of graphical outputs and interfacing
with GIS systems to provide inundation mapping. In this respect, two alternatives were
examined by BV, i.e. ISIS version 2.2 (developed by HR Wallingford and Halcrow UK)
and MIKEII (developed by the Danish Hydraulic Institute). In comparing with the results of
these models with the SC FLORIS results, they showed close agreement and so BV
Mosul Dam: Dam Failure and its Consequences 103
accepted SC choice as sound and correct.
The next step was checking the schematization of the Tigris River, and examining how the
river and its’ tributaries were represented and coded and how the structures along its course
were introduced, i.e. the Mosul Dam itself including the assumed dam breach, the
re-regulating dam, and the Sammara barrage, which controls outflows from the model to
Tharthar Lake, and which breaches when the embankment is overtopped. As a conclusion,
BV concludes the following “The schematization of the Mosul Dam model appears to have
been carried out in logical manner”.
The following stage of checking was on the modelling procedure and how the model was
calibrated. BV examined this matter in details and concluded that the choice of the 1964,
1969 and 1974 historical floods for simulation of the model for real floods was acceptable
due to the availability of good data of these floods in the form of gauged discharge
hydrographs in many stations along the river and its tributaries. And that; since the
geometry of the schematized river system was fixed by the cross sections, then the only
remaining parameter to be fixed by SC for this calibration was the choice of the Manning
“n”. The choice by SC of a value of 0.027 gave good results for the mentioned historic
floods and the decisions taken by SC to increase this to a higher value of 0.033 for running
the dam break wave on the model (as would be expected due to the higher hydraulic
resistance expected on the valley sides), and using 0.05 for sensitivity analysis, were good
decisions. BV considered that this was realistic and would represent the actual wave flow
condition. As a final conclusion, BV judged the whole modelling procedure as acceptable.
Chapter 6 reviewed the consequences of the flood wave.The results derived from the
SC-1984 report were checked for consistency; both internally and with the results from
other dam break studies. BV found that these results could be accepted with some
confidence. This BV review also can be used now as a guide through SC report and to see in
summary the key results obtained for Mosul City and Baghdad, which are the major
conurbations near the upstream and downstream ends of the model.
Another important point that was highlighted by BV review was the definition of the
“Rescue Level” adopted by SC, as the evacuation level, which is safe from flooding and
therefore, suitable as an evacuation destination. In the upper reaches, where the flow
velocities would be high, this was taken as 4m above the peak of the flood wave rounded up
to the next whole meter. Reducing it to 2m in the areas downstream of Baghdad, where the
flooded areas are flat and the flow wave depths and velocities are less. BV commented on
this choice in subsection 6.4.
In subsections 6.2 and 6.3, BV referred the reader to the parts and annexes in SC report,
where the detailed model outputs for the first 100 km downstream were given. BV summed
up the main results in a table with the following comment:
“What is abundantly clear from the 1984 results for Mosul City that, regardless of the
selected assumptions:
-The flood wave may arrive within about 3hours after the initiation of the breach: and;
-The ultimate depth (above normal flood levels in the river) will be 20 m.
The warning time, after allowing for any delays in raising the alarm, could therefore, be
extremely short and the effects on the city would be devastating. The whole left bank as far
as the ruins of Nineveh would be set under water. Subsection 6.4 also gives the chapters and
annexes in SC report for the key results in Baghdad and were summarized in table 5.1
Volume 3 of the 1984’s report and reproduced by BV in this subsection with the following
comment:
The calculated water levels were reported as 4.6 m higher than the flood level recorded in
104 Nadhir Al-Ansari et al.
1971 flood at a recorded discharge of 4500 m3/sec at the centre of Baghdad (Sari Gauging
Station), and estimated as 2.5 m to 3 m higher than the 1941’s flood, which had been
estimated at 7600 m3/sec. The results for Baghdad showed that there should be ample time
to raise the alarm, achieve an orderly evacuation to avoid heavy losses and mobilize the
emergency services. With proper planning, there should be opportunity to avoid heavy
losses of life. The rescue levels quoted in SC report for Baghdad was between level 38 m
(a.s.l.) and 42 m (a.s.l.) with 40 m (a.s.l.) at the centre. BV expressed their concern that due
to buildings and other obstructions in the city the rescue levels should be increased by
another 2 m to reduce the risks to the evacuation zones.
In chapter 7, on Damage assessment; BV review outlined some of the guidelines used in the
UK on the estimation of damage to buildings in the event of flooding; and one method for
the estimation of the potential loss of life which is suggested by the USBR in the United
States was also discussed. It is clear from these that if enough warning time is available,
then proper emergency planning can also be provided. But in all cases, Mosul City has not
enough warning time which makes a meaningful emergency planning possible.
BV report then goes on to say that damage assessment and emergency planning were not
included in SC report. BV in this respect claimed, however, that such a damage
assessment and planning were not possible in the short frame of time given to SC in the
preparation of the flood wave study and reiterated what SC had already mentioned in their
report on describing the damages as “ too large to be estimated at all”.
In chapter 8, Further Modelling; BV investigated the sufficiency and the applicability of the
results of the 1984’s report. In this context, BV emphasized that SC modelling results were
very sound to the degree that no further modelling would be required. But it also could be
suggested that some refinements could be introduced in modelling the lower reach around
Baghdad in view of the complexity of changes that had occurred in those areas. For such
modelling, modern processing and mapping techniques could be utilized. The important
conclusion, which BV had reached, however, is that there was not enough justification for
delaying the preparation of the Emergency Action Plan (EPA) even for such refinements.
In BVs’ opinion, the results of SC model are applicable for the preparation of the required
EAP, but it was very important that the interpretations of the model results were to be made
by an experienced hydraulic engineer, and to produce updated flood maps even if updated
surveying work might be required in some places.
Finally in the Conclusion, chapter 9, BV tried to answer three basic questions in order to
reach a conclusion, these are;
-Was the dam break model reasonable and realistic representation of the “least unlikely
mode of failure”?
-Was the flood wave model using FLORIS rigorous enough in view of the modelling
capabilities available in 1984?
-Did SCs’ work using FLORIS stand up to examination against software available in 2004?
BV’s answer to these three questions was “YES”.
Mosul Dam: Dam Failure and its Consequences 105
4 Consequences of Mosul Dam Failure
The seepage problem during the construction and operation periods in Mosul Dam due to
the dissolution of gypsum and anhydrite beds raised high concern about the safety of the
dam. In view of the situation, the Iraqi Government asked the Swiss Consultants to perform
a study about this matter (see [20]). This study was checked again by BV in 2004 (see [21]).
Despite the fact that the above studies used different mathematical models, they got the
same results. To overcome the problem, grouting operations were the main solution. Later
in 2007, the US Corps of Engineers raised high concerns about the safety of the dam and it
was reported that in case of the dam failure, it could wipe out whole cities, and was
considered to be the most dangerous dam in the world (see [14,15]). When ISIS occupied
the dam site in 2014, there were fears that they might use explosives to destroy the dam.
Numbers of articles were written in this context [15,16,17,18,19]. As an example, [15]
wrote “the dam has been suffering a critical lack of maintenance and repair work. And
under Islamic State management, a similar situation has been happening to other major
dams located on the Euphrates (which still haven’t been freed).
The problem is that when it was built in the mid-‘80s, little thought was given to the
location. David Petraeus, the former commanding general of the US Army in Iraq, wrote a
letter to Prime Minister Nouri Al-Maliki in 2007, indicating the dangers of the soluble soil
located underneath the dam, which warrant constant attention and repair work.
“Extraordinary engineering measures” to fill soil gaps and “maintain structural integrity
and operating capability of the dam” are a must, according to the US Army Corps of
Engineers (USACE) report sent out in the same year. Another report by USACE in 2011
indicated that a failure of the Mosul Dam could cost 500,000 civilian lives in the immediate
aftermath”.
Swiss Consultant [20] report had traced the wave caused by the dam failure. They
calculated the discharges and water levels from the dam site downstream to Baghdad
(Table 8 and figure 3). The highest discharges and wave heights are expected to be noticed
in the first 122 km downstream the dam. The discharge is expected to be 551000 m3/sec at
the start and attenuates to 320 000 m3/sec at the confluence of Tigris- Greater Zab Rivers,
which will be reached after 7 hours. The wave height is expected to be 55m and decreases
to 45 m the first 20 km. Mosul city will be affected by the flood after 4 hours of the dam
breaching where the maximum water level is expected to be 243 m (a.s.l.) (see Fig. 4). The
wave height will be 24 m and it will inundate 74.044 km2 of the area of Mosul city (Fig. 4).
Downstream the confluence with Greater Zab River the discharge of the Tigris River will
be reduced to 310 000 m3/sec. The water wave will reach Fatha after 16 hours and the
discharge of the Tigris River after its confluence with the Lesser Zab River will be 210000
m3/sec. The wave height is expected to be 25 m at Fatha and since the water has to pass
through the narrow gap between Hemrin and Makhul Mountains, backwater effect will be
noticed and the water velocity at the gap will reach 10 m/sec.
Downstream Fatha, the Tigris River valley widens from 1 km to 5 km and the discharge
decrease to 185000 m3/sec. At 422 km downstream the dam, the river passes a major city
called Tikrit. At that city the discharges will be 185000 m3/sec. The wave height will arrive
after 22 hours and its height will be 15m. It will inundate 68.985 km2 (Table 8, Figures 3
and 4). Then the wave will reach another major city called Samara which is 479 km
downstream the dam. The wave time of arrival at this city is 25 hours and height of the
wave reaches 10m. The river discharge will be reduced to 162000 m3/sec. It will inundate
30.100 km2 of the city (Table 8, Figures 3 and 4). Further downstream, at a distance of 638
106 Nadhir Al-Ansari et al.
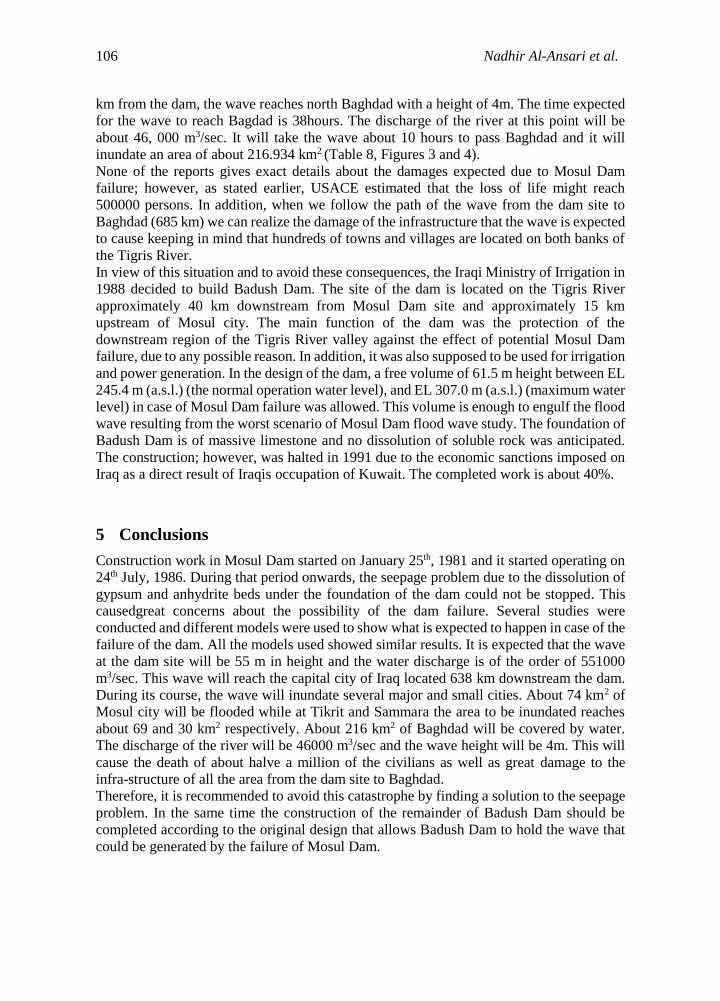
km from the dam, the wave reaches north Baghdad with a height of 4m. The time expected
for the wave to reach Bagdad is 38hours. The discharge of the river at this point will be
about 46, 000 m3/sec. It will take the wave about 10 hours to pass Baghdad and it will
inundate an area of about 216.934 km2 (Table 8, Figures 3 and 4).
None of the reports gives exact details about the damages expected due to Mosul Dam
failure; however, as stated earlier, USACE estimated that the loss of life might reach
500000 persons. In addition, when we follow the path of the wave from the dam site to
Baghdad (685 km) we can realize the damage of the infrastructure that the wave is expected
to cause keeping in mind that hundreds of towns and villages are located on both banks of
the Tigris River.
In view of this situation and to avoid these consequences, the Iraqi Ministry of Irrigation in
1988 decided to build Badush Dam. The site of the dam is located on the Tigris River
approximately 40 km downstream from Mosul Dam site and approximately 15 km
upstream of Mosul city. The main function of the dam was the protection of the
downstream region of the Tigris River valley against the effect of potential Mosul Dam
failure, due to any possible reason. In addition, it was also supposed to be used for irrigation
and power generation. In the design of the dam, a free volume of 61.5 m height between EL
245.4 m (a.s.l.) (the normal operation water level), and EL 307.0 m (a.s.l.) (maximum water
level) in case of Mosul Dam failure was allowed. This volume is enough to engulf the flood
wave resulting from the worst scenario of Mosul Dam flood wave study. The foundation of
Badush Dam is of massive limestone and no dissolution of soluble rock was anticipated.
The construction; however, was halted in 1991 due to the economic sanctions imposed on
Iraq as a direct result of Iraqis occupation of Kuwait. The completed work is about 40%.
5 Conclusions
Construction work in Mosul Dam started on January 25th, 1981 and it started operating on
24th July, 1986. During that period onwards, the seepage problem due to the dissolution of
gypsum and anhydrite beds under the foundation of the dam could not be stopped. This
causedgreat concerns about the possibility of the dam failure. Several studies were
conducted and different models were used to show what is expected to happen in case of the
failure of the dam. All the models used showed similar results. It is expected that the wave
at the dam site will be 55 m in height and the water discharge is of the order of 551000
m3/sec. This wave will reach the capital city of Iraq located 638 km downstream the dam.
During its course, the wave will inundate several major and small cities. About 74 km2 of
Mosul city will be flooded while at Tikrit and Sammara the area to be inundated reaches
about 69 and 30 km2 respectively. About 216 km2 of Baghdad will be covered by water.
The discharge of the river will be 46000 m3/sec and the wave height will be 4m. This will
cause the death of about halve a million of the civilians as well as great damage to the
infra-structure of all the area from the dam site to Baghdad.
Therefore, it is recommended to avoid this catastrophe by finding a solution to the seepage
problem. In the same time the construction of the remainder of Badush Dam should be
completed according to the original design that allows Badush Dam to hold the wave that
could be generated by the failure of Mosul Dam.
Mosul Dam: Dam Failure and its Consequences 107
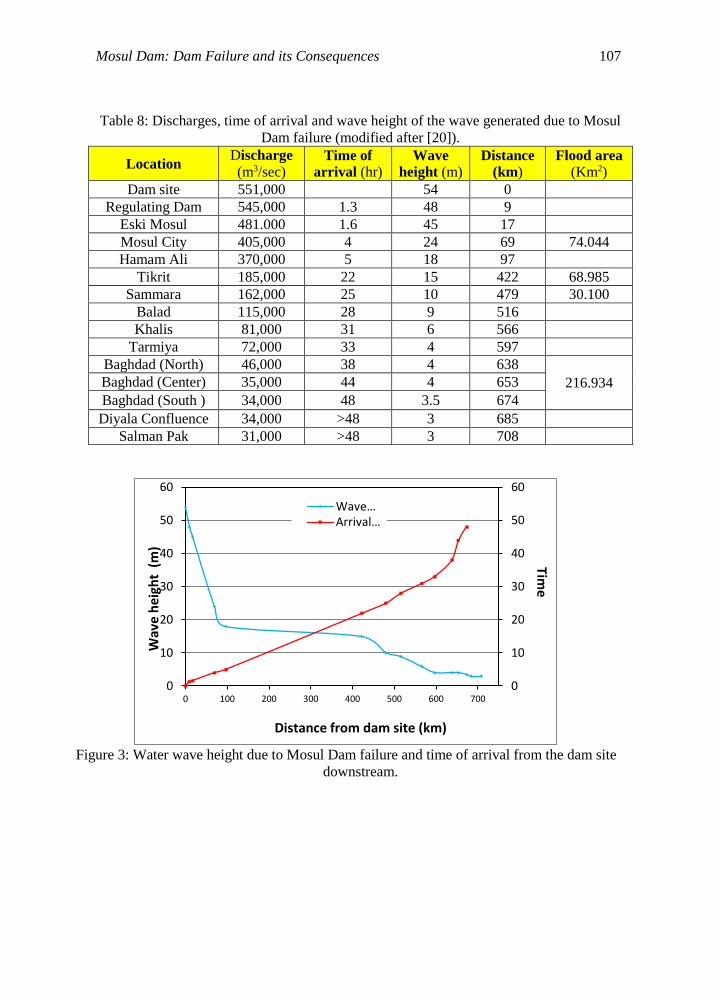
Table 8: Discharges, time of arrival and wave height of the wave generated due to Mosul
Dam failure (modified after [20]).
Figure 3: Water wave height due to Mosul Dam failure and time of arrival from the dam site
downstream.
0
10
20
30
40
50
60
0
10
20
30
40
50
60
0 100 200 300 400 500 600 700
Wave…Arrival…
Time
Wav
e h
eigh
t (m
)
Distance from dam site (km)
Location Discharge
(m3/sec) Time of
arrival (hr) Wave
height (m) Distance
(km) Flood area
(Km2)
Dam site 551,000 54 0
Regulating Dam 545,000 1.3 48 9
Eski Mosul 481.000 1.6 45 17
Mosul City 405,000 4 24 69 74.044
Hamam Ali 370,000 5 18 97
Tikrit 185,000 22 15 422 68.985
Sammara 162,000 25 10 479 30.100
Balad 115,000 28 9 516
Khalis 81,000 31 6 566
Tarmiya 72,000 33 4 597
Baghdad (North) 46,000 38 4 638
216.934 Baghdad (Center) 35,000 44 4 653
Baghdad (South ) 34,000 48 3.5 674
Diyala Confluence 34,000 >48 3 685
Salman Pak 31,000 >48 3 708
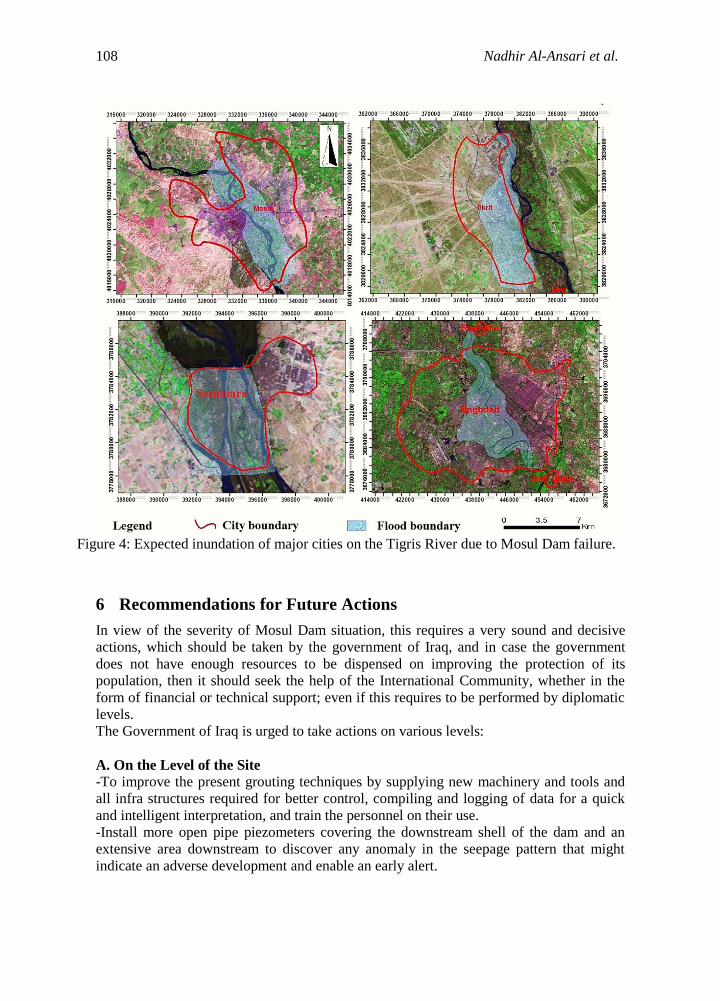
108 Nadhir Al-Ansari et al.
Figure 4: Expected inundation of major cities on the Tigris River due to Mosul Dam failure.
6 Recommendations for Future Actions
In view of the severity of Mosul Dam situation, this requires a very sound and decisive
actions, which should be taken by the government of Iraq, and in case the government
does not have enough resources to be dispensed on improving the protection of its
population, then it should seek the help of the International Community, whether in the
form of financial or technical support; even if this requires to be performed by diplomatic
levels.
The Government of Iraq is urged to take actions on various levels:
A. On the Level of the Site
-To improve the present grouting techniques by supplying new machinery and tools and
all infra structures required for better control, compiling and logging of data for a quick
and intelligent interpretation, and train the personnel on their use.
-Install more open pipe piezometers covering the downstream shell of the dam and an
extensive area downstream to discover any anomaly in the seepage pattern that might
indicate an adverse development and enable an early alert.
Mosul Dam: Dam Failure and its Consequences 109
-Investigate all available modern techniques and development in ground water movement
observation systems and select what fit the situation and acquire them.
-Abandoning the idea of constructing a diaphragm, as all the studies carried out so far
proved that such solution is not only infeasible technologically and financially, but it
could endanger the integrity of the dam itself. It is understood that the government has
signed a Memorandum of understanding with an international company in 2011 to do
such work.
-Detailed seismic study in the area should be conducted including micro seismicity and
microgravity to see the effect on old existing faults and their possible movement.
B. On the Area Level
-To resume the construction of Badush Dam as it is the only way for protecting of the
downstream region in case of Mosul Dam failure. It is understood that the government
had revised its plans for this dam to be built as a low run of the river facility and abandon
the flood wave protection function, which is very unwise in view of the current situation.
-To initiate a feasibility study for the decommissioning of Mosul Dam. Such a plan
should investigate the constructing of a much smaller dam upstream of the present site to
provide the projects of North Jazira, South Jazira and East Jazria with irrigation water.
The Irrigation water for the middle and southern Iraq irrigation project can be supplied
from Al-Tharthar Lake, while flood protection of Baghdad can be enhanced by turning
Al-Sharee Depression north of samara into flood protection facility.
C. On the National Level
-An exact and well defined Emergency Action Plan (EAP) should be prepared by the
government. This is a routine action, which is taken by all governments when building a
dam of Mosul Dam's magnitude or even less to safe guard the population against such an
event, even if the probability of its occurrence is very low. The plan shall be comprised of
but not limited to the following:-
1. Formation of an Emergency action group, which could convene at a very short notice
and can assume complete authority and responsibility of the situation to take any required
action. Needless to say it shall have in its membership representatives of all government
authorities concerned; civil and military.
2. Install a modern communication and warning system (independent of any other system)
with platforms in all critical points and offices concerned.
3. Conduct new updated mapping of the downstream region to the last point where the
flood wave ceases to have an effect beyond normal flooding. Such mapping should use all
modern systems of imagery and GIS technique to define not only inundation limits, but to
define the safe rescue levels depending on the present land use and finally select the
required evacuation areas.
4. The government should promulgate laws and ordinance on the future use of land in the
threatened zones. This should also be considered in the town planning of the extensions
and new developments of the existing cities and townships situated in the river valley.
110 Nadhir Al-Ansari et al.
ACKNOWLEDGEMENTS: The authors would like to thank all individuals for their
help and assistance in this work. Special thanks are forwarded to Mr. Mohammed Dhari,
the Construction Advisor of the Iraqi Ministry of Water Resources for his kind assistance,
encouragement and support.
The research presented has been financially supported by Luleå University of
Technology, Sweden and by “Swedish Hydropower Centre—SVC” established by the
Swedish Energy Agency, Elforsk and SvenskaKraftnät together with Luleå University of
Technology, The Royal Institute of Technology, Chalmers University of Technology and
Uppsala University. Their support is highly appreciated.
References
[1] Wahl, T. L., Dam Breach Modelling- An overview of Analysis Methods, Joint
Fedral Interagency Conference on Sedimentation and Hydrologic Modeling, Las
Vegas, USA, June 27-July 1, 2010.
http://www.usbr.gov/pmts/hydraulics_lab/pubs/PAP/PAP-1018.pdf. Last accessed
March 3, 2015.
[2] US Homeland Security, Estimating Loss of Life for Dam Failure Scenarios, Dam
Sector, 2011
http://www.damsafety.org/media/Documents/Security/DamsSectorConsequenceEsti
mation-LossofLife.pdf. Last accessed 3 March, 2015.
[3] Colorado Dam Safety Branch, Guidelines for Dam Breach Analysis, Department of
Natural Resources, Division of Water Resources, Colorado, 2010.
http://water.state.co.us/DWRIPub/Documents/GuidelinesForDamBreachAnalysis.pd
flast accessed 3 March, 2015.
[4] SCS, Soil Conservation Service, 1981, Simplified Dam-Breach Routing Procedure,
Technical Release No. 66 (Rev. 1), December 1981, 39 p.
[5] MacDonald, T.C., and Langridge-Monopolis, J., 1984, Breaching characteristics of
dam failures. Journal of Hydraulic Engineering, vol. 110, no. 5, p. 567-586.
[6] Costa, J.E., 1985, Floods from Dam Failures, U.S. Geological Survey Open-File
Report 85-560, Denver, Colorado, 54 p.
[7] Cristofano, E.A., 1965, Method of Computing Erosion Rate for Failure of Earthfill
Dams, U.S. Bureau of Reclamation, Denver, Colorado.
[8] Fread, D.L., 1988 (revised 1991), BREACH: An Erosion Model for Earthen Dam
Failures, National Weather Service, National Oceanic and Atmospheric
Administration, Silver Spring, Maryland.
[9] Wahl, T.L., Uncertainty of predictions of embankment dam breach parameters.
Journal of Hydraulic Engineering, vol. 130, no. 5, p. 389-397, 2004.
[10] Froehlich, David C., 1995, Embankment dam breach parameters revisited. In Water
Resources Engineering, Proceedings of the 1995 ASCE Conference on Water
Resources Engineering, San Antonio, Texas, August 14-18, 1995, p. 887-891.
[11] Mohamed, M.A.A., 2002, Embankment breach formation and modelling methods,
Ph. D. thesis, Open University, UK.
[12] Temple, D.M., Hanson, G.J., Nielsen, M.L., and Cook, K., 2005. Simplified breach
analysis model for homogeneous embankments: Part 1, Background and model
components. USSD Technologies to Enhance Dam Safety and the Environment,
25th Annual USSD Conference, Salt Lake City, Utah.
Mosul Dam: Dam Failure and its Consequences 111
[13] ICOLD, Committee on Failures and Accidents to Large Dams, Lessons from Dam
Incidents, 1974.
[14] Wakeley, L. D., Kelley, J. R., Talbot, C. A., Pearson, M .L., and Broadfoot, S. W.
,2007. Geologic Conceptual Model of Mosul Dam.U.S. Army Engineer Research
and Development Center, 61 pp, 2007.
[15] RT, World’s most dangerous’: Iraq’s retaken Mosul Dam could cause 500,000
deaths in days, Published time: August 19, 2014,
http://rt.com/news/181228-mosul-dam-iraq-explosives/last accessed 2March, 2015
[16] Roulo, C., Security of Mosul Dam Critical to Iraq’s Infrastructure, US department of
Defence, August 2014.
http://www.defense.gov/news/newsarticle.aspx?id=122953last accessed 2 March,
2015
[17] The Independent, Iraq crisis: Why is the Mosul dam so important and how could it
kill half a million people?, 19 August, 2014.
http://www.independent.co.uk/news/world/middle-east/iraq-crisis-why-is-the-mosul
-dam-so-important-and-how-could-it-kill-half-a-million-people-9677923.htmlLast
accessed 3 March, 2015.
[18] Bender, J., ISIS Militants Could Gain Control Of Iraq's Largest Dam And Put
Baghdad Under 15 Feet Of Water, The Independent, 6 August, 2014.
http://www.businessinsider.com/mosul-dam-is-structurally-unsound-2014-8?IR=T
Last accessed 3 March, 2015.
[19] Tomkiw, L., Three things to know about Iraq's Mosul Dam (+video), The Christian
Science Monitor, 19 August, 2014.
http://www.csmonitor.com/World/Middle-East/2014/0819/Three-things-to-know-ab
out-Iraq-s-Mosul-Dam-videoLast accessed 3 March, 2015.
[20] Swiss Consultants,Security measures II, Addendum 3- Flood wave studies, Task 2
Mosul flood wave, Confidential report for the Ministry of Irrigation, State
Organization of Dams, V. 1 (Summary), V,2 (The model and model calibration),
V.3 (Calculation of Mosul flood wave), 1984.
[21] Wheeler,M., Ackers,J., Bartlett,J., Tarrant, F., Dunlop, C. and Campbell, P.,
Mosul Dam Assessment, Review of 1984 Dambreak and Floodwave Study for
Mosul Dam, Iraq, 39p., Black & Veatch, UK, 2004.